Axial Displacements and Removal Torque Changes of Five Different Implant-Abutment Connections under Static Vertical Loading


Abstract
1. Introduction
2. Materials and Methods
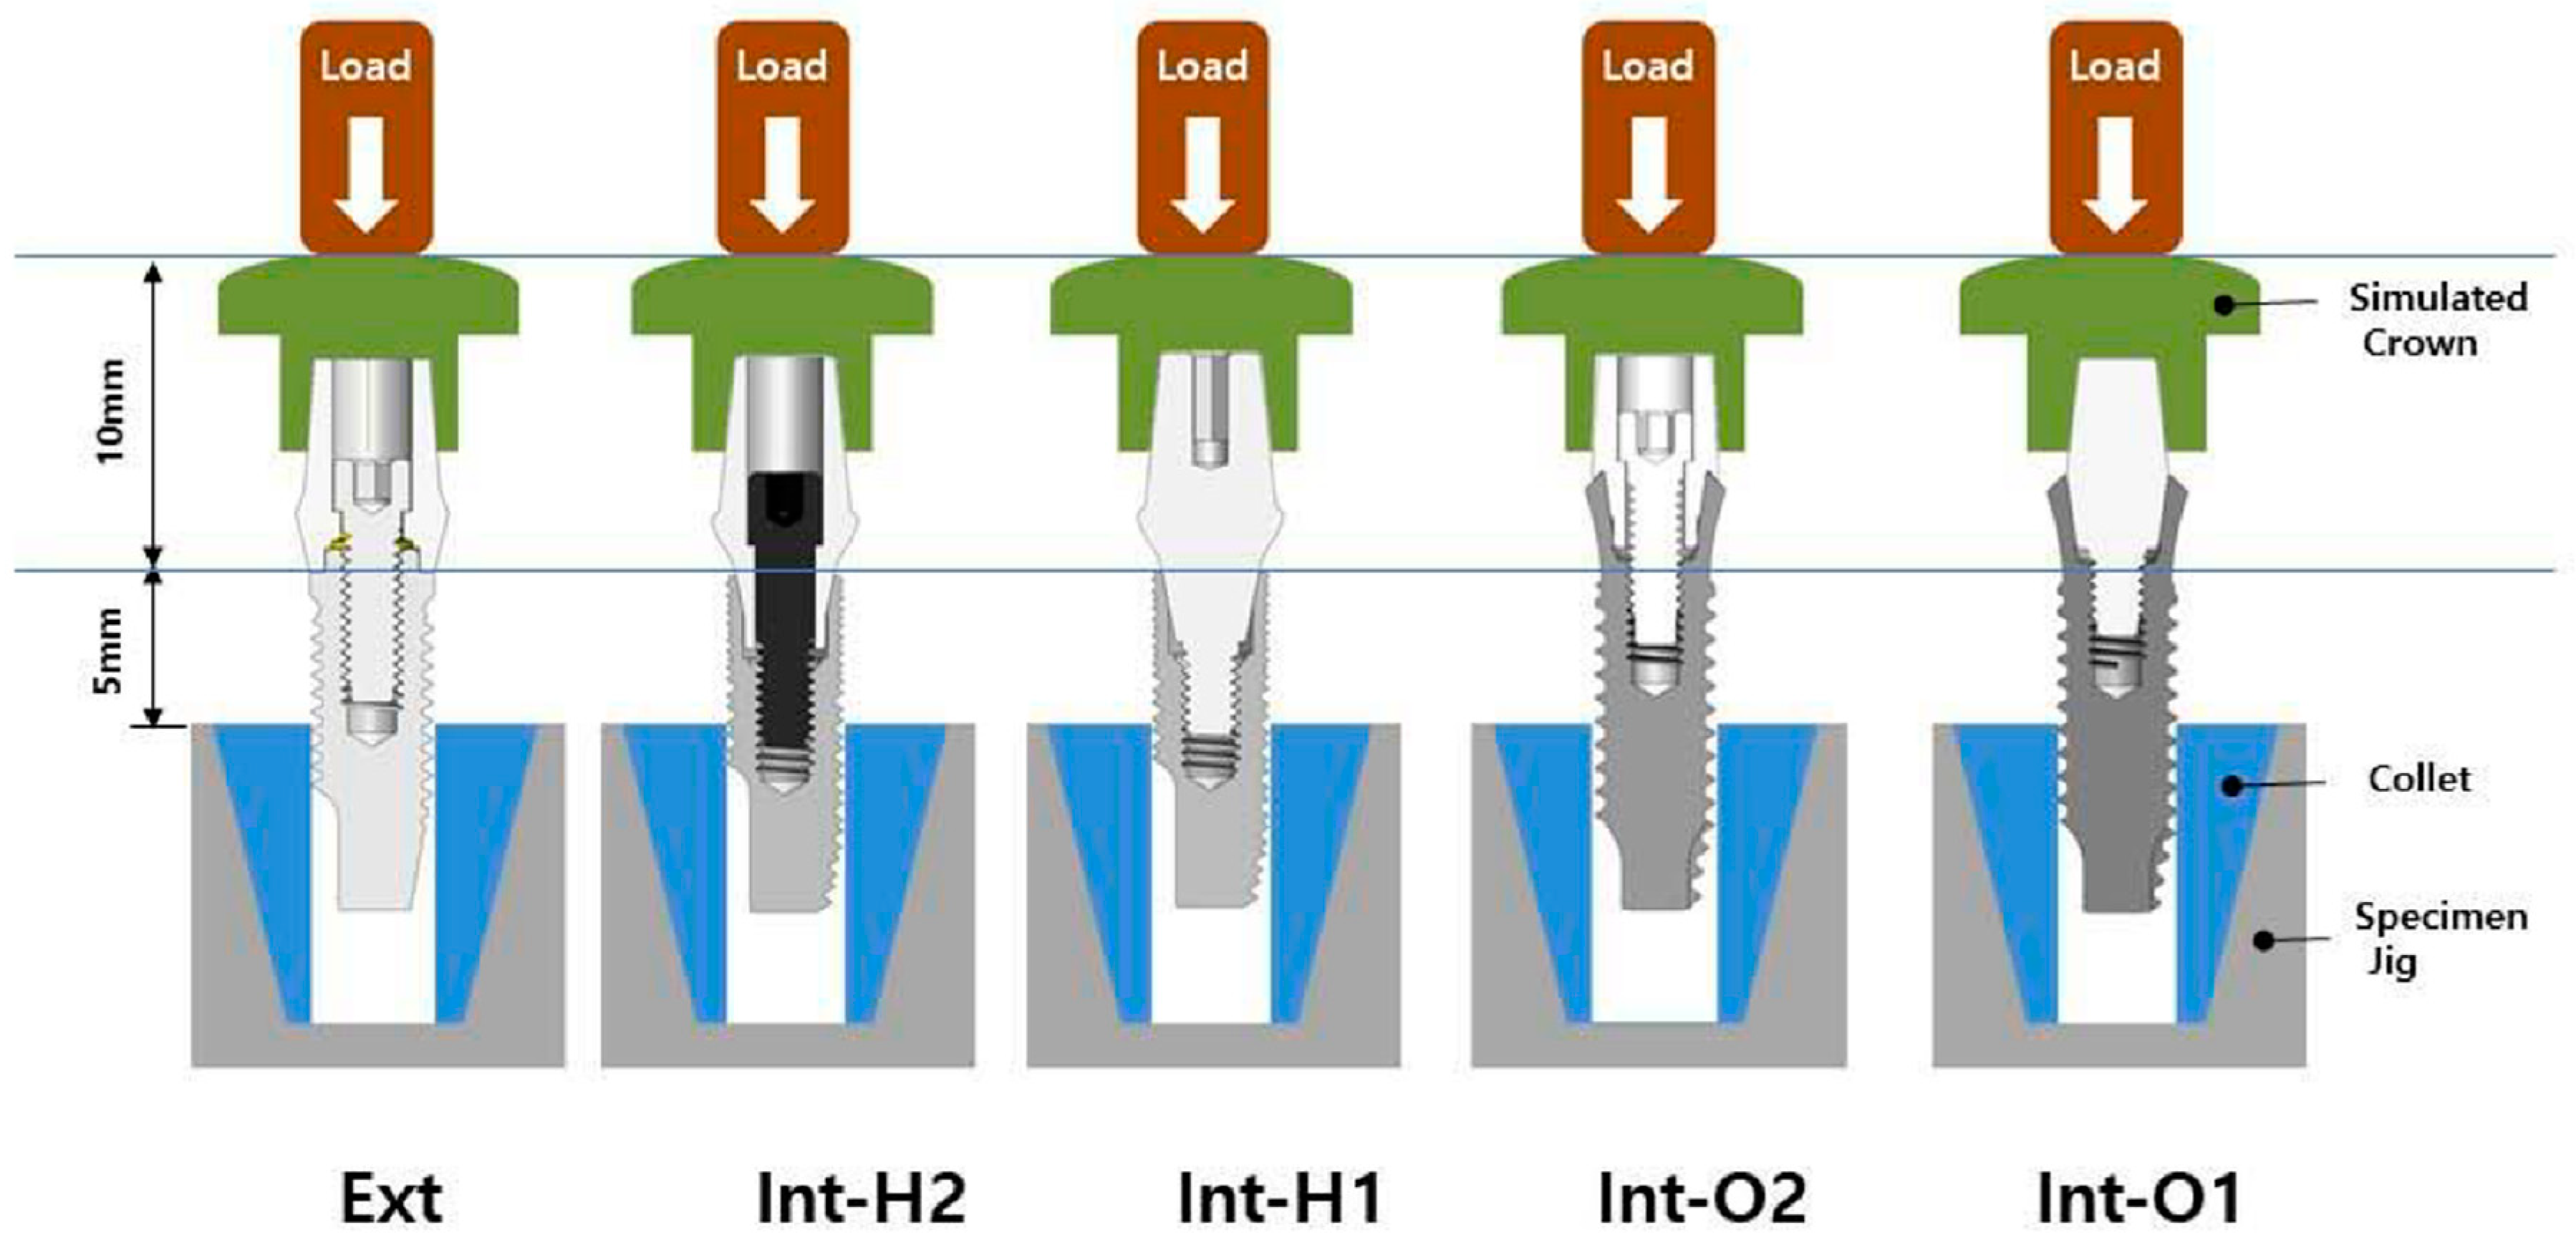
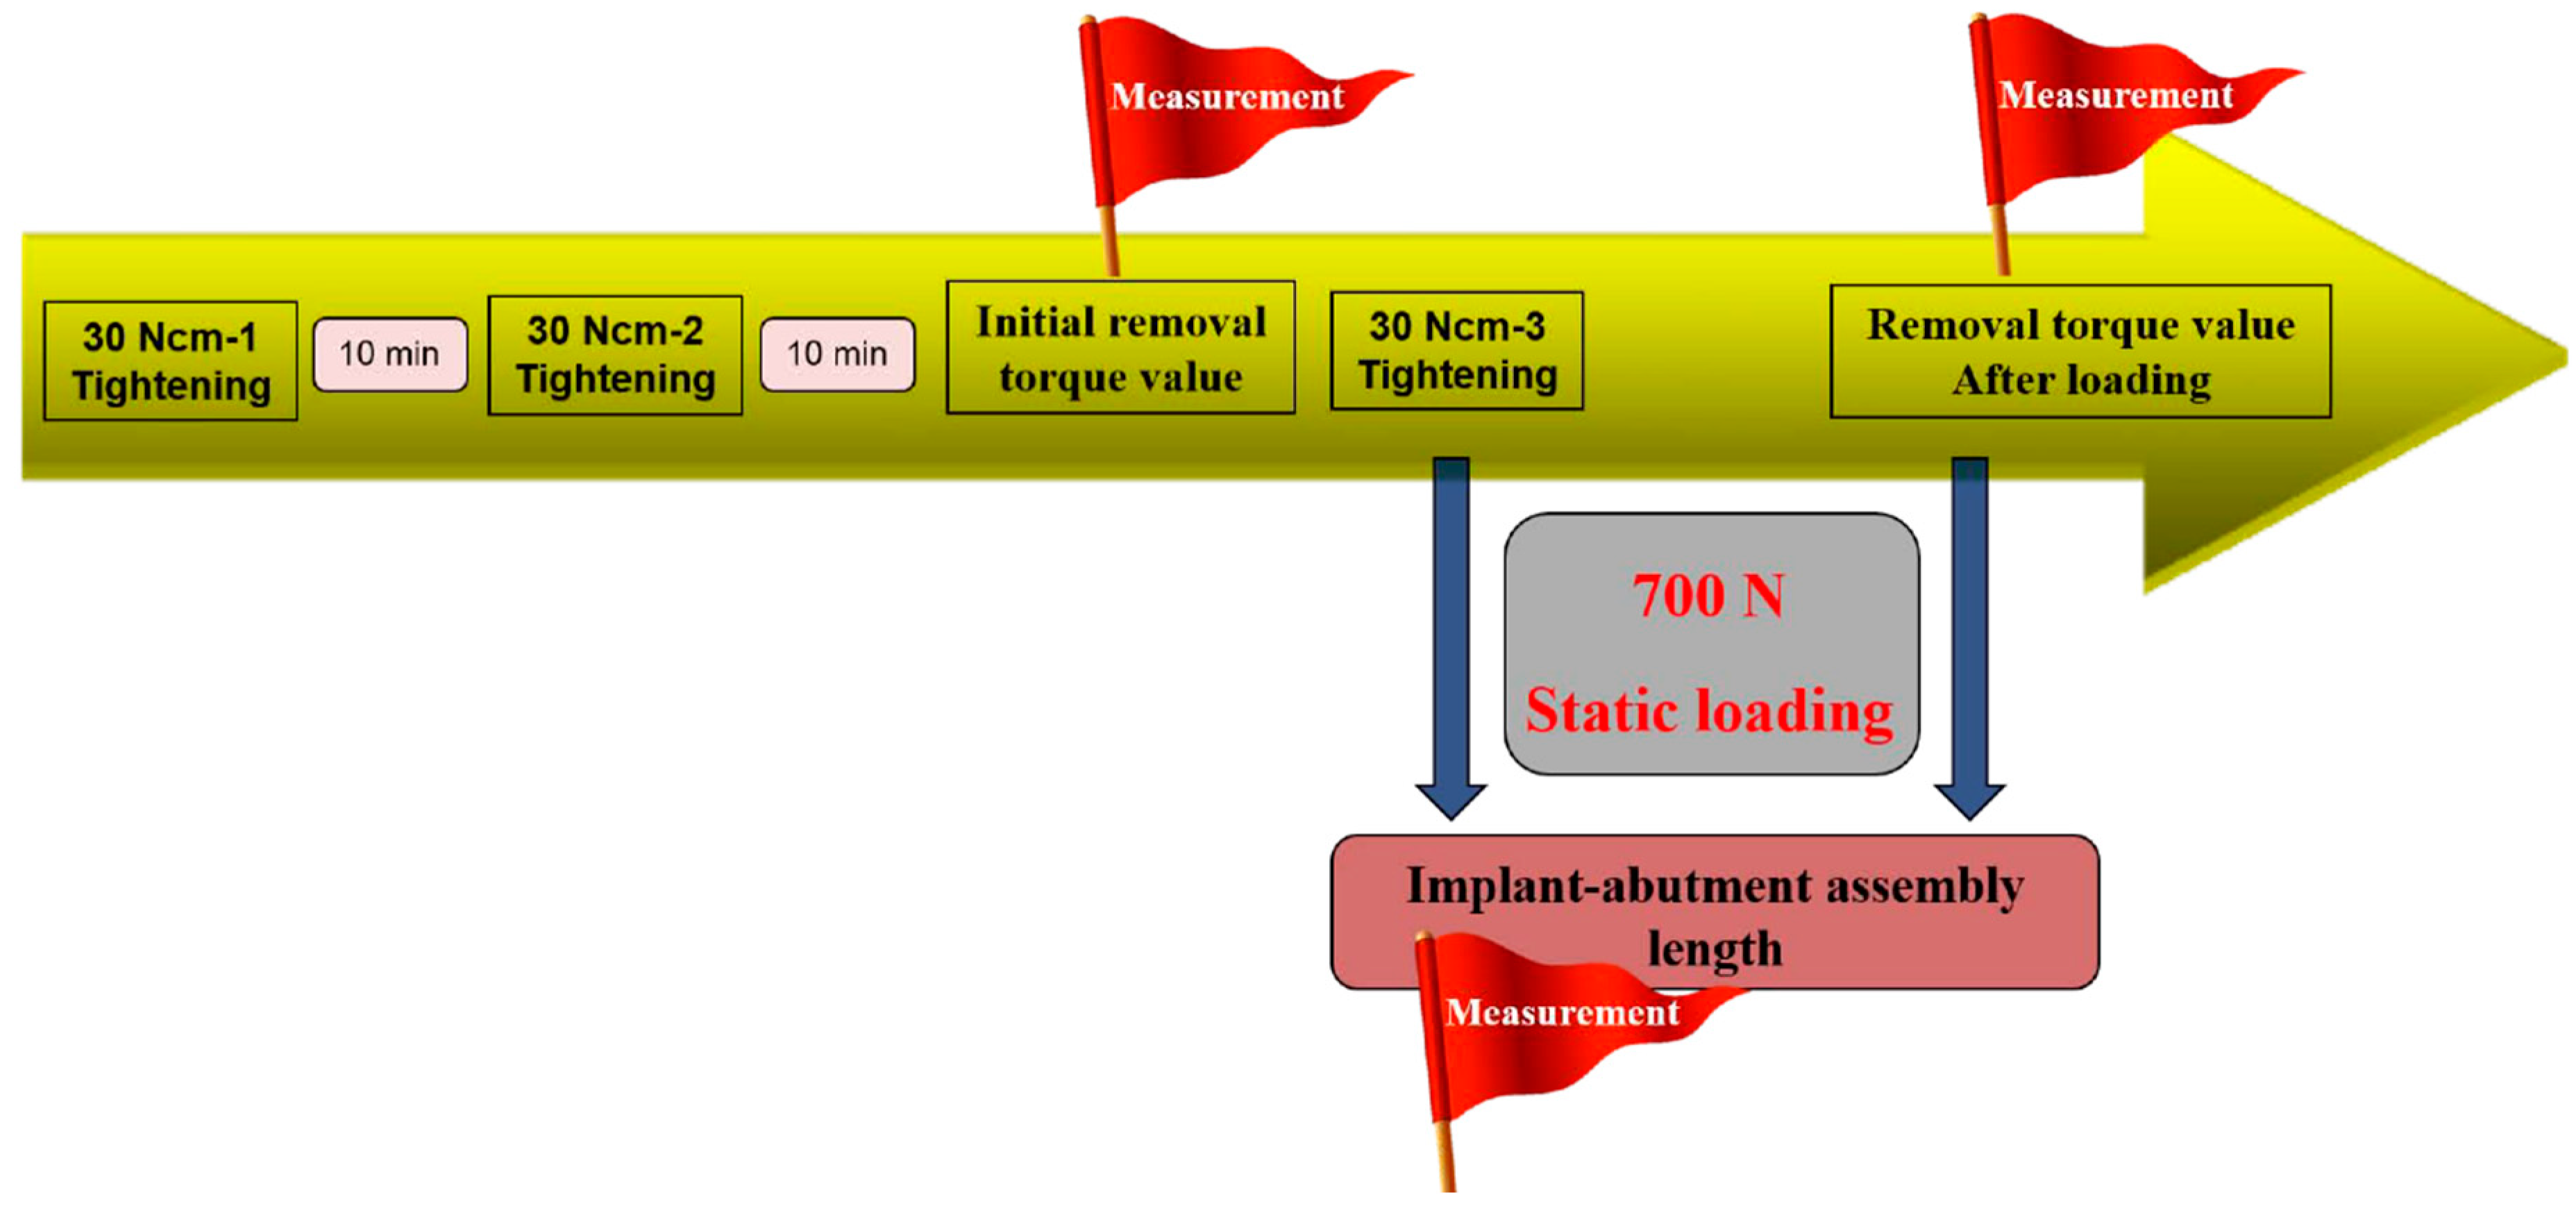
2.1. Implant-Abutment Systems Selection and Study Protocol
- Ext: External butt joint + Cemented abutment (two-piece)
- Int-H2: Internal hexagon + Transfer abutment (two-piece)
- Int-H1: Internal hexagon + Rigid abutment (one-piece)
- Int-O2: Internal octagon + Comocta abutment (two-piece)
- Int-O1: Internal octagon + Solid abutment (one-piece)
2.2. Statistical Analysis
3. Results
4. Discussion
5. Conclusions
Author Contributions
Funding
Conflicts of Interest
References
- Kim, K.S.; Lim, Y.J.; Kim, M.J.; Kwon, H.B.; Yang, J.H.; Lee, J.B.; Yim, S.H. Variation in the total lengths of abutment/implant assemblies generated with a function of applied tightening torque in external and internal implant-abutment connection. Clin. Oral Implants Res. 2011, 22, 834–839. [Google Scholar] [CrossRef] [PubMed]
- Kim, K.S.; Han, J.S.; Lim, Y.J. Settling of abutments into implants and changes in removal torque in five different implant-abutment connections. Part 1: Cyclic loading. Int. J. Oral Maxillofac. Implants 2014, 29, 1079–1084. [Google Scholar] [CrossRef] [PubMed]
- Lee, J.H.; Lee, W.; Huh, Y.H.; Park, C.J.; Cho, L.R. Impact of Intentional Overload on Joint Stability of Internal Implant-Abutment Connection System with Different Diameter. J. Prosthodont. 2019, 28, e649–e656. [Google Scholar] [CrossRef] [PubMed]
- Ko, K.H.; Huh, Y.H.; Park, C.J.; Cho, L.R. Axial displacement in cement-retained prostheses with different implant-abutment connections. Int. J. Oral Maxillofac. Implants 2019, 34, 1098–1104. [Google Scholar] [CrossRef] [PubMed]
- Bianco, G.; Di Raimondo, R.; Luongo, G.; Paoleschi, C.; Piccoli, P.; Piccoli, C.; Rangert, B. Osseointegrated implant for single-tooth replacement: A retrospective multicenter study on routine use in private practice. Clin. Implant Dent. Relat. Res. 2000, 2, 152–158. [Google Scholar] [CrossRef] [PubMed]
- Palmer, R.M.; Palmer, P.J.; Smith, B.J. A 5-year prospective study of Astra single tooth implants. Clin. Oral Implants Res. 2000, 11, 179–182. [Google Scholar] [CrossRef] [PubMed]
- Dean, J.S.; Throckmorton, G.S.; Ellis, E., Ш; Sinn, D.P. A preliminary study of maximum voluntary bite force and jaw muscle efficiency in pre-orthognathic surgery patients. J. Oral Maxillofac. Surg. 1992, 50, 1284–1288. [Google Scholar] [CrossRef]
- Koyano, K.; Esaki, D. Occlusion on oral implants: Current clinical guidelines. J. Oral Rehabil. 2015, 42, 153–161. [Google Scholar] [CrossRef] [PubMed]
- Kim, Y.; Oh, T.; Misch, C.E.; Wang, H.L. Occlusal considerations in implant therapy: Clinical guidelines with biomechanical rationale. Clin. Oral Implants Res. 2005, 1, 26–35. [Google Scholar] [CrossRef] [PubMed]
- Rieger, M.R.; Mayberry, M.; Brose, M.O. Finite element analysis of six endosseous implants. J. Prosthet. Dent. 1990, 63, 671–676. [Google Scholar] [CrossRef]
- Misch, C.E. The effect of bruxism on treatment planning for dental implants. Dent. Today 2002, 2, 76–81. [Google Scholar]
- van Eijden, T.M. Three-dimensional analyses of human bite-force magnitude and moment. Arch. Oral Biol. 1991, 36, 535–539. [Google Scholar] [CrossRef]
- Braun, S.; Hnat, W.P.; Freudenthaler, J.W.; Marcotte, M.R.; Hönigle, K.; Johnson, B.E. A study of maximum bite force during growth and development. Angle Orthod. 1996, 66, 261–264. [Google Scholar] [PubMed]
- Morneburg, T.R.; Pröschel, P.A. Measurement of masticatory forces and implant loads: A methodologic clinical study. Int. J. Prosthodont. 2002, 15, 20–27. [Google Scholar] [PubMed]
- Richter, E.J. In vivo vertical forces on implants. Int. J. Oral Maxillofac. Implants 1995, 10, 99–108. [Google Scholar] [PubMed]
- Chambrone, L.; Chambrone, L.A.; Lima, L.A. Effects of occlusal overload on peri-implant tissue health: A systematic review of animal-model studies. J. Periodontol. 2010, 81, 1367–1378. [Google Scholar] [CrossRef] [PubMed]
- Rigsby, D.F.; Bidez, M.W.; Misch, C.E. Bone Response to Mechanical Loads. In Contemporary Implant Dentistry, 2nd ed.; Misch, C.E., Ed.; Mosby: St. Louis, Missouri, USA, 1998; pp. 317–328. [Google Scholar]
- Haack, J.E.; Sakaguchi, R.L.; Sun, T.; Coffey, J.P. Elongation and preload stress in dental implant abutment screws. Int. J. Oral Maxillofac. Implants 1995, 10, 529–536. [Google Scholar] [PubMed]


| Group | Ext | Int-H2 | Int-H1 | Int-O2 | Int-O1 |
|---|---|---|---|---|---|
| Implant system | US II | GS II | SS II | ||
| Implant/abutment interface | External butt joint | 11° taper internal hexagon | 8° morse taper internal octagon | ||
| Abutment type | Cemented (two-piece) | Transfer (two-piece) | Rigid (one-piece) | Comocta (two-piece) | Solid (one-piece) |
| Abutment material | Ti CP-Gr 3 | Ti CP-Gr 3 | Ti-6Al-4V | Ti CP-Gr 3 | Ti-6Al-4V |
| Abutment diameter | Ø5.0 | Ø5.0 | Ø5.0 | Ø4.3 | Ø3.5 |
| Abutment gingival height | 2 mm | 2 mm | 2 mm | - | - |
| Abutment height (HA) | 5.5 mm | 5.5 mm | 5.5 mm | 4 mm | 4 mm |
| Abutment screw | Ta | WC/C Ta | - | Ta | - |
| Fixture material | Ti CP-Gr 4 | Ti CP-Gr 4 | Ti CP-Gr 4 | ||
| Fixture diameter | Ø4.0 | Ø4.0 | Ø4.0 | Ø4.1 | Ø4.1 |
| Fixture height(HF) | 11.4 mm | 11.5 mm | 11.5 mm | 11.5 mm | 11.5 mm |
| Feature |  |  |  |  |  |
| Group | Ext (mm) | Int-H2 (mm) | Int-H1 (mm) | Int-O2 (mm) | Int-O1 (mm) |
|---|---|---|---|---|---|
| Tightening torque | 18.6096 | 18.9624 | 19.0456 | 18.9564 | 18.9992 |
| 30 Ncm-③ * | ±0.0054 | ±0.0153 | ±0.0261 | ±0.0222 | ±0.0041 |
| Load 700 N Static ** | 18.6088 | 18.9512 | 19.0354 | 18.9372 | 18.9736 |
| ±0.0054 | ±0.0151 | ±0.0266 | ±0.0222 | ±0.0035 |
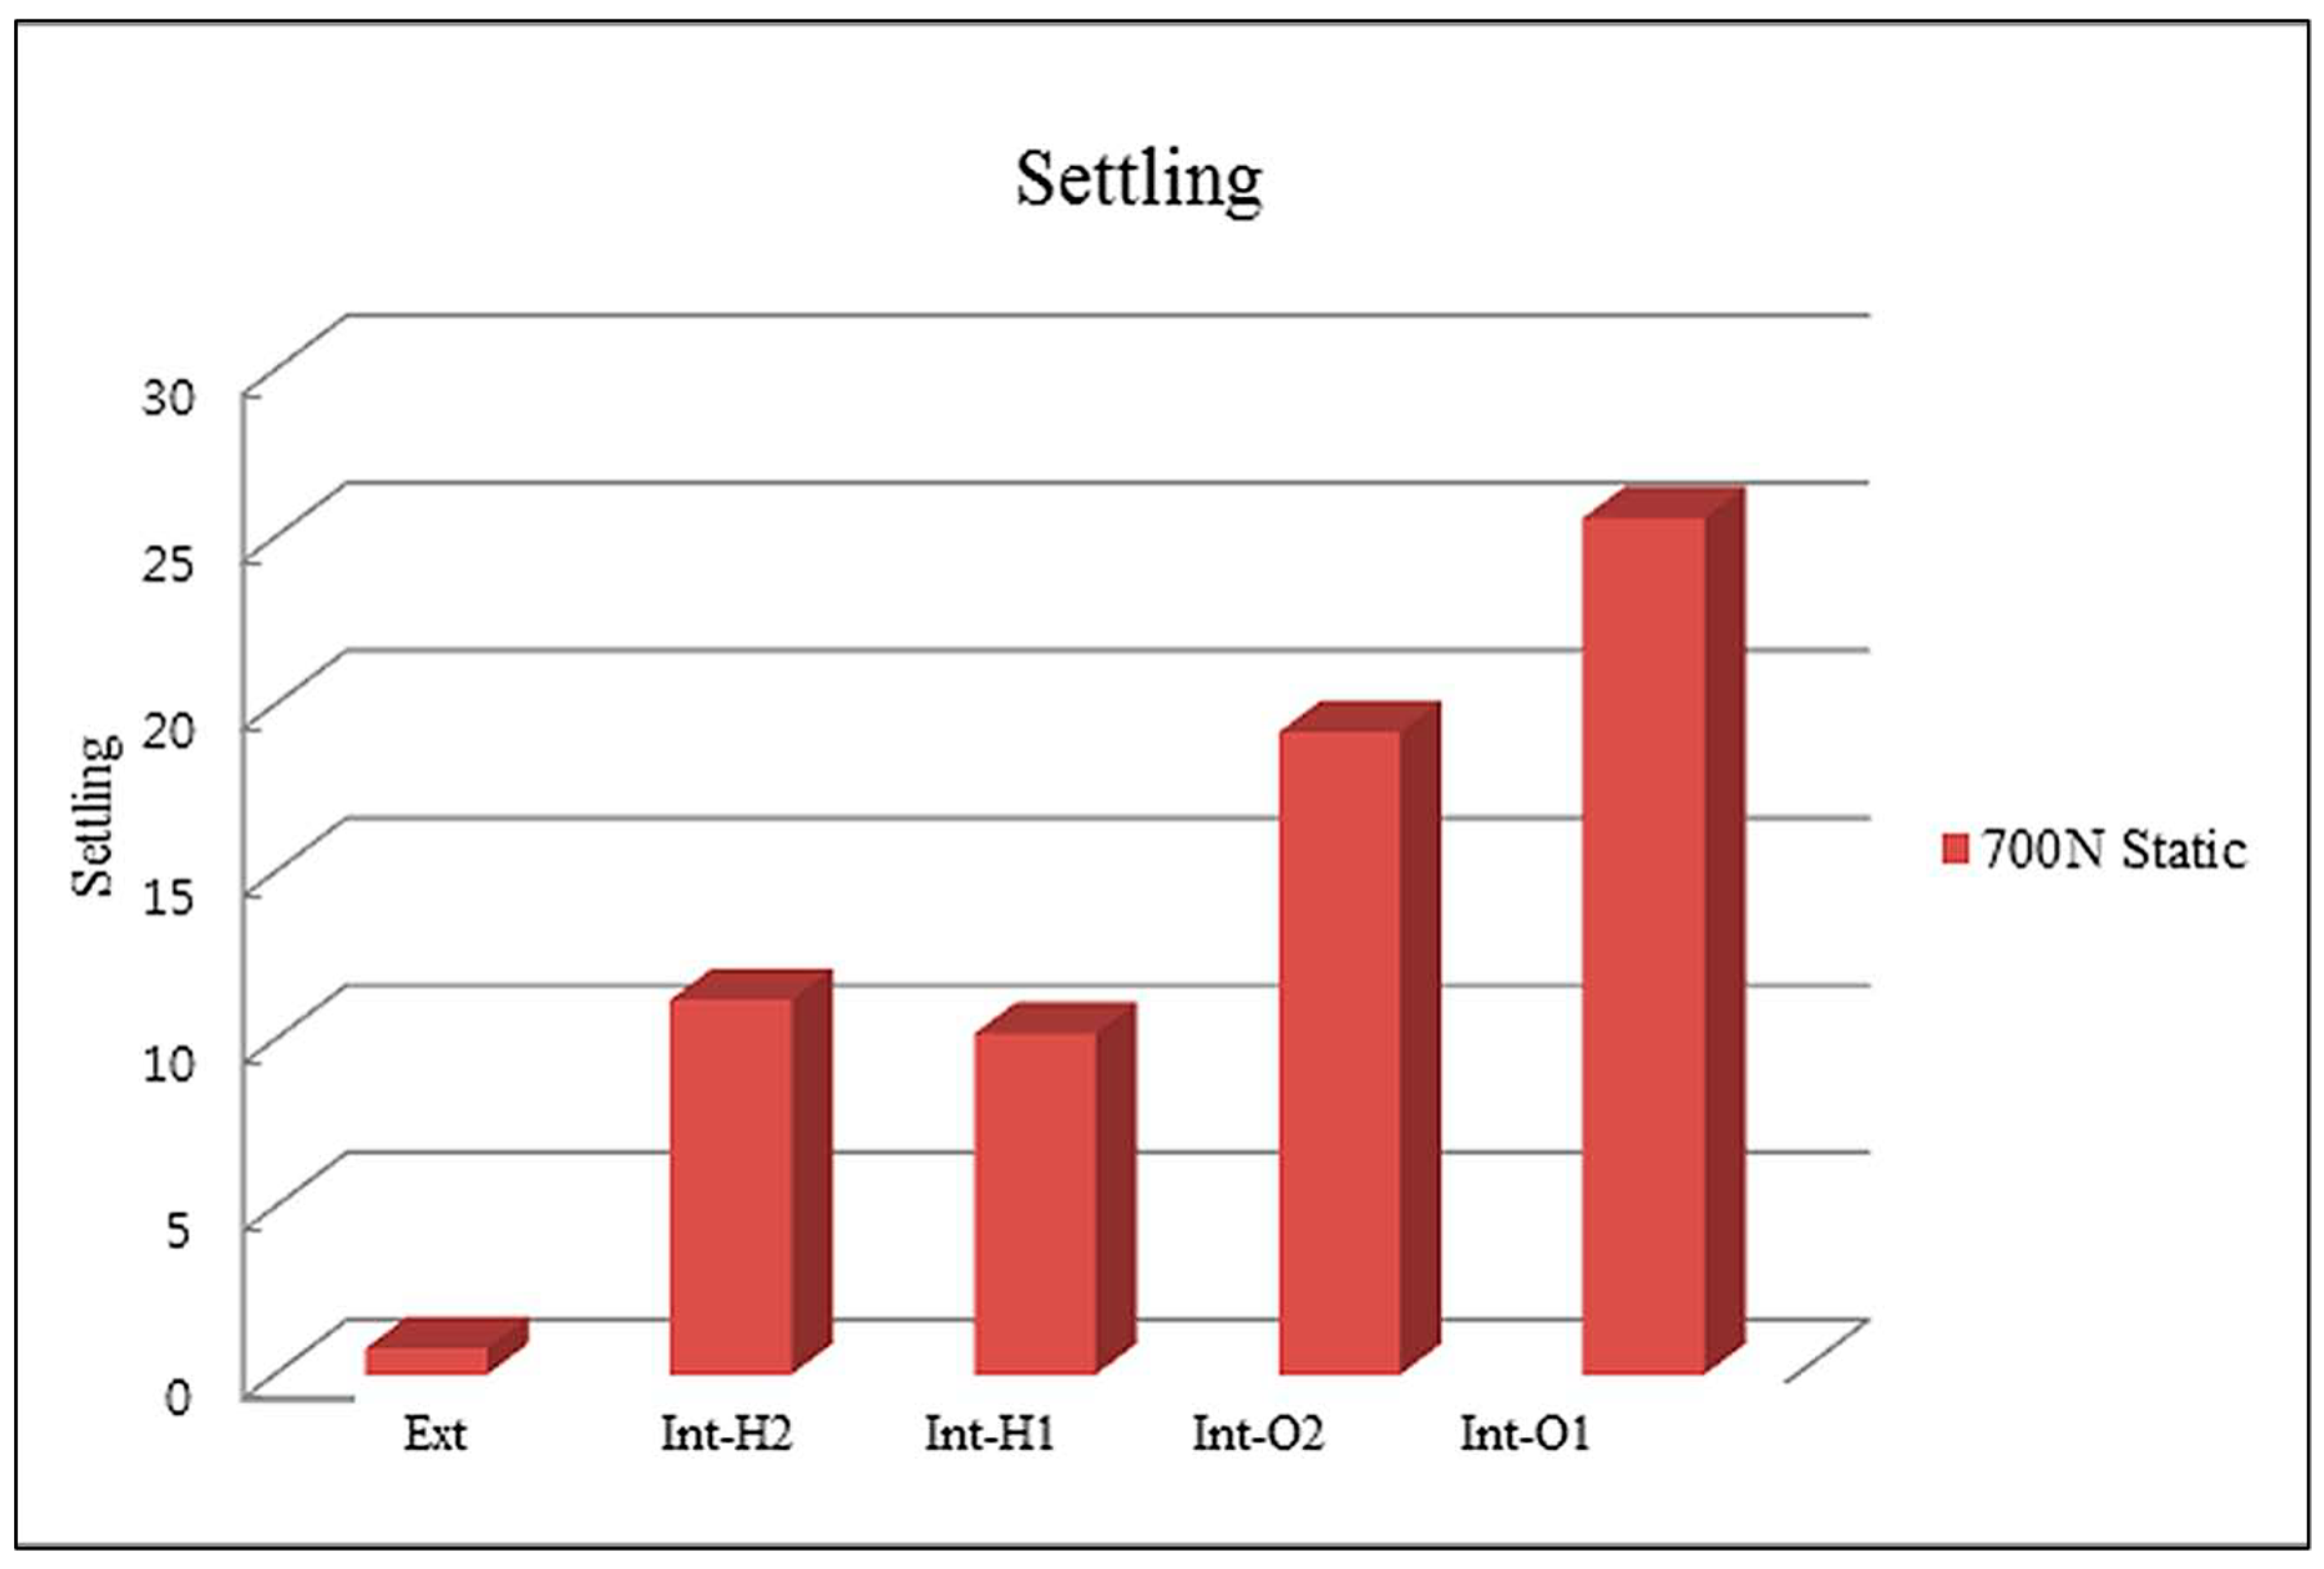
| Group | Settling Values Mean ± SD (μm) | Group Comparisons † |
|---|---|---|
| Ext | 0.8 ± 0.45 | Ext < Int-H1, Int-H2 < Int-O2 < Int-O1 Settling value = (total lengths of the implant-abutment assemblies at 30 Ncm-③) minus (total lengths of the implant-abutment assemblies after 700 N static loading) |
| Int-H2 | 11.2 ± 0.84 | |
| Int-H1 | 10.2 ± 0.84 | |
| Int-O2 | 19.2 ± 4.21 | |
| Int-O1 | 25.6 ± 2.97 |
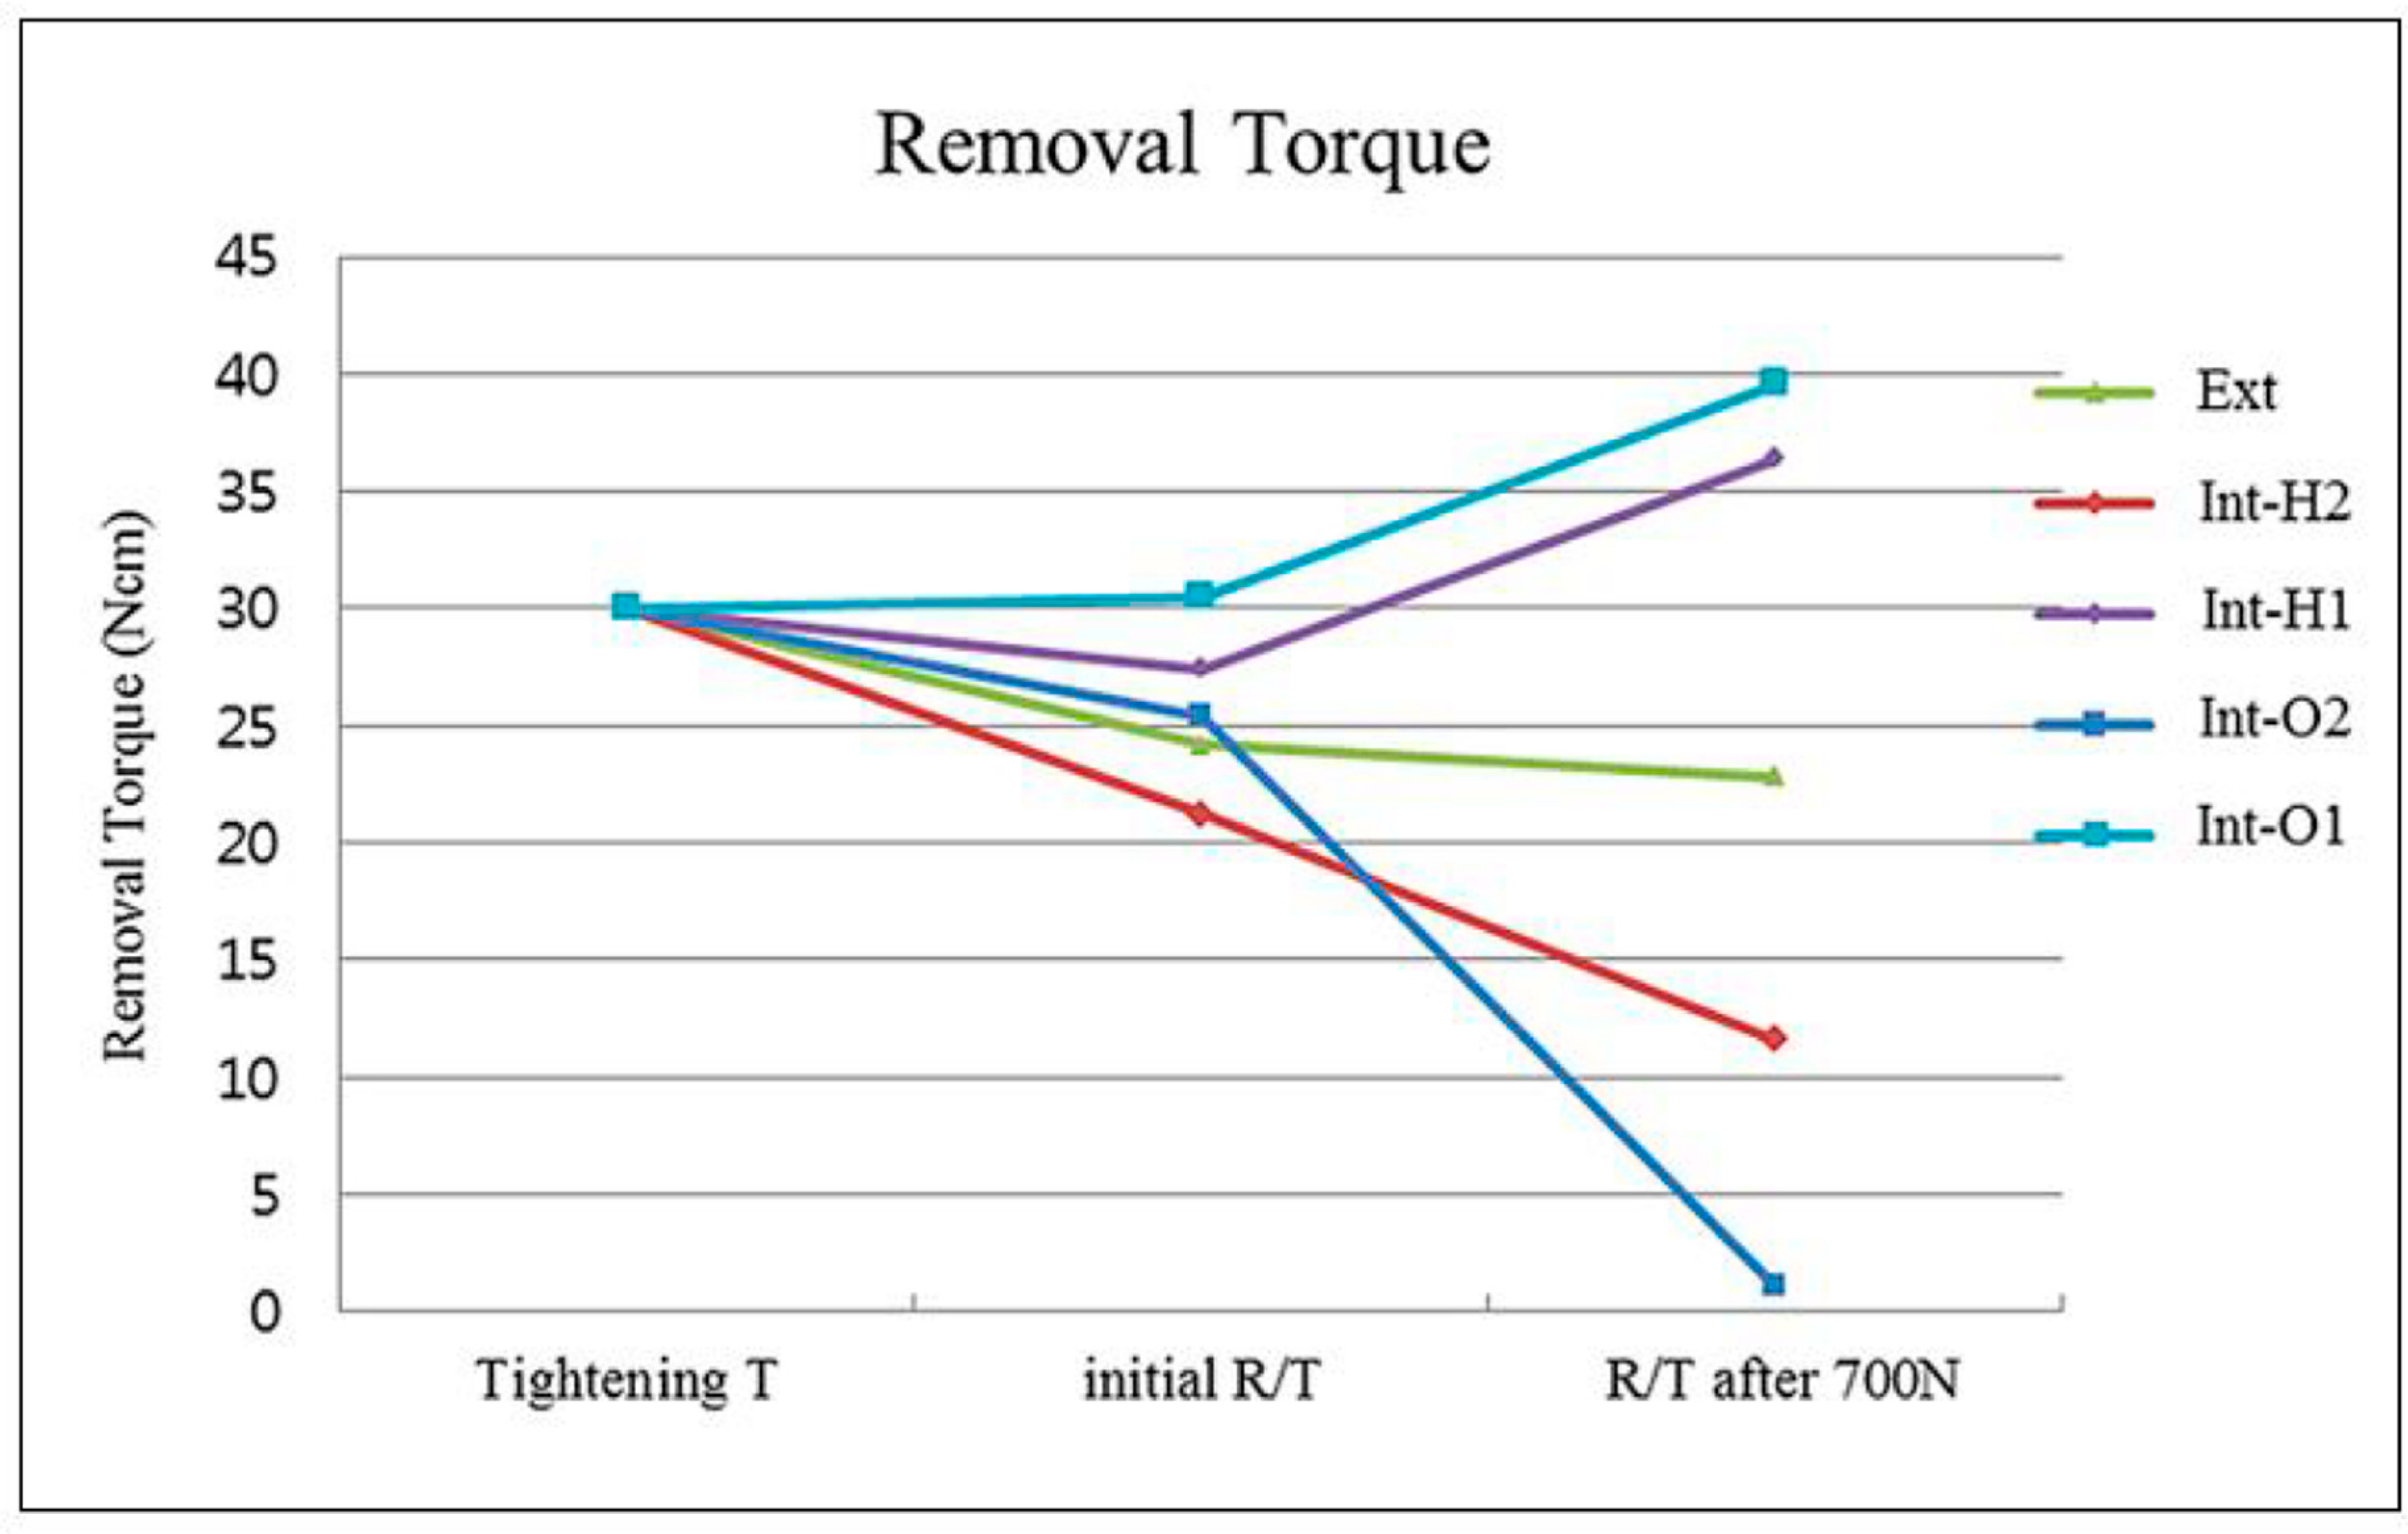
| Test | Group (n = 5) | Tightening Torque (Ncm) | Removal Torque (Ncm) | Significance † |
|---|---|---|---|---|
| Initial removal torque | Ext | 30 | 24.22 ± 0.81 | Int-H2 < Ext, Int-O2 < Int-H1 < Int-O1 |
| Int-H2 | 30 | 21.22 ± 1.04 | ||
| Int-H1 | 30 | 27.44 ± 0.92 | ||
| Int-O2 | 30 | 25.38 ± 1.86 | ||
| Int-O1 | 30 | 30.54 ± 0.56 | ||
| Removal torque after 700N static loading | Ext | 30 | 22.78 ± 0.40 | Int-O2 < Int-H2 < Ext < Int-H1, Int-O1 |
| Int-H2 | 30 | 11.62 ± 0.56 | ||
| Int-H1 | 30 | 36.38 ± 6.25 | ||
| Int-O2 | 30 | 1.14 ± 0.40 | ||
| Int-O1 | 30 | 39.64 ± 4.28 |
| Group | Initial R/T a | R/T after Static Load b | Significance † |
|---|---|---|---|
| Ext | 24.22 ± 0.81 | 22.78 ± 0.40 | * |
| Int-H2 | 21.22 ± 1.04 | 11.62 ± 0.56 | ** |
| Int-H1 | 27.44 ± 0.92 | 36.38 ± 6.25 | NS |
| Int-O2 | 25.38 ± 1.86 | 1.14 ± 0.40 | * |
| Int-O1 | 30.54 ± 0.56 | 39.64 ± 4.28 | * |
| Group | Removal Torque | t/P |
|---|---|---|
| Value | ||
| Ext | Initial | 6.279 |
| after 700 N static loading | /0.003 * | |
| Int-H2 | Initial | 16.204 |
| after 700 N static loading | /0.000 * | |
| Int-H1 | Initial | −3.313 |
| after 700 N static loading | /0.030 * | |
| Int-O2 | Initial | 6.413 |
| after 700 N static loading | /0.003 * | |
| Int-O1olid | Initial | −4.768 |
| after 700 N static loading | /0.009 * |
© 2020 by the authors. Licensee MDPI, Basel, Switzerland. This article is an open access article distributed under the terms and conditions of the Creative Commons Attribution (CC BY) license (http://creativecommons.org/licenses/by/4.0/).
Share and Cite
Kim, K.-S.; Lim, Y.-J. Axial Displacements and Removal Torque Changes of Five Different Implant-Abutment Connections under Static Vertical Loading. Materials 2020, 13, 699. https://doi.org/10.3390/ma13030699
Kim K-S, Lim Y-J. Axial Displacements and Removal Torque Changes of Five Different Implant-Abutment Connections under Static Vertical Loading. Materials. 2020; 13(3):699. https://doi.org/10.3390/ma13030699
Chicago/Turabian StyleKim, Ki-Seong, and Young-Jun Lim. 2020. "Axial Displacements and Removal Torque Changes of Five Different Implant-Abutment Connections under Static Vertical Loading" Materials 13, no. 3: 699. https://doi.org/10.3390/ma13030699
APA StyleKim, K.-S., & Lim, Y.-J. (2020). Axial Displacements and Removal Torque Changes of Five Different Implant-Abutment Connections under Static Vertical Loading. Materials, 13(3), 699. https://doi.org/10.3390/ma13030699