Evaluation of FRP Bars under Compression and Their Performance in RC Columns


Abstract
:1. Introduction
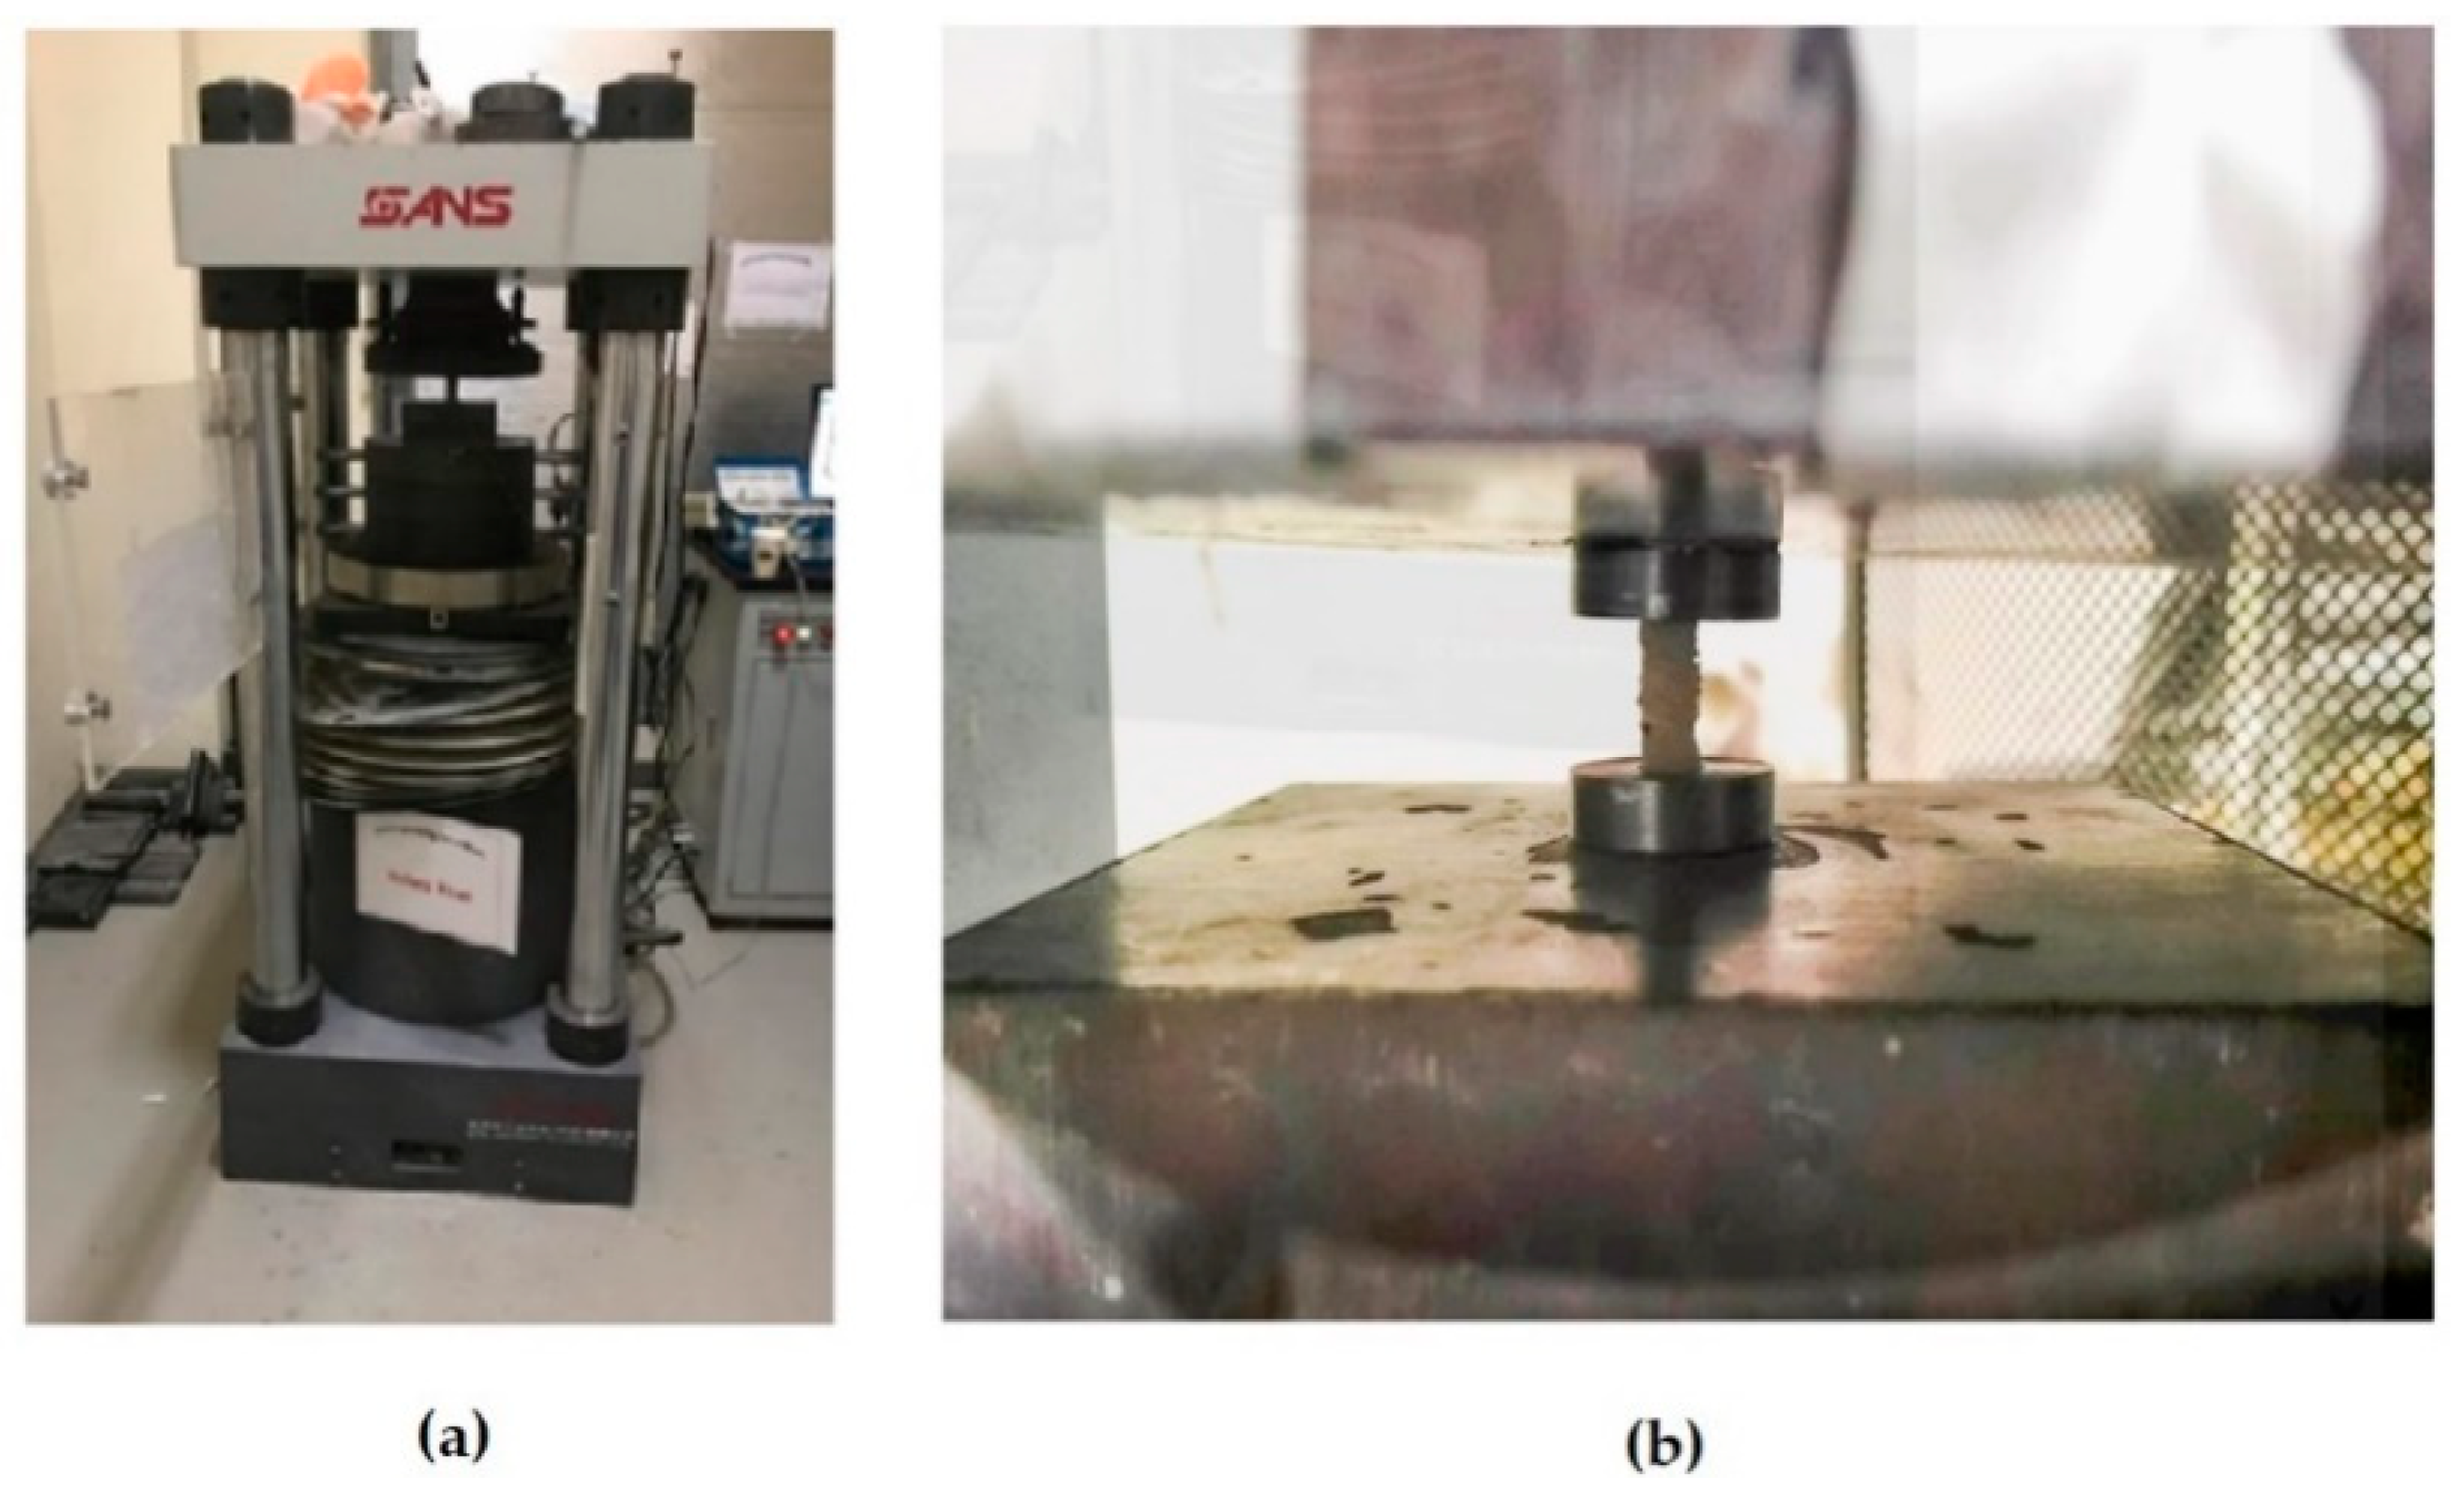
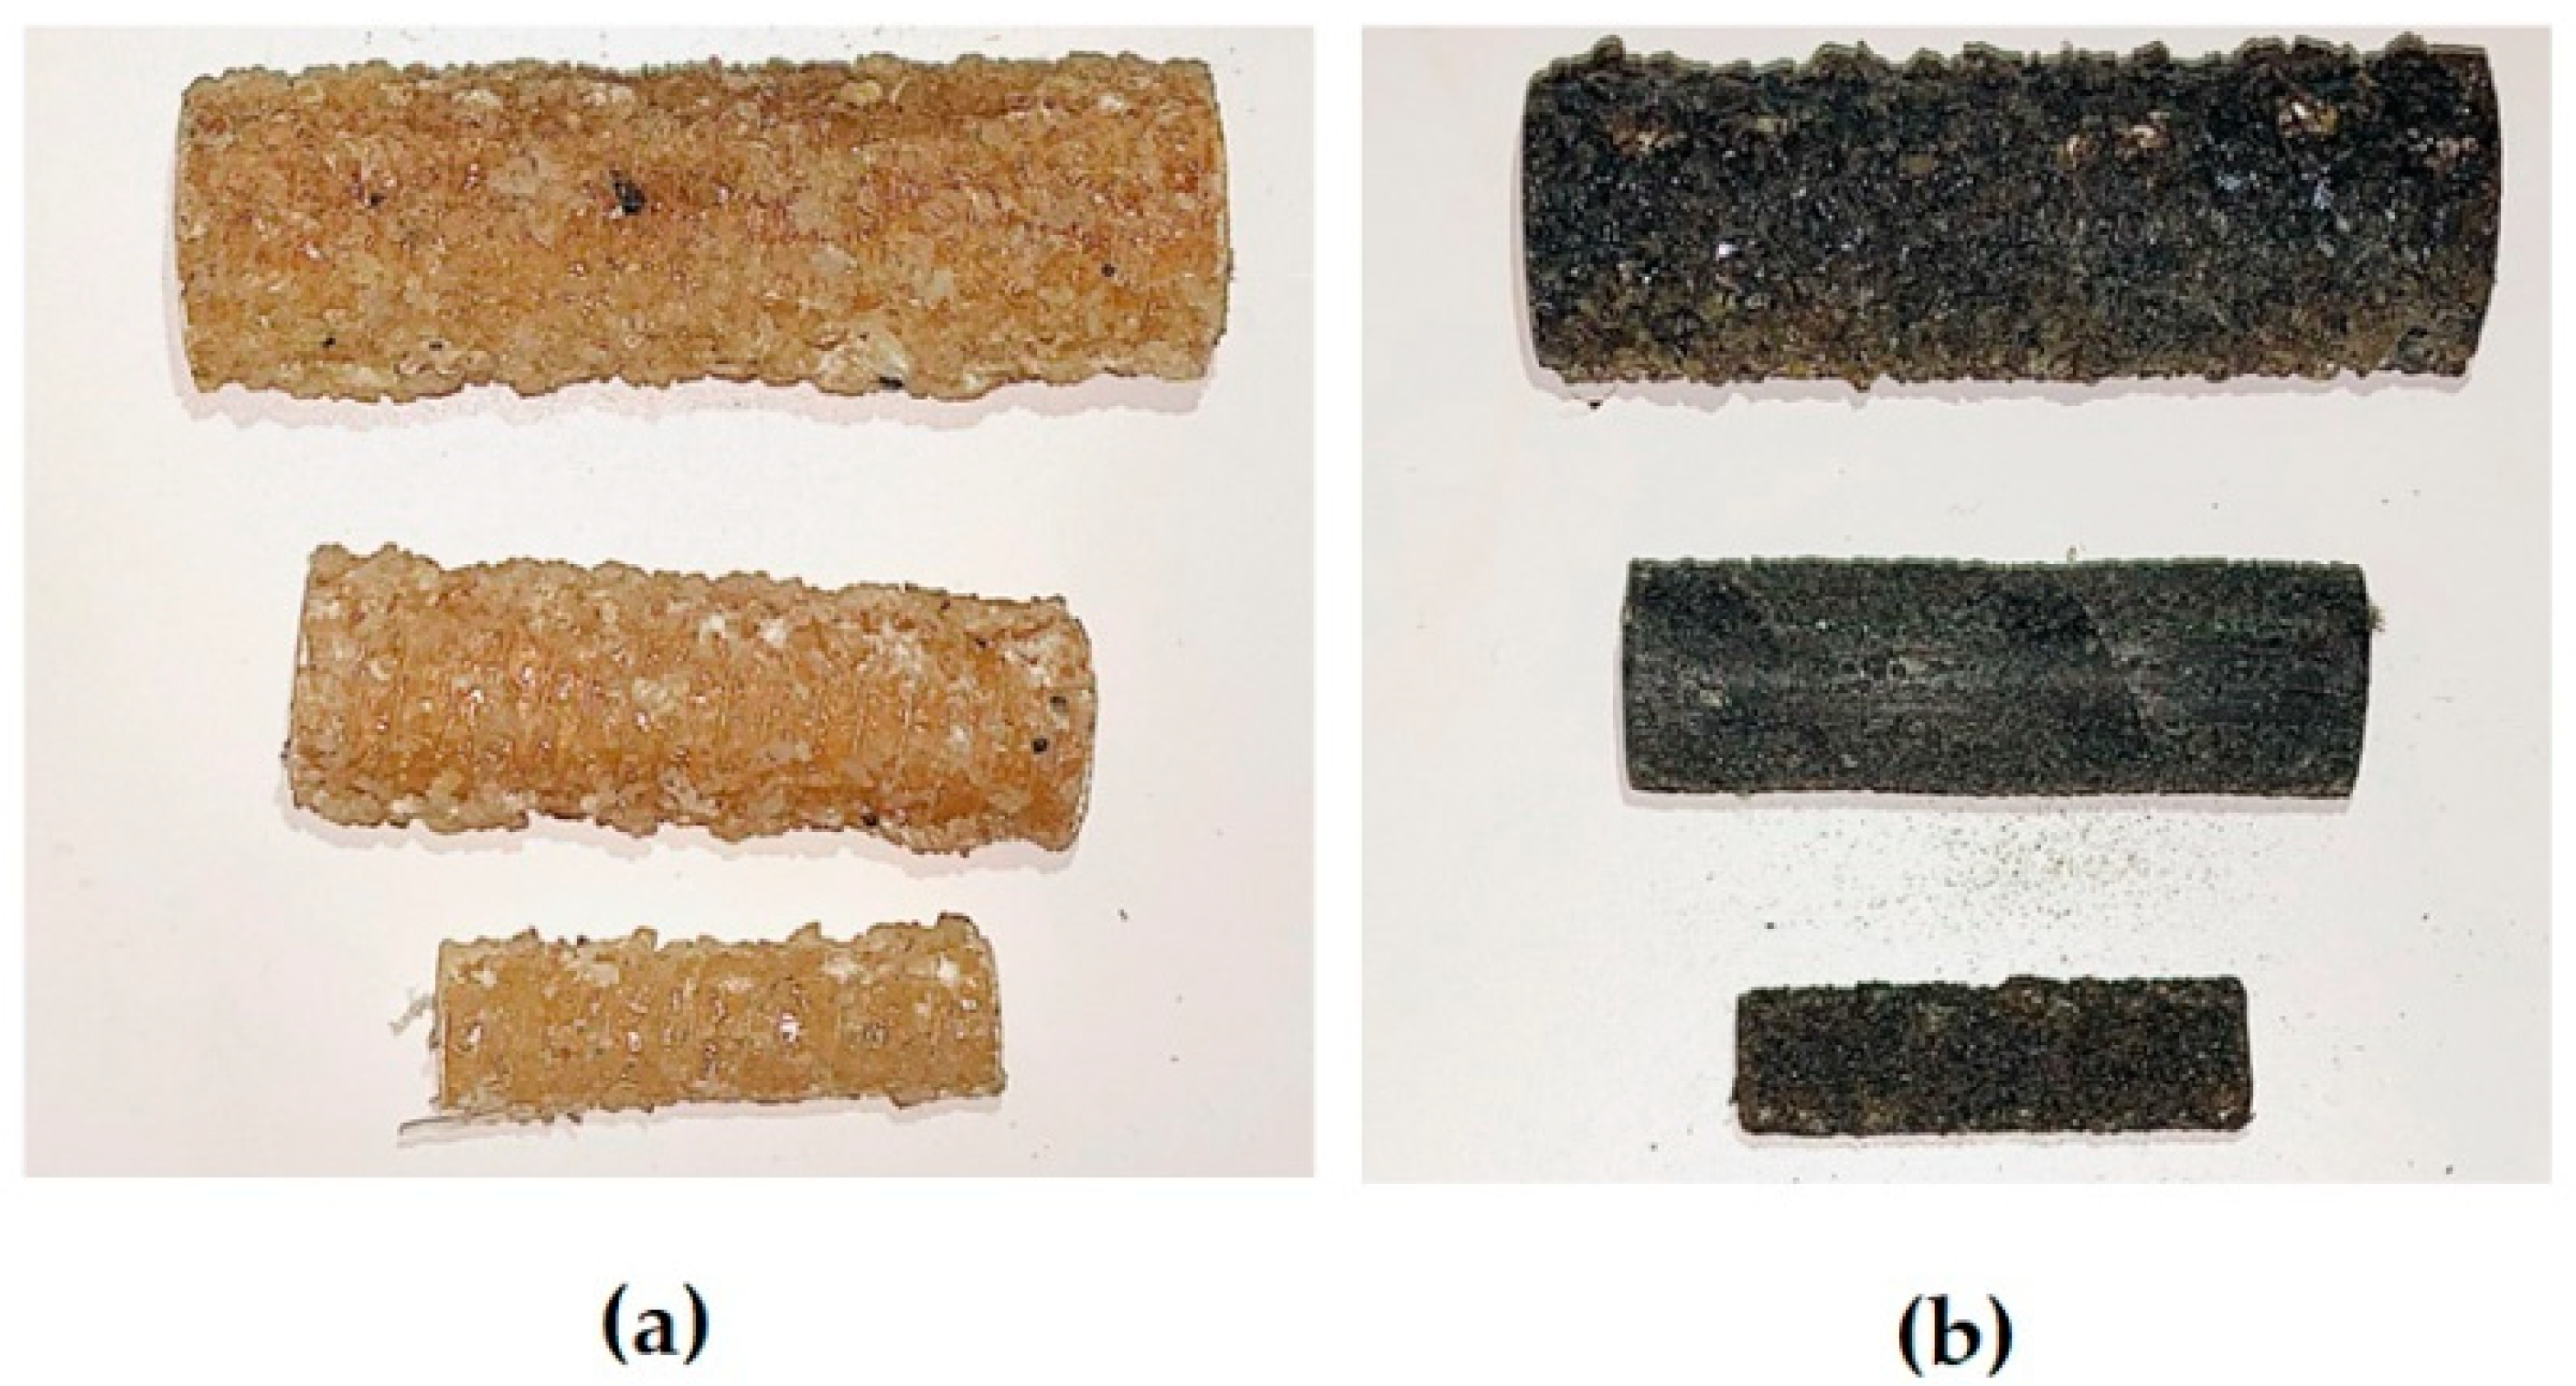
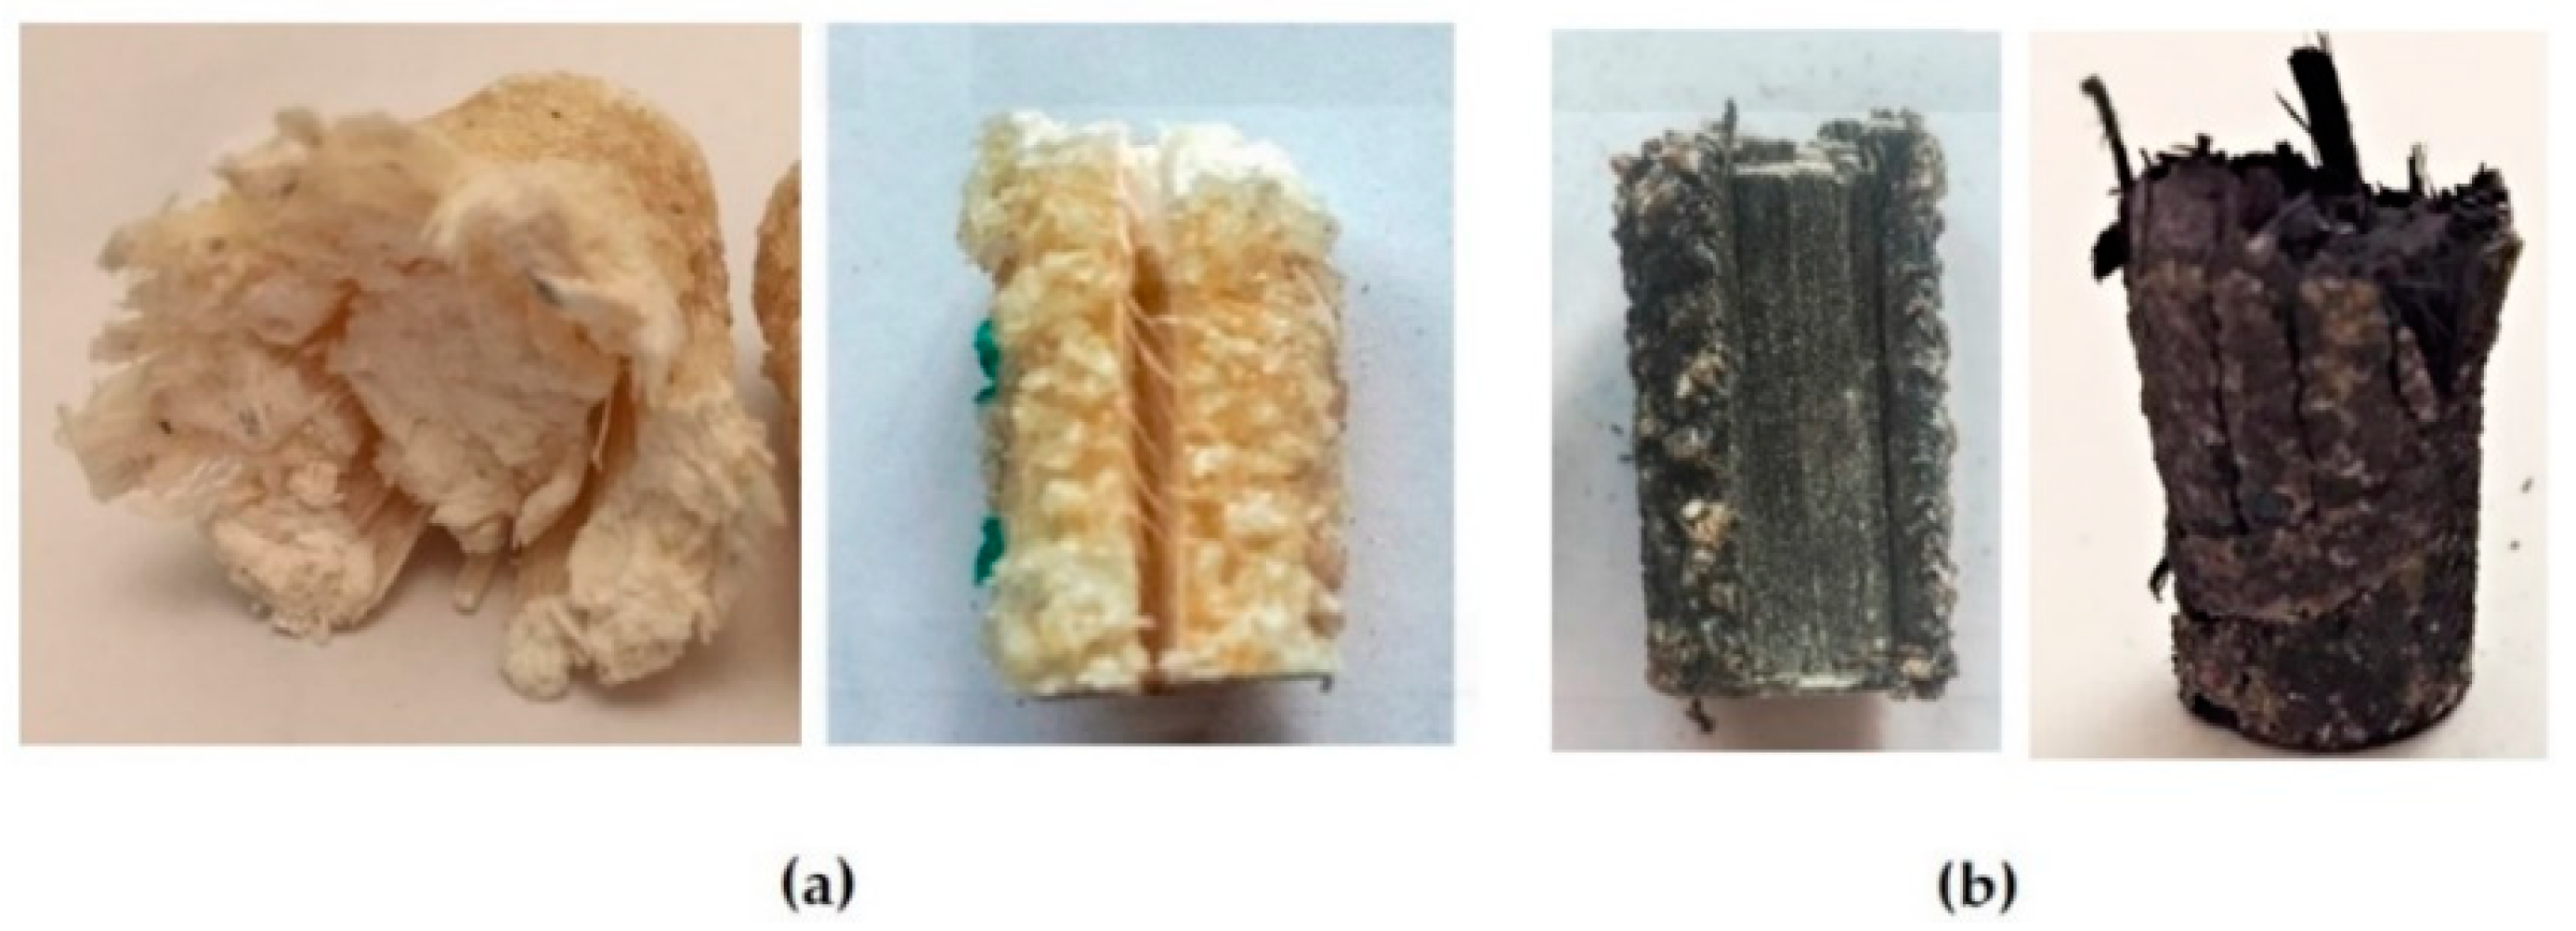
2. Experimental Evaluation of BFRP and GFRP Bars under Compression
3. Evaluation of RC Columns Reinforced with GFRP and BFRP Bars
3.1. Finite Element Modeling
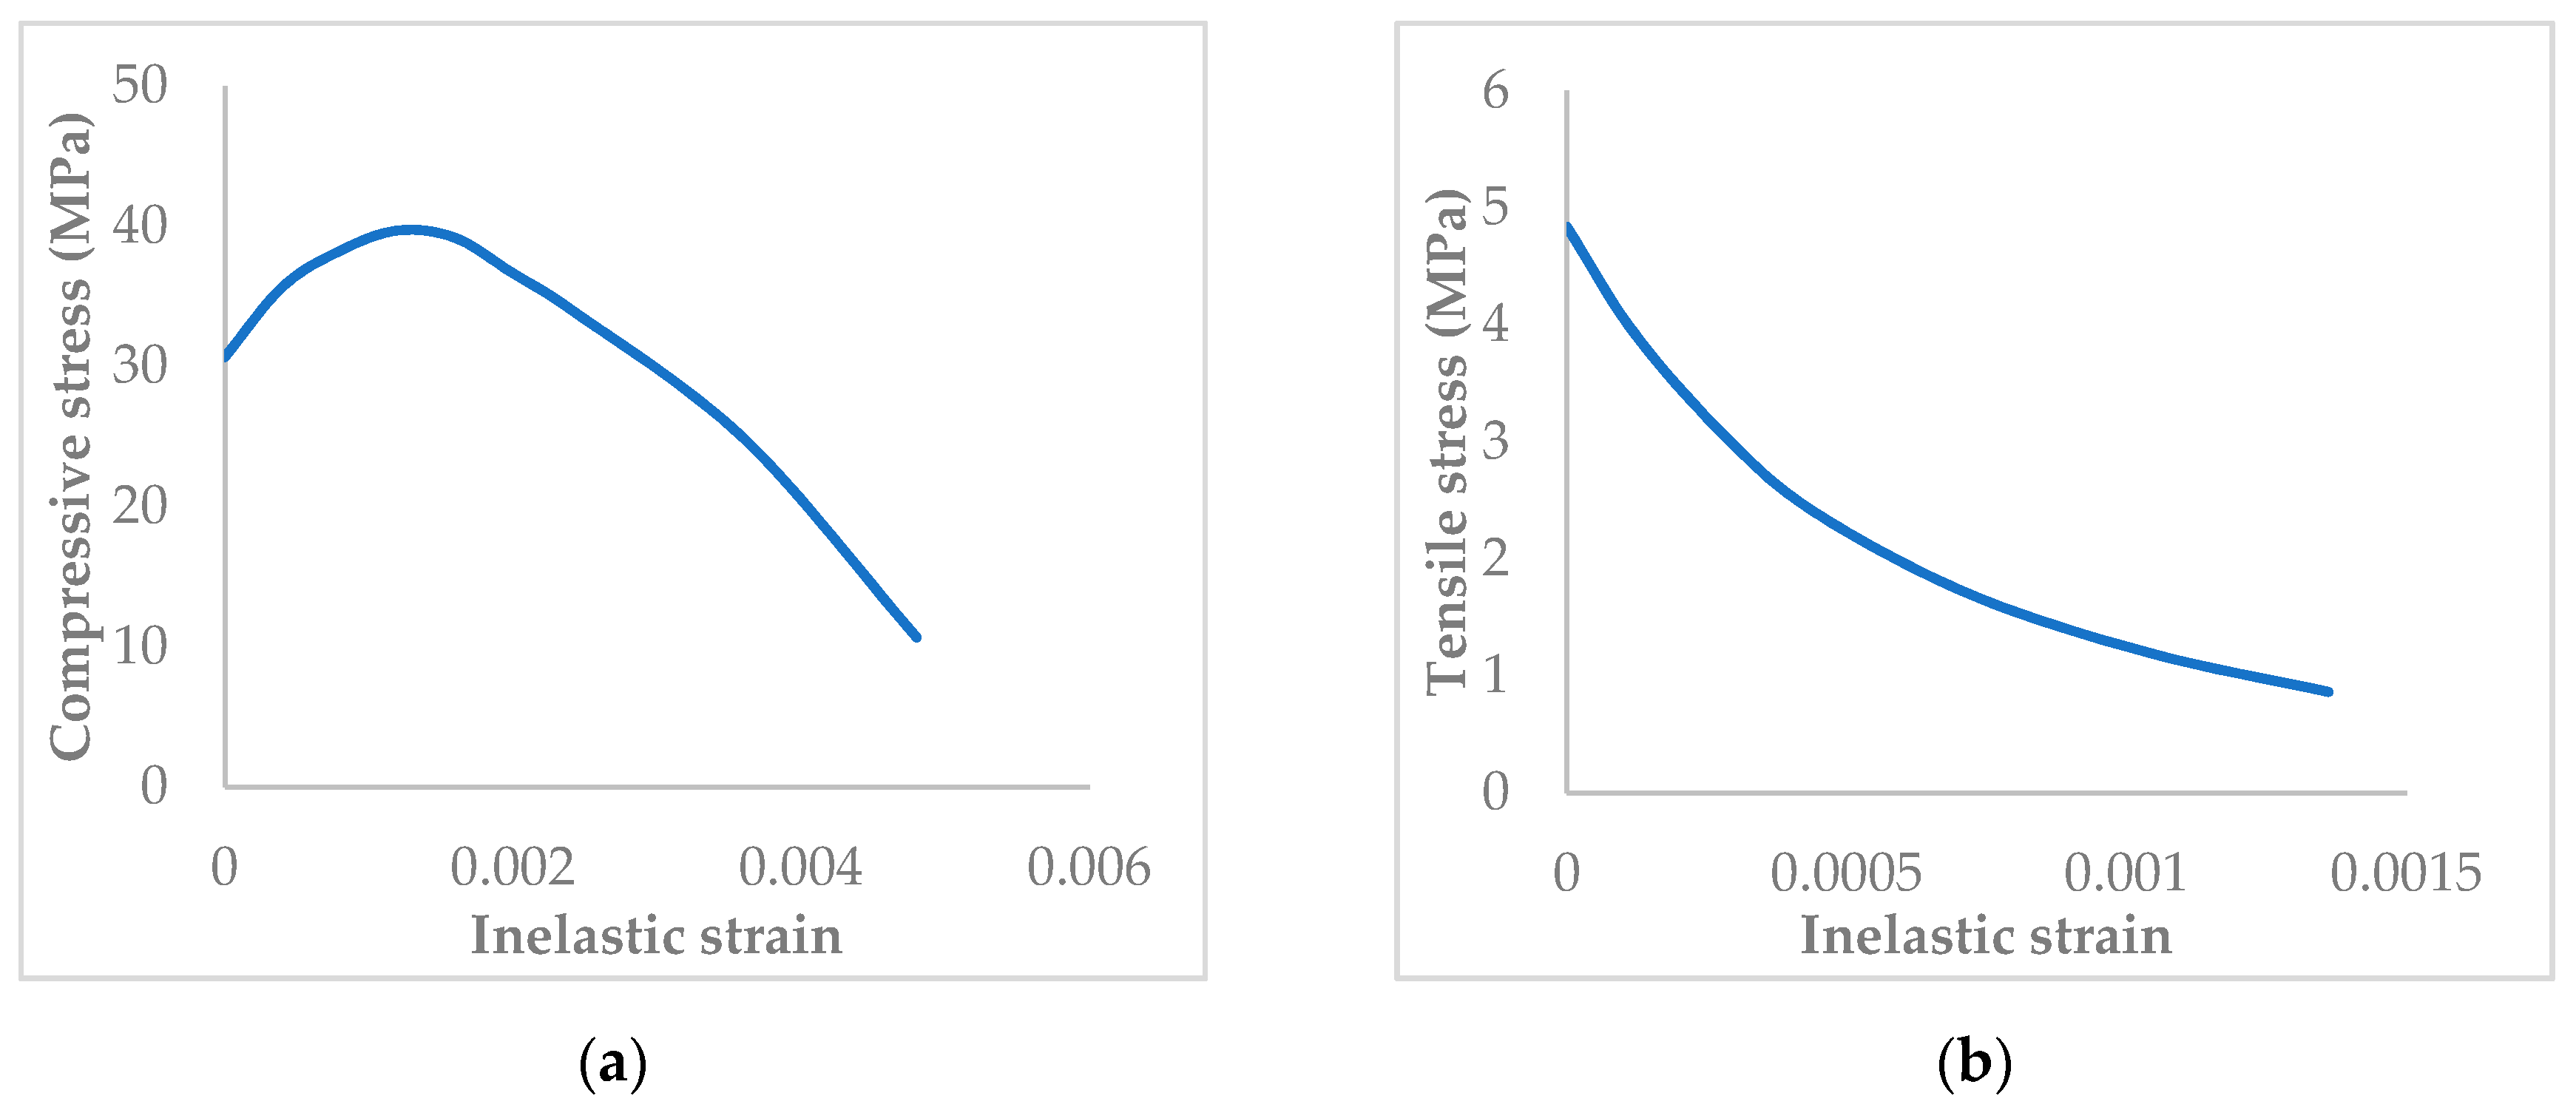
3.1.1. Materials Properties
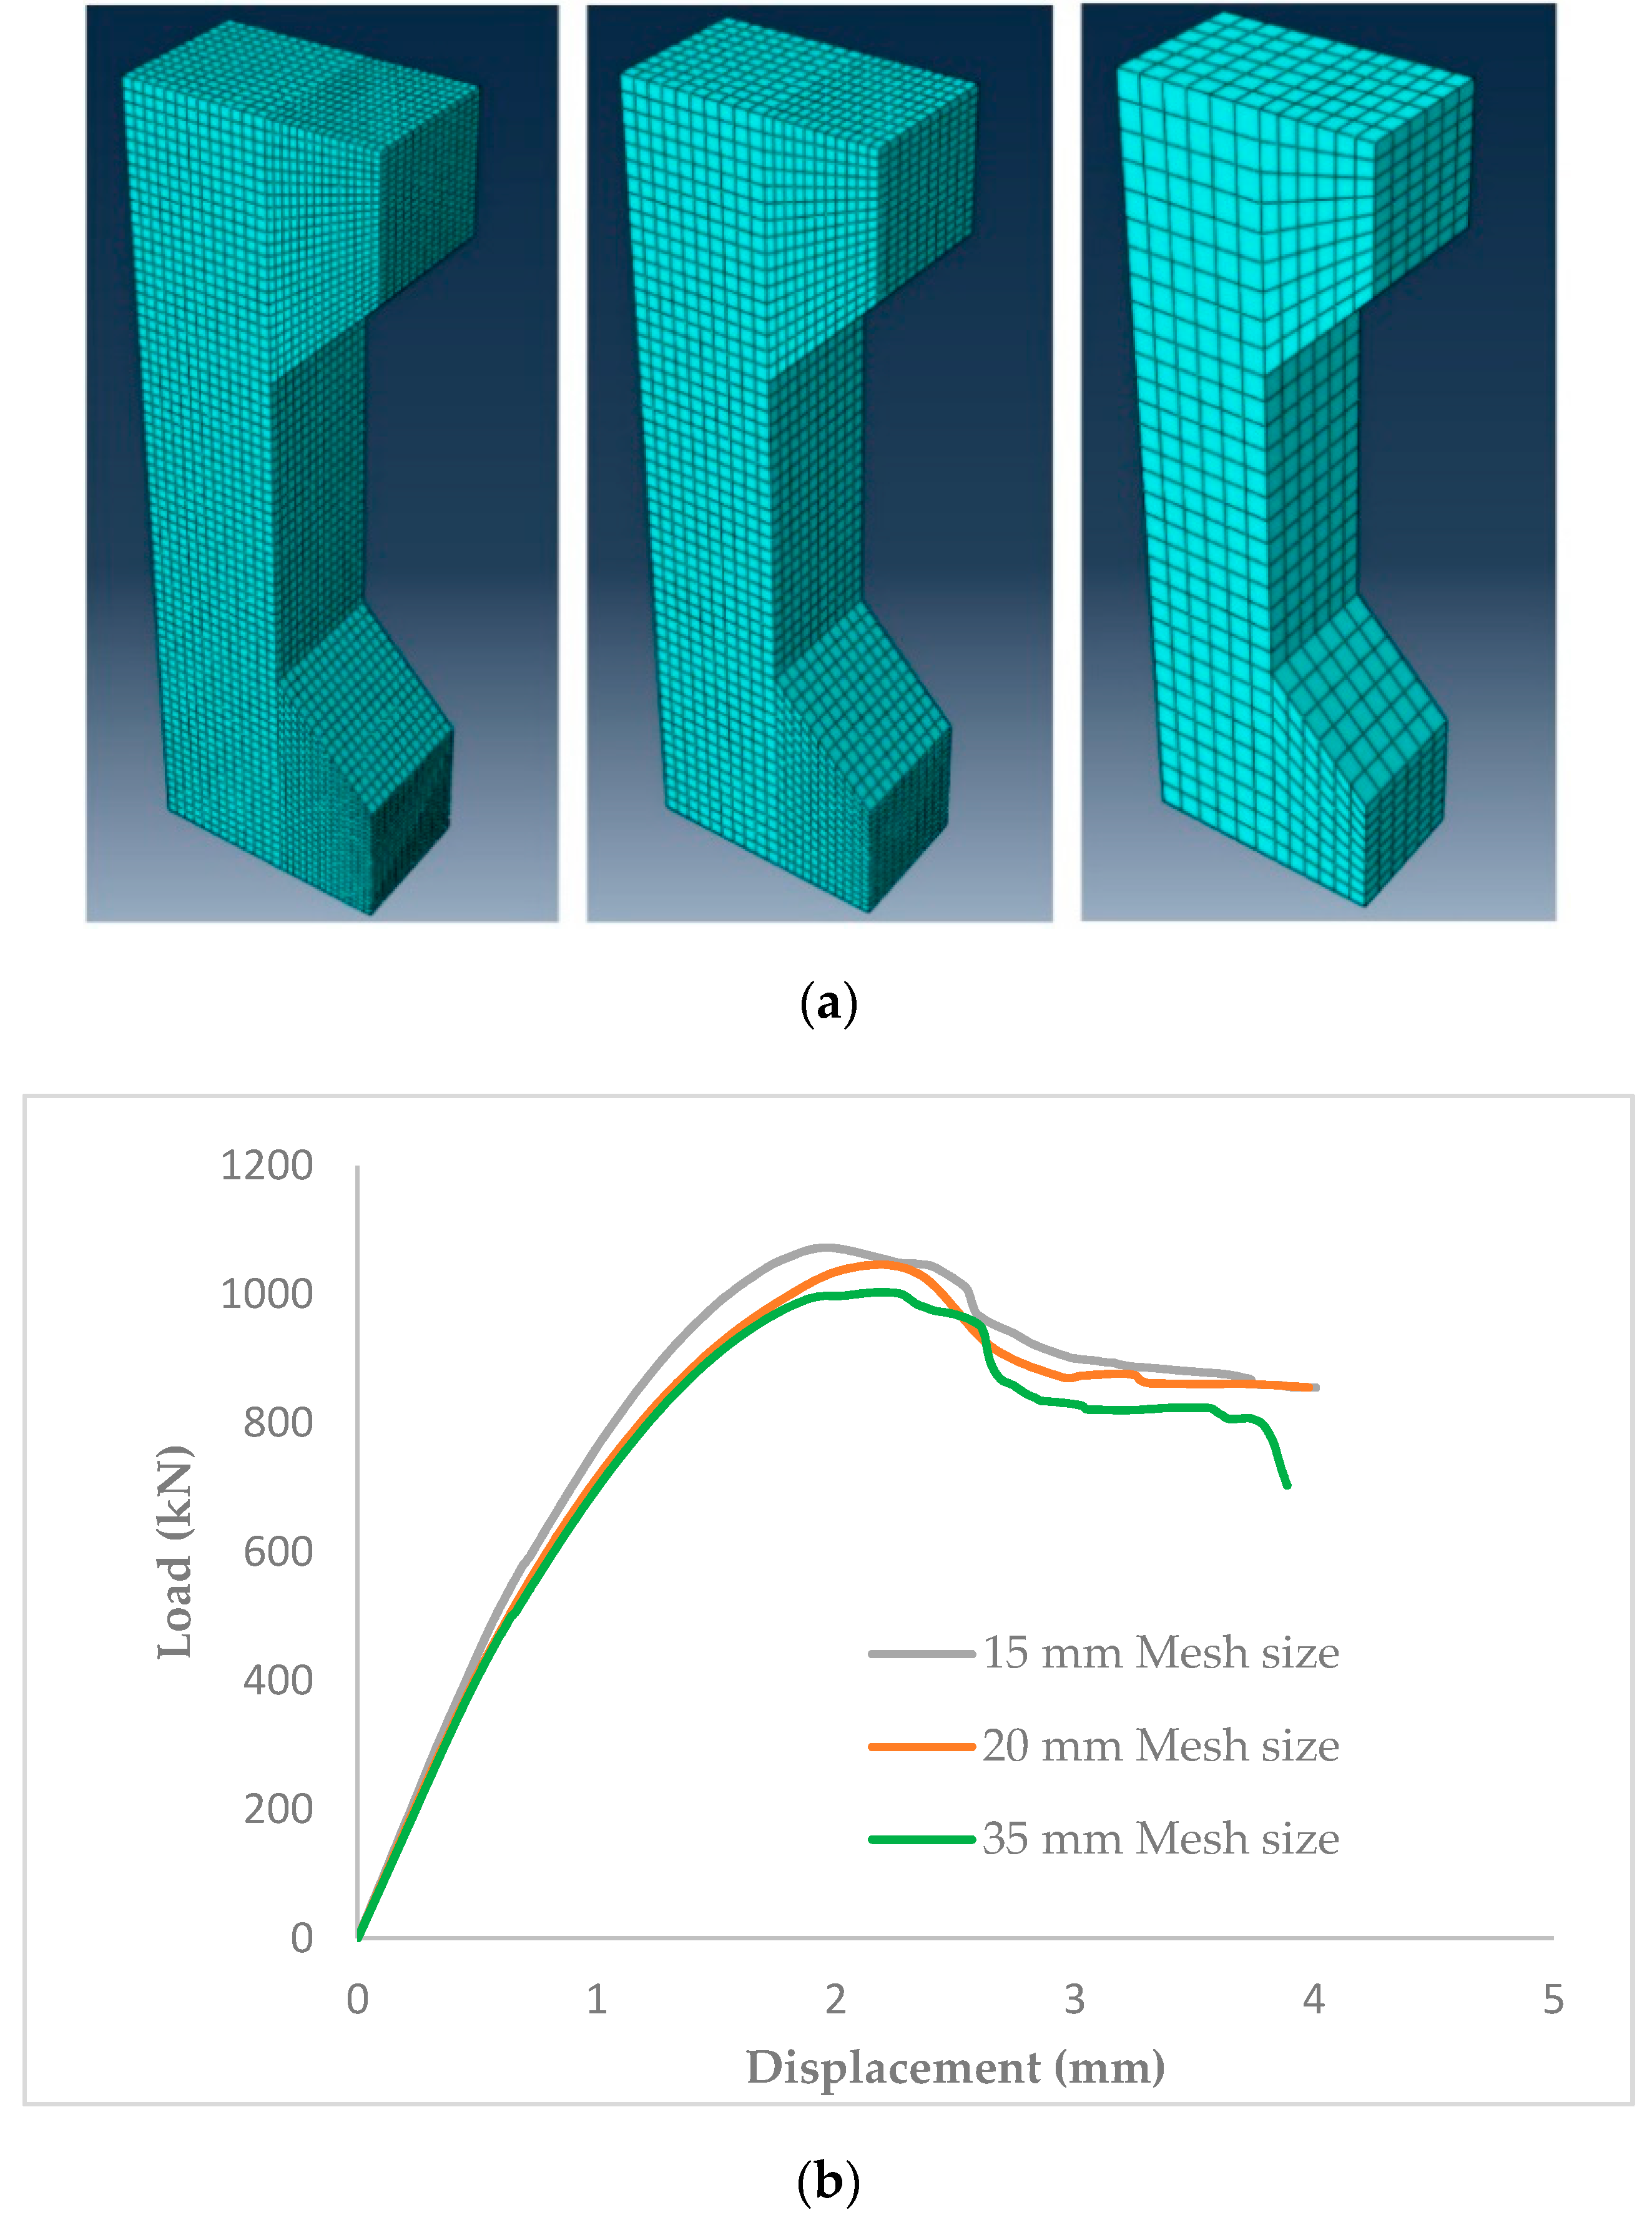
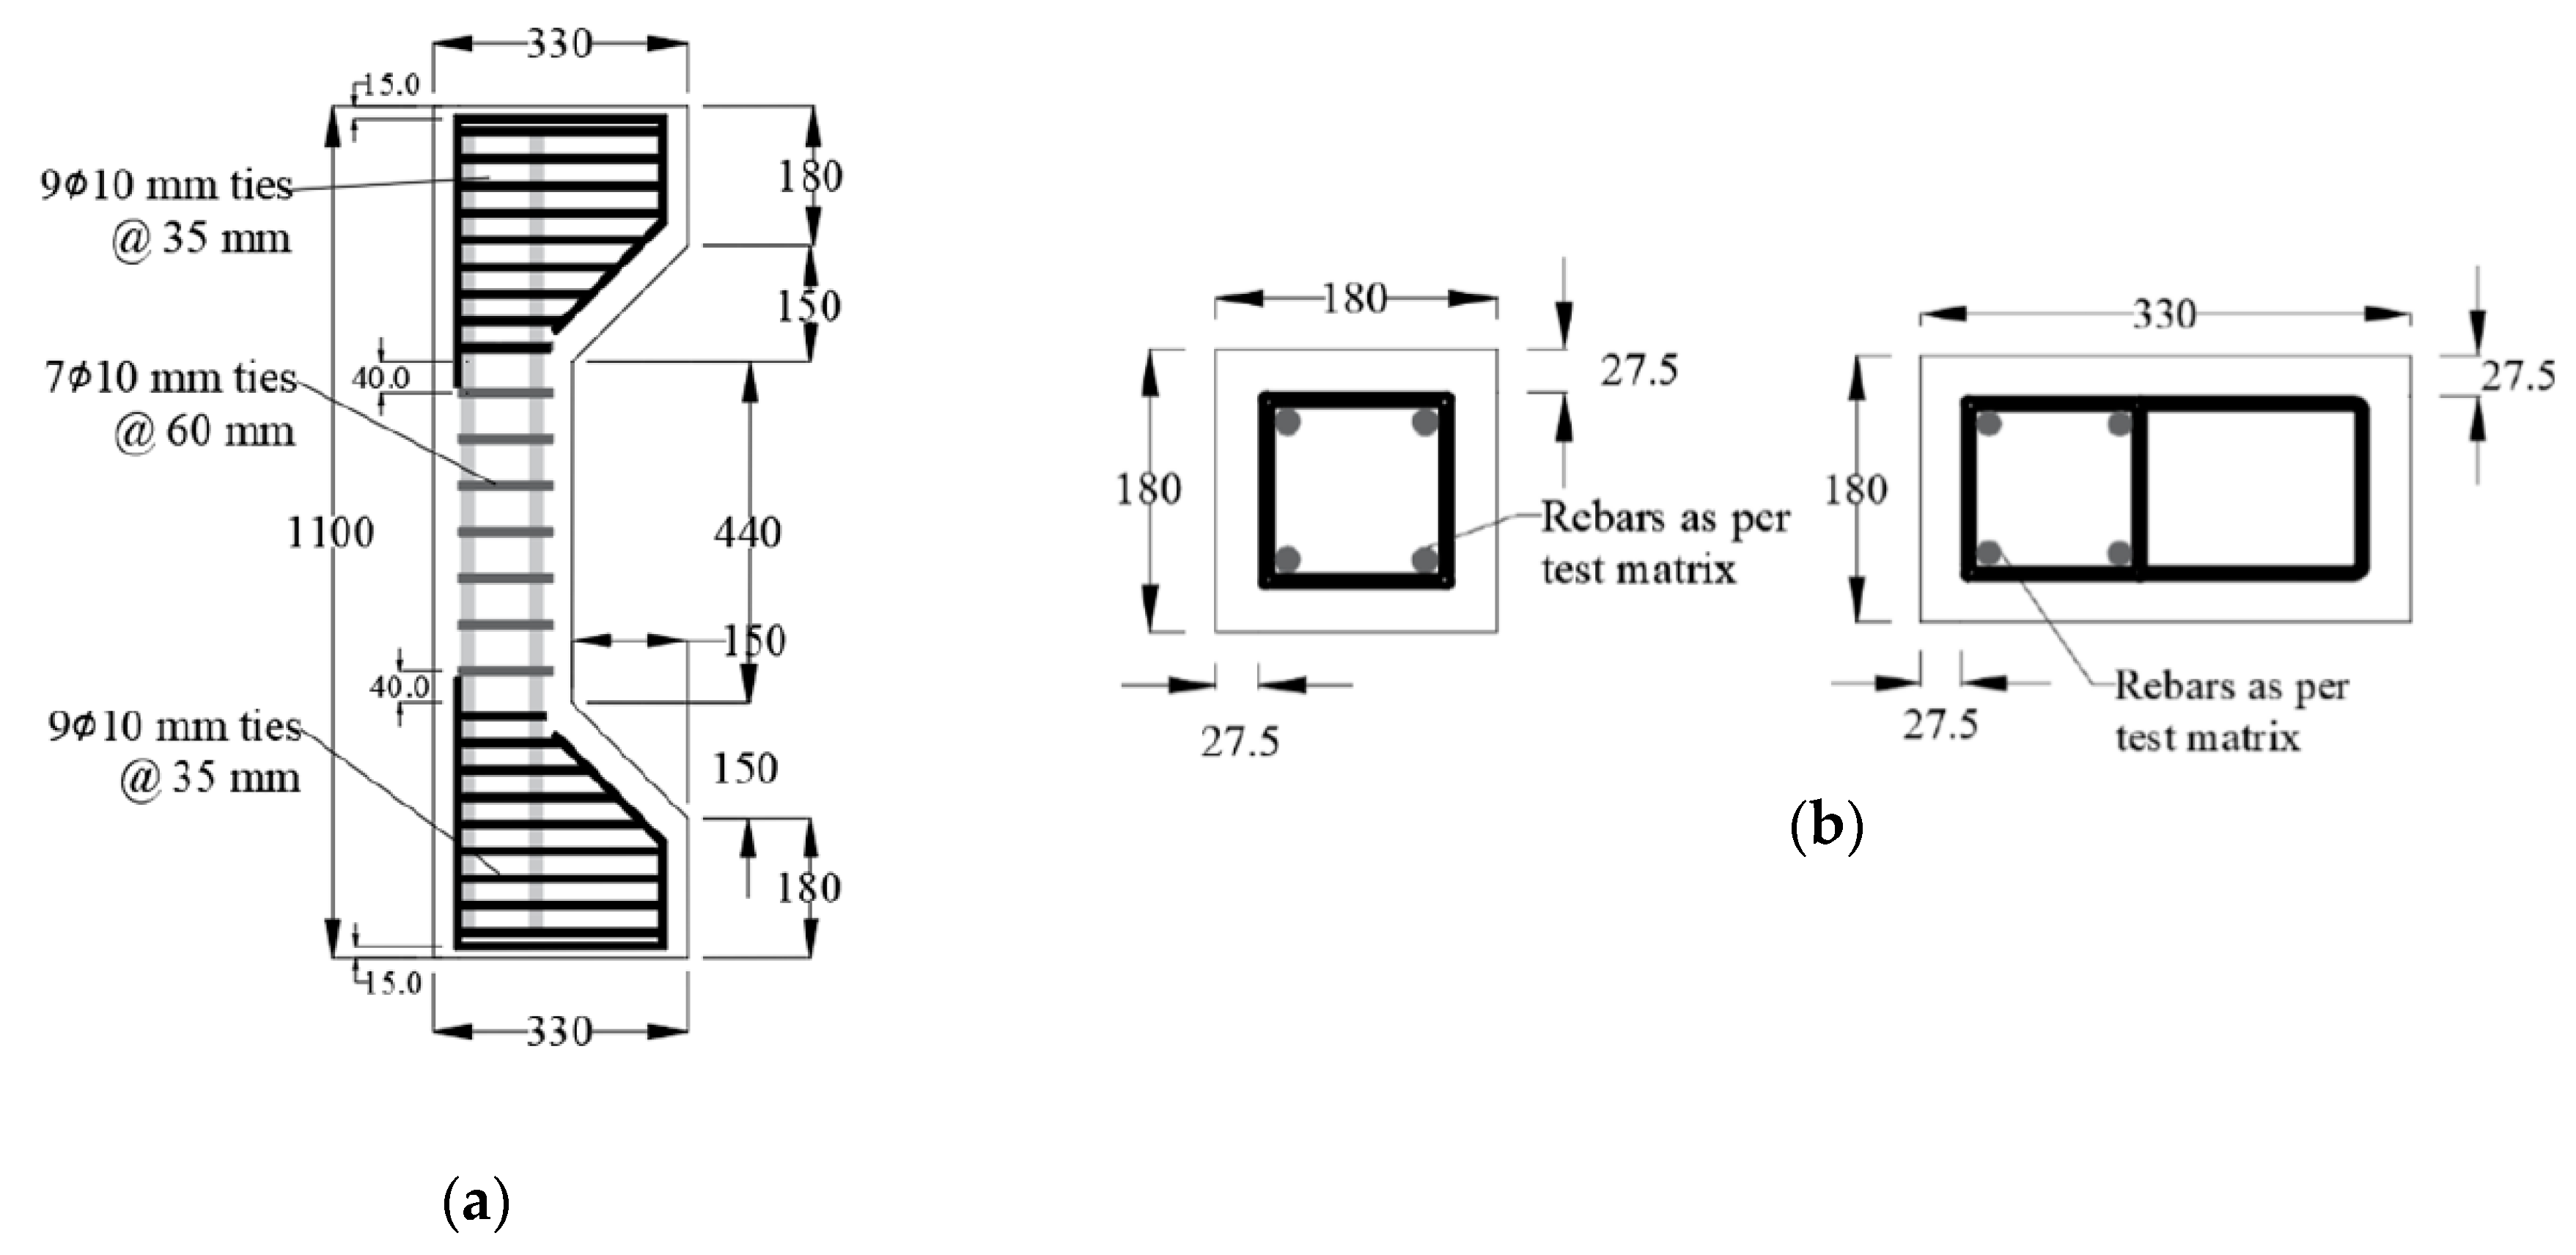
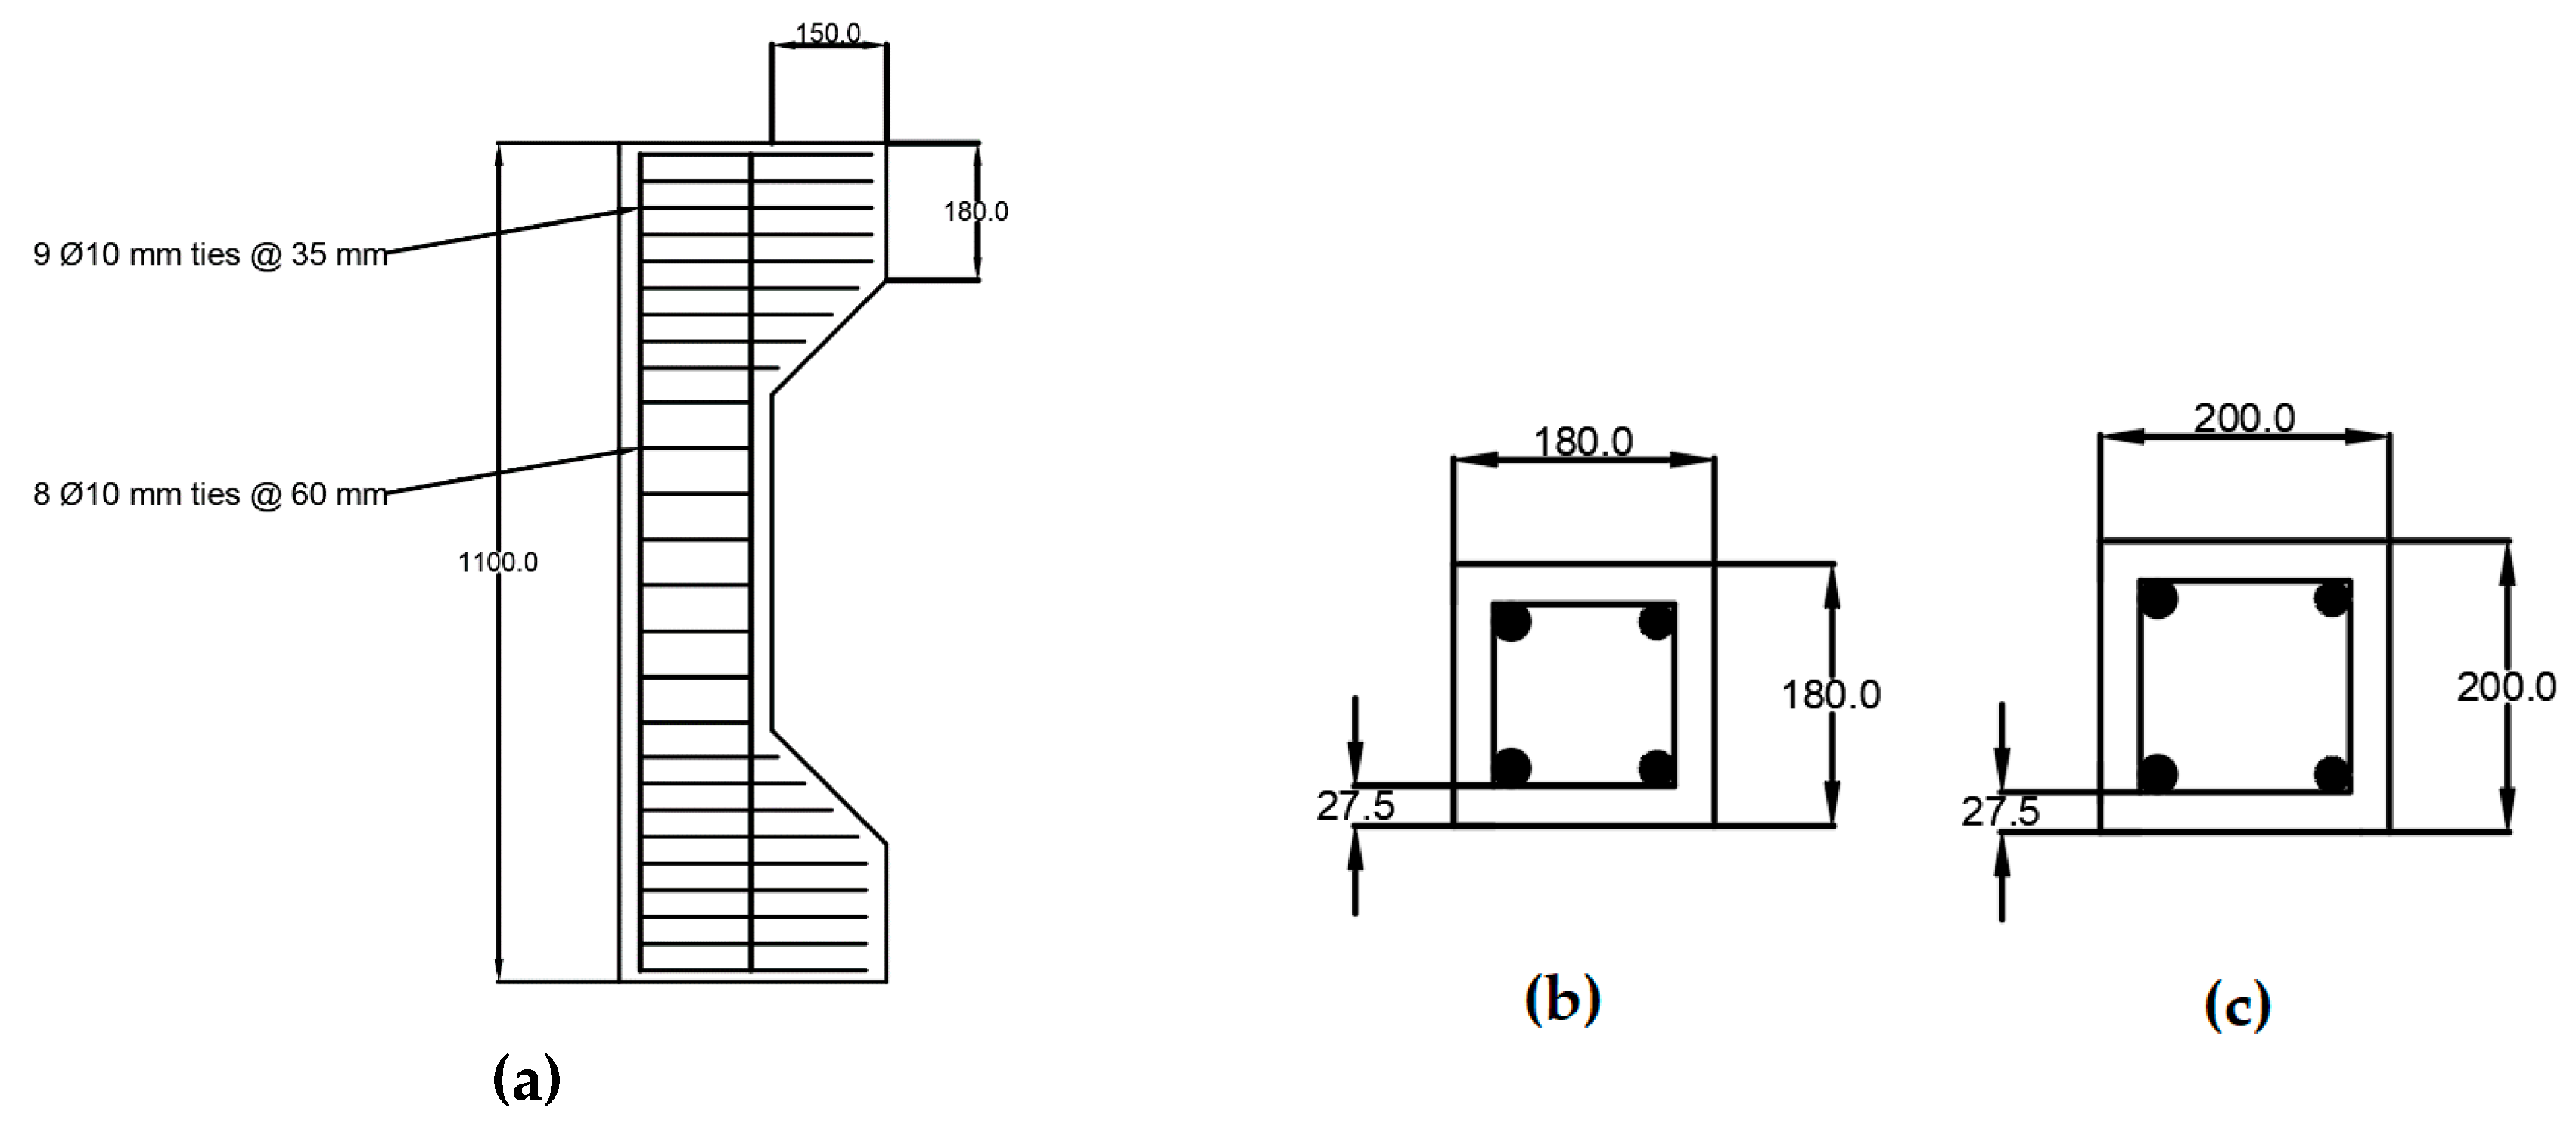
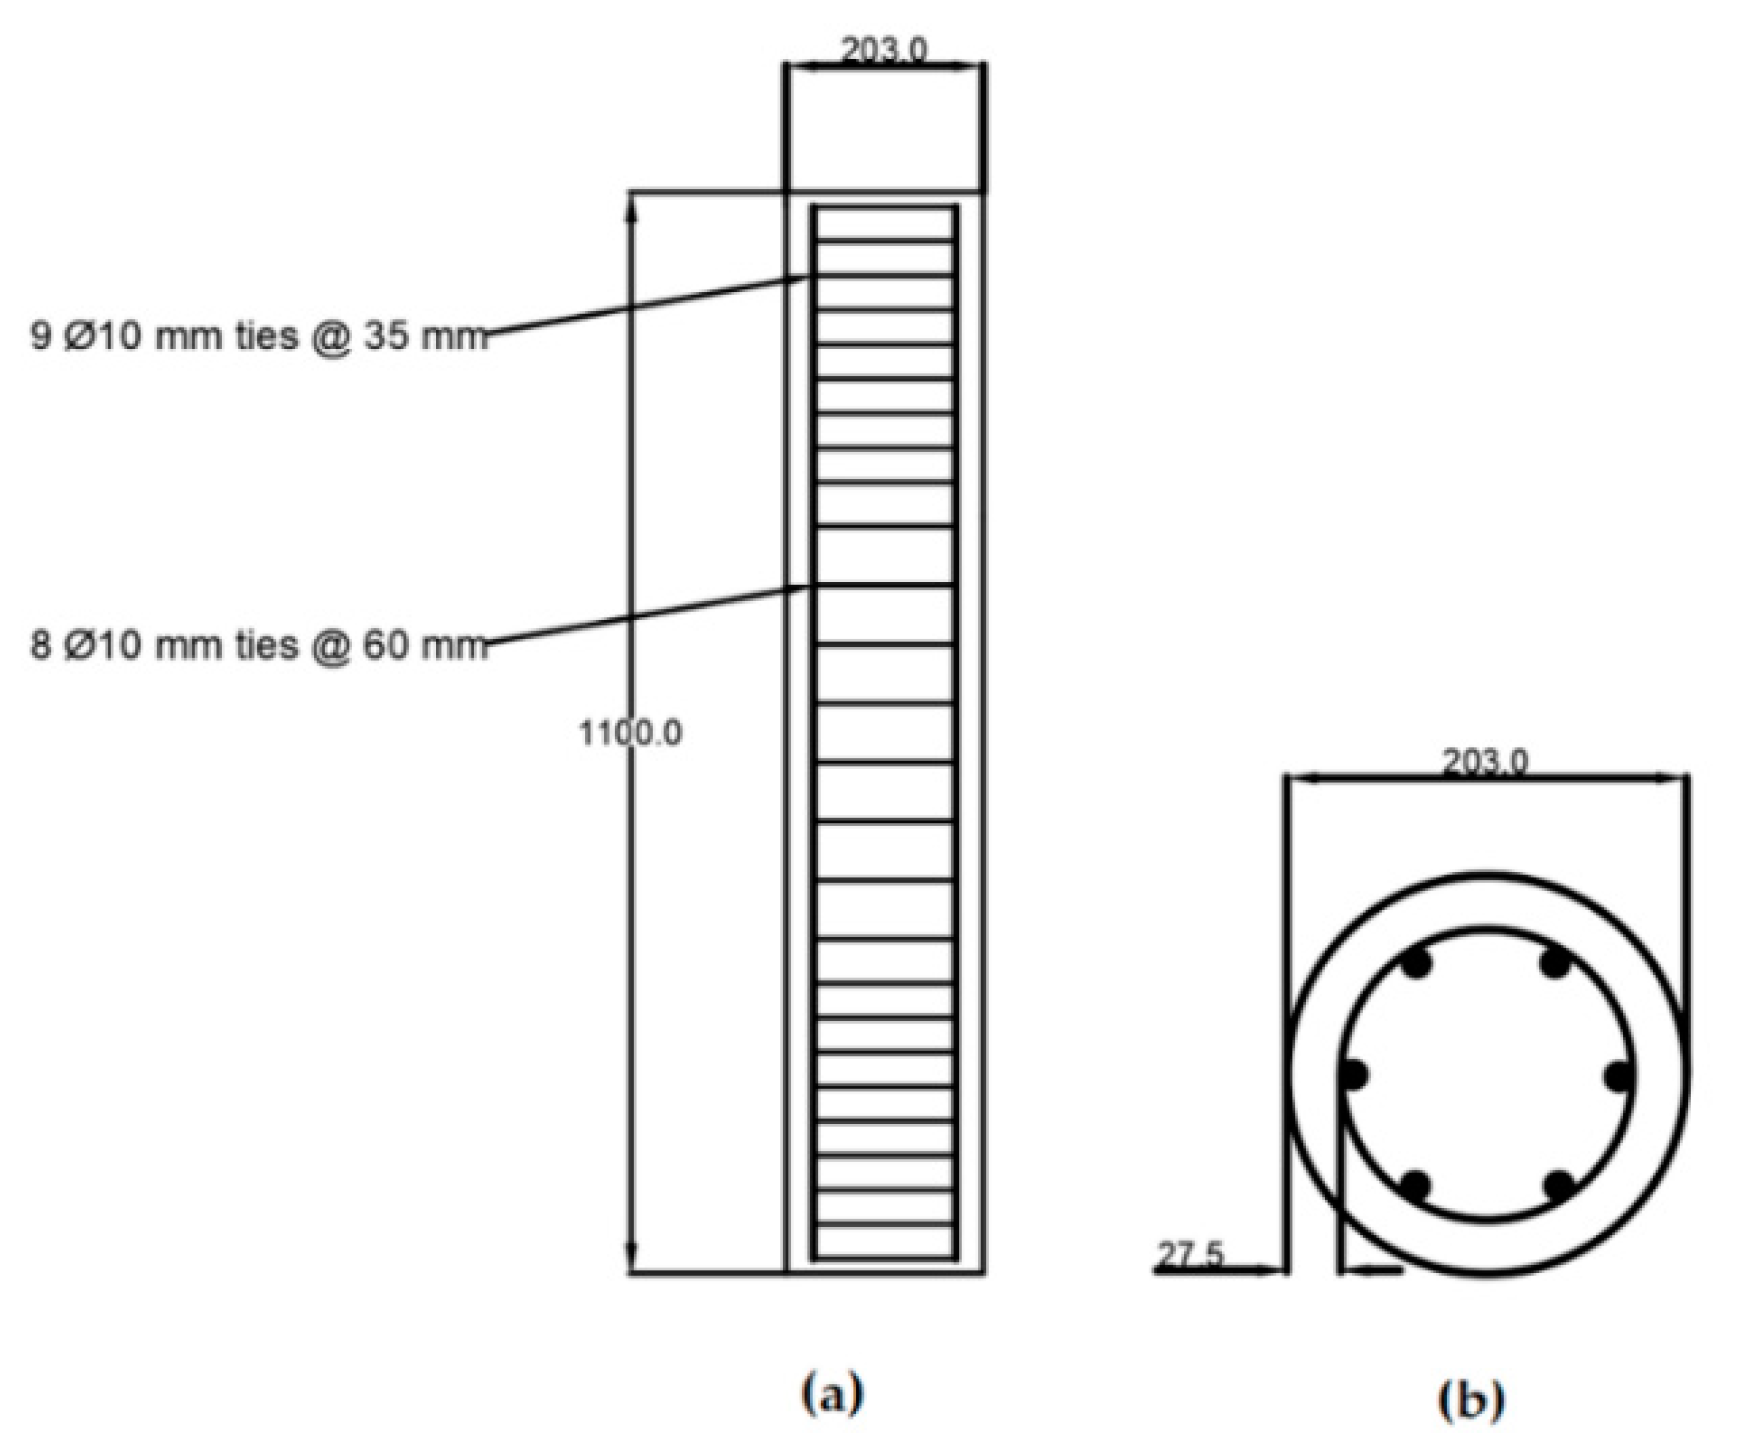
3.1.2. FE Model Geometry
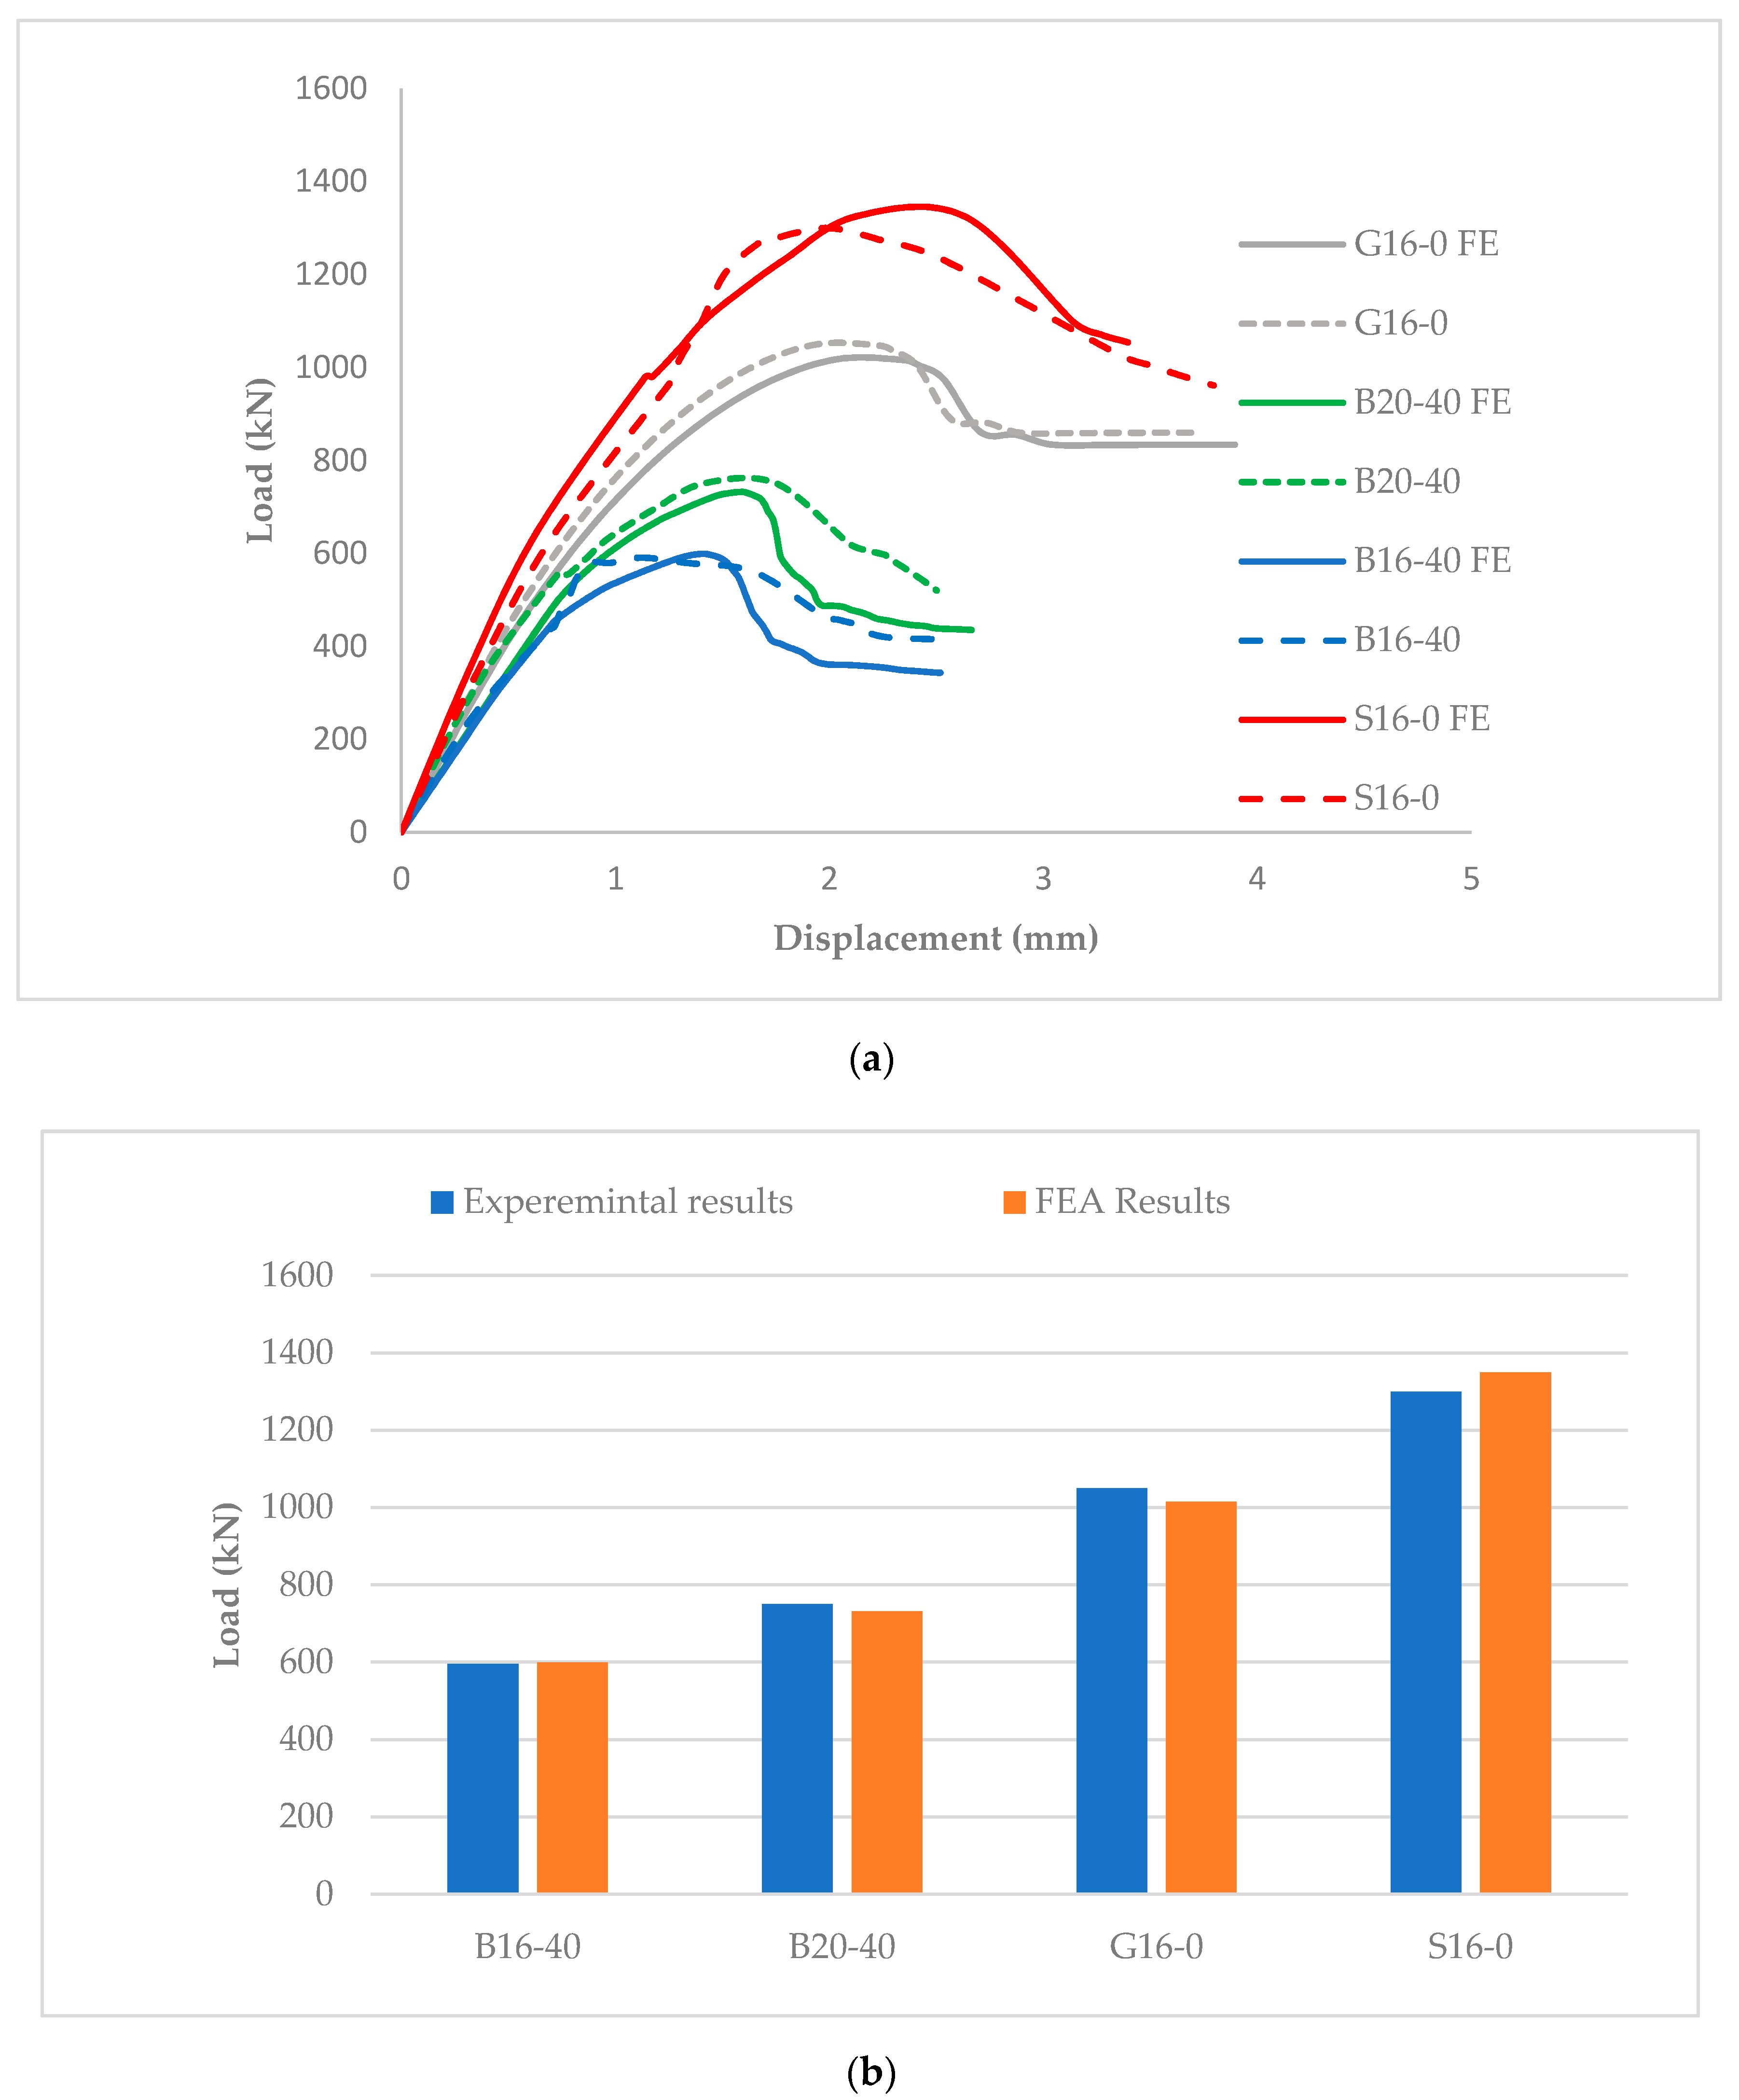
3.1.3. FE Model Verification
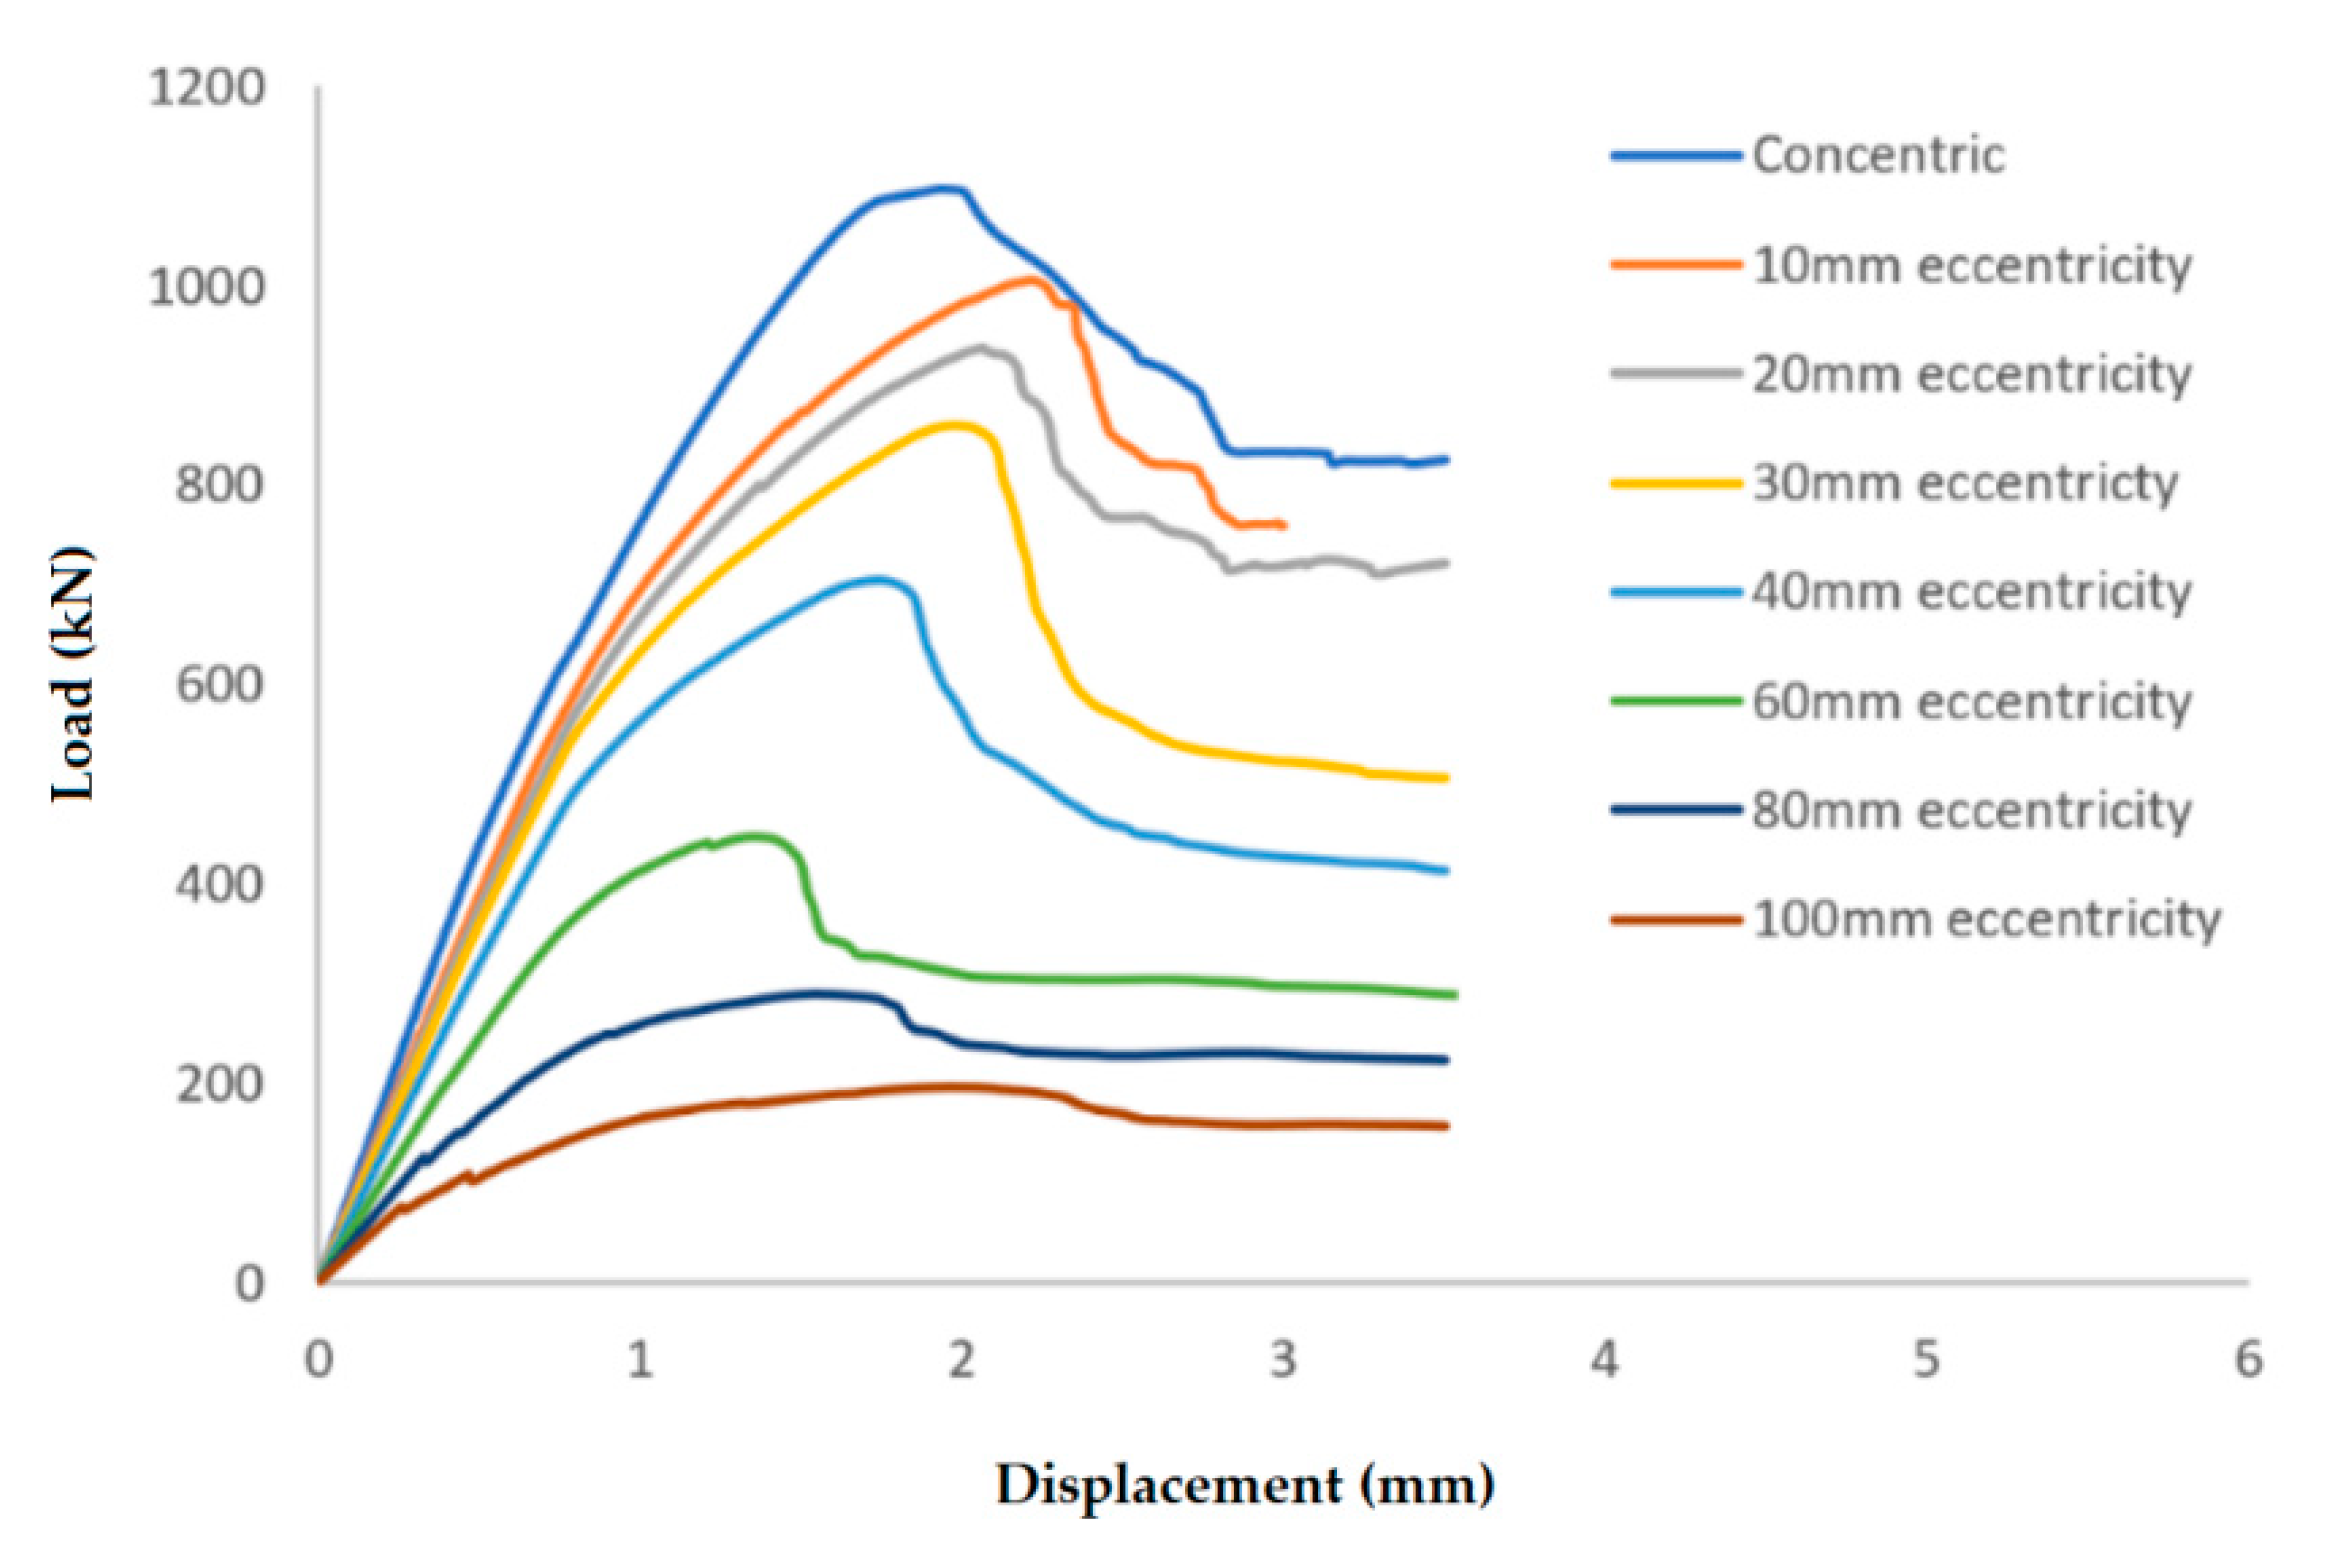
4. Parametric Analysis: Performance of the GFRP- and BFRP-RC Columns
5. Conclusions
- The compressive strengths of both the GFRP and BFRP bars were much lower than their tensile strength values. Small size bars reported lower compressive strengths than large sizes.
- There were insignificant differences between columns reinforced with BFRP bars and columns reinforced with GFRP bars in terms of overall maximum load, displacement, and bar strength contributions.
- The contribution of GFRP and BFRP bars to the ultimate capacities of FRP-RC columns increases with the reinforcement ratio and was found to be around 5% for the lowest reinforcement ratio and up to 24% for higher reinforcement ratios.
- Increasing the longitudinal reinforcement ratio for the BFRP and GFRP columns did not significantly affect the ultimate capacities of the columns for concentric columns, but the increase was noticeable for eccentric-loaded columns.
- The ductility of columns reinforced with the BFRP or GFRP bars decreased when the reinforcement ratio increased. The ductility was higher when the circular cross sections were used.
- Using steel ties for confinement of RC columns resulted in higher capacities, higher concrete core confinements, and higher ductility than using BFRP and GFRP ties.
Author Contributions
Funding
Acknowledgments
Conflicts of Interest
References
- Uddin, N. (Ed.) Developments in Fiber-Reinforced Polymer (FRP) Composites for Civil Engineering; Woodhead publishing Limited: Cambridge, UK, 2013. [Google Scholar]
- Soutis, C. Carbon fiber reinforced plastics in aircraft construction. Mater. Sci. Eng. A 2005, 412, 171–176. [Google Scholar] [CrossRef]
- ACI Committee 440: Guide for the Design and Construction of Externally Bonded FRP Systems for Strengthening Concrete Structures (ACI 440.2R-02); American Concrete Institute: Farmington Hills, MI, USA, 2008; p. 76.
- El Refai, A.; Abed, F.; Altalmas, A. Bond Durability of Basalt Fiber–Reinforced Polymer Bars Embedded in Concrete under Direct Pullout Conditions. J. Compos. Constr. 2015, 19, 04014078. [Google Scholar] [CrossRef]
- Al Rifai, M.; El-Hassan, H.; El-Maaddawy, T.; Abed, F. Durability of basalt FRP reinforcing bars in alkaline solution and moist concrete environments. Constr. Build. Mater. 2020, 243, 118258. [Google Scholar] [CrossRef]
- Al-Tamimi, A.; Abed, F.H.; Al-Rahmani, A. Effects of harsh environmental exposures on the bond capacity between concrete and GFRP reinforcing bars. Adv. Concr. Constr. 2014, 2, 1–11. [Google Scholar] [CrossRef]
- Altalmas, A.; El Refai, A.; Abed, F. Bond degradation of basalt fiber-reinforced polymer (BFRP) bars exposed to accelerated aging conditions. Constr. Build. Mater. 2015, 81, 162–171. [Google Scholar] [CrossRef]
- Tello, N.A.H.; Abdelrahman, M.; El Tonsy, S.; Weheda, F.; Abed, F.H. Effect of Harsh Environmental Exposure on the Flexural Performance of BFRP-RC Beams. In Proceedings of the 2020 Advances in Science and Engineering Technology International Conferences (ASET), Dubai, UAE, 4 February–9 April 2020; pp. 1–5. [Google Scholar]
- Barris, C.; Torres, L.; Turon, A.; Baena, M.; Catalan, A. An experimental study of the flexural behaviour of GFRP RC beams and comparison with prediction models. Compos. Struct. 2009, 91, 286–295. [Google Scholar] [CrossRef]
- Abed, F.; Alhafiz, A.R. Effect of basalt fibers on the flexural behavior of concrete beams reinforced with BFRP bars. Compos. Struct. 2019, 215, 23–34. [Google Scholar] [CrossRef]
- Abed, F.; Alhafiz, A.R. Finite element simulation of the flexural behavior of BFRP-FRC beams. In Proceedings of the 2018 Advances in Science and Engineering Technology International Conferences (ASET), Abu Dhabi, UAE, 6 February–5 April 2018; pp. 1–5. [Google Scholar]
- El Refai, A.; Abed, F. Concrete Contribution to Shear Strength of Beams Reinforced with Basalt Fiber-Reinforced Bars. J. Compos. Constr. 2016, 20, 04015082. [Google Scholar] [CrossRef]
- Alhamad, S.; Al Banna, Y.; Al Osman, A.; Mouthassseeb, J.; Abdalla, S.; Abed, F. Effect of shear span-to-depth ratio on the shear behavior of BFRP-RC deep beams. MATEC Web Conf. 2017, 120, 1–8. [Google Scholar] [CrossRef]
- Zhang, T.; Oehlers, D.J.; Visintin, P. Shear strength of FRP RC beams and one-way slabs without stirrups. J. Compos. Constr. 2014, 18. [Google Scholar] [CrossRef]
- Abed, F.; El-Chabib, H.; AlHamaydeh, M. Shear characteristics of GFRP-reinforced concrete deep beams without web reinforcement. J. Reinf. Plast. Compos. 2012, 31, 1063–1073. [Google Scholar] [CrossRef]
- Abed, F.; El Refai, A.; Abdalla, S. Experimental and finite element investigation of the shear performance of BFRP-RC short beams. Structures 2019, 20, 689–701. [Google Scholar] [CrossRef]
- Abed, F.H.; Al-Rahmani, A.; Al-Rahmani, A.H. Finite element simulations of the shear capacity of GFRP-reinforced concrete short beams. In Proceedings of the 2013 5th International Conference on Modeling, Simulation and Applied Optimization (ICMSAO), Hammamet, Tunisia, 28–30 April 2013; pp. 1–5. [Google Scholar]
- Hajiloo, H.; Green, M.F.; Noël, M.; Bénichou, N.; Sultan, M. GFRP-Reinforced Concrete Slabs: Fire Resistance and Design Efficiency. J. Compos. Constr. 2019, 23, 1–13. [Google Scholar] [CrossRef]
- El Refai, A.; Abed, F.; Al-Rahmani, A. Structural performance and serviceability of concrete beams reinforced with hybrid (GFRP and steel) bars. Constr. Build. Mater. 2015, 96, 518–529. [Google Scholar] [CrossRef]
- Al-Rahmani, A.; Abed, F.H. Numerical investigation of hybrid FRP reinforced beams. In Proceedings of the 2013 5th International Conference on Modeling, Simulation and Applied Optimization (ICMSAO), Hammamet, Tunisia, 28–30 April 2013; pp. 1–6. [Google Scholar]
- Elmessalami, N.; El Refai, A.; Abed, F. Fiber-reinforced polymers bars for compression reinforcement: A promising alternative to steel bars. Constr. Build. Mater. 2019, 209, 725–737. [Google Scholar] [CrossRef]
- Plevkov, V.; Baldin, I.; Kudyakov, K.; Nevskii, A. Mechanical properties of composite rebar under static and short-term dynamic loading. AIP Conf. Proc. 2017, 1800, 040018. [Google Scholar]
- Khorramian, K.; Sadeghian, P. Experimental and analytical behavior of short concrete columns reinforced with GFRP bars under eccentric loading. Eng. Struct. 2017, 151, 761–773. [Google Scholar] [CrossRef]
- Khorramian, K.; Sadeghian, P. New Testing Method of Gfrp Bars in Compression; Canadian Society for Civil Engineering: Fredericton, NB, Canada, 2018. [Google Scholar]
- Deitz, D.H.; Harik, I.E.; Gesund, H. Physical Properties of Glass Fiber Reinforced Polymer Rebars in Compression. J. Compos. Constr. 2003, 7, 363–366. [Google Scholar] [CrossRef]
- Khan, Q.S.; Sheikh, M.; Hadi, M.N.S. Tension and compression testing of fibre reinforced polymer (FRP) bars. In Proceedings of the Joint Conference of the 12th International Symposium on Fiber Reinforced Polymers for Reinforced, Nanjing, China, 14–16 December 2015; pp. 1–6. [Google Scholar]
- Abed, F.; Mehaini, Z.; Oucif, C.; Abdul–Latif, A.; Baleh, R. Quasi-static and dynamic response of GFRP and BFRP bars under compression. Compos. Part C Open Access 2020, 2, 100034. [Google Scholar] [CrossRef]
- ASTM D695-10 Standard Test Method for Compressive Properties of Rigid Plastics; ASTM: West Conshohocken, PA, USA, 2010.
- Elchalakani, M.; Karrech, A.; Dong, M.; Mohamed Ali, M.S.; Yang, B. Experiments and Finite Element Analysis of GFRP Reinforced Geopolymer Concrete Rectangular Columns Subjected to Concentric and Eccentric Axial Loading. Structures 2018, 14, 273–289. [Google Scholar] [CrossRef]
- Pantelides, C.P.; Gibbons, M.E.; Reaveley, L.D. Axial load behavior of concrete columns confined with GFRP spirals. J. Compos. Constr. 2013, 17, 305–313. [Google Scholar] [CrossRef]
- Abed, F.; Oucif, C.; Awera, Y.; Mhanna, H.H.; Alkhraisha, H. FE modeling of concrete beams and columns reinforced with FRP composites. Def. Technol. 2020. [Google Scholar] [CrossRef]
- ElMesalami, N.Z.A. Experimental Investigation of Frp-Reinforced Concrete Columns under Concentric and Eccentric Loading; American University Of Sharjah: Sharjah, UAE, 2019. [Google Scholar]
- ACI Committee 318: 318-19 Building Code Requirements for Structural Concrete and Commentary; American Concrete Institute: Farmington Hills, MI, USA, 2019; ISBN 9781641950565.
- Pessiki, S.; Pieroni, A. Axial load behavior of large-scale spirally-reinforced high-strength concrete columns. ACI Struct. J. 1997, 94, 304–314. [Google Scholar] [CrossRef]


| Sample Material | Sample Diameter (mm) | Ultimate Tensile Stress (MPa) | Tensile Modulus of Elasticity (GPa) |
|---|---|---|---|
| GFRP | 8 | 983.1 ± 32 | |
| GFRP | 12 | 976 ± 46 | |
| GFRP | 16 | 874 ± 39 | 44.9 ± 1.3 |
| BFRP | 8 | 1121.3 ± 56 | |
| BFRP | 12 | 1118.6 ± 31 | |
| BFRP | 16 | 1075.1 ± 37 | 49.3 ± 1.1 |
| Bar Diameter (mm) | Cross-Section Area (mm2) | Compressive Strength (MPa) | Average Strength (MPa) | Standard Deviation (MPa) |
|---|---|---|---|---|
| 16.7 | 219 | 573 | 562.5 | 23 |
| 16.7 | 219 | 544.2 | ||
| 16.7 | 219 | 551.5 | ||
| 16.7 | 219 | 545.6 | ||
| 16.7 | 219 | 598.1 | ||
| 12.7 | 126.7 | 504.4 | 496.1 | 18 |
| 12.7 | 126.7 | 480.8 | ||
| 12.7 | 126.7 | 510.7 | ||
| 12.7 | 126.7 | 472.9 | ||
| 12.7 | 126.7 | 511.5 | ||
| 8 | 50.5 | 354.3 | 311.6 | 27.3 |
| 8 | 50.5 | 294.9 | ||
| 8 | 50.5 | 287 | ||
| 8 | 50.5 | 322.7 | ||
| 8 | 50.5 | 298.9 |
| Bar Diameter (mm) | Cross-Section Area (mm2) | Compressive Strength (MPa) | Average Strength (MPa) | Standard Deviation (MPa) |
|---|---|---|---|---|
| 16.7 | 219 | 420 | 448.2 | 24.3 |
| 16.7 | 219 | 471.9 | ||
| 16.7 | 219 | 440.8 | ||
| 16.7 | 219 | 454.2 | ||
| 16.7 | 219 | 441.8 | ||
| 12.5 | 122.7 | 418 | 416.6 | 19.5 |
| 12.5 | 122.7 | 430.3 | ||
| 12.5 | 122.7 | 390.3 | ||
| 12.5 | 122.7 | 405 | ||
| 12.5 | 122.7 | 439.2 | ||
| 8.4 | 55.4 | 420.4 | 394.5 | 24.1 |
| 8.4 | 55.4 | 416.8 | ||
| 8.4 | 55.4 | 362.7 | ||
| 8.4 | 55.4 | 386.2 | ||
| 8.4 | 55.4 | 386.2 |
| Column ID | Longitudinal Bars Type | Diameter (mm) | Reinforcement Ratio (%) | Load Eccentricity (mm) | Ties Type | Ties Spacing (mm) | Pmax (kN) |
|---|---|---|---|---|---|---|---|
| B16-40 | BFRP | 16 | 2.48 | 40 | Steel | 180 | 595 |
| B20-40 | BFRP | 20 | 3.88 | 40 | Steel | 180 | 750 |
| G16-0 | GFRP | 16 | 2.48 | 0 | Steel | 180 | 1050 |
| S16-0 | Steel | 16 | 2.48 | 0 | Steel | 180 | 1300 |
| Group | Column ID | Cross-Section | Longitudinal Reinforcement | Dimensions (mm) | Ties | f’c (MPa) | Eccentricity (mm) |
|---|---|---|---|---|---|---|---|
| Group-1 | S-G180-S **-40 | Square | GFRP | 180 | Steel | 40 | 0, 10, 20, 30, 40, 60, 80, 100 and Pure Moment |
| Group-2 | S-G180-G **-40 | Square | GFRP | 180 | GFRP | 40 | |
| Group-3 | S-G200-S **-40 | Square | GFRP | 200 | Steel | 40 | |
| Group-4 | S-B180-S **-40 | Square | BFRP | 180 | Steel | 40 | |
| Group-5 | S-B200-S **-40 | Square | BFRP | 200 | Steel | 40 | |
| Group-6 | S-B200-B **-40 | Square | BFRP | 200 | BFRP | 40 | |
| Group-7 | S-G180-S **-30 | Square | GFRP | 180 | GFRP | 30 | |
| Group-8 | C-B200-S **-40 | Circular | BFRP | 203 | Steel | 40 | |
| Group-9 | C-B200-G **-40 | Circular | BFRP | 203 | GFRP | 40 | |
| Group-10 | C-B200-S **-30 | Circular | BFRP | 203 | Steel | 30 |
| Column ID | Reinforcement Ratio | Pmax | f’cc | DI | Pconcrete | Pconcrete/Pmax |
|---|---|---|---|---|---|---|
| S-G180-S00-40 | 1% | 1096 | 52.5 | 1.56 | 1042 | 0.95 |
| 2% | 1100 | 51.5 | 1.66 | 1004 | 0.91 | |
| 4% | 1114 | 50.7 | 1.41 | 965 | 0.87 | |
| 6% | 1126 | 52.5 | 1.43 | 963 | 0.85 | |
| 8% | 1170 | 54 | 1.56 | 964 | 0.82 | |
| S-G180-G00-40 | 1% | 841 | 40.8 | 1.32 | 810 | 0.96 |
| 2% | 865 | 41.8 | 1.5 | 816 | 0.94 | |
| 4% | 868 | 41.4 | 1.33 | 789 | 0.91 | |
| 6% | 895 | 42.1 | 1.35 | 772 | 0.86 | |
| 8% | 899 | 42.2 | 1.41 | 754 | 0.84 | |
| S-G200-S00-40 | 1% | 1114 | 41.6 | 2.02 | 1080 | 0.97 |
| 2% | 1218 | 46 | 1.55 | 1157 | 0.95 | |
| 4% | 1224 | 44.6 | 1.96 | 1109 | 0.91 | |
| 6% | 1250 | 44.4 | 2.01 | 1064 | 0.85 | |
| 8% | 1260 | 43.9 | 2.2 | 1018 | 0.81 | |
| S-B180-S00-40 | 1% | 1095 | 53.2 | 1.56 | 1056 | 0.96 |
| 2% | 1113 | 53.5 | 1.43 | 1044 | 0.94 | |
| 4% | 1114 | 50.7 | 1.63 | 965 | 0.87 | |
| 6% | 1124 | 52.2 | 1.58 | 957 | 0.85 | |
| 8% | 1175 | 54.1 | 1.68 | 966 | 0.82 | |
| S-B200-B00-40 | 1% | 1228 | 45.3 | 1.33 | 1177 | 0.96 |
| 2% | 1256 | 47.5 | 1.34 | 1196 | 0.95 | |
| 4% | 1258 | 46.3 | 1.3 | 1152 | 0.92 | |
| 6% | 1265 | 45.1 | 1.39 | 1080 | 0.85 | |
| 8% | 1271 | 44.4 | 1.43 | 1030 | 0.81 | |
| S-B200-S00-40 | 1% | 811 | 40.2 | 2.13 | 785 | 0.97 |
| 2% | 843 | 41.7 | 1.46 | 812 | 0.96 | |
| 4% | 857 | 42.2 | 1.93 | 803 | 0.94 | |
| 6% | 896 | 43.6 | 2.02 | 800 | 0.89 | |
| 8% | 940 | 44 | 2.13 | 786 | 0.84 | |
| S-G180-S00-30 | 1% | 685.8 | 32.8 | 2.08 | 652 | 0.95 |
| 2% | 721 | 33.8 | 2.02 | 660 | 0.92 | |
| 4% | 732 | 34.1 | 1.96 | 650 | 0.89 | |
| 6% | 740 | 34.7 | 2.12 | 636 | 0.86 | |
| 8% | 789 | 34.1 | 2.27 | 609 | 0.77 | |
| C-B200-S00-40 | 1% | 1281 | 102.2 | 2.07 | 1267 | 0.99 |
| 2% | 1285 | 90.9 | 2.01 | 1109 | 0.86 | |
| 3% | 1301 | 89 | 1.84 | 1063 | 0.82 | |
| 5% | 1352 | 91.8 | 2.24 | 1041 | 0.77 | |
| 7% | 1403 | 93.9 | 2.47 | 994 | 0.79 | |
| C-B200-G00-40 | 1% | 920 | 64.4 | 2.1 | 799 | 0.87 |
| 2% | 976 | 65.8 | 2.2 | 802 | 0.82 | |
| 3% | 995 | 66.4 | 2.24 | 794 | 0.8 | |
| 5% | 1041 | 66.8 | 2.38 | 758 | 0.73 | |
| 7% | 1087 | 71.5 | 2.45 | 756 | 0.7 | |
| C-B200-S00-30 | 1% | 1087 | 81 | 2.17 | 1005 | 0.92 |
| 2% | 1133 | 81.9 | 2.25 | 999 | 0.88 | |
| 3% | 1176 | 85.8 | 2.51 | 1025 | 0.87 | |
| 5% | 1249 | 89.5 | 2.45 | 1015 | 0.81 | |
| 7% | 1315 | 94.3 | 2.67 | 998 | 0.76 |
© 2020 by the authors. Licensee MDPI, Basel, Switzerland. This article is an open access article distributed under the terms and conditions of the Creative Commons Attribution (CC BY) license (http://creativecommons.org/licenses/by/4.0/).
Share and Cite
AlNajmi, L.; Abed, F. Evaluation of FRP Bars under Compression and Their Performance in RC Columns. Materials 2020, 13, 4541. https://doi.org/10.3390/ma13204541
AlNajmi L, Abed F. Evaluation of FRP Bars under Compression and Their Performance in RC Columns. Materials. 2020; 13(20):4541. https://doi.org/10.3390/ma13204541
Chicago/Turabian StyleAlNajmi, Laith, and Farid Abed. 2020. "Evaluation of FRP Bars under Compression and Their Performance in RC Columns" Materials 13, no. 20: 4541. https://doi.org/10.3390/ma13204541
APA StyleAlNajmi, L., & Abed, F. (2020). Evaluation of FRP Bars under Compression and Their Performance in RC Columns. Materials, 13(20), 4541. https://doi.org/10.3390/ma13204541