Experimental Study on Concrete under Combined FRP–Steel Confinement


Abstract
1. Introduction
2. Experimental Investigations
2.1. Experimental Program
- Diameter of the concrete cylinders
- Concrete mixture/mechanical properties of the core concrete
- Shape of the transverse steel reinforcement (i.e., tie/spiral)
- Diameter and volumetric ratio of the transverse steel reinforcement
- Mechanical properties of the transverse steel reinforcement
- Surface texture of the transverse steel reinforcement
- Volumetric ratio of the longitudinal steel reinforcement
- CFRP material
- Volumetric ratio of the CFRP jacket
2.2. Materials
2.2.1. Concrete
2.2.2. Steel Reinforcement
2.2.3. Carbon Fiber-Reinforced Polymer
2.3. Preparation of the Test Specimens
2.4. Test Setup and Instrumentation
2.5. Test Matrix
3. Experimental Findings
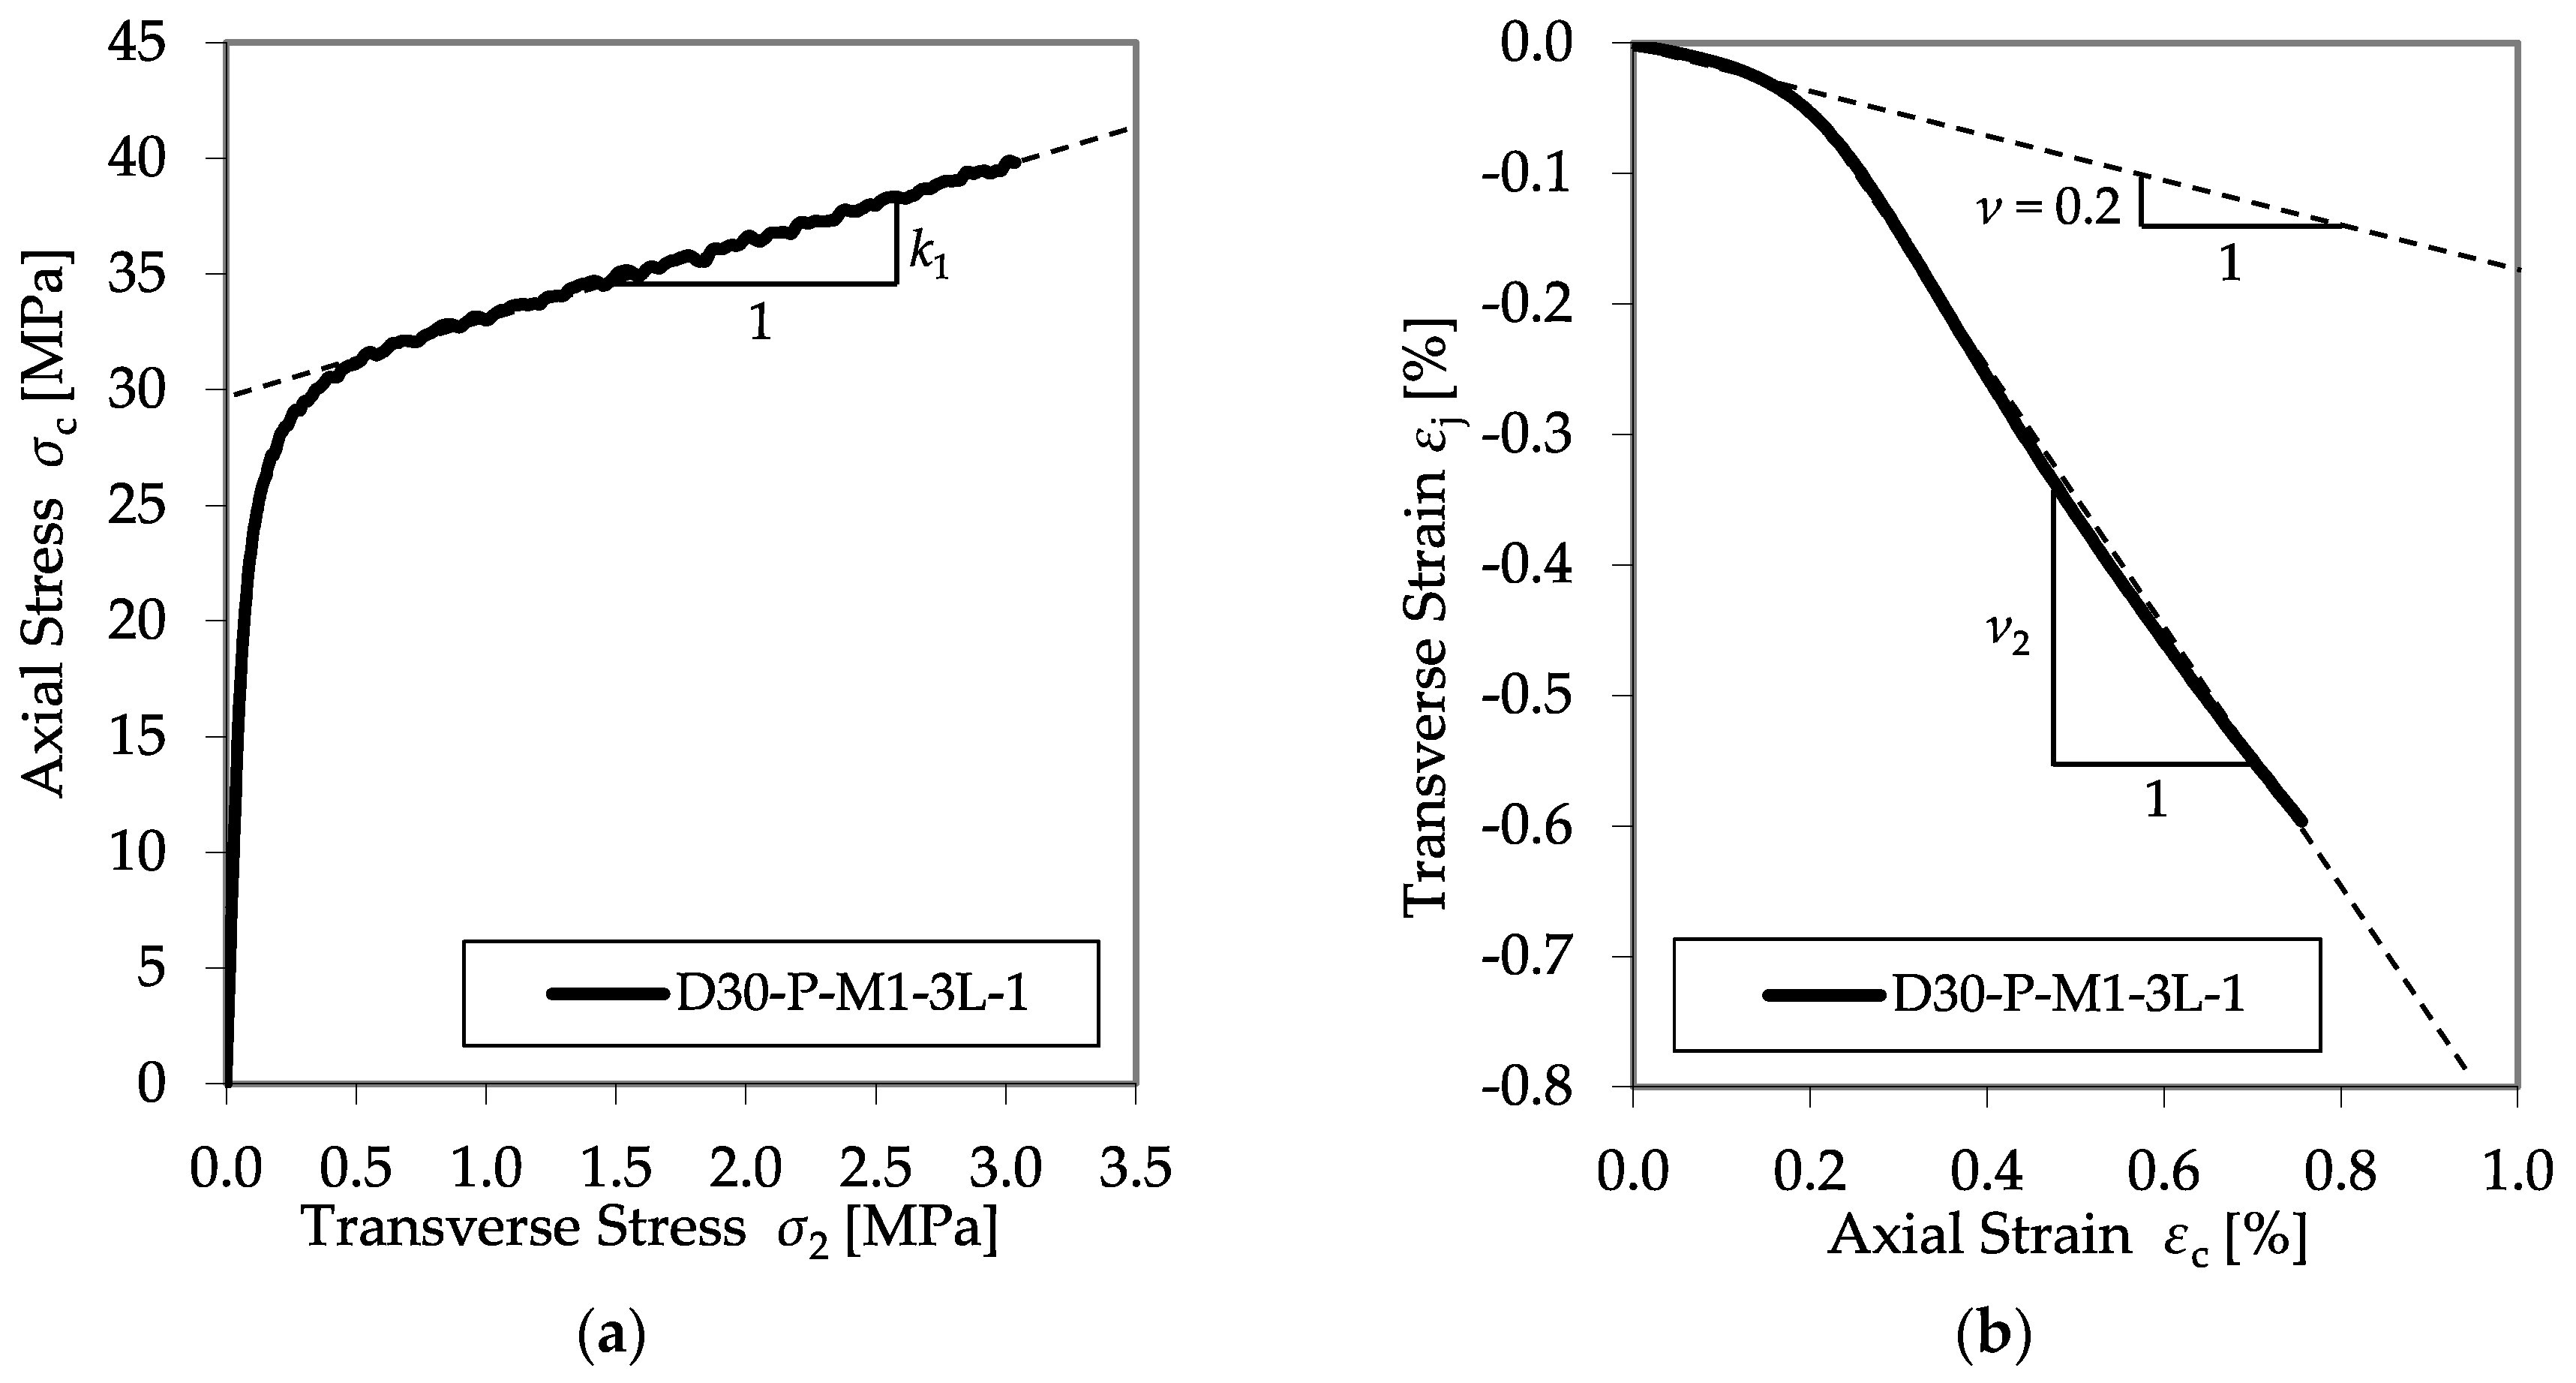
3.1. Evaluation Methods
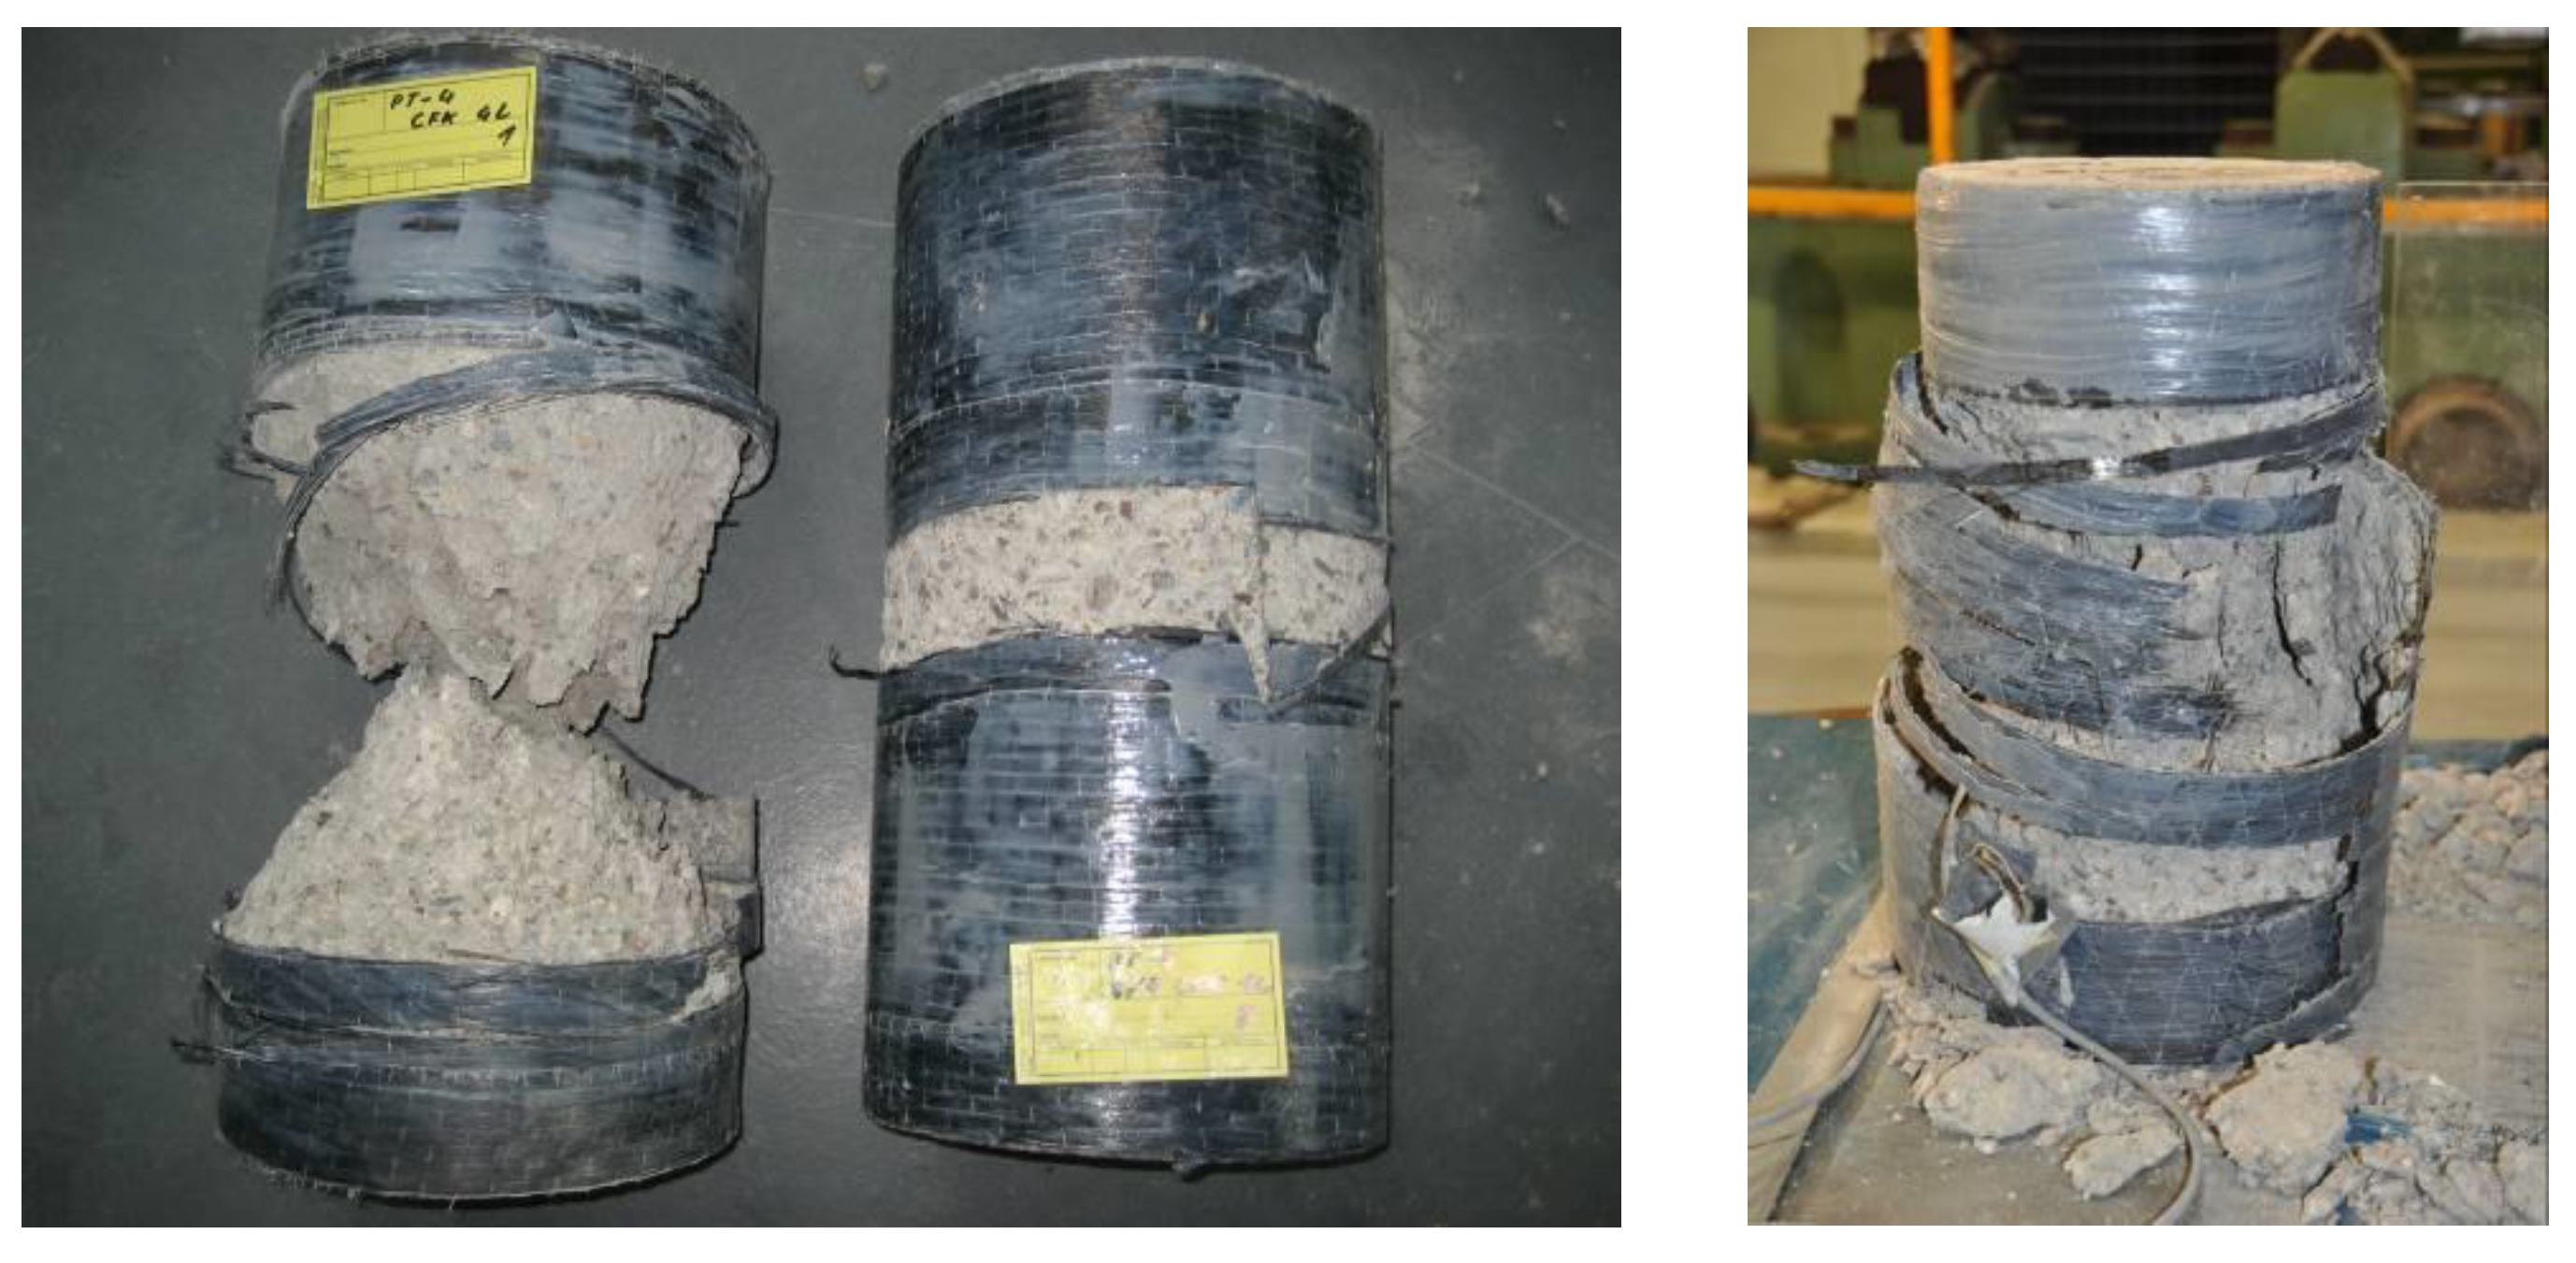
3.2. CFRP-Confined Concrete Specimens
3.3. FRP Rupture Strain and Accompanied Partial Safety Factors
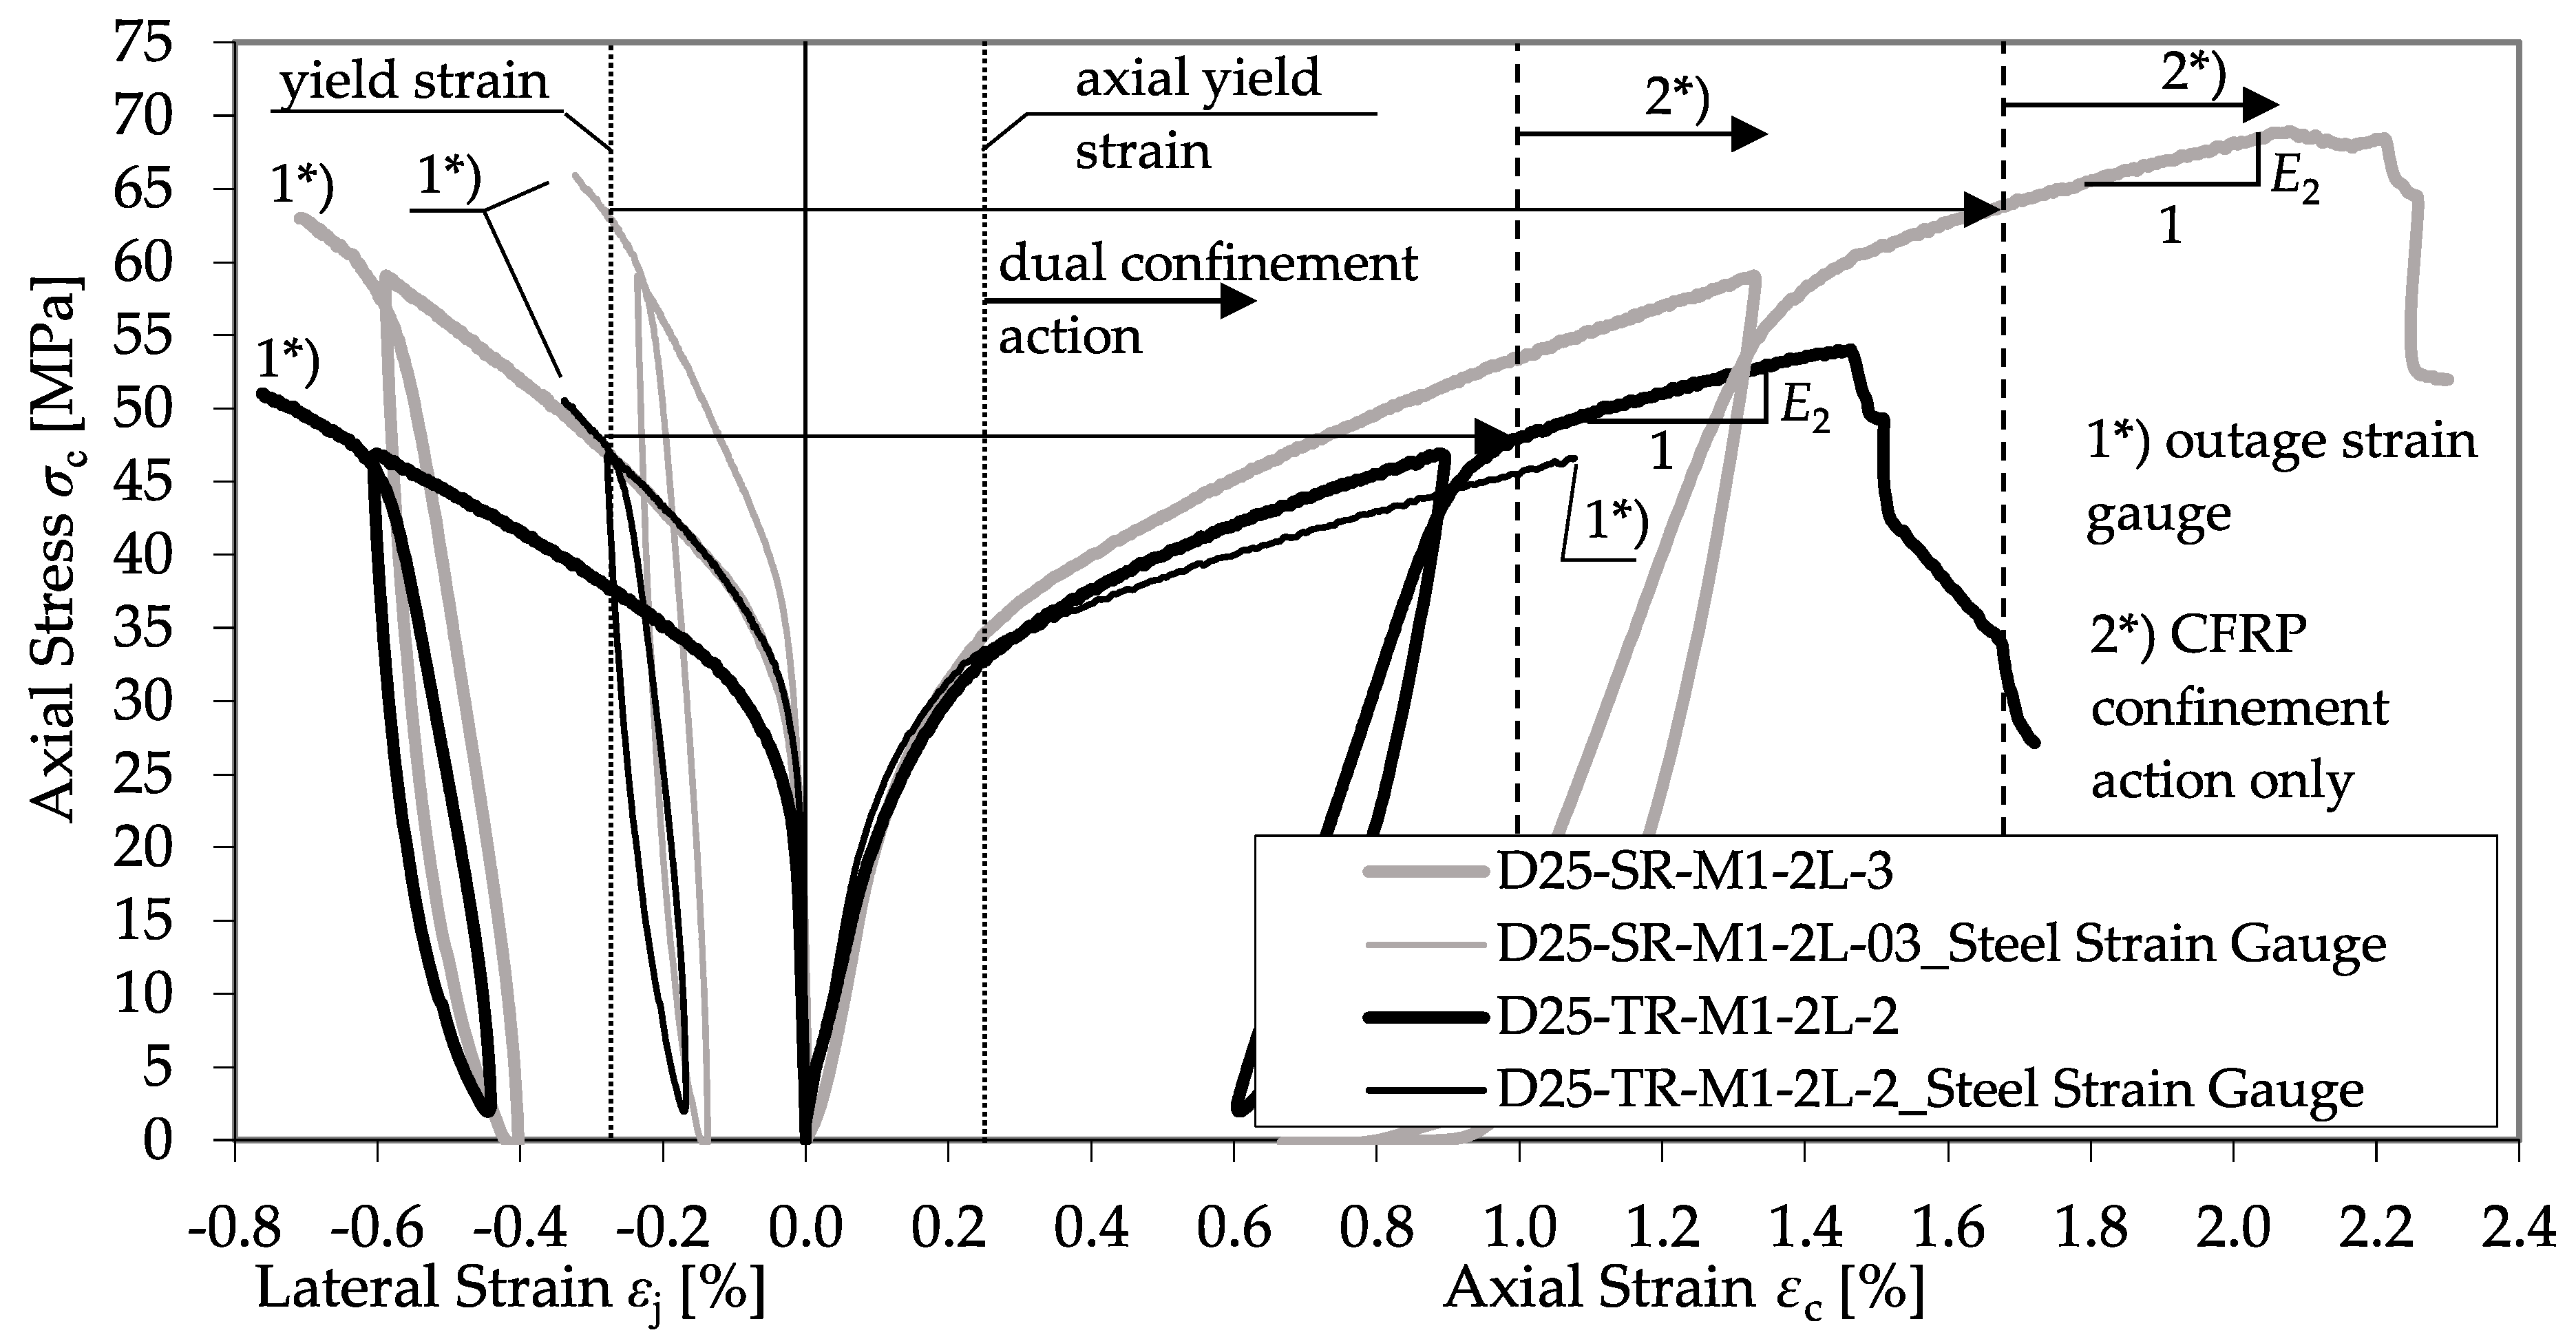
3.4. CFRP-Confined Reinforced Concrete Specimens
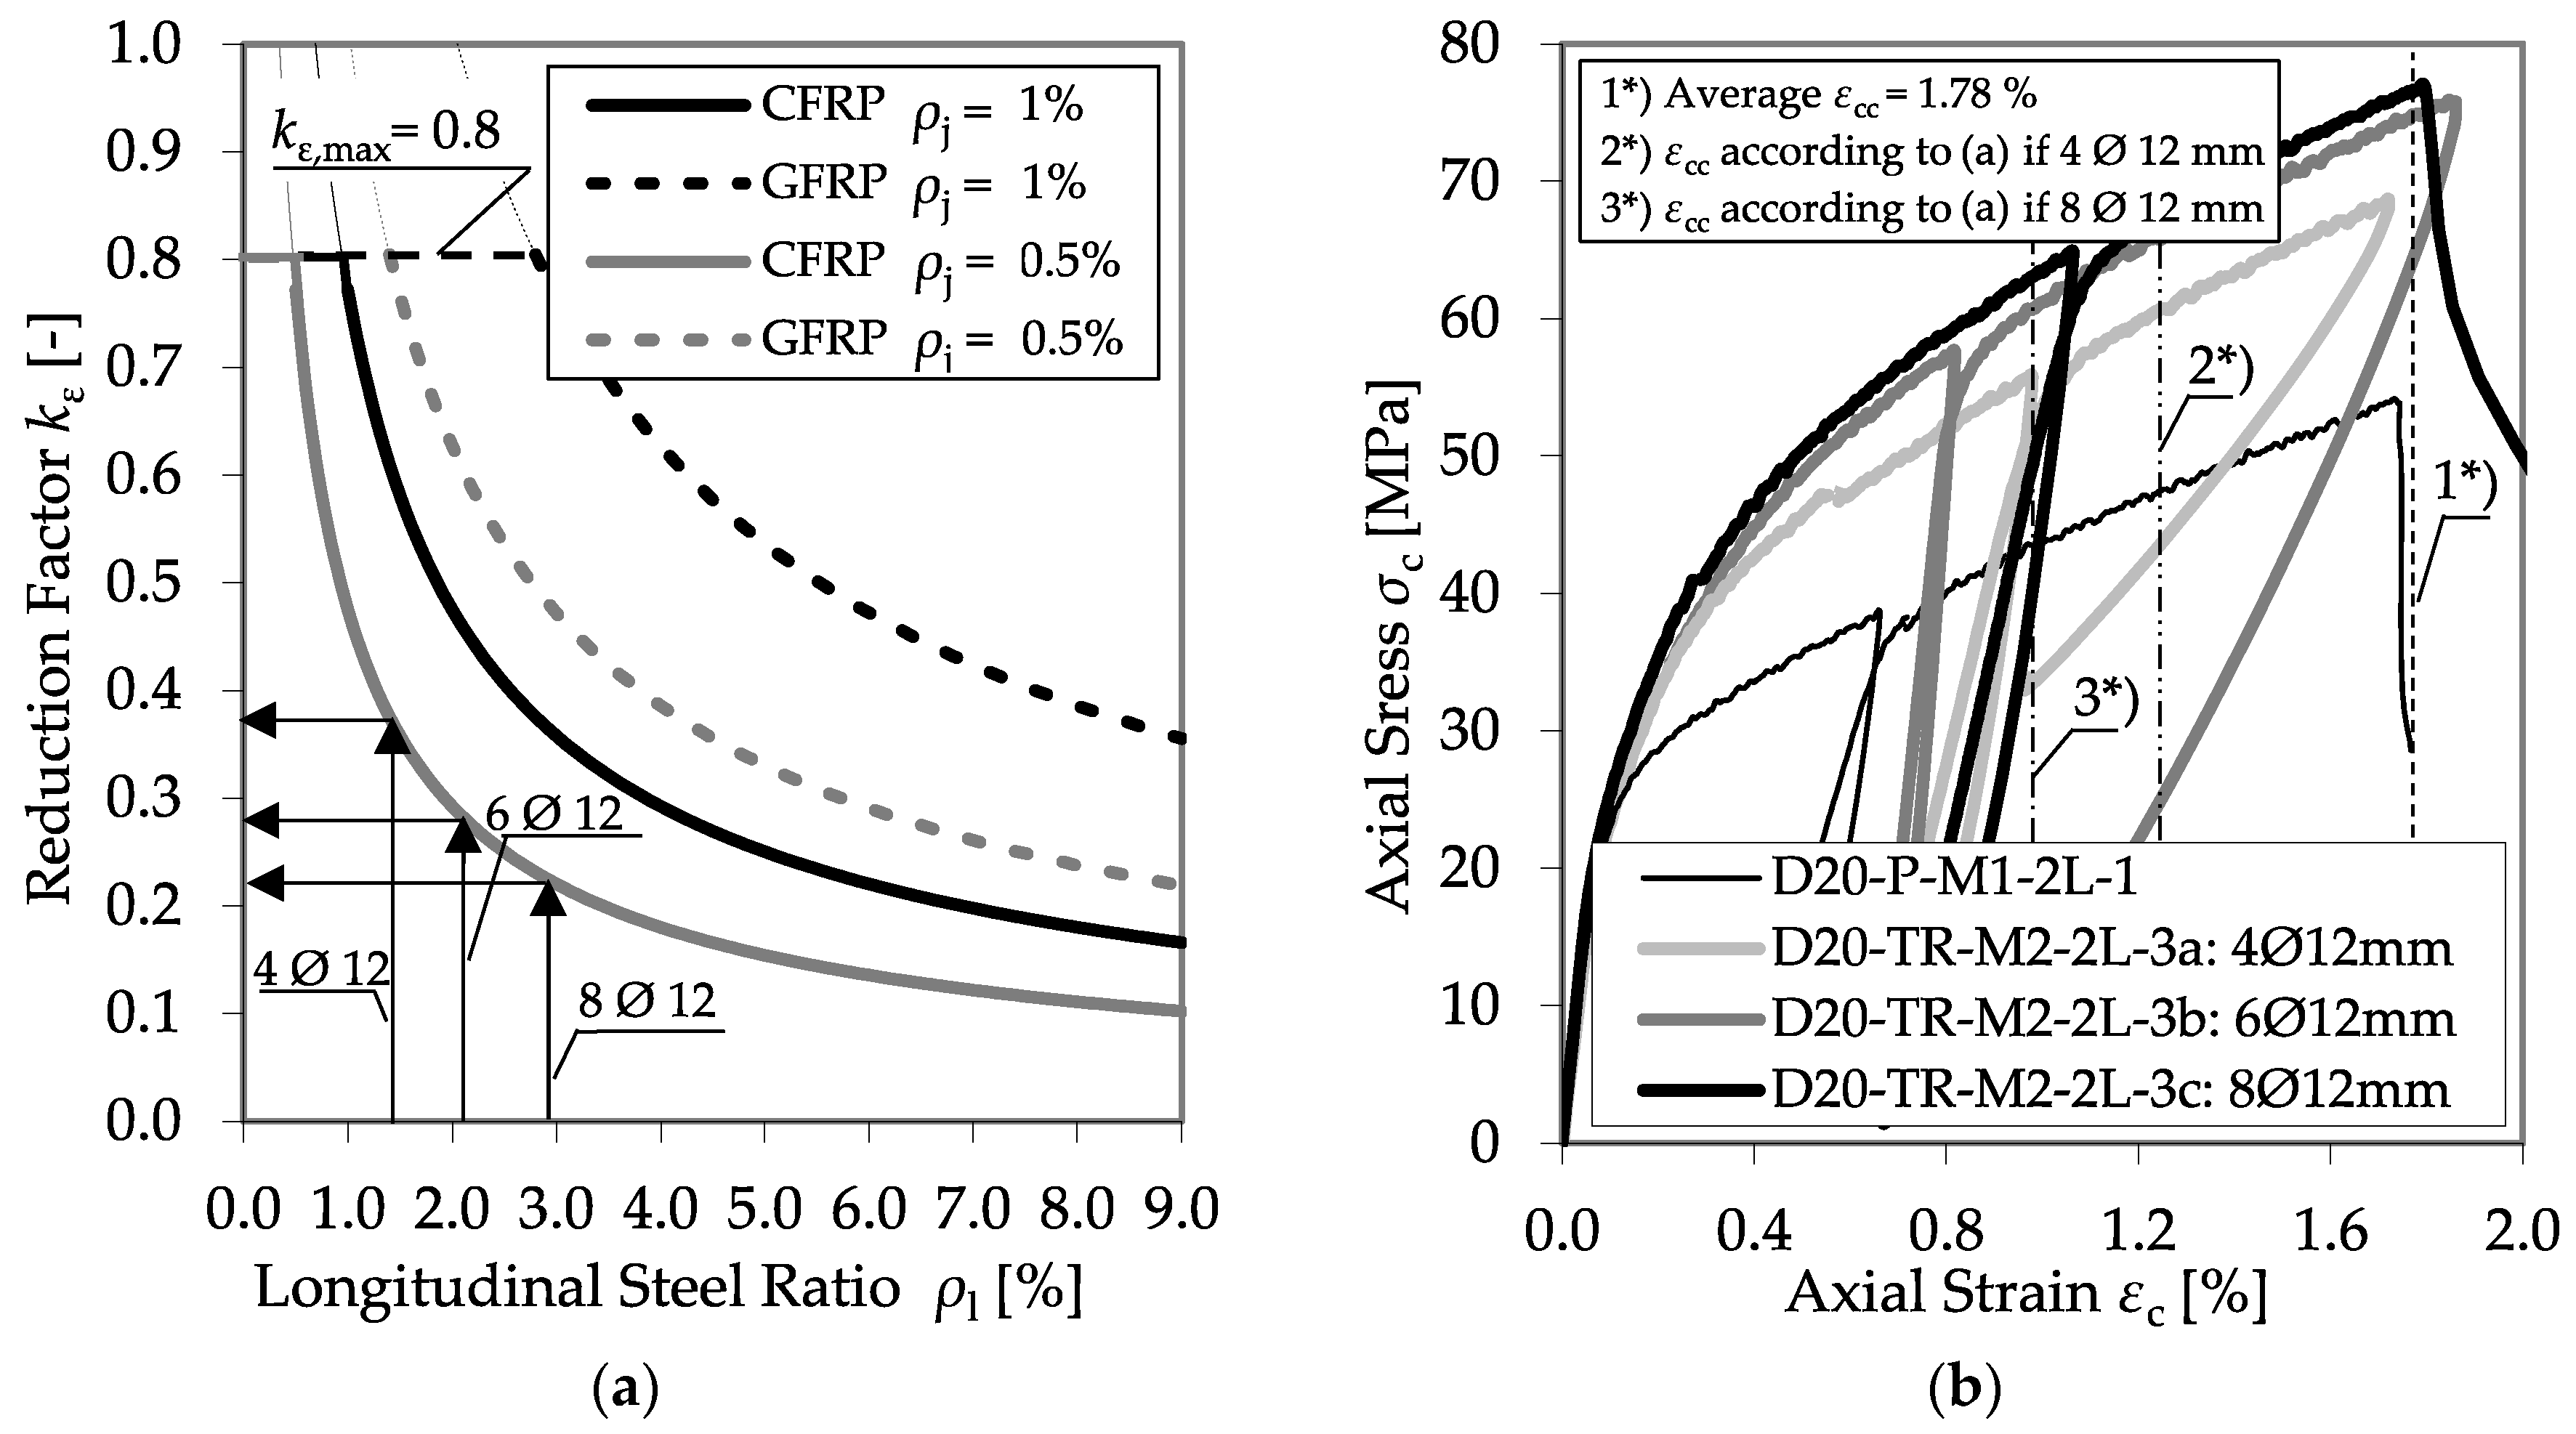
3.5. Impact of the Longitudinal Reinforcement on the CFRP Jacket’s Rupture Strain
4. Implementation of the Experimental Results from the Literature
4.1. Included Experimental Programs
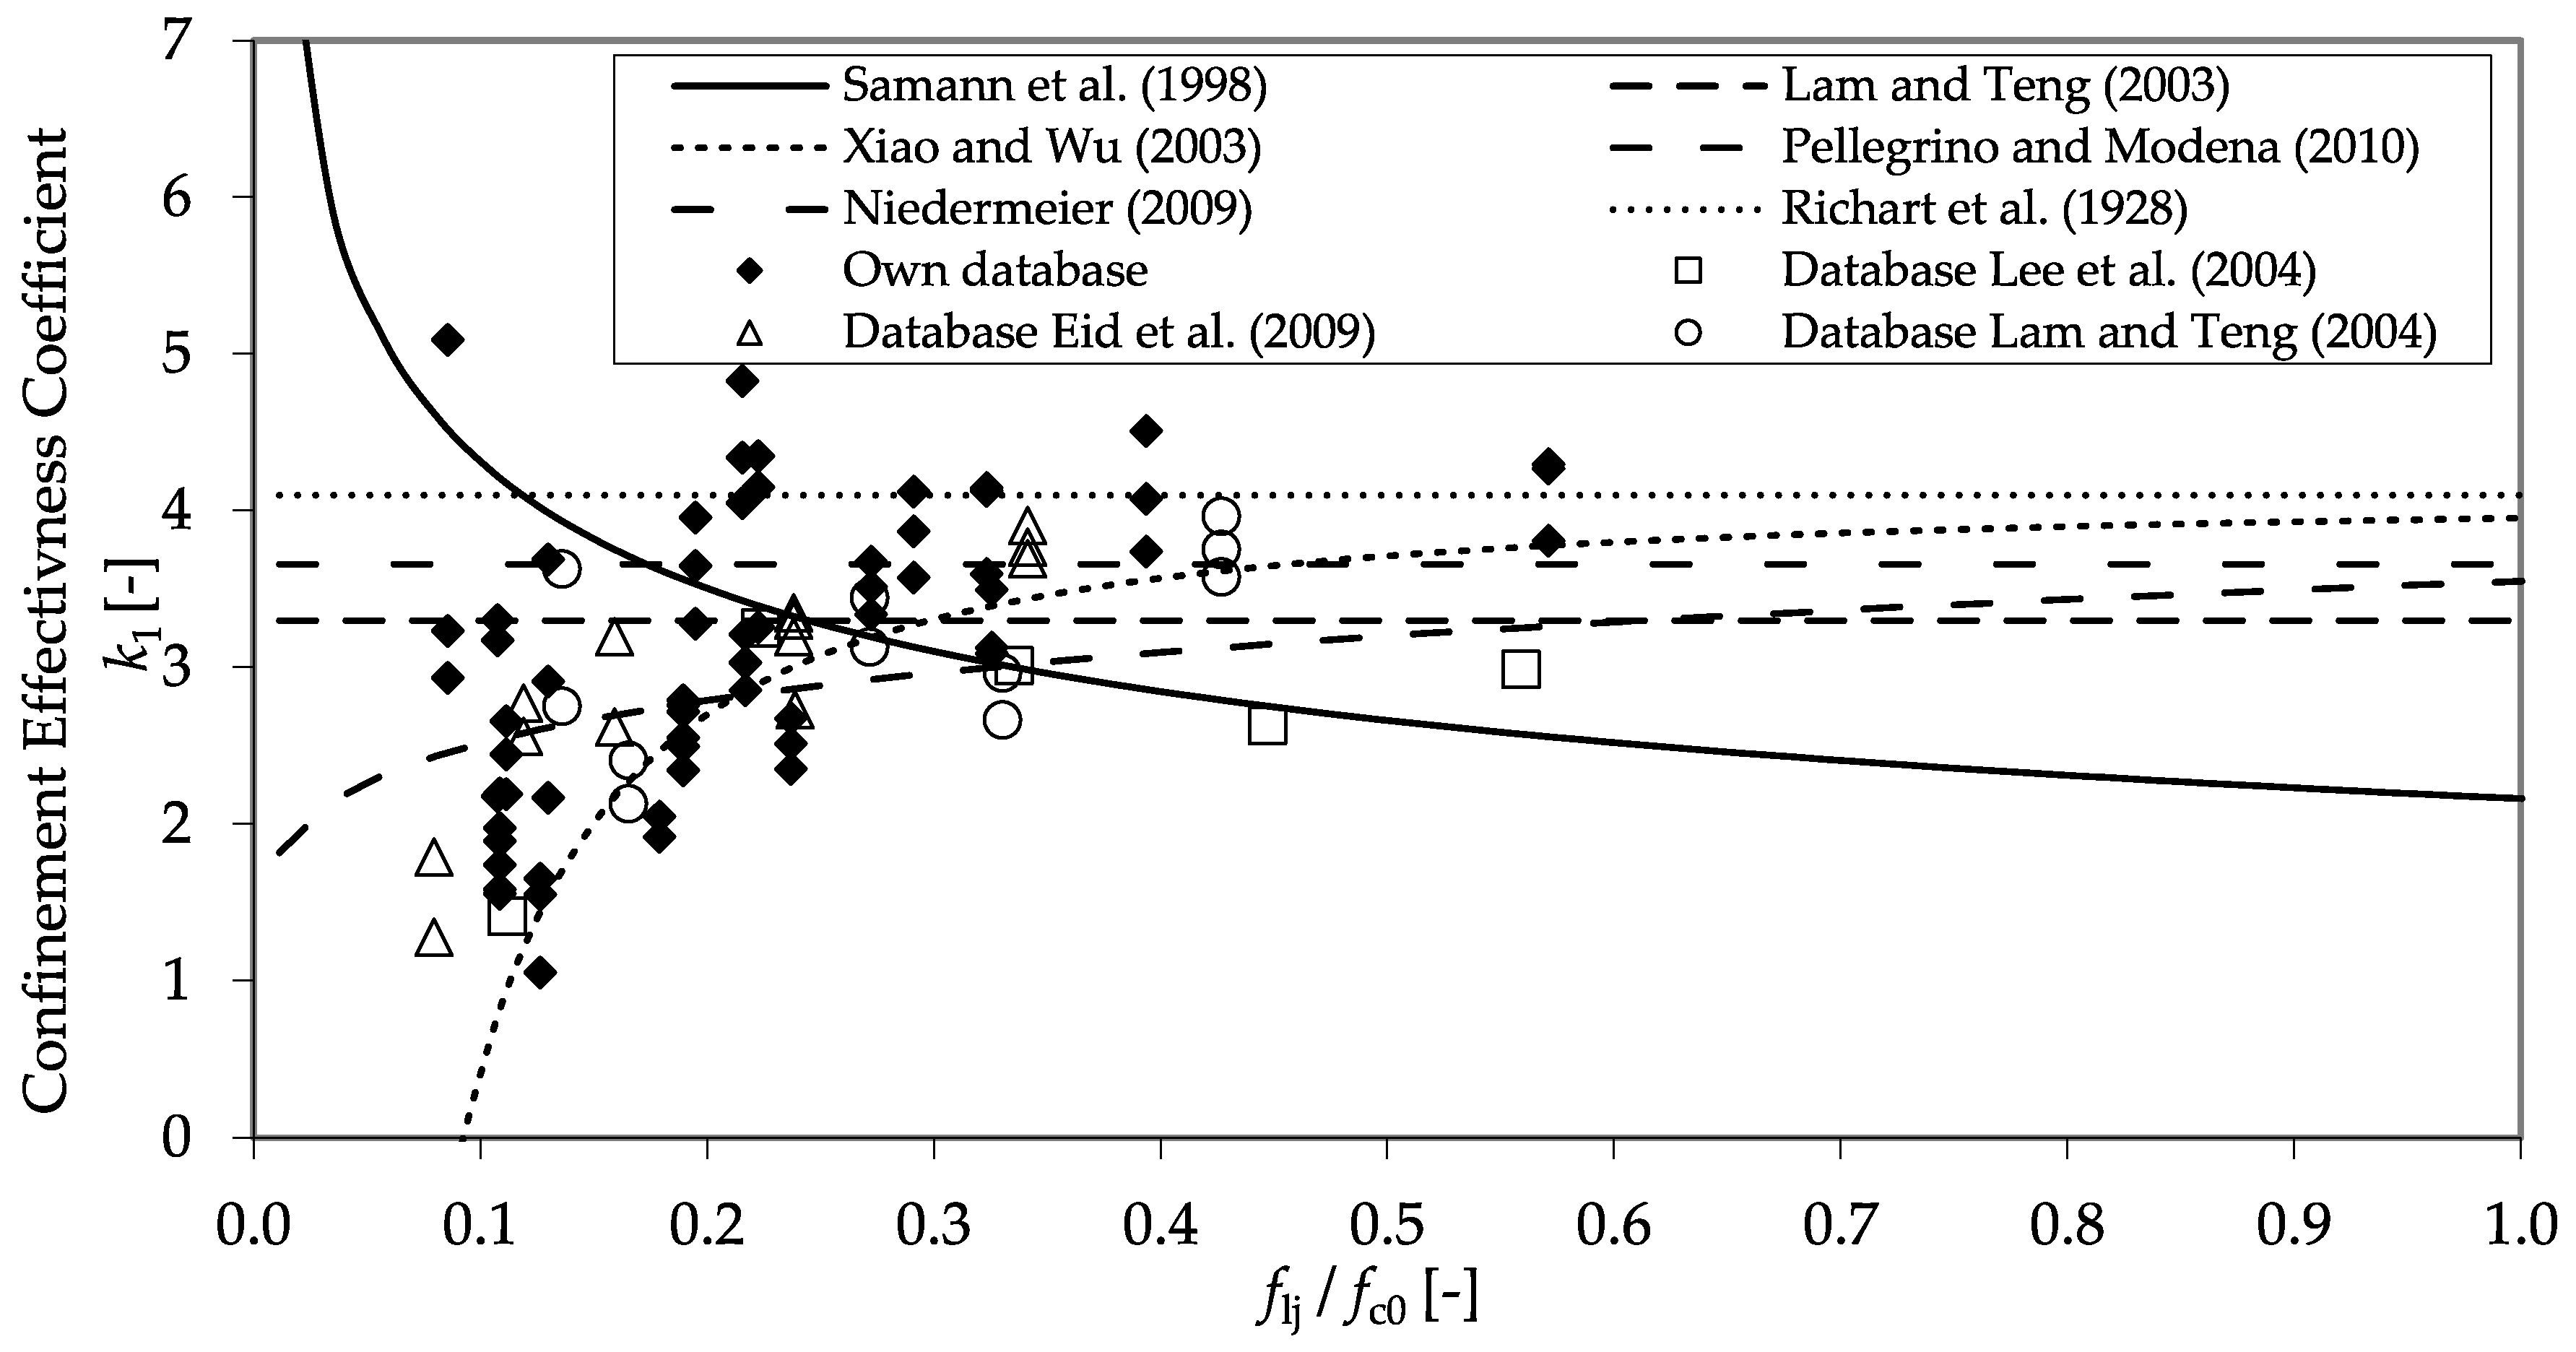
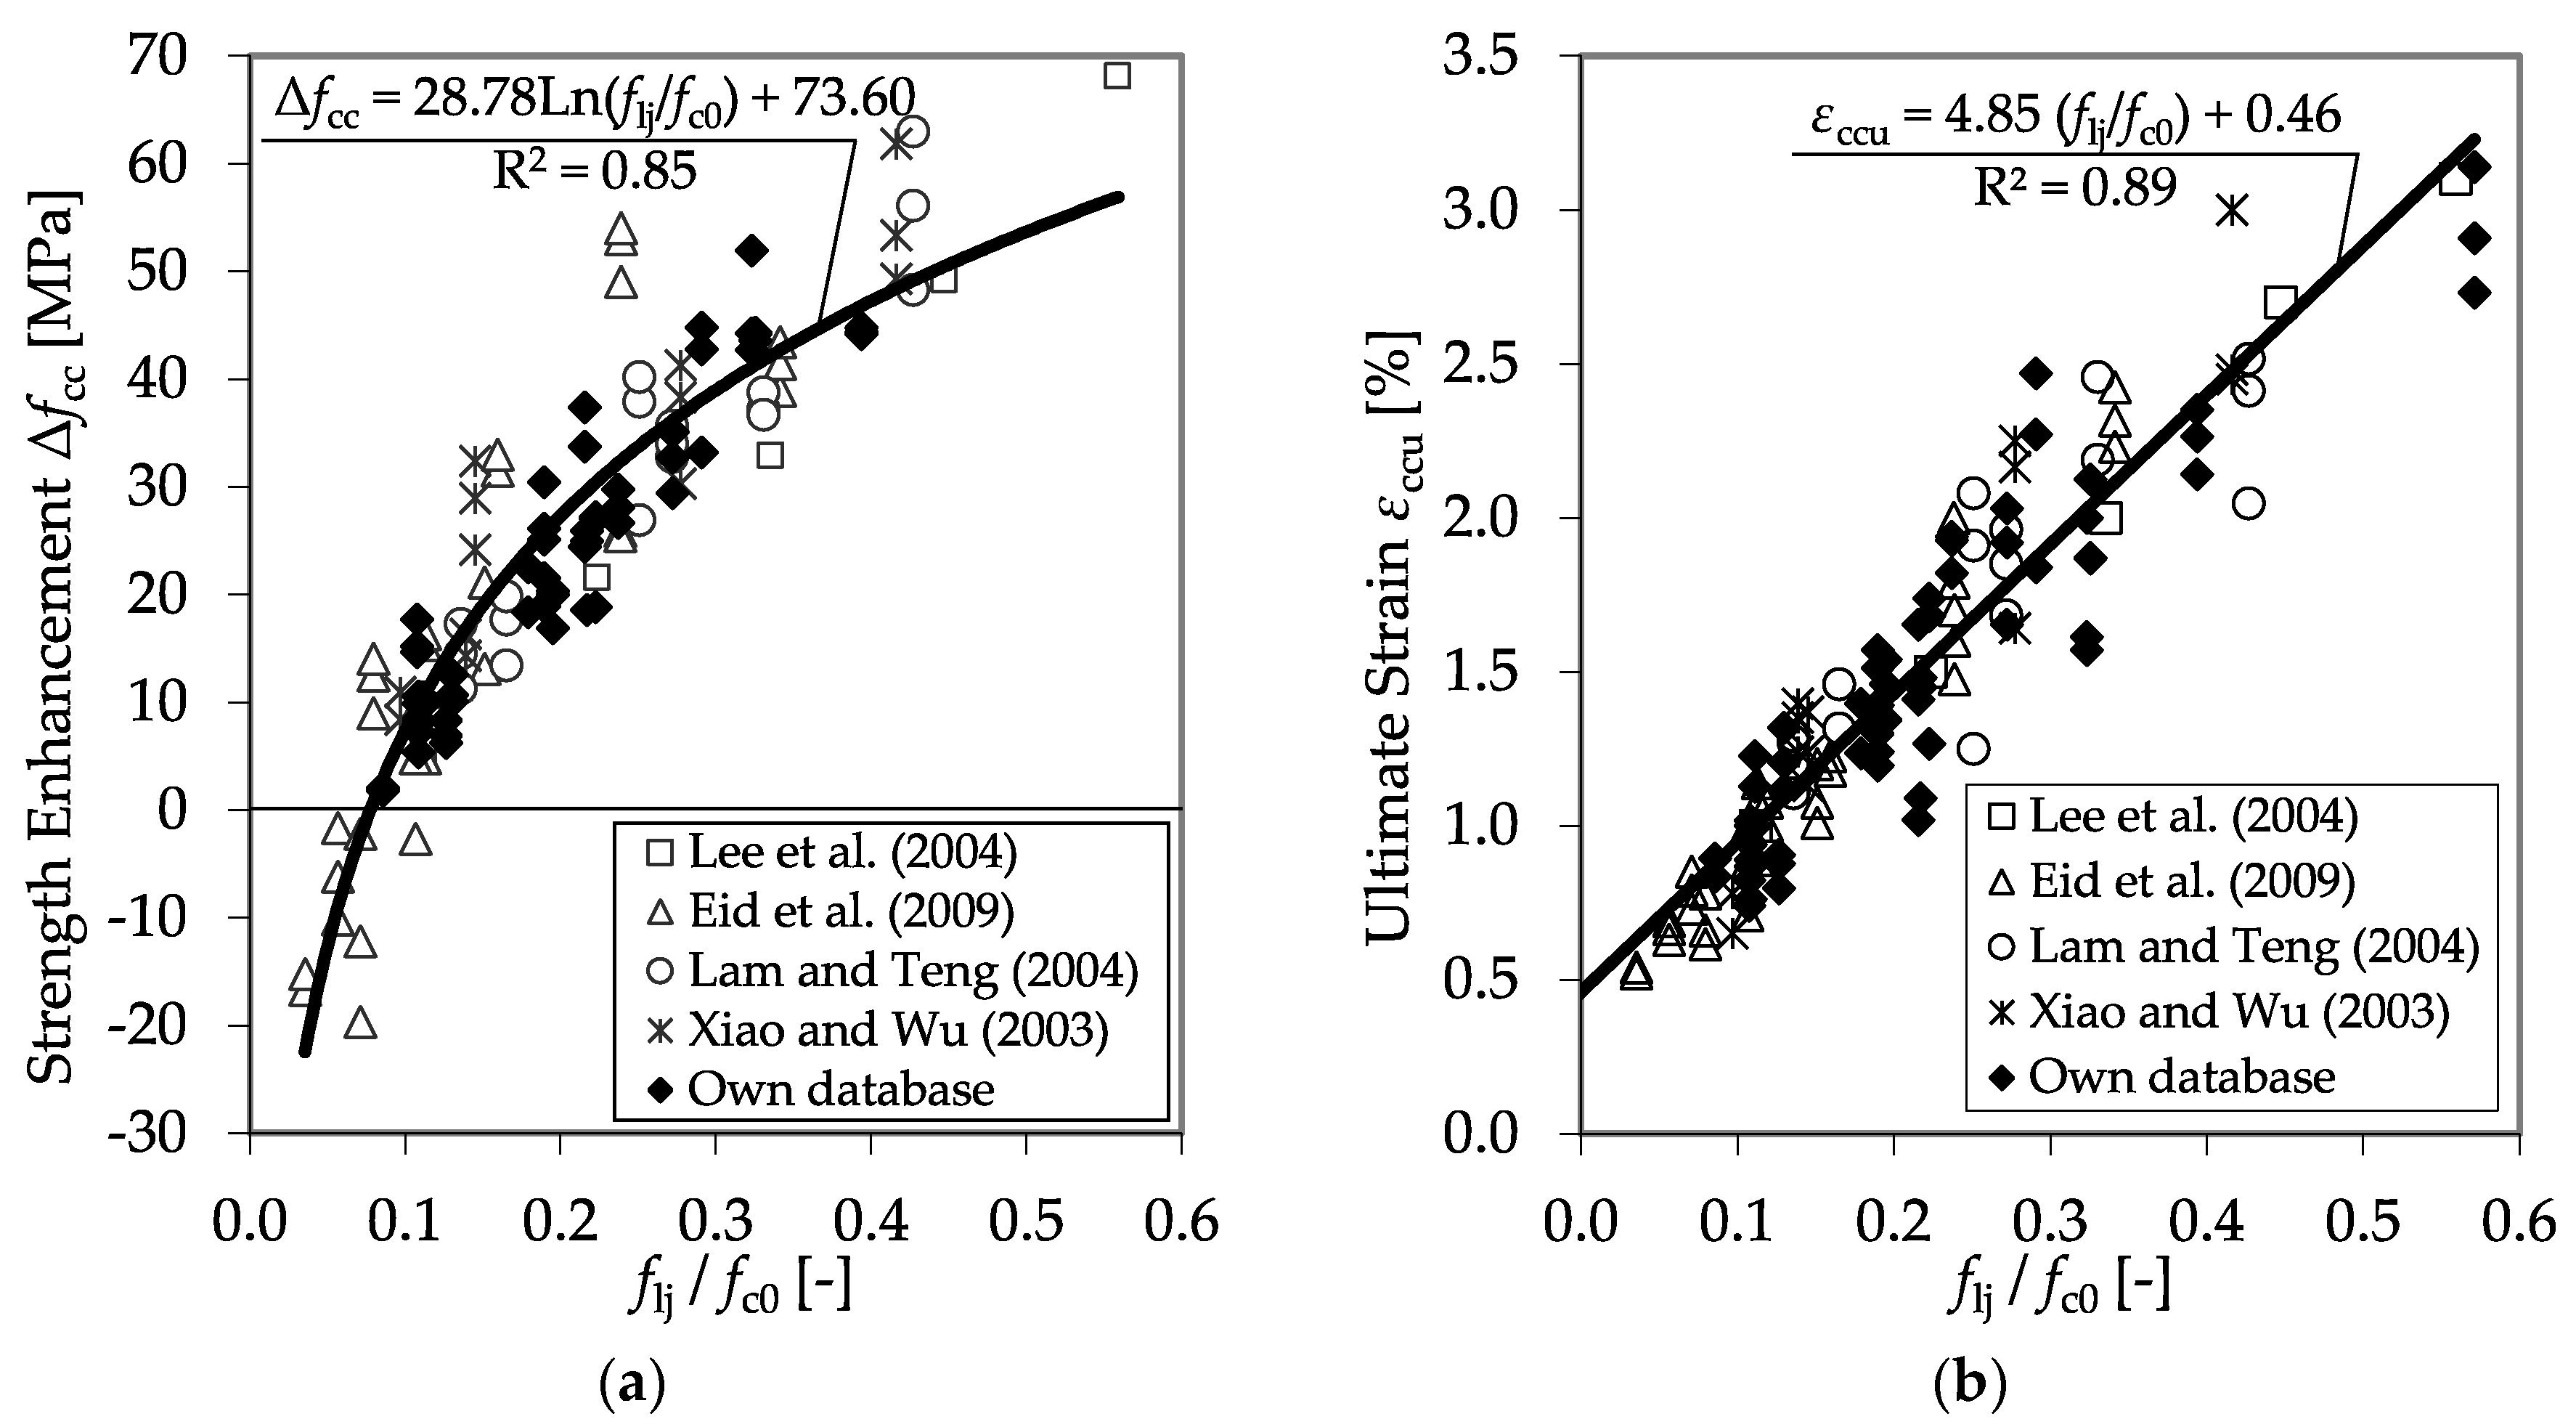
4.2. CFRP-Confined Plain Concrete Specimens
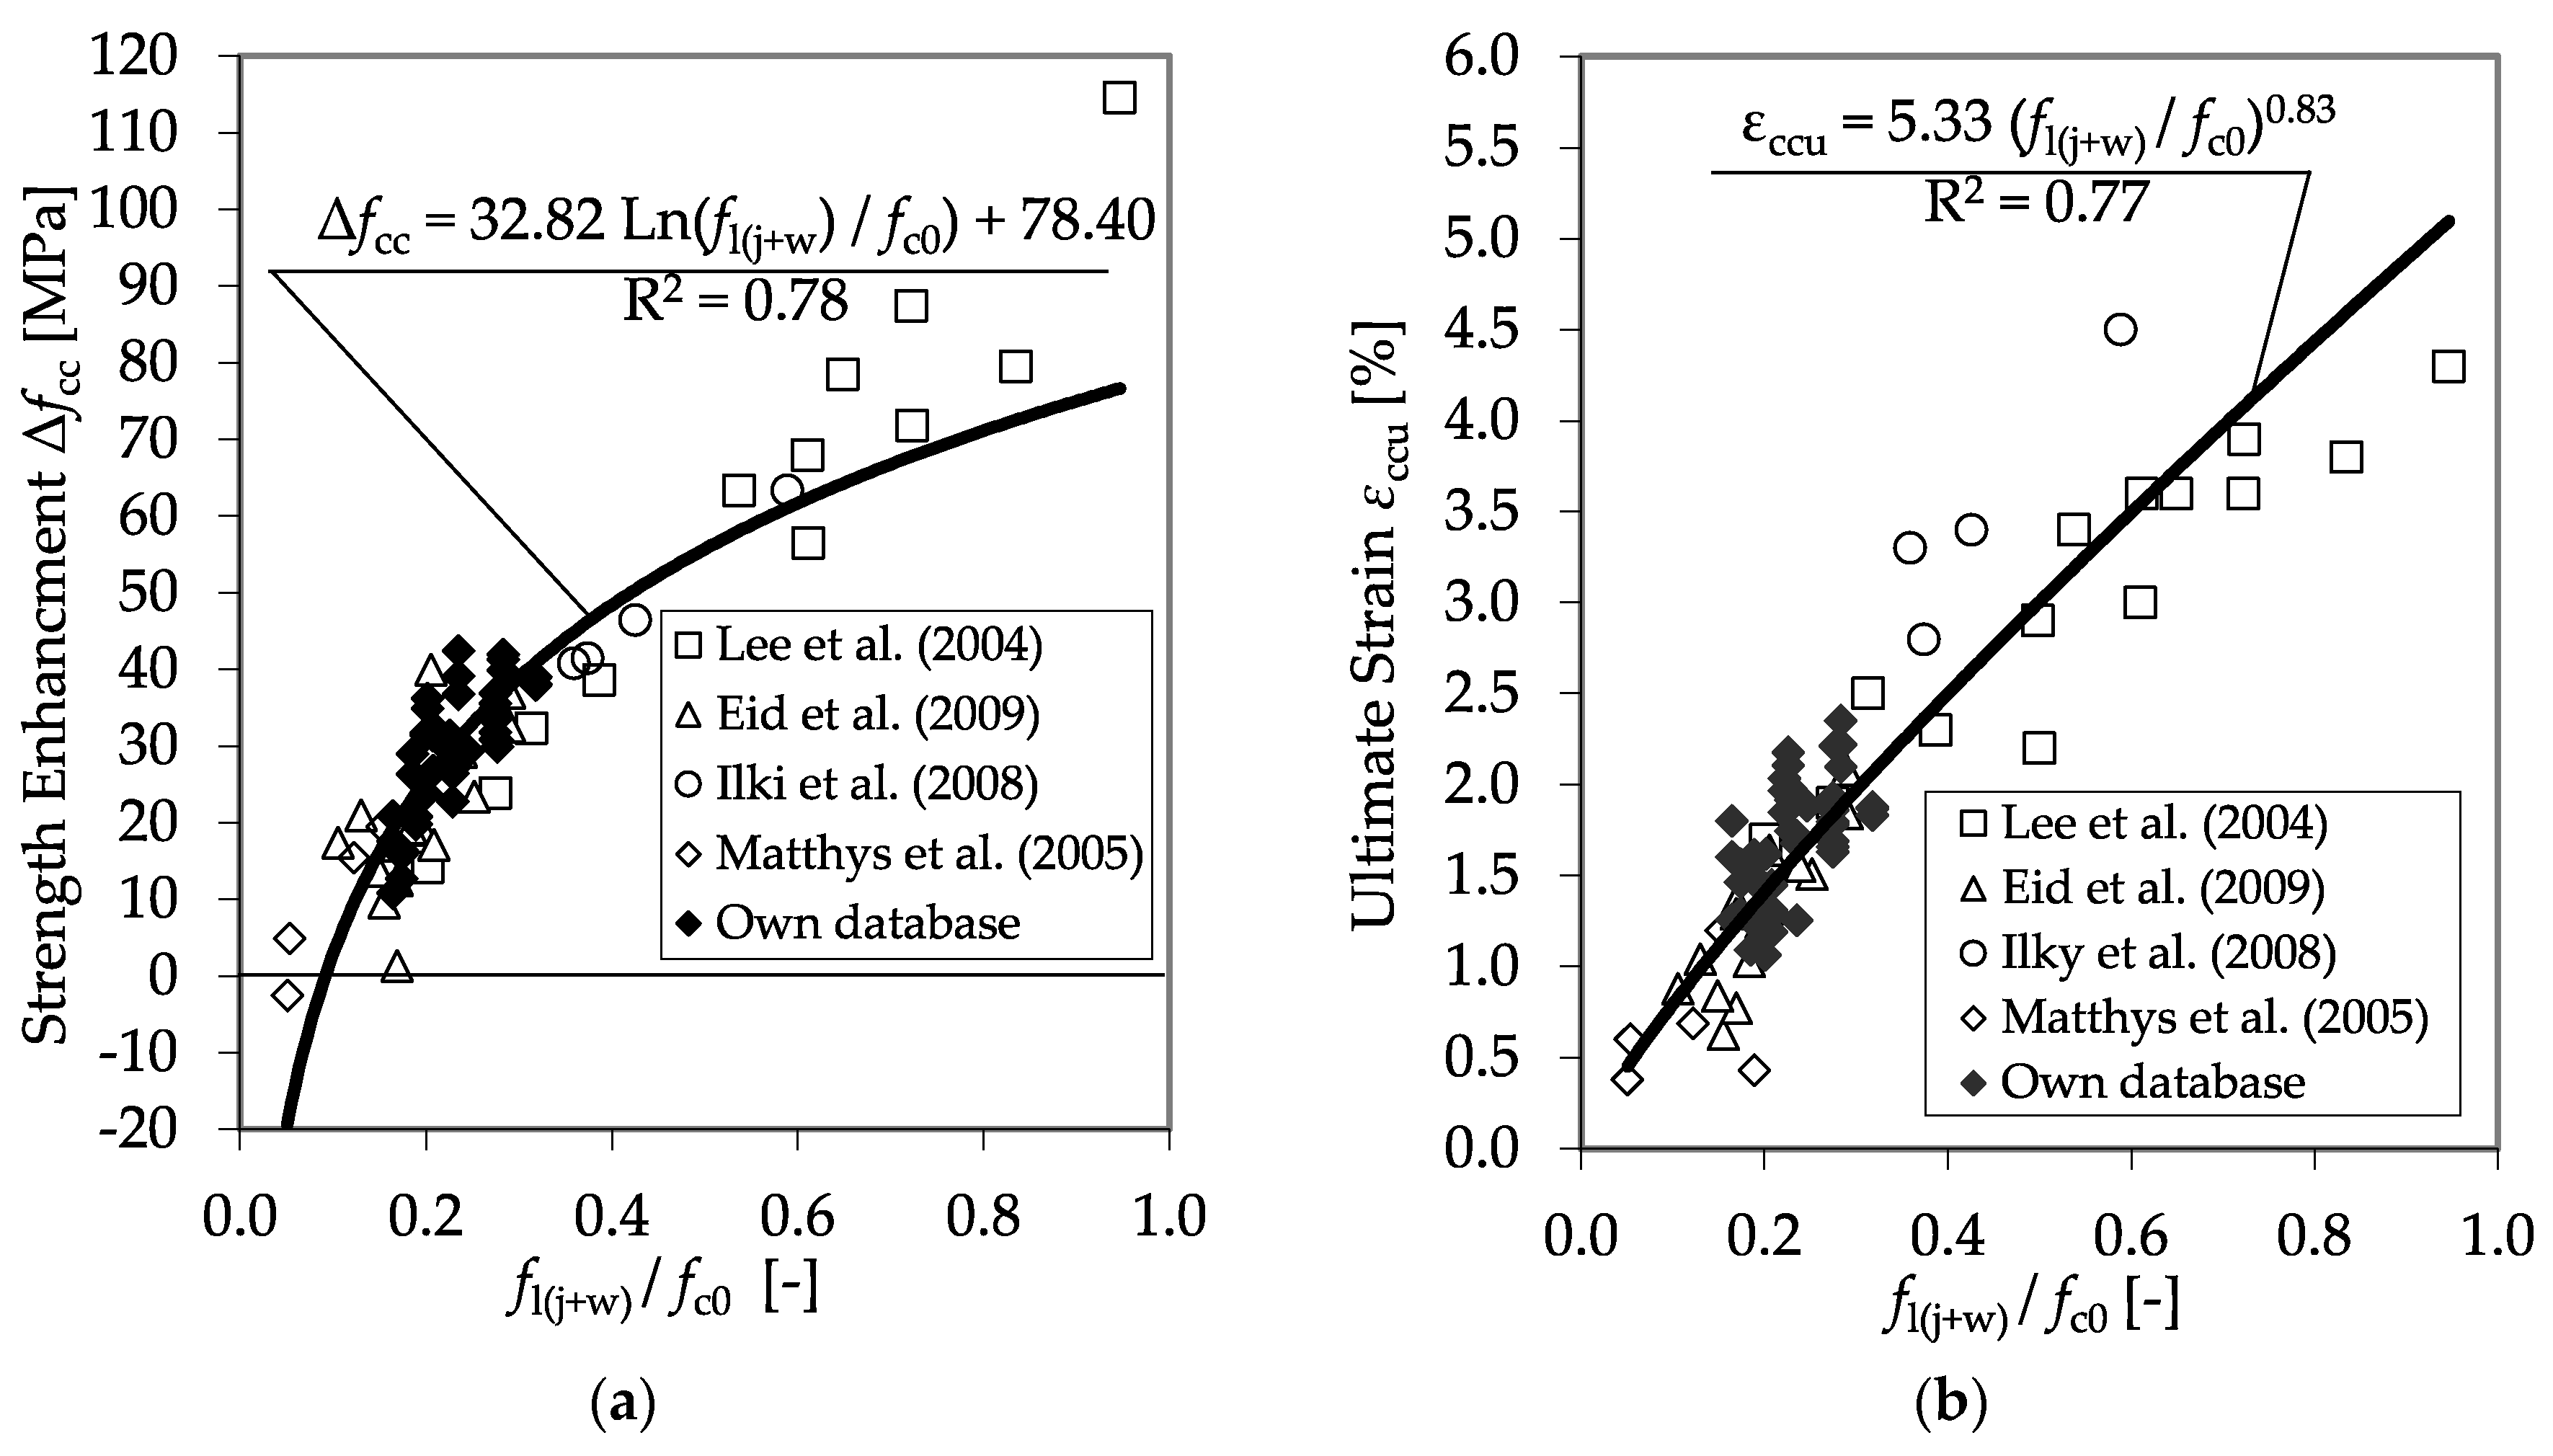
4.3. CFRP-Confined Reinforced Concrete Specimens
5. Model for CFRP-Confined Plain and Reinforced Concrete
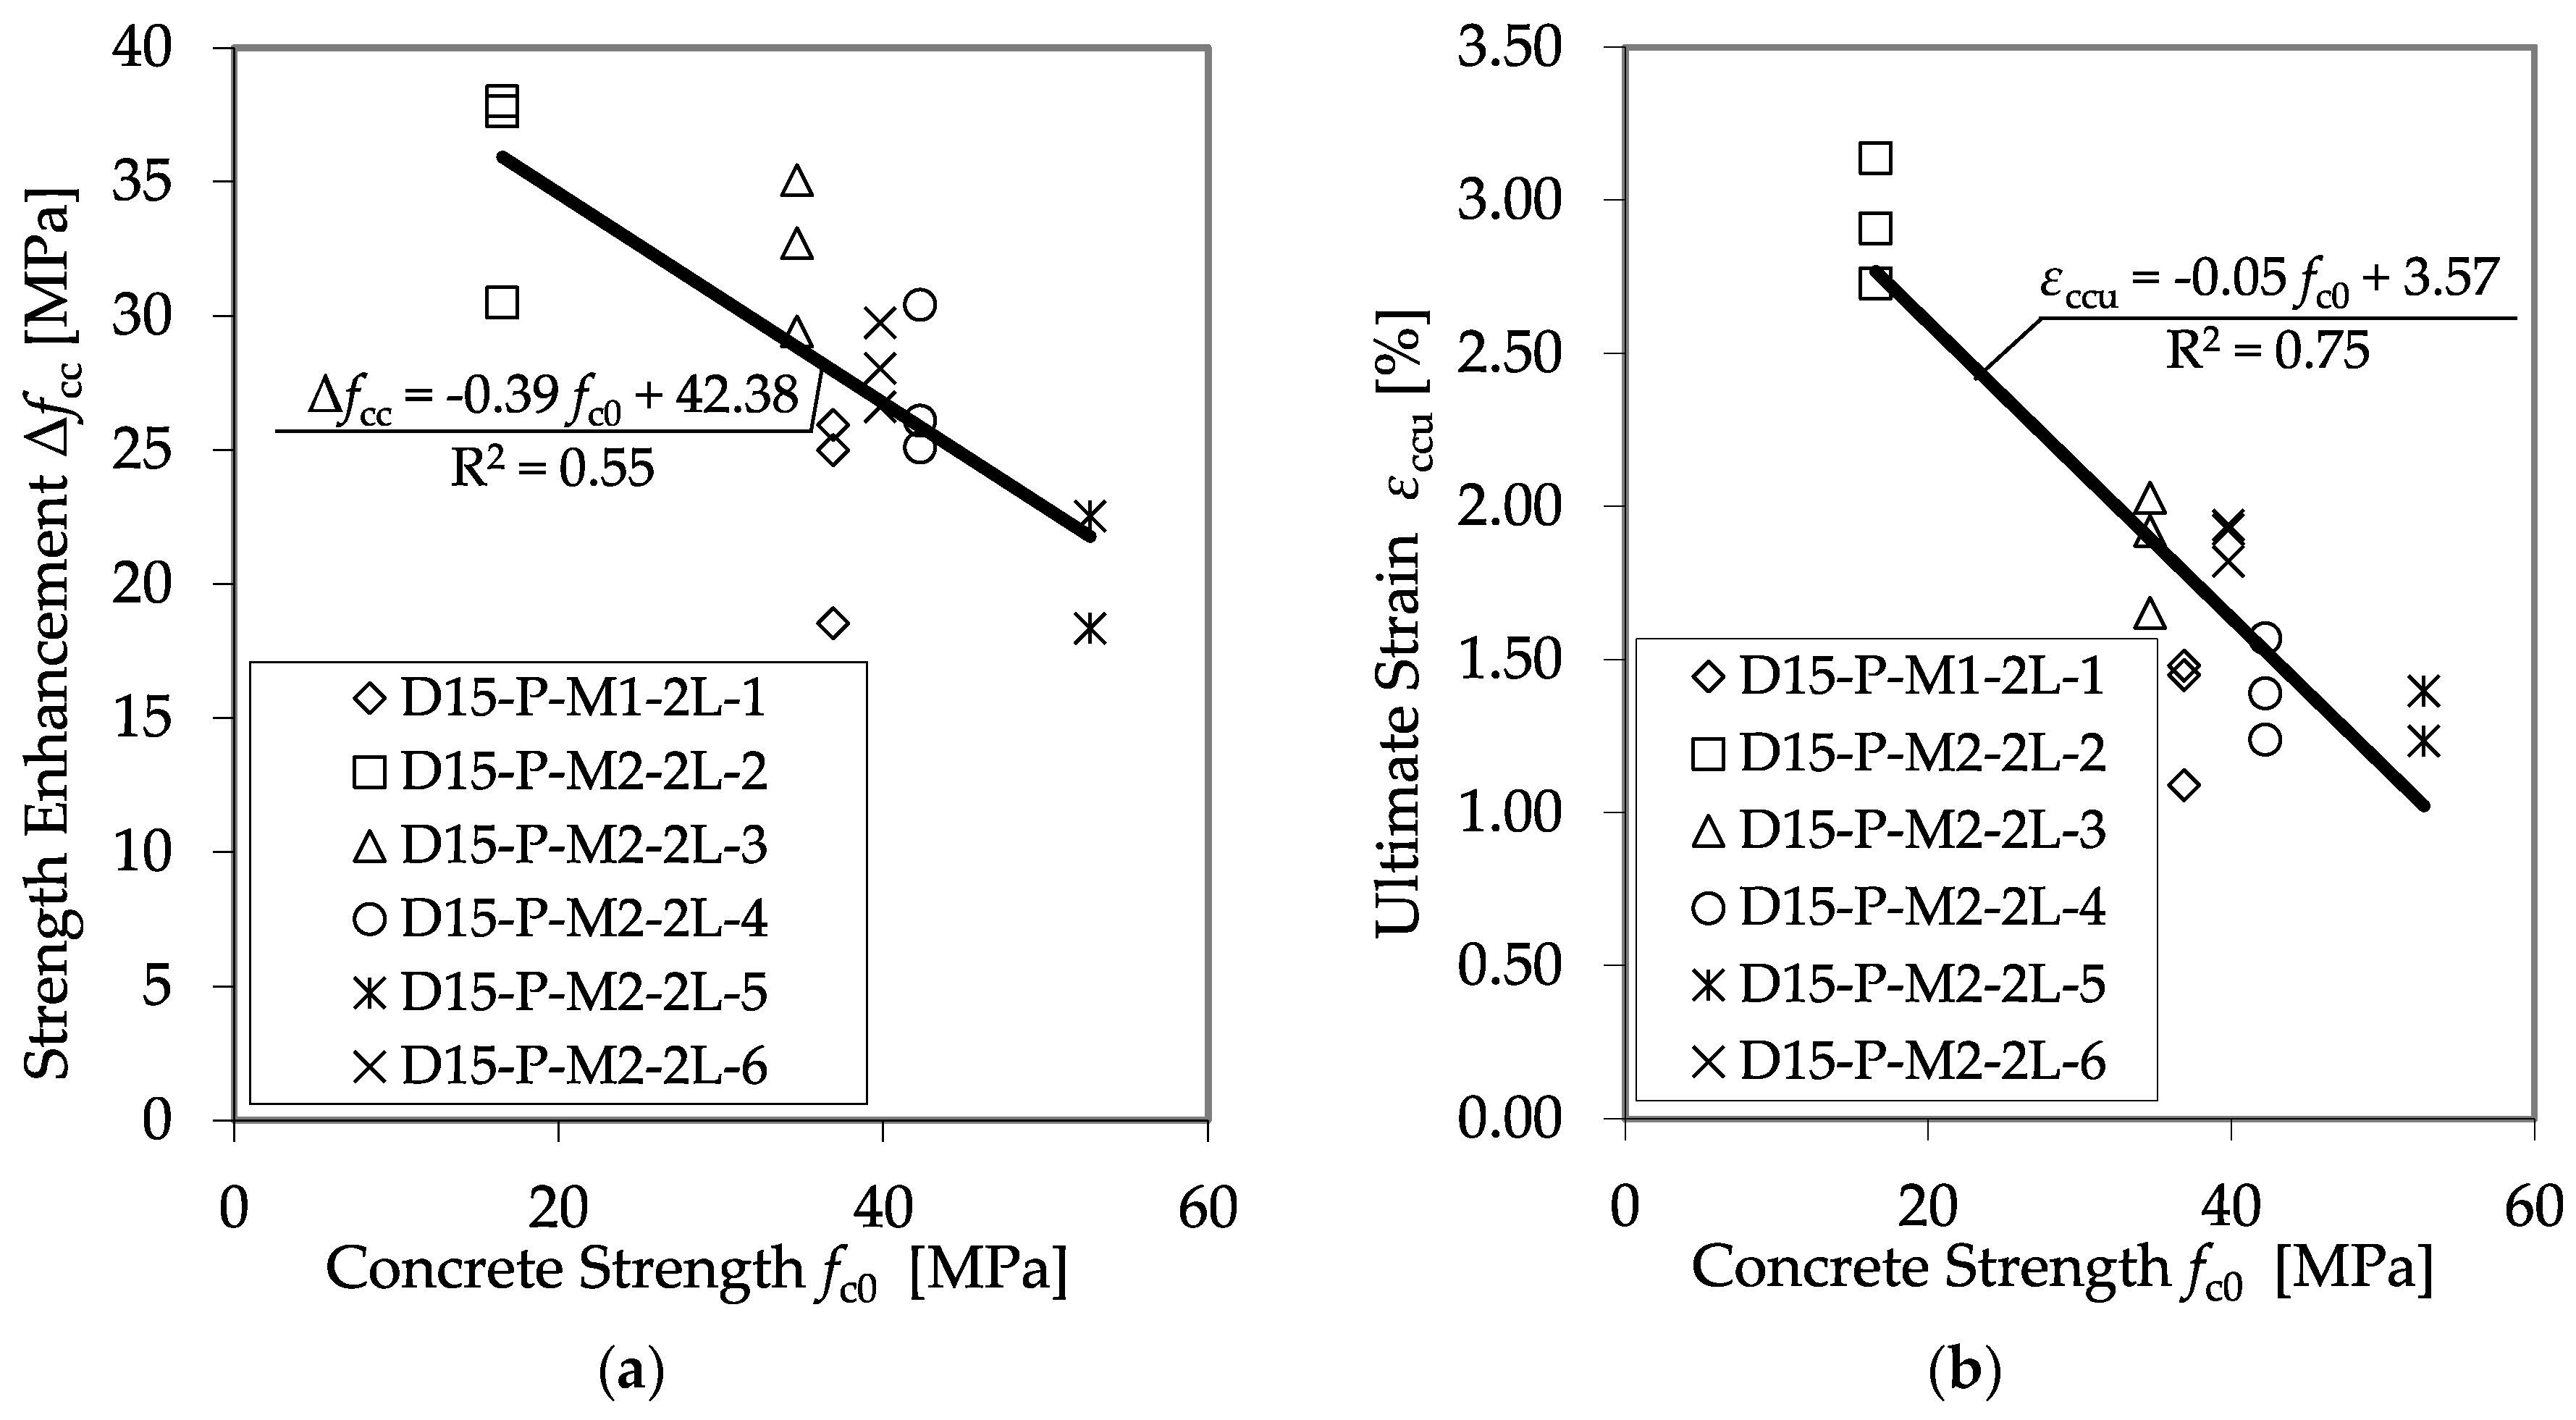
5.1. Ultimate Concrete Strength and Accompanied Axial Strain
5.2. Stress–Strain Relationships
6. Conclusions
Author Contributions
Funding
Conflicts of Interest
References
- Shahawy, M.; Mirmiran, A.; Beitelmann, T. Tests and modeling of carbon-wrapped concrete columns. Compos. Part B Eng. 2000, 31, 457–480. [Google Scholar] [CrossRef]
- Cui, C.; Sheikh, S.A. Analytical Model for Circular Normal- and High-Strength Concrete Columns Confined with FRP. J. Compos. Constr. 2010, 14, 562–572. [Google Scholar] [CrossRef]
- Eid, R.; Paultre, P. Analytical Model for FRP-Confined Circular Reinforced Concrete Columns. J. Compos. Constr. 2008, 12, 541–552. [Google Scholar] [CrossRef]
- Eid, R.; Roy, N.; Paultre, P. Normal- and High-Strength Concrete Circular Elements Wrapped with FRP Composites. J. Compos. Constr. 2009, 13, 113–124. [Google Scholar] [CrossRef]
- Hu, H.; Seracino, R. Analytical Model for FRP-and-Steel-Confined Circular Concrete Columns in Compression. J. Compos. Constr. 2014, 18. [Google Scholar] [CrossRef]
- Lam, L.; Teng, J.G. Design-oriented stress–strain model for FRP-confined concrete. Constr. Build. Mat. 2003, 17, 471–489. [Google Scholar] [CrossRef]
- Lin, G.; Yu, T.; Teng, J.G. Design-Oriented Stress–Strain Model for Concrete under Combined FRP-Steel Confinement. J. Compos. Constr. 2016, 20. [Google Scholar] [CrossRef]
- Pellegrino, C.; Modena, C. Analytical Model for FRP Confinement of Concrete Columns with and without Internal Steel Reinforcement. J. Compos. Constr. 2010, 14, 693–705. [Google Scholar] [CrossRef]
- Rousakis, T.C.; Karabinis, A.I. Adequately FRP confined reinforced concrete columns under axial compressive monotonic or cyclic loading. Mater. Struct. 2012, 45, 957–975. [Google Scholar] [CrossRef]
- Rousakis, T.C.; Rakitizis, T.D.; Karabinis, A.I. Design-Oriented Strength Model for FRP-Confined Concrete Members. J. Compos. Constr. 2012, 16, 615–625. [Google Scholar] [CrossRef]
- Teng, J.G.; Jiang, T.; Lam, L.; Luo, Y.Z. Refinement of a Design-Oriented Stress-Strain Model for FRP-Confined Concrete. J. Compos. Constr. 2009, 13, 269–278. [Google Scholar] [CrossRef]
- Teng, J.G.; Lin, G.; Yu, T. Analysis-Oriented Stress-Strain Model for Concrete under Combined FRP-Steel Confinement. J. Compos. Constr. 2015, 19. [Google Scholar] [CrossRef]
- Xiao, Y.; Wu, H. Compressive Behavior of Concrete Confined by Various Types of FRP Composite Jackets. J. Reinf. Plast. Compos. 2003, 22, 1187–1201. [Google Scholar] [CrossRef]
- Al-Nimry, H.; Neqresh, M. Confinement effects of unidirectional CFRP sheets on axial and bending capacities of square RC columns. Eng. Struct. 2019, 196. [Google Scholar] [CrossRef]
- Lin, G.; Teng, J.G. Stress-Strain Model for FRP-Confined Concrete in Eccentrically Loaded Circular Columns. J. Compos. Constr. 2019, 23. [Google Scholar] [CrossRef]
- Giamundo, V.; Lignola, G.P.; Prota, A.; Manfredi, G. Analytical Evaluation of FRP Wrapping Effectiveness in Restraining Reinforcement Bar Buckling. J. Struct. Eng. 2014, 140. [Google Scholar] [CrossRef]
- Ferrotto, M.F.; Fischer, O.; Niedermeier, R. Experimental investigation on the compressive behavior of short-term preloaded carbon fiber reinforced polymer-confined concrete columns. Struct. Concr. 2017, 19, 988–1001. [Google Scholar] [CrossRef]
- Mirmiran, A.; Shahawy, M.; Samaan, M.; El Echary, H.; Mastrapa, J.C.; Pico, O. Effect of Column Parameters on FRP-Confined Concrete. J. Compos. Constr. 1998, 2, 175–185. [Google Scholar] [CrossRef]
- Spoelstra, M.R.; Monti, G. FRP-Confined Concrete Model. J. Compos. Constr. 1999, 3, 143–150. [Google Scholar] [CrossRef]
- Jiang, T.; Teng, J.G. Analysis-oriented stress–strain models for FRP–confined concrete. Engineering Structures. 2007, 29, 2968–2986. [Google Scholar] [CrossRef]
- Smith, S.T.; Kim, S.J.; Zhang, H. Behavior and Effectiveness of FRP Wrap in the Confinement of Large Concrete Cylinders. J. Compos. Constr. 2010, 14, 573–582. [Google Scholar] [CrossRef]
- Meßerer, D.; Käseberg, S.; Weisbrich, M.; Holschemacher, K. Effect of substrate preparation on the load-bearing behaviour of CFRP-confined concrete. Beton- und Stahlbetonbau 2020. (In German) [Google Scholar] [CrossRef]
- Lam, L.; Teng, J.G. Design-Oriented Stress-Strain Model for FRP-Confined Concrete in Rectangular Columns. J. Reinf. Plast. Compos. 2003, 22, 1149–1186. [Google Scholar] [CrossRef]
- Kaeseberg, S.; Messerer, D.; Holschemacher, K. Assessment of Standards and Codes Dedicated to CFRP Confinement of RC Columns. Materials 2019, 12, 390. [Google Scholar] [CrossRef] [PubMed]
- Kaeseberg, S.; Messerer, D.; Holschemacher, K. Comparison of standards and design guidelines for CFRP confinement of RC columns. In Proceedings of the 7th Asia-Pacific Conference on FRP in Structures (APFIS 2019), Surfers Paradise, Australia, 10–13 December 2019. [Google Scholar]
- ACI 440.2R-17. Guide for the Design and Construction of Externally Bonded FRP Systems for Strengthening Concrete Structures; American Concrete Institute (ACI): Farmington Hills, MI, USA, 2017.
- CNR-DT 200 R1/2013. Guide for the Design and Construction of Externally Bonded FRP Systems for Strengthening Existing Structures; National Research Council—Advisory Committee on Technical Recommendations for Construction: Rome, Italy, 2013; Available online: https://www.cnr.it/en/node/2636 (accessed on 27 August 2020).
- GB50608-2010. Technical Code for Infrastructure Application of FRP Composites; Ministry of Housing and Urban-Rural Development, General Administration of Quality Supervision, Inspection and Quarantine: Beijing, China, 2010. (In Chinese)
- CSA S806-2012 (R2017). Design and Construction of Building Structures with Fibre-Reinforced Polymers; Canadian Standards Association: Ontario, ON, Canada, 2012; (Reaffirmed 2017).
- DAfStb RiLi VBgB. DAfStb-Richtlinie Verstärken von Betonbauteilen mit Geklebter Bewehrung; Deutscher Ausschuss für Stahlbeton e.V. (DAfStb): Berlin, Germany, 2012. (In German) [Google Scholar]
- Richart, F.E.; Brandtzæg, A.; Brown, R.L. A Study of the Failure of Concrete under Combined Compressive Stresses; Engineering Experiment Station, Bulletin No. 185; University of Illinois: Urbana-Champaign, IL, USA, 1928; Available online: http://hdl.handle.net/2142/4277 (accessed on 27 August 2020).
- Samaan, M.; Mirmiran, A.; Shahawy, M. Model of Concrete Confined by Fiber Composites. J. Struct. Eng. 1998, 124, 1025–1031. [Google Scholar] [CrossRef]
- Niedermeier, R. Verstärkung von Stahlbetondruckgliedern durch Umschnürung. Ph.D. Thesis, Technical University of Munich, Munich, Germany, 2009. (In German). [Google Scholar]
- Teng, J.G.; Huang, Y.L.; Lam, L.; Ye, L.P. Theoretical Model for Fiber-Reinforced Polymer-Confined Concrete. J. Compos. Constr. 2007, 11, 201–210. [Google Scholar] [CrossRef]
- Rousakis, T.C.; Karabinis, A.I. Substandard reinforced concrete members subjected to compression: FRP confining effects. Mater. Struct. 2008, 41, 1595–1611. [Google Scholar] [CrossRef]
- Chastre, C.; Silva, M.A.G. Monotonic axial behavior and modelling of RC circular columns confined with CFRP. Eng. Struct.. 2010, 32. [Google Scholar] [CrossRef]
- EN 197-1:2011. Cement—Part 1: Composition, Specifications and Conformity Criteria for Common Cements; European Committee for Standardization (CEN): Brussels, Belgium, 2011.
- EN 12390-3:2009. Testing Hardened Concrete—Part 3: Compressive Strength of Test Specimens; European Committee for Standardization (CEN): Brussels, Belgium, 2009.
- DIN 488-1. Reinforcing Steels—Part 1: Grades, Properties, Marking; German Institute for Standardisation (DIN—Deutsches Institut für Normung e. V.): Berlin, Germany, 2009. (In German)
- Zilch, K.; Niedermeier, R.; Finckh, W. Geklebte Verstärkung mit CFK-Lamellen und Stahllaschen. In Beton-Kalender 2013, Lebensdauer und Instandsetzung, Brandschutz, 1st ed.; Bergmeister, K., Fingerloos, F., Wörner, J.-D., Eds.; Wilhelm Ernst & Sohn: Berlin, Germany, 2013; pp. 469–552. (In German) [Google Scholar]
- Toutanji, H.; Matthys, S.; Taerwe, L.; Audenaert, K. Behaviour of large-scale columns confined with FRP composites in compression. In Proceedings of the 2nd International Conference on FRP Composites in Civil Engineering (CICE 2004), Adelaide, Australia, 8–10 December 2004. [Google Scholar]
- EN 1990. Basis of Structural Design; European Committee for Standardization (CEN): Brussels, Belgium, 2002.
- fib Bulletin No. 80. Partial Factor Methods for Existing Concrete Structures; Fédération Internationale du Béton (fib): Lausanne, Switzerland, 2016; ISBN 978-2-88394-120-5.
- fib Bulletin No. 14. Externally Bonded frp Reinforcement for RC Structures; Fédération Internationale du Béton (fib): Lausanne, Switzerland, 2001; ISBN 978-2-88394-054-3.
- Bai, Y.-L.; Dai, J.-G.; Teng, J.G. Buckling of steel reinforcing bars in FRP-confined RC columns: An experimental study. Constr. Build. Mater. 2017, 140, 403–415. [Google Scholar] [CrossRef]
- Lee, J.-Y.; Oh, Y.-J.; Park, J.-S.; Mansour, M.Y. Behavior of Concrete Columns Confined with Steel Spirals and FRP Composites. In Proceedings of the 13th World Conference on Earthquake Engineering, Vancouver, Canada, 1–6 August 2004. [Google Scholar]
- Matthys, S.; Toutanji, H.; Audenaert, K.; Taerwe, L. Axial Load Behavior of Large-Scale Columns Confined with Fiber-Reinforced Polymer Composites. ACI Struct. J. 2005, 102, 258–267. [Google Scholar]
- Lam, L.; Teng, J.G. Ultimate Condition of Fiber Reinforced Polymer-Confined Concrete. J. Compos. Constr. 2004, 8, 539–548. [Google Scholar] [CrossRef]
- Lam, L.; Teng, J.G.; Cheung, C.H.; Xiao, Y. FRP-confined concrete under axial cyclic compression. Concr. Compos. 2006, 28, 949–958. [Google Scholar] [CrossRef]
- Ilki, A.; Peker, O.; Karamuk, E.; Demir, C.; Kumbasar, N. FRP Retrofit of Low and Medium Strength Circular and Rectangular Reinforced Concrete Columns. J. Mat. Civil Eng. 2008, 20, 169–188. [Google Scholar] [CrossRef]
- Taha, M.R. FRP for Infrastructure Applications: Research Advances. Fibers 2018, 6, 1. [Google Scholar] [CrossRef]
- Naser, M.Z.; Hawileh, R.A.; Abdalla, J.A. Fiber-reinforced polymer composites in strengthening reinforced concrete structures: A critical review. Eng. Struct. 2019, 198. [Google Scholar] [CrossRef]


| Authors | Confined Concrete Compressive Strength fcc | Ultimate Axial Compressive Strain εccu |
|---|---|---|
| Richart et al. (1928) [31] | - | |
| Samaan et al. (1998) [32] | ||
| Xiao and Wu (2003) [13] | ||
| Lam and Teng (2003) [6] | ||
| Teng et al. (2009) [11] | ||
| Niedermeier (2009) [33] | ||
| Authors | Confined Concrete Compressive Strength fcc | Ultimate Axial Compressive Strain εccu |
|---|---|---|
| Eid and Paultre (2008) [3] | ||
| Pellegrino and Modena (2010) [8] | ||
| Niedermeier (2009) [33] | ||
| Type | Nominal Diameter | Ribbing | Yield Strength fym | Tensile Strength ftm | Modulus of Elasticity | Rupture Strain |
|---|---|---|---|---|---|---|
| [mm] | [-] | [MPa] | [MPa] | [GPa] | [%] | |
| T4 | 4 | yes | 550 | 610 | 196 | 8 |
| T6 | 6 | |||||
| T8 | 8 | |||||
| T10 | 10 | |||||
| T12 | 12 | 500 | 608 | 194 | 14 | |
| T5 | 5 | 670 | 725 | 205 | - | |
| T6NR | 6 | no | 730 | 760 | - | 12 |
| CFRP type | Density | Axial Tensile Strength | Axial Modulus of Elasticity | Rupture Strain (axial) | Weight Per Square Meter |
|---|---|---|---|---|---|
| [-] | [g/m3] | [MPa] | [GPa] | [%] | [g/m2] |
| M1 | 1.80 | 3900 | 230 | 1.70 | 200 |
| M2 | 1.80 | 4100 | 230 | 1.78 | 220 |
| M3 | 1.79 | 4800 | 240 | 2.00 | 200 |
| Series (3 specimens) | Concrete Strength | Dia Meter | Height | CFRP Confinement | Transverse Reinforcement | ||||
|---|---|---|---|---|---|---|---|---|---|
| fc0 | D | h | Material | Layers | tj | Type | s | Geometry | |
| [MPa] | [mm] | [mm] | [-] | [mm] | [mm] | ||||
| D15-P-M1-1L-1 | 36.9 | 150 | 300 | M1 | 1 | 0.111 | - | - | - |
| D15-P-M1-1L-2 | 36.9 | 150 | 300 | M1 | 1 | 0.111 | - | - | - |
| D15-P-M1-2L-1 | 36.9 | 150 | 300 | M1 | 2 | 0.222 | - | - | - |
| D15-P-M2-2L-2 | 16.5 | 150 | 300 | M2 | 2 | 0.244 | - | - | - |
| D15-P-M2-2L-3 | 34.7 | 150 | 300 | M2 | 2 | 0.244 | - | - | - |
| D15-P-M2-2L-4 | 42.3 | 150 | 300 | M2 | 2 | 0.222 | - | - | - |
| D15-P-M2-2L-5 | 52.7 | 150 | 300 | M2 | 2 | 0.244 | - | - | - |
| D15-P-M2-2L-6 | 39.8 | 150 | 300 | M2 | 2 | 0.244 | - | - | - |
| D15-P-M1-3L-1 | 36.9 | 150 | 300 | M1 | 3 | 0.333 | - | - | - |
| D15-TR-M1-2L-1 | 42.3 | 150 | 300 | M1 | 2 | 0.222 | T6 | 100 | Tie |
| D15-TR-M1-2L-2 | 42.3 | 150 | 300 | M1 | 2 | 0.222 | T6 | 50 | Tie |
| D20-P-M1-1L-1 | 27.0 | 200 | 400 | M1 | 1 | 0.111 | - | - | - |
| D20-P-M3-1L-2 | 24.5 | 200 | 400 | M3 | 1 | 0.112 | - | - | - |
| D20-P-M1-2L-1 | 27.0 | 200 | 400 | M1 | 2 | 0.222 | - | - | - |
| D20-P-M3-2L-2 | 24.5 | 200 | 400 | M3 | 2 | 0.223 | - | - | - |
| D20-P-M1-3L-1 | 27.0 | 200 | 400 | M1 | 3 | 0.444 | - | - | - |
| D20-P-M3-3L-2 | 24.5 | 200 | 400 | M3 | 3 | 0.447 | - | - | - |
| D20-TR-M1-2L-1 | 27.0 | 200 | 400 | M1 | 2 | 0.222 | T4 | 175 | Tie |
| D20-TR-M1-2L-2 | 27.0 | 200 | 400 | M1 | 2 | 0.222 | T6 | 175 | Tie |
| D20-TR-M2-2L-3a | 28.0 | 200 | 400 | M2 | 2 | 0.244 | T6 | 100 | Tie |
| D20-TR-M2-2L-3b | 28.0 | 200 | 400 | M2 | 2 | 0.244 | T6 | 100 | Tie |
| D20-TR-M2-2L-3c | 28.0 | 200 | 400 | M2 | 2 | 0.244 | T6 | 100 | Tie |
| D20-TR-M2-2L-4 | 28.0 | 200 | 400 | M2 | 2 | 0.244 | T6 | 50 | Tie |
| D20-TR-M2-1L-1 | 24.5 | 200 | 400 | M2 | 1 | 0.122 | T6 | 75 | Tie |
| D20-TR-M2-1L-2 | 24.5 | 200 | 400 | M2 | 1 | 0.122 | T6NR | 75 | Tie |
| D20-TR-M2-1L-3 | 24.5 | 200 | 400 | M2 | 1 | 0.122 | T5 | 50 | Tie |
| D25-P-M1-1L-1 | 28.1 | 250 | 500 | M1 | 1 | 0.111 | - | - | - |
| D25-P-M1-2L-1 | 38.0 | 250 | 500 | M1 | 2 | 0.222 | - | - | - |
| D25-P-M1-3L-1 | 38.0 | 250 | 500 | M1 | 3 | 0.333 | - | - | - |
| D25-P-M1-4L-1 | 33.0 | 250 | 500 | M1 | 4 | 0.444 | - | - | - |
| D25-SR-M1-1L-1 | 33.0 | 250 | 500 | M1 | 1 | 0.111 | T8 | 40 | Spiral |
| D25-SR-M1-2L-1 | 39.0 | 250 | 500 | M1 | 2 | 0.222 | T8 | 40 | Spiral |
| D25-SR-M1-2L-2 | 28.1 | 250 | 500 | M1 | 2 | 0.222 | T10 | 40 | Spiral |
| D25-SR-M1-2L-3 | 31.2 | 250 | 1000 | M1 | 2 | 0.222 | T8 | 40 | Spiral |
| D25-SR-M1-3L-1 | 39.0 | 250 | 500 | M1 | 3 | 0.333 | T8 | 40 | Spiral |
| D25-TR-M1-2L-1 | 33.0 | 250 | 500 | M1 | 2 | 0.222 | T6 | 100 | Tie |
| D25-TR-M1-2L-2 | 31.2 | 250 | 1000 | M1 | 2 | 0.222 | T6 | 100 | Tie |
| D30-P-M1-2L-1 | 30.8 | 300 | 600 | M1 | 2 | 0.222 | - | - | - |
| D30-P-M1-3L-1 | 30.8 | 300 | 600 | M1 | 3 | 0.333 | - | - | - |
| D30-SR-M1-2L-1 | 31.0 | 300 | 600 | M1 | 2 | 0.222 | T10 | 40 | Spiral |
| D30-SR-M1-2L-2 | 31.0 | 300 | 600 | M1 | 2 | 0.222 | T10 | 55 | Spiral |
| Series | Specimens | fc0 | fcc | εccu | E2,t | E2 | ν2 | k1 | kε |
|---|---|---|---|---|---|---|---|---|---|
| [MPa] | [MPa] | [%] | [MPa] | [MPa] | [-] | [-] | [-] | ||
| D15-P-M1-1L-1 | 1 | 36.9 | 42.23 | 0.761 | 497 | 960 | 1.857 | 1.581 | 0.546 |
| 2 | 45.34 | 0.939 | 750 | 1112 | 1.747 | 2.196 | 0.649 | ||
| 3 | 47.39 | 1.017 | 647 | 1094 | 1.681 | 1.893 | 0.737 | ||
| Mean: | 44.99 | 0.906 | 631 | 1055 | 1.762 | 1.890 | 0.644 | ||
| D15-P-M1-1L-2 | 1 | 36.9 | 44.90 | 0.868 | 670 | 1039 | 1.532 | 1.974 | 0.590 |
| 2 | 46.72 | 1.001 | 536 | 999 | 1.800 | 1.553 | 0.867 | ||
| 3 | 44.11 | 0.890 | 517 | 1008 | 1.948 | 1.739 | 0.767 | ||
| Mean: | 45.24 | 0.920 | 574 | 1015 | 1.760 | 1.755 | 0.741 | ||
| D15-P-M1-2L-1 | 1 | 36.9 | 55.43 | 1.089 | 1996 | 2079 | 1.033 | 3.031 | 0.516 |
| 2 | 61.87 | 1.450 | 2166 | 2018 | 0.897 | 3.210 | 0.625 | ||
| 3 | 62.82 | 1.480 | 1932 | 2055 | 1.047 | 2.855 | 0.749 | ||
| Mean: | 60.04 | 1.340 | 2031 | 2051 | 0.992 | 3.032 | 0.630 | ||
| D15-P-M2-2L-2 | 1 | 16.5 | 54.16 | 3.138 | 3273 | 1209 | 0.394 | 4.270 | 0.600 |
| 2 | 54.53 | 2.908 | 2854 | 1292 | 0.533 | 3.807 | 0.743 | ||
| 3 | 47.02 | 2.730 | 3120 | 1266 | 0.395 | 4.295 | 0.522 | ||
| Mean: | 51.90 | 2.925 | 3082 | 1256 | 0.441 | 4.124 | 0.622 | ||
| D15-P-M2-2L-3 | 1 | 34.7 | 64.07 | 1.652 | 2553 | 1895 | 0.811 | 3.339 | 0.651 |
| 2 | 67.37 | 1.920 | 2754 | 1862 | 0.956 | 3.674 | 0.729 | ||
| 3 | 69.73 | 2.030 | 2634 | 1757 | 0.894 | 3.514 | 0.752 | ||
| Mean: | 67.06 | 1.867 | 2647 | 1838 | 0.887 | 3.509 | 0.711 | ||
| D15-P-M2-2L-4 | 1 | 42.3 | 72.68 | 1.570 | 1867 | 2023 | 1.115 | 2.715 | 0.885 |
| 2 | 67.36 | 1.240 | 1750 | 2135 | 1.325 | 2.495 | 0.737 | ||
| 3 | 68.36 | 1.390 | 1956 | 2221 | 1.253 | 2.789 | 0.758 | ||
| Mean: | 69.47 | 1.400 | 1858 | 2126 | 1.231 | 2.666 | 0.793 | ||
| D15-P-M2-2L-5 | 1 | 52.7 | 75.25 | 1.397 | 1255 | 1470 | 1.499 | 2.046 | 0.785 |
| 2 | 71.07 | 1.235 | 989 | 1291 | 1.561 | 1.919 | 0.785 | ||
| Mean: | 73.16 | 1.316 | 1122 | 1381 | 1.530 | 1.983 | 0.785 | ||
| D15-P-M2-2L-6 | 1 | 39.8 | 69.55 | 1.820 | 1949 | 1758 | 1.009 | 2.514 | 0.505 |
| 2 | 66.42 | 1.938 | 1773 | 1602 | 1.031 | 2.352 | 0.841 | ||
| 3 | 67.85 | 1.926 | 2124 | 1672 | 0.987 | 2.676 | 0.774 | ||
| Mean: | 67.94 | 1.895 | 1949 | 1677 | 1.009 | 2.514 | 0.707 | ||
| D15-P-M1-3L-1 | 1 | 36.9 | 81.16 | 1.867 | 3180 | 2672 | 0.825 | 3.125 | 0.722 |
| 2 | 80.43 | 1.869 | 3482 | 2432 | 0.754 | 3.497 | 0.699 | ||
| 3 | 81.05 | 2.125 | 3137 | 2350 | 0.795 | 3.087 | 0.719 | ||
| Mean: | 80.88 | 1.954 | 3266 | 2485 | 0.791 | 3.236 | 0.713 | ||
| D20-P-M1-1L-1 | 1 | 27.0 | 36.68 | 1.128 | 559 | 928 | 1.626 | 2.189 | 0.802 |
| 2 | 37.39 | 1.226 | 679 | 893 | 1.311 | 2.654 | 0.790 | ||
| 3 | 36.66 | 1.000 | 625 | 1066 | 2.035 | 2.446 | 0.814 | ||
| Mean: | 36.91 | 1.118 | 621 | 962 | 1.657 | 2.430 | 0.802 | ||
| D20-P-M3-1L-2 | 1 | 24.5 | 39.17 | 0.824 | 563 | 1230 | 2.074 | 2.177 | 0.400 |
| 2 | 42.25 | 0.949 | 932 | 1447 | 1.986 | 3.174 | 0.475 | ||
| 3 | 39.73 | 0.741 | 1059 | 1816 | 1.920 | 3.303 | 0.420 | ||
| Mean: | 40.38 | 0.838 | 851 | 1498 | 1.993 | 2.885 | 0.432 | ||
| D20-P-M1-2L-1 | 1 | 27.0 | 45.81 | 1.266 | 1600 | 1810 | 1.089 | 3.253 | 0.661 |
| 2 | 54.16 | 1.738 | 2220 | 2057 | 0.963 | 4.349 | 0.743 | ||
| 3 | 53.99 | 1.681 | 2084 | 2017 | 0.961 | 4.150 | 0.767 | ||
| Mean: | 51.32 | 1.562 | 1968 | 1961 | 1.004 | 3.917 | 0.724 | ||
| D20-P-M3-2L-2 | 1 | 24.5 | 58.29 | 1.411 | 2126 | 2065 | 1.146 | 4.337 | 0.530 |
| 2 | 61.90 | 1.653 | 2032 | 1977 | 1.218 | 4.048 | 0.640 | ||
| 3 | 48.99 | 1.018 | 2399 | 2597 | 1.091 | 4.825 | 0.370 | ||
| Mean: | 56.39 | 1.361 | 2186 | 2213 | 1.152 | 4.403 | 0.513 | ||
| D20-P-M1-3L-1 | 1 | 27.0 | 71.72 | 2.140 | 3584 | 2705 | 0.752 | 4.509 | 0.729 |
| 2 | 71.15 | 2.264 | 3136 | 2305 | 0.772 | 3.738 | 0.749 | ||
| 3 | 71.30 | 2.350 | 3440 | 2254 | 0.648 | 4.077 | 0.721 | ||
| Mean: | 71.39 | 2.251 | 3387 | 2421 | 0.724 | 4.108 | 0.733 | ||
| D20-P-M3-3L-2 | 1 | 24.5 | 67.24 | 1.614 | 3151 | 2244 | 0.802 | 4.128 | 0.480 |
| 2 | 68.77 | 1.570 | 2788 | 2457 | 1.004 | 3.597 | 0.500 | ||
| 3 | 76.45 | 2.000 | 3156 | 2286 | 0.966 | 4.146 | 0.625 | ||
| Mean: | 70.82 | 1.728 | 3032 | 2329 | 0.924 | 3.957 | 0.535 | ||
| D25-P-M1-1L-1 | 1 | 28.1 | 30.11 | 0.834 | 600 | 1027 | 1.724 | 2.933 | 0.722 |
| 2 | 29.92 | 0.893 | 660 | 1049 | 1.582 | 3.231 | 0.696 | ||
| 3 | 29.85 | 0.894 | 1033 | 1202 | 1.130 | 5.088 | 0.484 | ||
| Mean: | 29.96 | 0.874 | 764 | 1093 | 1.479 | 3.751 | 0.634 | ||
| D25-P-M1-2L-1 | 1 | 38.0 | 44.87 | 0.798 | 675 | 991 | 1.994 | 1.650 | 0.413 |
| 2 | 46.33 | 0.905 | 634 | 1000 | 1.584 | 1.550 | 0.590 | ||
| 3 | 44.20 | 0.877 | 429 | 550 | 1.091 | 1.050 | 0.413 | ||
| Mean: | 45.13 | 0.860 | 579 | 847 | 1.556 | 1.417 | 0.472 | ||
| D25-P-M1-3L-1 | 1 | 38.0 | 59.54 | 1.511 | 1564 | 1820 | 1.151 | 2.551 | 0.678 |
| 2 | 56.89 | 1.300 | 1692 | 1727 | 1.030 | 2.759 | 0.548 | ||
| 3 | 56.94 | 1.195 | 1437 | 1709 | 1.224 | 2.343 | 0.590 | ||
| Mean: | 57.79 | 1.335 | 1564 | 1752 | 1.135 | 2.551 | 0.605 | ||
| D25-P-M1-4L-1 | 1 | 33.0 | 75.80 | 2.270 | 3140 | 2448 | 0.804 | 3.870 | 0.826 |
| 2 | 66.20 | 1.840 | 2890 | 2249 | 0.850 | 3.571 | 0.708 | ||
| 3 | 77.80 | 2.470 | 3314 | 2503 | 0.783 | 4.121 | 0.826 | ||
| Mean: | 73.27 | 2.193 | 3115 | 2400 | 0.812 | 3.854 | 0.787 | ||
| D30-P-M1-2L-1 | 1 | 30.8 | 41.50 | 1.206 | 719 | 1152 | 1.580 | 2.167 | 0.944 |
| 2 | 40.85 | 1.115 | 1178 | 1476 | 1.146 | 3.690 | 0.578 | ||
| 3 | 43.33 | 1.319 | 860 | 1371 | 1.432 | 2.909 | 0.885 | ||
| Mean: | 41.89 | 1.213 | 919 | 1333 | 1.386 | 2.922 | 0.802 | ||
| D30-P-M1-3L-1 | 1 | 30.8 | 50.75 | 1.459 | 1657 | 1859 | 1.126 | 3.280 | 0.740 |
| 2 | 51.08 | 1.539 | 1852 | 1869 | 1.007 | 3.645 | 0.708 | ||
| 3 | 47.68 | 1.345 | 1991 | 1876 | 0.880 | 3.957 | 0.546 | ||
| Mean: | 49.84 | 1.448 | 1833 | 1868 | 1.004 | 3.627 | 0.665 |
| Series | ρj | flj | Ejl | Ejl/fc0 | Ejl/fc02 | flj/fc0 |
|---|---|---|---|---|---|---|
| [%] | [MPa] | [MPa] | [-] | [-] | [-] | |
| D15-P-M1-1L-1 | 0.296 | 4.00 | 340 | 9.24 | 0.250 | 0.109 |
| D15-P-M1-1L-2 | 0.296 | 4.00 | 340 | 9.24 | 0.250 | 0.109 |
| D15-P-M1-2L-1 | 0.593 | 8.01 | 682 | 18.474 | 0.501 | 0.217 |
| D15-P-M2-2L-2 | 0.652 | 9.44 | 750 | 45.38 | 2.747 | 0.571 |
| D15-P-M2-2L-3 | 0.652 | 9.44 | 750 | 21.63 | 0.624 | 0.272 |
| D15-P-M2-2L-4 | 0.593 | 8.01 | 682 | 16.13 | 0.382 | 0.190 |
| D15-P-M2-2L-5 | 0.652 | 9.44 | 750 | 14.22 | 0.270 | 0.179 |
| D15-P-M2-2L-6 | 0.652 | 9.44 | 750 | 18.83 | 0.473 | 0.237 |
| D15-P-M1-3L-1 | 0.889 | 12.02 | 1022 | 27.71 | 0.751 | 0.326 |
| D20-P-M1-1L-1 | 0.222 | 3.00 | 256 | 9.48 | 0.352 | 0.111 |
| D20-P-M3-1L-2 | 0.223 | 2.65 | 268 | 10.92 | 0.445 | 0.108 |
| D20-P-M1-2L-1 | 0.444 | 6.00 | 511 | 18.96 | 0.703 | 0.223 |
| D20-P-M3-2L-2 | 0.447 | 5.30 | 536 | 21.85 | 0.890 | 0.216 |
| D20-P-M1-3L-1 | 0.733 | 10.62 | 843 | 31.28 | 1.160 | 0.394 |
| D20-P-M3-3L-2 | 0.670 | 7.94 | 805 | 32.77 | 1.335 | 0.323 |
| D25-P-M1-1L-1 | 0.178 | 2.40 | 204 | 7.28 | 0.259 | 0.086 |
| D25-P-M1-2L-1 | 0.356 | 4.81 | 409 | 10.76 | 0.283 | 0.126 |
| D25-P-M1-3L-1 | 0.533 | 7.21 | 613 | 16.14 | 0.425 | 0.190 |
| D25-P-M1-4L-1 | 0.711 | 9.61 | 818 | 24.77 | 0.750 | 0.291 |
| D30-P-M1-2L-1 | 0.296 | 4.00 | 341 | 11.06 | 0.359 | 0.130 |
| D30-P-M1-3L-1 | 0.444 | 6.00 | 511 | 16.59 | 0.538 | 0.195 |
| Source | FRP-Confined Plain Concrete | FRP-Confined Reinforced Concrete | |
|---|---|---|---|
| Niedermeier | [33,40] | kε = 0.66, kεk = 0.50 | kε = 0.50, kεk = 0.25 |
| Lam and Teng | [6,23] | kε = 0.586 (Carbon), kε = 0.669 (Glass) | no information |
| Toutanji et al. | [41] | kε = 0.6 | no information |
| Smith et al. | [21] | kε = 0.8 | no information |
| Pellegrino and Modena | [8] | ||
| CFRP Sheet | Vx | γj |
|---|---|---|
| M1 | 0.200 | 1.59 |
| M2 | 0.155 | 1.50 |
| M3 | 0.189 | 1.57 |
| Recommendation/Code | γj | |
|---|---|---|
| CNR-DT 200 R1/2013 | [27] | 1.21 |
| GB 50608-2010 | [28] | 1.40 |
| DAfStb-Guideline | [30] | 1.35 |
| fib Technical Report | [44] | 1.35 |
| Series | Specimens | fc0 | ke | fl(j+w) | fcc | Δfcc | εccu | E2,t | ν2 |
|---|---|---|---|---|---|---|---|---|---|
| [MPa] | [-] | [MPa] | [MPa] | [MPa] | [%] | [MPa] | [-] | ||
| D15-TR-M1-2L-1 | 1 | 42.3 | 0.352 | 9.93 | 83.80 | 36.70 | 1.254 | 5178 | 0.873 |
| 2 | 89.46 | 42.36 | 1.680 | 5376 | 0.951 | ||||
| 3 | 86.15 | 39.05 | 1.720 | 4886 | 0.990 | ||||
| Mean: | 86.47 | 39.37 | 1.551 | 5147 | 0.938 | ||||
| D15-TR-M1-2L-2 | 1 | 42.3 | 0.182 | 8.51 | 83.25 | 36.16 | 1.620 | 3745 | 1.120 |
| 2 | 81.92 | 34.82 | 1.430 | 3129 | 1.293 | ||||
| 3 | 73.03 | 25.94 | 1.180 | 4485 | 0.996 | ||||
| Mean: | 79.40 | 32.31 | 1.410 | 3786 | 1.136 | ||||
| D20-TR-M1-2L-1 | 1 | 27.0 | 0.154 | 6.08 | 65.08 | 27.08 | 1.980 | 3241 | 0.814 |
| 2 | 69.37 | 31.37 | 2.176 | 2595 | 0.930 | ||||
| 3 | 67.76 | 29.76 | 2.106 | 2552 | 0.959 | ||||
| Mean: | 67.40 | 29.40 | 2.087 | 2796 | 0.901 | ||||
| D20-TR-M1-2L-2 | 1 | 27.0 | 0.146 | 6.17 | 64.99 | 26.99 | 1.977 | 3216 | 0.655 |
| 2 | 64.43 | 26.43 | 1.915 | 2602 | 0.784 | ||||
| 3 | 60.75 | 22.75 | 1.746 | 2839 | 0.749 | ||||
| Mean: | 63.93 | 25.39 | 1.879 | 2886 | 0.729 | ||||
| D20-TR-M2-2L-3a | 1 | 28.0 | 0.325 | 7.69 | 66.10 | 30.77 | 1.660 | 3945 | 0.647 |
| 2 | 68.70 | 33.38 | 1.630 | 3476 | 0.736 | ||||
| 3 | 67.05 | 31.72 | 1.690 | 2860 | 0.971 | ||||
| Mean: | 67.28 | 31.96 | 1.660 | 3427 | 0.785 | ||||
| D20-TR-M2-2L-3b | 1 | 28.0 | 0.325 | 7.69 | 72.80 | 33.75 | 1.690 | 3298 | 0.937 |
| 2 | 75.91 | 36.85 | 1.860 | 3277 | 0.895 | ||||
| 3 | 72.84 | 33.78 | 1.660 | 3339 | 0.882 | ||||
| Mean: | 73.85 | 34.79 | 1.737 | 3305 | 0.905 | ||||
| D20-TR-M2-2L-3c | 1 | 28.0 | 0.325 | 7.69 | 76.32 | 33.47 | 1.781 | 3631 | 0.811 |
| 2 | 77.08 | 34.23 | 1.796 | 4370 | 0.769 | ||||
| 3 | 78.39 | 35.54 | 1.926 | 3524 | 0.781 | ||||
| Mean: | 77.26 | 34.41 | 1.834 | 3842 | 0.787 | ||||
| D20-TR-M2-2L-4 | 1 | 28.0 | 0.483 | 8.91 | 76.97 | 37.92 | 1.877 | 3738 | 0.727 |
| 2 | 77.06 | 38.00 | 1.834 | 4424 | 0.654 | ||||
| 3 | 78.06 | 39.00 | 1.867 | 3973 | 0.709 | ||||
| Mean: | 77.36 | 38.31 | 1.859 | 4045 | 0.697 | ||||
| D20-TR-M2-1L-1 | 1 | 24.5 | 0.400 | 4.55 | 51.64 | 26.29 | 1.094 | 2830 | 0.880 |
| 2 | 54.32 | 28.97 | 1.257 | 3190 | 0.865 | ||||
| Mean: | 52.98 | 27.63 | 1.176 | 3010 | 0.873 | ||||
| D20-TR-M2-1L-2 | 1 | 24.5 | 0.490 | 5.10 | 49.07 | 23.71 | 1.065 | 2452 | 0.941 |
| 2 | 57.04 | 31.69 | 1.180 | 2043 | 1.228 | ||||
| 3 | 56.68 | 31.33 | 1.249 | 2303 | 1.072 | ||||
| Mean: | 54.26 | 28.91 | 1.165 | 2266 | 1.080 | ||||
| D20-TR-M2-1L-3 | 1 | 24.5 | 0.400 | 4.92 | 56.65 | 31.30 | 1.193 | 3871 | 0.783 |
| 2 | 57.77 | 32.42 | 1.310 | 3129 | 0.921 | ||||
| 3 | 52.07 | 26.71 | 1.450 | 3621 | 0.891 | ||||
| Mean: | 55.50 | 30.14 | 1.318 | 3540 | 0.865 | ||||
| D25-SR-M1-1L-1 | 1 | 33.0 | 0.590 | 6.25 | 60.65 | 20.62 | 1.473 | 3125 | 0.799 |
| 2 | 59.80 | 19.77 | 1.490 | - | - | ||||
| 3 | 60.84 | 20.81 | 1.616 | 3361 | 0.780 | ||||
| Mean: | 60.43 | 20.40 | 1.526 | 3243 | 0.790 | ||||
| D25-SR-M1-2L-1 | 1 | 39.0 | 0.590 | 8.65 | 76.51 | 30.50 | 1.850 | 3140 | 0.776 |
| 2 | 75.79 | 29.78 | 1.966 | 3140 | 0.835 | ||||
| 3 | 76.69 | 30.68 | 2.036 | 3412 | 0.811 | ||||
| Mean: | 76.33 | 30.32 | 1.951 | 3230 | 0.807 | ||||
| D25-SR-M1-2L-2 | 1 | 28.1 | 0.578 | 10.75 | - | - | - | 5257 | 0.475 |
| 2 | - | - | - | 4634 | 0.503 | ||||
| 3 | - | - | - | 4783 | 0.476 | ||||
| Mean: | - | - | - | 4891 | 0.485 | ||||
| D25-SR-M1-2L-3 | 1 | 31.2 | 0.590 | 8.65 | 68.08 | 29.86 | 1.911 | 3538 | 0.632 |
| 2 | 68.96 | 30.74 | 2.214 | 4374 | 0.490 | ||||
| Mean: | 68.52 | 30.30 | 2.063 | 3956 | 0.561 | ||||
| D25-SR-M1-3L-1 | 1 | 39.0 | 0.590 | 11.06 | 87.95 | 41.94 | 2.350 | 4545 | 0.583 |
| 2 | 87.25 | 41.24 | 2.220 | 4603 | 0.589 | ||||
| 3 | 85.88 | 39.87 | 2.100 | 4377 | 0.616 | ||||
| Mean: | 87.03 | 41.02 | 2.223 | 4508 | 0.596 | ||||
| D25-TR-M1-2L-1 | 1 | 33.0 | 0.430 | 5.43 | 60.90 | 20.86 | 1.800 | 2884 | 0.832 |
| 2 | 57.57 | 17.54 | 1.605 | 2726 | 0.786 | ||||
| 3 | 50.83 | 10.80 | 1.258 | 2338 | 0.991 | ||||
| Mean: | 56.43 | 16.40 | 1.554 | 2649 | 0.870 | ||||
| D25-TR-M1-2L-2 | 1 | 31.2 | 0.430 | 5.43 | 54.02 | 15.80 | 1.466 | 2870 | 0.731 |
| 2 | 50.83 | 12.61 | 1.289 | 2968 | 0.704 | ||||
| 3 | 54.64 | 16.42 | 1.564 | 2845 | 0.717 | ||||
| Mean: | 53.16 | 14.94 | 1.440 | 2894 | 0.717 | ||||
| D30-SR-M1-2L-1 | 1 | 31.0 | 0.651 | 7.44 | - | - | - | 4922 | 0.480 |
| 2 | - | - | - | 4846 | 0.521 | ||||
| 3 | - | - | - | 4380 | 0.577 | ||||
| Mean: | - | - | - | 4716 | 0.526 | ||||
| D30-SR-M1-2L-2 | 1 | 31.0 | 0.601 | 7.63 | - | - | - | 4832 | 0.473 |
| 2 | 65.20 | 29.34 | 1.880 | 3813 | 0.587 | ||||
| 3 | - | - | - | 3888 | 0.600 | ||||
| Mean: | 65.20 | 29.34 | 1.880 | 4178 | 0.553 |
| Series | flj | fl,wy | Asl | σsl | fl(j+w)/fc0 |
|---|---|---|---|---|---|
| [MPa] | [MPa] | [mm2] | [MPa] | [-] | |
| D15-TR-M1-2L-1 | 8.01 | 1.92 | 170 | 4.85 | 0.235 |
| D15-TR-M1-2L-2 | 8.01 | 0.50 | 170 | 4.85 | 0.201 |
| D20-TR-M1-2L-1 | 6.01 | 0.07 | 679 | 11.04 | 0.226 |
| D20-TR-M1-2L-2 | 6.01 | 0.16 | 679 | 11.04 | 0.229 |
| D20-TR-M2-2L-3a | 7.08 | 0.62 | 452 | 7.31 | 0.275 |
| D20-TR-M2-2L-3b | 7.08 | 0.62 | 679 | 11.04 | 0.275 |
| D20-TR-M2-2L-3c | 7.08 | 0.62 | 905 | 14.83 | 0.275 |
| D20-TR-M2-2L-4 | 7.08 | 1.83 | 679 | 11.04 | 0.318 |
| D20-TR-M2-1L-1 | 3.54 | 1.01 | 50 | 0.80 | 0.185 |
| D20-TR-M2-1L-2 | 3.54 | 1.56 | 50 | 0.80 | 0.208 |
| D20-TR-M2-1L-3 | 3.54 | 1.38 | 50 | 0.80 | 0.200 |
| D25-SR-M1-1L-1 | 2.40 | 3.85 | 679 | 7.01 | 0.189 |
| D25-SR-M1-2L-1 | 4.81 | 3.85 | 679 | 7.01 | 0.222 |
| D25-SR-M1-2L-2 | 4.81 | 5.94 | 679 | 7.01 | 0.383 |
| D25-SR-M1-2L-3 | 4.81 | 3.85 | 679 | 7.01 | 0.277 |
| D25-SR-M1-3L-1 | 7.21 | 3.85 | 679 | 7.01 | 0.283 |
| D25-TR-M1-2L-1 | 4.81 | 0.63 | 679 | 7.01 | 0.164 |
| D25-TR-M1-2L-2 | 4.81 | 0.63 | 679 | 7.01 | 0.174 |
| D30-SR-M1-2L-1 | 4.01 | 3.43 | 679 | 4.85 | 0.240 |
| D30-SR-M1-2L-2 | 4.01 | 3.63 | 679 | 4.85 | 0.246 |
| Authors | Used Materials | Number of Specimens 1 | ||
|---|---|---|---|---|
| Xiao and Wu | (2003) | [13] | CFRP 1: | 14 (U), 42 (U) k1 and ν2 analysis only |
| Ej = 96 GPa, εFRP = 1.64 %, tj,n=1 = 0.39 mm | ||||
| CFRP 2: | ||||
| Ej = 78 GPa, εFRP = 1.59 %, tj,n=1 = 0.56 mm | ||||
| Lee et al. | (2004) | [46] | CFRP: | 5 (U), 15 (R) |
| Ej = 250 GPa, εFRP = 1.80 %, tj,n=1 = 0.11 mm | ||||
| Spiral Reinforcement: | ||||
| fy = 1200 MPa, Dc = 130 mm | ||||
| No Longitudinal Reinforcement | ||||
| Matthys et al. | (2005) | [47] | CFRP 1 (C240): | 5 (R) |
| Ej = 198 GPa, εFRP = 1.31 % | ||||
| CFRP 2 (C640): | ||||
| Ej = 480 GPa, εFRP = 0.23 % | ||||
| GFRP (TU600/25): | ||||
| Ej = 60 GPa, εFRP = 1.30 % | ||||
| Hybrid (TU360G160C/27G): | ||||
| Ej = 120 GPa, εFRP = 0.92 % | ||||
| Transverse Reinforcement: | ||||
| fy = 560 MPa, Dc = 370 mm | ||||
| Longitudinal Reinforcement: | ||||
| fy = 620 MPa, n = 10, Ø = 12 mm | ||||
| Lam et al. | (2004/2006) | [48,49] | CFRP (C): | 18 (U) |
| Ej = 230 GPa, εFRP = 1.49 %, tj,n=1 = 0.165 mm | ||||
| GFRP (G): | ||||
| Ej = 22 GPa, εFRP = 2.00 %, tj,n=1 = 1.27 mm | ||||
| Ilki et al. | (2008) | [50] | CFRP: | 4 (R) |
| Ej = 230 GPa, εFRP = 1.50 %, tj,n=1 = 0.165 mm | ||||
| Transverse Reinforcement: | ||||
| fy = 476 MPa, Dc = 200 mm | ||||
| Longitudinal Reinforcement: | ||||
| fy = 367 MPa, n = 6, Ø = 10 mm | ||||
| Eid et al. | (2009) | [4] | CFRP: | 36 (U), 15 (R) |
| Ej = 78 GPa, εFRP = 1.35 %, tj,n=1 = 0.38 mm | ||||
| Transverse Reinforcement: | ||||
| fy = 456 MPa, Dc = 253 mm | ||||
| Longitudinal Reinforcement: | ||||
| fy = 423 MPa, n = 6, Ø = 16 mm | ||||
| Series | Specimens | D | fc0 | tj | flj | fcc | εccu | E2,t | kε | k1 | ν2 |
|---|---|---|---|---|---|---|---|---|---|---|---|
| [mm] | [MPa] | [mm] | [MPa] | [MPa] | [%] | [MPa] | [-] | [-] | [-] | ||
| Xiao and Wu (2003) [13] | |||||||||||
| CFRP1-1L | 1 | 152 | 33.7 | 0.39 | 4.68 | 48.0 | 1.35 | 1250 | 0.58 | - | - |
| 2 | 50.0 | 1.24 | 1417 | 0.70 | - | - | |||||
| 3 | 50.0 | 1.40 | 1583 | 0.61 | - | - | |||||
| Mean: | 49.3 | 1.33 | 1417 | 0.63 | - | - | |||||
| CFRP1-2L | 1 | 152 | 33.7 | 0.78 | 9.35 | 64.0 | 1.64 | 3167 | 0.55 | - | - |
| 2 | 72.0 | 2.17 | 3300 | 0.61 | - | - | |||||
| 3 | 75.0 | 2.25 | 3750 | 0.61 | - | - | |||||
| Mean: | 70.3 | 2.02 | 3406 | 0.59 | - | - | |||||
| CFRP1-3L | 1 | 152 | 33.7 | 1.17 | 14.03 | 83.0 | 2.48 | 5333 | 0.50 | - | - |
| 2 | 87.0 | 2.45 | 6000 | 0.49 | - | - | |||||
| 3 | 95.5 | 3.00 | 6500 | 0.55 | - | - | |||||
| Mean: | 88.5 | 2.64 | 5944 | 0.51 | - | - | |||||
| CFRP2-1L | 1 | 152 | 43.6 | 0.56 | 4.22 | 52.0 | 0.65 | 900 | 0.47 | - | - |
| 2 | 54.5 | 0.78 | 1000 | 0.48 | - | - | |||||
| 3 | - | - | - | - | - | - | |||||
| Mean: | 53.25 | 0.72 | 950 | 0.48 | - | - | |||||
| CFRP2-1,5L | 1 | 152 | 43.6 | 0.84 | 6.33 | 67.8 | 1.13 | 3150 | 0.45 | - | - |
| 2 | 72.5 | 1.24 | 3350 | 0.41 | - | - | |||||
| 3 | 76.0 | 1.37 | 3760 | 0.50 | - | - | |||||
| Mean: | 72.1 | 1.25 | 3420 | 0.45 | - | - | |||||
| Lee et al. (2004) [46] | |||||||||||
| S0F | 1 | 150 | 36.2 | 0.11 | 4.05 | 41.7 | 1.00 | 517 | 0.64 | 1.41 | - |
| 2 | 0.22 | 8.10 | 57.8 | 1.50 | 2381 | 0.51 | 3.25 | 0.67 | |||
| 3 | 0.33 | 12.14 | 69.1 | 2.00 | 3311 | 0.55 | 3.01 | 0.47 | |||
| 4 | 0.44 | 16.19 | 85.4 | 2.70 | 3854 | 0.69 | 2.63 | 0.54 | |||
| 5 | 0.55 | 20.24 | 104.3 | 3.10 | 5477 | 0.67 | 2.99 | 0.38 | |||
| Lam et al. (2004/2006) [48,49] | |||||||||||
| C1 | 1 | 152 | 35.9 | 0.165 | 4.88 | 50.4 | 1.27 | 1375 | 0.65 | 2.75 | 0.91 |
| 2 | 47.2 | 1.11 | 1375 | 0.67 | 2.75 | 1.09 | |||||
| 3 | 53.2 | 1.29 | 1813 | 0.77 | 3.63 | 0.83 | |||||
| Mean: | 50.3 | 1.22 | 1521 | 0.70 | 3.04 | 0.94 | |||||
| C2 | 1 | 152 | 35.9 | 0.330 | 9.76 | 68.7 | 1.68 | 3125 | 0.67 | 3.13 | 0.53 |
| 2 | 69.9 | 1.96 | 3125 | 0.65 | 3.13 | 0.54 | |||||
| 3 | 71.6 | 1.85 | 3438 | 0.69 | 3.44 | 0.55 | |||||
| Mean: | 70.1 | 1.83 | 3229 | 0.67 | 3.23 | 0.54 | |||||
| C3 | 1 | 152 | 34.3 | 0.495 | 14.64 | 82.6 | 2.05 | 5625 | 0.54 | 3.75 | 0.38 |
| 2 | 90.4 | 2.41 | 5363 | 0.61 | 3.58 | 0.42 | |||||
| 3 | 97.3 | 2.52 | 5938 | 0.66 | 3.96 | 0.40 | |||||
| Mean: | 90.1 | 2.33 | 5642 | 0.60 | 3,76 | 0.40 | |||||
| G1 | 1 | 152 | 38.5 | 1.27 | 6.36 | 56.2 | - | - | - | - | - |
| 2 | 51.9 | 1.32 | 800 | 0.71 | 2.41 | 1.25 | |||||
| 3 | 58.3 | 1.46 | 900 | 0.96 | 2.13 | 1.33 | |||||
| Mean: | 55.5 | 1.39 | 850 | 0.84 | 2.27 | 1.29 | |||||
| G2 | 1 | 152 | 38.5 | 2.54 | 12.72 | 75.7 | 2.46 | 2000 | 0.83 | 2.66 | 0.95 |
| 2 | 77.3 | 2.19 | 2227 | 0.88 | 2.97 | 0.89 | |||||
| 3 | 75.2 | - | - | - | - | - | |||||
| Mean: | 76.1 | 2.32 | 2114 | 0.86 | 2.82 | 0.92 | |||||
| CII-M | 1 | 152 | 38.9 | 0.33 | 9.76 | 76.8 | 1.91 | - | - | - | - |
| 2 | 79.1 | 2.08 | - | - | - | - | |||||
| 3 | 65.8 | 1.25 | - | - | - | - | |||||
| Mean: | 73.9 | 1.75 | - | - | - | - | |||||
| Eid et al. (2009) [4] | |||||||||||
| N1 | 1 | 152 | 32.1 | 0.381 | 3.83 | 39.0 | 1.00 | 1000 | 0.60 | 2.56 | 0.80 |
| 2 | 41.0 | 1.08 | 1083 | 0.62 | 2.77 | 0.92 | |||||
| 3 | 41.0 | 1.08 | 1083 | 0.62 | 2.77 | 0.92 | |||||
| Mean: | 40.3 | 1.05 | 1055 | 0.61 | 2.70 | 0.88 | |||||
| N2 | 1 | 152 | 32.1 | 0.762 | 7.65 | 58.0 | 2.00 | 2617 | 0.74 | 3.35 | 0.48 |
| 2 | 57.5 | 1.79 | 2500 | 0.67 | 3.20 | 0.50 | |||||
| 3 | 57.5 | 1.79 | 2583 | 0.69 | 3.30 | 0.51 | |||||
| Mean: | 57.7 | 1.86 | 2567 | 0.70 | 3.28 | 0.50 | |||||
| N3 | 1 | 152 | 33.6 | 1.143 | 11.48 | 72.5 | 2.23 | 4333 | 0.63 | 3.69 | 0.39 |
| 2 | 75.0 | 2.32 | 4417 | 0.65 | 3.77 | 0.40 | |||||
| 3 | 77.0 | 2.43 | 4583 | 0.65 | 3.91 | 0.40 | |||||
| Mean: | 74.8 | 2.33 | 4444 | 0.64 | 3.79 | 0.40 | |||||
| M1 | 1 | 152 | 48.0 | 0.381 | 3.83 | 57.0 | 0.62 | 500 | 0.58 | 1.28 | - |
| 2 | 60.5 | 0.66 | 500 | 0.66 | 1.28 | 1.75 | |||||
| 3 | 62.0 | 0.78 | 700 | 0.63 | 1.79 | 1.79 | |||||
| Mean: | 59.8 | 0.69 | 567 | 0.62 | 1.45 | 1.77 | |||||
| M2 | 1 | 152 | 48.0 | 0.762 | 7.65 | 79.5 | 1.23 | 2050 | 0.82 | 2.62 | 1.10 |
| 2 | 79.5 | 1.23 | 2050 | 0.82 | 2.62 | 1.14 | |||||
| 3 | 81.0 | 1.18 | 2500 | 0.98 | 3.20 | 1.03 | |||||
| Mean: | 80.0 | 1.21 | 2200 | 0.87 | 2.81 | 1.09 | |||||
| M3 | 1 | 152 | 48.0 | 1.143 | 11.48 | 97.0 | 1.48 | 3200 | 0.88 | 2.73 | 0.94 |
| 2 | 101.0 | 1.60 | 3200 | 1.06 | 2.73 | 1.04 | |||||
| 3 | 102.0 | 1.70 | 3200 | 1.06 | 2.73 | 1.07 | |||||
| Mean: | 100.0 | 1.59 | 3200 | 1.00 | 2.73 | 1.02 | |||||
| H11 | 1 | 152 | 67.7 | 0.381 | 3.83 | 57.5 | 0.63 | - | 0.59 | - | - |
| 2 | 61.5 | 0.67 | - | 0.73 | - | - | |||||
| 3 | 66.0 | 0.69 | - | 0.77 | - | - | |||||
| Mean: | 61.7 | 0.66 | - | 0.70 | - | - | |||||
| H12 | 1 | 152 | 67.7 | 0.762 | 7.65 | 72.5 | 0.89 | - | 0.71 | - | - |
| 2 | 83.0 | 1.08 | 417 | 0.91 | 0.53 | 1.90 | |||||
| 3 | 84.0 | 1.14 | 667 | 1.00 | 0.85 | 1.44 | |||||
| Mean: | 79.8 | 1.04 | 542 | 0.87 | 0.69 | 1.67 | |||||
| H13 | 1 | 152 | 75.9 | 1.143 | 11.48 | 89.0 | 1.01 | - | 0.87 | - | - |
| 2 | 97.0 | 1.08 | 750 | 0.74 | 0.64 | 1.56 | |||||
| 3 | 97.0 | 1.20 | 1083 | 0.89 | 0.92 | 1.19 | |||||
| Mean: | 94.3 | 1.10 | 917 | 0.83 | 0.78 | 1.38 | |||||
| H21 | 1 | 152 | 107.7 | 0.381 | 3.83 | 91.0 | 0.52 | - | 0.56 | - | - |
| 2 | 91.0 | 0.52 | - | 0.56 | - | - | |||||
| 3 | 92.5 | 0.54 | - | 0.53 | - | - | |||||
| Mean: | 91.5 | 0.53 | - | 0.55 | - | - | |||||
| H22 | 1 | 152 | 107.7 | 0.762 | 7.65 | 88.0 | 0.85 | - | 0.81 | - | - |
| 2 | 95.5 | 0.73 | - | 0.56 | - | - | |||||
| 3 | 105.5 | 0.79 | - | 0.67 | - | - | |||||
| Mean: | 96.3 | 0.79 | - | 0.68 | - | - | |||||
| H23 | 1 | 152 | 107.7 | 1.143 | 11.48 | 105.0 | 1.00 | - | 0.74 | - | - |
| 2 | 112.5 | 0.71 | - | 0.53 | - | - | |||||
| 3 | 117.0 | 0.88 | - | 0.65 | - | - | |||||
| Mean: | 111.5 | 0.86 | - | 0.64 | - | - | |||||
| Series | D | fc0 | tj | flj | s | Øw | ke | fl,wy | fcc | εccu |
|---|---|---|---|---|---|---|---|---|---|---|
| [mm] | [MPa] | [mm] | [MPa] | [mm] | [mm] | [-] | [MPa] | [MPa] | [%] | |
| Lee et al. (2004) [46] | ||||||||||
| S6F1 | 150 | 36.2 | 0.110 | 4.05 | 60 | 5.5 | 0.44 | 3.25 | 50.37 | 1.70 |
| S6F2 | 150 | 36.2 | 0.220 | 8.10 | 60 | 5.5 | 0.44 | 3.25 | 68.52 | 2.50 |
| S6F4 | 150 | 36.2 | 0.440 | 16.19 | 60 | 5.5 | 0.44 | 3.25 | 99.49 | 3.40 |
| S6F5 | 150 | 36.2 | 0.550 | 20.24 | 60 | 5.5 | 0.44 | 3.25 | 114.64 | 3.60 |
| S4F1 | 150 | 36.2 | 0.110 | 4.05 | 40 | 5.5 | 0.54 | 5.90 | 60.00 | 1.90 |
| S4F2 | 150 | 36.2 | 0.220 | 8.10 | 40 | 5.5 | 0.54 | 5.90 | 74.77 | 2.30 |
| S4F3 | 150 | 36.2 | 0.330 | 12.14 | 40 | 5.5 | 0.54 | 5.90 | 73.85 | 2.90 |
| S4F4 | 150 | 36.2 | 0.440 | 16.19 | 40 | 5.5 | 0.54 | 5.90 | 104.15 | 3.00 |
| S4F5 | 150 | 36.2 | 0.550 | 20.24 | 40 | 5.5 | 0.54 | 5.90 | 123.64 | 3.60 |
| S2F1 | 150 | 36.2 | 0.110 | 4.05 | 20 | 5.5 | 0.64 | 14.04 | 72.87 | 2.20 |
| S2F2 | 150 | 36.2 | 0.220 | 8.10 | 20 | 5.5 | 0.64 | 14.04 | 92.68 | 3.60 |
| S2F3 | 150 | 36.2 | 0.330 | 12.14 | 20 | 5.5 | 0.64 | 14.04 | 108.01 | 3.90 |
| S2F4 | 150 | 36.2 | 0.440 | 16.19 | 20 | 5.5 | 0.64 | 14.04 | 115.72 | 3.80 |
| S2F5 | 150 | 36.2 | 0.550 | 20.24 | 20 | 5.5 | 0.64 | 14.04 | 150.80 | 4.30 |
| Matthys et al. (2005) [47] | ||||||||||
| K2 | 400 | 34.3 | 0.585 | 4.64 | 140 | 8 | 0.53 | 0.59 | 59.36 | 1.20 |
| K3 | 400 | 34.3 | 0.940 | 5.89 | 140 | 8 | 0.53 | 0.59 | 59.60 | 0.43 |
| K4 | 400 | 39.3 | 1.800 | 4.21 | 140 | 8 | 0.53 | 0.59 | 60.32 | 0.69 |
| K5 | 400 | 39.3 | 0.600 | 1.40 | 140 | 8 | 0.53 | 0.59 | 42.38 | 0.38 |
| K8 | 400 | 39.1 | 0.492 | 1.49 | 140 | 8 | 0.53 | 0.59 | 49.58 | 0.60 |
| Ilki et al. (2008) [50] | ||||||||||
| NSR-C-050-3 | 250 | 27.6 | 0.495 | 9.51 | 50 | 8 | 0.45 | 2.22 | 77.59 | 3.40 |
| NSR-C-100-3 | 250 | 27.6 | 0.495 | 9.51 | 100 | 8 | 0.32 | 0.80 | 72.60 | 2.80 |
| NSR-C-145-3 | 250 | 27.6 | 0.495 | 9.51 | 145 | 8 | 0.23 | 0.39 | 71.95 | 3.30 |
| NSR-C-145-5 | 250 | 27.6 | 0.825 | 15.85 | 145 | 8 | 0.23 | 0.39 | 94.45 | 4.50 |
| Eid et al. (2009) [4] | ||||||||||
| A5NP2C | 303 | 29.4 | 0.762 | 3.84 | 150 | 9.5 | 0.31 | 0.72 | 46.13 | 0.63 |
| A3NP2C | 303 | 31.7 | 0.762 | 3.84 | 70 | 9.5 | 0.47 | 2.37 | 60.06 | 1.24 |
| A1NP2C | 303 | 31.7 | 0.762 | 3.84 | 45 | 9.5 | 0.53 | 4.14 | 63.39 | 1.51 |
| C4NP2C | 303 | 31.7 | 0.762 | 3.84 | 100 | 11.3 | 0.40 | 1.51 | 51.37 | 0.77 |
| C4N1P2C | 303 | 36.0 | 0.762 | 3.84 | 100 | 11.3 | 0.40 | 1.51 | 56.87 | 0.84 |
| C4NP4C | 303 | 31.7 | 1.524 | 7.68 | 100 | 11.3 | 0.40 | 1.51 | 75.83 | 2.08 |
| B4NP2C | 303 | 31.7 | 0.762 | 3.84 | 100 | 11.3 | 0.40 | 1.51 | 58.00 | 1.36 |
| C4MP2C | 303 | 50.8 | 0.762 | 3.84 | 100 | 11.3 | 0.40 | 1.51 | 75.36 | 0.88 |
| C2NP2C | 303 | 31.7 | 0.762 | 3.84 | 65 | 11.3 | 0.48 | 2.78 | 55.94 | 1.32 |
| C2N1P2C | 303 | 36.0 | 0.762 | 3.84 | 65 | 11.3 | 0.48 | 2.78 | 62.44 | 1.03 |
| C2N1P4C | 303 | 36.0 | 1.524 | 7.68 | 65 | 11.3 | 0.48 | 2.78 | 75.71 | 1.84 |
| C2N1P2N | 303 | 36.0 | 0.762 | 4.60 | 65 | 11.3 | 0.68 | 3.98 | 75.57 | 1.55 |
| C2MP2C | 303 | 50.8 | 0.762 | 3.84 | 65 | 11.3 | 0.48 | 2.78 | 78.90 | 1.04 |
| C2MP4C | 303 | 50.8 | 1.524 | 7.68 | 65 | 11.3 | 0.48 | 2.78 | 97.94 | 1.64 |
| C2MP2N | 303 | 50.8 | 0.762 | 4.60 | 65 | 11.3 | 0.68 | 3.98 | 62.45 | 1.29 |
| Ejl/fc0 | ν2 | Ejl/fc02 | k1 |
|---|---|---|---|
| [-] | [-] | [-] | [-] |
| 47.00 | 0.30 | 1.30 | 3.80 |
| 47.00 | 0.35 | 1.30 | 4.00 |
| 47.00 | 0.35 | 1.30 | 4.40 |
| 36.00 | 0.40 | 0.88 | 3.20 |
| 36.00 | 0.42 | 0.88 | 3.40 |
| 36.00 | 0.45 | 0.88 | 4.00 |
| 31.00 | 0.41 | 0.80 | 3.35 |
| 31.00 | 0.42 | 0.80 | 3.75 |
| 31.00 | 0.49 | 0.80 | 4.20 |
| 28.50 | 0.55 | 0.78 | 3.25 |
| 28.50 | 0.61 | 0.78 | 3.80 |
| 28.50 | 0.61 | 0.78 | 3.80 |
| 26.50 | 0.39 | 0.53 | 3.20 |
| 26.50 | 0.44 | 0.53 | 3.50 |
| 26.50 | 0.60 | 0.53 | 3.35 |
| 24.00 | 0.55 | 0.50 | 2.70 |
| 24.00 | 0.61 | 0.50 | 3.00 |
| 24.00 | 0.73 | 0.50 | 3.20 |
| 19.50 | 0.55 | 0.48 | 3.25 |
| 19.50 | 0.60 | 0.48 | 3.25 |
| 19.50 | 0.60 | 0.48 | 3.40 |
| 17.50 | 0.58 | 0.43 | 3.70 |
| 17.50 | 0.65 | 0.43 | 3.90 |
| 17.50 | 0.73 | 0.43 | 4.20 |
| 16.00 | 1.25 | 0.42 | 2.55 |
| 16.00 | 1.30 | 0.42 | 2.75 |
| 16.00 | 1.68 | 0.42 | 3.05 |
| 15.50 | 0.75 | 0.31 | 0.45 |
| 15.50 | 0.80 | 0.31 | 0.70 |
| 15.50 | 0.85 | 0.31 | 1.00 |
| 13.00 | 1.34 | 0.30 | 0.45 |
| 13.00 | 1.71 | 0.30 | 1.20 |
| 13.00 | 1.85 | 0.30 | 2.20 |
| 10.50 | 1.45 | 0.28 | -0.95 |
| 10.50 | 1.82 | 0.28 | 0.05 |
| 8.50 | 1.10 | 0.28 | 1.75 |
| 8.50 | 1.42 | 0.25 | 0.30 |
| 6.00 | 1.45 | 0.25 | 0.75 |
| 6.00 | 2.09 | 0.25 | 0.90 |
| 6.00 | 2.45 | 0.16 | -4.30 |
| - | - | 0.16 | -1.00 |
| - | - | 0.16 | 0.65 |
© 2020 by the authors. Licensee MDPI, Basel, Switzerland. This article is an open access article distributed under the terms and conditions of the Creative Commons Attribution (CC BY) license (http://creativecommons.org/licenses/by/4.0/).
Share and Cite
Kaeseberg, S.; Messerer, D.; Holschemacher, K. Experimental Study on Concrete under Combined FRP–Steel Confinement. Materials 2020, 13, 4467. https://doi.org/10.3390/ma13204467
Kaeseberg S, Messerer D, Holschemacher K. Experimental Study on Concrete under Combined FRP–Steel Confinement. Materials. 2020; 13(20):4467. https://doi.org/10.3390/ma13204467
Chicago/Turabian StyleKaeseberg, Stefan, Dennis Messerer, and Klaus Holschemacher. 2020. "Experimental Study on Concrete under Combined FRP–Steel Confinement" Materials 13, no. 20: 4467. https://doi.org/10.3390/ma13204467
APA StyleKaeseberg, S., Messerer, D., & Holschemacher, K. (2020). Experimental Study on Concrete under Combined FRP–Steel Confinement. Materials, 13(20), 4467. https://doi.org/10.3390/ma13204467