Strengthening of AA5754 Aluminum Alloy by DRECE Process Followed by Annealing Response Investigation

 ,
,  ,
,  , ,
, ,  and
and
Abstract
1. Introduction
2. Materials and Methods
3. Results and Discussion
3.1. Initial Microstructure
3.2. Effect of DRECE on Dislocation Density
3.3. Evolution of Microstructure
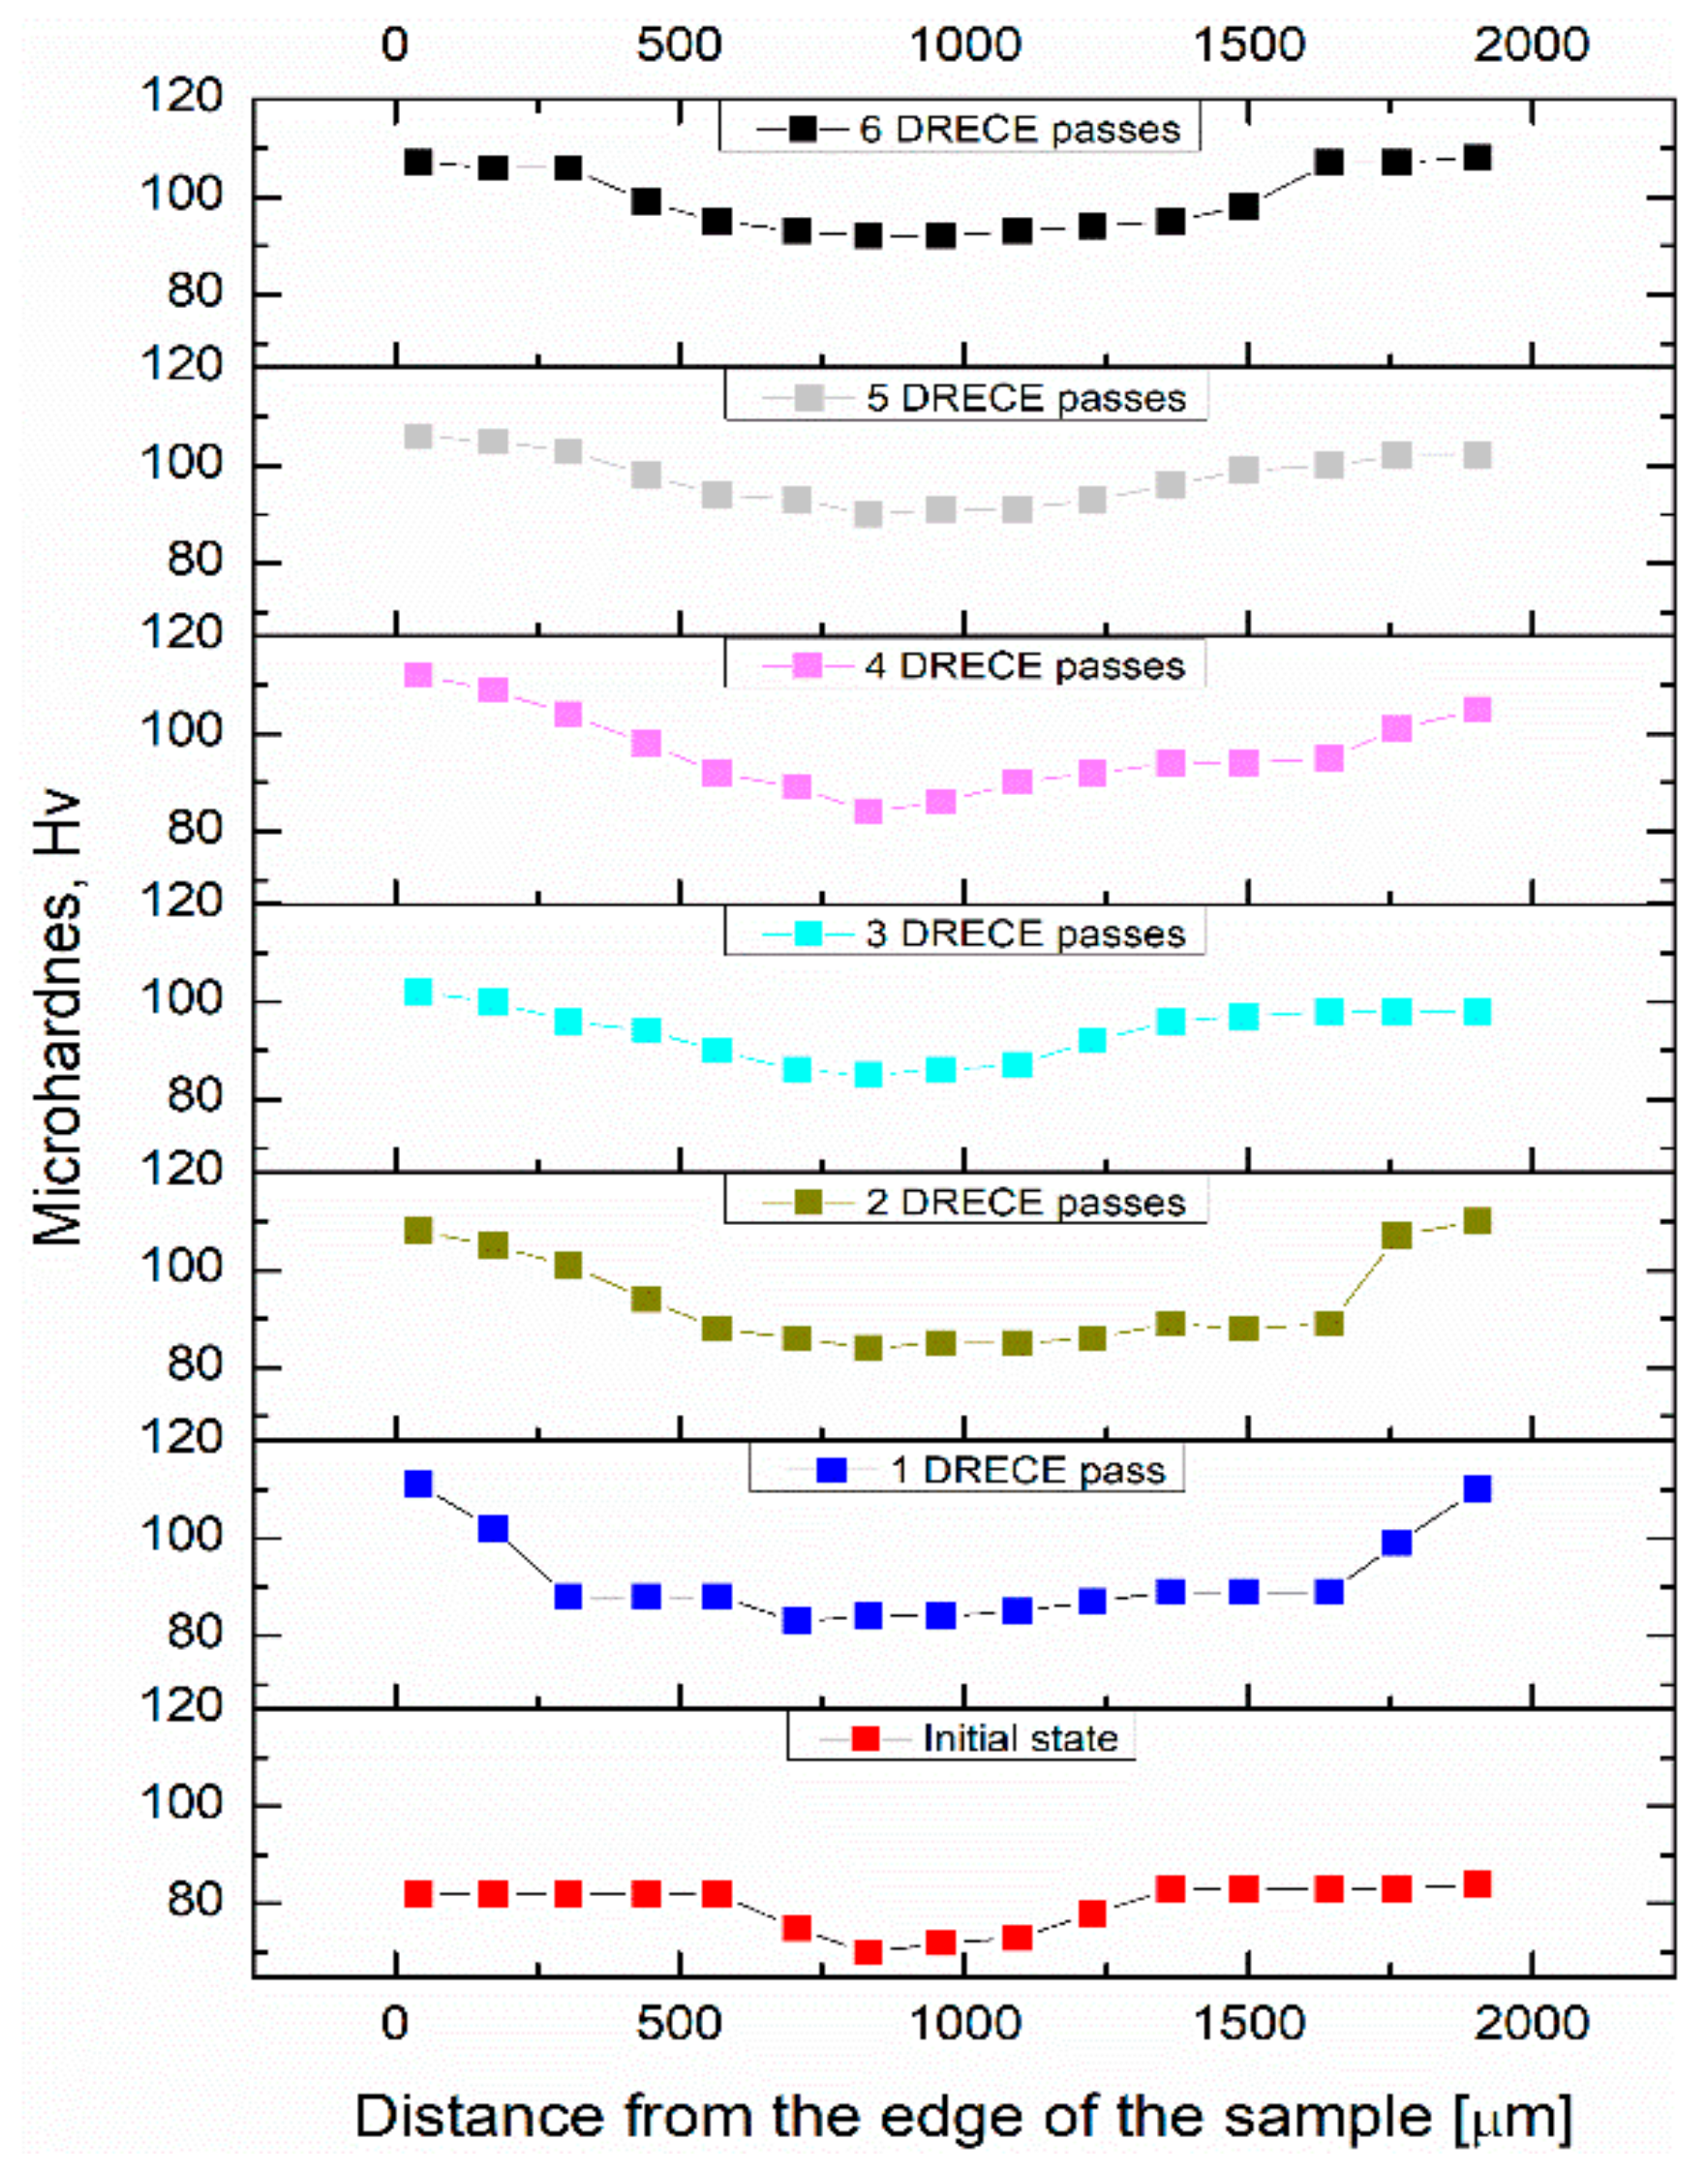
3.4. Mechanical Properties after DRECE Process
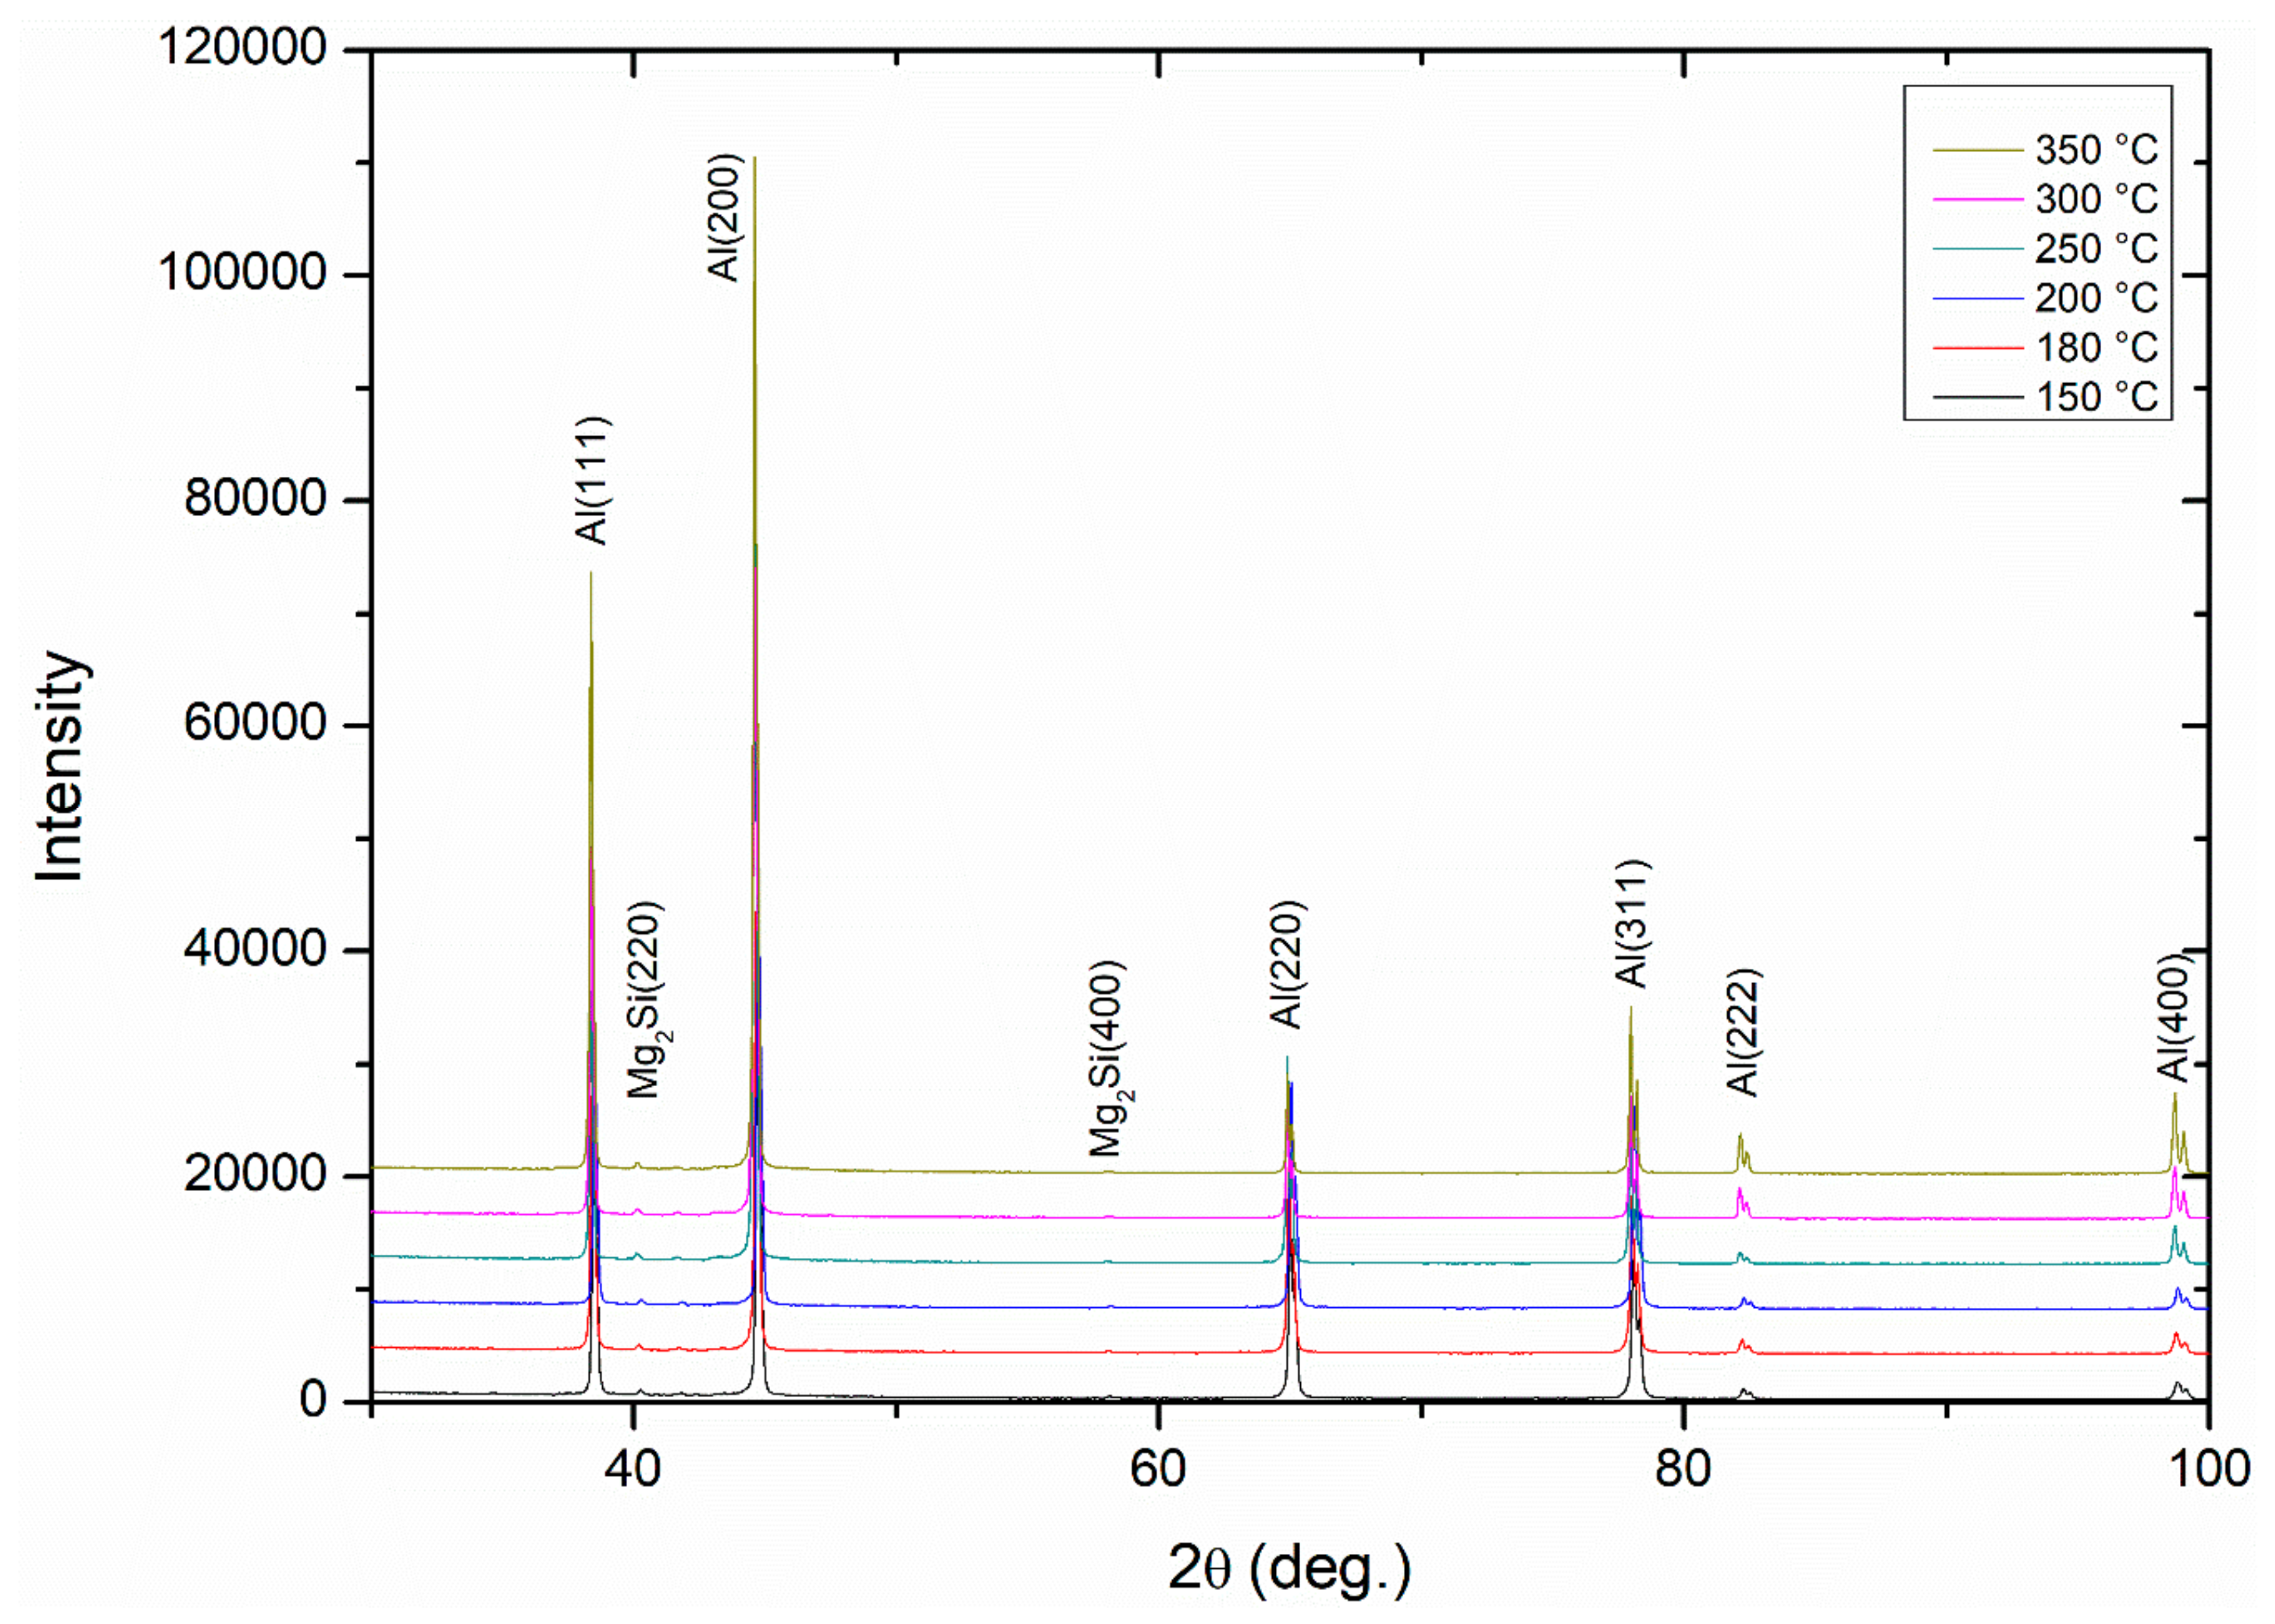
3.5. Annealing Response of the As-Deformed 5745 Alloy
4. Conclusions
Author Contributions
Funding
Conflicts of Interest
References
- Tański, T.; Snopiński, P.; Borek, W. Strength and structure of AlMg3 alloy after ECAP and post-ECAP processing. Mater. Manuf. Process 2017, 32, 59–70. [Google Scholar] [CrossRef]
- Azushima, A.; Kopp, R.; Korhonen, A.; Yang, D.Y.; Micari, F.; Lahoti, G.D.; Groche, P.; Yanagimoto, J.; Tsuji, N.; Rosochowski, A.; et al. Severe plastic deformation (SPD) processes for metals. CIRP Ann. 2008, 57, 16–735. [Google Scholar] [CrossRef]
- Segal, V. Review: Modes and processes of severe plastic deformation (SPD). Materials 2018, 11, 1175. [Google Scholar] [CrossRef]
- Snopiński, P.; Tański, T.; Matus, K.; Rusz, S. Microstructure, grain refinement and hardness of Al–3%Mg aluminium alloy processed by ECAP with helical die. Arch. Civ. Mech. Eng. 2019, 19, 287–296. [Google Scholar] [CrossRef]
- Takayama, Y.; Miura, T.; Kato, H.; Watanabe, H. Microstructural and Textural Evolution by Continuous Cyclic Bending and Annealing in a High Purity Titanium. Mater. Trans. 2004, 45, 2826–2831. [Google Scholar] [CrossRef][Green Version]
- Huang, J.; Zhu, Y.T.; Alexander, D.J.; Liao, X.; Lowe, T.C.; Asaro, R.J. Development of repetitive corrugation and straightening. Mater. Sci. Eng. A 2004, 371, 35–39. [Google Scholar] [CrossRef]
- Saito, Y.; Utsunomiya, H.; Tsuji, N.; Sakai, T. Novel ultra-high straining process for bulk materials—development of the accumulative roll-bonding (ARB) process. Acta Mater. 1999, 47, 579–583. [Google Scholar] [CrossRef]
- Derakhshan, J.F.; Parsa, M.H.; Jafarian, H.R. Microstructure and mechanical properties variations of pure aluminum subjected to one pass of ECAP-Conform process. Mater. Sci. Eng. A 2019, 747, 120–129. [Google Scholar] [CrossRef]
- Rusz, S.; Cizek, L.; Michenka, V.; Dutkiewicz, J.; Salajka, M.; Hilser, O.; Tylsar, S.; Kedron, J.; Klos, M. New Type of Device for Achievement of Grain Refinement in Metal Strip. Adv. Mater. Res. 2015, 1127, 91–97. [Google Scholar] [CrossRef]
- Rusz, S.; Klyszewski, A.; Salajka, M.; Hilser, O.; Cizek, L.; Klos, M. Possibilities of Application Methods Drece in Forming of Non-Ferrous Metals. Arch. Metall. Mater. 2015, 60, 3011–3015. [Google Scholar] [CrossRef]
- Totten, G.E.; Mackenzie, D.S. Handbook of Aluminum: Physical Metallurgy and Processes 1; CRC Press: Boca Raton, FL, USA, 2003; Volume 1. [Google Scholar]
- Mckenzie, P.W.J.; Lapovok, R. ECAP with back pressure for optimum strength and ductility in aluminium alloy 6016. Part 1: Microstructure. Acta Mater. 2010, 58, 3198–3211. [Google Scholar] [CrossRef]
- Tański, T.; Snopiński, P.; Pakieła, W.; Borek, W.; Prusik, K.; Rusz, S. Structure and properties of AlMg alloy after combination of ECAP and post-ECAP ageing. Arch. Civ. Mech. Eng. 2016, 16, 325–334. [Google Scholar] [CrossRef]
- Pandey, V.; Singh, J.K.; Chattopadhyay, K.; Santhi Srinivas, N.C.; Singh, V. Influence of ultrasonic shot peening on corrosion behavior of 7075 aluminum alloy. J. Alloys Compd. 2017, 723, 826–840. [Google Scholar] [CrossRef]
- Williamson, G.K.; Hall, W.H. X-ray line broadening from filed aluminium and wolfram. Acta Mater. 1953, 1, 22–31. [Google Scholar] [CrossRef]
- Cabibbo, M.; Paoletti, C.; Ghat, M.; Forcellese, A.; Simoncini, M. Post-FSW Cold-Rolling Simulation of ECAP Shear Deformation and Its Microstructure Role Combined to Annealing in a FSWed AA5754 Plate Joint. Materials 2019, 12, 1526. [Google Scholar] [CrossRef] [PubMed]
- Ungar, T.; Mughrabi, H.; Rönnpagel, D.; Wilkens, M. X-ray line-broadening study of the dislocation cell structure in deformed [001]-orientated copper single crystals. Acta Mater. 1984, 32, 333–342. [Google Scholar] [CrossRef]
- Howeyze, M.; Arabi, H.; Eivani, A.R.; Jafarian, H.R. Strengthening of AA5052 aluminum alloy by equal channel angular pressing followed by softening at room temperature. Mater. Sci. Eng. A 2018, 720, 160–168. [Google Scholar] [CrossRef]
- Dinkerl, M.; Pyczak, F.; May, J.; Hoppel, H.W.; Goken, M. Xrd profile analysis characterization of ultrafine grained Al-Mg alloys. J. Mater. Sci. 2009, 43, 7481–7487. [Google Scholar] [CrossRef]
- Liu, M.; Roven, H.J.; Liu, X.; Murashkin, M.; Valiev, R.Z.; Ungar, T.; Balogh, L. Grain refinement in nanostructured Al–Mg alloys subjected to high pressure torsion. J. Mater. Sci. 2010, 45, 4659–4664. [Google Scholar] [CrossRef]
- Zhang, C.; Wang, C.; Guo, R.; Zhao, G.; Chen, L.; Sun, W.; Wang, X. Investigation of dynamic recrystallization and modeling of microstructure evolution of an Al-Mg-Si aluminum alloy during high-temperature deformation. J. Alloys Compd. 2019, 773, 59–70. [Google Scholar] [CrossRef]
- Tański, T.; Snopiński, P.; Prusik, K.; Sroka, M. The effects of room temperature ECAP and subsequent aging on the structure and properties of the Al-3%Mg aluminium alloy. Mater. Charact. 2017, 133, 185–195. [Google Scholar] [CrossRef]
- Izairi, N.; Ajredini, F.; Vevecka-Priftaj, A.; Ristova, M. Enhancement of mechanical properties of the AA5754 aluminium alloy with a severe plastic deformation. Mater. Technol. 2014, 48, 385–388. [Google Scholar]
- León, J.; Salcedo, D.; Murillo, Ó.; Luis, C.J.; Fuertes, J.P.; Puertas, I.; Luri, R. Mechanical Properties Analysis of an Al-Mg Alloy Connecting Rod with Submicrometric Structure. Metals 2015, 5, 1397–1413. [Google Scholar] [CrossRef]
- Tang, L.; Peng, X.; Huang, J.; Ma, A.; Deng, Y.; Xu, G. Microstructure and mechanical properties of severely deformed Al-Mg-Sc-Zr alloy and their evolution during annealing. Mater. Sci. Eng. A 2019, 754, 295–308. [Google Scholar] [CrossRef]
- Khelfa, T.; Rekik, M.A.; Munoz-Bolanos, J.A.; Cabrera-Marrero, J.M.; Khitouni, M. Microstructure and strengthening mechanisms in an Al-Mg-Si alloy processed by equal channel angular pressing (ECAP). Int. J. Adv. Manuf. Technol. 2018, 95, 1165–1177. [Google Scholar] [CrossRef]


| Al | Mg | Si | Mn | Fe | Cr | Cu | Zn | Ti |
|---|---|---|---|---|---|---|---|---|
| Bal. | 2.6–3.6 | ≤0.4 | ≤0.5 | ≤0.4 | ≤0.3 | ≤0.1 | ≤0.2 | ≤0.15 |
| Sample | Dv(nm) | ρ (m−2) | ρd (m−2) | ρ (m−2) |
|---|---|---|---|---|
| Initial state | 35 | 2.46∙× 1015 | 4.86∙× 1013 | 3.46 × 10¹⁴ |
| 1× | 32 | 2.98∙× 1015 | 1.40∙× 1014 | 6.47 × 10¹⁴ |
| 2× | 34 | 2.63∙× 1015 | 1.35 × 10¹⁴ | 5.96 × 10¹⁴ |
| 3× | 31 | 3.13 × 10¹⁵ | 1.04∙× 1014 | 5.73 × 10¹⁴ |
| 4× | 30 | 3.15 × 10¹⁵ | 1.67∙× 1014 | 7.25 × 10¹⁴ |
| 5× | 32 | 2.84 × 10¹⁵ | 1.50∙× 1014 | 6.54 × 10¹⁴ |
| 6× | 29 | 3.36 × 10¹⁵ | 1.69∙× 1014 | 7.55 × 10¹⁴ |
| Grain Size (Intercept Lengths) [μm] | Fraction of Low Angle Grain Boundaries, % | Fraction of High Angle Grain Boundaries, % | Average Misorientation Angle, θAV [°] | |
|---|---|---|---|---|
| Initial state | 7.916 | 11.6 | 88.4 | 36.98 |
| 1× | 7.862 | 13.4 | 86.6 | 37.76 |
| 4× | 6.872 | 41.4 | 58.6 | 25.50 |
| 6× | 6.958 | 40.4 | 59.6 | 27.27 |
| Condition | Average Vickers Microhardness | Yield Strength (MPa) | Tensile Strength (MPa) | Elongation, % |
|---|---|---|---|---|
| Initial state | 79.6 | 112.3 | 216 | 30.1 |
| 1× | 91.7 | 184.7 | 235.4 | 13.2 |
| 2× | 93.6 | 188.1 | 239.5 | 10.6 |
| 3× | 93.7 | 189.4 | 241.2 | 10.0 |
| 4× | 96.3 | 193.3 | 246.1 | 9.1 |
| 5× | 97.5 | 194.1 | 247.0 | 9.0 |
| 6× | 99.5 | 198.2 | 251.8 | 8.4 |
| Annealing Temperature [°C] | Dv (nm) | ρs (m−2) | ρd (m−2) | ρ (m−2) |
|---|---|---|---|---|
| 150 | 34 | 2.50 × 10¹⁵ | 8.75 × 10¹³ | 4.68 × 10¹⁴ |
| 180 | 36 | 2.31 × 10¹⁵ | 8.51 × 10¹³ | 4.44 × 10¹⁴ |
| 200 | 37 | 2.14 × 10¹⁵ | 8.06 × 10¹³ | 4.16 × 10¹⁴ |
| 250 | 43 | 1.61 × 10¹⁵ | 8.63 × 10¹³ | 3.73 × 10¹⁴ |
| 300 | 40 | 1.85 × 10¹⁵ | 2.27 × 10¹³ | 2.05 × 10¹⁴ |
| 350 | 47 | 1.35 × 10¹⁵ | 7.48 × 10¹³ | 3.18 × 10¹⁴ |
| Annealing Temperature [°C] | Average Vickers Microhardness |
|---|---|
| 150 | 81.5 |
| 180 | 74.1 |
| 200 | 77.1 |
| 250 | 61.1 |
| 300 | 61.5 |
| 350 | 68.7 |
© 2020 by the authors. Licensee MDPI, Basel, Switzerland. This article is an open access article distributed under the terms and conditions of the Creative Commons Attribution (CC BY) license (http://creativecommons.org/licenses/by/4.0/).
Share and Cite
Snopiński, P.; Tański, T.; Gołombek, K.; Rusz, S.; Hilser, O.; Donič, T.; Nuckowski, P.M.; Benedyk, M. Strengthening of AA5754 Aluminum Alloy by DRECE Process Followed by Annealing Response Investigation. Materials 2020, 13, 301. https://doi.org/10.3390/ma13020301
Snopiński P, Tański T, Gołombek K, Rusz S, Hilser O, Donič T, Nuckowski PM, Benedyk M. Strengthening of AA5754 Aluminum Alloy by DRECE Process Followed by Annealing Response Investigation. Materials. 2020; 13(2):301. https://doi.org/10.3390/ma13020301
Chicago/Turabian StyleSnopiński, Przemysław, Tomasz Tański, Klaudiusz Gołombek, Stanislav Rusz, Ondřej Hilser, Tibor Donič, Paweł M. Nuckowski, and Marcin Benedyk. 2020. "Strengthening of AA5754 Aluminum Alloy by DRECE Process Followed by Annealing Response Investigation" Materials 13, no. 2: 301. https://doi.org/10.3390/ma13020301
APA StyleSnopiński, P., Tański, T., Gołombek, K., Rusz, S., Hilser, O., Donič, T., Nuckowski, P. M., & Benedyk, M. (2020). Strengthening of AA5754 Aluminum Alloy by DRECE Process Followed by Annealing Response Investigation. Materials, 13(2), 301. https://doi.org/10.3390/ma13020301