3.1. Load-Displacement Behavior
Figure 9 plots the load-displacement curves measured in the bending test of the specimens. The RC specimen (control) exhibits typical behavior of an RC flexural member. The load-displacement curve is quasi-trilinear with a linear part until the initiation of tensile cracks in concrete as the first stage, a load resisting part until the yield of steel reinforcement of unstrengthened cross section in the second stage (see yielding point in
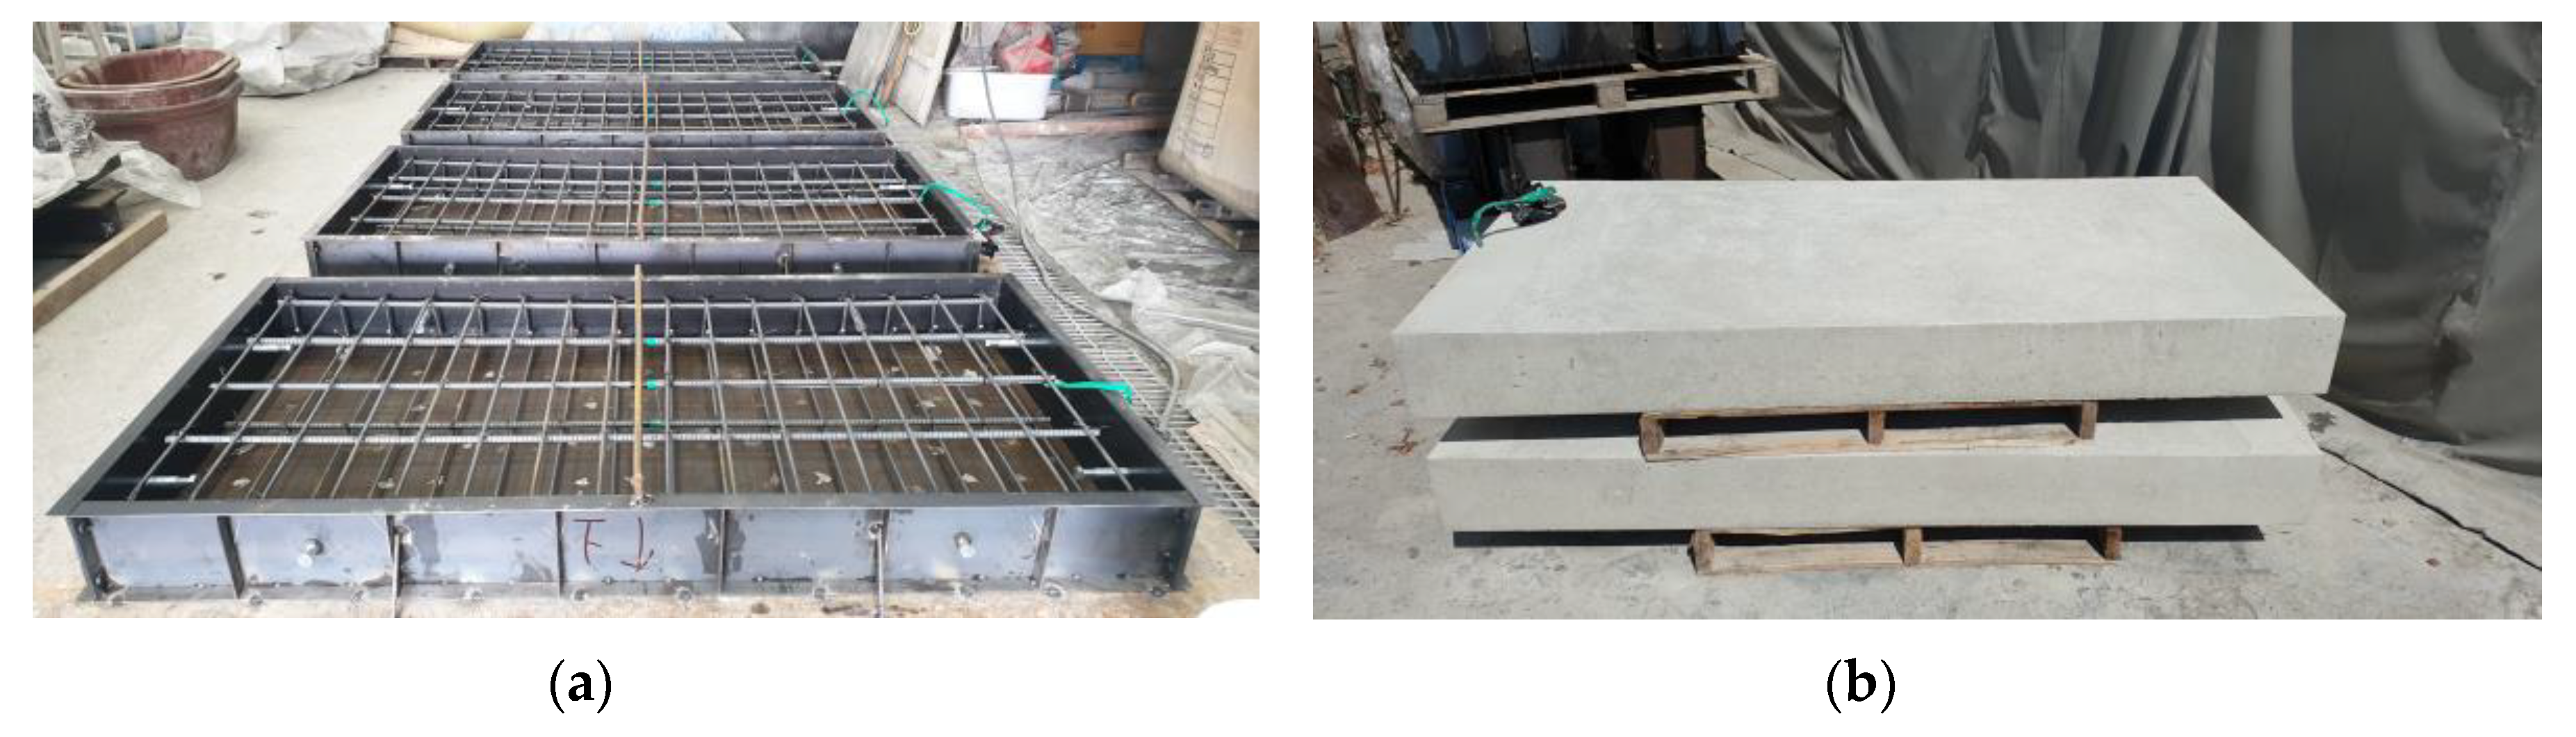
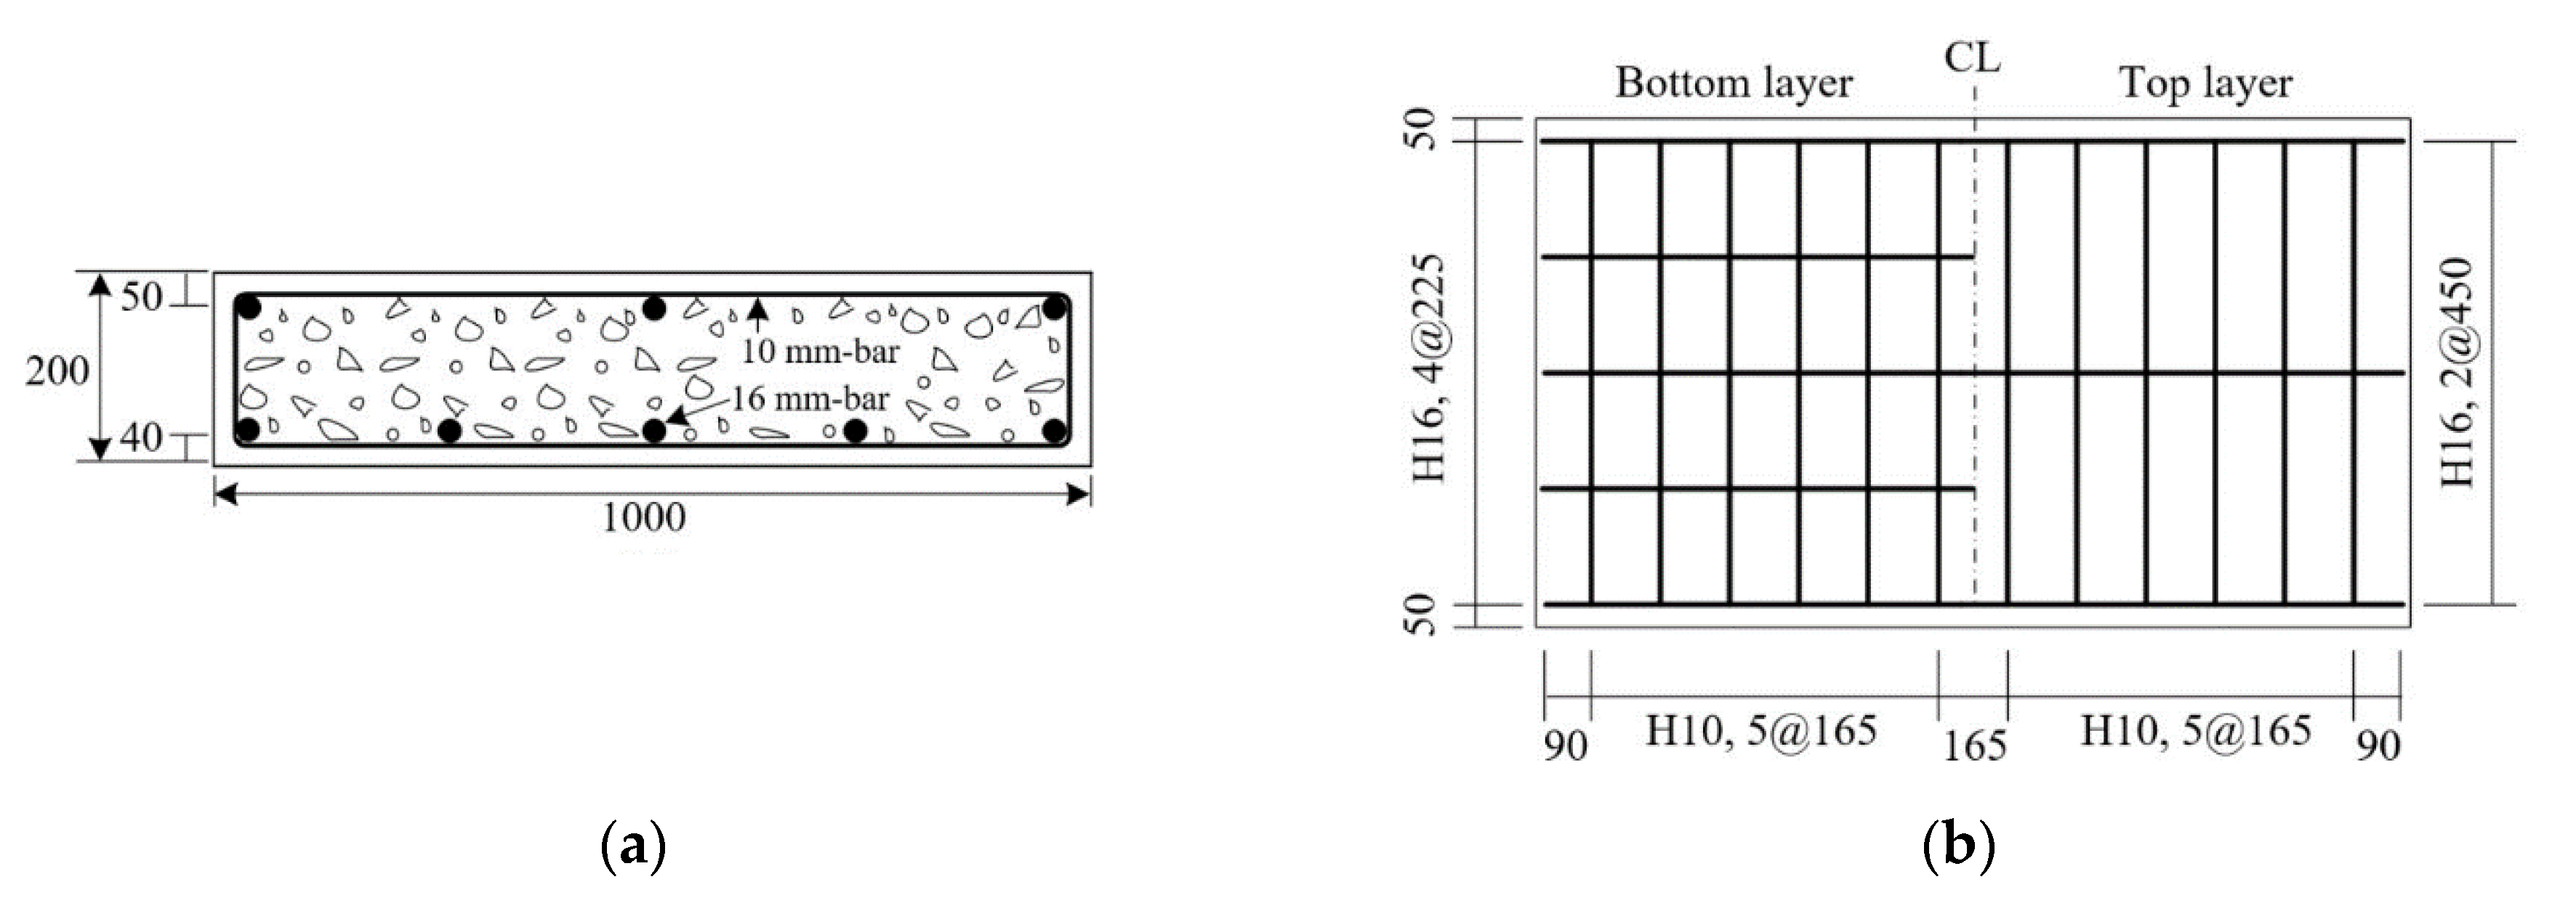
Figure 9), and an increase of the displacement only after yield of the steel reinforcement in the third stage. For both the SP and SSP series specimens, the strain gauges were mounted on the top and bottom reinforcements (16 mm bars,
Figure 5) only. Hence, the yielding of reinforcement indicates the yielding of the bottom (tensile) reinforcement (16 mm bar). However, it should be noted that the additional steel reinforcement (10 mm bar) might yield first due to a higher depth relative to the neutral axis.
Sets of two specimens were fabricated and tested for each SP and SSP series. Some difference can be observed for the peak load but the behavior and response until the peak load are practically identical. This similarity indicates that the tests were consistent with each other. In view of the load-displacement behavior of the specimen strengthened with the TRC panel, there is some difference in the responses, but the first and second linear behavioral stages between the initiation of concrete cracks and the rebar yield can be distinguished, similarly to those observed in the control RC slab. The difference occurs in the part from the third stage following the second stage after the rebar yield to the peak load. In this part, the specimens of SP and SSP series exhibit a shorter post-yield ductile section than the RC specimen and show a steep reduction of the load-carrying capacity due to sudden failure (fourth stage). In particular, in
Figure 9a, delamination between the TRC panel and the concrete occurred in the SP series to lead to sudden failure. In the final fifth stage, the displacement increased continuously without further resisting of the applied loading.
When the RC slab is to be designed for strengthening with the TRC panel, the occurrence of brittle failure after the peak load should be considered carefully. Since the sudden failure happens after the yield of the steel reinforcement of the slab, the structure may be assumed to maintain its load-carrying capacity until the yield of the tensile reinforcement if conservative design is conducted.
In this study, the mortar for the TRC was reinforced with PVA short fibers to mitigate shrinkage-induced crack formation. The PVA short fibers were very effective in preventing shrinkage-induced cracks during the curing of the TRC panel. However, the PVA short fibers did not have a significant influence on the cracking load of the TRC panel and concrete slab in the full-scale flexural failure test.
3.2. Load-Carrying Capacity
Table 5 summarizes the bending test results of all sets of specimens. Compared to the RC specimen (control), the load-carrying capacity of the SP series specimens strengthened with the TRC panel only improved by 46% on average and that of the SSP series specimens strengthened with the TRC panel and additional reinforcement improved by a maximum of 69%. Note that the cracking of concrete and the TRC panel occurred simultaneously due to perfect bonding between the concrete substrate and the TRC panel.
Table 6 provides the peak load ratio with respect to the tensile reinforcement ratio for the specimens. The total nominal area of the tensile reinforcement used in the fabrication of the RC slab was 992.8 mm
2, which gives a tensile reinforcement ratio of 0.0062. The reinforcement ratio of the grid is 0.0004 (=0.085/210), corresponding to a 6.5% tensile reinforcement ratio of the RC slab. Considering that the elastic modulus of the steel reinforcement is 200 GPa, the effective reinforcement ratio is around 7.1% when considering the elastic modulus ratio (1.1 = 220 GPa/200 GPa). In other words, the flexural performance developed up to 146% on average when the tensile reinforcement ratio was increased to 7%. This result can be credited to the high tensile strength of the carbon grid compared to the yield strength of the steel reinforcement.
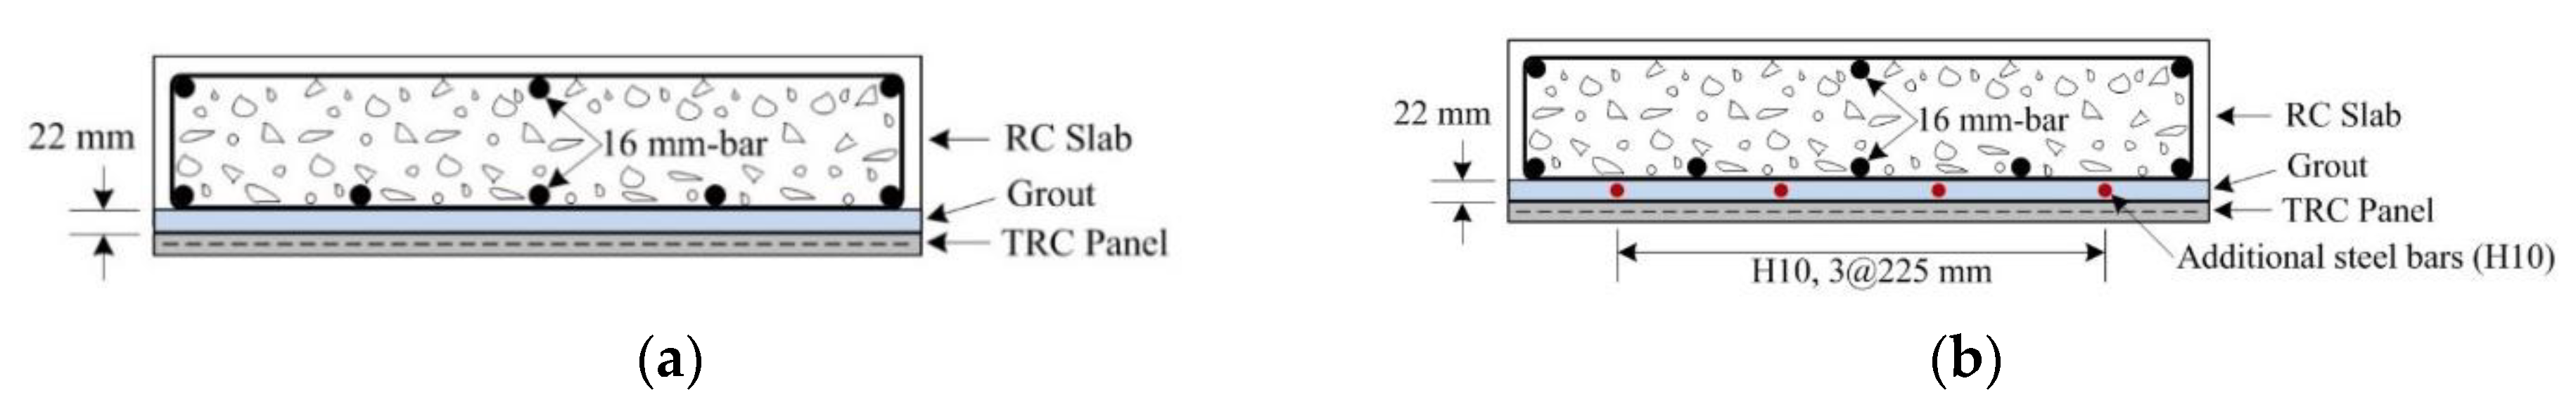
Four strips of rebar with a diameter of 9.53 mm were additionally arranged in the SSP series. This represents an additional amount (0.0014 = 285.3 mm
2/1000 × 200 mm
2) corresponding to a 22.5% tensile reinforcement ratio of the RC slab to be strengthened and means that the reinforcement ratio of the SSP specimens increased by 30% on the whole. In
Table 6, the improved resistance of the SSP series reaches 161% on average compared to the control RC slab. If the tensile performance of the grout in the tensile zone is ignored, the best performance was achieved by the installation of the textile grid and steel reinforcement. However, in terms of efficiency, it appears that only strengthening with the textile grid can be recommended. Moreover, the relation between the tensile reinforcement ratio and the load-carrying capacity is not linear.
In view of the behavior after the initiation of cracks and until the yield of tensile reinforcement, the slope (=load/deflection) of the slab strengthened with the TRC panel and that of the slab strengthened with both the TRC panel and additional reinforcement arrangement increased on average by respectively 32% and 58% compared to the unstrengthened RC slab. This indicates that greater load-carrying capacity can be developed by the slab strengthened with the TRC panel under deflection identical to that of the RC slab before strengthening. On the contrary, the RC slab strengthened with the TRC panel experiences smaller deflection than the RC slab before strengthening under application of the same load.
3.3. Failure Mode
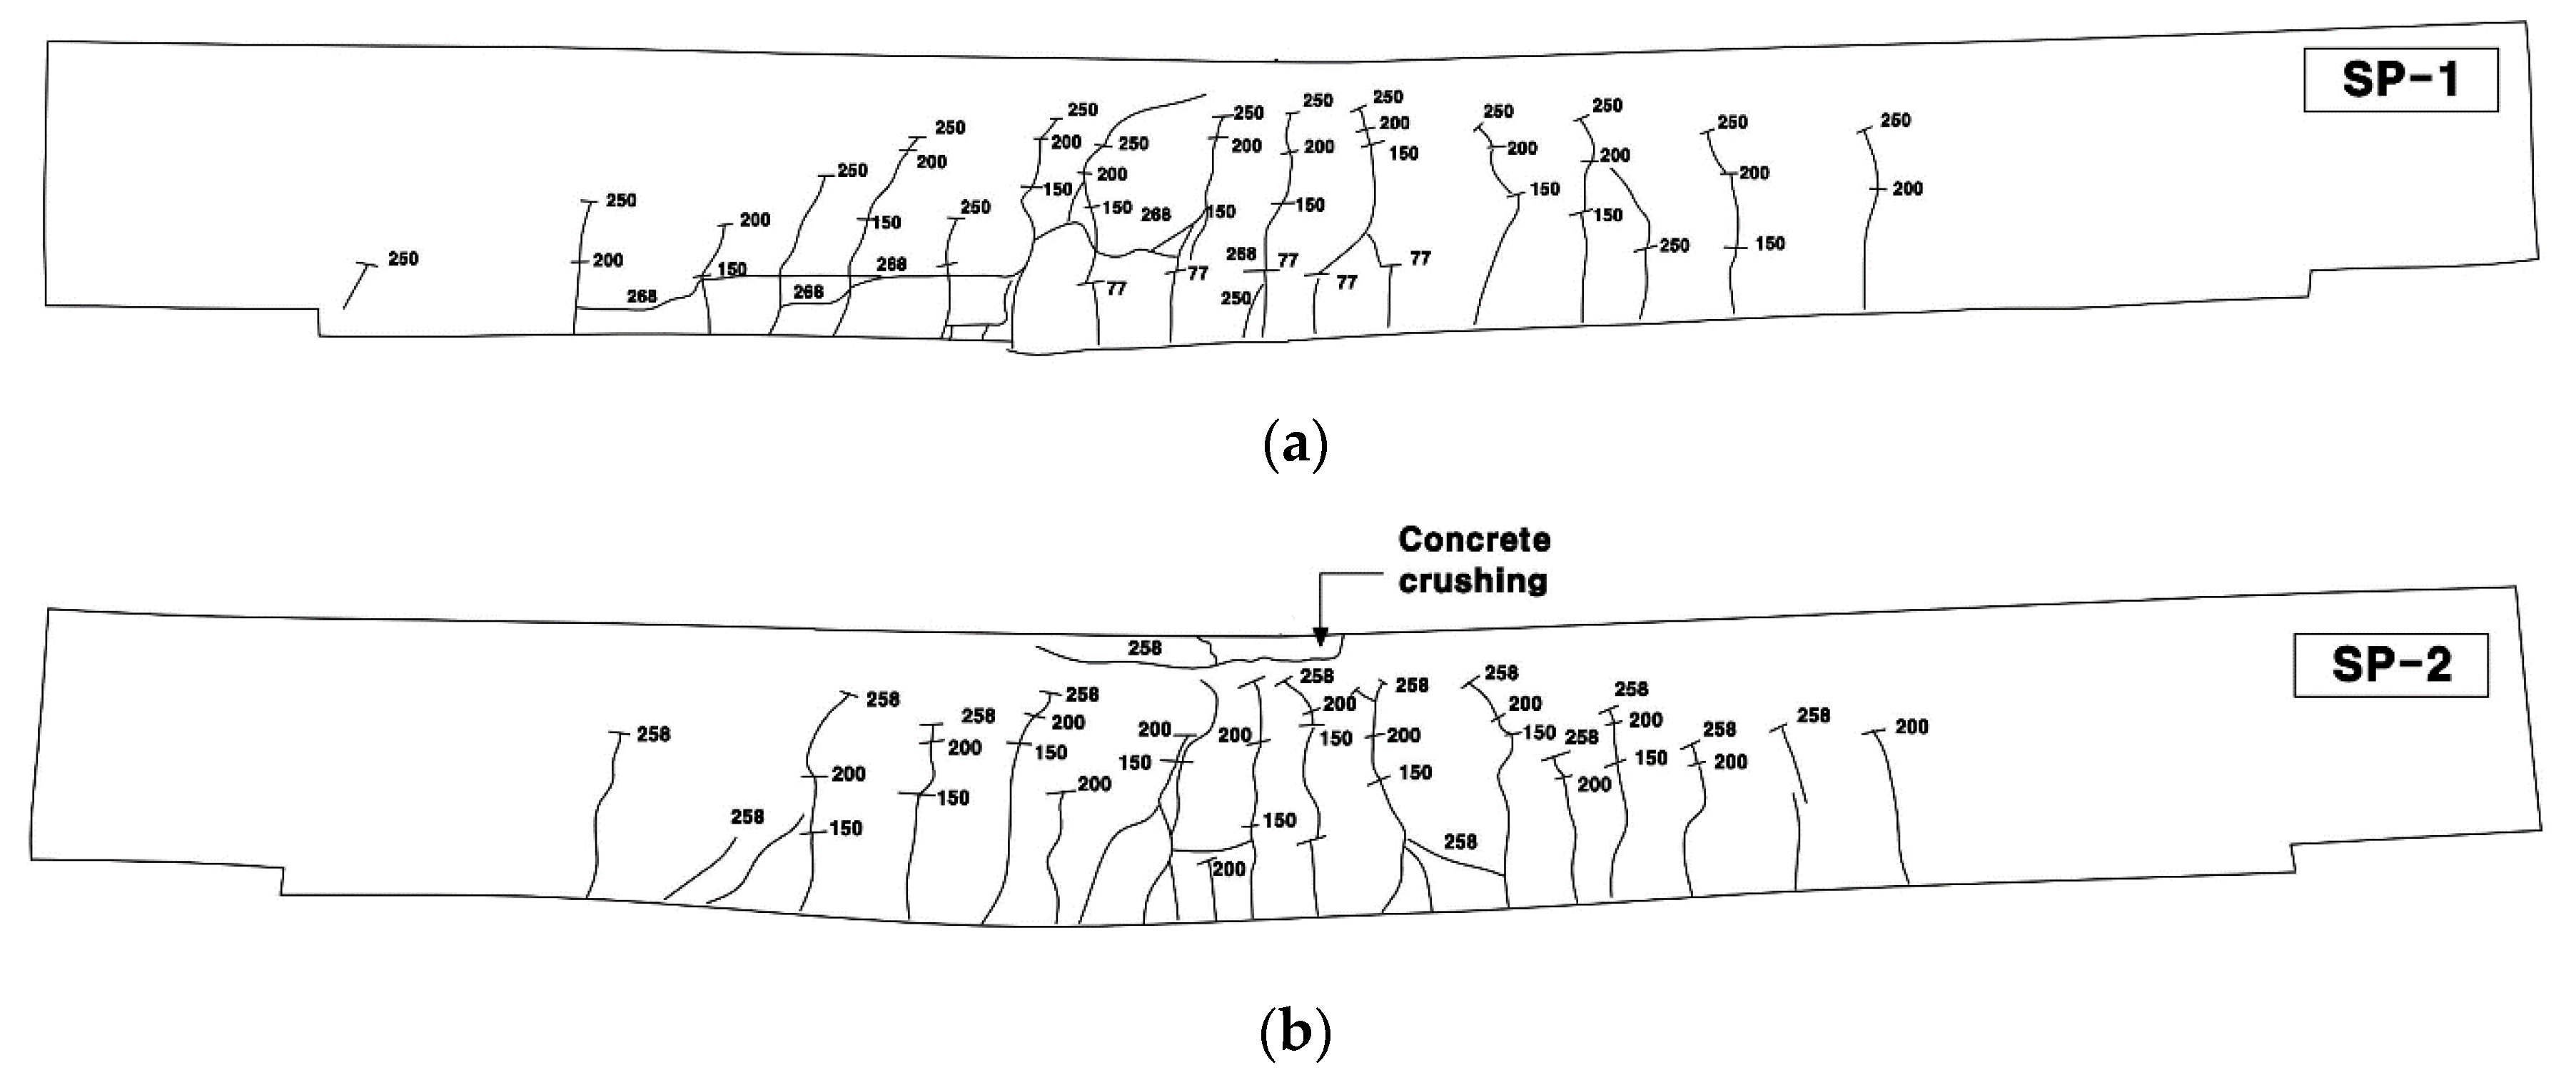
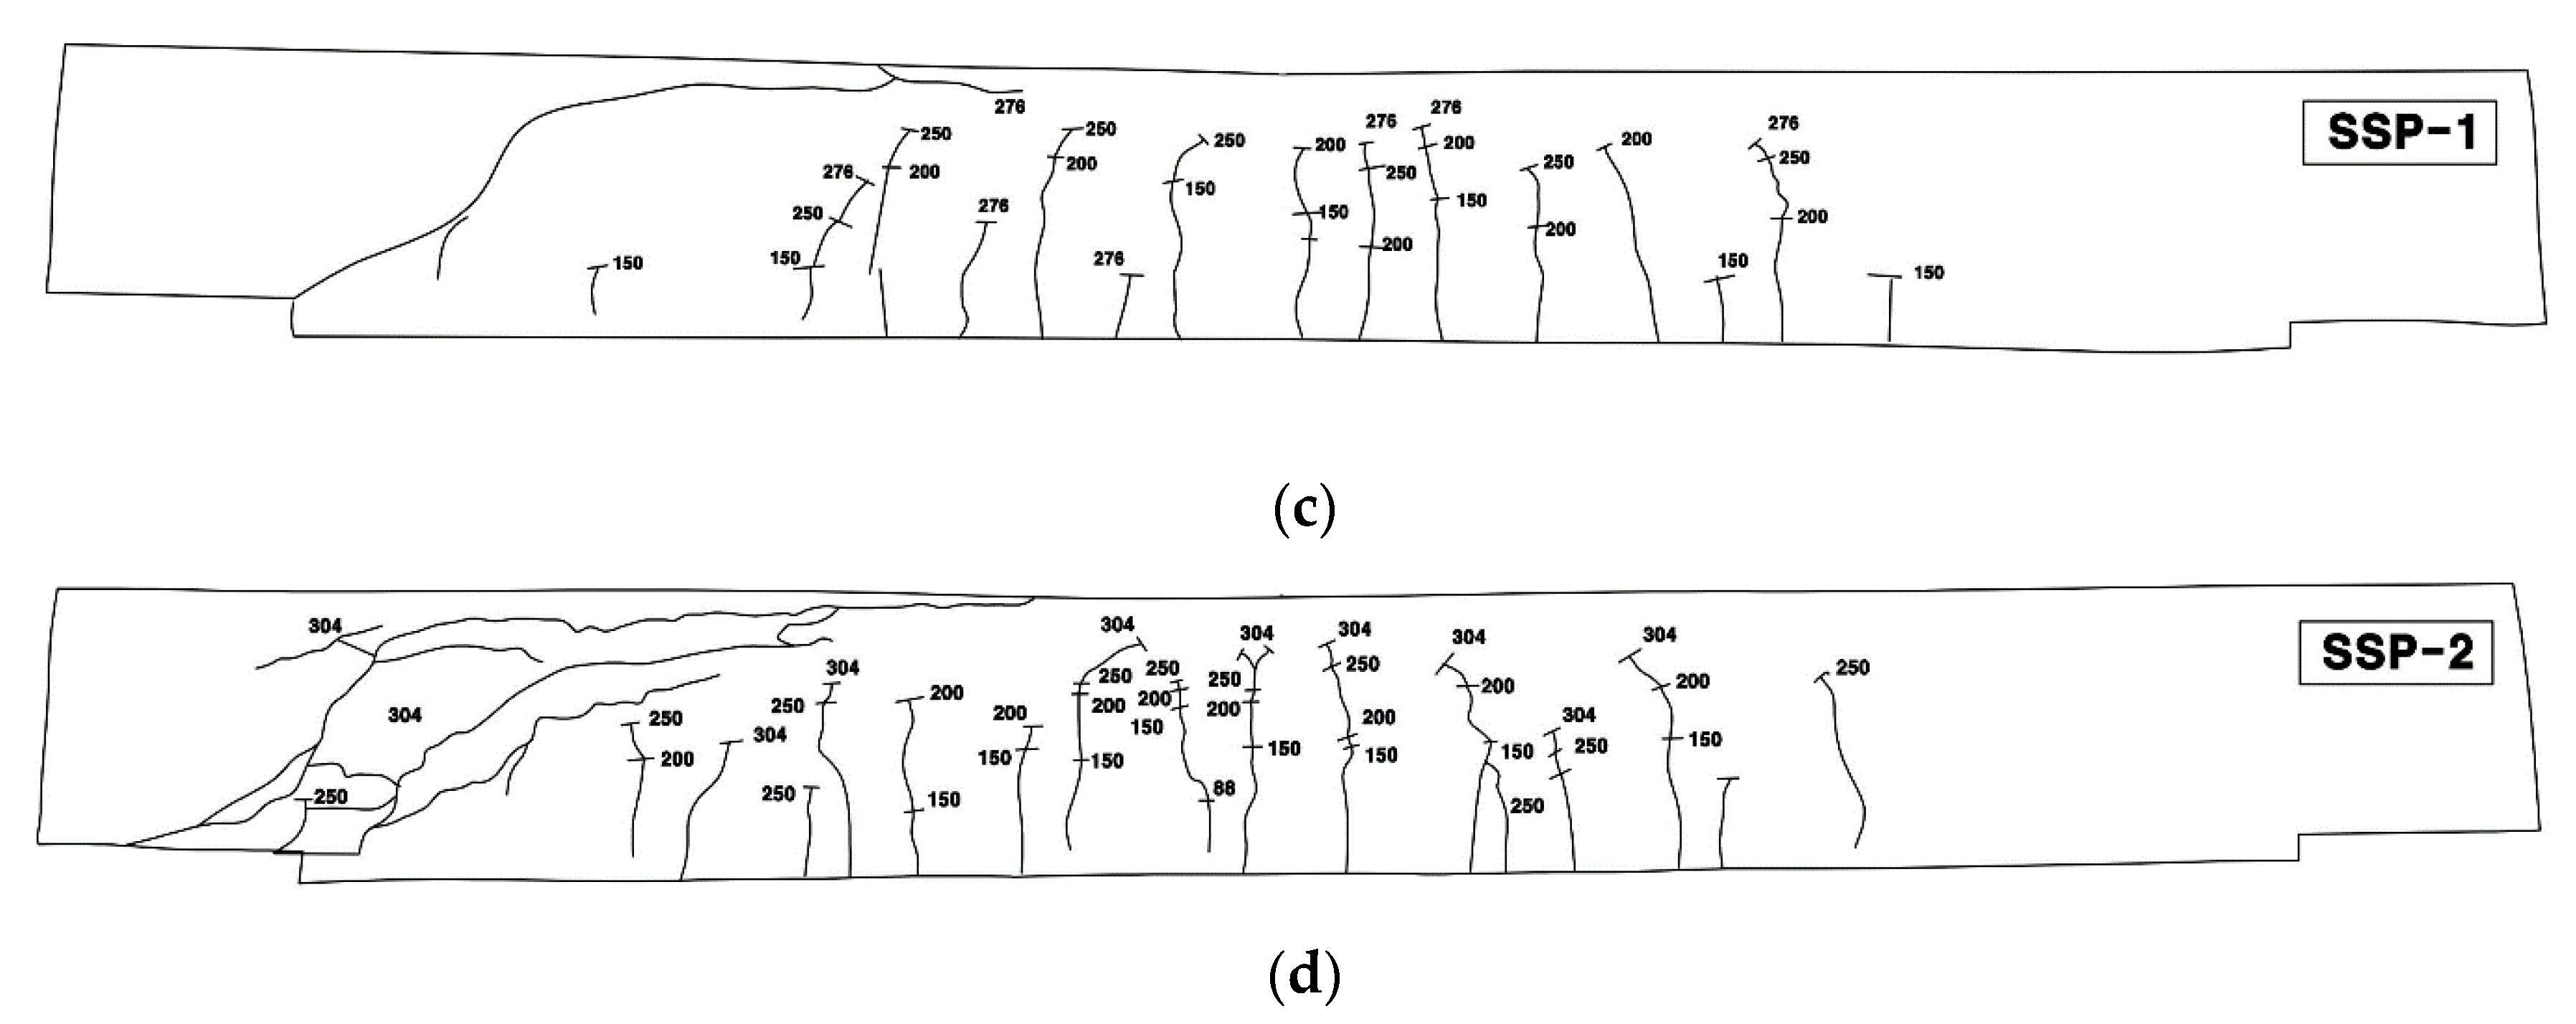
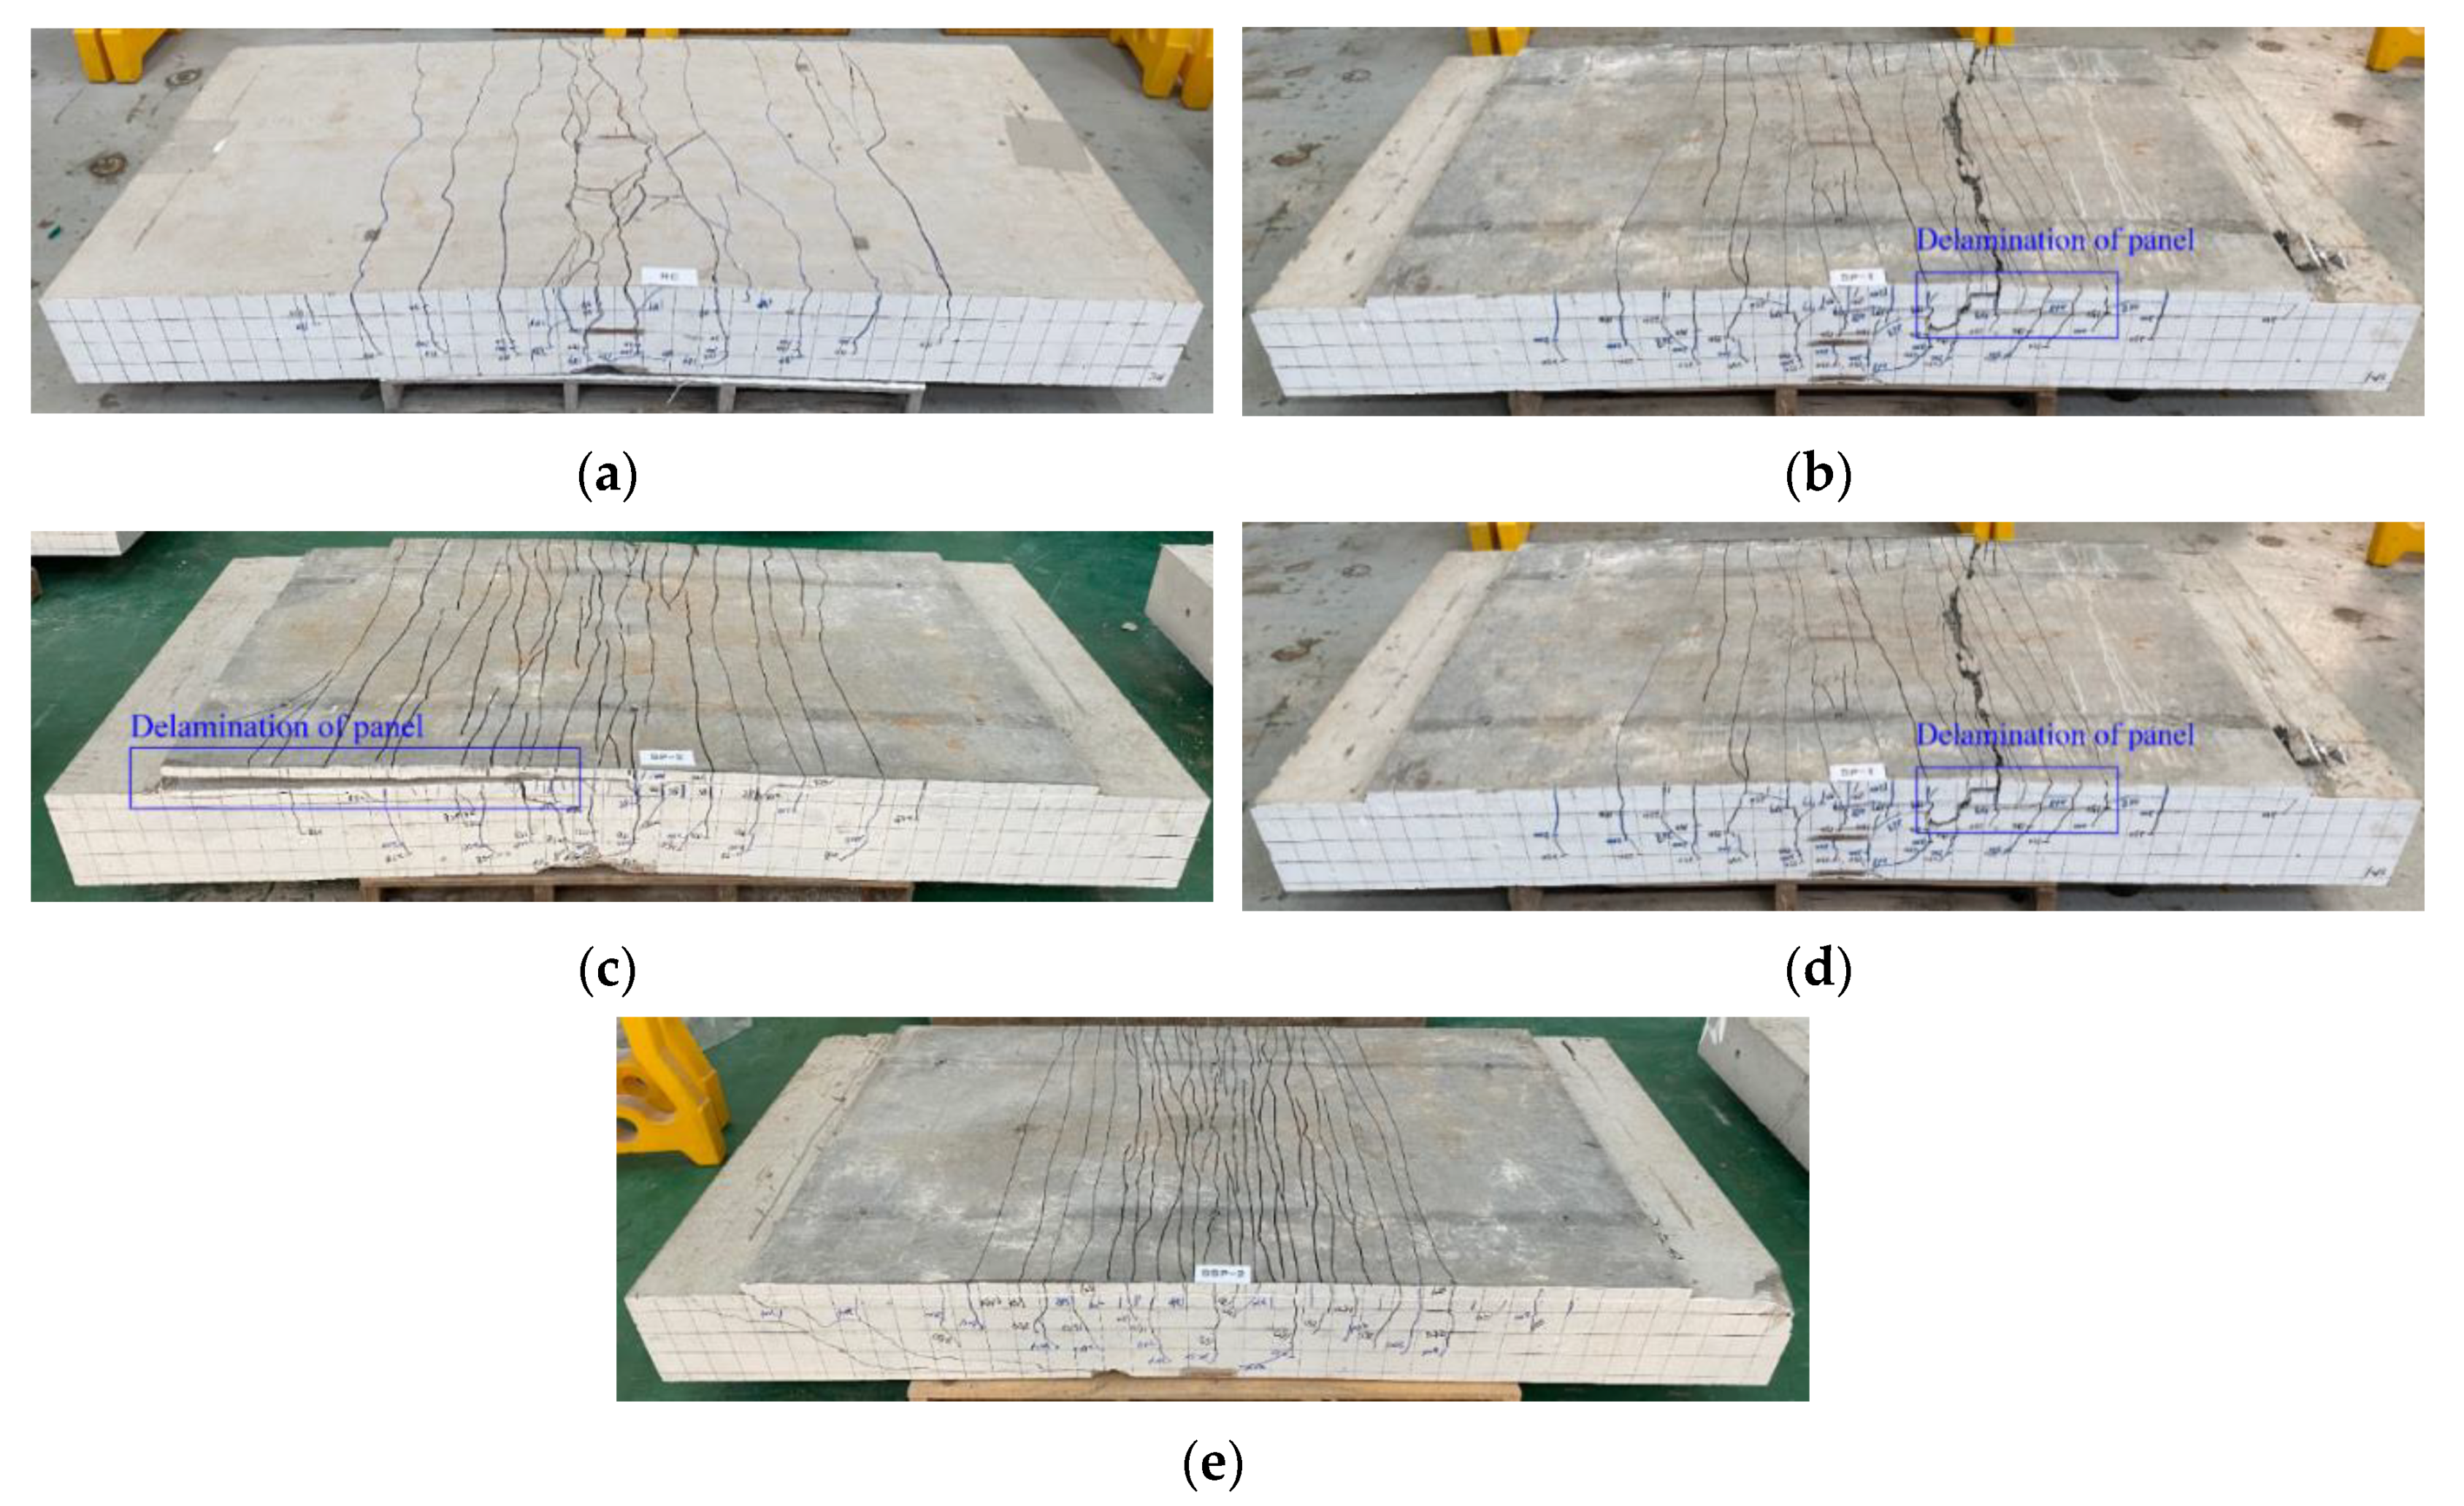
Figure 10 presents the crack patterns of the specimens after completion of the test. The tested specimens were placed in an inverted position to inspect the crack patterns and failure mechanism on the bottom side of the specimens. The RC specimen shows a typical flexural failure mode (
Figure 10a). The SP series strengthened with the TRC panel through grout filling exhibited flexural failure and bond failure by delamination of the panel (
Figure 10b,c). The SSP series with additional steel reinforcement experienced composite failure mode with the occurrence of failure by the propagation of inclined tensile cracks from the ends of the panel toward the loading point after the initiation of flexural cracking (
Figure 10d,e).
The TRC system and the slab must have sufficient bond strength until failure of the slab to develop a sufficient strengthening effect. Accordingly, careful attention should be paid to the bond performance when composing two members. The specimen strengthened with the TRC panel failed through delamination of the panel, but this delamination occurred after the peak load (
Figure 9a) and was caused by the excessive curvature experienced by the specimen at failure. Consequently, the TRC panel appears to have achieved sufficient strengthening performance until delamination. It should be further noted that the delamination of the TRC panel from the concrete slab did not occur for the SSP series specimens because the curvature of the SSP series specimens was much smaller than those of the SP series specimens due to the higher effective reinforcement ratio.
In general, the cracking of the RC flexural member changes from cracking induced by pure bending to cracking caused by the combined action of flexure and shear, as the tensile reinforcement ratio is increased [
21]. As explained above, the effective tensile reinforcement ratio of the SP series and SSP series was increased respectively by 7% and 30% compared to the RC slab. Therefore, the failure induced by the inclined tensile cracks in the SSP series can be attributed to the significantly larger reinforcement ratio provided by both TRC and additional reinforcement. When the RC flexural member features a high reinforcement ratio, failure is likely to occur suddenly due to the inclined tensile cracks. Accordingly, the effective reinforcement ratio and the failure mode must be checked when design is conducted for strengthening with TRC.
3.4. Effect of Strengthening Methods
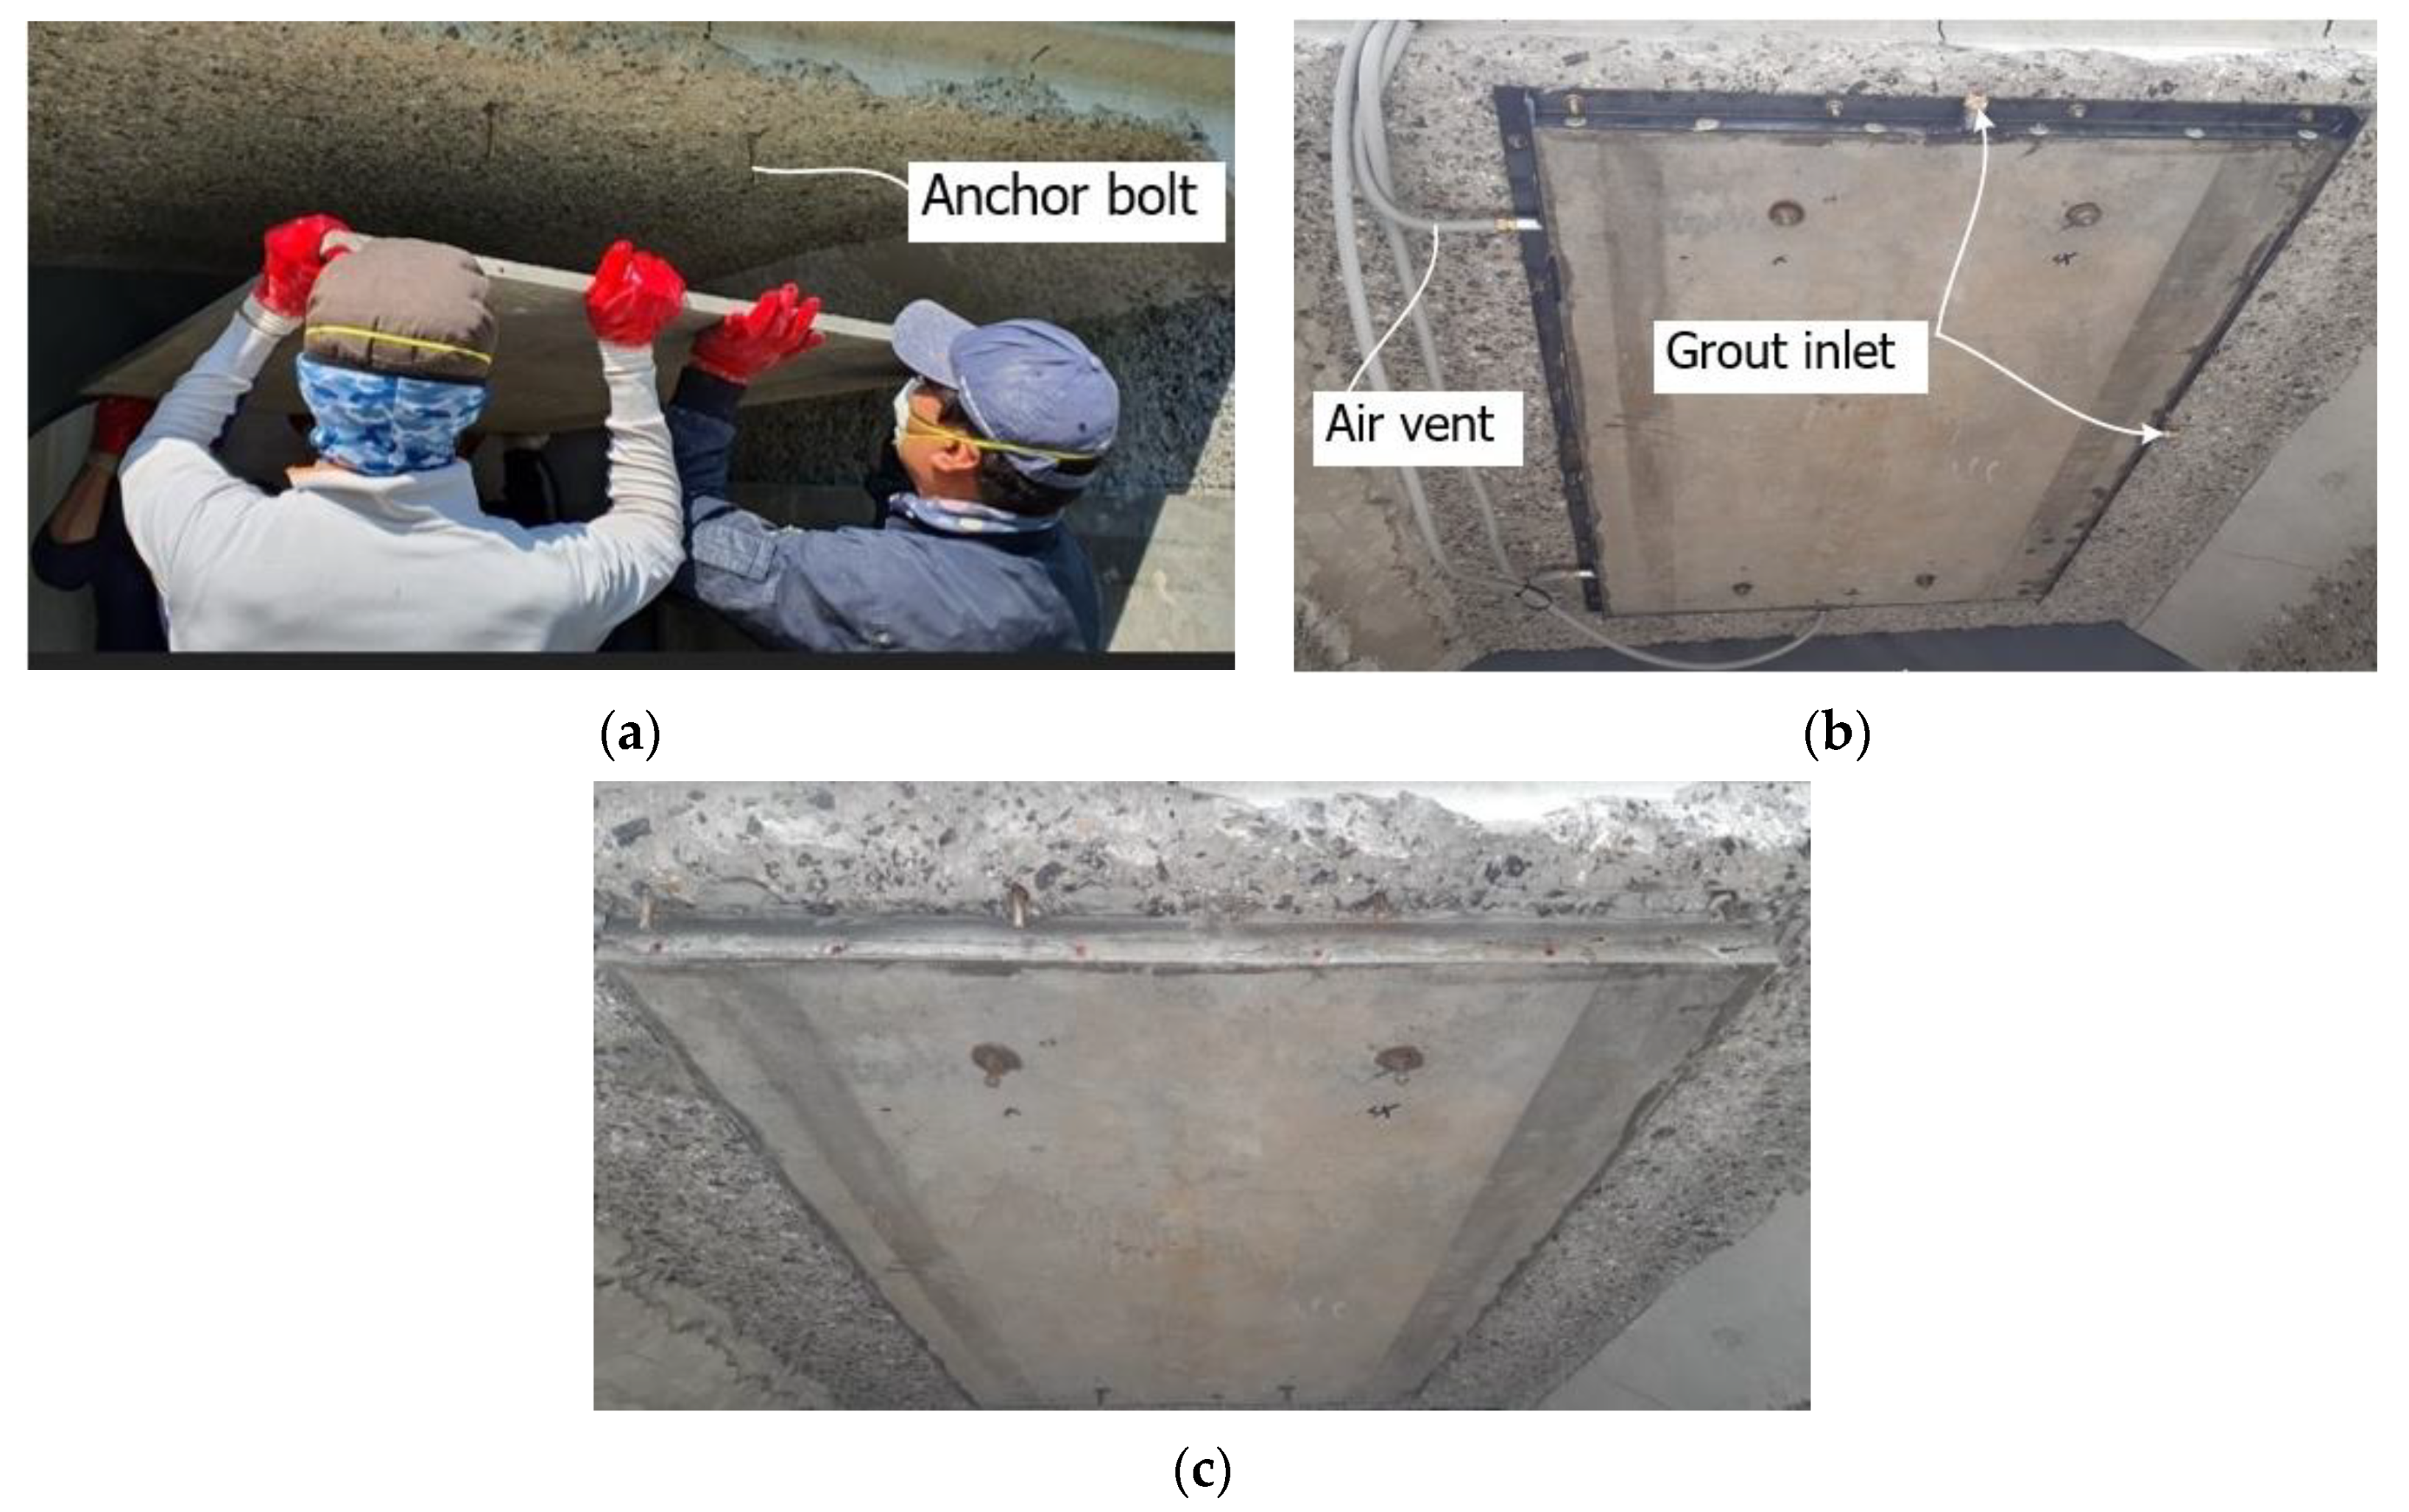
The TRC system is generally constructed by finishing or shotcreting. Recently, KICT [
17] carried out a study on the flexural performance of RC slabs strengthened with a cast-in-place TRC system by mortar shotcreting using an RC slab with the same dimensions as that of the present study and a TRC system with the same thickness as that of the TRC panel of this study. The same carbon fibertex (3200 tex) was used for the textile grid but the grid spacing was 25 mm, which represents a cross-sectional area that is approximately 17% smaller compared to the textile grid used in this study. Polystyrene was used as resin and the tensile strength and elastic modulus were respectively 1700 MPa and 200 GPa. The mix design of mortar used in the TRC system and the strengthening thickness of 20 mm are identical.
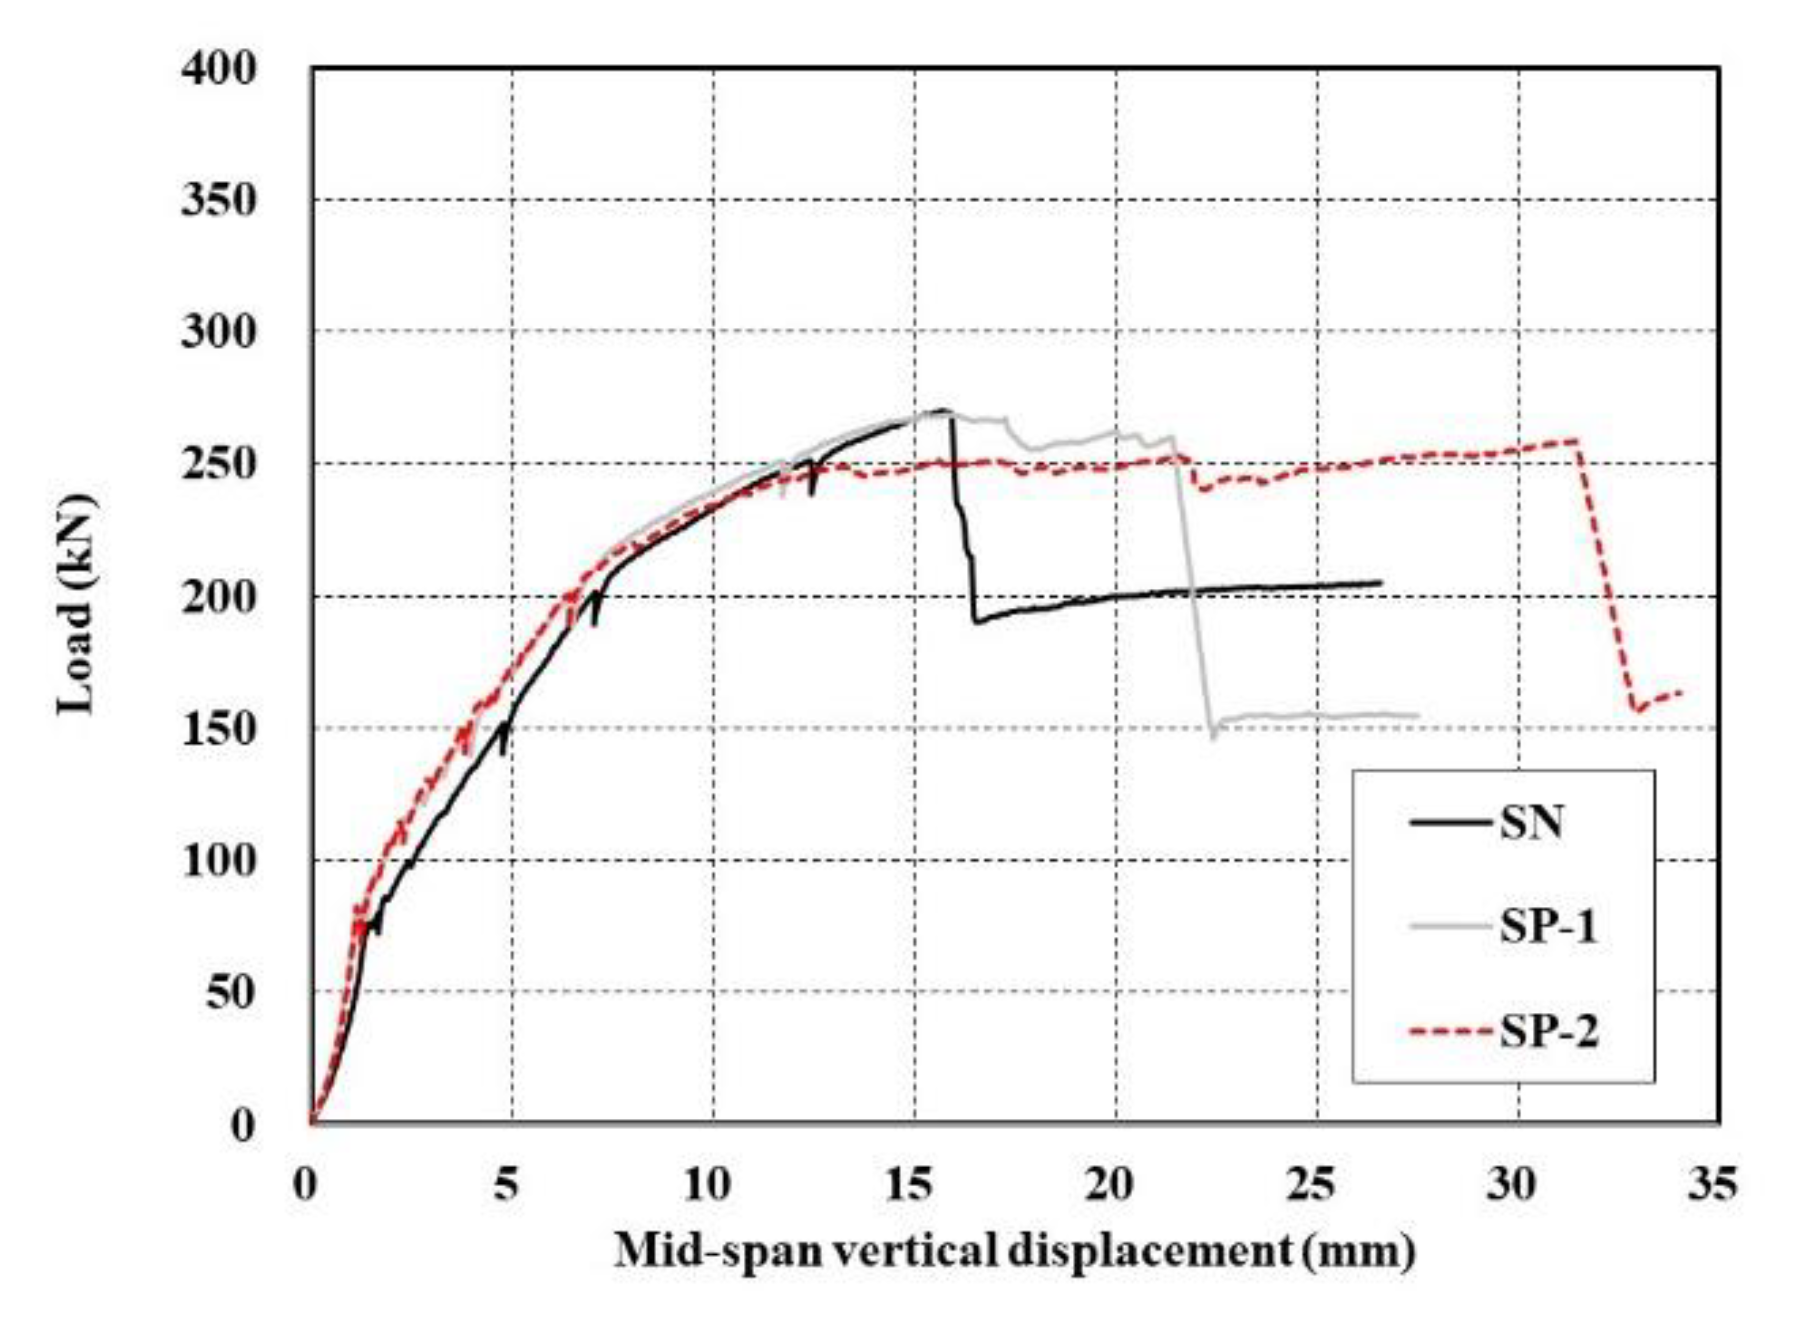
Figure 11 compares the load–displacement curves of the specimen strengthened with the TRC panel and the SN specimen strengthened by a cast-in-place TRC system of KICT [
17]. The SP series and the SN specimen exhibited quasi-similar load resisting performance where the load-carrying capacity develops until the peak load and shows a steep loss after failure to reach a level comparable to that of the yield load of the matrix. It can be clearly seen from
Figure 11 that the failure of the SN specimen occurred with a low value of displacement relative to that of the SP series specimens because the tensile strength of the textile used for the SN specimen was approximately 51% of that used for the SP series specimens. However, in view of the post-failure strength, the strengthening with the cast-in-place TRC system exhibits a slightly higher value of 200 kN than that (150 kN) developed by strengthening with TRC panels. Considering that the yield load of the RC slab to be strengthened was around 140 kN (
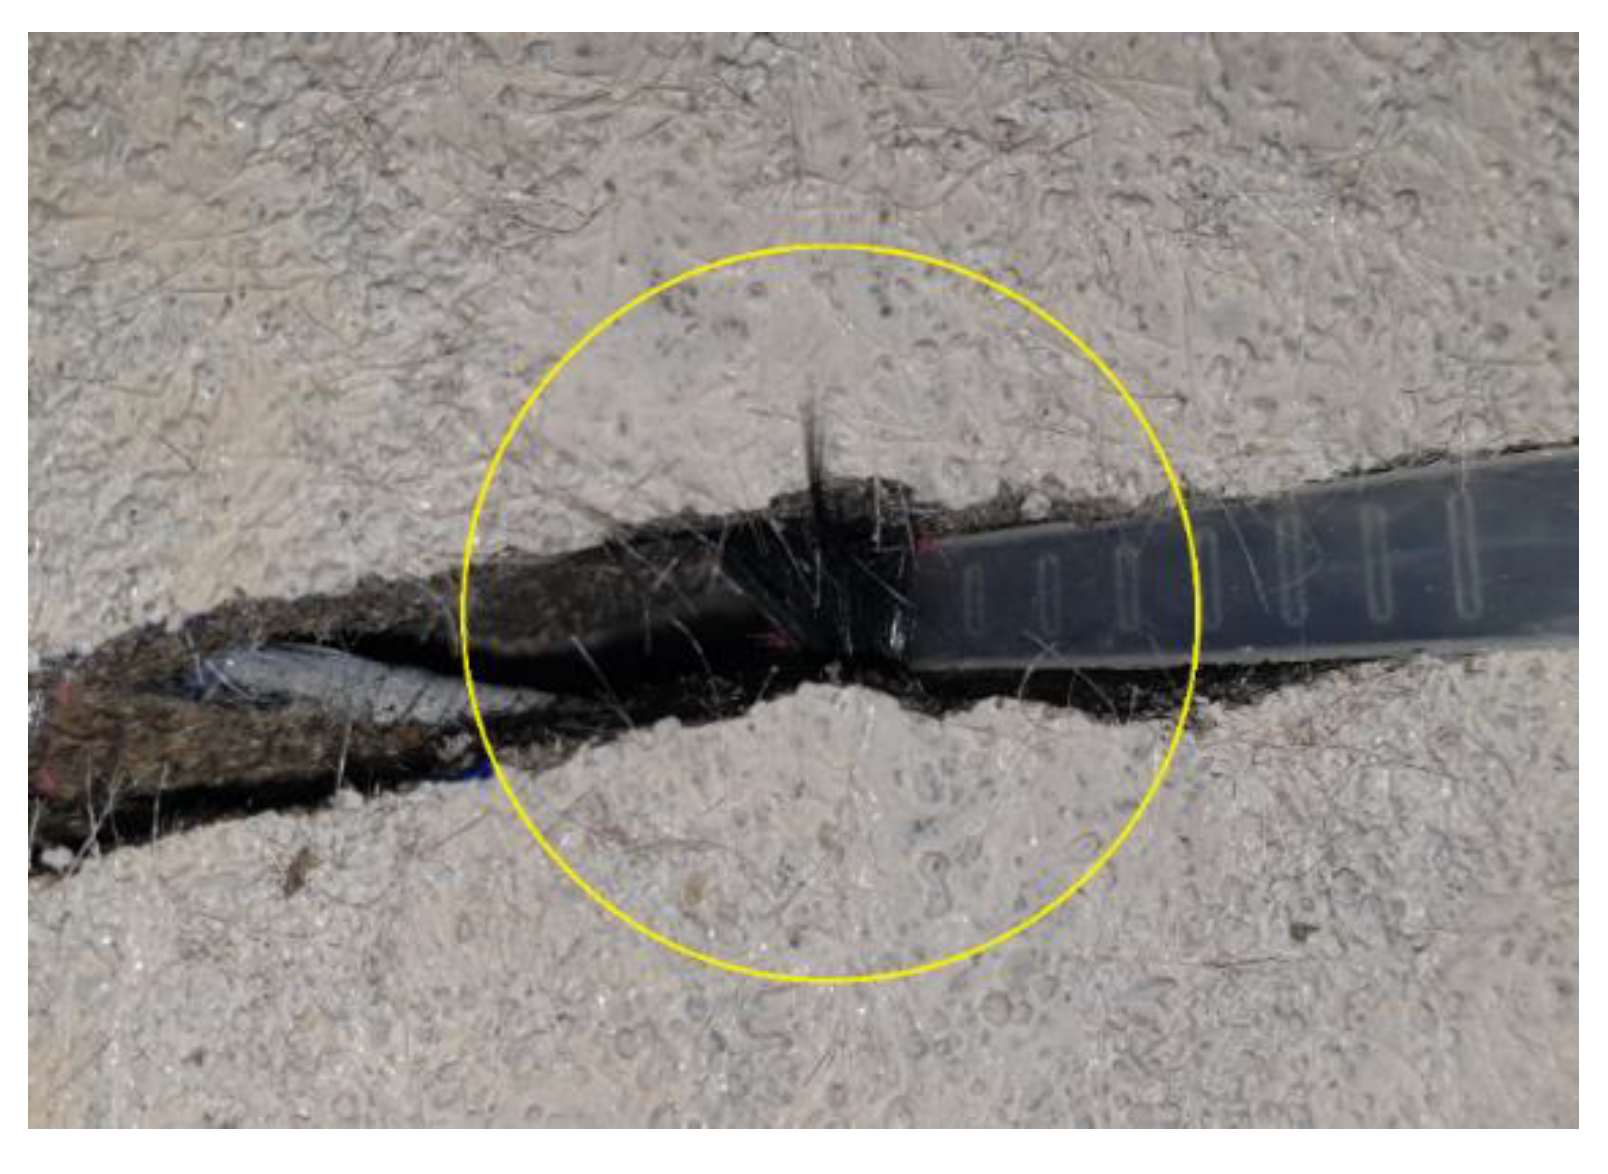
Table 5), the specimen strengthened with a TRC panel faithfully fulfilled its strengthening performance after the final failure. The specimen with the cast-in-place TRC system continued to resist the external force to some extent by transferring it to the remaining fibers even when the specimen partially lost its strengthening performance due to the rupture of a portion of the fibers of the carbon grid (
Figure 12). Despite that post-failure is meaningless in terms of the resistance of the structure, this transfer of the external force can be credited to the relatively uniform bonding between the TRC and the slab in the specimen with the cast-in-place TRC system.
If the failure of the RC slab strengthened with the TRC panel is not flexural tensile failure of concrete nor concrete crushing on the compression zone, this failure can be attributed to the following four causes. The first cause is the rupture of the textile when the TRC system and the slab are perfectly composed. The second cause is the bond failure between the TRC panel and the slab. The third cause is the shear (inclined tension) of the slab. The final cause is the failure caused by a slip between the carbon grid and the matrix. The first and second causes generally generate brittle failure due to the adopted materials and the combination of two different members. This situation can be verified in
Figure 11 through the sudden loss of load-carrying capacity after the peak load in the load-displacement curve of the SN specimen in which some fibers of the carbon grid experienced rupture.
Figure 13 shows the crack patterns viewed from the side of the specimens. The failure induced by the inclined tensile cracks tended to be brittle in some cases. For the SP series in
Figure 13a,b, inclined tensile cracks were not visibly observed until failure. In addition, for the SSP series in
Figure 13c,d, inclined tensile cracks were observed. For SSP-1 specimens, these cracks were not visible until 250 kN but developed immediately when reaching the peak load of 276 kN. In the case of the SSP-2 specimens, inclined tensile cracks were observed at around 250 kN and developed suddenly when the peak load of 305 kN was reached. The occurrence of inclined tensile cracks in the SSP series was caused by the change of the failure mode from flexure to flexure-shear due to the additional arrangement of reinforcement. Even though the slope of the load-displacement curve is relatively smaller than that of the SN specimen (
Figure 9), the failure of the RC slab due to the inclined tensile cracks approximately shows the pattern of brittle failure.
The load-displacement curve of the RC slab strengthened only with the TRC panel shows a slightly different shape. In
Figure 9 and
Figure 11, the displacement measured from the yield load to the peak load appears to be longer than those of the SN and SSP series. This shape appears when the load-carrying capacity continuously decreases as the applied load increases. If inclined tensile cracks do not continuously develop according to the load increase, this situation can be attributed to the occurrence of slip between the matrix and carbon fiber of TRC or to the successive rupture of the carbon fibers forming the textile. In other words, the resistance degrades due to the slip or rupture of carbon fiber and this degradation process repeats whenever the load is increased. This explains the continuous increase of the displacement without any increase in the load-carrying capacity. Since carbon fiber is a brittle material with high tensile performance, the load–displacement curve is likely to exhibit a stepwise shape if the strands undergo rupture successively. Accordingly, the experimental results of this study can be credited to the occurrence of slip between the matrix and the carbon grid constituting TRC. Note that such results are not caused by the difference in the strengthening method; rather, they are attributable to the material properties of the mortar and textile grid.
3.5. Analytical Solutions
The theoretical analysis is based upon the following general assumptions adopted in the analysis of RC structural sections [
22] together with additional assumptions considering the TRC system: (1) the strain distribution in the section is linear. In other words, a plane section before flexure remains plane after flexure and is perpendicular to the neutral axis; (2) concrete and steel reinforcement as well as the structure being strengthened and the TRC system are perfectly composed and behave monolithically; (3) the resistance of the TRC matrix to cracking is ignored; (4) steel reinforcement behaves bi-linearly and textile behaves linearly; and (5) the effective tensile strain level in the carbon grid is set to 0.012, as recommended by ACI [
23]. The theoretical analysis presented in this paper considered flexural failure only.
The ultimate compressive strain of concrete in the compression zone is 0.003 and the following stress-strain behavior is considered for concrete [
24]:
where
,
= compressive stress and strain levels in concrete;
,
= maximum stress in flexure of concrete and strain corresponding to the maximum stress of concrete (
); and
,
= ultimate compressive strain and elastic modulus of concrete.
The internal force of concrete when establishing the equilibrium equation for the internal forces in the loaded section can be obtained by Equations (2) and (3).
where
= tensile force provided by steel;
= tensile force provided by TRC;
= compressive force provided by concrete;
= distance from extreme compression fiber to the centroid of steel reinforcement; and
= width of the cross section.
= cross-sectional area of longitudinal steel reinforcement;
= area of fabric reinforcement by unit width;
= steel tensile strength;
N = number of layers of mesh reinforcement;
and
= modulus of elasticity and tensile strain of TRC, respectively. The parameters
and
for computing the equivalent block stress can be obtained as follows [
24].
Ultimate moment and load can be computed according to Equations (5)–(7) respectively as
where
and
= by member, steel reinforcement, and TRC, respectively;
d and
= distance from extreme compression fiber to centroid of tension steel and TRC, respectively;
= steel tensile yield strength;
,
, and
= distance from extreme compression fiber to neutral axis, flexural strength, and load at ultimate state, respectively;
a = distance between load and support points.
The theoretical peak load of the specimens was computed (refer to [
5] for the calculation process), and
Table 7 compares the analytical and experimental results. The corresponding deflection was calculated from the curvature of the changing section according to the load increase. In
Table 7, it appears that the theoretical values obtained using the constitutive laws of each material predict with very good accuracy the experimental results for the RC slab. The peak load is predicted with good accuracy for SP series but there is some discrepancy in the displacement between the predicted and experimental values. The theoretical calculation for the SN specimens in which the fiber experienced rupture provided satisfactory prediction of the peak load and displacement. Therefore, it appears that the slip of the textile inside the TRC system occurred as explained for the SP-2 specimen. For the SSP series, the theoretically calculated values are significantly larger than the experimental values. This last observation can be attributed to the fact that TRC could not sufficiently develop the required material performance due to the failure of the RC slab.


