Abstract
Although many different analytical models of local bond stress–slip have been proposed, considering the possible differences between materials in different countries, their applicability needs to be further explored. In this paper, the local bond stress–slip characteristics of reinforcing bars embedded in concrete with different strengths were experimentally studied. The experimental variables included the concrete strength (20, 40, and 60 MPa) and deformed rebar size (#4, #6, and #8). The experimental results of the bond stress–slip relationship were compared with the Euro-International Concrete Committee (CEB-Comité Euro-International du Béton)-International Federation for Prestressing (FIP-Fédération Internationale de la Précontrainte) Model Code and prediction models found in the literature. In addition, based on the test results, an empirical model of the bond stress–slip relationship was proposed. The evaluation and comparison results show that, regardless of the concrete strength grades, the predicted value calculated using the CEB-FIP Model Code will underestimate the bond strength of the specimens with different steel bar diameters. From this perspective, it is more conservative. In contrast, the proposed model can predict the test results with a reasonable accuracy.
1. Introduction
It is well known that reinforced concrete (RC) has many advantages. Therefore, it has become the most important composite material in modern civil engineering and has been widely used in various construction projects. In RC structures, the reinforcing bars are embedded in the tensile area of the concrete. This is mainly to compensate for the tensile strength of the concrete and effectively absorbs all of the tensile forces without separating from the concrete. For an RC member to perform its intended function, it is necessary to generate a bond force at the interface between the concrete and steel to prevent significant slip at the interface. In other words, bond action is the mechanism that ensures the composite behavior of concrete and reinforcing bars [1].
According to the definition of Building Code Requirements for Structural Concrete (ACI 318-11) and Commentary [2], bond stress is a shear stress transmitted along the interface between steel and concrete. For a deformed bar, the capacity of this interface to transfer stresses between the two materials is mainly composed of three resistance mechanisms, namely (1) the chemical adhesion between steel and concrete, (2) the friction between the two surfaces, and (3) the mechanical interlock of the ribs against the concrete, as shown in Figure 1 [3,4]. Once the tensile capacity of the adhesion is exhausted, the embedded bars will slip, resulting in friction. As the slip increases, the friction between steel and concrete diminishes, and the bond strength is sustained through mechanical interaction.
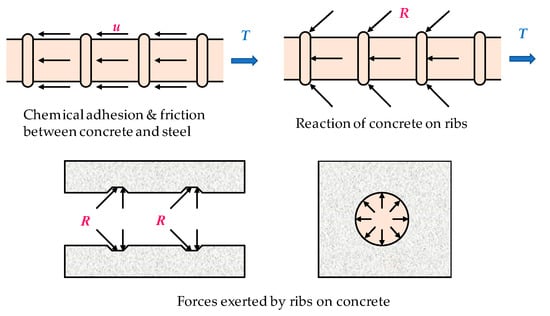
Figure 1.
Bond force transfer mechanisms.
In RC structures, the bond-slip effect between the reinforcing bars and the concrete has a significant effect on the mechanical and seismic performance of the structure and members [5]. On the one hand, the quality of the bond performance directly affects the structure’s deflection, ultimate bearing capacity, crack width, and distribution [3]. On the other hand, under cyclic loading (such as earthquakes), the bond stiffness deteriorates rapidly, resulting in a significant increase in the amount of steel slip. Therefore, the hysteretic performance of RC structures largely depends on the interaction between reinforcing bars and concrete.
Essentially, the magnitude of the bond stress varies along the embedded length of the reinforcing bar. In structural design, several important parameters depend on the bond performance. For example, the anchorage length of the steel bar, the lap splices, and the tension stiffness between the cracks [6]. Moreover, cracks can cause large changes in the bond stress. When a reinforcing bar is stressed in tension, such as in a crack, the resulting elongation can cause sliding relative to the surrounding concrete. The ribs on the periphery of the bar bear on the concrete as they attempt to displace the concrete in order to pullout, thus exerting rupture pressures on the inner perimeter of the concrete [1]. As a result, the crack width and deflection of RC members are affected by the bond stress distribution along the reinforcing bar and the slip between the bar and the surrounding concrete [7].
The bond stress between steel and concrete is a result of the mechanical interaction of the two materials. In structural design, in order to simplify the calculation process, some scholars use the concept of the average bond stress to reflect the steel bond strength with concrete. Eligehausen et al. [8] set a shorter anchor length (, where is the anchor length and is the diameter of the reinforcing bar) in their experimental research. Its purpose is to reduce the influence caused by an uneven bond stress distribution along the embedded length of the steel bar. Therefore, that the measured test results could be close to the true local bond stress. Oh and Kim [9] proposed a realistic model of the bond stress-slip relationship under repeated loads. The test showed that if bond failure did not occur, the bond strength and the slip at peak bond stress were not influenced much by repeated loading. However, the values of loaded slip and residual slip increased with increasing load cycles. In a theoretical analysis, Filippou et al. [10] assumed that the bond stress was evenly distributed along the anchoring length, and the following differential relationship could be established according to the balance between reinforced concrete:
where is the bond stress and is the reinforcing bar stress. Then, the bond stress derivation formula could be obtained:
Basically, bond stress is a function of several parameters, such as concrete’s compressive strength, the surface of the bar roughness and/or irregularities, the diameter of the bars, and the type and disposition of the ribs. As early as 1987, it was proposed that bond stress–slip–rebar strain can be used to express the bond–slip relationship [11]. Kankam [12] established the relationship between bond stress, steel bar stress, and slip based on an experimental analysis. At present, there are two common ways to express the bond–slip relationship. Among them, τ-s is the most common, that is, the relationship between the bond stress and the amount of slip. The other is σ-s, which is the steel bar stress and slip. The two can be transformed into each other.
In the experimental research on the bond-slip relationship of reinforced concrete, there are two commonly used test methods: the pull-out test and the beam test [13]. Among them, the pull test is the main research method. Eligehausen et al. [8] conducted a pullout test on 125 beam–column joint specimens through displacement control loading. The test comprehensively considered the influence of various factors on the bond–slip relationship, including the steel bar diameter, concrete strength, transverse compressive stress, load rate, etc. They finally established the bond–slip constitutive relationship of deformed bars under a monotonic load and cyclic load. Filippou et al. [10] established an analytical model describing the hysteretic behavior of reinforced concrete beam-column joints. The model considered the effect of bond slip and the degradation of bond strength under the control of cyclic displacement. Therefore, the model is collectively referred to as the Eligehausen–Filippou model. CEB-FIP Model Code 1990 [14] and 2010 [15] also adopted this model successively, which comprised four distinct branches: A curvilinear ascending region; a constant maximum region; a linearly descending region; and a region of constant frictional bond stress, as shown in Figure 2. In order to establish the bond–slip constitutive relationship of moderately confined concrete, Guizani et al. [16] produced 43 moderately anchored reinforced concrete specimens. The anchorage length of each specimen was , and the influence of the degree of restraint, the layering effect of concrete, the amount of initial loading, etc., on the test was studied. Based on Eligehausen’s test, Xu [17] conducted a pullout test on 334 reinforced concrete specimens with variables such as the concrete strength, concrete cover thickness, and stirrup content. Finally, using the experimental data for regression analysis, the calculation formula of the characteristic strength and the corresponding bond–slip constitutive relationship were obtained.
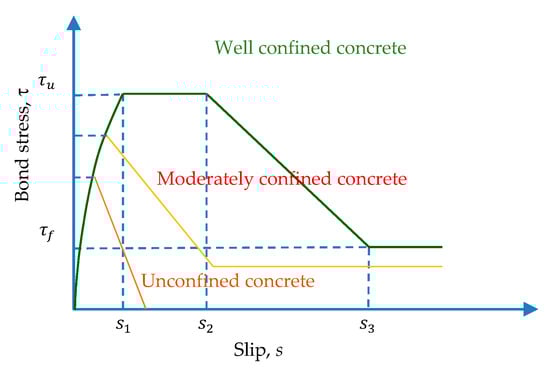
Figure 2.
Comparison of bond–slip curves under different constraints.
In view of the importance of the bond between steel and concrete, many scholars have conducted extensive research. In the past few decades, many studies have proposed characteristic parameters for this complex problem [18,19,20,21,22,23,24,25,26,27,28,29,30,31,32,33,34,35,36,37,38,39,40,41,42,43,44,45,46,47,48]. However, due to the complexity of the bond interface, data dispersion, and other test conditions, the bond–slip constitutive relationship proposed by different scholars has certain differences and is often only applicable to specific situations. Therefore, further research and the application of such formulas are restricted. Based on the above analysis, it is necessary to conduct an in-depth study of the mechanism and factors influencing bond slip, as well as establish the corresponding bond–slip relationship. Its purpose is to reveal the behavior response of the RC structure more accurately and further improve the performance of the RC structure. Under the conditions of different rebar sizes and concrete strengths, this study performed the pullout experiment to compare and analyze the effect of each factor. In addition, through regression analysis, the formula for the local ultimate bond stress between the deformed steel bar and the concrete was obtained. Furthermore, a modified local bond stress–slip relationship was proposed.
2. Experimental Program
2.1. Material Properties
The materials used in this study for making specimens included cement, fine and coarse aggregates, superplasticizer, and reinforcing steel. The cement used was locally produced Type I Portland cement with a specific gravity of 3.15 and a fineness of 3400 cm2/g. Aggregate was locally produced. The coarse aggregate was crushed stone with a maximum particle size of 19 mm. the fine aggregate was natural river sand. Their physical properties are listed in Table 1. Two different superplasticizers produced locally (HICON HPC 1000 for medium-strength concrete and HICON MTP A40 for high-strength concrete) were used. HPC 1000 complies with the American ASTM C494 Type D regulations and HICON MTP A40 complies with the American ASTM C494 Type G regulations. Their physical properties are shown in Table 2. Three different reinforcing bars (#4, #6, and #8) of A706 were used. Their physical and mechanical properties are shown in Table 3.

Table 1.
Physical properties of coarse/fine aggregate.
Table 2.
Basic properties of superplasticizer.
Table 3.
Basic properties of rebars.
2.2. Concrete Mix Design and Test Specimens
The literature shows that the bond strength is closely related to the compressive strength of concrete. To analyze the influence of the concrete strength on the bond behavior, the specified 28-day compressive strengths chosen were equal to 20, 40, and 60 MPa (representing low, medium, and high grades respectively). This study referred to the Standard Practice for Selecting Proportions for Normal, Heavyweight, and Mass Concrete [49] specification for concrete mix design and adjusted the composition after trial mixing. The concrete mix design used is shown in Table 4. The abbreviations for identifying each concrete indicate the type of concrete: normal-aggregate concrete (C) and the strength of concrete (30 or 50 MPa).
Table 4.
Concrete mix design composition.
All aggregates were cured indoors until the required saturated surface-dry condition was reached. The processed aggregates were then stored indoors, and the ambient temperature and relative humidity (RH) were controlled at 25 °C ± 3 °C and 50% ± 5%, respectively, to prevent moisture changes in the aggregate. During mixing, the cement, fine aggregates, and coarse aggregates were first blended in the biaxial mixer at a rate of 45 revolutions per minute for about 1 min. Then the water and superplasticizer were added in the mixer and blended for about 1.5 min.
The pullout specimens were 150 mm cubes, which were cast using steel molds. For the cubic specimen, its single bar was anchored vertically along the central axis (see Figure 3). The embedded length in the pullout specimens was three times the bar diameter (i.e., ). As suggested by Soroushian et al. [36], this embedded length was short enough to assume that the slippage recorded was representative of a local bond stress value. The unbounded regions of the bar were sheathed with PVC pipes. In addition, the specimen contained three transverse stirrups to limit its splitting when the bar was placed in tension. In this study, three kinds of concrete strengths were tested, and three kinds of steel bars with different diameters were respectively configured to make nine groups of pullout specimens. To check the reliability of the test method and the dispersion of the test results, two nominally identical samples were made in each group.
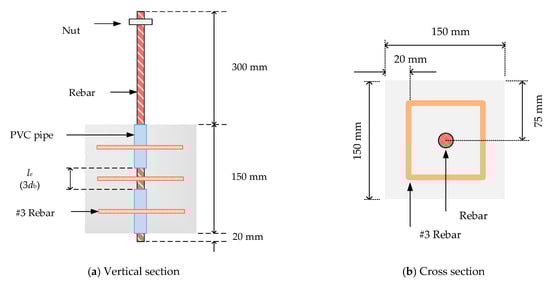
Figure 3.
Dimensions and cross-sections of specimen: (a) Vertical section; (b) Cross section.
When casting the pullout specimen, the fresh concrete was slowly poured into the mold to a depth of half, which was followed by controlled vibrations. After fully vibrating the sample, the mold was filled with concrete and vibrated again to ensure that the concrete was well-compacted. For each concrete mixture, six cylindrical specimens of 100 mm diameter × 200 mm height were also cast, hereinafter referred to as control cylinders. In addition, for each concrete mixture, six cylindrical specimens with a diameter of 150 mm × 300 mm in height were cast to determine their split tensile strength. After casting, the specimens were covered overnight with wet hessian and polyethylene sheets for a period of 24 h. Then, the pullout specimens and their respective control cylinders were removed from the molds. To maintain the same environmental conditions, all specimens were placed in water containers in the laboratory for 27 days. Each test was conducted 28 days after casting.
2.3. Instrumentation and Testing Procedures
According to Standard Test Method for Slump of Hydraulic-Cement Concrete ASTM C143 [50], Standard Test Method for Compressive Strength of Cylindrical Concrete Specimens ASTM C39 [51], Standard Test Method for Splitting Tensile Strength of Cylindrical Concrete Specimens ASTM C496 [52], and Standard Test Method for Static Modulus of Elasticity and Poisson’s Ratio of Concrete in Compression ASTM C469 [53], the slump, compressive strength, splitting strength, and elastic modulus of concrete were tested, respectively. The pullout specimens were loaded by using a 500 kN MTS servo valve-controlled machine, which was equipped with a special test frame, as shown in Figure 4. It can be seen from Figure 4 that one end of the test bar was loaded, and no load was applied at the other end. Three linear variable differential transformers (LVDTs) were used to measure the relative bond slip between steel and concrete. The test setup is shown in Figure 4. The pullout force was applied under displacement control at a constant displacement rate of 0.01 mm/sec until the specimen failed. The pullout force was measured by a dynamometer installed in the testing machine. The test progress was monitored on a computer screen. In addition, all load and displacement data were captured and stored on a floppy disk through a data logger.
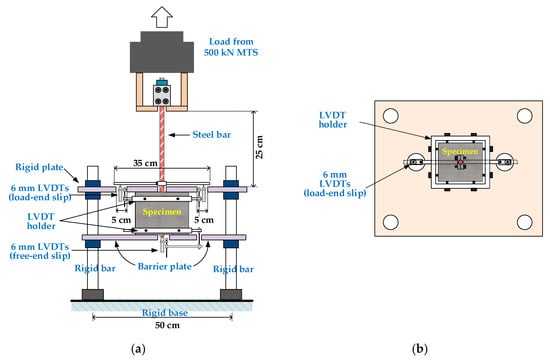
Figure 4.
Setup of the pullout test: (a) front view; (b) top view.
In most pullout tests, the embedded length of the steel bar was set to be short (), the steel bar was basically maintained in the elastic stage, and the bond stress was approximately constant [5]. In view of this, this study assumed that the bond stress was uniformly distributed along the embedded length (see Figure 5). Therefore, the bond stress could be calculated by dividing the applied load by the contact area between the steel bar and the concrete, as shown in the following equation:
where τ is the bond stress (MPa), P is the applied load (N), and bar diameter (mm), and is the embedded length (mm).
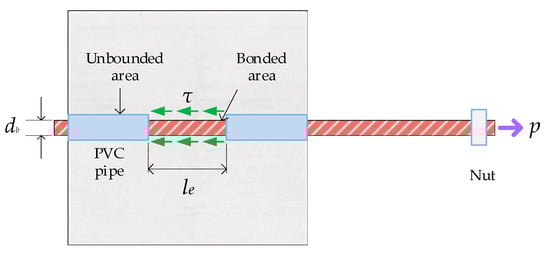
Figure 5.
Schematic diagram of local bond stress between the bar and concrete.
On the other hand, this value is usually obtained by measuring the steel bars at both ends of the specimen. Therefore, the analysis model of bond slip could be directly derived from the test data. The relative slip of the rebar and concrete corresponding to the bond stress could be divided into the slip at the loading end and the slip at the free end . In the case of a local bond, the relative slip of the rebar and concrete can be regarded as rigid motion, so under the same load, and should be the same. In this study, the average value of and could be taken as the slip corresponding to the bond stress, as shown in the following equation:
3. Experimental Results and Discussion
3.1. Fresh and Mechanical Properties of Concrete
The slump values of each concrete mixture are listed in Table 5. It can be seen from Table 5 that the slump of the three groups of concrete proportions is approximately the same, about 16–17 cm. On the day of the pullout test, each control cylinder was capped and subjected to a compression test to determine the compressive strength of each concrete mixture. The compressive strength of each concrete mixture is the average of three specimens. The test results show that the average value of the 28-day compressive strengths is close to the target value (that is, 20, 40, and 60 MPa), as shown in Table 5. In addition, the average values of the splitting tensile strength and elastic modulus of each concrete mixture are also listed in Table 5.
Table 5.
Mechanical properties of concrete.
3.2. Local Bond Stress–Slip Behavior
In this paper, the bond stress was calculated according to Equation (3). In addition, according to Equation (4), the slip was calculated as the average motion of the loaded end and free end of the steel bar relative to the concrete block. Therefore, the bond–slip curve could be drawn directly based on the test data. The local bond stress–slip curves for specimens with different concrete strengths and rebar diameters are presented in Figure 6, Figure 7 and Figure 8. With the different test variables, the bond stress–slip relationship of each specimen was also different. Overall, the behavior of the bond stress–slip relationship of the specimen shows that when the bond stress initially increased, the slip was very small. However, once the maximum bonding stress was reached, the curve softened immediately. During the loading process of the pullout test, the load was mainly transferred between the reinforcement and the surrounding concrete by means of adhesion and a mechanical bond. However, due to the low tensile strength of the interfacial zone, the bond strength, which depends on adhesion and surface friction, was inherently weak. In contrast, the inclined ribs acted as an interlocking bearing on adjacent concrete, and the deformed rebar produced a greater bond strength. This is the main mechanism of load transfer, and its strength limit state is usually controlled by the splitting strength of surrounding concrete [19]. During the translation of the deformed bar relative to the concrete, the ribs will either split the concrete by pushing it away or crush the concrete by enclosing it in the spaces between them. Lutz et al. [4] have shown that, for rib angles between 40° and 105°, relative motion is almost entirely caused by the latter effect.
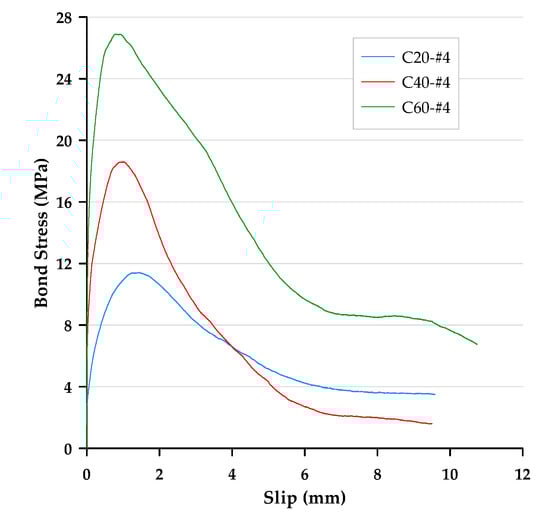
Figure 6.
Local bond stress–slip curve for specimens with the #4 rebar.
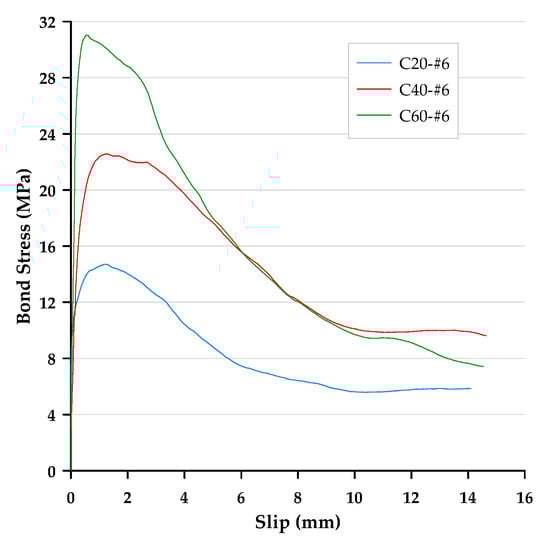
Figure 7.
Local bond stress–slip curve for specimens with the #6 rebar.
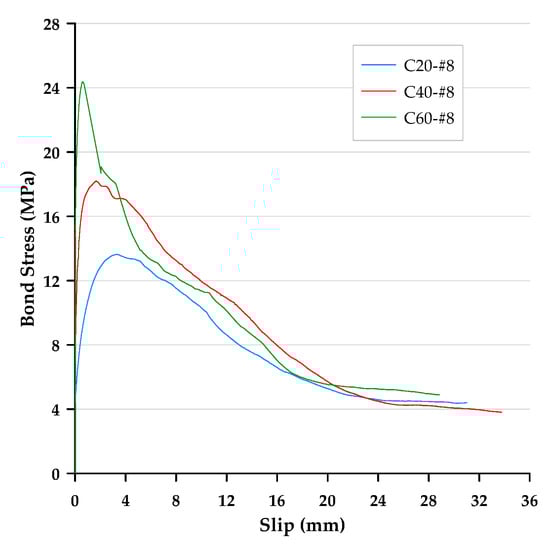
Figure 8.
Local bond stress–slip curve for specimens with the #8 rebar.
From the pullout test results, it can be seen that the response can be divided into five stages (see Figure 9), as described below:
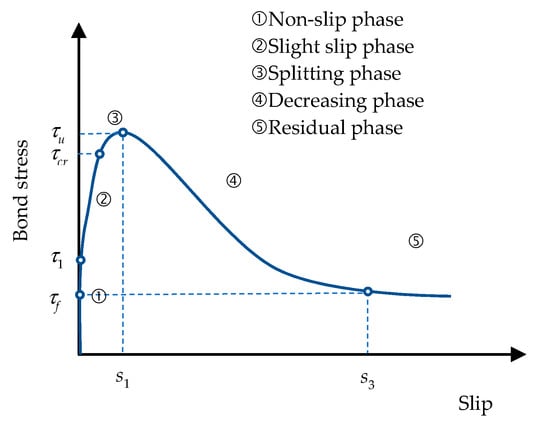
Figure 9.
Typical local bond stress–slip curve.
- Stage 1: At the initial stage of loading, there was a short non-slip straight line section, mainly due to the chemical adhesion and friction between the steel bar and the concrete;
- Stage 2: When the loading was up to / ≈ 0.3, the chemical adhesion between the rebar and concrete failed, and the rebar and concrete started to produce a relative slip;
- Stage 3: When the loading increased continually and the bond stress reached a splitting bond stress (), radial splits appeared around the rebar due to the radial pressure exerted by the rebar lugs. However, the confining effect of the stirrup could delay the development of splitting, and the load could continue to increase;
- Stage 4: When the loading was increased continually for the ultimate bond stress (), the concrete within the clear rib spacing of the tested rebar was crushed completely, and shear-cut slip along the rib outer diameter occurred. At this time, the bond stress decreased quickly and the slip amount increased quickly;
- Stage 5: When the slip amount reached , approximately the clear rib spacing of the tested rebar, the concrete between the ribs was completely cut-off. At this time, the bond stress did not keep decreasing; that is, the residual bonding stress () was only provided by the friction between the steel bar and the surrounding concrete.
3.3. Failure Modes
Bond failures are generally divided into pullout failures or splitting failures. In this study, the failure of most test specimens belonged to the pull-out mode, while a few specimens failed in splitting failure mode. Due to adhesion, the bond stress–slip curve was initially very steep, as shown in Figure 6, Figure 7 and Figure 8. It is worth noting that the magnitude of the bond stress did change according to the test variables, and the effect of the size of the rebar is the most significant. Regardless of the concrete strength level, all specimens with the #4 rebar or #6 rebar exhibited pullout failure, which resulted in shearing along a surface at the top of the ribs around the rebar. The reason for this failure mode is that the stirrup was able to prevent or delay splitting failure. In other words, on the one hand, when the radial force from the loaded rebar is less than the resistance of the surrounding concrete and/or stirrups, and on the other hand, the tangential force is greater than the resistance of the concrete, a pullout failure mode will occur.
For the specimen with a concrete strength of 60 MPa and a #8 rebar, the concrete cover was less than that of the #4 rebar, and under the condition of an embedded length equivalent to , the embedded length of the rebar was longer than that of the #4 rebar specimen. As the rebar was loaded, it exerted radial pressure on the surrounding concrete. When the bond stress developed to a fixed level, if the surrounding concrete or stirrups were not able to resist the pressure, cracks were generated at the interface of the concrete-reinforcing steel. Once these cracks propagated to the surface, they caused failure of the concrete by concrete cover splitting, as shown in Figure 10. This caused failure as a result of split before developing into a real ultimate bond stress. As can be seen from Figure 8, the bond stress decreased dramatically when the specimens produced splitting failure. This meant that the rebar and concrete lost their bond performance. As a result, only the frictional force between the rebar and the surrounding concrete could provide residual bond stress.
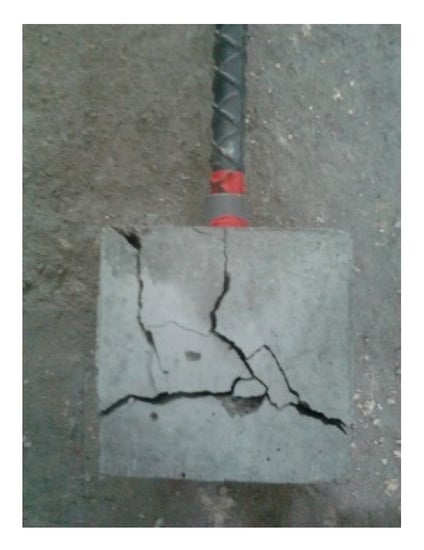
Figure 10.
Appearance of the specimen with splitting failure.
3.4. Ultimate Bond Stress
Pull out tests were conducted on specimens with different concrete strengths and rebar diameters. In total, there were nine different combinations of concrete strength and rebar diameter. A total of 18 specimens completed the pullout test, and the test age was 28 days. The bond strength is a key mechanical property of RC members, which refers to the bond stress corresponding to the ultimate load recorded during the test. Table 6 presents the experimental results of ultimate bond stress for each combination of concrete strength and rebar diameter, which is the average of two nominally identical test specimens.
Table 6.
Test result of ultimate bond stress.
3.4.1. Comparison of Ultimate Bond Stress between Test Result and Prediction Models
Investigations into the bond strength between the concrete and rebar have been carried out for many years. Many researchers have studied the relationship between pullout load and compressive strength. All studies in this field unanimously show that the compressive strength of concrete is an important factor affecting the bond strength [15,37]. In addition, researchers have also explored the influence of other factors, such as the thickness of the concrete cover, the diameter of the rebar, the embedded length, and the transverse stirrups ratio, on the bond strength [38,39,40]. This study selected some common prediction models of bond strength to compare with the test results. Further, this study proposes two prediction models of bond strength based on the test results. These prediction modes are described below.
(1) CEB-FIP Model Code 2010
For specimens with good confinement and non-split failure, the calculation formula of the ultimate bond stress (bond strength) recommended by the CEB-FIP Model Code 2010 is as follows [15]:
where is the concrete compressive strength.
(2) The prediction model proposed by Huang et al.
Huang et al. proposed a prediction formula for the ultimate bond stress, as shown below [37]:
where is the concrete compressive strength.
(3) The prediction model proposed by Xu
Xu proposed a prediction formula for the ultimate bond stress, as follows [17]:
where compressive strength of concrete, c is the thickness of concrete cover, diameter of the rebar, is the embedded length, tensile strength of concrete, is the stirrup ratio, is the stirrup area, and is the stirrup spacing.
(4) The prediction model proposed by Soroushian and Choi
Soroushian and Choi proposed the empirical formula of the ultimate bond stress from the partial bond pull test, as shown below [38]:
where compressive strength of concrete and is the diameter of the rebar.
(5) The prediction model proposed by Aslani and Samali
Aslani and Samali proposed an empirical formula for the ultimate bond stress of concrete, as follows [39]:
where is the compressive strength of concrete, c is the thickness of concrete cover, is the diameter of the rebar, and is the embedded length.
(6) The prediction model proposed by this study
According to the test results, this study proposes two prediction models. One of them is obtained by simple regression analysis and the other is obtained by multiple regression analysis, which are described as follows:
where compressive strength of concrete, c is the thickness of concrete cover, and is the diameter of the rebar. It can be seen from Figure 11 that the proposed univariate regression prediction model of bond strength has a good correlation coefficient. The coefficient of determination (R2) of Equation (13) is 0.9568.
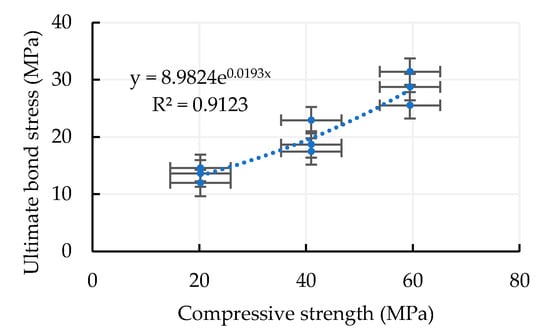
Figure 11.
The proposed univariate regression prediction model of bond strength.
The experimental results of for each specimen, together with their values predicted by each prediction model, are compiled in Table 7. It can be seen from Table 7 that regardless of concrete strength grades or the rebar size, the measured is greater than the recommended by the CEB/FIP Model Code. In other words, the CEB/FIP Model Code is more conservative. The reason for this result can be seen from Equation (5); the CEB/FIP Model Code only considers the effect of the concrete compressive strength and does not consider other factors. Huang et al.’s prediction model is also more conservative. Therefore, the CEB/FIP and Huang et al.’s prediction model [37], which only consider the effect of the concrete strength on , are unable to accurately estimate the test results. In addition to considering the compressive strength of concrete, the prediction models of Xu [17], Soroushian and Choi [38], and Aslani and Samali [39] also include the influence of parameters such as concrete cover, the rebar diameter, and embeddedness. The prediction results of these prediction models tend to be overestimated, but there are also cases where underestimation occurs, as shown in Table 7. In contrast, the two prediction models proposed in this study have excellent prediction results, as shown in Figure 12. It can be seen from Figure 12 that the less scatter of data around the diagonal line confirms the fact that Equations (12) and (13) are an excellent predictor for the value of . The correlation between the experimental values and the predictive values, which were obtained from Equations (5) and (7) and Equations (10) and (11), is more scattered.
Table 7.
Comparison of ultimate bond stress between the test result and prediction models.
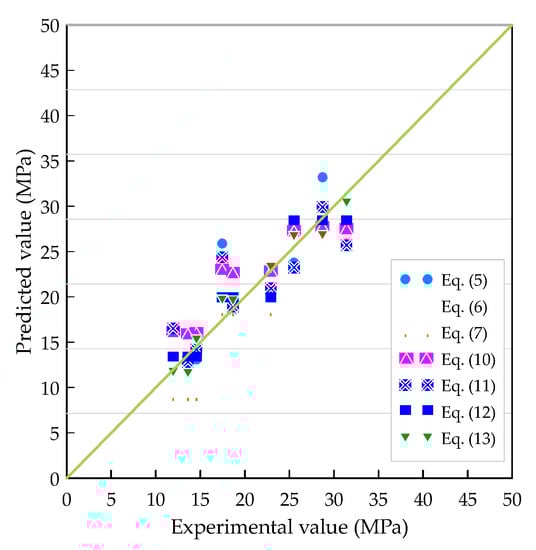
Figure 12.
Comparison of prediction models of ultimate bond strength.
3.4.2. Effect of the Rebar Size on the Ultimate Bond Stress
In theory, the rib area increases with an increasing rebar diameter. However, the shape parameter of the rebar does not change linearly with the rebar diameter, and the height of the rib decreases relatively. Accordingly, the area of the rib does not actually increase much. In other words, the larger the diameter of the rebar, the smaller the bond area. As a result, is smaller. This result can be confirmed by Figure 13, regardless of the concrete strength of the test specimen. When the diameter of the rebar changed from #6 to #8, the normalized ultimate bond strength () decreased.
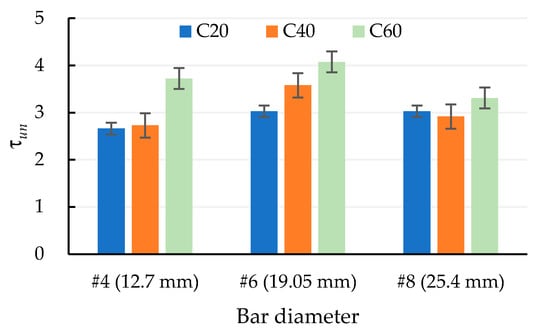
Figure 13.
Normalized ultimate bond strength of different rebar diameters and concrete strength grades.
In fact, the rib height also plays a vital role when discussing the bond properties between the concrete and rebar. Figure 13 shows that under the same concrete strength conditions, the of specimens with #4 and #8 were lower than that of specimens with #6. The reason for this is that the of the specimen is significantly related to the rib height of the rebar. As can be seen from Table 3, the rib height values of #4, #6, and #8 are 0.7, 1.9, and 1.7 mm, respectively. Furthermore, the ratio of the rib height to diameter () of the rebar can be used as a parameter to explore its effect on . According to the physical properties of steel used in this study (see Table 3), the values of for #4, #6, and #8 are 0.055, 0.1, and 0.067, respectively. It can be seen from Figure 14 that, for specimens that failed in the pullout mode, the greater the value of , the greater the . From this perspective, the use of in analyzing not only demonstrates a regular linear relationship, but also interprets test results well.
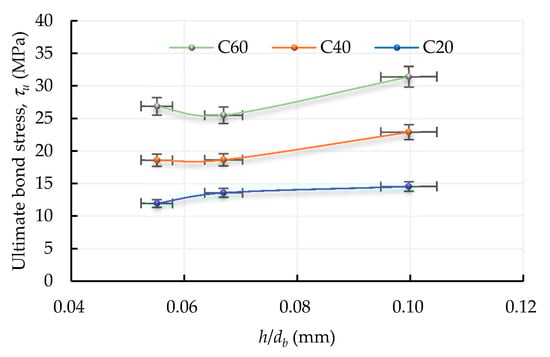
Figure 14.
Relationship between and .
3.4.3. Effect of the Concrete Strength on the Ultimate Bond Stress
Table 5 shows that as the compressive strength of concrete increases, its splitting strength also increases. Therefore, along with the increase in compressive strength, the bond performance between the rebar and the concrete also increases, developing higher bond stress before failure, as shown in Figure 15. Under the condition of a lower concrete strength, the aggregate in the cracked surface is mostly not damaged, which is able to provide a higher bearing characteristic, thus enhancing the overall bond strength. However, under the condition of high-strength concrete, the aggregate in the cracked surface is often cleaved or broken. The bearing force provided by aggregates is relatively small, so the mortar matrix is the main factor affecting bond failure.
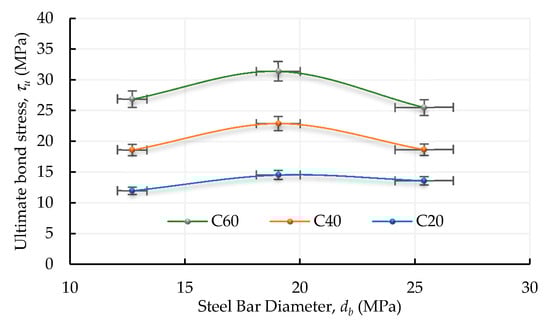
Figure 15.
Relationship between the rebar diameter and ultimate bond stress for various concrete strengths.
3.5. Comparison of Measured Bond Stress–Slip Behavior with Prediction Models
As early as 1983, Eligehausen et al. [8] developed a bond–slip analysis model based on a single pull test with a short embedding length. It is arguably one of the most widely used and accepted bond–slip models. The CEBFIP Model Code 2010 also uses this model. The analytical bond stress–slip model recommended by the CEB-FIP Model, Huang et al. [37], and Harajli et al. [40] is shown in Figure 16. It is composed of four distinct branches. The initial ascending branch reaches the ultimate bond stress () for . The second branch is regarded as a plateau, during which the slip continues to increase while maintaining a constant bonding stress. for . Then, the linear descending branch begins from to . Subsequently, a constant residual bond strength () is reached due to pure friction between the rebar with cracked concrete lugs and surrounding concrete. In this study, these three modes were selected for comparative analysis with the measured bond stress–slip behavior of the specimen. According to the bond stress–slip relationship recommended by CEB-FIP Model, Huang et al. [37], and Harajli et al. [40], the bond stress (τ) between the concrete and rebar can be calculated as a function of the relative displacement (s) using the following equation:
where is the ultimate bond stress, is the residual bond stress; s is the bond slip, , , and are the slip at the beginning of ultimate bond stress, slip at the end of ultimate bond stress, and slip at the beginning of residual bond stress, respectively, and α is a curve fitting parameter, and its value is less than 1.
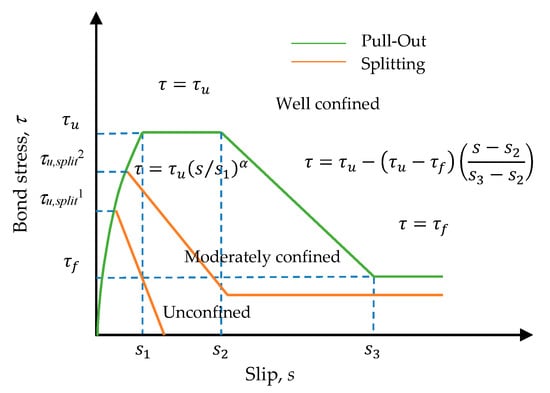
Figure 16.
Analytical bond stress–slip relationship (CEB-FIP Model Code 2010).
The controlling parameters suggested by CEB-FIP, Huang et al. [37], and Harajli et al. [40] are shown in Table 8. According to Table 8, although the controlling parameters are different, the main curves of these three bond stress slip models are basically similar to each other. On the other hand, based on the test results, this study replaces in Table 8 with Equation (13). In addition, the relationship between the observed slip corresponding to the maximum bond strength , the clear rib spacing of the tested rebar , and the rebar diameter is obtained by regression analysis, as shown in Equation (15). Then, other controlling parameters are also adjusted according to the actual results. Through this amendment, a bond–slip model is proposed, and its controlling parameters are shown in Table 8.
Table 8.
Parameter values of the prediction model for the bond stress–slip relationship.
The bond stress–slip relationship recommended by CEB-FIP Model, Huang et al. [37], and Harajli et al. [40] was compared with the measured bond stress–slip behavior of the specimen (see Figure 17, Figure 18 and Figure 19). As can be seen from these figures, regardless of the strength of the concrete, the predicted value calculated using the CEB-FIP Model Code and Harajli et al.’s model underestimates the bond strength of the specimen with different rebar diameters. From this perspective, these two models are more conservative. In addition, it can be seen that the predicted value of low-strength concrete calculated by the model of Huang et al. underestimated the bond strength in all cases, while the predicted value of medium-high-strength concrete was overestimated. Theoretically, residual bond stress is associated with the ultimate bond. Therefore, when there is some difference between the ultimate bond stress and the predicted values calculated with the three models, the residual bond stress will also exhibit some differences. As for the value of slip at the start of residual bond stress, the measured slip is close to the value suggested by the three models, which is equal to one bar rib-net spacing. On the other hand, the slope of the curve for all specimens is far greater than those specified in the three models. This means that under the same bond stress, the measured slip is smaller than the value specified in the three models.
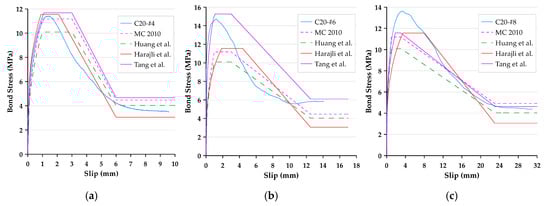
Figure 17.
Comparison of the local bond stress–slip curve produced with different prediction models: (a) C20-#4, (b) C20-#6, and (c) C20-#8 (for specimens with low-strength concrete).
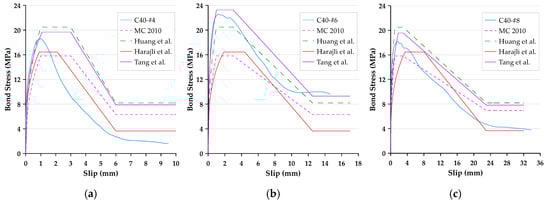
Figure 18.
Comparison of the local bond stress–slip curve produced with different prediction models: (a) C40-#4, (b) C40-#6, and (c) C40-#8 (for specimens with medium-strength concrete).
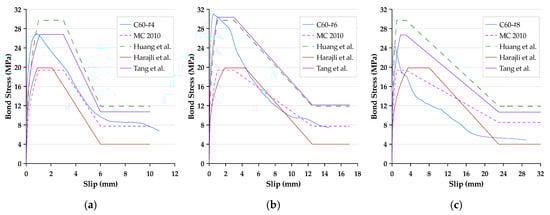
Figure 19.
Comparison of the local bond stress–slip curve produced with different prediction models: (a) C60-#4, (b) C60-#6, and (c) C60-#8 (for specimens with high-strength concrete).
As for the prediction model proposed by this research, although the prediction results of medium strength concrete are overestimated, the difference is limited; while the prediction results of low- and high-strength concrete are underestimated, the difference is quite limited. Overall, the proposed prediction model is more accurate and has reference value.
3.6. Local Slip
In the local bond stress–slip model suggested by the CEB/FIP Model Code, the bond stress–slip curve is initially very steep. In particular, the bond stress–slip relationship is quite non-linear near the ultimate bond stress. In fact, before the stress reaches the ultimate value, cracks in the concrete will also affect the slip. In other words, it is difficult to obtain good and accurate results by only comparing slip . In view of this, this study assumes that when the sliding value is between zero and , the bond stress–slip relationship is linear, as shown in the following equation:
where is the local bond stress (only a function of the relative slip), is the relative slip, and κ is the bond modulus (the paper takes ). In essence, the bond modulus has a physical meaning. If the bond stress is maintained at a certain value, the larger the value of the bond modulus, the smaller the slip. Therefore, under the condition that each variable is fixed, by applying κ to compare the difference between the bond stress–slip relationship, the result will be clearer.
The effect of concrete’s compressive strength on the bond modulus is shown in Table 9. It can be clearly seen from Table 9 that the bond modulus increased with the strength of concrete. The reason for this is that due to the increase in concrete strength, the bond properties between steel and concrete became better, so the relative sliding between concrete and steel was smaller. As can be seen from Figure 20, under the condition of a fixed concrete strength, the bond modulus of the specimen with #6 was the largest, the bond modulus of the specimen with #8 was the smallest, and the bond modulus of the specimen with #4 was between the two. From this point of view, in order to ensure objective results, the percentage of the rib area to the overall bond area should be considered.
Table 9.
Bond modulus for specimens with various bar diameters.
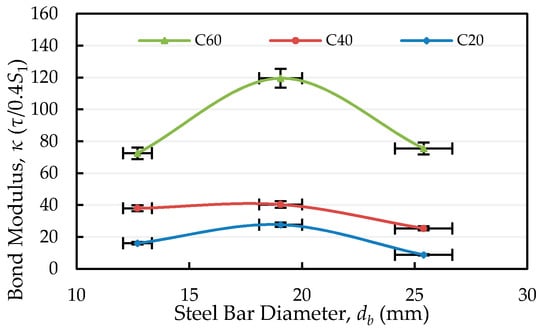
Figure 20.
Comparison of the bond modulus under the same concrete compressive strength.
It can also be seen from Figure 20 that when the steel bar size changes from #6 to #8, the bond modulus attenuation of the specimen with high strength concrete is much larger than that of the specimen with low and medium strength concretes. This result clearly shows that under the same bonding stress, the slip value of the specimen with #8 will be much higher than that of the specimen with #6. In other words, the bond–slip behavior of high-strength RC members in the presence of tensile cracks will change significantly, depending on the size of the steel bar.
This study further analyzed the ascending branch of the local bond stress–slip curve of each specimen and derived the equation of the fitting curve. Through regression analysis, the local bond stress–slip curve before the ultimate bond strength was obtained. The coefficients of determination of the regression equation were mostly above 0.90, as shown in Figure 21 (taking specimens with the #8 rebar as an example). By establishing the relationship between the local bond stress–slip relationship and the bond stress–slip relationship of the steel bar along the embedded length, the true bond stress–slip relationship curve at the anchor position of the steel bar could be obtained, that is, the position function . On the other hand, the establishment of the local bond stress–slip relationship has a considerable degree of benefit for the application of finite element analysis.
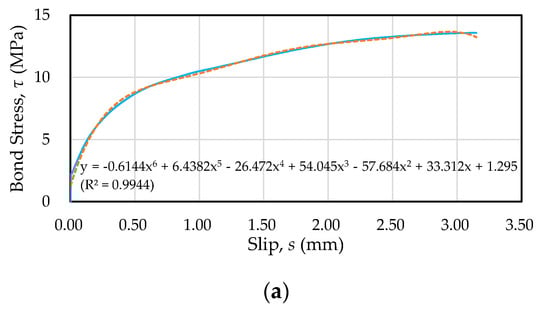
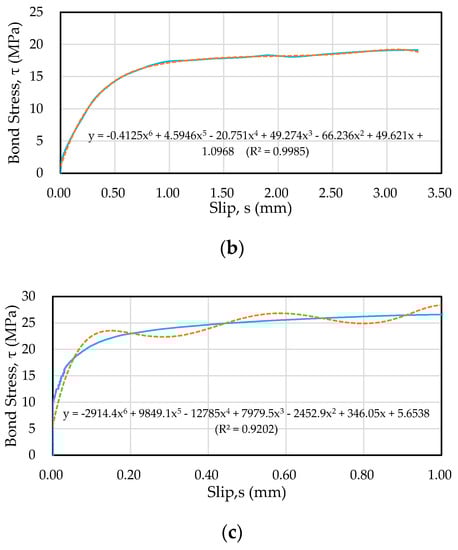
Figure 21.
Comparison of the local bond stress–slip curve versus fitting curve for specimens with the #8 rebar: (a) C20, (b) C40, and (c) C60.
4. Conclusions
According to the analysis results of the experiment, the following conclusions can be obtained:
- Regardless of the concrete strength grades, the predicted value calculated using the CEB-FIP Model Code and Harajli et al.’s model underestimates the bond strength of the specimen with different rebar diameters. From this perspective, these two models are more conservative.
- The predicted value of low-strength concrete calculated by the model of Huang et al. underestimated the bond strength in all cases, while the predicted value of medium-high-strength concrete was overestimated.
- The established empirical formula for local ultimate bond stress is a function of the concrete strength, thickness of concrete cover, and diameter of the rebar, which fits well with the experimental values.
- The analysis and comparison of the calculated values and the test results confirm that the proposed model can reasonably predict the local bond behavior for different rebar diameters and concrete strength grades.
Author Contributions
Conceptualization, C.-W.T.; methodology, C.-W.T.; software, C.-K.C.; validation, C.-W.T. and C.-K.C.; formal analysis, C.-W.T. and C.-K.C.; investigation, C.-W.T. and C.-K.C.; resources, C.-W.T.; data curation, C.-W.T.; writing—original draft preparation, C.-W.T.; writing—review and editing, C.-W.T.; visualization, C.-W.T. and C.-K.C.; supervision, C.-W.T.; project administration, C.-W.T.; funding acquisition, C.-W.T. All authors have read and agreed to the published version of the manuscript.
Funding
The research was funded by the Ministry of Science and Technology of Taiwan grant number MOST 108-2221-E-230-003-MY2.
Acknowledgments
The authors sincerely thank the Ministry of Science and Technology of Taiwan for funding this research work.
Conflicts of Interest
The authors declare no conflict of interest.
References
- Darwin, D.; Dolan, C.W.; Nilson, A.H. Design of concrete structures, Fifteenth Edition; McGraw-Hill Education: New York, NY, USA, 2016; Chapter 6 Bond, Anchorage, and Development Length. [Google Scholar]
- Building Code Requirements for Structural Concrete and Commentary (ACI 318-11); ACI Committee 318 (2011); American Concrete Institute: Farmington Hills, MI, USA, August 2011.
- Bond. and Development of Straight Reinforcing Bars in Tension (ACI 408R-03); ACI Committee 408 (2003); American Concrete Institute: Farmington Hills, MI, USA, September 2003.
- Lutz, L.A.; Gergely, P. Mechanics of Bond and Slip of Deformed Reinforcement. ACI J. 1967, 64, 711–721. [Google Scholar]
- Zheng, S.; Pei, P.; Zhang, Y.; Dong, L.; Zheng, J.; Dong, F. Review of Research on Bond-Slip of Reinforced Concrete. Mater. Rev. A: Rev. Pap. 2018, 32, 4182–4191. (In Chinese) [Google Scholar]
- Barbosa, M.T.G.; Filho, S.S. Investigation of Bond Stress in Pull Out Specimens with High Strength Concrete. Glob. J. Res. Eng. Civ. Struct. Eng. 2013, 13, 55–64. [Google Scholar]
- Desnerck, P.; De Schutter, G.; Taerwe, L. A local bond stress-slip model for reinforcing bars in self-compacting concrete. In Proceedings of the Fracture Mechanics of Concrete and Concrete Structures, Jeju, Korea, 23–28 May 2010; Volume 2, pp. 771–778. [Google Scholar]
- Eligehausen, R.; Popov, E.P.; Bertero, V.V. Local Bond Stress-Slip Relationships of Deformed Bars under Generalized Excitations; University of California: Berkeley, CA, USA, 1983. [Google Scholar]
- Oh, B.H.; Kim, S.H. Realistic models for local bond stress-slip of reinforced concrete under repeated loading. J. Struct. Eng. 2007, 133, 216. [Google Scholar] [CrossRef]
- Filippou, F.C.; Popov, E.P.; Bertero, V.V. Modeling of R/C joints under cyclic excitations. J. Struct. Eng. 1983, 109, 2666–2684. [Google Scholar] [CrossRef]
- Shima, H.; Chou, L.L.; Okamura, H. Micro and macro models for bond in reinforced concrete. J. Fac. Eng. 1987, 39, 133–194. [Google Scholar]
- Kankam, C.K. Relationship of bond stress, steel stress, and slip in reinforced concrete. J. Struct. Eng. 1997, 123, 79–85. [Google Scholar] [CrossRef]
- Saeed, M.N. Internal measurement of bond stress slip relationship in reinforced concrete. ACI J. 1979, 76, 19. [Google Scholar]
- CEB (1992). CEB-FIP Model. Code 90; CEB: London, UK, 1992. [Google Scholar]
- CEB (2010). CEB-FIP Model. Code 2010; CEB: Lausanne, Switzerland, 2010. [Google Scholar]
- Guizani, L.; Chaallal, O.; Mousavi, S.S. Local bond stress-slip model for R/C joints and anchorages with moderate confinement. Can. J. Civ. Eng. 2017, 44, 201–211. [Google Scholar] [CrossRef]
- Xu, Y.L. A simplified model of bond-slip relationship for reinforced concrete. Eng. Mech. 1997, 2, 34. (In Chinese) [Google Scholar]
- Morohashi, N.; Sakurada, T. Effect of concrete strength on bond splitting strength of lap splice. JCI Annu. J. 2002, 24, 787–792. [Google Scholar]
- Ogura, N.; Ichinose, T. Analytical study on splitting bond failure of deformed bars. AIJ J. Struct. Constr. Eng. 2004, 586, 147–153. [Google Scholar] [CrossRef][Green Version]
- Zhu, W.; Sonebi, M.; Bartos, P.J.M. Bond and interfacial properties of reinforcement in self-compacting concrete. Mater. Struct. 2004, 37, 442–448. [Google Scholar] [CrossRef]
- Hossain, K.M.A.; Lachemi, M. Bond behavior of self consolidating concrete with mineral and chemical admixtures. J. Mater. Civ. Eng. 2008, 20, 608–616. [Google Scholar] [CrossRef]
- Ogura, N.; Bolander, J.E.; Ichinose, T. Analysis of bond splitting failure of deformed bars within structural concrete. Eng. Struct. 2008, 30, 428–435. [Google Scholar] [CrossRef]
- Valcuende, M.; Parra, C. Bond behaviour of reinforcement in self-compacting concretes. Constr. Build. Mater. 2009, 23, 162–170. [Google Scholar] [CrossRef]
- Desnerck, P.; De Schutter, G.; Taerwe, L. Bond behaviour of reinforcing bars in self-compacting concrete: Experimental determination by using beam tests. Mater. Struct. 2010, 43, 53–62. [Google Scholar] [CrossRef]
- Hassan, A.A.A.; Hossain, K.M.A.; Lachemi, M. Bond strength of deformed bars in large reinforced concrete members cast with industrial self-consolidating concrete mixture. Constr. Build. Mater. 2010, 24, 520–530. [Google Scholar] [CrossRef]
- Güneyisi, E.; Gesoǧlu, M.; Ipek, S. Effect of steel fiber addition and aspect ratio on bond strength of cold-bonded fly ash lightweight aggregate concretes. Constr. Build. Mater. 2013, 47, 358–365. [Google Scholar]
- Alexandre Bogas, J.; Gomes, M.G.; Real, S. Bonding of steel reinforcement in structural expanded clay lightweight aggregate concrete: The influence of failure mechanism and concrete composition. Constr. Build. Mater. 2014, 65, 350–359. [Google Scholar] [CrossRef]
- Aslani, F.; Nejadi, S.; Samali, B. Short term bond shear stress and cracking control of reinforced self-compacting concrete one way slabs under flexural loading. Comput. Concr. 2014, 13, 709–737. [Google Scholar] [CrossRef]
- Deng, Z.C.; Jumbe, R.D.; Yuan, C.X. Bonding between high strength rebar and reactive powder concrete. Comput. Concr. 2014, 13, 411–421. [Google Scholar] [CrossRef]
- Golafshani, E.M.; Alireza Rahai, A.; Kebria, S.S.H. Prediction of the bond strength of ribbed steel bars in concrete based on genetic programming. Comput. Concr. 2014, 14, 327–359. [Google Scholar] [CrossRef]
- Dehestani, M.; Mousavi, S.S. Modified steel bar model incorporating bond-slip effects for embedded element method. Constr. Build. Mater. 2015, 81, 284–290. [Google Scholar] [CrossRef]
- Mo, K.H.; Alengaram, U.J.; Visintin, P.; Goh, S.H.; Jumaat, M.Z. Influence of lightweight aggregate on the bond properties of concrete with various strength grades. Constr. Build. Mater. 2015, 84, 377–386. [Google Scholar] [CrossRef]
- Zhou, H.; Lu, J.; Xv, X.; Dong, B.; Xing, F. Effects of stirrup corrosion on bond–slip performance of reinforcing steel in concrete: An experimental study. Constr. Build. Mater. 2015, 93, 257–266. [Google Scholar] [CrossRef]
- Tang, C.W. Local bond–slip behavior of medium and high strength fiber reinforced concrete after exposure to high temperatures. Struct. Eng. Mech. 2018, 66, 477–485. [Google Scholar]
- Tang, C.W. Local bond–slip behavior of fiber reinforced LWAC after exposure to elevated temperatures. Struct. Eng. Mech. 2020, 73, 437–445. [Google Scholar]
- Soroushian, P.; Mirza, F.; Alhozaimy, A. Bonding of confined steel fiber reinforced concrete to deformed bars. ACI Mater. J. 1994, 91, 144–149. [Google Scholar]
- Huang, Z.; Engström, B.; Magnusson, J. Experimental and Analytical Studies of the Bond Behavior of Deformed Bars in High Strength Concrete. In Proceedings of the 4th International Symposium on the Utilization of High Strength/ High Performance Concrete, Paris, France, 29–31 May 1996; Volume 3, pp. 1115–1124. [Google Scholar]
- Soroushian, P.; Choi, K.B. Local Bond of Deformed Bars with Different Diameters in Confined Concrete. ACI Struct. J. 1989, 86, 217–222. [Google Scholar]
- Aslani, F.; Samali, B. Predicting the bond between concrete and reinforcing steel at elevated temperatures. Struct. Eng. Mech. 2013, 48, 643–660. [Google Scholar] [CrossRef]
- Harajli, M.H.; Hout, M.; Jalkh, W. Local bond stress-slip behaviour of reinforcing bars embedded in plain and fiber concrete. ACI Mater. J. 1995, 92, 343–353. [Google Scholar]
- Lee, C.; Shin, S.; Lee, S.; Oh, J. Modeling of Bond Stress–Slip Relationships of a Strand in Concrete during Steam Curing. Int. J. Concr Struct Mater. 2017, 11, 477–487. [Google Scholar] [CrossRef]
- Pishro, A.A.; Feng, X. Experimental Study on Bond Stress between Ultra High Performance Concrete and Steel Reinforcement. Civ. Eng. J. 2017, 3, 1235–1246. [Google Scholar] [CrossRef]
- Máca, P.; Panteki, E.; Curbach, M. Bond Stress-Slip Behaviour of Concrete and Steel under High-Loading Rates. Int. J. Comp. Meth. Exp. Meas. 2016, 4, 221–230. [Google Scholar]
- Chu, S.H.; Kwan, A.K.H. A new bond model for reinforcing bars in steel fibre reinforced concrete. Cem. Concr. Compos. 2019, 104, 103405. [Google Scholar] [CrossRef]
- Ng, P.L.; Lam, J.Y.K.; Kwan, A.K.H. Effects of Concrete-to-Reinforcement Bond and Loading Conditions on Tension Stiffening. Procedia Eng. 2011, 14, 704–714. [Google Scholar] [CrossRef]
- Lv, X.; Yu, Z.; Shan, Z.; Yuan, J. A Stochastic Damage Model for Bond Stress-Slip Relationship of Rebar-Concrete Interface under Monotonic Loading. Materials 2019, 12, 3151. [Google Scholar] [CrossRef]
- Pauletta, M.; Rovere, N.; Randl, N.; Russo, G. Bond-Slip Behavior between Stainless Steel Rebars and Concrete. Materials 2020, 13, 979. [Google Scholar] [CrossRef]
- Wiemer, N.; Wetzel, A.; Schleiting, M.; Krooß, P.; Vollmer, M.; Niendorf, T.; Böhm, S.; Middendorf, B. Effect of Fibre Material and Fibre Roughness on the Pullout Behaviour of Metallic Micro Fibres Embedded in UHPC. Materials 2020, 13, 3128. [Google Scholar] [CrossRef]
- ACI 211.1-91. Standard Practice for Selecting Proportions for Normal, Heavyweight, and Mass Concrete; American Concrete Institute: Farmington Hills, MI, USA, January 2009. [Google Scholar]
- Standard Test. Method for Slump of Hydraulic-Cement Concrete; ASTM C143/C143M-20; ASTM International: West Conshohocken, PA, USA, 2020; Available online: www.astm.org (accessed on 20 February 2020).
- Standard Test. Method for Compressive Strength of Cylindrical Concrete Specimens; ASTM C39/C39M-18; ASTM International: West Conshohocken, PA, USA, 2018; Available online: www.astm.org (accessed on 20 February 2020).
- Standard Test. Method for Splitting Tensile Strength of Cylindrical Concrete Specimens; ASTM C496/C496M-04; ASTM International: West Conshohocken, PA, USA, 2004; Available online: www.astm.org (accessed on 20 February 2020).
- Standard Test. Method for Static Modulus of Elasticity and Poisson’s Ratio of Concrete in Compression; ASTM C469/C469M-14 (2014); ASTM International: West Conshohocken, PA, USA, 2014; Available online: www.astm.org (accessed on 20 February 2020).


© 2020 by the authors. Licensee MDPI, Basel, Switzerland. This article is an open access article distributed under the terms and conditions of the Creative Commons Attribution (CC BY) license (http://creativecommons.org/licenses/by/4.0/).