Effect of Cellulose Nanocrystals Nanofiller on the Structure and Sorption Properties of Carboxymethyl Cellulose–Glycerol–Cellulose Nanocrystals Nanocomposite Systems


Abstract
:1. Introduction
2. Materials and Methods
2.1. Materials
2.2. Preparation
2.3. Methods
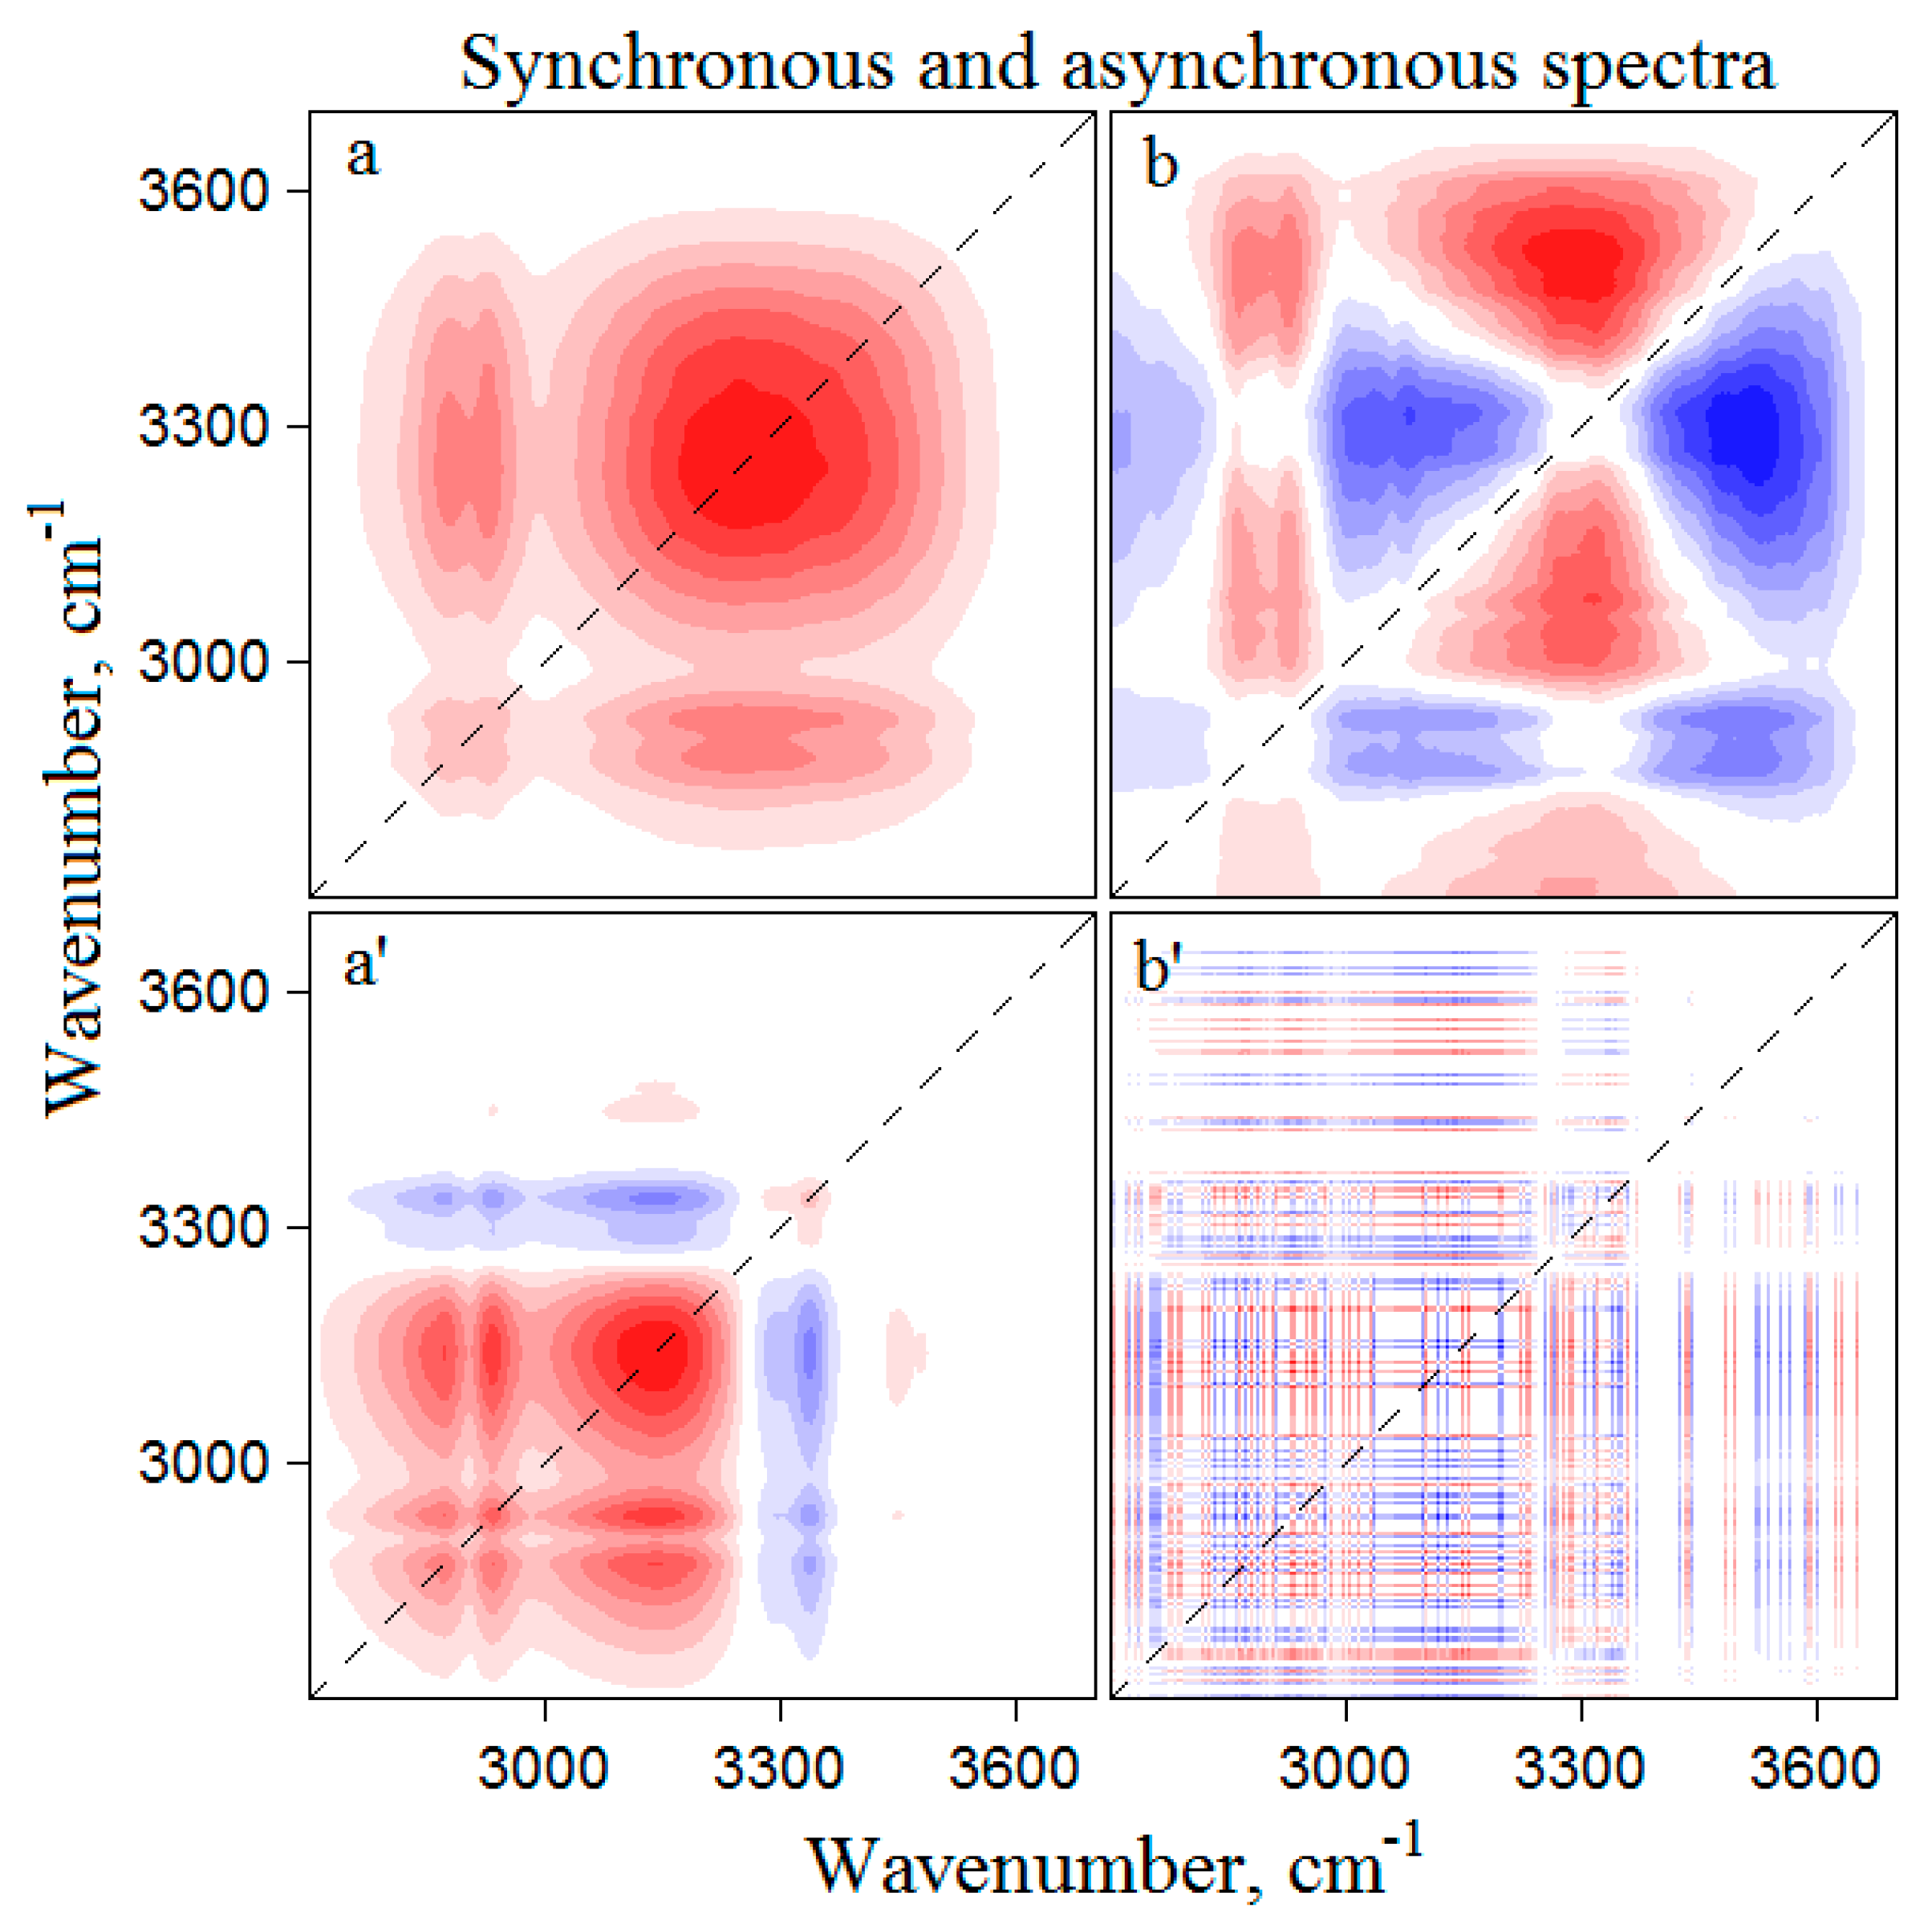
2.3.1. Infrared Spectroscopy
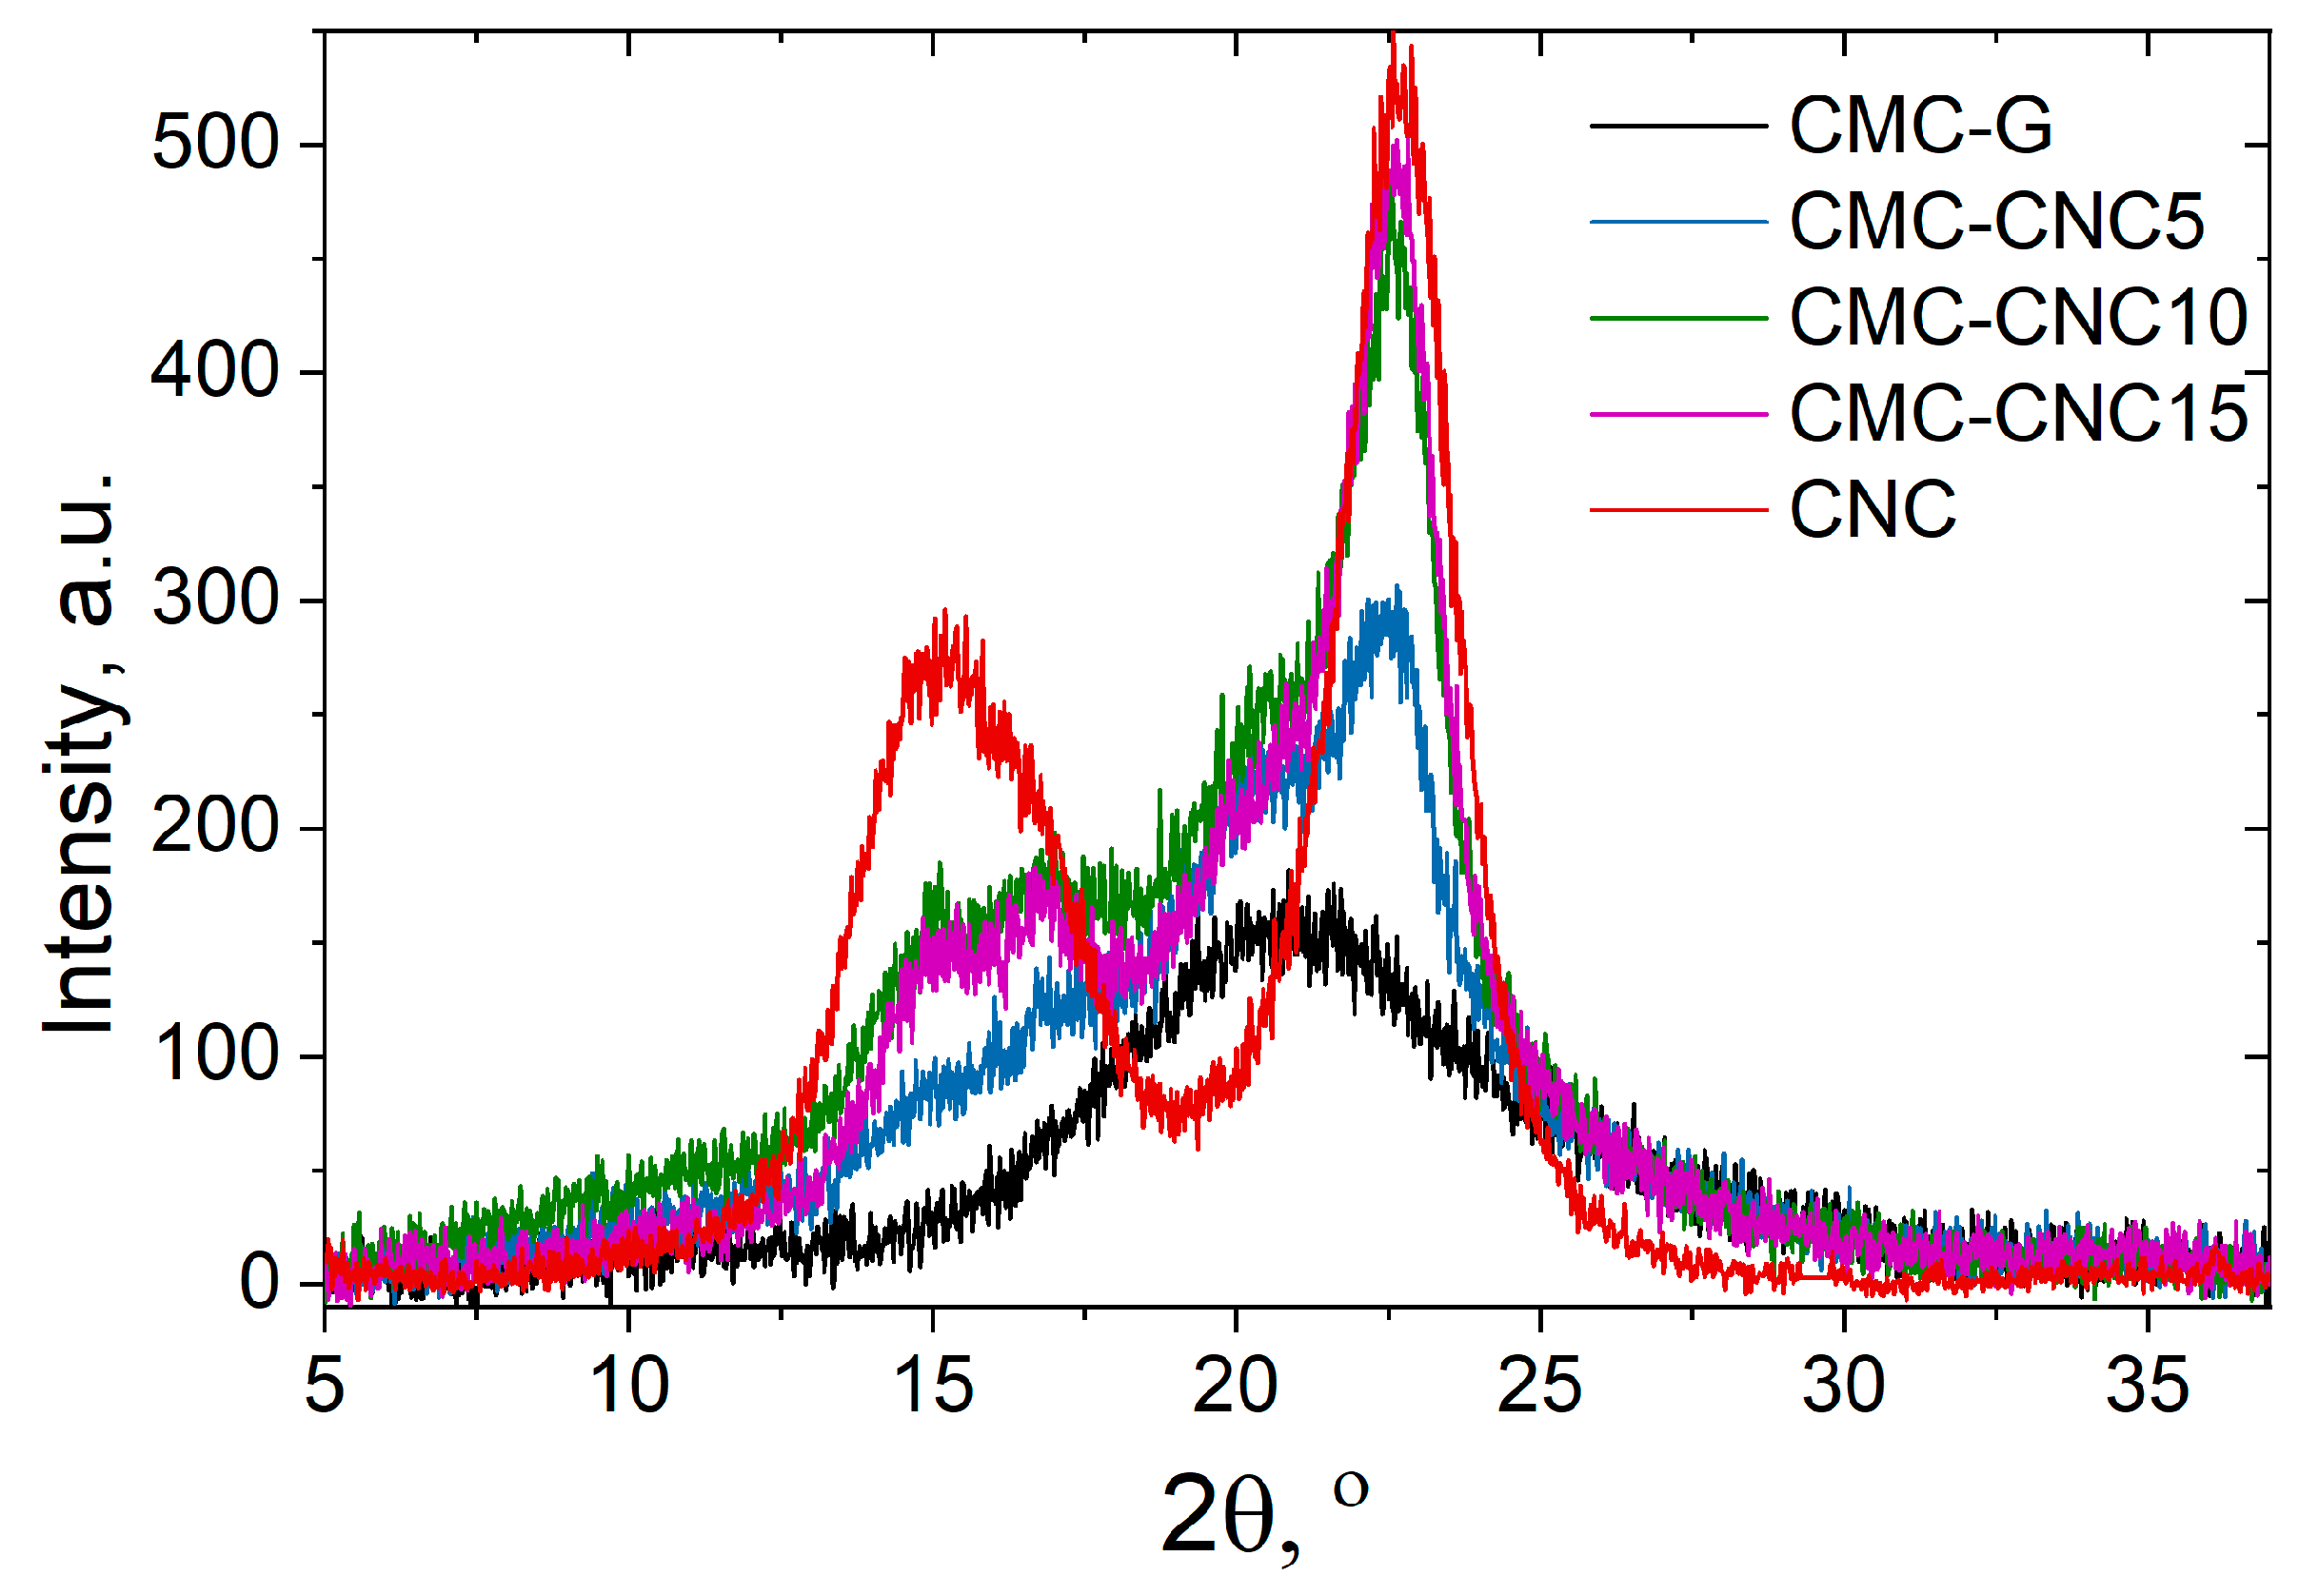
2.3.2. X-Ray Diffraction
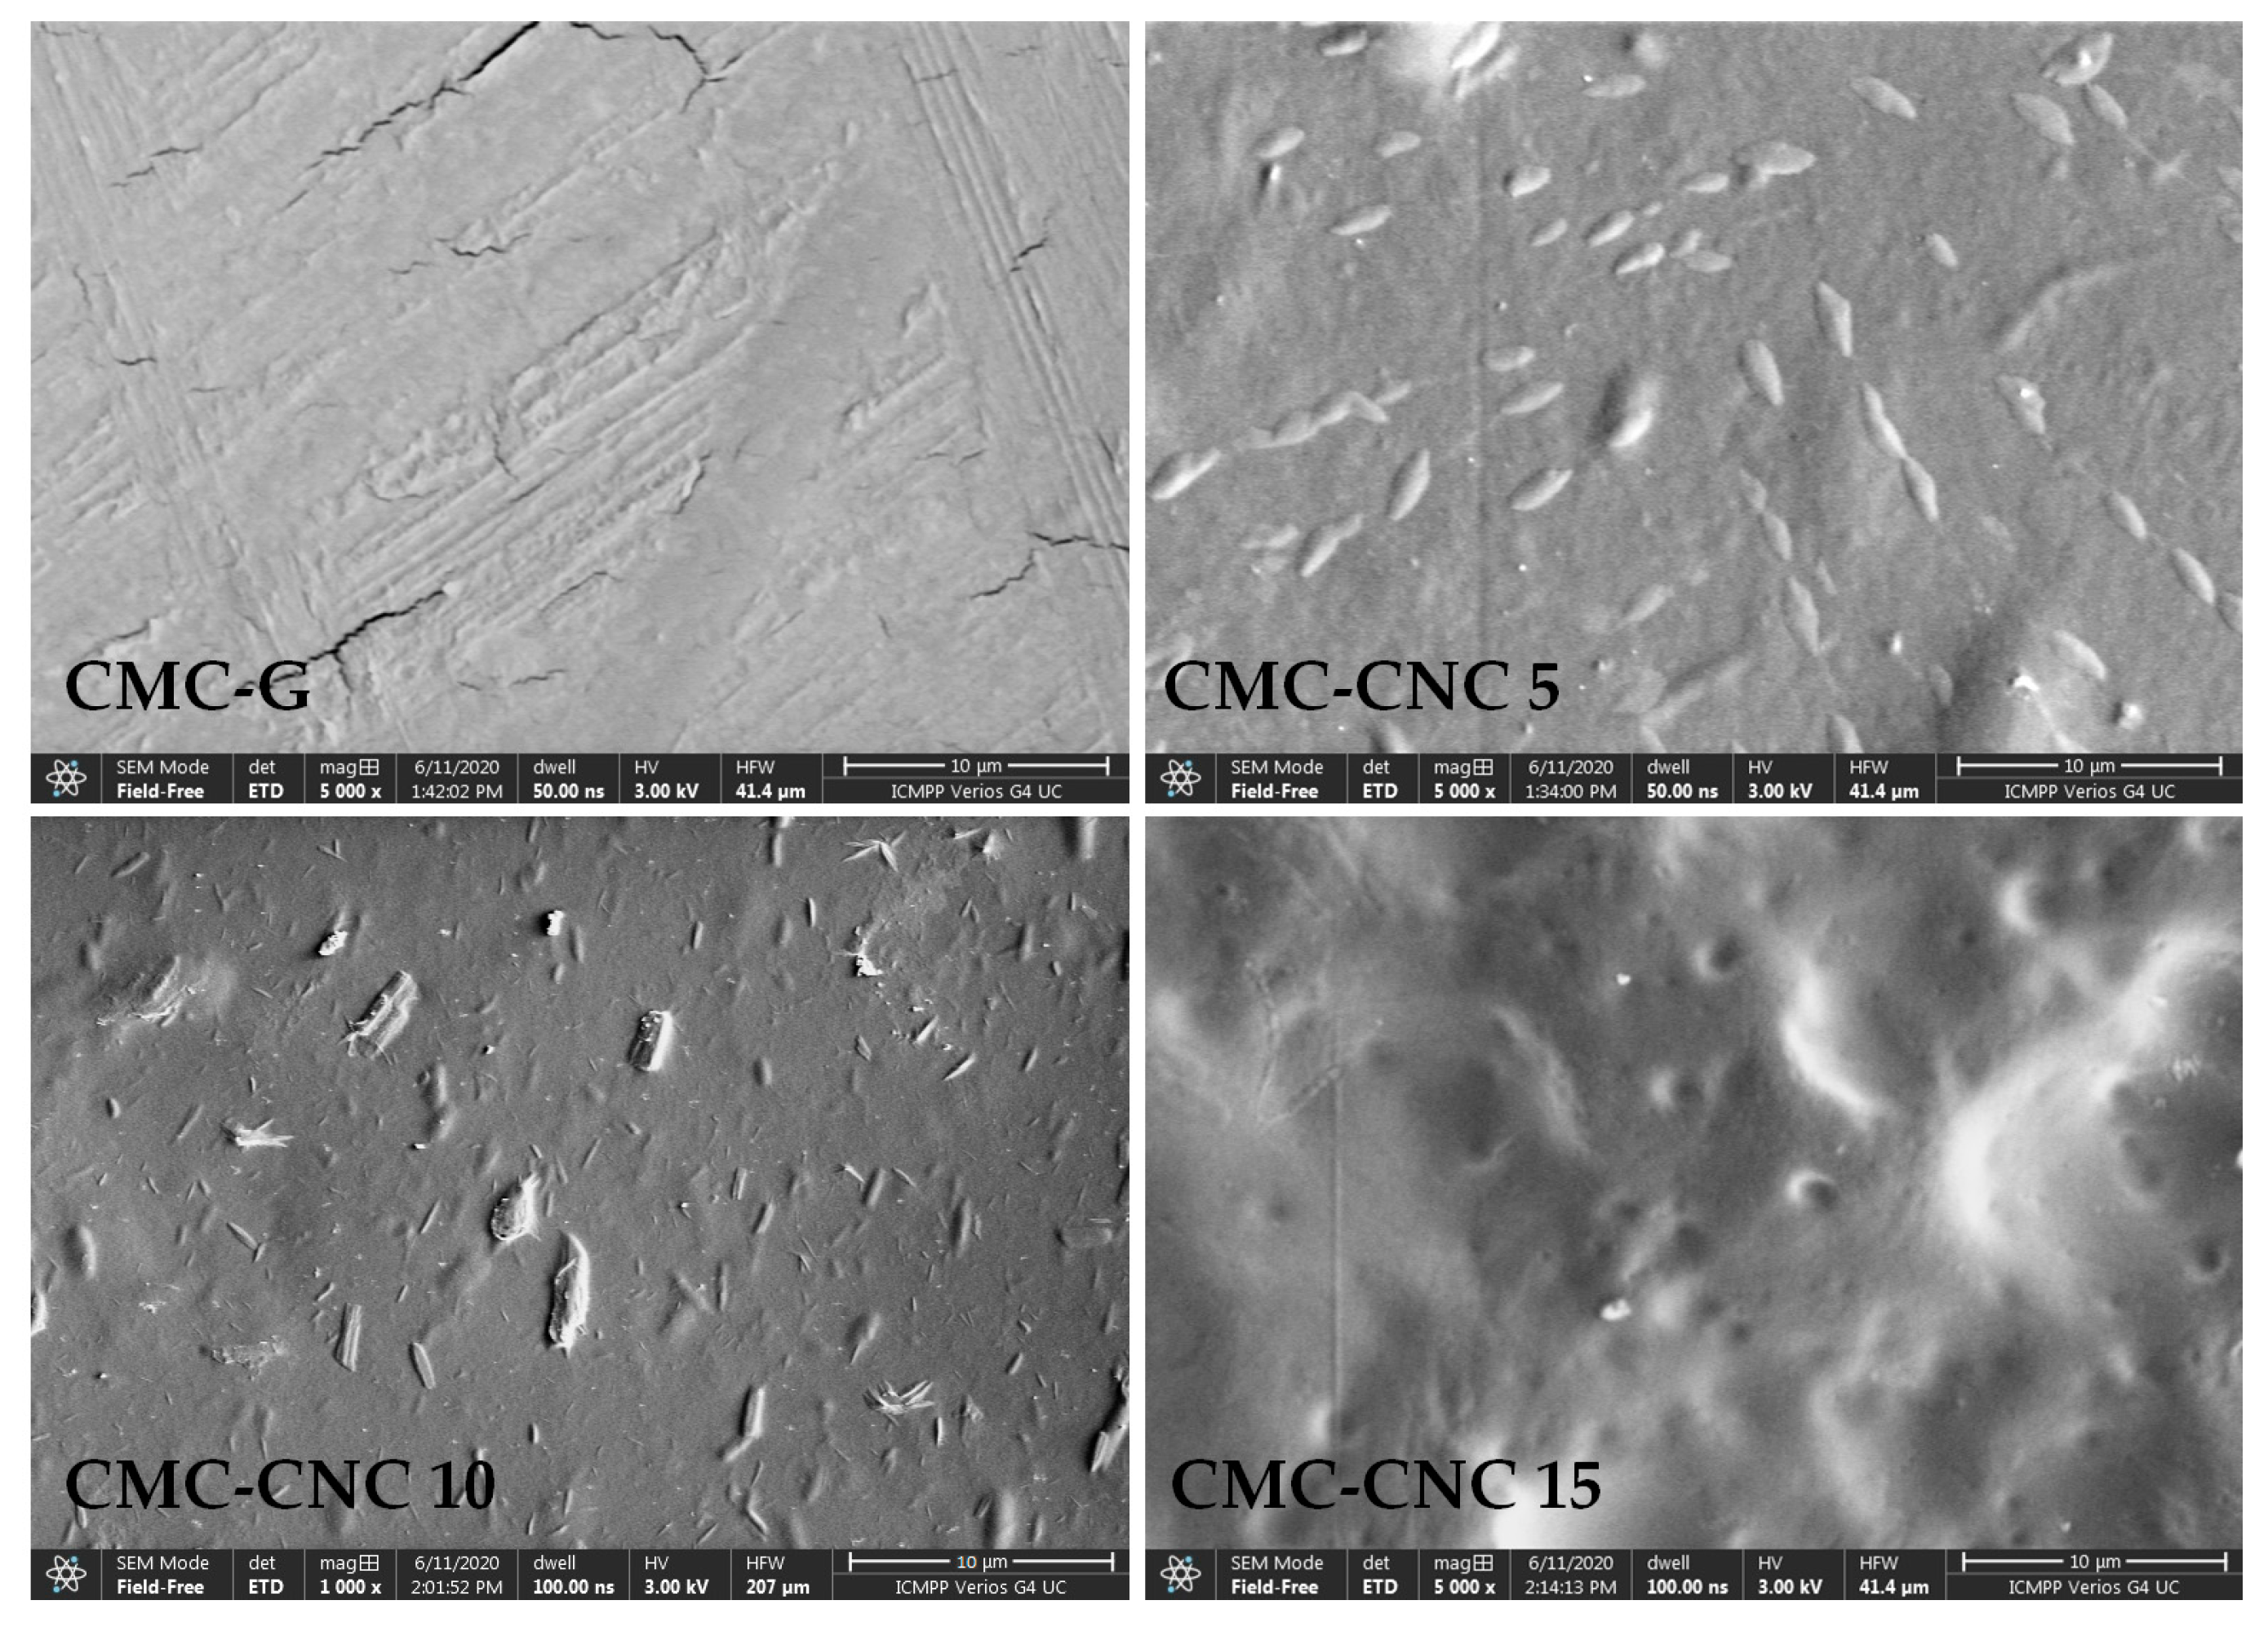
2.3.3. Scanning Electron Microscope (SEM)
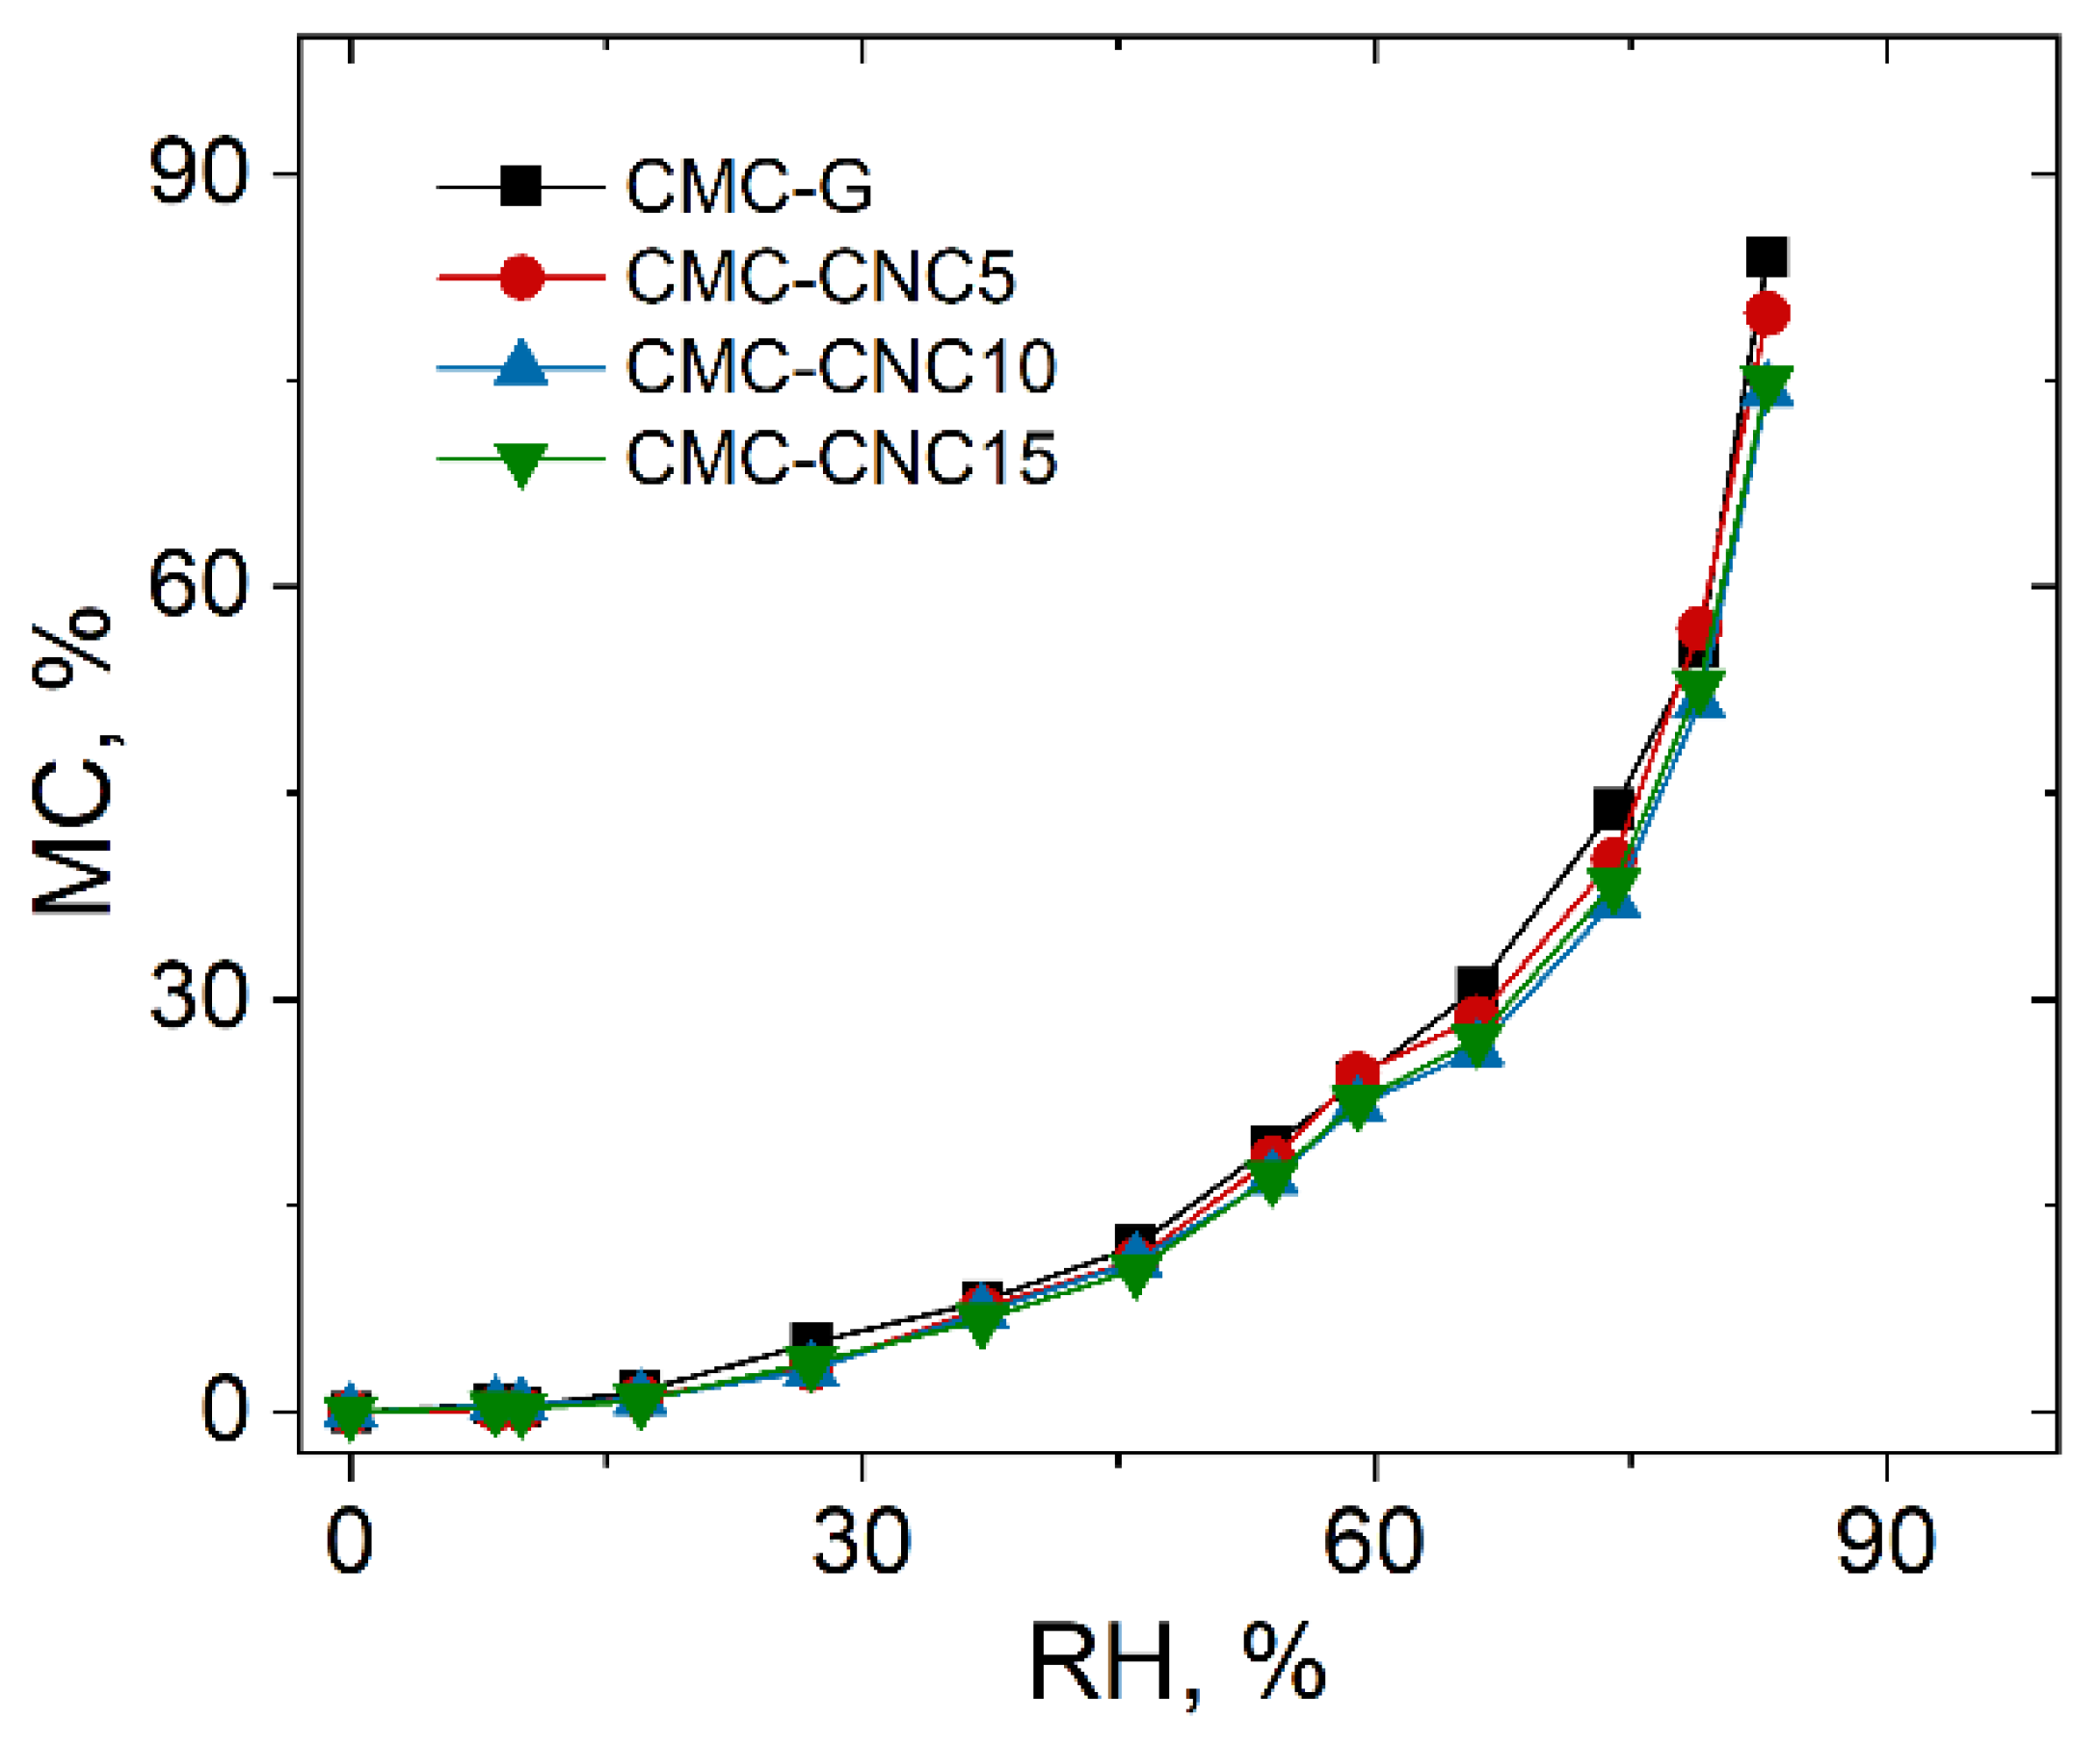
2.3.4. Water Vapor Sorption
2.3.5. Water Uptake
3. Results and Discussions
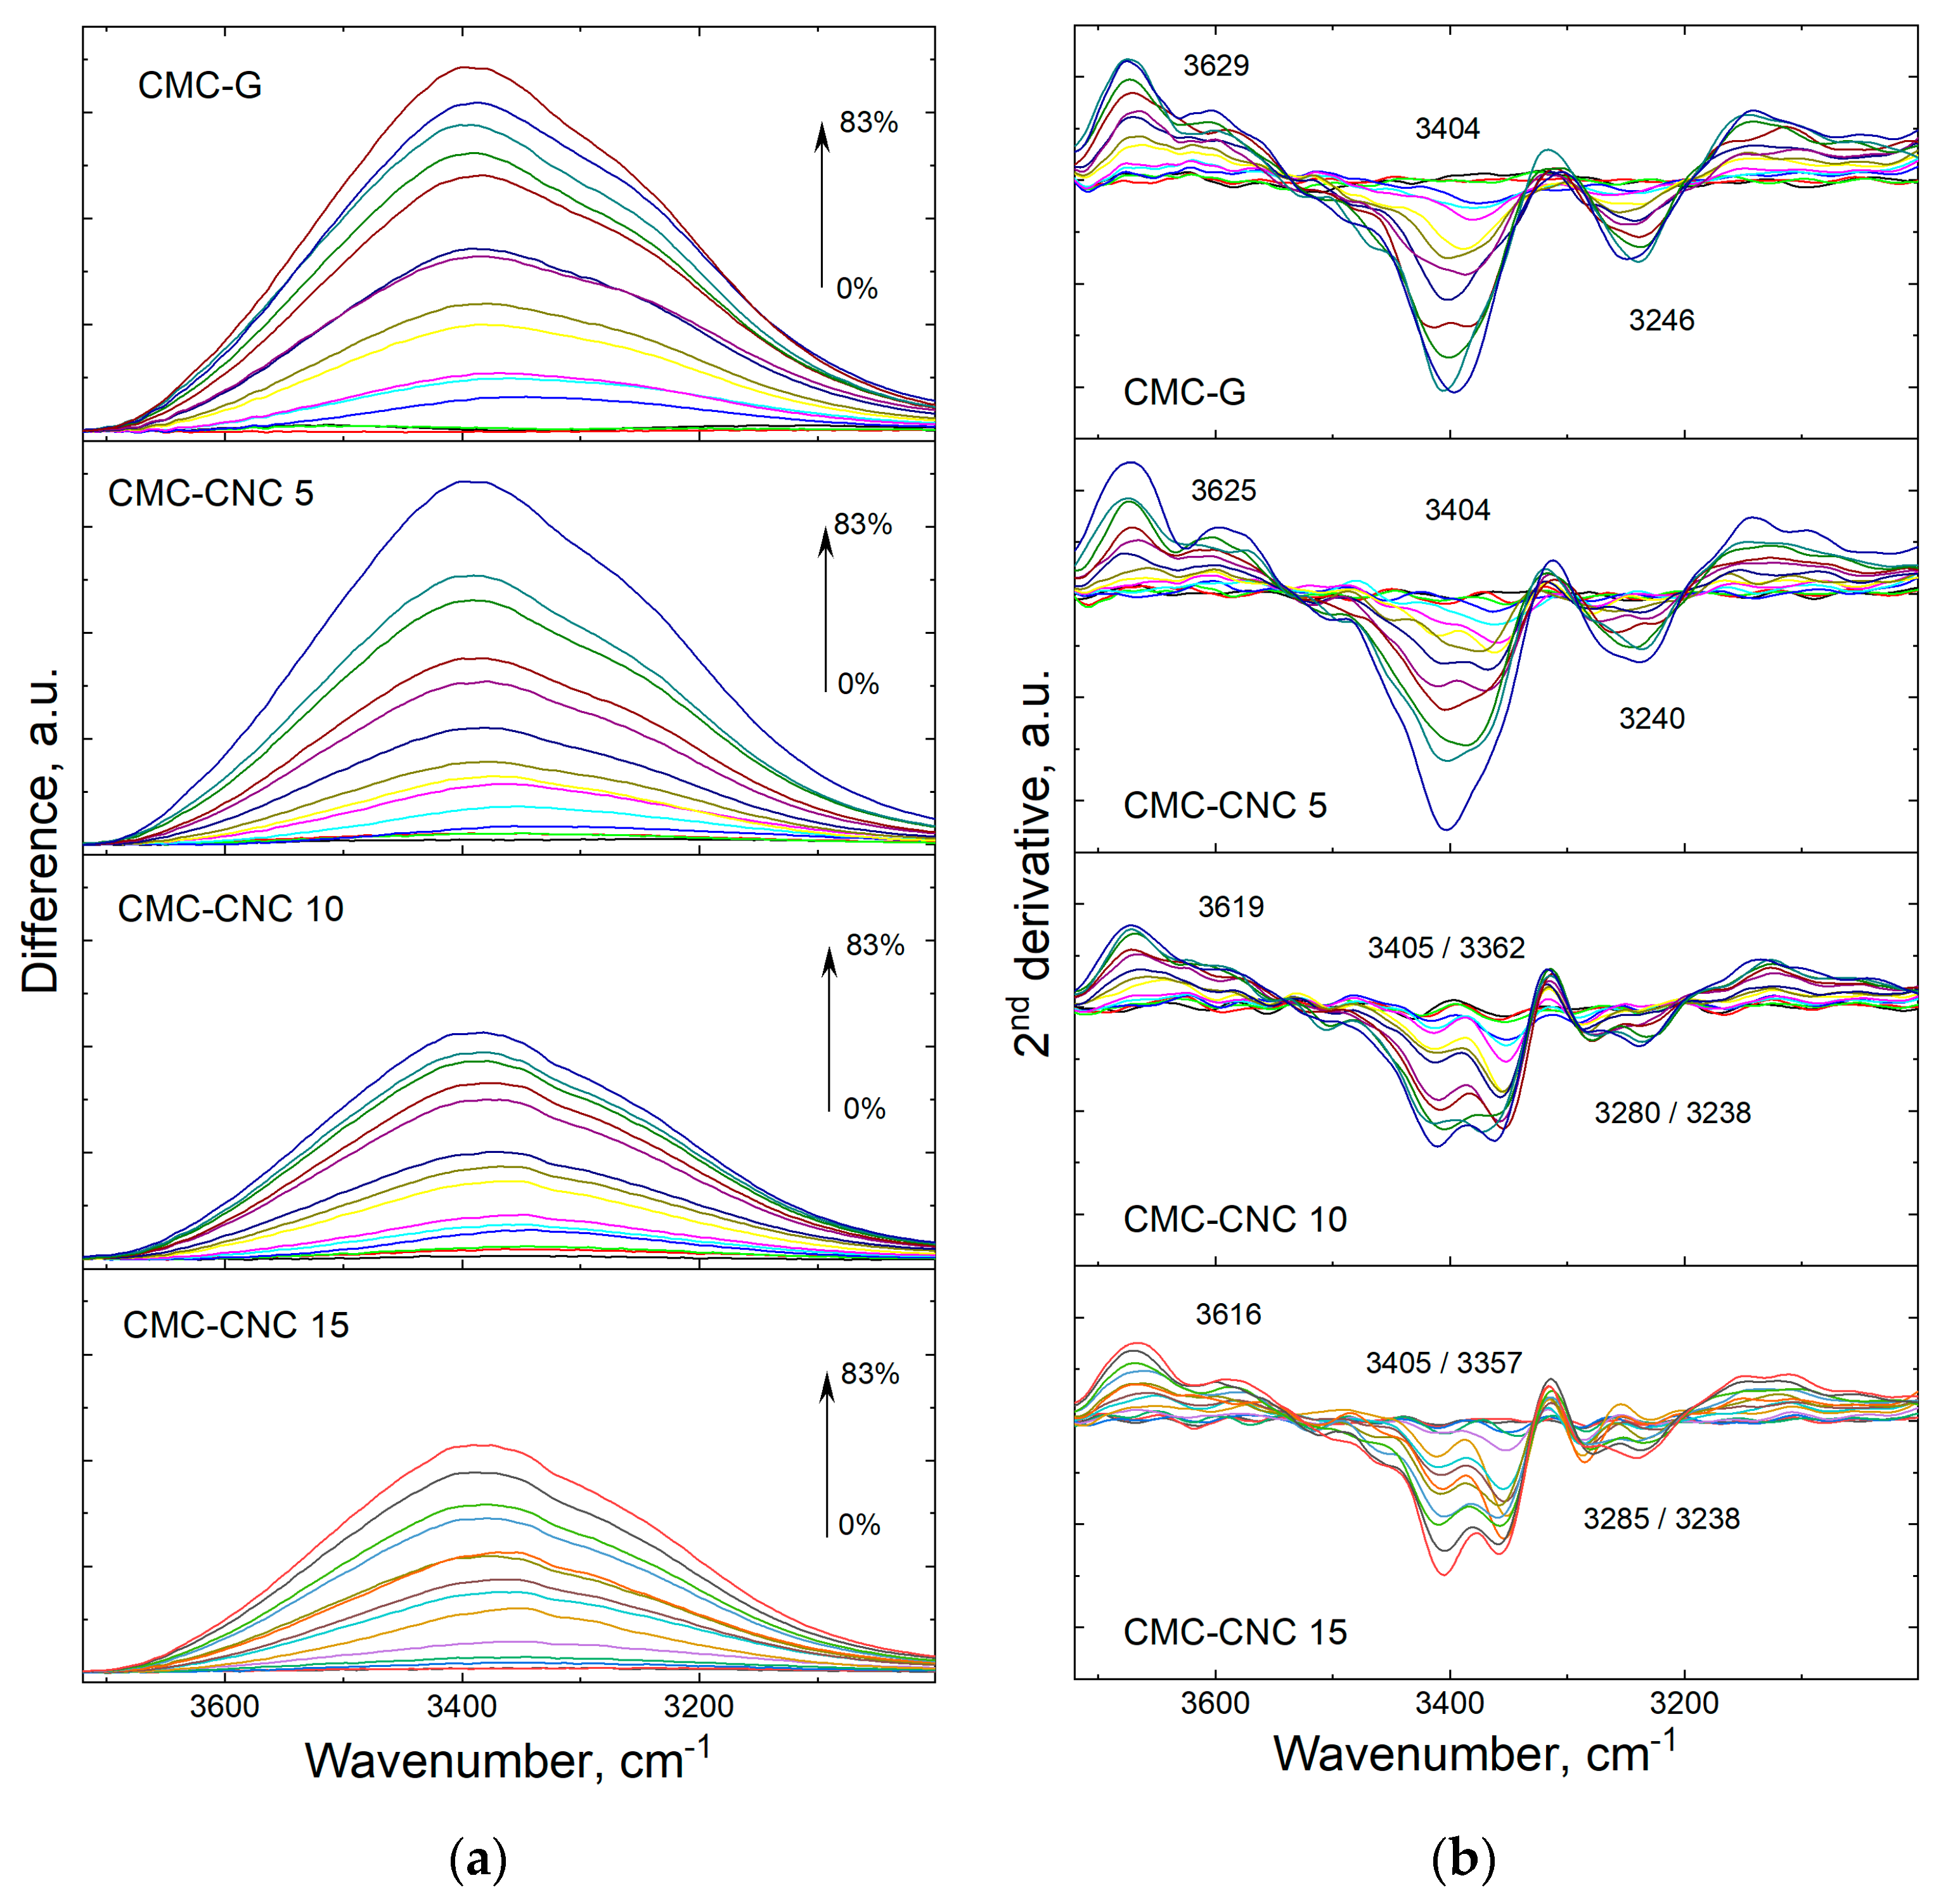
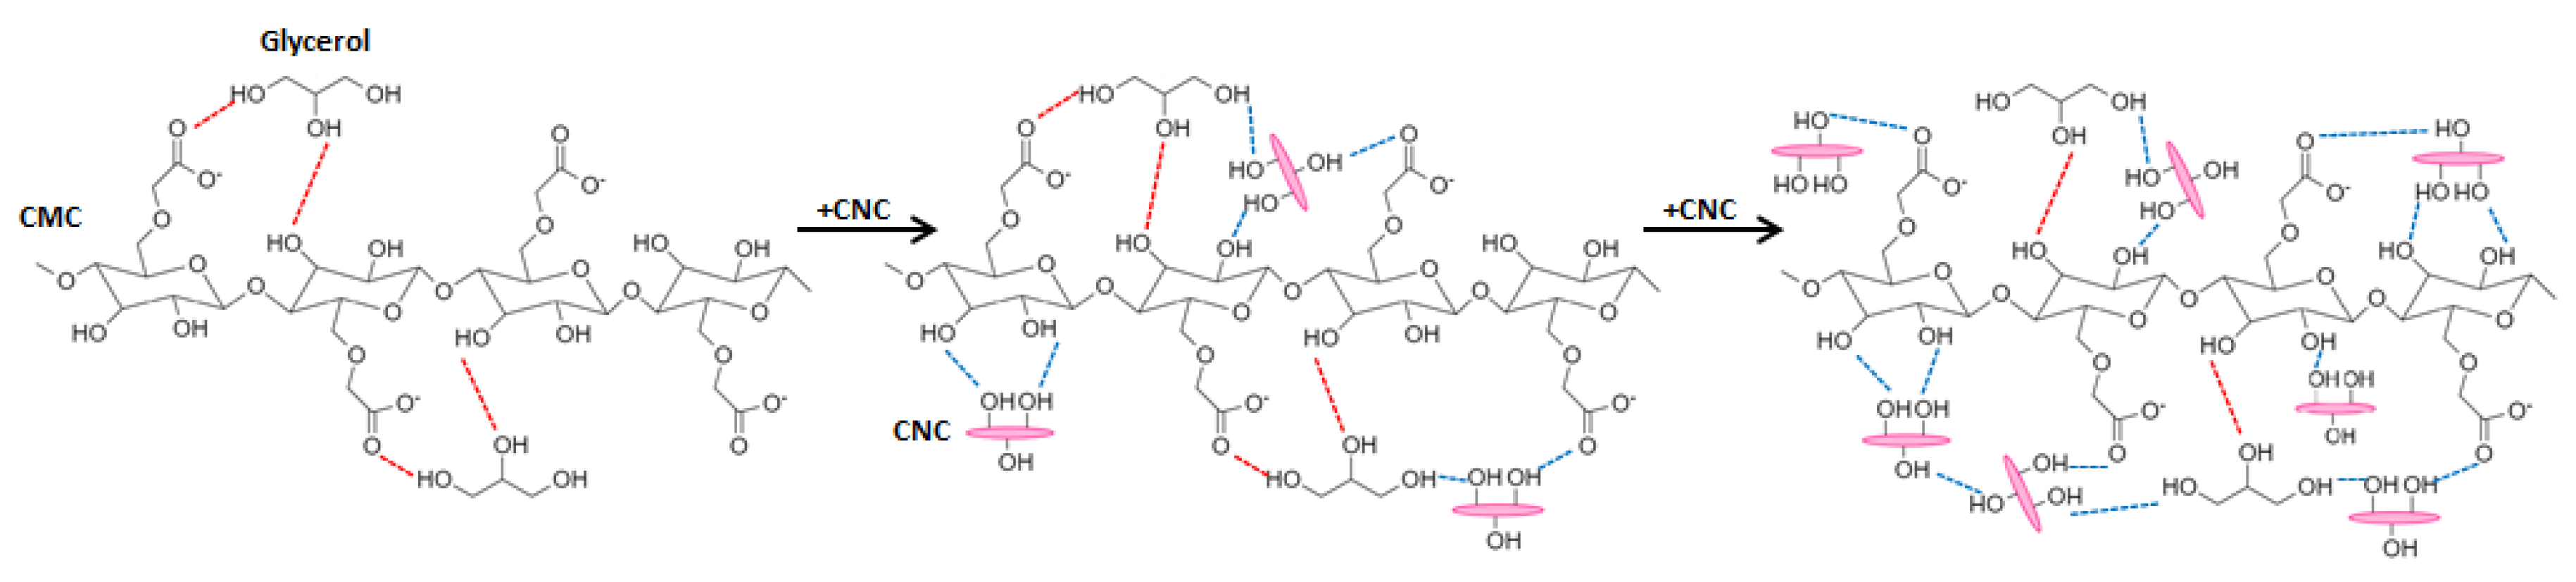
3.1. Infrared Spectroscopy
3.2. X-Ray Diffraction
3.3. Scanning Electron Microscopy (SEM)
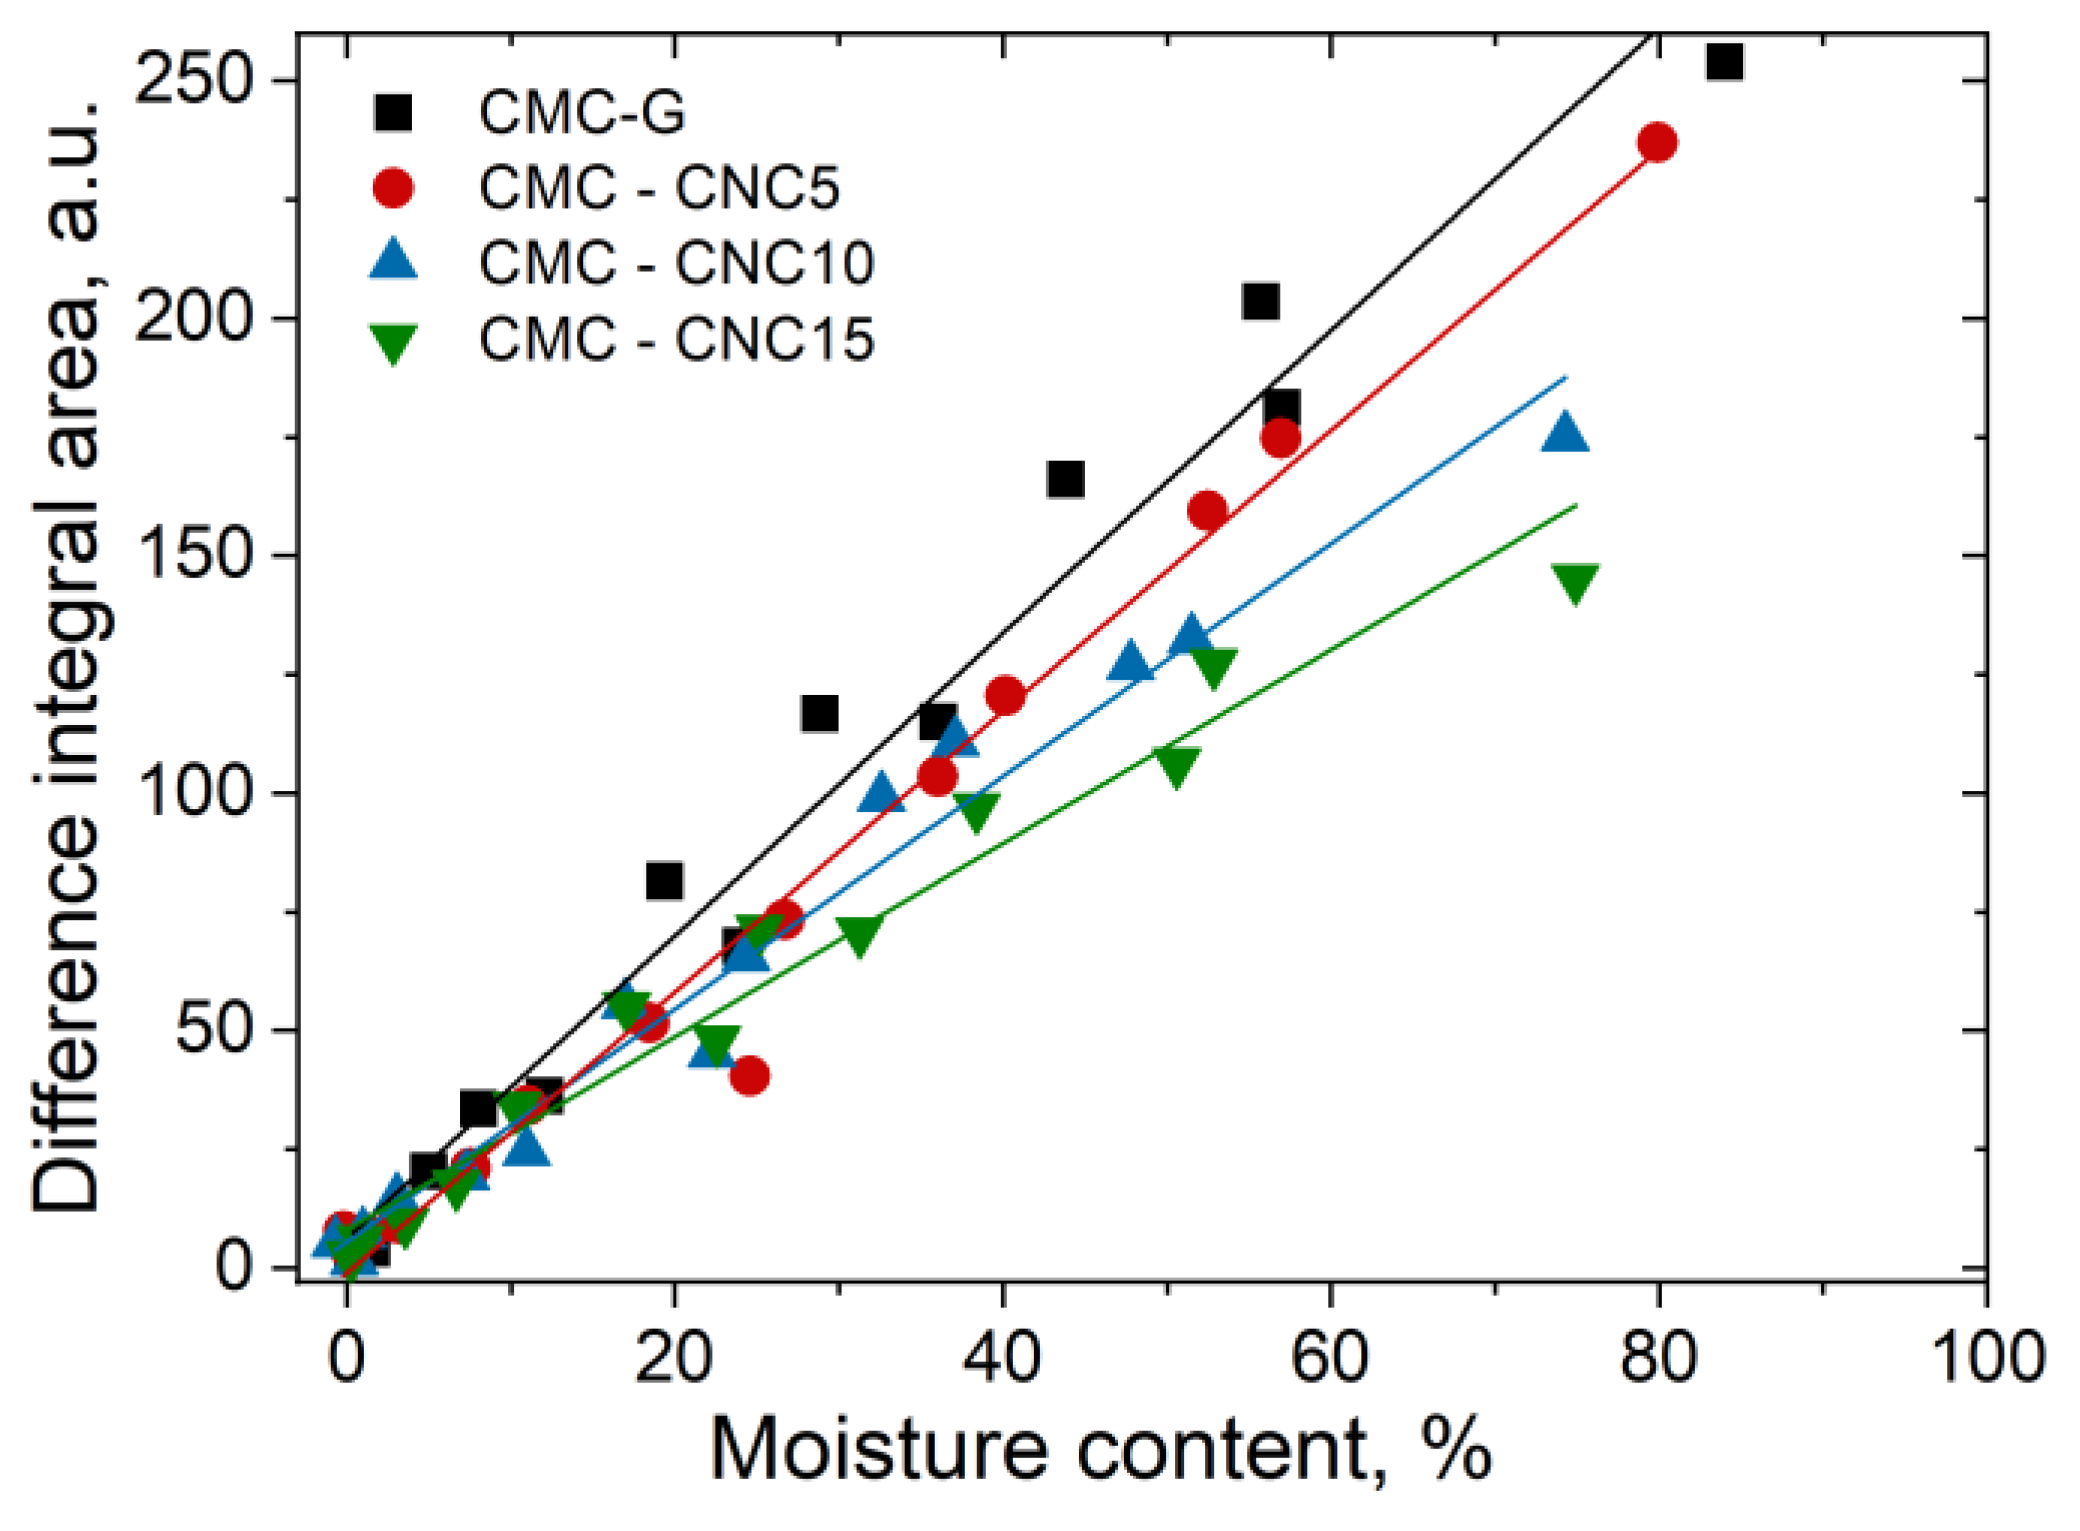
3.4. Water Vapor Sorption Properties
3.5. Water Uptake
4. Conclusions
Author Contributions
Funding
Conflicts of Interest
References
- Kukrety, A.; Singh, R.K.; Singh, P.; Ray, S.S. Comprehension on the synthesis of carboxymethylcellulose (CMC) utilizing various cellulose rich waste biomass resources. Waste Biomass Valor. 2018, 9, 1587–1595. [Google Scholar] [CrossRef]
- Oguzlu, H.; Danumah, C.; Boluk, Y. The role of dilute and semi-dilute cellulose nanocrystal (CNC) suspensions on the rheology of carboxymethyl cellulose (CMC) solutions. Can. J. Chem. Eng. 2016, 94, 1841–1847. [Google Scholar] [CrossRef]
- Akhtar, H.M.S.; Riaz, A.; Hamed, Y.S.; Abdin, M.; Chen, G.; Wan, P.; Zeng, X. Production and characterization of CMC-based antioxidant and antimicrobial films enriched with chickpea hull polysaccharides. Int. J. Biol. Macromol. 2018, 118, 469–477. [Google Scholar] [CrossRef]
- Saha, N.; Saarai, A.; Roy, N.; Kitano, T.; Saha, P. Polymeric biomaterial based hydrogels for biomedical applications. J. Biomater. Nanobiotech. 2011, 2, 85–90. [Google Scholar] [CrossRef] [Green Version]
- Ghanbarzadeh, B.; Almasi, H. Physical properties of edible emulsified films based on carboxymethyl cellulose and oleic acid. Int. J. Biol. Macromol. 2011, 48, 44–49. [Google Scholar] [CrossRef]
- Ebrahimi, Y.; Peighambardoust, S.J.; Peighambardoust, S.H.; Karkaj, S.Z. Development of antibacterial carboxymethyl cellulose-based nanobiocomposite films containing various metallic nanoparticles for food packaging applications. J. Food Sci. 2019, 84, 2537–2548. [Google Scholar] [CrossRef]
- Oun, A.A.; Rhim, J.-W. Isolation of cellulose nanocrystals from grain straws and their use forthe preparation of carboxymethyl cellulose-based nanocomposite films. Carbohydr. Polym. 2016, 150, 187–200. [Google Scholar] [CrossRef]
- Mandal, A.; Chakrabarty, D. Studies on mechanical, thermal, and barrier properties of carboxymethyl cellulose film highly filled with nanocellulose. J. Thermoplast. Compos. Mater. 2018, 32, 1–20. [Google Scholar] [CrossRef]
- Chi, K.; Catchmark, J.M. Improved eco-friendly barrier materials based on crystalline nanocellulose/chitosan/carboxymethyl cellulose polyelectrolyte complexes. Food Hydrocoll. 2018, 80, 195–205. [Google Scholar] [CrossRef]
- Wang, J.; Gardner, D.J.; Stark, N.M.; Bousfield, D.W.; Tajvidi, M.; Cai, Z. Moisture and oxygen barrier properties of cellulose nanomaterial-based films. ACS Sustain. Chem. Eng. 2017, 6, 49–70. [Google Scholar] [CrossRef]
- Mazhari Mousavi, S.M.; Afra, E.; Tajvidi, M.; Bousfield, D.W.; Dehghani-Firouzabadi, M. Cellulose nanofiber/carboxymethyl cellulose blends as an efficient coating to improve the structure and barrier properties of paperboard. Cellulose 2017, 24, 3001–3014. [Google Scholar] [CrossRef]
- Neto, W.P.F.; Silvério, H.A.; Vieira, J.G.; da Costa e Silva Alves, H.; Pasquini, D.; Nascimento de Assuncao, R.M.; Oliveira Dantas, N. Preparation and characterization of nanocomposites of carboxymethyl cellulose reinforced with cellulose nanocrystals. Macromol. Symp. 2012, 319, 93–98. [Google Scholar] [CrossRef]
- El Miri, N.; Abdelouahdi, K.; Barakat, A.; Zahouily, M.; Fihri, A.; Solhy, A.; El Achaby, M. Bio-nanocomposite films reinforced with cellulose nanocrystals: Rheology of film-forming solutions, transparency, water vapor barrier and tensile properties of films. Carbohydr. Polym. 2015, 129, 156–167. [Google Scholar] [CrossRef]
- Achachlouei, B.F.; Zahedi, Y. Fabrication and characterization of CMC-based nanocomposites reinforced with sodium montmorillonite and TiO2 nanomaterials. Carbohydr. Polym. 2018, 199, 415–425. [Google Scholar] [CrossRef] [PubMed]
- Popescu, C.-M.; Popescu, M.-C.; Singurel, G.; Vasile, C.; Argyropoulos, D.S.; Willför, S. Spectral characterization of Eucalyptus wood. Appl. Spectrosc. 2007, 61, 1168–1177. [Google Scholar] [CrossRef] [PubMed]
- Popescu, C.-M.; Larsson, P.T.; Olaru, N.; Vasile, C. Spectroscopic study of acetylated kraft pulp fibers. Carbohydr. Polym. 2012, 88, 530–536. [Google Scholar] [CrossRef]
- Mendoza, D.J.; Browne, C.; Raghuwanshi, V.S.; Simon, G.P.; Garnier, G. One-shot TEMPO-periodate oxidation of native cellulose. Carbohydr. Polym. 2019, 226, 115292. [Google Scholar] [CrossRef]
- Nishiyama, Y.; Johnson, G.P.; French, A.D. Diffraction from nonperiodic models of cellulose crystals. Cellulose 2012, 19, 319–336. [Google Scholar] [CrossRef]
- Poletto, M.; Pistor, V.; Zattera, A.J. Structural characteristics and thermal properties of native cellulose. Cellul. Fundam. Asp. 2013, 2, 45–68. [Google Scholar]
- Kassab, Z.; Aziz, F.; Hannache, H.; Youcef, H.B.; El Achaby, M. Improved mechanical properties of k-carrageenan-based nanocomposite films reinforced with cellulose nanocrystals. Int. J. Biol. Macromol. 2019, 123, 1248–1256. [Google Scholar] [CrossRef]
- Chen, Q.-J.; Zhou, L.-L.; Zou, J.-Q.; Gao, X. The preparation and characterization of nanocomposite film reinforced by modified cellulose nanocrystals. Int. J. Biol. Macromol. 2019, 132, 1155–1162. [Google Scholar] [CrossRef] [PubMed]
- Popescu, M.-C.; Dogaru, B.-I.; Sun, D.; Stoleru, E.; Simionescu, B.C. Structural and sorption properties of bio-nanocomposite films based on κ-carrageenan and cellulose nanocrystals. Int. J. Biol. Macromol. 2019, 135, 462–471. [Google Scholar] [CrossRef] [PubMed]
- Yang, F.; Li, G.; He, Y.G.; Ren, F.X.; Wang, G.-X. Synthesis, characterization, and applied properties of carboxymethyl cellulose and polyacrylamide graft copolymer. Carbohydr. Polym. 2009, 78, 95–99. [Google Scholar] [CrossRef]
- Tongdeesoontorn, W.; Mauer, L.J.; Wongruong, S.; Sriburi, P.; Rachtanapun, P. Effect of carboxymethyl cellulose concentration on physical properties of biodegradable cassava starch-based films. Chem. Cent. J. 2011, 5, 1–8. [Google Scholar] [CrossRef] [Green Version]
- Noda, I.; Ozaki, Y. Two-Dimensional Correlation Spectroscopy: Applications in Vibrational and Optical Spectroscopy; John Wiley and Sons: Chichester, UK, 2004. [Google Scholar]
- Gupta, B.; Agarwal, R.; Alam, M.S. Preparation and characterization of polyvinyl alcohol-polyethylene oxide-carboxymethyl cellulose blend membranes. J. Appl. Polym. Sci. 2013, 127, 1301–1308. [Google Scholar] [CrossRef]
- Cai, Z.; Kim, J. Bacterial cellulose/poly(ethylene glycol) composite: Characterization and first evaluation of biocompatibility. Cellulose 2010, 17, 83–91. [Google Scholar] [CrossRef]
- French, A.D. Idealized powder diffraction patterns for cellulose polymorphs. Cellulose 2014, 21, 885–896. [Google Scholar] [CrossRef]
- Rico, M.; Rodríguez-Llamazares, S.; Barral, L.; Bouza, R.; Montero, B. Processing and characterization of polyols plasticized-starch reinforced with microcrystalline cellulose. Carbohydr. Polym. 2016, 149, 83–93. [Google Scholar] [CrossRef]
- Popescu, M.-C.; Dogaru, B.-I.; Popescu, C.-M. The influence of cellulose nanocrystals content on the water sorption properties of bio-based composite films. Mater. Des. 2017, 132, 170–177. [Google Scholar] [CrossRef]
- Van der Wel, G.K.; Adan, O.C.G. Moisture of organic coatings—A review. Prog. Org. Coat. 1991, 37, 1–14. [Google Scholar] [CrossRef]
- Lu, Y.; Weng, L.; Cao, X. Biocomposites of plasticized starch reinforced with cellulose crystallites from cottonseed linter. Macromol. Biosci. 2005, 5, 1101–1107. [Google Scholar] [CrossRef] [PubMed]
- Yin, Q.; Wang, D.; Jia, H.; Ji, Q.; Wang, L.; Li, G.; Yin, B. Water-induced modulus changes of bio-based uncured nanocomposite film based on natural rubber and bacterial cellulose nanocrystals. Ind. Crop. Prod. 2018, 113, 240–248. [Google Scholar] [CrossRef]
- Mujtaba, M.; Salaberria, A.M.; Andres, M.A.; Kaya, M.; Gunyakti, A.; Labidi, J. Utilization of flax (Linum usitatissimum) cellulose nanocrystals asreinforcing material for chitosan films. Int. J. Biol. Macromol. 2017, 104, 944–952. [Google Scholar] [CrossRef] [PubMed]
- Guan, L.; Xu, H.; Huang, D. The investigation on states of water in different hydrophilic polymers by DSC and FTIR. J. Polym. Res. 2011, 18, 681–689. [Google Scholar] [CrossRef]
- Cotugno, S.; Larobina, D.; Mensitieri, G.; Musto, P.; Ragosta, G. A novel spectroscopic approach to investigate transport processes in polymers: The case of water-epoxy system. Polymer 2001, 42, 6431–6438. [Google Scholar] [CrossRef]


| Codes | Composition | ||
|---|---|---|---|
| CMC | CNC | G (⁂) | |
| CMC-G | 100 | - | 30 |
| CNC | - | 100 | - |
| CMC-CNC 5 | 95 | 5 | 30 |
| CMC-CNC 10 | 90 | 10 | 30 |
| CMC-CNC 15 | 85 | 15 | 30 |
| Codes | CNC | CMC-CNC 15 | CMC-CNC 10 | CMC-CNC 5 |
|---|---|---|---|---|
| Cr.I % | 73.3 | 44.8 | 38.0 | 28.9 |
| τ200 | 4.02 ± 0.01 | 5.20 ± 0.02 | 5.33 ± 0.01 | 5.39 ± 0.02 |
| d200 | 0.387 | 0.388 | 0.388 | 0.390 |
© 2020 by the authors. Licensee MDPI, Basel, Switzerland. This article is an open access article distributed under the terms and conditions of the Creative Commons Attribution (CC BY) license (http://creativecommons.org/licenses/by/4.0/).
Share and Cite
Popescu, M.-C.; Dogaru, B.-I.; Popescu, C.-M. Effect of Cellulose Nanocrystals Nanofiller on the Structure and Sorption Properties of Carboxymethyl Cellulose–Glycerol–Cellulose Nanocrystals Nanocomposite Systems. Materials 2020, 13, 2900. https://doi.org/10.3390/ma13132900
Popescu M-C, Dogaru B-I, Popescu C-M. Effect of Cellulose Nanocrystals Nanofiller on the Structure and Sorption Properties of Carboxymethyl Cellulose–Glycerol–Cellulose Nanocrystals Nanocomposite Systems. Materials. 2020; 13(13):2900. https://doi.org/10.3390/ma13132900
Chicago/Turabian StylePopescu, Maria-Cristina, Bianca-Ioana Dogaru, and Carmen-Mihaela Popescu. 2020. "Effect of Cellulose Nanocrystals Nanofiller on the Structure and Sorption Properties of Carboxymethyl Cellulose–Glycerol–Cellulose Nanocrystals Nanocomposite Systems" Materials 13, no. 13: 2900. https://doi.org/10.3390/ma13132900