Article

Effect of Pressure and Temperature on CO2/CH4 Competitive Adsorption on Kaolinite by Monte Carlo Simulations

1
College of Safety and Emergency Management Engineering, Taiyuan University of Technology, Taiyuan 030024, China
2
Key Laboratory of In-situ Property-improving Mining of Ministry of Education, Taiyuan University of Technology, Taiyuan 030024, China
*
Author to whom correspondence should be addressed.
Materials 2020, 13(12), 2851; https://doi.org/10.3390/ma13122851
Submission received: 20 May 2020 / Revised: 21 June 2020 / Accepted: 23 June 2020 / Published: 25 June 2020
(This article belongs to the Special Issue Novel Inorganic Adsorbents for Environmental Purification)

Abstract

:
The adsorption of CO2 and CO2/CH4 mixtures on kaolinite was calculated by grand canonical Monte Carlo (GCMC) simulations with different temperatures (283.15, 293.15, and 313.15 K) up to 40 MPa. The simulation results show that the adsorption amount of CO2 followed the Langmuir model and decreased with an increasing temperature. The excess adsorption of CO2 increased with an increasing pressure until the pressure reached 3 MPa and then decreased at different temperatures. The S C O 2 / C H 4 decreased logarithmically with increasing pressure, and the S C O 2 / C H 4 was lower with a higher temperature at the same pressure. The interaction energy between CO2 and kaolinite was much higher than that between CH4 and kaolinite at the same pressure. The interaction energy between the adsorbent and adsorbate was dominant, and that between CO2 and CO2 and between CH4 and CH4 accounted for less than 20% of the total interaction energy. The isothermal adsorption heat of CO2 was higher than that of CH4, indicating that the affinity of kaolinite to CO2 was higher than that of CH4. The strong adsorption sites of carbon dioxide on kaolinite were hydrogen, oxygen, and silicon atoms, respectively. CO2 was not only physically adsorbed on kaolinite, but also exhibited chemical adsorption. In gas-bearing reservoirs, a CO2 injection to displace CH4 and enhance CO2 sequestration and enhanced gas recovery (CS-EGR) should be implemented at a low temperature.

1. Introduction

As CO2 emissions are increasing, global warming is becoming an increasingly serious environmental problem [1,2]. In order to reduce CO2 in the atmosphere, the effective capture and sequestration of CO2 has received a greater amount of attention. Compared with activated carbons, zeolites, and metal organic frameworks (MOFs), clay minerals may be more suitable for CO2 capture and sequestration [3]. This is because a clay mineral is a natural adsorbent that is widely available in the soil and sedimentary environment and is cheap and easily available [4]. Furthermore, the adsorption of molecules on porous media, such as shale and coal, can be significantly affected by clay minerals which possess a large surface area [5,6,7]. Compared with CH4, CO2 can be preferentially adsorbed on shale and coal [8]. This means that CH4 can be displaced from a coal bed or shale gas reservoir by injecting CO2 into the gas-bearing reservoir to improve gas recovery (CS-EGR) [9]. Hence, a deeper understanding of the CO2/CH4 competitive adsorption behavior in clay will help optimize the CS-EGR technology.
Much of the literature refers to studying the adsorption behaviors of CH4 in clays [10]. There are also several experiments relating to CO2 adsorption on clays. Rother et al. [11] studied the CO2 adsorption on sub-single hydration layer montmorillonite clay by excess sorption and neutron diffraction. The results show that the maximum CO2 concentration was 0.15 g/cm3, after which the excess adsorption decreased linearly to zero, and the negative value increased with the increase in the CO2 bulk density. Alhwaige et al. [12] measured the adsorption ability of clay-reinforced bio-based chitosan polybenzoxazine nanocomposites for CO2. They found that the adsorption capacity of CO2 and the reversibility of adsorption–desorption were excellent, and the reversible adsorption capacity could reach 5.72 mmol/g. However, research on the competitive adsorption behavior of CO2/CH4 in clay is very limited.
In the past few years, molecular simulations have been executed to research CO2/CH4 competitive adsorption on clay minerals. Yang et al. [13] researched the adsorption behavior of CH4, CO2, and CH4/CO2 on Na-montmorillonite by grand canonical Monte Carlo (GCMC) simulations. The results indicate that the adsorption capacity of CO2 was higher than that of CH4. At yCO2 = 0.5, the selectivity of CO2/CH4 was generally in the range of 25.0–46.8. Jin and Firoozabadi [14] found that the adsorption of CH4 and CO2 is mainly dependent on the surface area of Na-montmorillonite. In addition, the adsorption of CO2 increased rapidly with the enhanced cation exchange under low pressure. They further studied the effect of the water content of montmorillonite on its adsorption of CH4 and CO2. The results show that water molecules are preferentially adsorbed on the surface of Na-montmorillonite at less than 10 MPa. CH4 and CO2 are adsorbed on the surface of water molecules to form a weak second adsorption layer. CO2 can exhibit multi-layer adsorption with an increased pressure, but CH4 cannot. The adsorption behavior of CH4 and CO2 has been studied for years, but few researchers have focused on the influence mechanism of a clay structure on the competitive adsorption between CH4 and CO2.
Based on the above analysis, in this investigation, we studied the adsorption of CO2 and CO2/CH4 mixtures on kaolinite by GCMC simulations with different temperatures (283.15, 293.15, and 313.15 K) up to 40 MPa. The interaction energies, isosteric heat of adsorption, and radial distribution function (RDF) were also analyzed. Kaolinite is one of the most abundant components in clay minerals [15]. As inorganic matter, due to the large specific surface area of kaolinite, it has a great significance for CO2 capture and CH4 production to study the interaction mechanism between kaolinite and CH4/CO2 [16]. In this research, we hope to clarify details of CO2/CH4 competing adsorption behavior accompanying the CS-EGR process.

2. Simulation Methods

2.1. Models

The kaolinite layered configuration determined by Bish’s experiment [17] was directly used. Our research object was a 4 × 2 × 2 kaolinite (001) surface supercell model, and the detailed modeling processes and parameters were the same as in our previously published works [18,19]. An all-atom model was used to represent methane, where the C-H bond length was 0.109 nm and the C-H bond angle was 109°28’ [20,21]. A CO2 molecule was described as a three-center model (EPM2) and the C-O bond length was 0.1149 nm [22].

2.2. Interaction Potential Model

The interactions between CO2/CH4 and the kaolinite were simulated using the Dreiding force field [23,24]. The atomic charge and Lennard–Jones parameters were taken from Zhang et al. [18,19], Zhang et al. [25], and Harris and Yung [26], as listed in Table 1. We estimated the Coulomb interaction between the charges in the system utilizing Ewald’s summation method, the accuracy of which is 1 × 10⁻⁵ kcal mol−1. The van der Waals interaction was determined by utilizing an atomic base cutoff radius with a value of 0.8 nm [26]. A much larger vacuum space than LX or Ly was placed along the Z direction in the simulation cell. The long-range electrostatic interactions and the slab geometry were accounted for by the three-dimensional Ewald summation considering the correction term [27,28].

2.3. Simulation Details

We calculated the adsorption of CO2 and CO2/CH4 mixtures on kaolinite by utilizing GCMC simulations, which have been widely used to solve adsorption problems. The isosteric heat of adsorption, interaction energies, and radial distribution function (RDF) with different temperatures (283.15, 293.15, and 313.15 K) and pressures of up to 40 MPa were analyzed.
Peng–Robinson’s state equation [29] was used to obtain the fugacity, which was the effective pressure of gas. For the calculation, the periodic boundary conditions and metropolis arithmetic rue [30] were used to accept or reject the generation, disappearance, translation, and rotation of methane molecules, depending on energy changes. The simulation generated 1 × 10⁸ configurations [31]. Half of the system was configured to maintain balance and the other was used for calculations. The sorption module of the Materials Studio software was employed in all GCMC simulations [32]. The absolute adsorption was fitted by the Langmuir model, which is expressed as
n a = N L P P L + P  
The Langmuir pressure (PL) represents the pressure at which the gas adsorption capacity is half of the maximum gas adsorption capacity. PL values are typically used to evaluate the methane affinity of absorbents and the feasibility of gas desorption under reservoir pressures, with lower PL values indicating that methane adsorption occurs more readily and that desorption is more difficult to achieve.
The relationship between excess adsorption and absolute adsorption was
n e = n a υ ρ .
In this paper, the free pore volume of the kaolinite model was calculated by inserting the probe, utilizing the Atom Volumes and Surface tool in the Materials Studio software.
The adsorption selectivity in the binary mixtures can reflect the relative adsorption priority between CO2 and CH4, which is defined as [33].
S C O 2 / C H 4 = x C O 2 / x C H 4 y C O 2 / y C H 4 .
It should be noted that when S C O 2 / C H 4 > 1, CO2 is preferably adsorbed on the kaolinite, and a higher selectivity reflects that the adsorption capacity of CO2 relative to CH4 is greater.
The van der Waals energy and electrostatic energy together constitute the total interaction energy [18,34].
Direct electrostatic and higher-order interactions were neglected in the calculation of the total interaction energy. For a simple molecular model, the total interaction potential is underestimated by 5–15% [23,35].
The interaction energy was calculated according to
E Interaction = E A B E A + E B .
We used the Clausius Clapeyron equation to calculate the isothermal adsorption heat q s t , kJ/mol, which implied the information of energy release in the adsorption process [36].
q s t = R T 2 ln P T N
The radial distribution function g(r) was used to calculate the relationship between the density variation of the guest molecule (CO2, CH4) and its distance to the surface of kaolinite [37].
g i j r = d N 4 π ρ j r 2 d r

3. Results and Discussion

3.1. Validation

The model, force field, and interaction between CH4 and kaolinite were verified by experiments on lattice parameters, pore volumes, and adsorption isotherms in our previous work. Our simulation results were compared with the experimental results of Chen and Lu [38], which validated that the interaction between CO2 and kaolinite was reasonable.
Figure 1 shows the adsorption isotherms of CO2 of the simulation results and the experimental results at the same temperature of 298.15 K. The simulation results of GCMC are nearly consistent with the experimental results. The slight differences were due to the differences in samples and methods [9,39]. These differences were also found in the study of Xiong et al [40]. Therefore, the adsorption of CO2 and the CO2/CH4 mixture on kaolinite could be studied further using a model and force field.

3.2. Single Component Adsorption

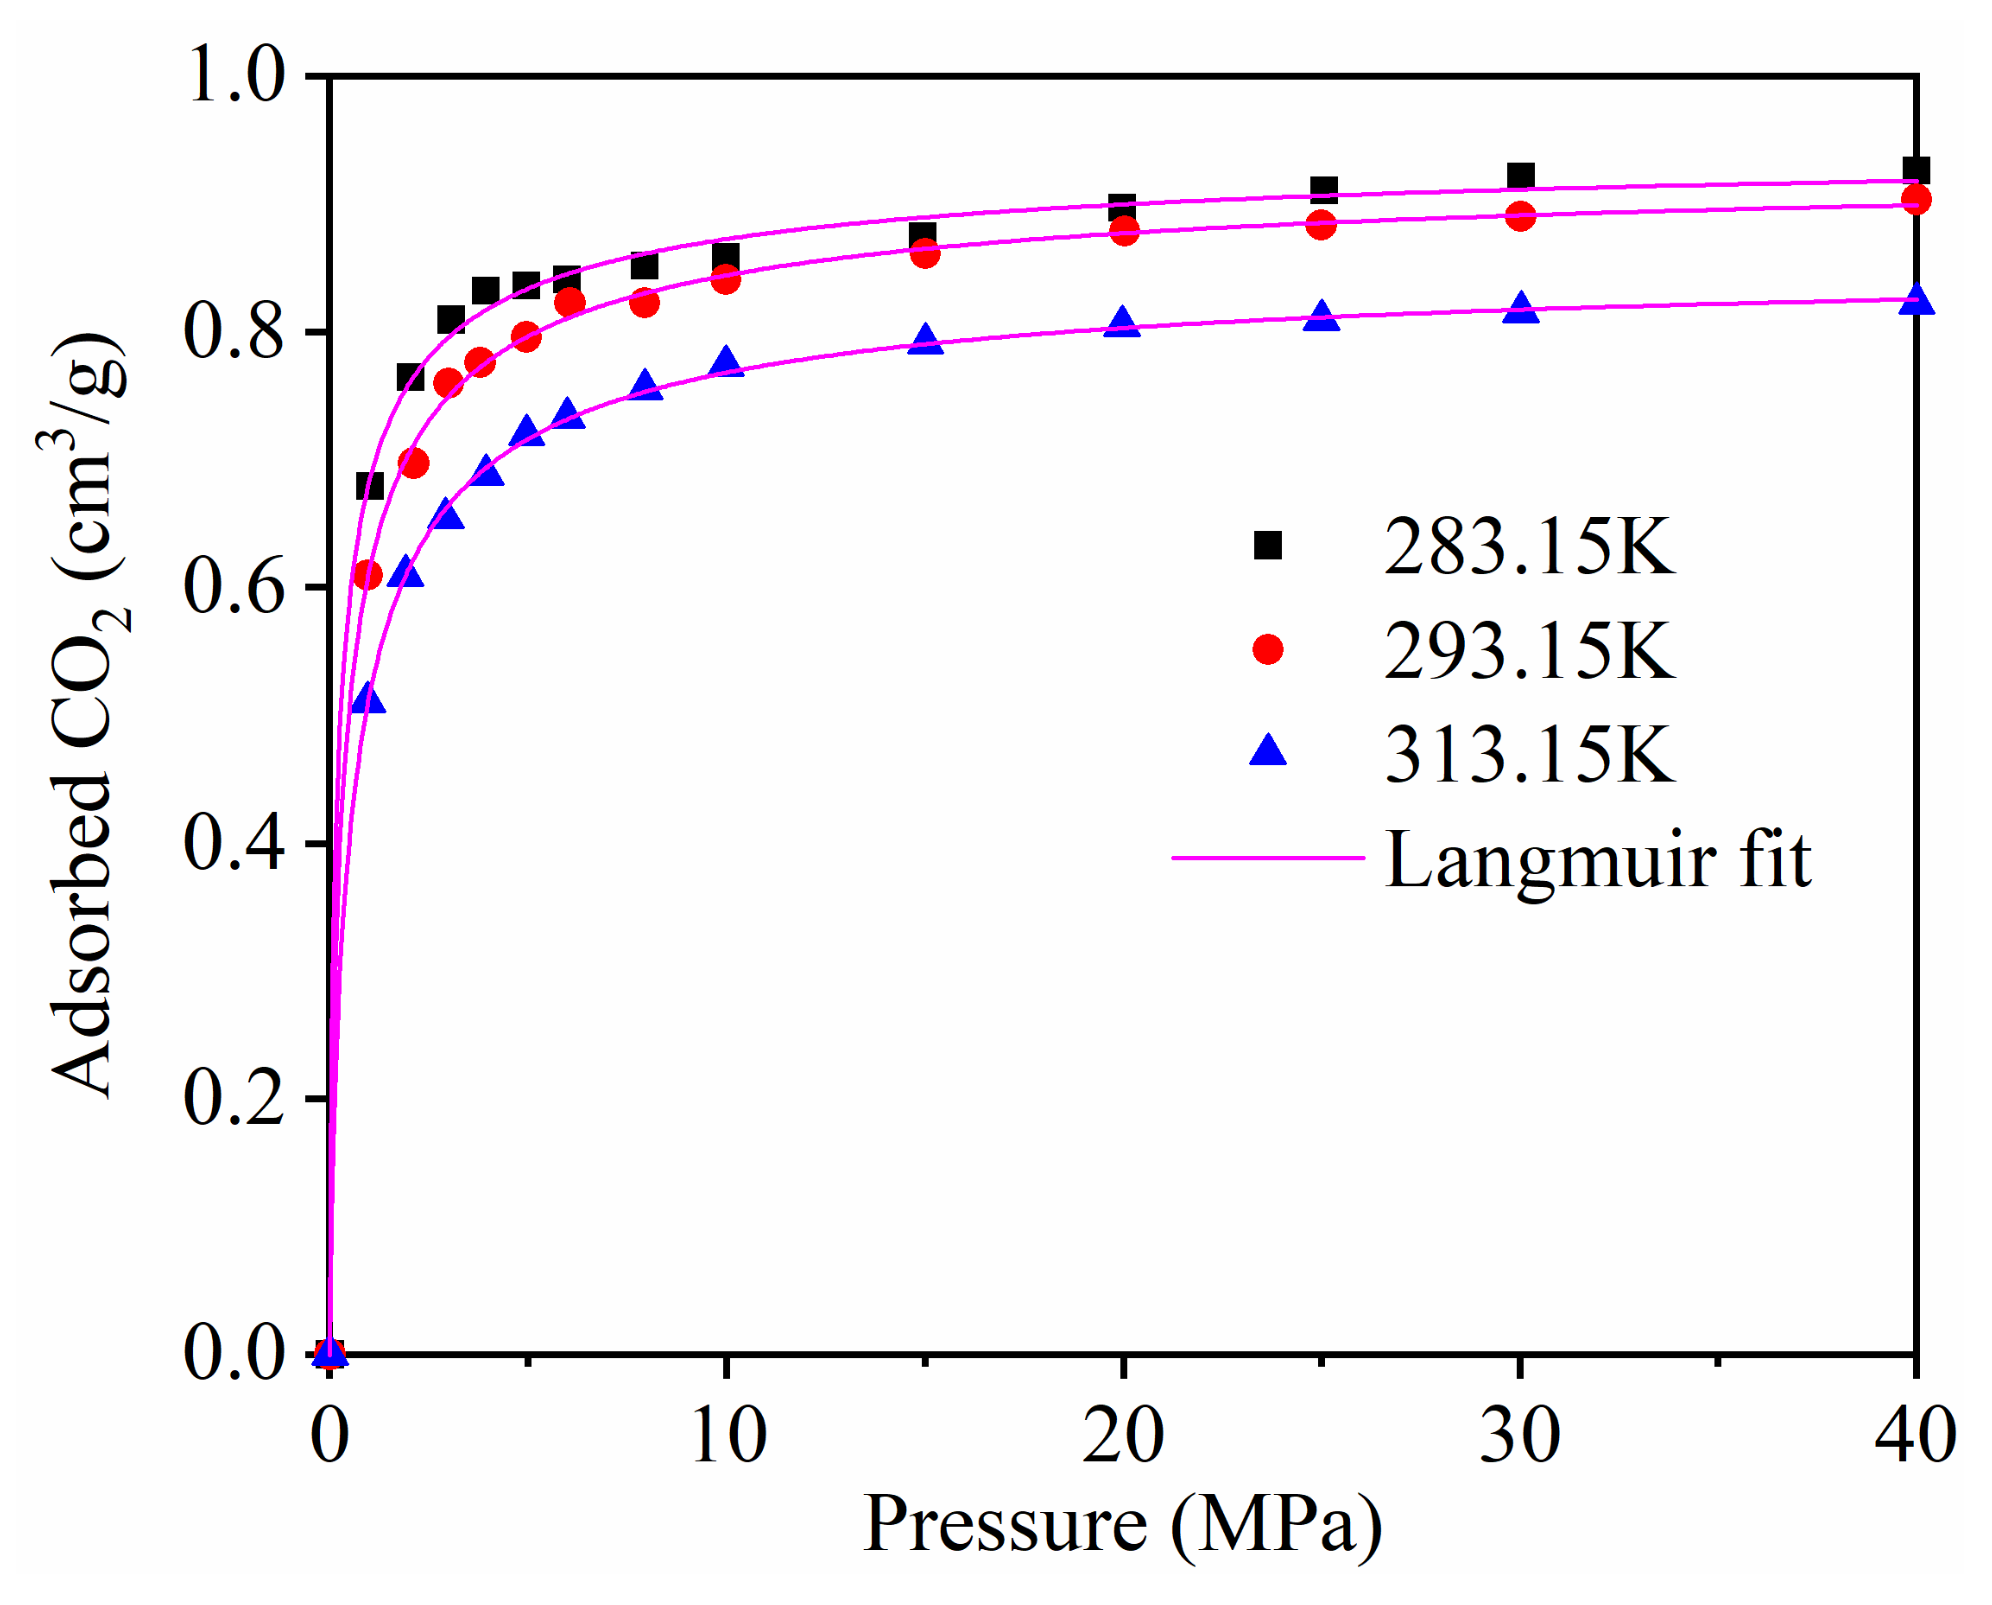
The single component adsorption of CH4 on kaolinite with different temperatures was studied in detail in our published paper [41]. Figure 2 displays the adsorption isotherms of CO2 at different temperatures. The molecule simulation study of Yang et al. [13] and Jin et al. [14] showed that the CO2 adsorption on montmorillonite clay. In terms of relative CO2 sorption capacity: montmorillonite > kaolinit. This may due to the fact that CO2 was adsorbed only on the external surface of kaolinite; however, adsorption also occurred in the interlayer space of montmorillonite, which had a larger interlayer distance than the size of a CO2 molecule.
The results demonstrate that the adsorption capacity of CO2 increased with the increase in the adsorption equilibrium pressure, and increased rapidly at low pressure. The adsorption capacity of CO2 decreased as the temperature increased.
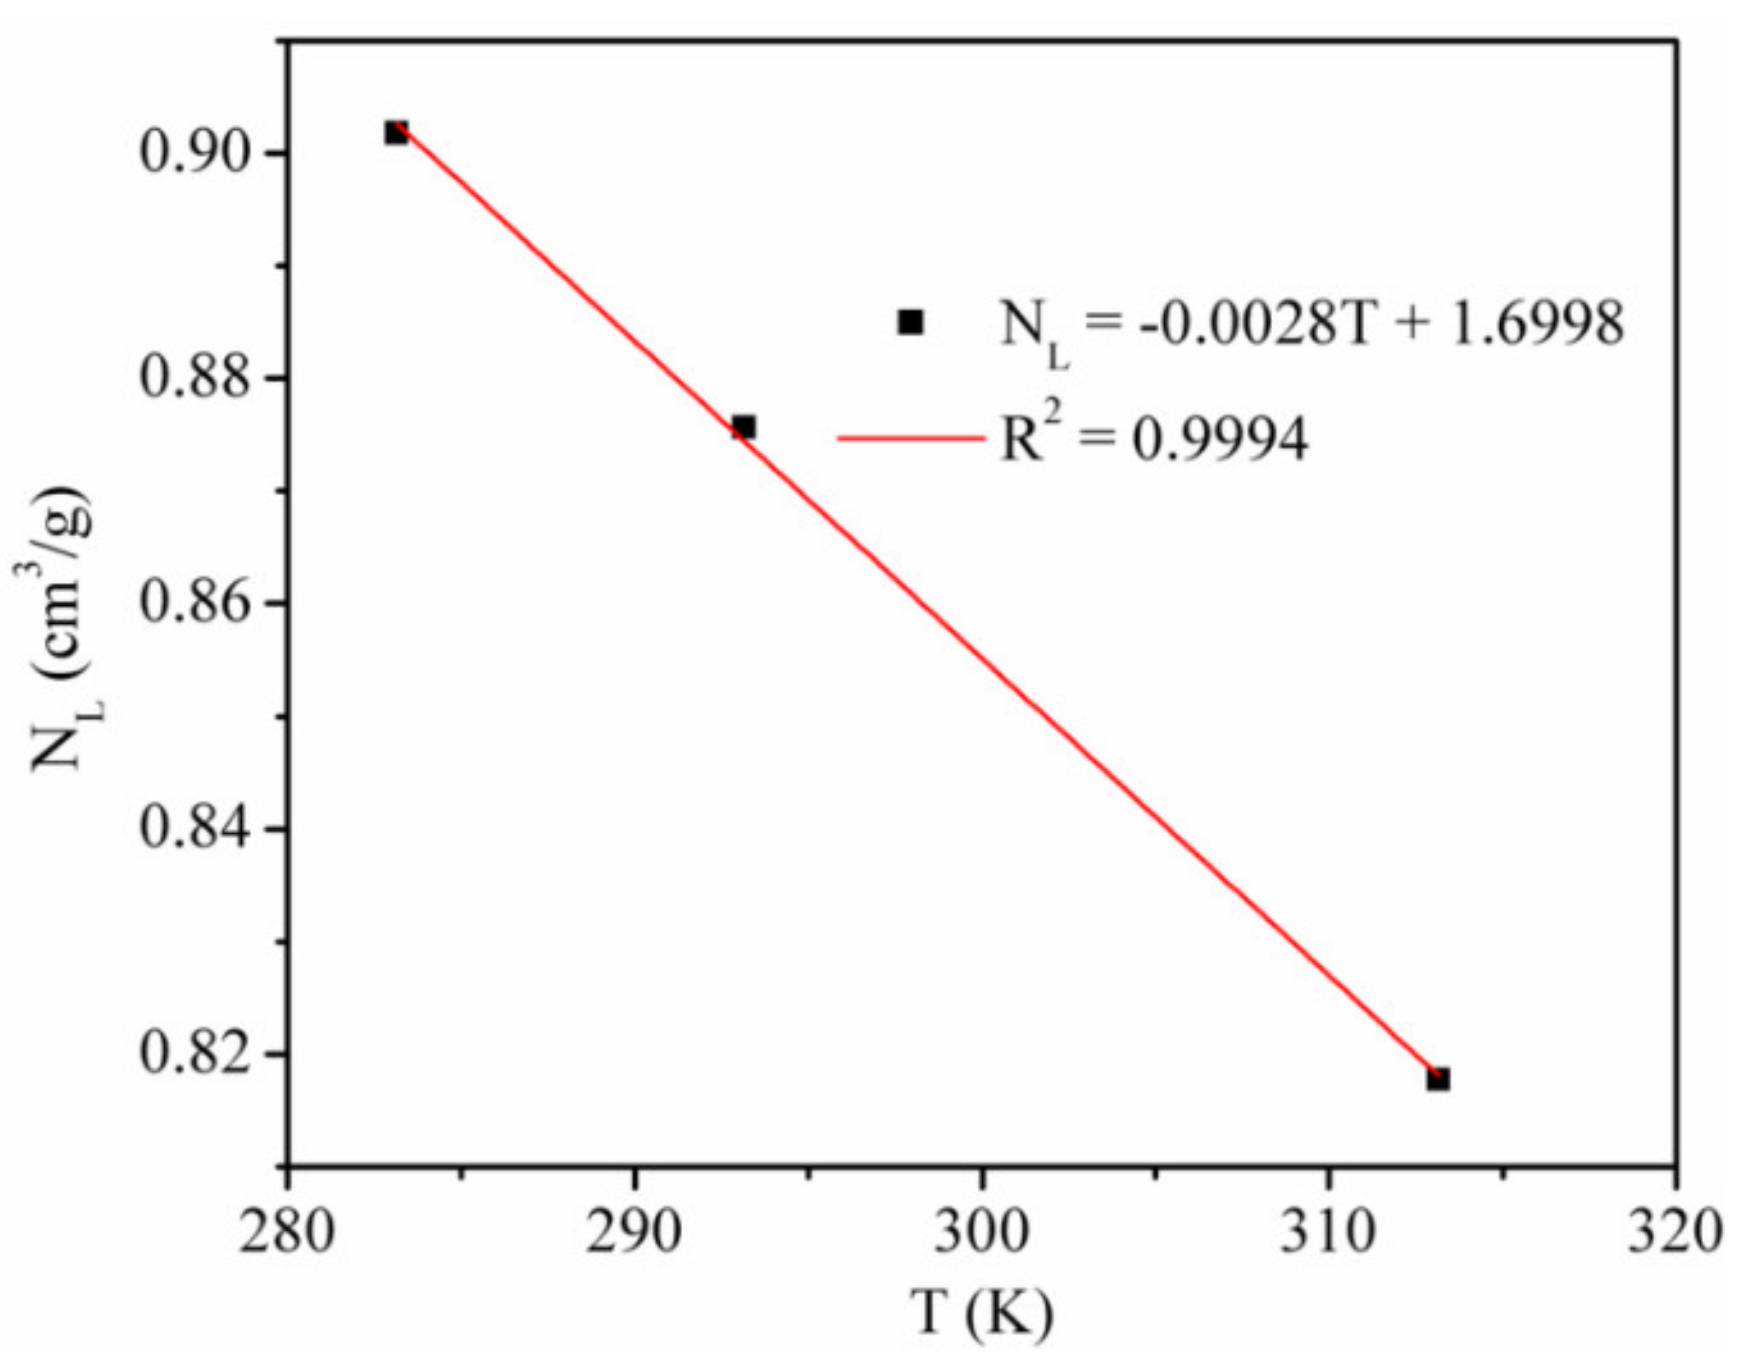
We studied the adsorption rate of CO2 by using the Langmuir equation to fit the simulation data (Figure 2) [6]. Table 2 shows the Langmuir constants. Figure 3 presents the temperature dependence of the CO2 maximum absolute amount adsorbed NL, cm3/g. It clearly shows that there is a negative linear relationship between NL and temperature, indicating that the CO2 maximum amount adsorbed decreased as the temperature increased.
The Langmuir pressure PL is the pressure at which the gas adsorption amount is NL/2. The PL value is usually applied to evaluate the molecule affinity of the adsorbent and the complexity of gas desorption. The Langmuir constant PL of CO2 adsorption on kaolinite was positively correlated with temperature, which indicated that with the increase in temperature, the adsorption of CO2 is more difficult and desorption becomes easier.
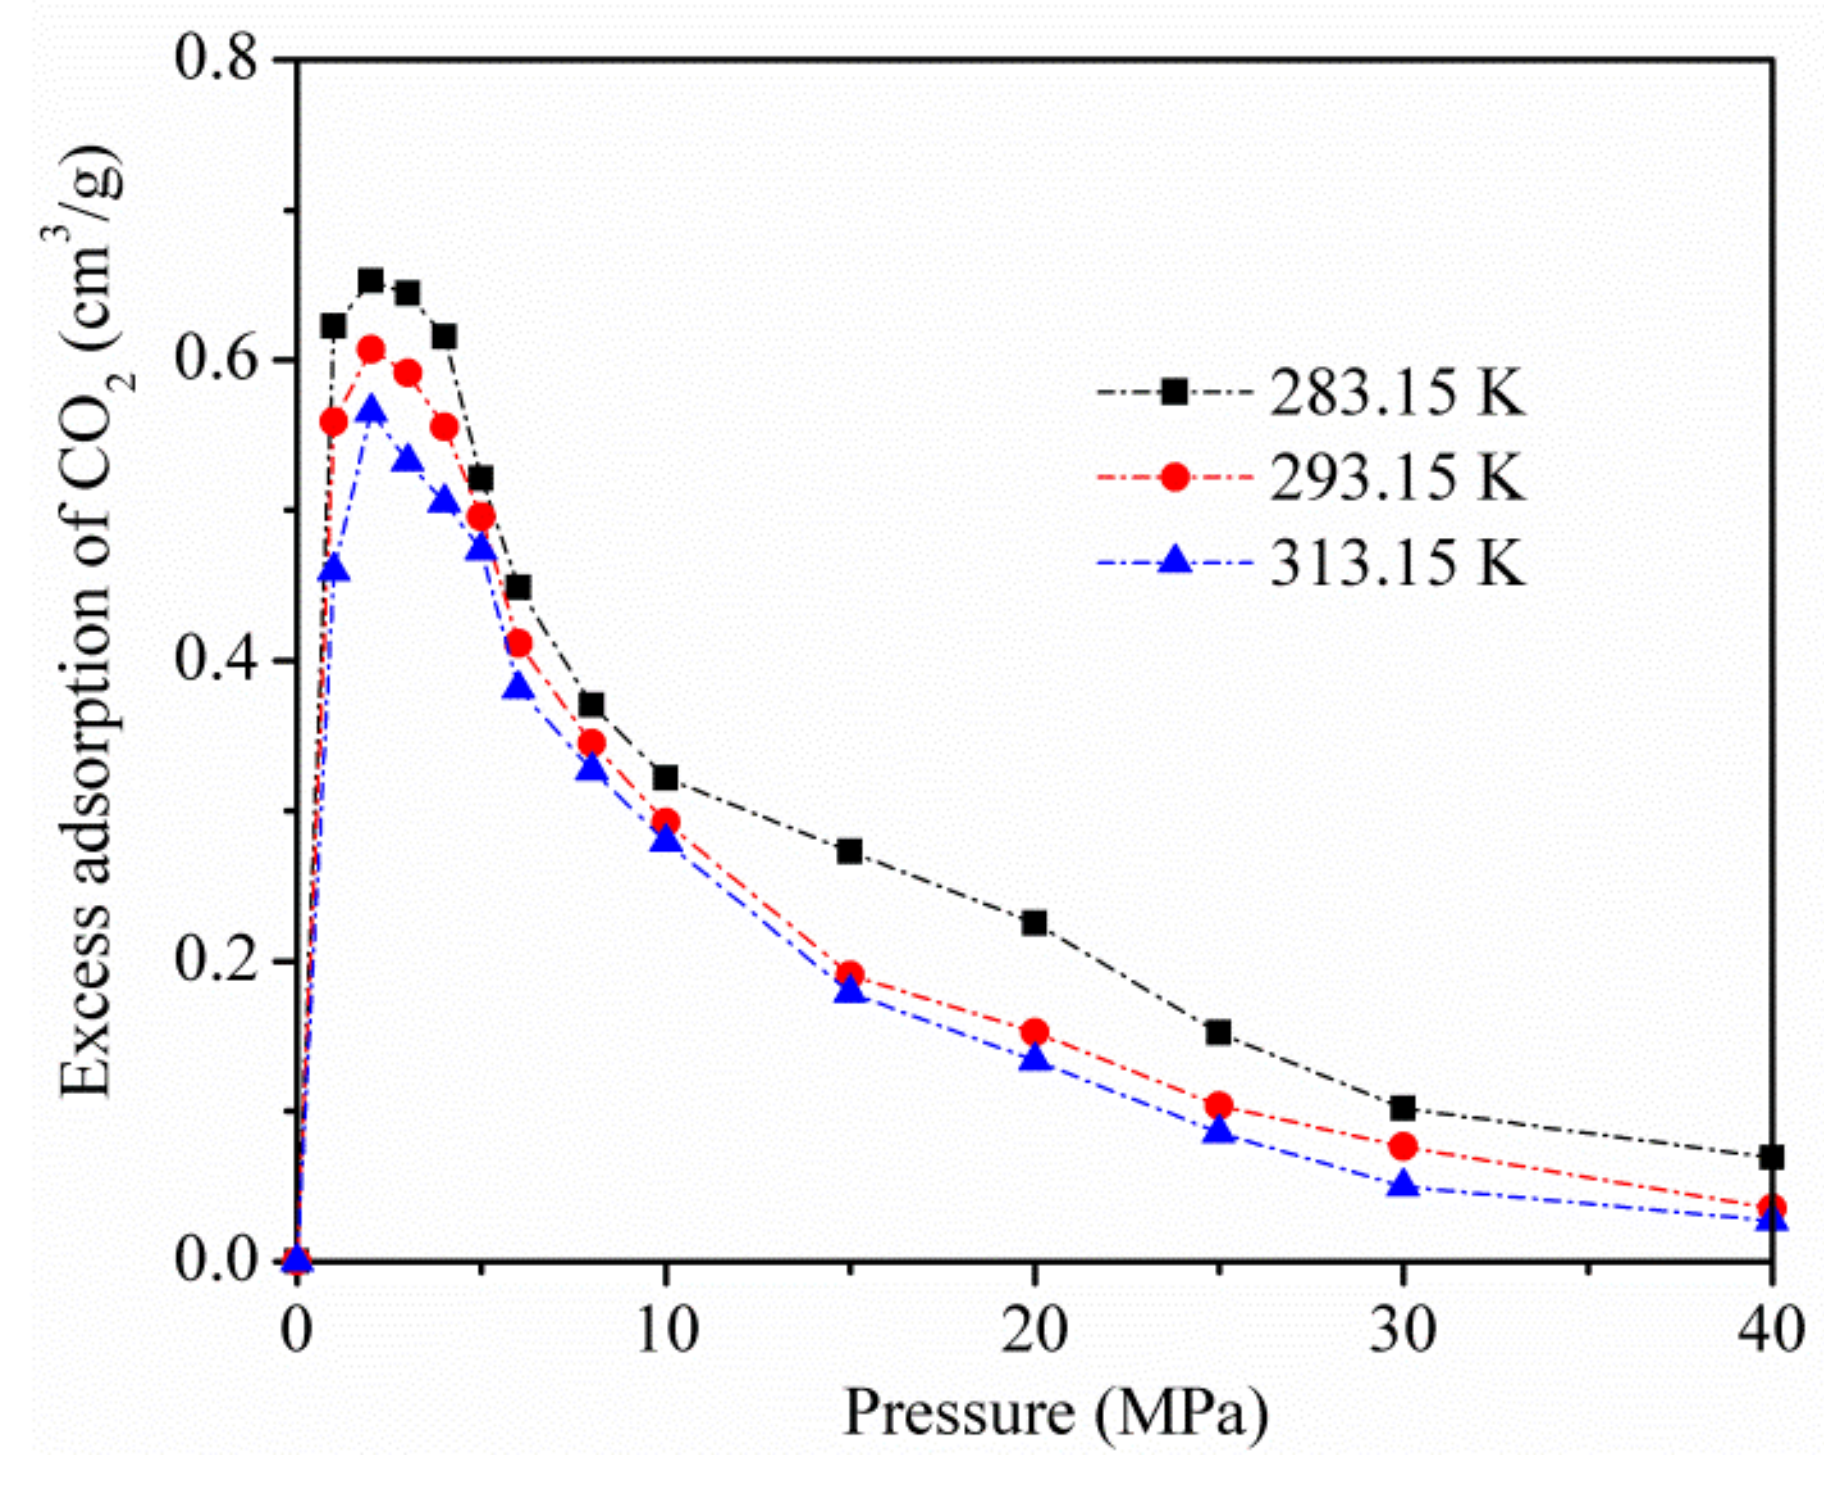
Figure 4 displays the excess adsorption of CO2 on kaolinite at temperatures of 283.15, 293.15, and 313.15 K. Excessive adsorption at different temperatures improves to a maximum (about 3 MPa) as the pressure increases, and then decreases at a higher pressure.
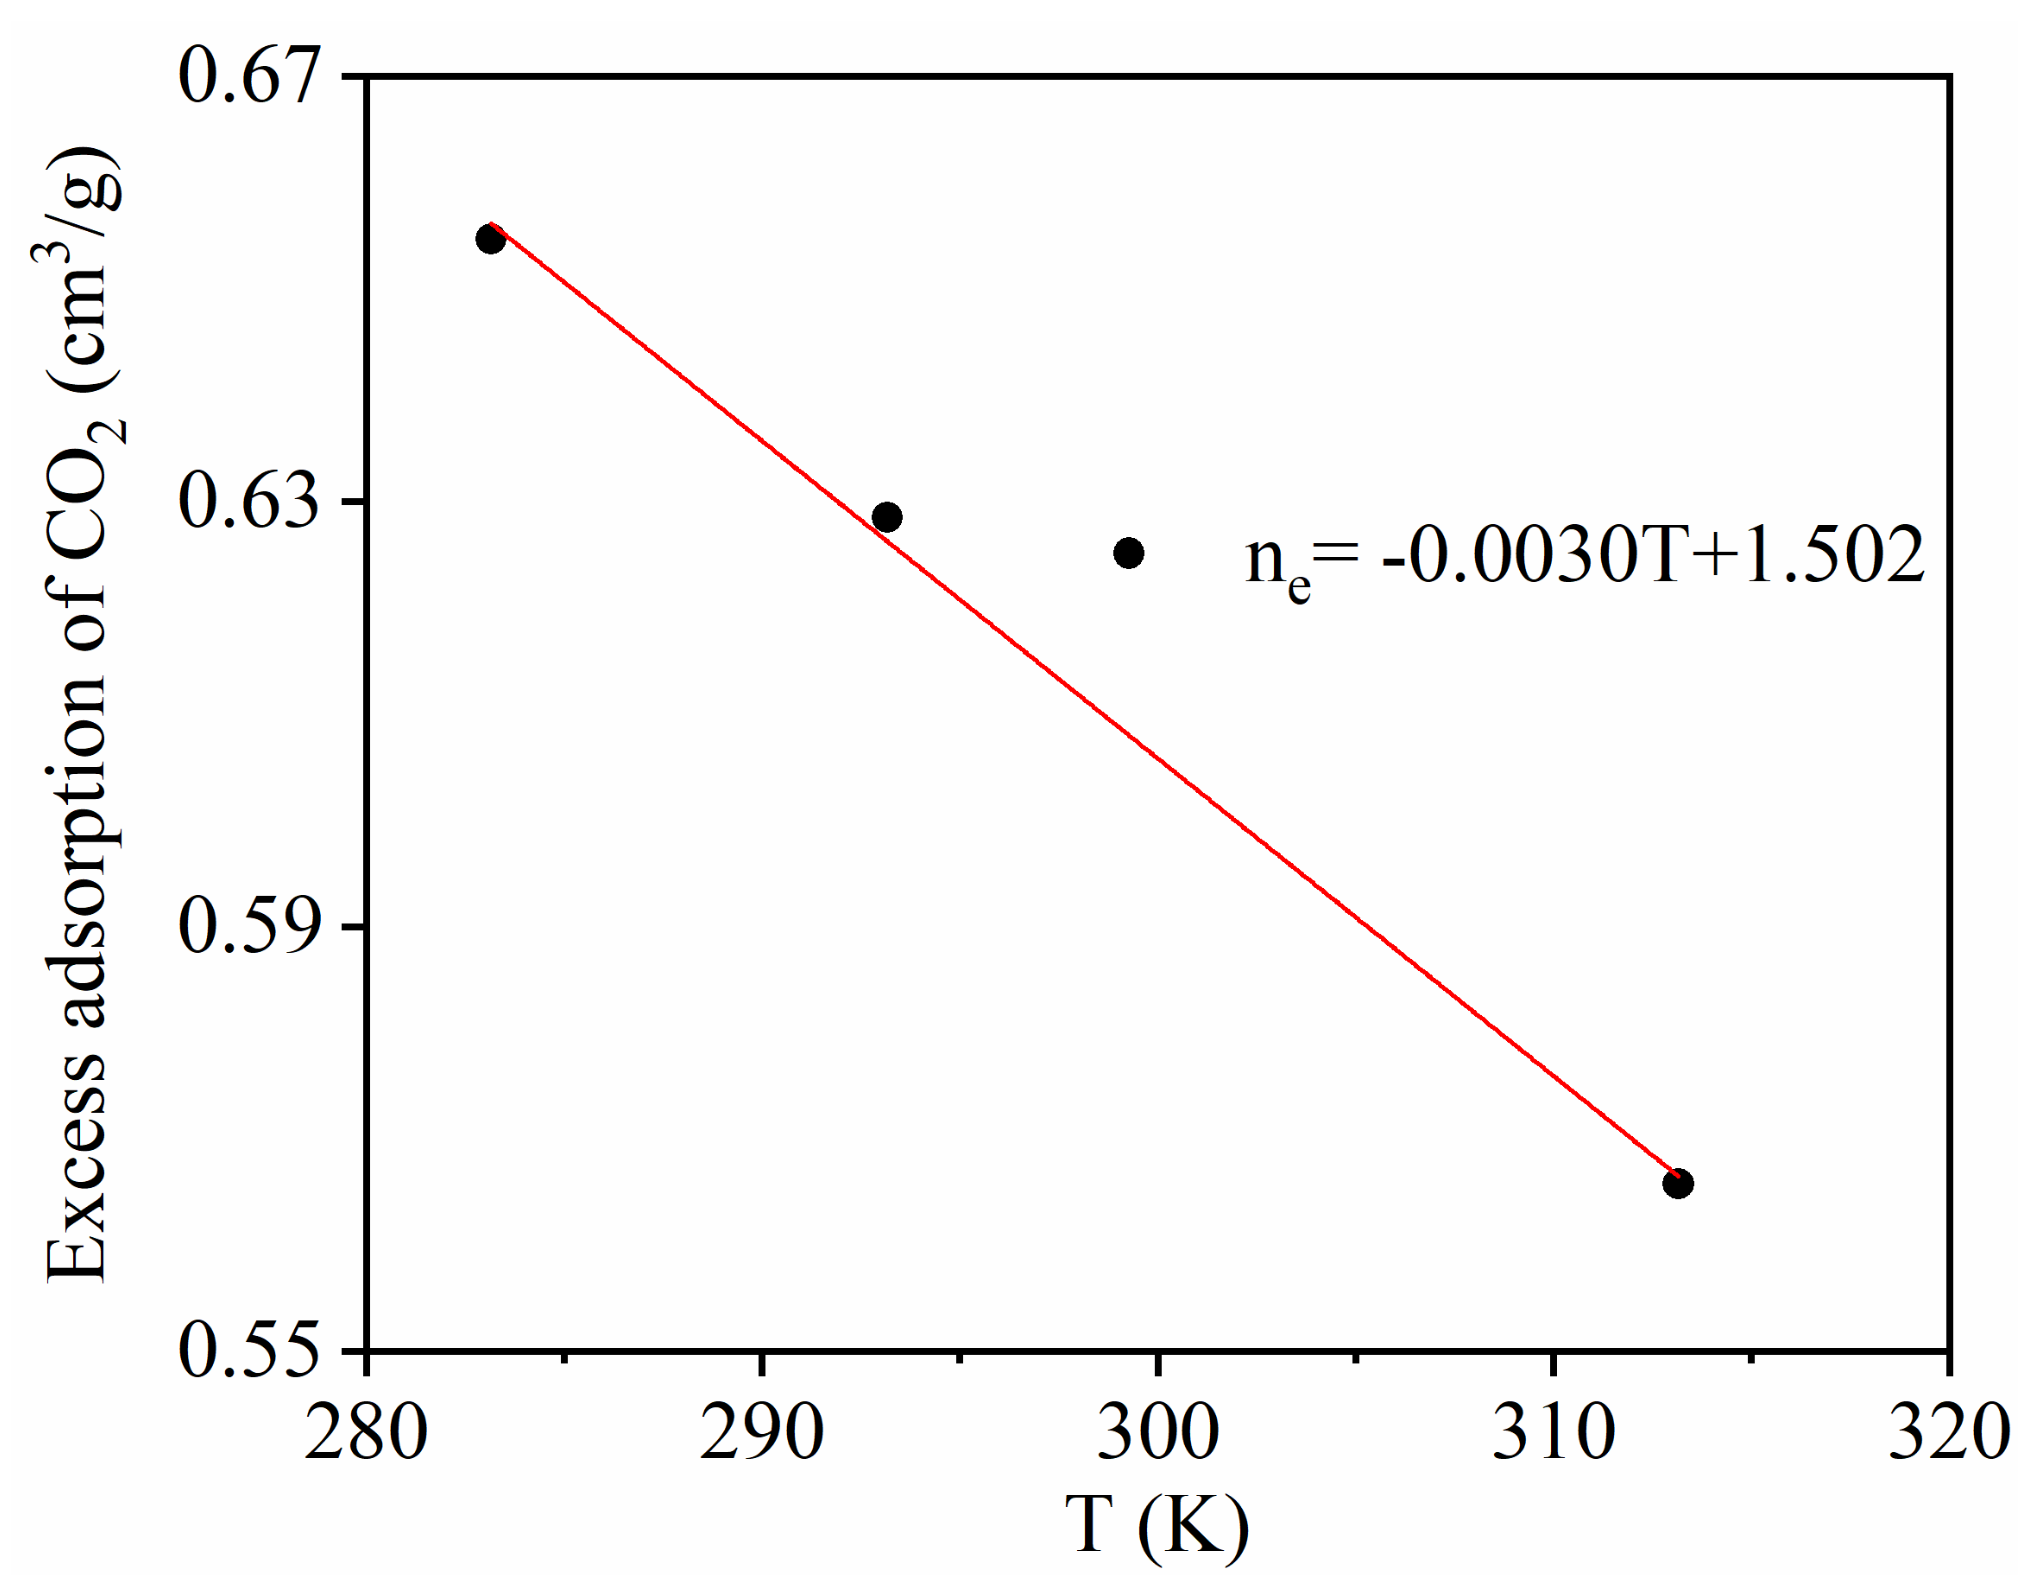
Figure 5 shows the temperature dependence of CO2 excess adsorption. It can be seen that the CO2 excess adsorption amount decreased linearly with temperature, indicating that the adsorption capacity of CO2 adsorption decreases when the temperature increases.

3.3. Adsorption of CO2/CH4 Mixtures

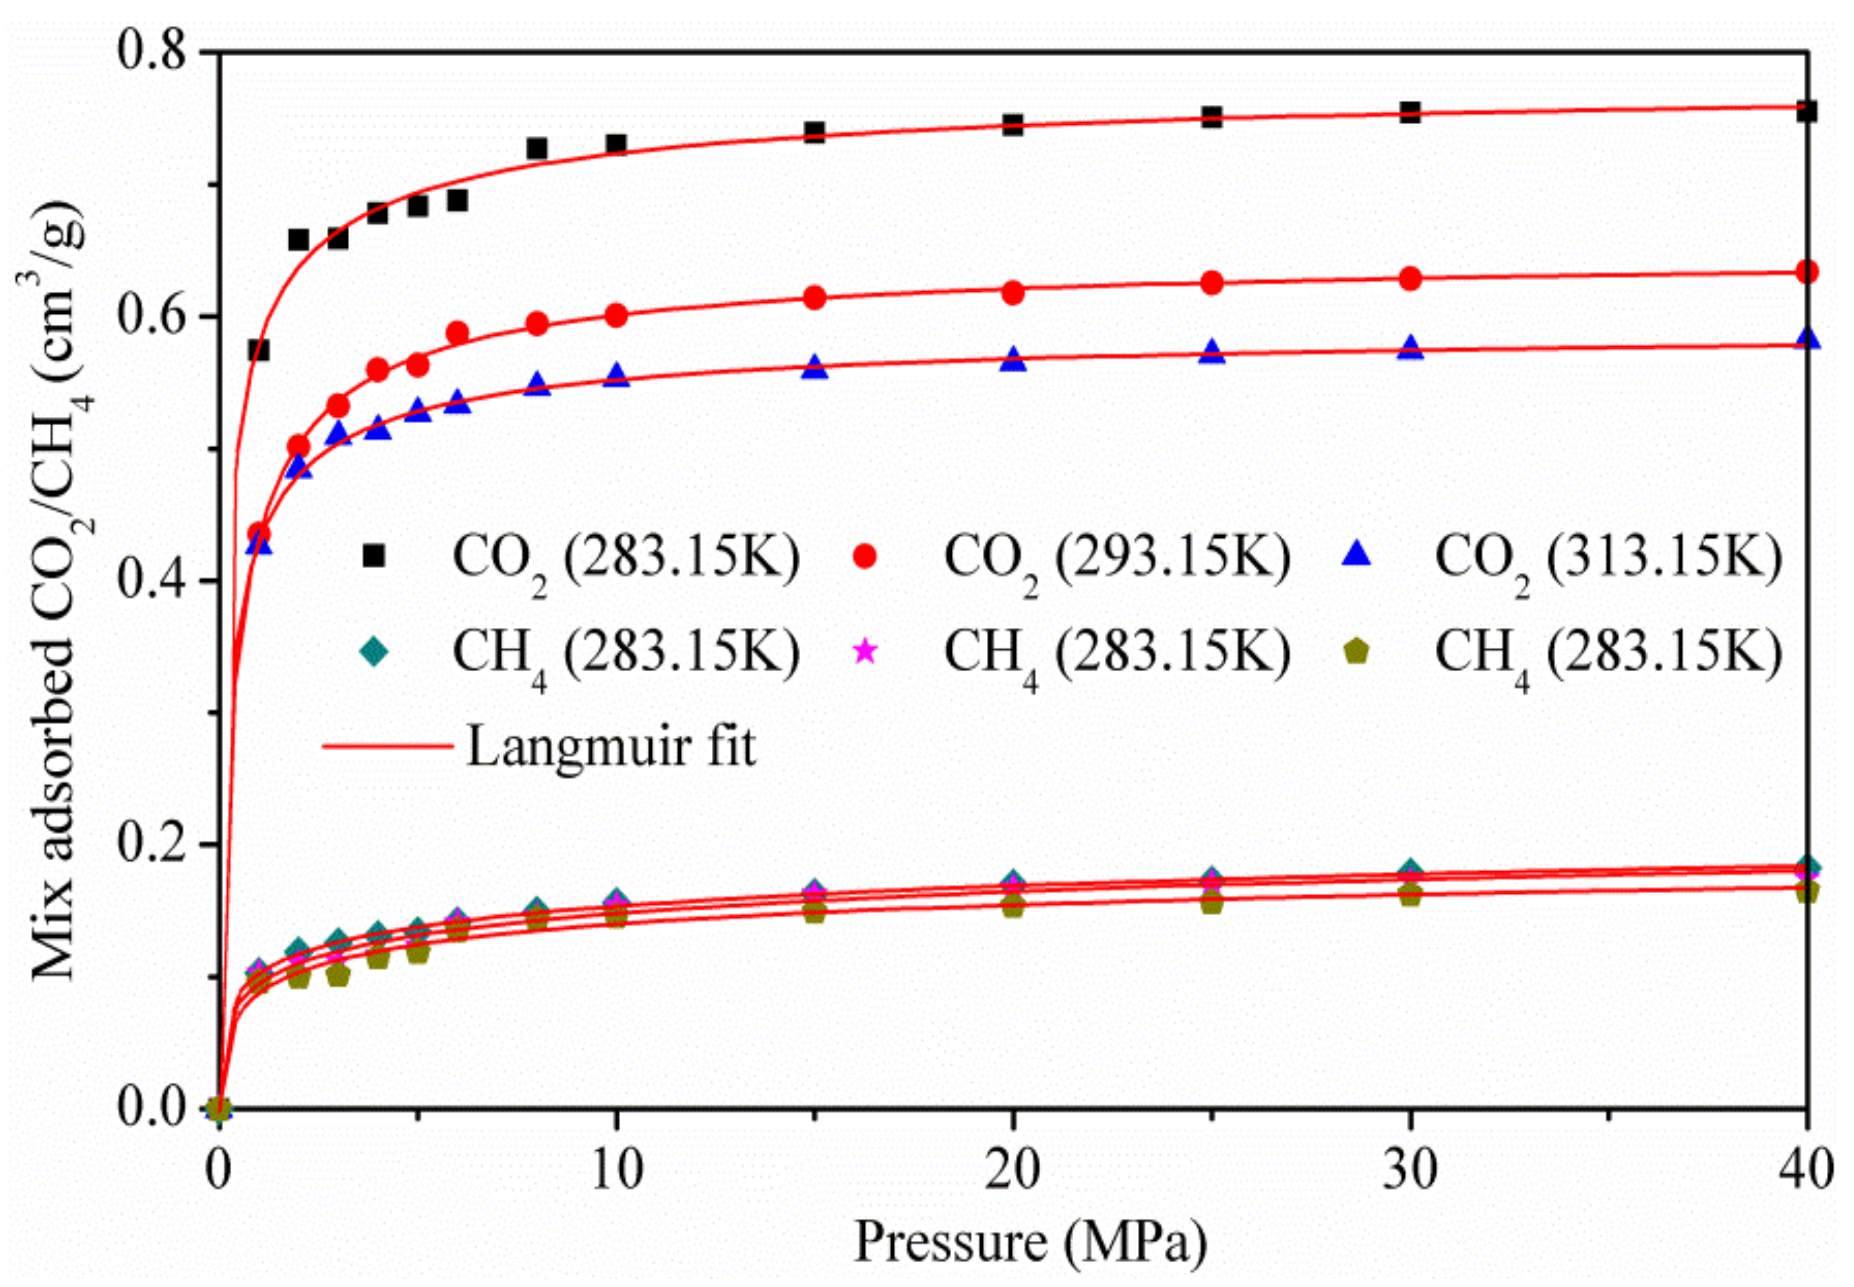
Figure 6 shows the adsorption isotherms of the CO2/CH4 binary mixture at the temperatures of 283.15, 293.15, and 313.15 k, for pressures up to 40 MPa. As the pressure increases, the capacity of CO2 adsorbed increases rapidly, while the amount of CH4 adsorbed is more stable. The results show that CO2 is more preferentially adsorbed on the surface of kaolinite than CH4, because of the stronger interaction between CO2 and kaolinite, which was in accordance with the adsorption amount of pure CO2 and CH4.
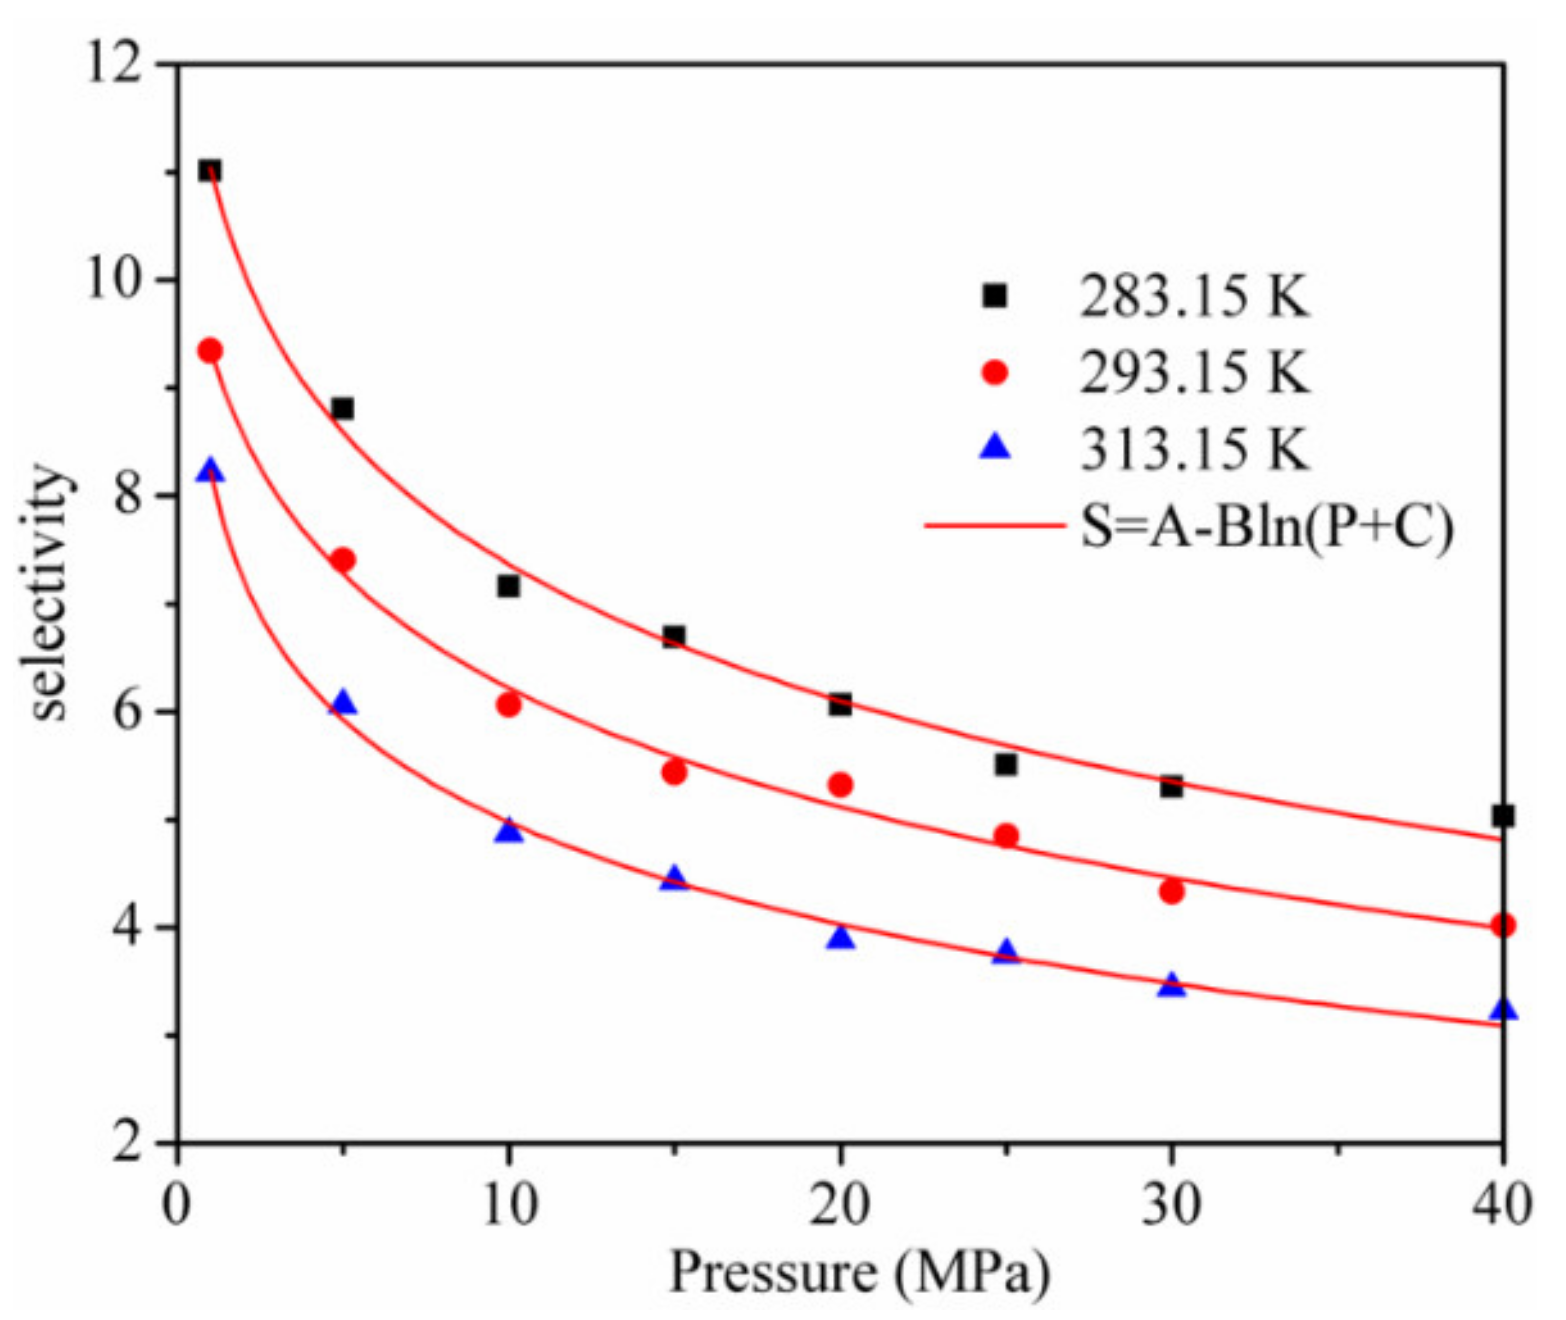
The adsorption and separation properties of kaolinite for CO2 and CH4 were further evaluated by utilizing the adsorption selectivity S C O 2 / C H 4 . The results are shown in Figure 7. It can be seen from the results that the selectivity is always larger than 3, which means that kaolinite has a high adsorption separation behavior for the CO2/CH4 mixture. When the pressure increases from 1 to 40 MPa, the S C O 2 / C H 4 decreases logarithmically and the S C O 2 / C H 4 is lower with a higher temperature at the same pressure. Hence, a CO2 injection in CH4-bearing reservoirs to displace CH4 and enhance the CS-EGR should be implemented at a low temperature.

3.4. Interaction Energies and Isosteric Heat Analysis during CH4/CO2 Adsorption

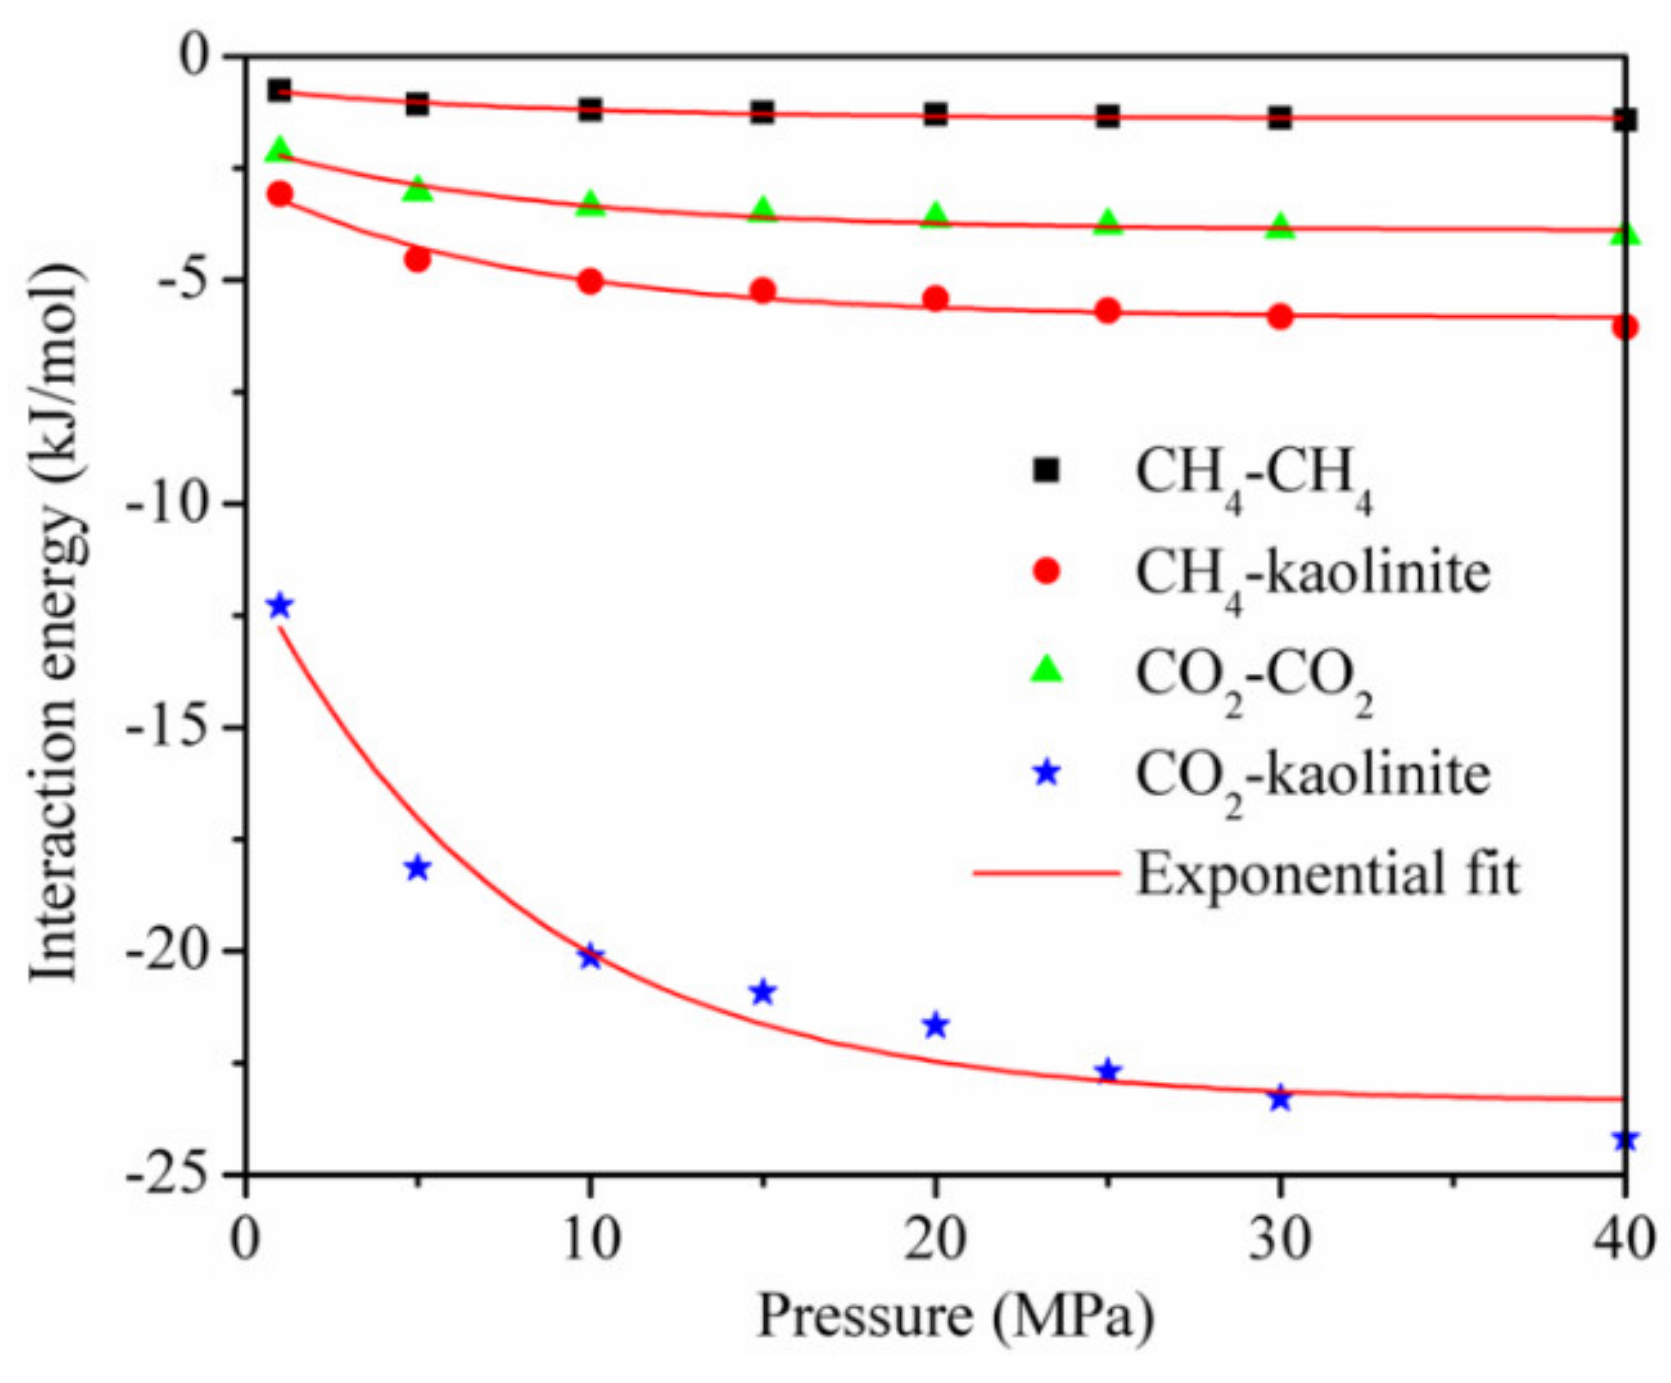
The interaction energy between the adsorbent and adsorbate and between the adsorbate and adsorbate [18,19] is shown in Figure 8 for the temperature of 293.15 K. Although each interaction energy decreased exponentially with the increase in pressure, the interaction energy between CO2 and kaolinite was much higher than that between CH4 and kaolinite at the same pressure.
This is the reason why the adsorption amount of CO2 is greater than that of CH4, and it is also the main reason why a CO2 injection can displace CH4 in CBM and shale reservoirs. In addition, the interaction energy between the adsorbent and adsorbate was dominant, and that between CO2 and CO2 and between CH4 and CH4 accounted for less than 20% of the total interaction energy, respectively, during the adsorption of the CO2/CH4 binary mixture.
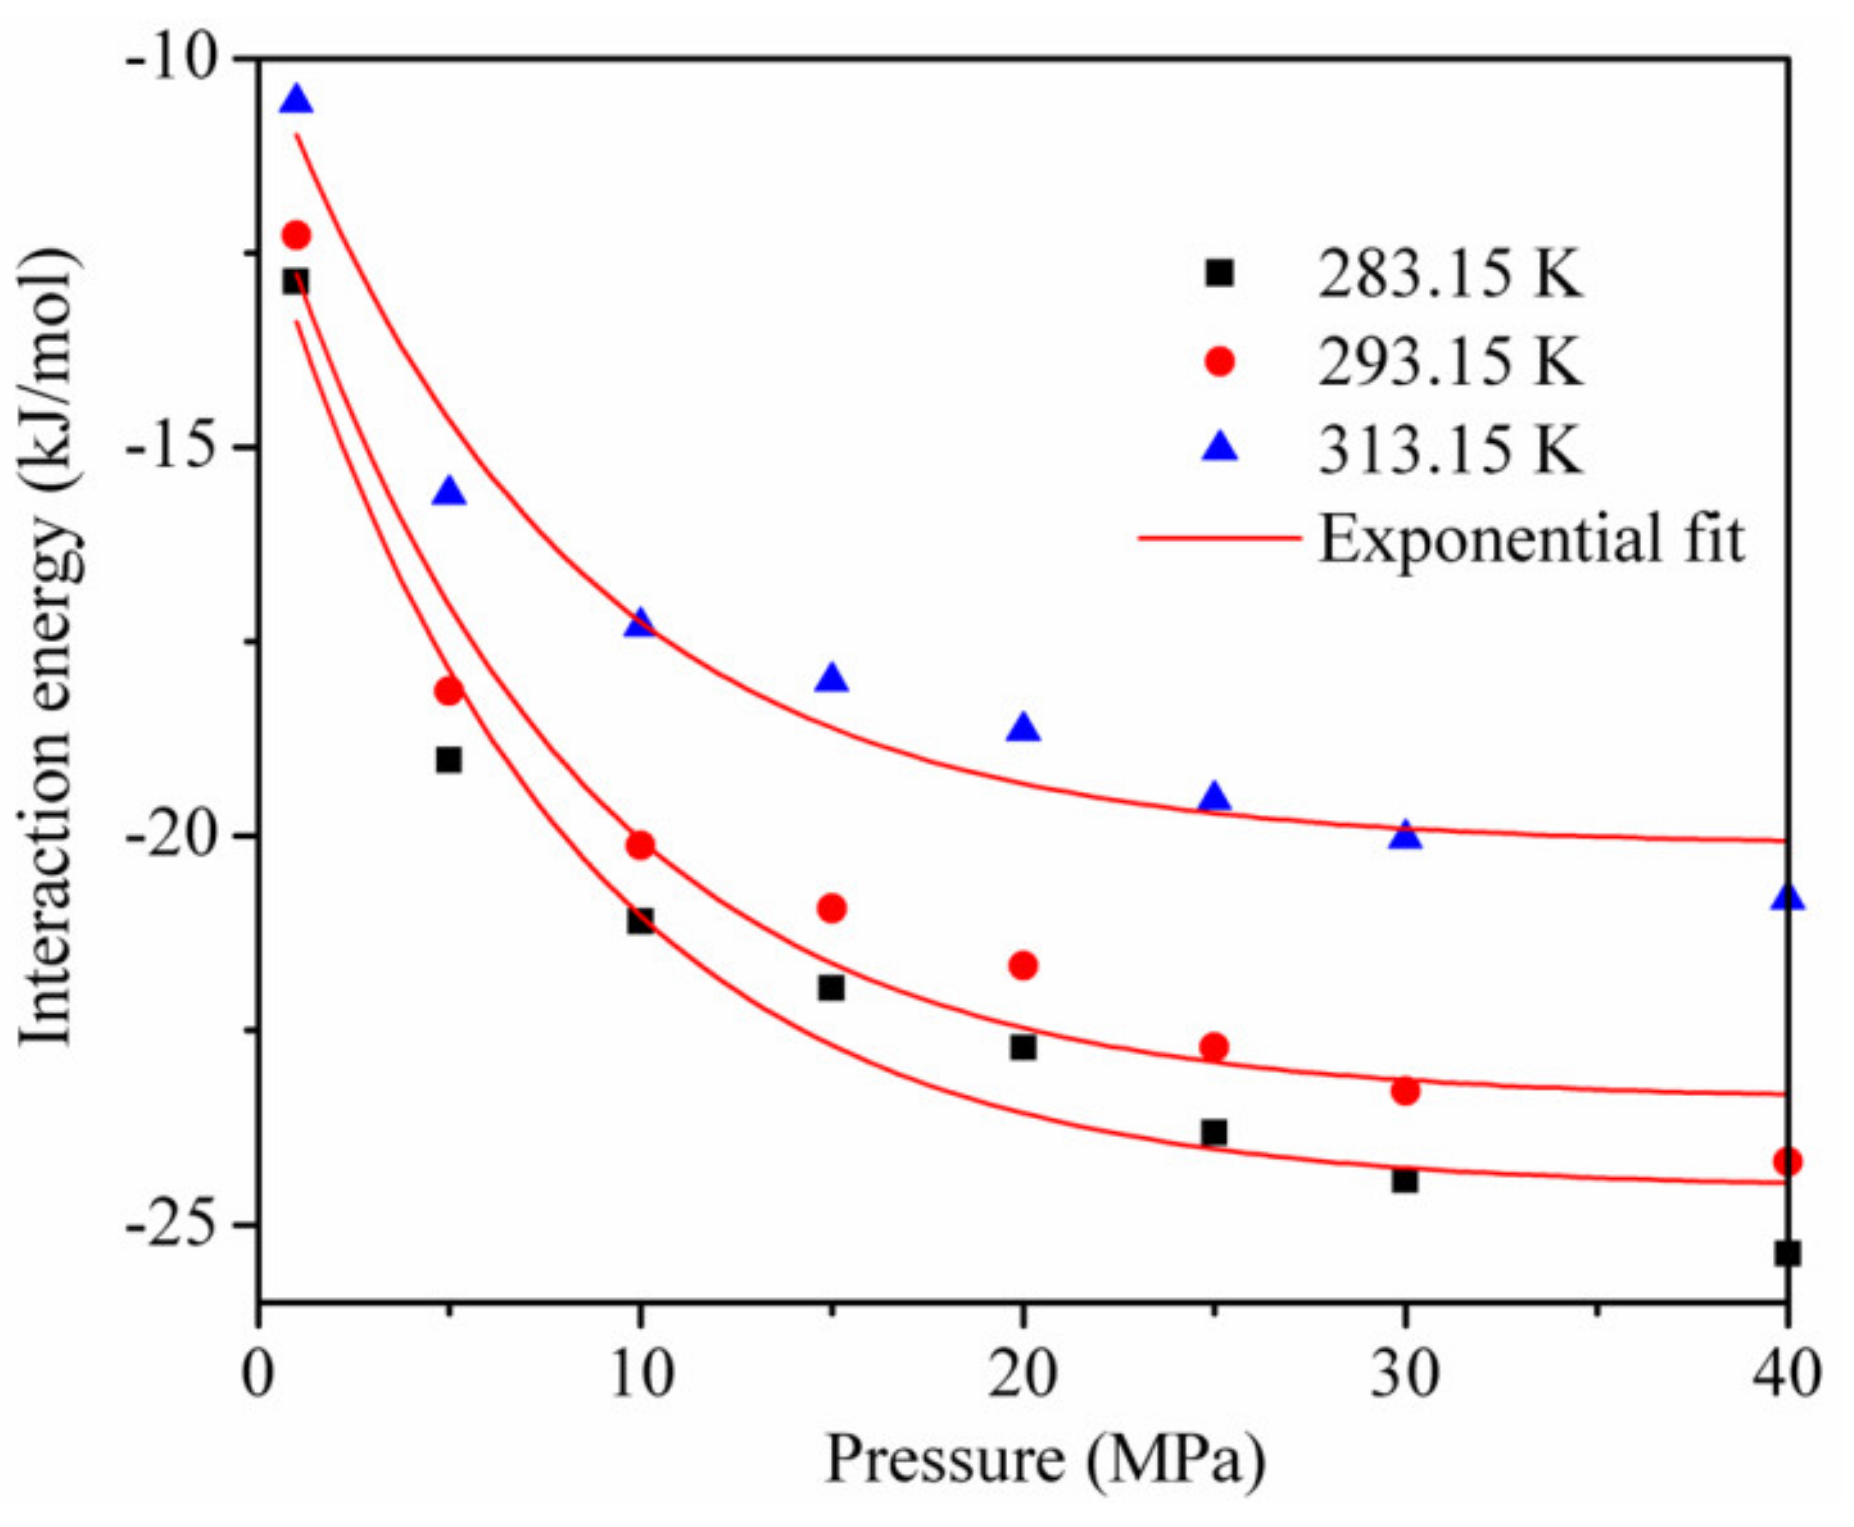
Figure 9 shows the interaction energy curve for CO2 and kaolinite at different temperatures. Clearly, the temperature had an important influence on the interaction energy. The interaction energy between CO2 and kaolinite decreased with the increase in temperature and became less negative, which led to a decrease in the CO2 adsorption amount, consistent with Figure 3.
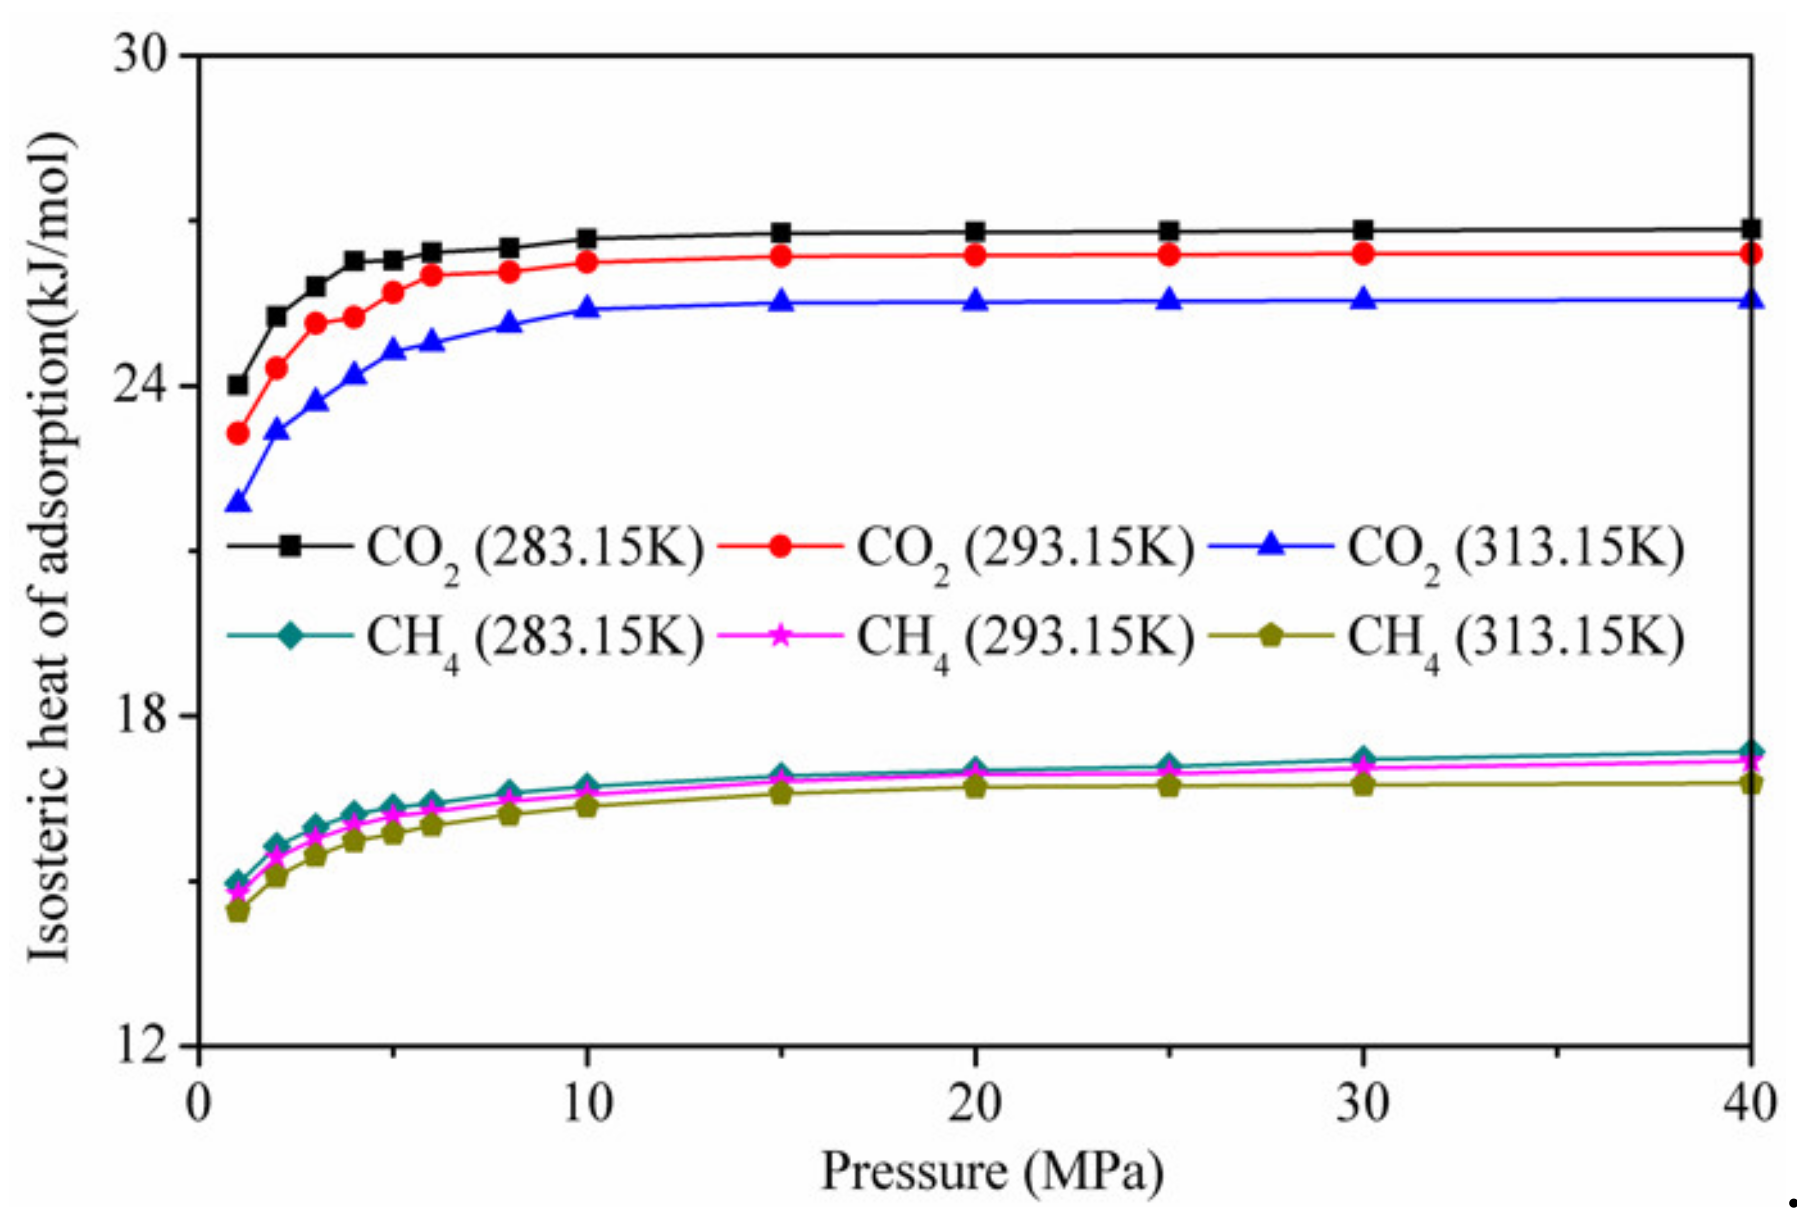
Figure 10 shows the calculation results of the isotherm adsorption heat of CO2 and CH4 on kaolinite at different temperatures. The isothermal adsorption heat of CO2 was higher than that of CH4, indicating that the affinity of kaolinite to CO2 was stronger than that of CH4. At low pressure, the isotherm adsorption heat of CO2 and CH4 on kaolinite increased with the increase in pressure. When the pressure was higher than 10 MP, it tended to be stable. With increasing temperature, the lower isotherm adsorption heat was not conducive to adsorption, in agreement with the results presented in Figure 4.

3.5. Radial Distribution Function

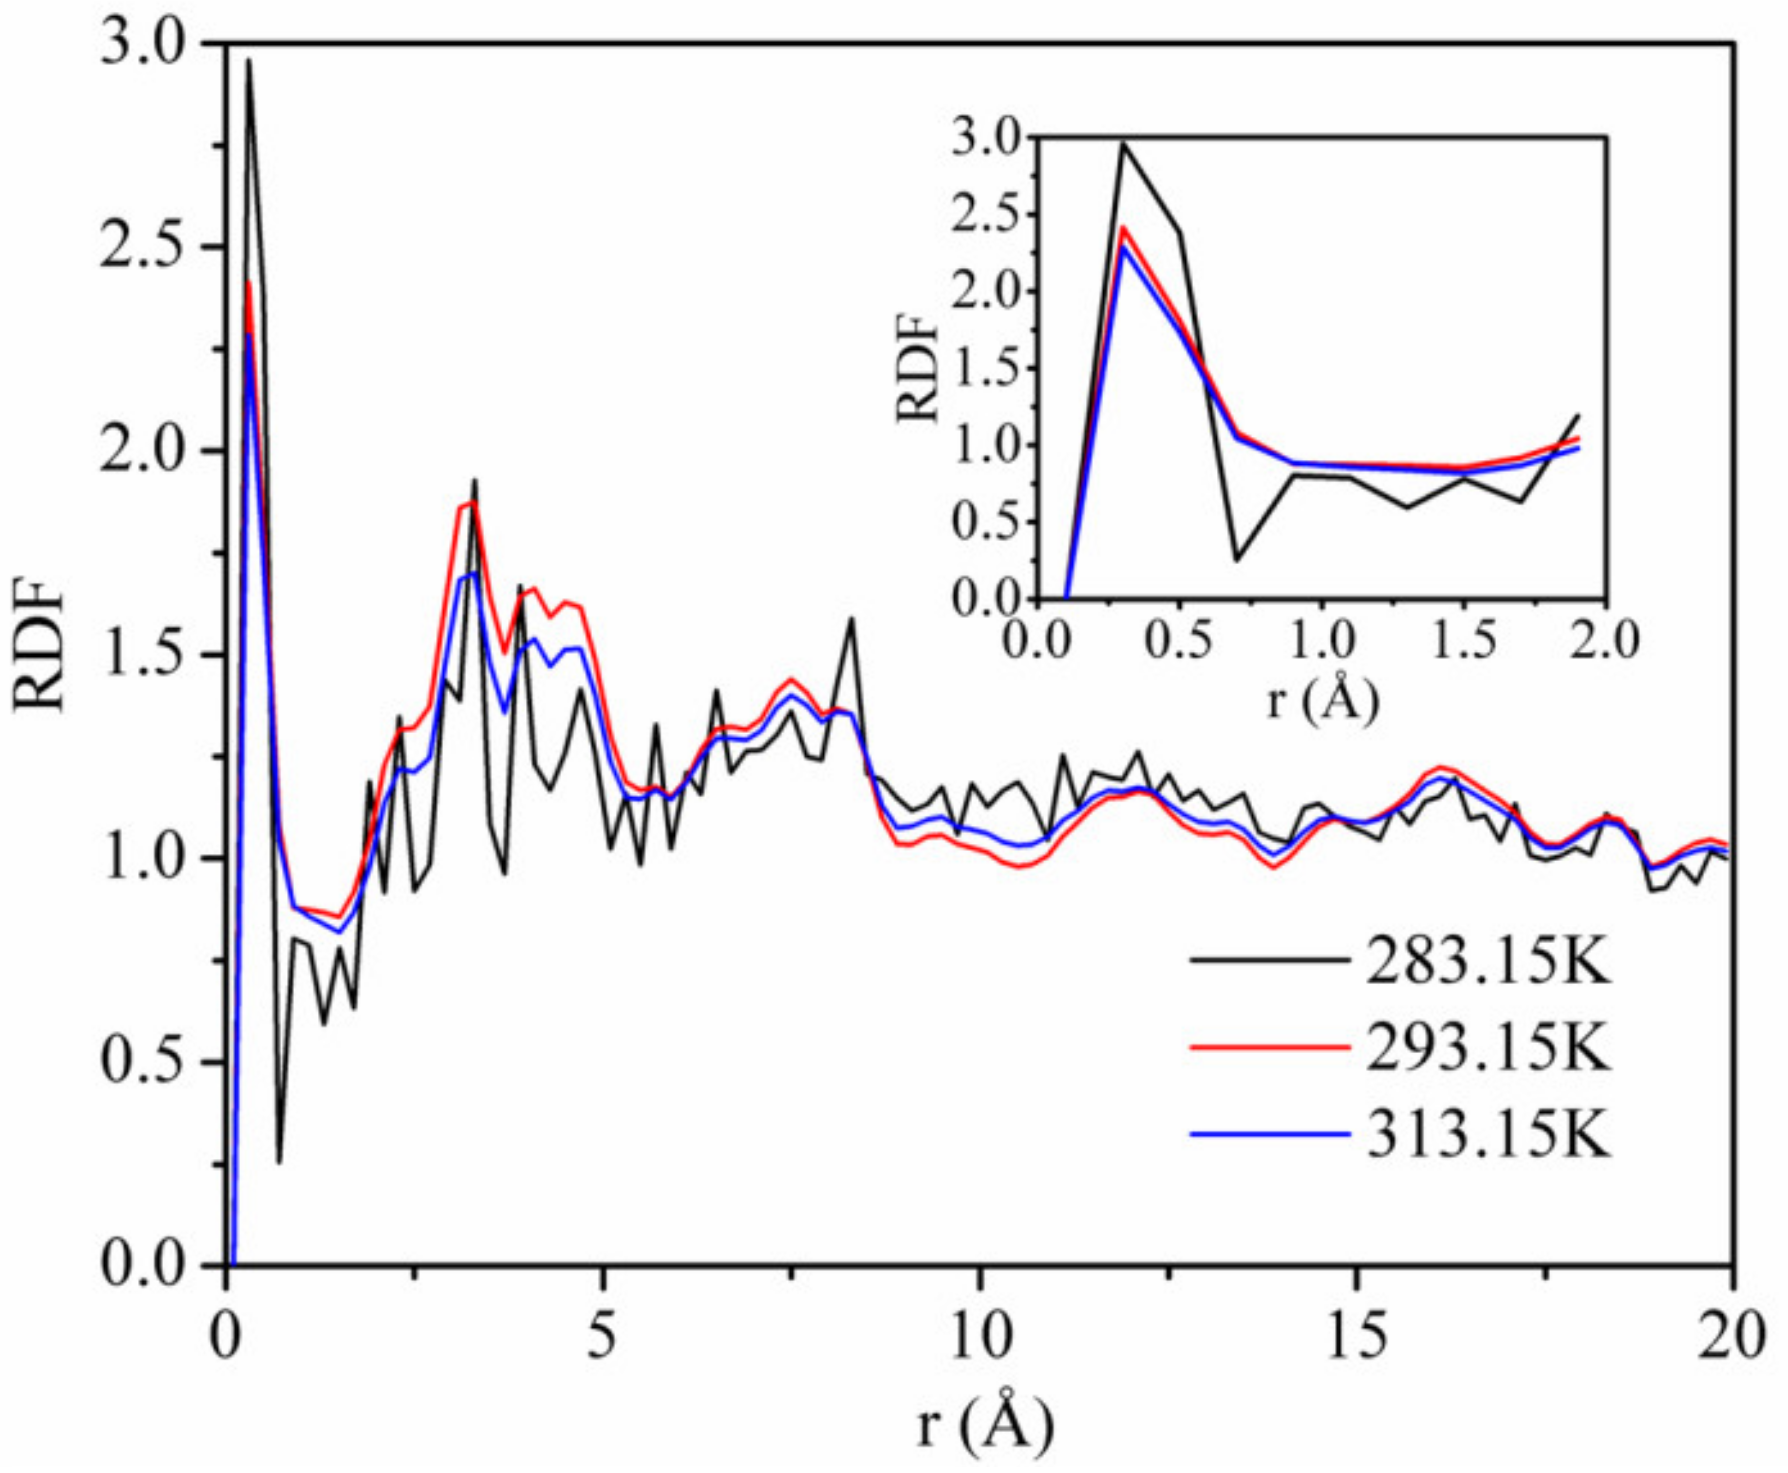
Figure 11 shows the RDFs of CO2 on kaolinite at a pressure of 5 MPa and the temperatures of 283.15, 293.15, and 313.15 K. The first and highest peak occurs at r = 0.33 Å, with values of about 1.92, 1.87, and 1.69 corresponding to the temperature of 283.15, 293.15, and 313.15 K. This means that the adsorption density of CO2 being found at r = 0.33 Å was 1.92, 1.87, and 1.69 times, respectively. The height of the first peak decreased with increasing temperature, indicating that the interaction between CO2 and kaolinite decreased with the increase in temperature. The results further confirm the influence of the temperature on the adsorption capacity of CO2 and the interaction energy between CO2 and kaolinite.
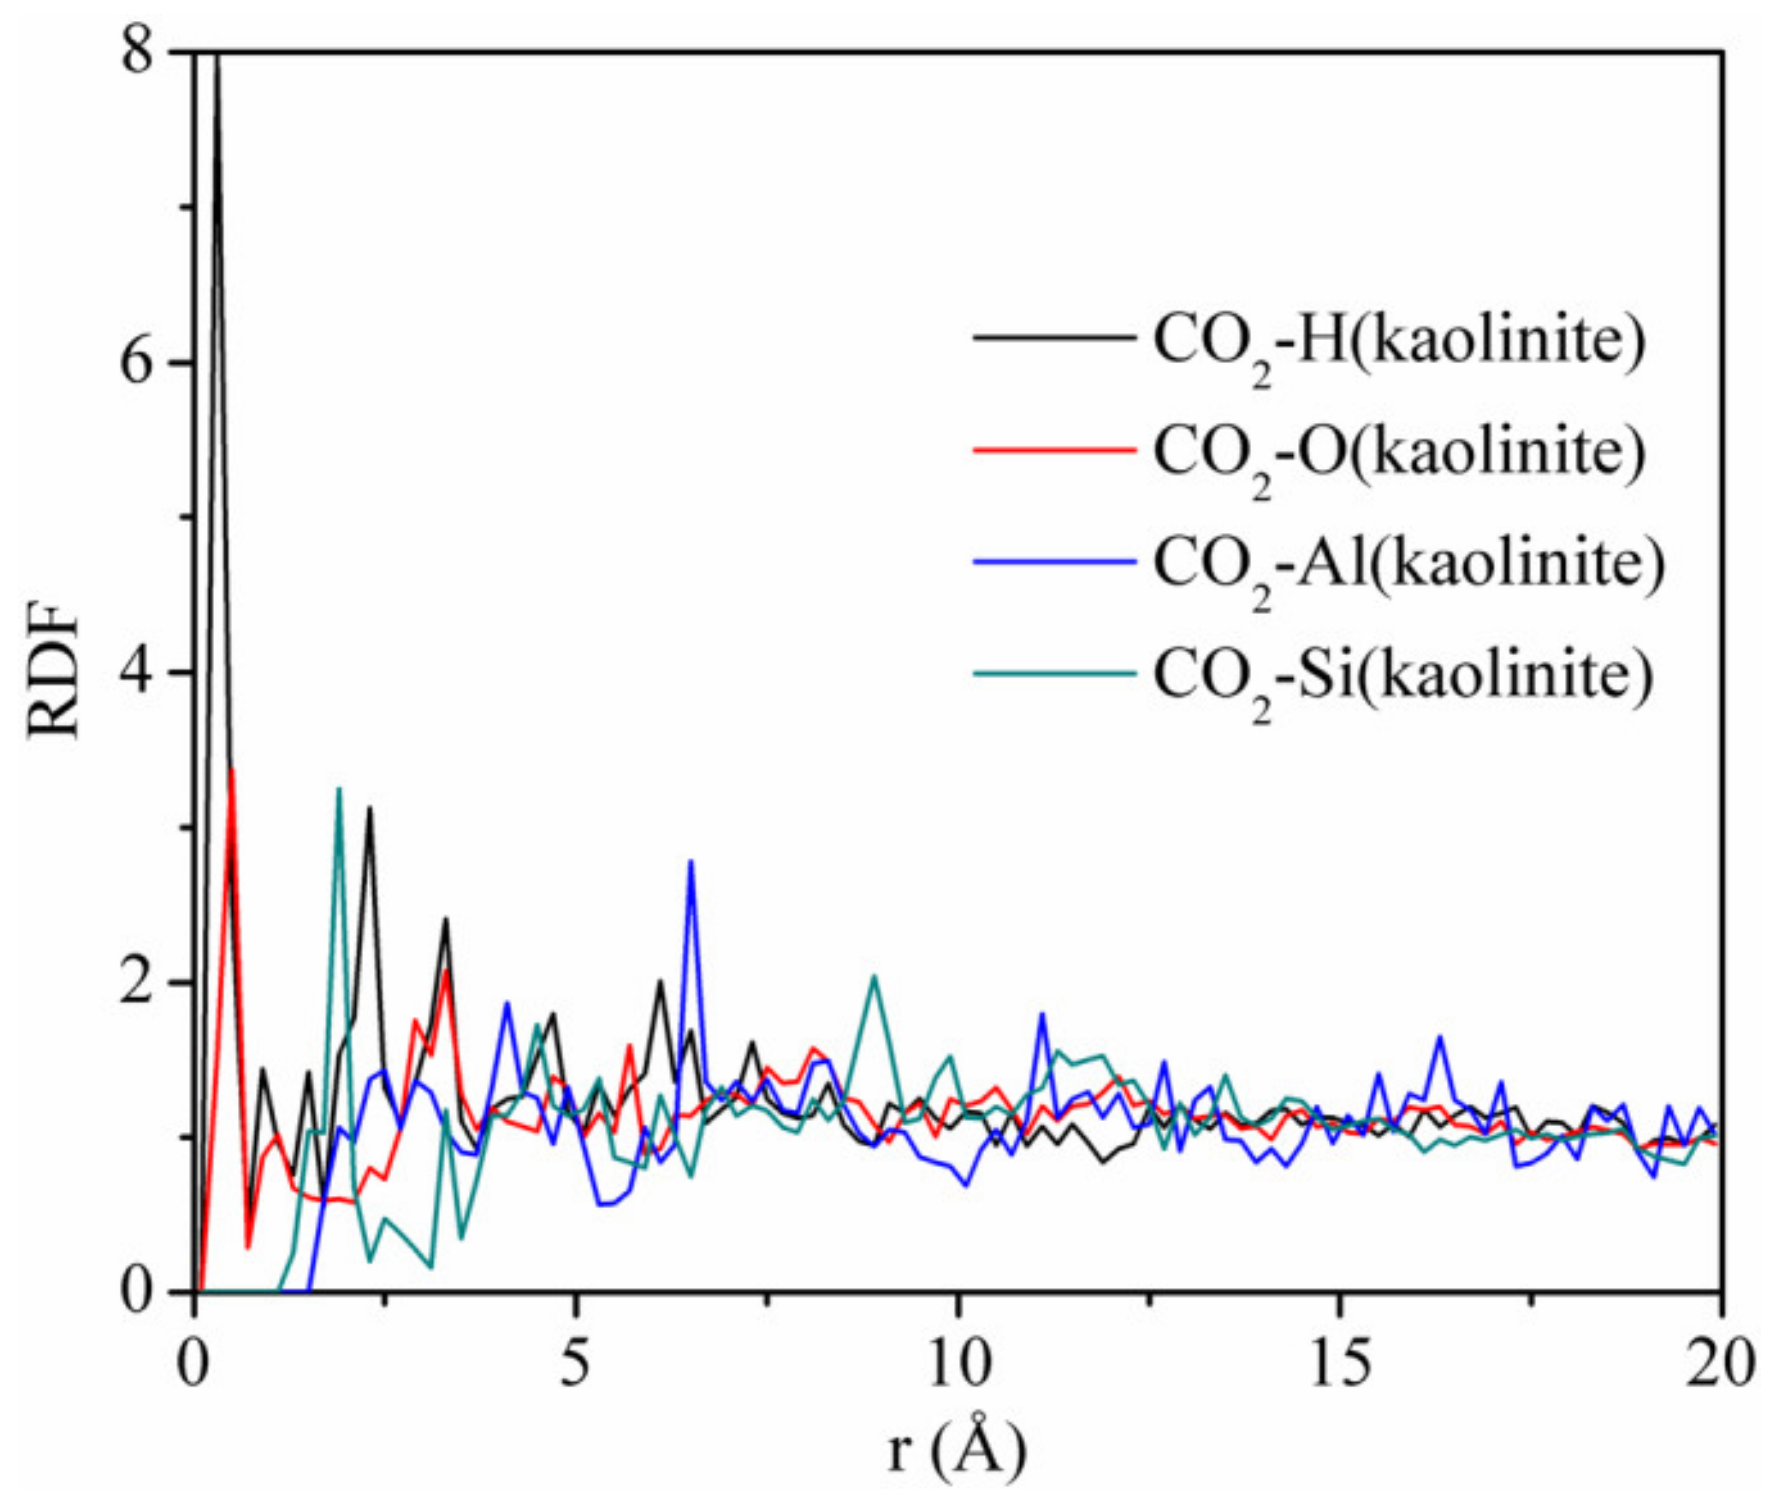
Figure 12 displays the RDFs between CO2 and different atoms of kaolinite at the pressure of 5 MPa and the temperature of 293.15 K. The first peaks of the RDFs between CO2 and H and CO2 and O appeared near r = 0.3 Å, which were sharp and intense, with peak values of 8.0 and 3.37, respectively. The first peak of the RDFs between CO2 and Si appeared near r = 2.0 Å, with a peak value of 3.25. In contrast, the close contact peak of CO2-Al was low, which indicated that the interaction between CO2 and Al was weak. We conclude that the strong adsorption sites of carbon dioxide on kaolinite are hydrogen, oxygen, and silicon atoms, respectively. It is worth noting that the non-bonding forces were mainly composed of hydrogen bonding forces and van der Waals forces, whose interaction ranges are 0.26–0.31 nm versus 0.31–0.50 nm. Hence, CO2 can form hydrogen bonds with hydrogen atoms in kaolinite. This means that CO2 is not only physically adsorbed on kaolinite, but also displays chemical adsorption, which was different from the adsorption of CH4 on kaolinite, which only demonstrated physical adsorption. In addition, the strength of the hydrogen bonding force is much greater than that of the van der Waals force. Therefore, the amount of CO2 adsorbed is much higher than that of CH4, which is consistent with the result of Figure 2.

4. Conclusions

Single component adsorption and CO2/CH4 mixtures on kaolinite associated with the CS-EGR process were simulated by GCMC up to 40 MPa with different temperatures (283.15, 293.15, and 313.15 K). The main findings are as follows:
(1)
The adsorption capacity of CO2 increased with an increase in the adsorption equilibrium pressure, and increased rapidly at low pressure. The adsorption amount of CO2 decreased as the temperature increased. Excessive adsorption at different temperatures increases to a maximum (about 3 MPa) as the pressure increases, and then decreases at a higher pressure;
(2)
The S C O 2 / C H 4 decreased logarithmically with increasing pressure, and the S C O 2 / C H 4 was lower with a higher temperature at the same pressure;
(3)
The interaction energy between the adsorbent and adsorbate was dominant, and that between CO2 and CO2 and between CH4 and CH4 accounted for less than 20% of the total interaction energy, respectively, during the adsorption of the CO2/CH4 binary mixture. The isothermal adsorption heat of CO2 was higher than that of CH4, indicating that the affinity of kaolinite to CO2 was higher than that of CH4;
(4)
The strong adsorption sites of CO2 on kaolinite are hydrogen, oxygen, and silicon atoms, respectively. CO2 is not only physically adsorbed on kaolinite, but also displays chemical adsorption;
(5)
By considering the results of adsorption, the capture and sequestration of CO2 and enhanced CS-EGR should be carried out at low temperatures.

Author Contributions

Project administration, B.Z.; software, T.K.; writing—original draft preparation, G.K.; B.Z.; J.G.; G.Z.; writing—review and editing, B.Z.; funding acquisition, T.K. and B.Z. All authors have read and agreed to the published version of the manuscript.

Funding

This research was financially supported by the National Natural Science Foundation of China (U1810102) and Applied Basic Research Program of Shanxi Province (201901D211033).

Acknowledgments

The use of the Materials Studio software package, which was supported by the Key Laboratory of Coal Science and Technology of the Ministry of Education and Taiyuan University of Technology, is gratefully acknowledged.

Conflicts of Interest

The authors declare no conflict of interest.

References

  1. Keith, D.W. Why capture CO2 from the atmosphere? Science 2009, 325, 1654. [Google Scholar] [CrossRef]
  2. Lashof, D.A.; Ahuja, D.R. Relative contributions of greenhouse gas emissions to global warming. Nature 1990, 344, 529–531. [Google Scholar] [CrossRef]
  3. Uibu, M.; Velts, O.; Kuusik, R. Developments in CO2 mineral carbonation of oil shale ash. J. Hazard. Mater. 2010, 174, 209. [Google Scholar] [CrossRef] [PubMed]
  4. Aziz, B.K.; Shareef, F.H. Using natural clays and spent bleaching clay as cheap adsorbent for the removal of phenol in aqueous media. Int. J. Basic Appl. Sci. 2013, 13, 88–93. [Google Scholar]
  5. Holmboe, M.; Bourg, I.C. Molecular Dynamics Simulations of Water and Sodium Diffusion in Smectite Interlayer Nanopores as a Function of Pore Size and Temperature. Chem. Soc. Rev. 2017, 42, 3628–3646. [Google Scholar] [CrossRef]
  6. Liu, D.; Yuan, P.; Liu, H.; Li, T.; Tan, D.; Yuan, W.; He, H. High-pressure adsorption of methane on montmorillonite, kaolinite and illite. Appl. Clay Sci. 2013, 85, 25–30. [Google Scholar] [CrossRef]
  7. Ross, D.J.K.; Bustin, R.M. The importance of shale composition and pore structure upon gas storage potential of shale gas reservoirs. Mar. Pet. Geol. 2009, 26, 916–927. [Google Scholar] [CrossRef]
  8. Zhang, J.; Liu, K.; Clennell, M.B.; Dewhurst, D.N.; Pervukhina, M. Molecular simulation of CO2–CH4 competitive adsorption and induced coal swelling. Fuel 2015, 160, 309–317. [Google Scholar] [CrossRef]
  9. Huang, L.; Ning, Z.; Wang, Q.; Zhang, W.; Cheng, Z.; Wu, X.; Qin, H. Effect of organic type and moisture on CO 2/CH 4 competitive adsorption in kerogen with implications for CO 2 sequestration and enhanced CH 4 recovery. Appl. Energy 2018, 210, 28–43. [Google Scholar] [CrossRef]
  10. Zhang, S.; Tang, S.; Zheng, Q.; Pan, Z.; Guo, Q. Evaluation of geological features for deep coalbed methane reservoirs in the Dacheng Salient, Jizhong Depression, China. Int. J. Coal Geol. 2014, 133, 60–71. [Google Scholar] [CrossRef]
  11. Rother, G.; Ilton, E.S.; Wallacher, D.; Hauss, T.; Schaef, H.T.; Qafoku, O.; Rosso, K.M.; Felmy, A.R.; Krukowski, E.G.; Stack, A.G.; et al. CO2 Adsorption to Sub-Single Hydration Layer Montmorillonite Clay Studied by Excess Sorption and Neutron Diffraction. Environ. Sci. Technol. 2013, 47, 205–211. [Google Scholar] [CrossRef]
  12. Alhwaige, A.A.; Ishida, H.; Qutubuddin, S. Carbon Aerogels with Excellent CO2 Adsorption Capacity Synthesized from Clay-Reinforced Biobased Chitosan-Polybenzoxazine Nanocomposites. ACS Sustain. Chem. Eng. 2016, 4. [Google Scholar] [CrossRef]
  13. Yang, N.; Liu, S.; Yang, X. Molecular simulation of preferential adsorption of CO2 over CH4 in Na-montmorillonite clay material. Appl. Surf. Sci. 2015, 356, 1262–1271. [Google Scholar] [CrossRef]
  14. Jin, Z.; Firoozabadi, A. Methane and carbon dioxide adsorption in clay-like slit pores by Monte Carlo simulations. Fluid Phase Equilibria 2013, 360, 456–465. [Google Scholar] [CrossRef]
  15. Benazzouz, B.K.; Zaoui, A.; Belonoshko, A.B. Determination of the melting temperature of kaolinite by means of the Z-method. Am. Mineral. 2013, 98, 1881–1885. [Google Scholar] [CrossRef]
  16. Zhang, B.; Kai, W.; Kang, T.; Kang, G.; Zhao, G. Effect of the basal spacing on CH4 diffusion in kaolinite. Chem. Phys. Lett. 2019, 732, 136639. [Google Scholar] [CrossRef]
  17. Bish, D.L. Rietveld Refinement of Non-Hydrogen Atomic Positions in Kaolinite. Clays Clay Miner. 1989, 37, 289–296. [Google Scholar] [CrossRef]
  18. Zhang, B.; Kang, J.; Kang, T. Monte Carlo simulations of methane adsorption on kaolinite as a function of pore size. J. Nat. Gas Sci. Eng. 2018, 49, 410–416. [Google Scholar] [CrossRef]
  19. Zhang, B.; Kang, J.; Kang, T. Effect of water on methane adsorption on the kaolinite (001) surface based on molecular simulations. Appl. Surf. Sci. 2018, 439. [Google Scholar] [CrossRef]
  20. Biase, E.D.; Sarkisov, L. Systematic development of predictive molecular models of high surface area activated carbons for adsorption applications. Carbon 2013, 64, 262–280. [Google Scholar] [CrossRef]
  21. Bagherzadeh, S.A.; Alavi, S.; Ripmeester, J.A.; Englezos, P. Evolution of methane during gas hydrate dissociation. Fluid Phase Equilibria 2013, 358, 114–120. [Google Scholar] [CrossRef]
  22. Harris, J.G.; Yung, K.H. Carbon Dioxide’s Liquid-Vapor Coexistence Curve and Critical Properties as Predicted by a Simple Molecular Model. J. Phys. Chem. 1995, 99, 12021–12024. [Google Scholar] [CrossRef]
  23. Sharma, A.; Namsani, S.; Singh, J.K. Molecular simulation of shale gas adsorption and diffusion in inorganic nanopores. Mol. Simul. 2015, 41, 414–422. [Google Scholar] [CrossRef]
  24. Mayo, S.L.; Olafson, B.D.; Goddard, W.A. DREIDING: A generic force field for molecular simulations. J. Phys. Chem. 1990, 94, 8897–8909. [Google Scholar] [CrossRef]
  25. Zhang, J.; Burke, N.; Zhang, S.; Liu, K.; Pervukhina, M. Thermodynamic analysis of molecular simulations of CO 2 and CH 4 adsorption in FAU zeolites. Chem. Eng. Sci. 2014, 113, 54–61. [Google Scholar] [CrossRef]
  26. Rutkai, G.; Kristóf, T. Molecular simulation study of intercalation of small molecules in kaolinite. Chem. Phys. Lett. 2008, 462, 269–274. [Google Scholar] [CrossRef]
  27. Yeh, I.C.; Berkowitz, M.L. Ewald summation for systems with slab geometry. J. Chem. Phys. 1999, 111, 3155–3162. [Google Scholar] [CrossRef]
  28. Crozier, P.S.; Rowley, R.L.; Spohr, E.; Henderson, D. Comparison of charged sheets and corrected 3D Ewald calculations of long-range forces in slab geometry electrolyte systems with solvent molecules. J. Chem. Phys. 2000, 112, 9253–9257. [Google Scholar] [CrossRef] [Green Version]
  29. Fisk, S.; Widom, B. Structure and Free Energy of the Interface between Fluid Phases in Equilibrium near the Critical Point. J. Chem. Phys. 1969, 50, 3219–3227. [Google Scholar] [CrossRef]
  30. Metropolis, N.; Rosenbluth, A.W.; Rosenbluth, M.N.; Teller, A.H.; Teller, E. Equation of State Calculations by Fast Computing Machines. J. Chem. Phys. 2004, 21, 1087–1092. [Google Scholar] [CrossRef] [Green Version]
  31. Hirotani, A.; Mizukami, K.; Miura, R.; Takaba, H.; Miya, T.; Fahmi, A.; Stirling, A.; Kubo, M.; Miyamoto, A. Grand canonical Monte Carlo simulation of the adsorption of CO 2 on silicalite and NaZSM-5. Appl. Surf. Sci. 1997, 120, 81–84. [Google Scholar] [CrossRef]
  32. Accelrys, I. Materials Studio; Accelrys Software Inc: San Diego, CA, USA, 2010. [Google Scholar]
  33. Liu, X.Q.; He, X.; Qiu, N.X.; Yang, X.; Tian, Z.Y.; Li, M.J.; Xue, Y. Molecular simulation of CH4, CO2, H2O and N2 molecules adsorption on heterogeneous surface models of coal. Appl. Surf. Sci. 2016, 389, 894–905. [Google Scholar] [CrossRef]
  34. Fan, W.; Chakraborty, A. Investigation of the interaction of polar molecules on graphite surface: Prediction of isosteric heat of adsorption at zero surface coverage. J. Phys. Chem. C 2016, 120, 23490–23499. [Google Scholar] [CrossRef]
  35. Zhang, T.; Ellis, G.S.; Ruppel, S.C.; Milliken, K.; Yang, R. Effect of organic-matter type and thermal maturity on methane adsorption in shale-gas systems. Org. Geochem. 2012, 47, 120–131. [Google Scholar] [CrossRef]
  36. Pan, H.; And, J.A.R.; Balbuena, P.B. Examination of the Approximations Used in Determining the Isosteric Heat of Adsorption from the Clausius−Clapeyron Equation. Langmuir 2015, 14, 535–542. [Google Scholar] [CrossRef]
  37. Kong, X.P.; Wang, J. Copper(II) adsorption on the kaolinite(001) surface: Insights from first-principles calculations and molecular dynamics simulations. Appl. Surf. Sci. 2016, 389, 316–323. [Google Scholar] [CrossRef]
  38. Chen, Y.H.; Lu, D.L. CO_2 capture by kaolinite and its adsorption mechanism. Appl. Clay Sci. 2015, 104, 221–228. [Google Scholar] [CrossRef]
  39. Wang, T.; Tian, S.; Li, G.; Sheng, M. Selective adsorption of supercritical carbon dioxide and methane binary mixture in shale kerogen nanopores. J. Nat. Gas Sci. Eng. 2018, 50, 181–188. [Google Scholar] [CrossRef]
  40. Xiong, J.; Liu, X.; Liang, L.; Zeng, Q. Adsorption Behavior of Methane on Kaolinite. Ind. Eng. Chem. Res. 2017, 56, 6229–6238. [Google Scholar] [CrossRef]
  41. Zhang, B.; Kang, J.; Kang, T. Molecular simulation of methane adsorption and its effect on kaolinite swelling as functions of pressure and temperature. Mol. Simul. 2018, 44, 789–796. [Google Scholar] [CrossRef]
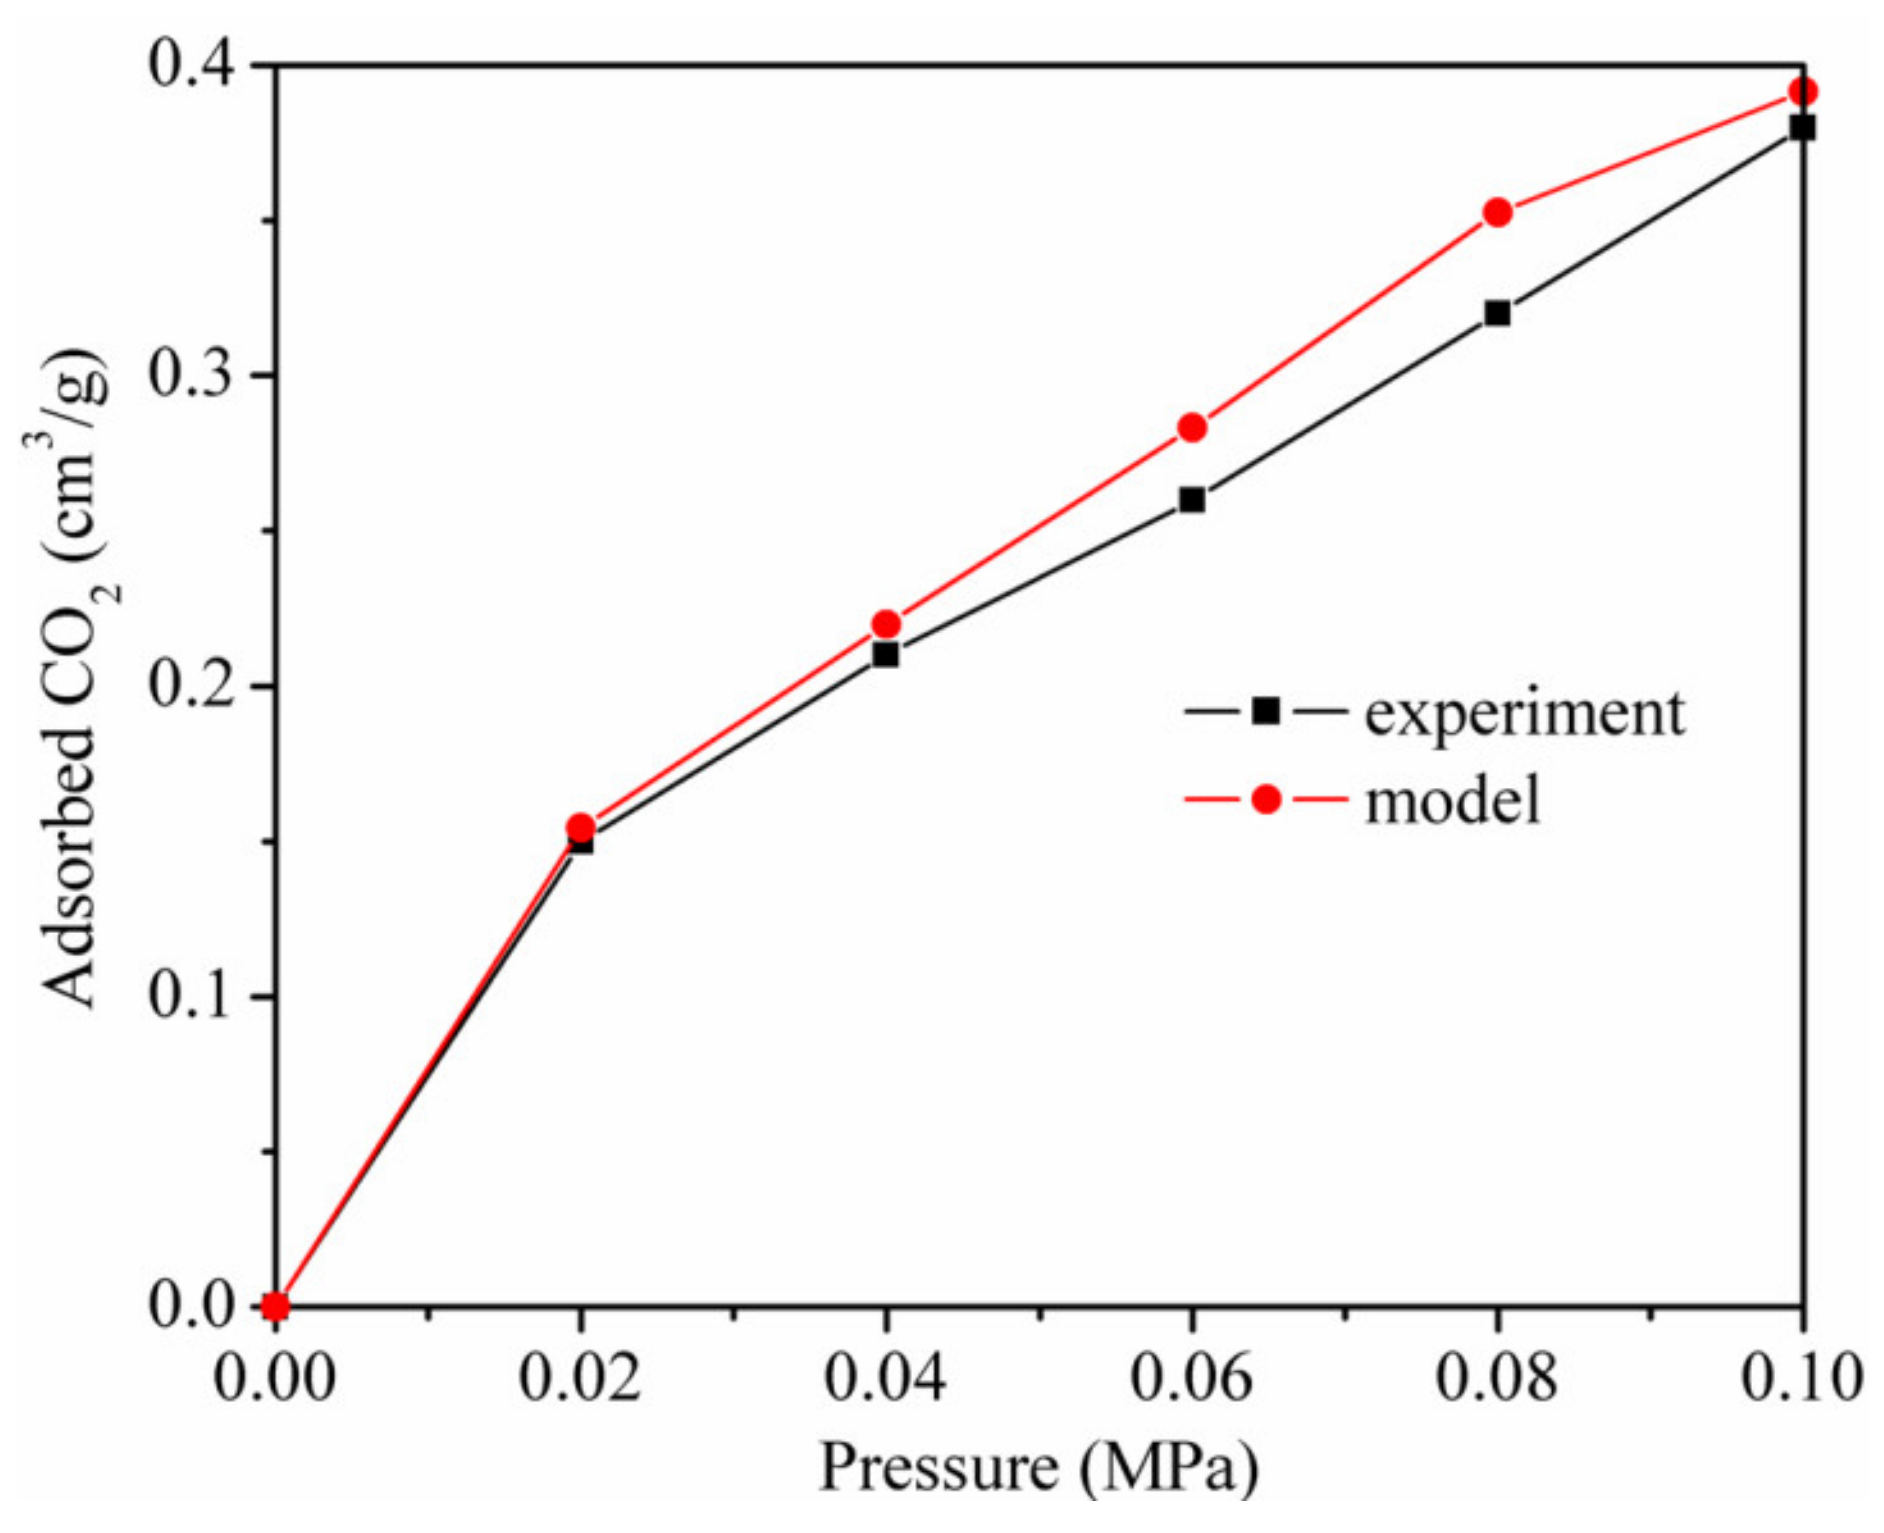
Figure 1. Adsorption isotherms of CO2 in terms of the simulation results and the experimental results at 298.15 K.
Materials 13 02851 g001
Figure 2. The adsorption isotherms of CO2 at different temperatures.
Materials 13 02851 g002
Figure 3. CO2 maximum absolute amount adsorbed at different temperatures.
Materials 13 02851 g003
Figure 4. Excess adsorption of CO2 on kaolinite at temperatures of 283.15, 293.15, and 313.15 K.
Materials 13 02851 g004
Figure 5. Temperature dependence of CO2 maximum excess adsorption.
Materials 13 02851 g005
Figure 6. Isotherms of the CO2/CH4 mixture on kaolinite.
Materials 13 02851 g006
Figure 7. Selectivity of CO2/CH4 in kaolinite.
Materials 13 02851 g007
Figure 8. The interaction energy between the adsorbent and adsorbate and between the adsorbate and adsorbate at the temperature of 293.15 K.
Materials 13 02851 g008
Figure 9. The interaction energy between kaolinite and CO2 at different temperatures.
Materials 13 02851 g009
Figure 10. Isotherm adsorption heat of CO2 and CH4 on kaolinite at different temperatures.
Materials 13 02851 g010
Figure 11. Radial distribution functions (RDFs) of CO2 on kaolinite at a pressure of 5 MPa and the different temperatures.
Materials 13 02851 g011
Figure 12. RDFs between CO2 and different atoms of kaolinite at the pressure of 5 MPa and the temperature of 293.15 K.
Materials 13 02851 g012
Table 1. Lennard–Jones parameters and atomic charge.
MoleculeElementσ/nm ε / k B / K q / e
CO2C2.757 +0.6512
O3.033 −0.3256
CH4C3.1840.06069−0.1360
H2.9630.06618+0.0340
kaoliniteSi0.4000.20934+1.1
Al0.4200.20934+1.45
O(surface)0.3500.10467−0.55
O(apical)0.3500.10467−0.75833
O(hydroxyl)0.3500.10467−0.68333
H0.10980.0544284+0.2
Table 2. Langmuir constants of adsorption of CO2 at temperatures of 283.15, 293.15, and 313.15 K.
Temperature N L   ( cm 3 / g ) P L   ( Mpa 1 ) Correlation Coefficient R2
283.15 K0.9020.4270.994
293.15 K0.8760.4780.997
313.15 K0.8180.9630.996