Article

Evolution of Oxygen–Ion and Proton Conductivity in Ca-Doped Ln2Zr2O7 (Ln = Sm, Gd), Located Near Pyrochlore–Fluorite Phase Boundary

1
N.N. Semenov Federal Research Center for Chemical Physics, Russian Academy of Sciences, ul. Kosygina 4, Moscow 119991, Russia
2
proMetheus, ESTG, Instituto Politécnico de Viana do Castelo, 4900-348 Viana do Castelo, Portugal
3
Institute of Problems of Chemical Physics RAS, Moscow region, Chernogolovka 142432, Russia
4
University of Nottingham Ningbo China, Ningbo 315100, China
5
Institute of Solid State Chemistry, the Ural Branch of the Russian Academy of Sciences, Pervomayskaya Str. 91, Ekaterinburg 620990, Russia
6
Moscow State University, Leninskie gory 1, Moscow 119991, Russia
7
Emanuel Institute of Biochemical Physics, Russian Academy of Sciences, ul. Kosygina 4, Moscow 119991, Russia
*
Author to whom correspondence should be addressed.
Materials 2019, 12(15), 2452; https://doi.org/10.3390/ma12152452
Submission received: 25 June 2019 / Revised: 16 July 2019 / Accepted: 29 July 2019 / Published: 1 August 2019

Abstract

:
Sm2−xCaxZr2O7−x/2 (x = 0, 0.05, 0.1) and Gd2−xCaxZr2O7−x/2 (x = 0.05, 0.1) mixed oxides in a pyrochlore–fluorite morphotropic phase region were prepared via the mechanical activation of oxide mixtures, followed by annealing at 1600 °C. The structure of the solid solutions was studied by X-ray diffraction and refined by the Rietveld method, water content was determined by thermogravimetry (TG), their bulk and grain-boundary conductivity was determined by impedance spectroscopy in dry and wet air (100–900 °C), and their total conductivity was measured as a function of oxygen partial pressure in the temperature range: 700–950 °C. The Sm2−xCaxZr2O7−x/2 (x = 0.05, 0.1) pyrochlore solid solutions, lying near the morphotropic phase boundary, have proton conductivity contribution both in the grain bulk and on grain boundaries below 600 °C, and pure oxygen–ion conductivity above 700 °C. The 500 °C proton conductivity contribution of Sm2−xCaxZr2O7−x/2 (x = 0.05, 0.1) is ~ 1 × 10⁻⁴ S/cm. The fluorite-like Gd2−xCaxZr2O7−x/2 (x = 0.1) solid solution has oxygen-ion bulk conductivity in entire temperature range studied, whereas proton transport contributes to its grain-boundary conductivity below 700 °C. As a result, of the morphotropic phase transition from pyrochlore Sm2−xCaxZr2O7−x/2 (x = 0.05, 0.1) to fluorite-like Gd2−xCaxZr2O7−x/2 (x = 0.05, 0.1), the bulk proton conductivity disappears and oxygen-ion conductivity decreases. The loss of bulk proton conductivity of Gd2−xCaxZr2O7−x/2 (x = 0.05, 0.1) can be associated with the fluorite structure formation. It is important to note that the degree of Ca substitution in such solid solutions (Ln2−xCax)Zr2O7−δ (Ln = Sm, Gd) is low, x < 0.1. In both series, grain-boundary conductivity usually exceeds bulk conductivity. The high grain-boundary proton conductivity of Ln2−xCaxZr2O7−x/2 (Ln = Sm, Gd; x = 0.1) is attributable to the formation of an intergranular CaZrO3-based cubic perovskite phase doped with Sm or Gd in Zr sublattice.

1. Introduction

An extremely important subject of alternative energy is the development of materials for proton-conducting solid oxide fuel cells (PC-SOFCs). A fuel cell is an electrochemical energy converter, which converts the chemical energy of a fuel (H2, CH4) and an oxidant (air) to electrical energy. PC-SOFCs are converters, which can use hydrogen as fuel usually at T~ 600–800 °C. In a PC-SOFC the typical electrolyte is ceramic acceptor doped perovskite materials–BaCeO3 (BaCe0.9Y0.1O3−δ) and BaZrO3 (BaZr0.8Y0.2O3−δ). Acceptor doped BaCeO3 has low stability in CO2 atmosphere. The main problem of BaZrO3-based perovskite materials is low grain-boundary conductivity [1]. Therefore, an important task is to find alternative materials, which have higher or similar proton conductivity compared with well-known BaZr0.8Y0.2O3−δ perovskite proton conductor, but the problem of low grain-boundary conductivity, which limits the total conductivity of BaZr0.8Y0.2O3−δ, should disappear in these new materials. Although there are numerous experimental studies discussing the effect of chemistry and/or disorder on ionic conductivity of pyrochlores [2,3,4,5,6,7,8,9,10,11,12,13,14], there are only a few that examine the impact of GBs (grain boundaries) on oxygen and proton diffusion in pyrochlores [15,16,17,18].
Ln2Zr2O7 zirconates have long been studied as potential solid electrolytes for SOFCs [2,6,8,9,11,12,13]. Among undoped Ln2Zr2O7 zirconates, the highest oxygen-ion conductivity is offered by Gd2Zr2O7, the most disordered pyrochlore oxide and an intrinsic oxygen-ion conductor (cation anti-site and related oxygen vacancies formation in the pyrochlore structure) [9]. Its oxygen-ion conductivity at 600 °C has been variously reported to be from 3 × 10⁻⁴ to 7 × 10⁻⁴ S/cm [2,6,8,9]. Tb2Zr2O7, its neighbor in the lanthanide zirconate series, has the fluorite structure and an order of magnitude lower oxygen-ion conductivity [19,20]. The ordered pyrochlore phase La2Zr2O7 possesses proton conductivity, but it is as low as ~5 × 10⁻⁶ S/cm at 600 °C [21] (9 × 10⁻⁵ S/cm at 900 °C [22]). Therefore, proton conductivity is also possible in undoped pyrochlores due to the interaction of intrinsic oxygen vacancies with H2O, but since the number of oxygen vacancies is insignificant in the ordered La2Zr2O7, the proton conductivity is also low.
Ca- and Sr-doped light-lanthanide zirconates have oxygen-ion conductivity in dry atmosphere and proton conductivity in wet atmosphere [21,22,23,24,25]. Proton conduction was reliably demonstrated in Ca- and Sr-doped pyrochlore La2Zr2O7 [22,23,24,25]. La1.95Ca0.05Zr2O6.95 and La1.9Ca0.1Zr2O6.9 pyrochlore solid solutions were reported to be essentially identical in proton conductivity [23,24]: 7 × 10⁻⁴ S/cm at 600 °C. Obviously, when La2Zr2O7 is doped by calcium, its proton conductivity increases by two orders of magnitude, which is associated with the appearance of extrinsic oxygen vacancies that actively interact with H2O in the presence of such a hydrophilic dopant as calcium [25]. The 600 °C proton conductivity of the Sr-doped pyrochlore zirconate La1.95Sr0.05Zr2O6.95 is an order of magnitude lower (8 × 10⁻⁵ S/cm at 600°С) [18]. La1.95Sr0.05Zr2O6.95 was annealed in a wide temperature range, including 1600, 1700, and 1900 °C [18]. If the annealing temperature did not exceed 1600 °C, the total conductivity was studied (σprot = 8 × 10⁻⁵ S/cm at 600 °C). Annealing at 1700 °C allowed the bulk and grain-boundary components of conductivity to be separately assessed, and the bulk conductivity was found to exceed the grain-boundary component by more than one order of magnitude, reaching 1 × 10⁻³ S/cm at 600 °C. Annealing at the highest temperature, 1900 °C, slightly reduced the bulk conductivity due to deviations from the Sr stoichiometry in the grain bulk, whereas the grain-boundary conductivity increased by half an order of magnitude [18]. Therefore, the rise in grain-boundary conductivity is attributed to the formation of a Sr-containing intergranular phase. In spite of the high bulk proton conductivity, the grain-boundary component limits the total proton conductivity, which is lower (5 × 10⁻⁴ S/cm at 600 °C) than that of Ca-doped La2Zr2O7 [23,24]. Reducing the Ln ionic radius in the Ln2−xMxZr2O7−x/2 (Ln = La − Lu; M = Ca, Sr) doped zirconate series also leads to a pyrochlore–fluorite morphotropic phase transition. As mentioned above, the intrinsic oxygen-ion conductivity of Ln2Zr2O7 (Ln = La – Gd) increases in going from Ln = La to Gd, so that Gd2Zr2O7 is the most disordered pyrochlore zirconate with the highest oxygen-ion conductivity in this series. It is probably for this reason that Ca doping of Gd2Zr2O7 was unsuccessful, and Fournier et al. [26] observed a decrease in oxygen-ion conductivity with increasing x in the Gd2−xCaxZr2O7−x/2 (x = 0, 0.05, 0.2, 0.3) zirconates synthesized in the range of 1600–1700 °C.
It is important to emphasize that at synthesis temperatures between 1400 and 1900 °C, Moriga et al. [27] observed disordering of the pyrochlore structure of undoped Gd2Zr2O7, whereas synthesis at higher temperatures, above ~1900 °C, yielded fluorite Gd2Zr2O7. It is probably for this reason that Kutty et al. [28], who synthesized Gd2−xSrxZr2O7−x/2 solid solutions at 1400 °C (within the stability range of ordered pyrochlore Gd2Zr2O7 [27]), found that the oxygen-ion conductivity of Gd1.9Sr0.1Zr2O6.9 was twice that of undoped pyrochlore Gd2Zr2O7.
Xia et al. [29] prepared Sm2−xCaxZr2O7−x/2 (0 ≤ x ≤ 0.1) ceramics at 1700 °C, 10 h and investigated it by impedance spectroscopy in the narrow temperature range of 300–600 °C in air. They observed that electrical conductivity of Sm2−xCaxZr2O7−x/2 decreases with increasing CaO content. Eurenius et al. [30] measured the proton conductivity of a Sm2Zr2O7-based solid solution, Sm1.92Ca0.08Zr2O7−x/2, but they used low-density samples (~70–82%). According to their results, the solid solution has proton conductivity only below 400 °C, and its contribution to the total conductivity is rather small. This differs from data obtained by Shimura et al. [31], who reported the 600 °C conductivity of the Sm2Zr2O7-based solid solution Sm2Zr1.8Y0.2O7−α in hydrogen to be 1 × 10⁻⁴ S/cm. To the best of our knowledge, the intermediate and heavy lanthanide zirconates have no proton conductivity. Data on the proton conductivity of Gd2Zr2O7-based solid solutions are not available in the literature.
Recently, a Ca-doped 3+/5+ pyrochlore series, which also has a pyrochlore–fluorite morphotropic phase boundary, was shown to have proton conductivity [32], which increases in going from La2−xCaxScNbO7−x/2 to Sm2−xCaxScNbO7−x/2, i.e., with increasing disorder in the pyrochlore structure, and completely disappears in fluorite Ln2−xCaxScNbO7−x/2 (Ln = Ho, Yb).
The purpose of this work is to assess the ratio of oxygen-ion conductivity to proton conductivity in undoped and Ca-doped Sm2Zr2O7 and Gd2Zr2O7 pyrochlores, the compositions of which lie at the pyrochlore–fluorite morphotropic phase boundary. It is of interest to examine how bulk and grain-boundary oxygen-ion conductivity varies in going from the pyrochlores to fluorites and the proton conductivity of the rare-earth zirconate solid solutions gradually disappears. We studied Sm2−xCaxZr2O7−x/2 (x = 0, 0.05, 0.1) and Gd2−xCaxZr2O7−x/2 (x = 0.05, 0.1) solid solutions. Note that, to obtain high-density samples, we used the mechanical activation of starting oxides, followed by high-temperature synthesis at 1600 °C. As a result, we obtained disordered Gd2Zr2O7-based solid solutions, more similar in structure to fluorite, whereas the Sm2Zr2O7-based solid solutions had the pyrochlore structure.

2. Experimental Part

Sm2−xCaxZr2O7−x/2 (x = 0, 0.05, 0.1) и Gd2−xCaxZr2O7−x/2 (x = 0.05, 0.1) were synthesized by reacting appropriate oxide mixtures (Ln2O3 (Ln = Sm, Gd) + ZrO2 + CaO) after mechanical activation in a SPEX8000 ball mill (Glen Mills Inc, Clifton, NJ, USA). The parameters of SPEX8000 mill are: frequency 30 Hz, powder mass −10 g, balls mass −120 g. The Ln2O3 (Ln = Sm, Gd) starting powders were annealed at 1000 °C for 2 h and then placed in a desiccator after cooling to 850 °C. After the milling, the mixtures were pressed at 914 MPa and then fired at 1600 °C for 4–10 h in air. Gd1.9Mg0.1Zr2O7−x/2 was synthesized in the same way, but using MgO as a dopant.
The density of the resultant samples was determined by measuring their mass and dimensions and ranged from 89 to 92.6% of their X-ray density. Characteristics of the compounds and solid solutions under investigation presented in Table 1. All of the synthesized solid solutions were characterized by X-ray diffraction (XRD) on a DRON-3M (Bourevestnik, Sankt-Petersburg, Russia) (filtered Cukα radiation, step scan mode with a step of 0.1 or 0.05°, angular range 2θ = 10–65°). In addition, for the same synthesized solid solutions the XRD patterns were registered on a Bruker D8 Advance diffractometer (Bruker AXS, Karlsruhe, Germany) in the reflection mode with Ni-filtered CuKα radiation. The diffractometer is equipped with a LynxEYE detector. The XRD patterns were registered under air at the temperature of 22 °C in the angular range of 12 ≤ 2θ ≤ 98 with a step size of 0.01° and counting for 0.3 s in each point. Corundum (Bruker AXS, Karlsruhe, Germany) and Si powder (Sigma-Aldrich, St. Louis, MI, USA) were used as the external and internal standards.
The microstructure of the sintered ceramics was examined using scanning electron microscopy (JEOL JSM-6390LA, JEOL, Tokyo, Japan).
Thermogravimetric analysis was performed by using the NETZSCH STA 449C system (Netzsch, Selb, Germany) (30–1000 °C, heating rate of 10 K/min, Al2O3 plate) in air. A detailed description of the experiment can be found in Reference [32].
For electrical measurements disk-shaped polycrystalline samples (diameter ~9 mm and thickness 2–3 mm) were prepared. Contacts to the sample faces were made by firing ChemPur C3605 paste, containing colloidal platinum, at 950–1000 °C. The conductivity of Sm2−xCaxZr2O7−x/2 (x = 0, 0.05, 0.1) и Gd2−xCaxZr2O7−x/2 (x = 0.05, 0.1) was characterized by impedance spectroscopy in dry and wet air. Electrical conductivity measurements of the samples were performed on cooling regime using a P-5X potentiostat/galvanostat combined with frequency response analyzer module (Elins Ltd., Russia) over the frequency range of 0.1 Hz to 500 kHz at signal amplitude of 150 mV in the temperature range of 100–900 °C. Dry atmosphere was created by passing air through a KOH and wet atmosphere through a water saturator held at 20 °C, which ensured constant humidity of about 0.023 atm (2.3% H2O). Air flow rate was 130 mL/min. To get stable state (water vapor pressure) before conductivity measurement, the sample was kept at each temperature for 40 min. The impedance data fitting was performed by the least squares refinement program ZView (Scribner Associates Inc., Southern Pines, NC, USA). The general equivalent circuit model used to fit the experimental data includes at least two (RQ)-circuits connected in series, where R is the resistance and Q is the constant phase element. Most of the spectra consist of high- and low-frequency arcs. The high-frequency (from 500 to ~0.1–1 kHz) arc corresponds to the bulk (Rb) and grain-boundary (Rgb) resistances of the sample, and the low-frequency (from ~0.1–1 kHz to 1 Hz) arc represents the electrode polarization resistance.
Electrical characterization of Sm2−xCaxZr2O7−x/2 (x = 0.05, 0.1) and Gd2−xCaxZr2O7−x/2 (x = 0.1) was carried out by impedance spectroscopy in the frequency range of 20 Hz to 1 MHz, with a signal amplitude of 200 mV, using a Hewlett-Packard 4284A precision LCR bridge, as a function of the oxygen partial pressure, during reoxidation, after reduction with a mixture of 95% N2 and 5% H2, between 700 and 950 °C.

3. Results and Discussion

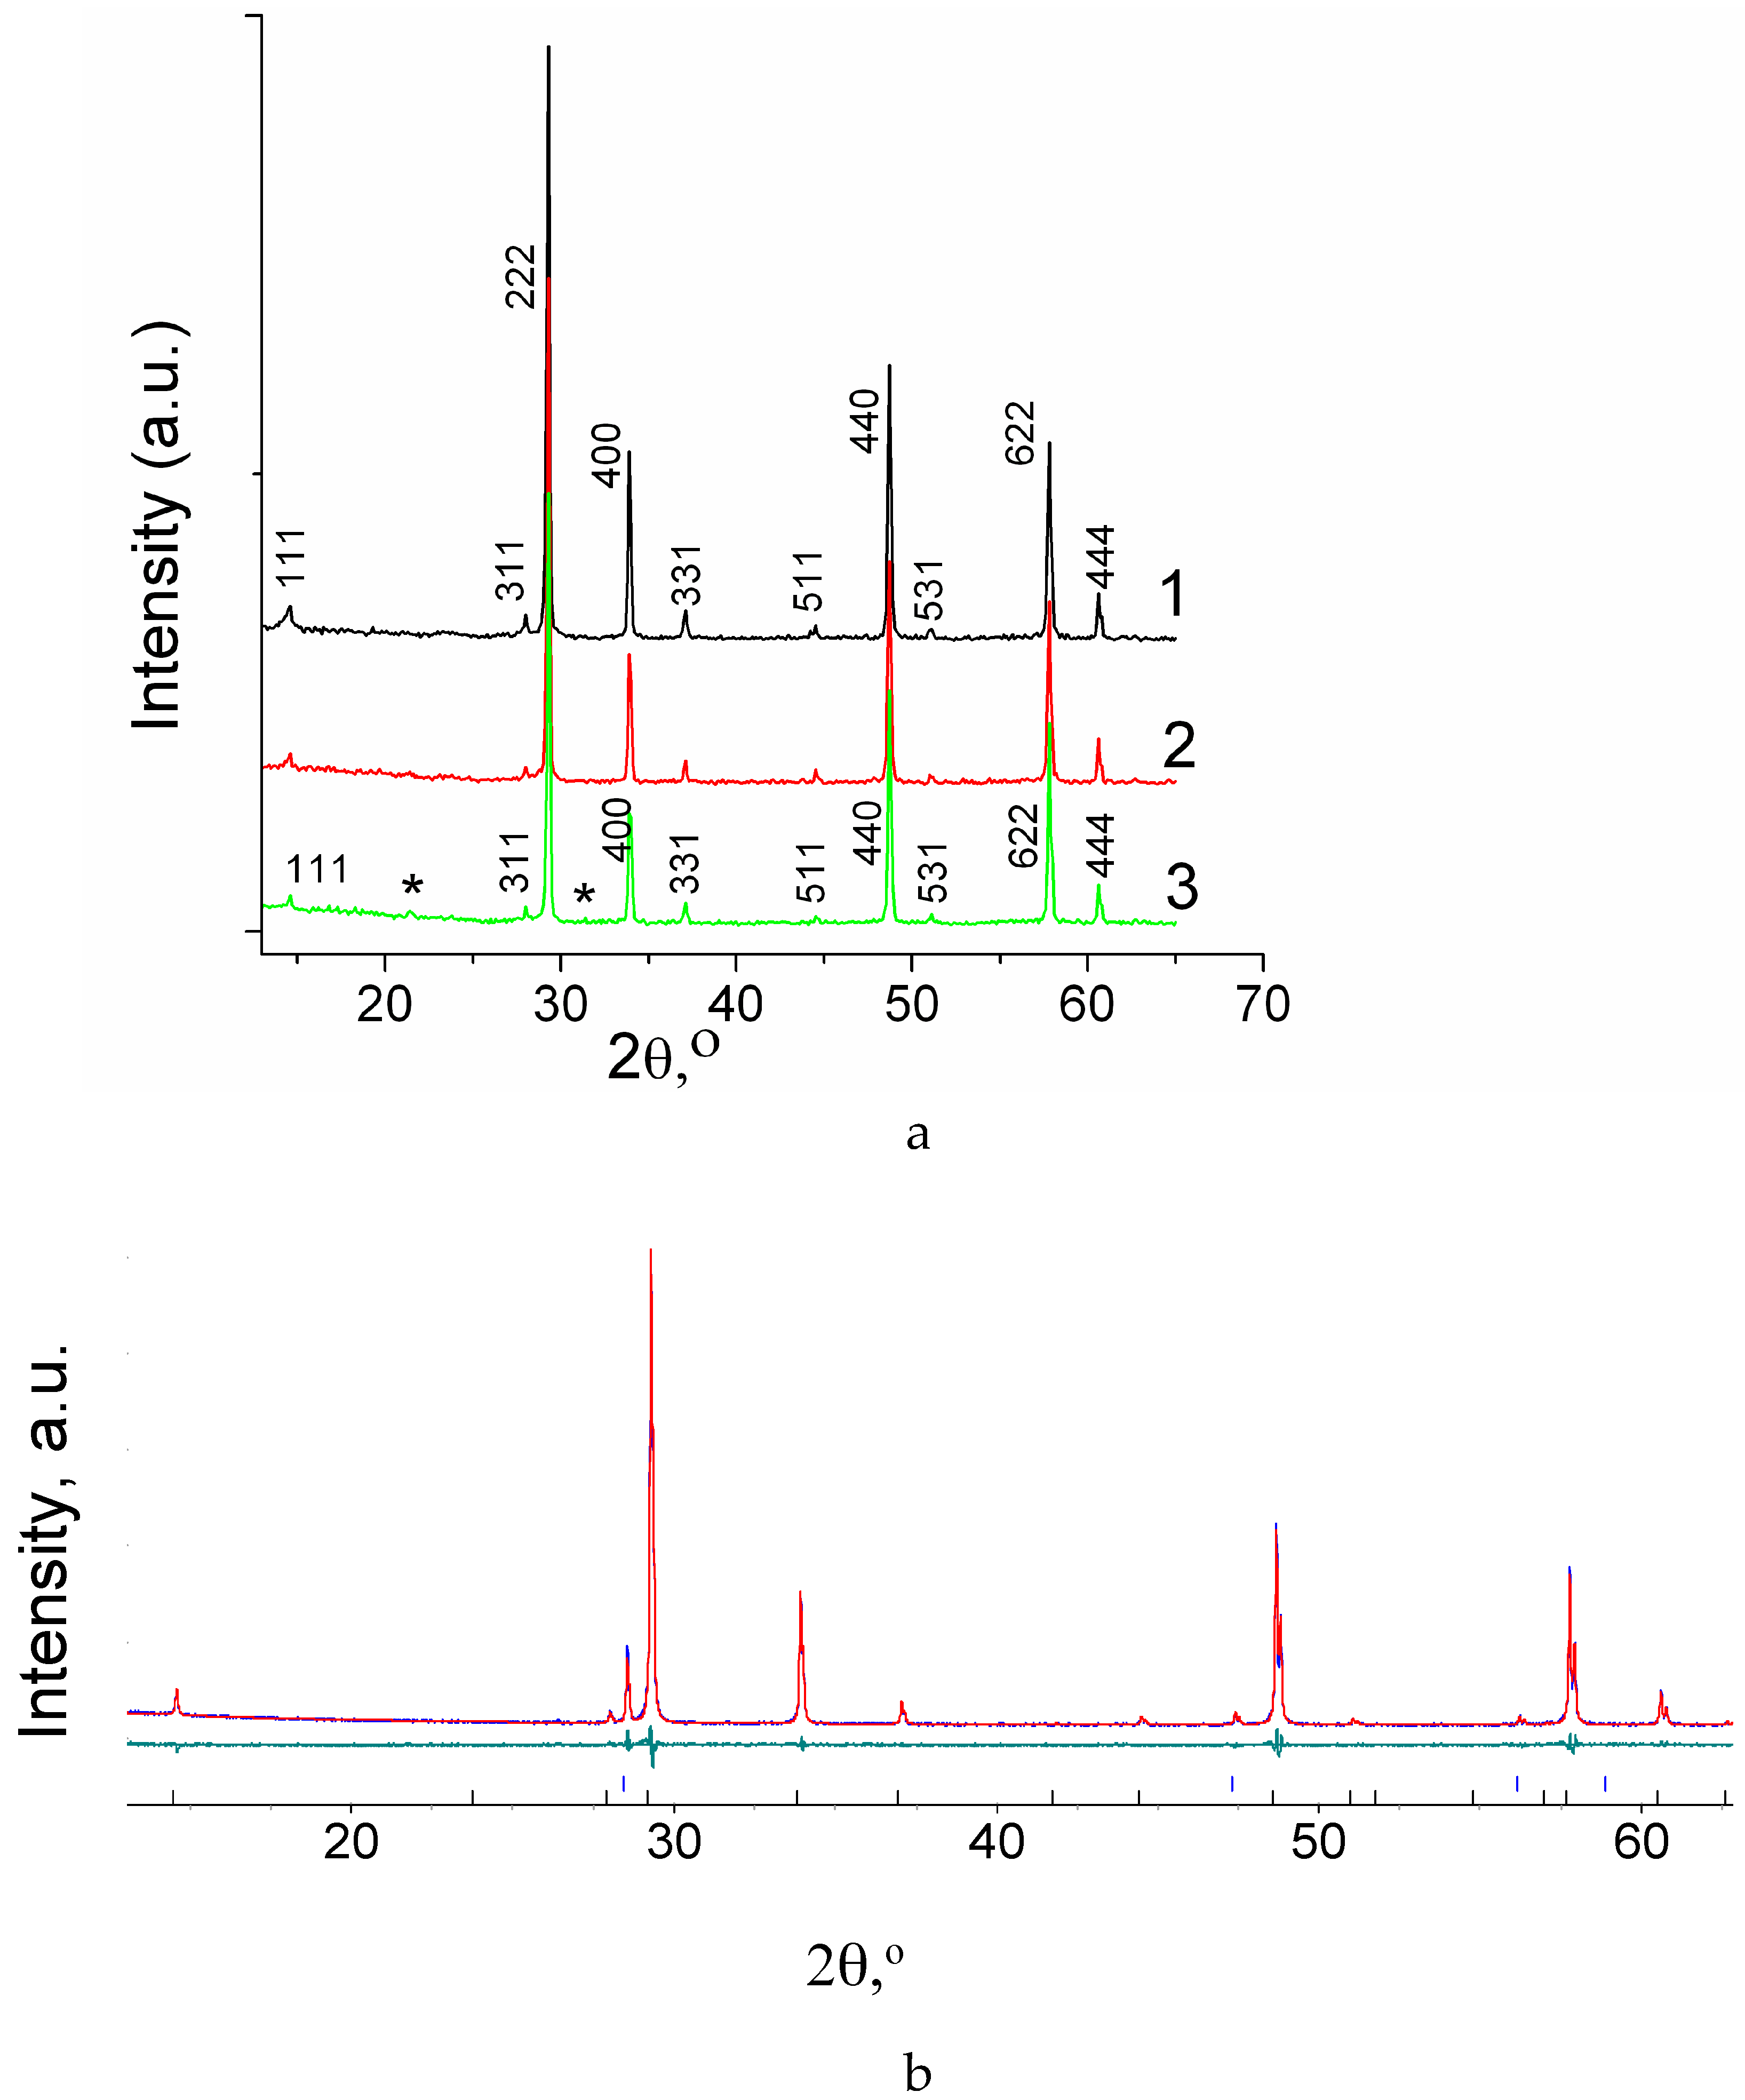
3.1. Structure of Sm2−xCaxZr2O7−x/2 (x = 0, 0.05, 0.1) and Gd2−xCaxZr2O7- x/2 (x = 0.05, 0.1) Studied by XRD with Rietveld Refinement

Figure 1a and Figure 2a present XRD results for the Sm2−xCaxZr2O7−x/2 (x = 0, 0.05, 0.1) and Gd2−xCaxZr2O7−x/2 (x = 0.05, 0.1) solid solutions. It is seen that, upon doping with calcium, which has a larger ionic radius than do the lanthanides (RCN8 Sm3+ = 1.079, RCN8 Gd3+ = 1.053, RCN8 Ca2+ = 1.12 Å), all of the Sm-containing materials retain the pyrochlore structure, but the intensity of the pyrochlore superstructure reflections decreases with increasing doping level (Figure 1a). In the case of the Gd2−xCaxZr2O7−x/2 (x = 0.05, 0.1) solid solutions, synthesized at the same temperature, 1600 °C, there is only one pyrochlore superstructure reflection, (111), and Gd2−xCaxZr2O7−x/2 (x = 0.05) has a weak (331) line. The Gd1.9Mg0.1Zr2O6.95 solid solution, containing Mg, which has a smaller ionic radius than does Gd (RCN8 Gd3+ = 1.053, RCN8 Mg2+ = 0.89 Å), has the pyrochlore structure and its XRD pattern shows the (111), (311), (331), (511), and (531) superstructure reflections (Figure 2a, scan 3). Therefore, Ca substitution on the lanthanide site leads to disordering (decreasing and disappearing of (111), (311), (331), (511), and (531) superstructure reflections) in the pyrochlore structure of Ln2Zr2O7 (Ln = Sm, Gd) (Figure 1a and Figure 2a).
The structure of the solid solutions was refined by the Rietveld method. The results are presented in Table 2, Table 3 and Table 4 and, for the x = 0.05 solid solutions, in Figure 1b and Figure 2b. It is seen from Table 2 that the lattice parameter of Sm1.95Ca0.05Zr2O6.975 (a = 10.5925(1) Å) is lower than that of undoped Sm2Zr2O7 (a = 10.5975(1) Å). On Ca-doping of Nd2Zr2O7 [33] the change of Ca coordination number from 8 to 7 in the pyrochlore structure was observed by neutron diffraction (ND) at room temperature. Then the ionic radii of the host ions Sm3+CN8 will be larger than that the ionic radii of dopant CaCN7 (RCN8 Sm3+ = 1.079 Å, RCN7 Ca2+ = 1.06 Å) compare to undoped Sm2Zr2O7 (RCN8 Sm3+ = 1.079 Å, RCN8 Ca2+ = 1.12 Å). Therefore, it is reasonable to expect the decrease in the lattice parameters of Sm1.95Ca0.05Zr2O6.975. The data presented in Table S1 for Sm1.95Ca0.05Zr2O6.975 illustrate that there is a small variation in the A- and B- sites occupancies by host and doping cations (at the same quality of refinement) resulting in the appearance of the cation anti-sites generated by host cations and incorporation of Ca cations into both A-sublattice (preferably) and B-sublattice. According to the Rietveld refinement of Sm1.9Ca0.1Zr2O6.95 the variation in the A- and B-sites occupancies could occur with a higher degree of the formal substitution Table S2. In the latest case, the fraction of the cation anti-sites generated by the host cations could be higher (up to 8% on both sublattices). The lattice parameter of the Sm1.9Ca0.1Zr2O6.95 solid solution (5% substitution), is а = 10.5923(1) Å (Table 2), is almost comparable with that for Sm1.95Ca0.05Zr2O6.975 suggesting that a solubility limit of calcium in the pyrochlore structure is within 0.05 < x < 0.10. Note the additional lines (100) and (110) at 2θ~22° and 31.5° exist in the XRD pattern of Sm1.9Ca0.1Zr2O6.95 (Figure 1a, scan 3; the additional lines are marked by asterisks). These lines correspond to the main diffraction lines of CaZrO3 perovskite. In the study of the oxygen-ion conductivity of the Sm2−xCaxZr2O7-δ series, the appearance of tiny peaks of perovskite-like CaZrO3 second phase was observed in the XRD pattern of Sm1.9Ca0.1Zr2O6.95 (x = 0.1) solid solution [29]. With the appearance of the second phase, the real composition of this sample could deviate from the intended composition, nevertheless the Rietveld refinement of the X-ray diffraction data was carried out for Sm1.9Ca0.1Zr2O6.95 and corresponding crystallographic information is presented in Table 2 and Table S2 in order to give insight into the defect formation at a higher degree of Ca substitution. Most likely, the second phase appears due to the interaction of excess Ca, which cannot fully enter to the samarium sublattice, with zirconium.
Previously, in studies of Sr-doped Gd2Zr2O7 and Gd2Hf2O7, Gd1.8Sr0.2Zr2O6.9 and Gd1.8Sr0.2Hf2O6.9 samples (10% substitution) were found to contain SrZrO3 and SrHfO3 perovskites, respectively, as impurity phases [28,34]. These findings confirm that the degree of Sr substitution for Gd in Gd2Zr2O7 and Gd2Hf2O7 does not exceed 5%. An excess of Sr above 5% forms the SrMO3 (M = Zr, Hf) perovskite compounds, and their lines emerge in XRD patterns. In this study, in the case of Sm1.9Ca0.1Zr2O6.95 we assume the formation of a small amount perovskite CaZrO3 based phase, because the observed extra lines are similar to the (100) and (110) lines of cubic perovskite CaZrO3 [35]. Clearly, there will be deviations from the intended stoichiometry in the grain bulk of the Sm1.9Ca0.1Zr2O6.95 solid solution.
The Rietveld refinement was carried out for Gd2−xCaxZr2O7−x/2 (x = 0.05, 0.1) compositions as well (Table 2 and Figure 2b). Two structural models were considered for each composition: the pyrochlore structure and the fluorite structure with oxygen deficiency corresponding to the oxygen content in the pyrochlore structure. The Rietveld refinement carried out for Gd2−xCaxZr2O7−x/2 (x = 0.05, 0.1) compositions as for a single phase compound with the phyrochlore structure indicates that a wide variation in occupancies of A-sites and B-sites results in the same set of the refinement factors. The following variations in occupancy were observed: GdGd ~ 0.48–0.62, ZrGd ~ 0.36–0.50, ZrZr ~ 0.50–0.64, GdZr ~ 0.35–0.50 for Gd1.9Ca0.05Zr2O6.975 as well as GdGd ~ 0.46–0.65, ZrGd ~ 0.30–0.54, ZrZr ~ 0.46–0.70, GdZr ~ 0.30–0.49 for Gd1.9Ca0.1Zr2O6.95. The typical sets of the refinement factors are presented in Table 2. Location of Ca cations on the A-site only, B-sites only or on both A- and B-sites in different ratios will not change the quality of the refinement. This indicates a high degree of disorder within the pyrochlore structure. The comparison of the Rietveld refinement for the two structural models indicates that both Gd2−xCaxZr2O7−x/2 (x = 0.05, 0.1) compositions are better described by the fluorite structural model as the refinement factors are slightly better (Table 2). The lattice parameters of Gd2−xCaxZr2O7−x/2 (x = 0.05, 0.1) compositions as for compounds with fluorite structure are two times less when these compounds are described by pyrochlore structural model. The description of Gd2−xCaxZr2O7−x/2 (x = 0.05, 0.1) compositions within the pyrochlore structure model allows us to consider the evolution of lattice parameters on Ca-doping. The lattice parameter of the Gd1.95Ca0.05Zr2O6.975 solid solution (2.5% substitution) was determined to be 10.5326(1) Å. Undoped Gd2Zr2O7 was investigated in Reference [35,36,37]. According to previous studies, the lattice parameter of undoped Gd2Zr2O7 is 10.524 Å [36] or 10.528 Å [37]. Therefore, the lattice parameter of the Gd1.95Ca0.05Zr2O6.975 solid solution (2.5% Ca substitution) exceeds that of undoped Gd2Zr2O7. In this case, raising the degree of substitution to 5% (Gd1.9Ca0.1Zr2O6.95) does not actually change the lattice parameter (a = 10.5321(1) Å). In this case, we also assume the presence of a small amount (under 5%) of a second phase, based on perovskite CaZrO3. Recently, a series of Gd2−xCaxZr2O7−x/2 (x = 0, 0.02, 0.05, 0.1, 0.15, 0.2, 0.25, 0.3) solid solutions was synthesized by a hydrothermal process followed by annealing at 1500 °C for 4 h [38]. The lattice parameter of Gd1.95Ca0.05Zr2O6.975 (2.5% substitution) was found to exceed that of undoped Gd2Zr2O7. The ionic radii of the host Gd cations (RCN8 Gd3+= 1.056 Å) is smaller than that the ionic radii of dopant Ca2+ (RCN7 Ca2+ = 1.06 Å). Therefor it is reasonable to expect the increase in the parameter of Gd1.95Ca0.05Zr2O6.975 in comparison with Gd2Zr2O7. At higher doping levels, the lattice parameter remained essentially constant up to x = 0.15. Starting at 5% substitution (Gd1.9Ca0.1Zr2O6.95), diffraction lines of a second phase, perovskite GdZrO3, were observed [38]. These data are completely consistent with our results (Table 2).

3.2. Microstructure of Sm2−xCaxZr2O7−x/2 (x = 0, 0.1)

Figure 3 illustrates the microstructure of undoped Sm2Zr2O7 and Sm1.9Ca0.1Zr2O6.95 ceramics. The open porosity of both ceramics is insignificant. However, in Sm1.9Ca0.1Zr2O6.95 ceramics grains with the size of 100–300 nm and micron-size agglomerates formed from small grains can be observed in addition to well-sintered micron-size grains (Figure 3b,c). The small grains (100–300 nm) are randomly distributed over the ceramics. SEM/EDX point analysis was used to identify chemical composition of different microstructural components in Sm1.9Ca0.1Zr2O6.95 ceramics and compare with the nominal stoichiometry of this composition (Table 3). Well-sintered micron-size grains contain 1.7–2.5 at.% Ca, which is comparable with the nominal stoichiometry. In contrast to the nominal stoichiometry, the concentration of Sm cations is larger than that of Zr. At the grain boundaries and in the neighboring area, the concentration of Ca (1.6–2 at.%) is comparable with that in the bulk of the grains. A similar trend was revealed for the grains with the size of 100–300 nm on the surface of micron-size well co-sintered grains. It is necessary to note that the analyzing volume, which is defined by instrumentation, is much larger (sub-micron/micron range) than the grain boundaries and grains with the size of 100–300 nm, therefore the measured values have uncertain contributions from the bulk of surrounded grains and cannot describe precisely chemical composition of the grain boundaries and grains with the size of 100–300 nm in the ceramics. Therefore, one cannot rule out the formation around the grains a thin nano-size film with different chemical composition and deviation in Ca content in the grains with the size of 100–300 nm. A slightly higher concentration of Ca (up to 4.9 at%) was revealed in individual small grains with the size of 0.6–1.1 mkm. A higher concentration of Sm was detected for these grains as well, but much higher variation in the absolute values was observed: 49.1–73.6 at.% (Table 3). A high concentration of Ca in micron-size agglomerates formed from small grains is evidently confirmed through the mapping of Ca, Sm and Zr (Supplementary information, Figure S1). The ratio [Ca]/([Sm] + [Zr]) is close to 1–1.5, which allows us to assume the formation of Ca based perovskite containing both Sm and Zr on the B-sites.

3.3. TG Characterization of Sm2−xCaxZr2O7- x/2 (x = 0, 0.1) and Gd2−xCaxZr2O7- x/2 (x = 0.1)

The geometric densities of the synthesized samples are presented in Table 1. Note that they fall in the range of 89–92.6%, markedly exceeding those reported previously [30].
Figure 4a presents the results obtained for as-synthesized pyrochlore Sm2Zr2O7 in three successive heating–cooling cycles between 25 and 1000 °C in air. It is seen that the initial weight loss is 0.05% and that essentially all of the water is removed below 500 °C, but during cooling the material partially picks up water from air. The same is observed in the next two cycles. Water is readily removed from Sm2Zr2O7 and then partially absorbed during cooling. Sm2Zr2O7 loses water in one step, in the temperature interval of 250–500 °C, like hydrophilic samarium oxide Sm2O3 [39]. It seems likely that, for the most part, surface water and hydroxyl ions are involved. Prolonged hydration and higher temperatures seem to be needed for structurally bound water and interstitial protons to be present in Sm2Zr2O7. Note that the present TG curves of Sm2Zr2O7 are similar to those obtained by Eurenius et al. [30] for different Ca-doped Sm2B2O7-δ (B = Ti, Sn, Zr and Ce) proton-conducting pyrochlore oxides.
Figure 4b presents analogous experimental data for pyrochlore Sm1.9Ca0.1Zr2O6.95. It is seen that there is no water loss (Figure 4b, curve 1). Next, pyrochlore Sm1.9Ca0.1Zr2O6.95 was held in water for four weeks and characterized by TG (Figure 4b, curves 2, 3). The hydrated Sm1.9Ca0.1Zr2O6.95 was heated twice to 1000 °C. During the first heating, surface water, the water in the pores of the ceramic, and hydroxyl ions were removed below about 500 °C (~0.03%) [40]. Above 500 °C, water was removed rather slowly, without obvious steps, up to 1000 °C. Clearly, structurally bound water and interstitial protons were involved [40]. The amount of weight loss was about 0.015% at 500–1000 °C. The second heating caused no weight loss. Therefore, the kinetics of water incorporation into the structure of Sm1.9Ca0.1Zr2O6.95 is extremely sluggish. Nevertheless, in this sample there is strongly bound water and interstitial protons, as distinct from undoped Sm2Zr2O7, which has a comparable density.
Figure 4c shows TG heating and cooling curves obtained for the Gd1.9Ca0.1Zr2O6.95 solid solution without prehydration. Here, during the first heating we observe the first weight loss stage of ~0.02% below 450 °C, which is obviously due to the removal of surface water and hydroxyl ions, and a second weight loss stage of ~0.005% in the range of 450–1000 °C, which is due to the structurally bound water and interstitial protons [40]. Note that the cooling curves of the Gd1.9Ca0.1Zr2O6.95 sample have small anomalies in the range of 200–300 °C, due to water sorption from the atmosphere, but they are much smaller than those of the undoped Sm2Zr2O7 sample. Therefore, there is negligible weight loss during the second heating.
We believe that if structurally bound water and interstitial protons do not show up in TG curves between 500 and 1000 °C, this may mean that the samples should be prehydrated, and this is related to kinetic hindrances for water incorporation into the complex defect structure of the mixed oxides. This should be taken into account in proton conductivity measurements, because even prolonged holding, up to 5 h, at each temperature can be insufficient for incorporating water into the defect structure of the mixed oxides, and the results will be underestimated.

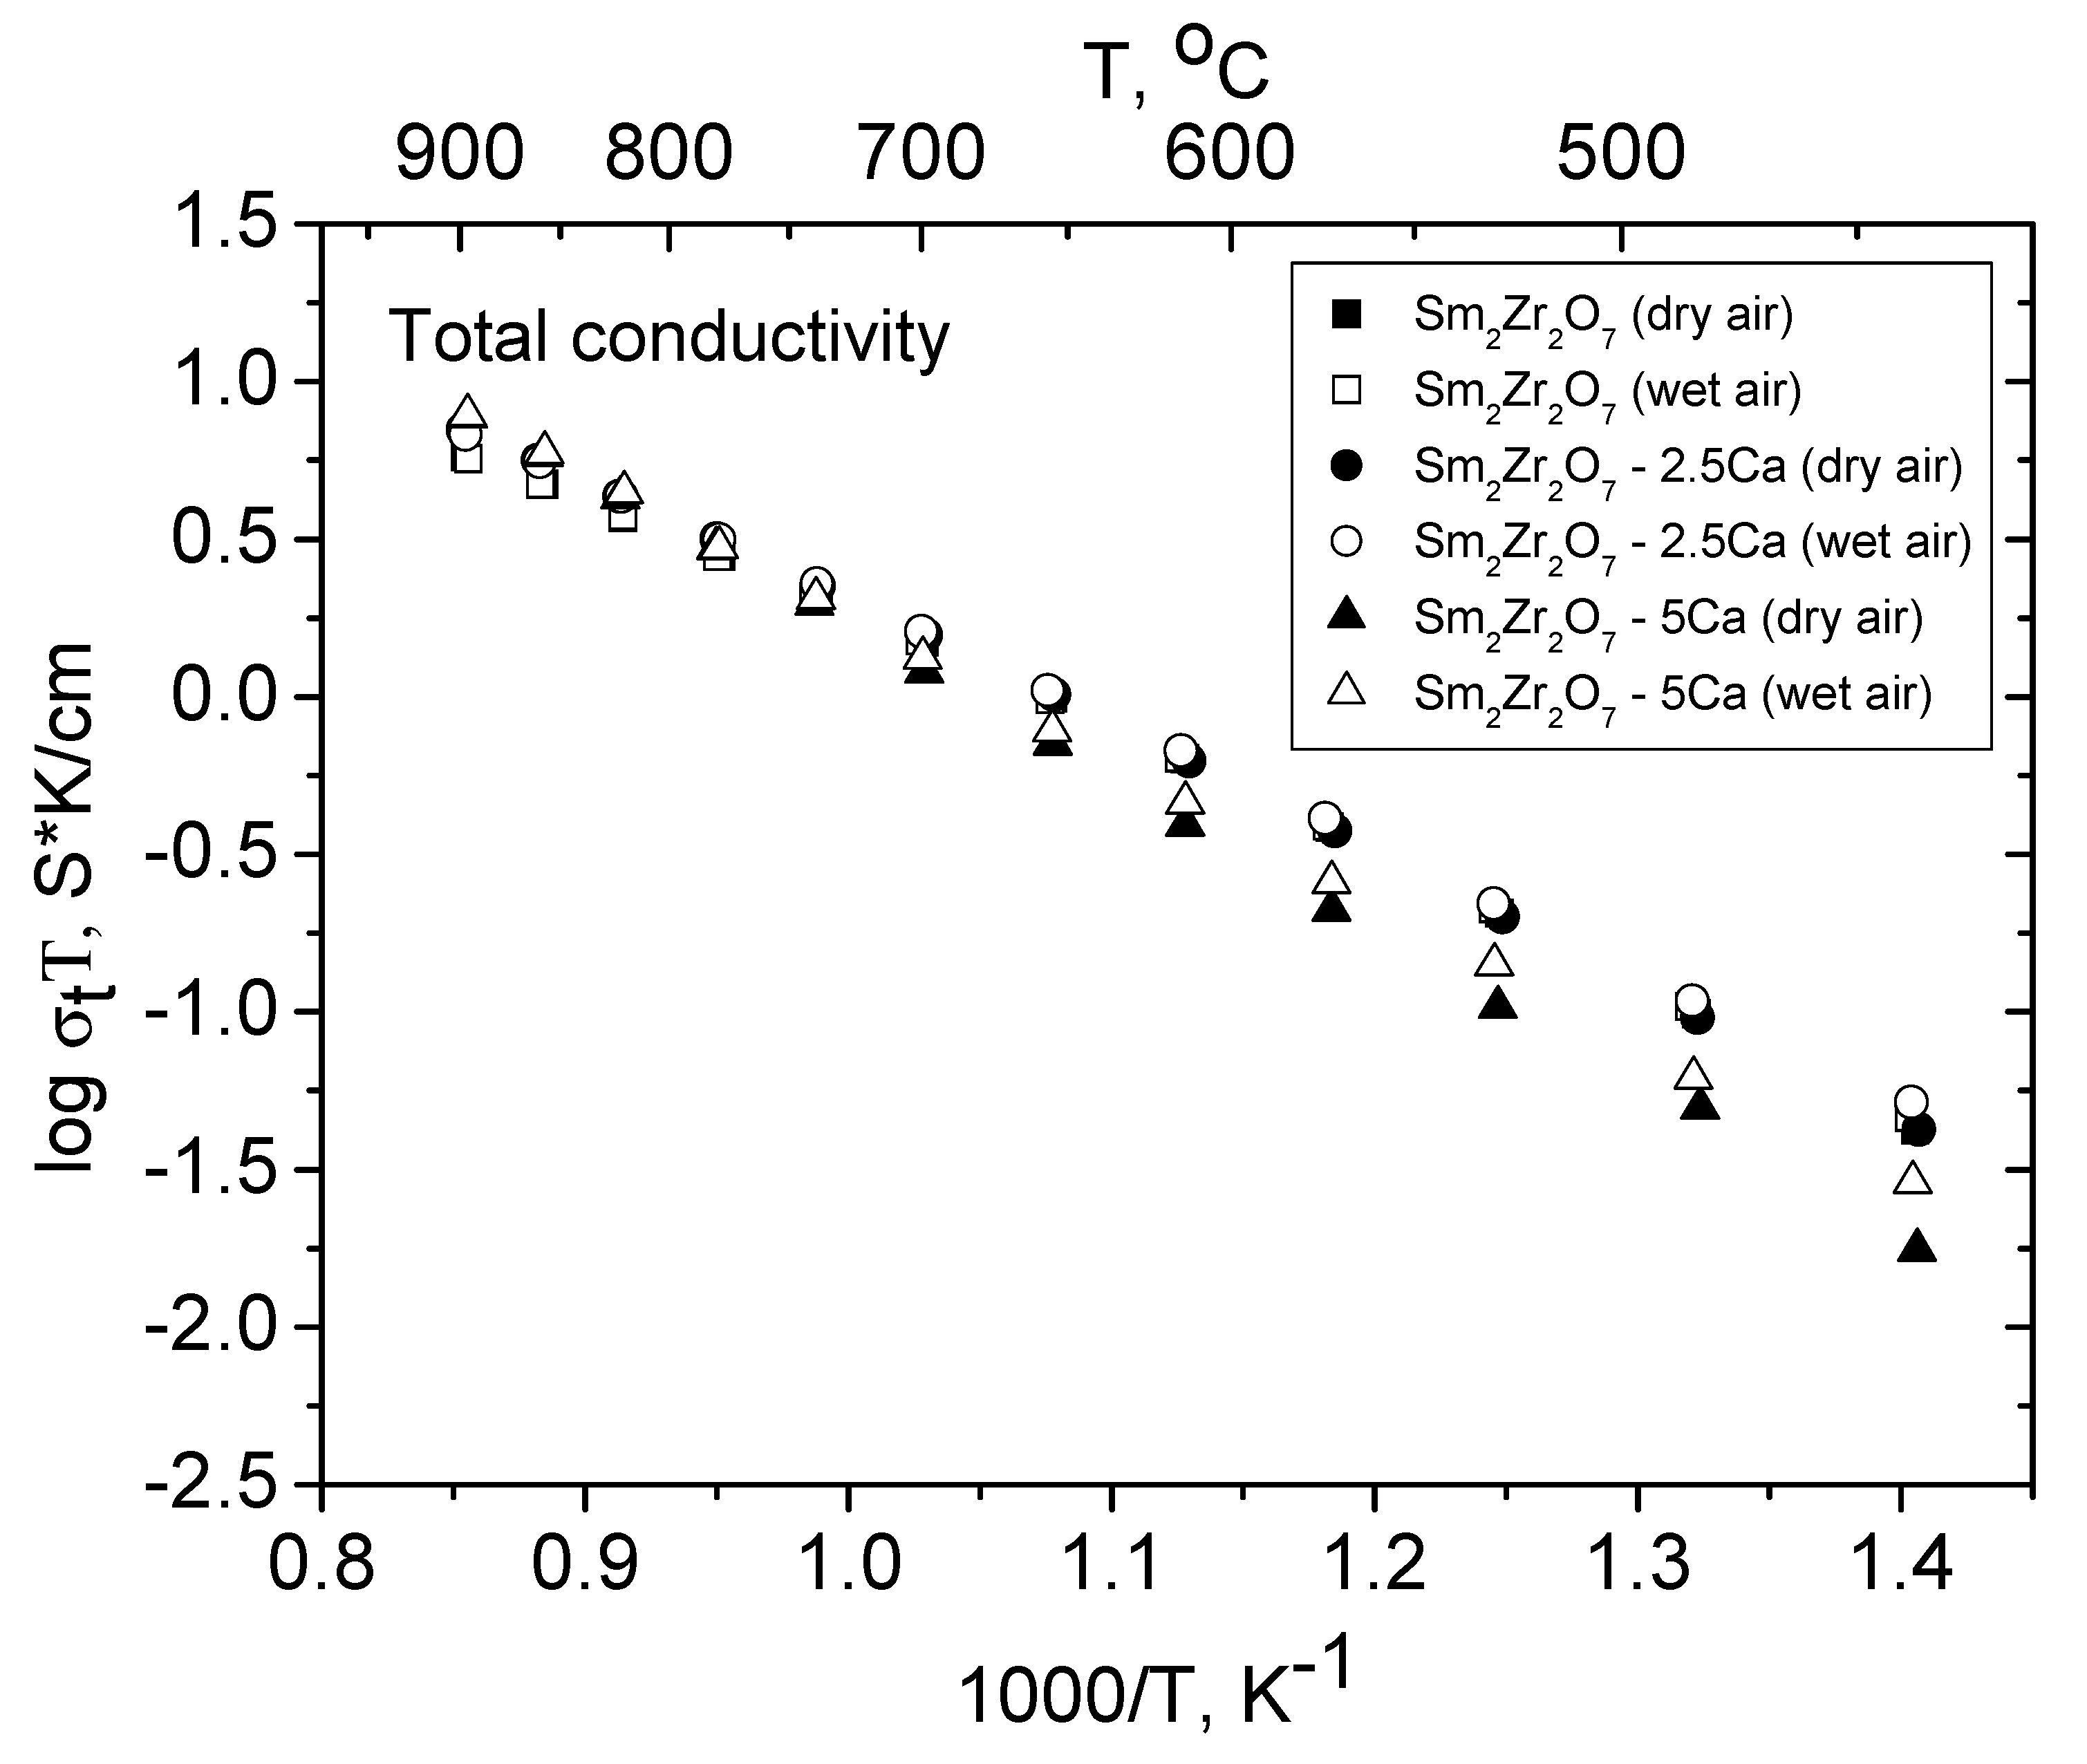
3.4. Conductivity of the Sm2−xCaxZr2O7- x/2 (x = 0, 0.05, 0.1) Solid Solutions in Dry and Wet Air

Figure 5 shows impedance spectra of undoped Sm2Zr2O7 and the Ln2−xCaxZr2O7−x/2 (Ln = Sm, Gd; x = 0.1) solid solutions (5% substitution) in dry and wet air at 530 and 615 °C, respectively. Most of the spectra have the form of two arcs at high (0.1–1 to 500 kHz) and low (0.1–1 kHz to 1 Hz) frequencies. The high-frequency arc represents the bulk (Rb) and grain-boundary (Rgb) resistances of the sample, and the low-frequency arc represents the electrode polarization resistance. Rb and Rgb were evaluated by extrapolating the high-frequency arc to the real axis: Rb corresponds to the high-frequency limit (>500 kHz), and Rgb, to intermediate frequencies (0.1–1 kHz). The specific capacitances corresponded to the bulk, grain boundary, and electrode arcs were ~10−11 F cm−1, ~10−7÷10−8 F cm−1, and ~10−5 F cm−1, respectively.
Figure 6, Figure 7 and Figure 8 and Table 4 summarize the bulk, grain-boundary, and total conductivities of the Sm2−xCaxZr2O7−x/2 (x = 0, 0.05, 0.1) solid solutions in dry and wet air. Above 700 °C, the Sm2−xCaxZr2O7−x/2 (x = 0.05, 0.1) solid solutions have the conductivity, which is independent of humidity (Figure 6). According to López-Vergara et al. [41], this means that oxygen-ion conductivity prevails at these temperatures. The activation energies for conduction in dry and wet atmospheres are indicated in Table 4. It is seen that the activation energies for conduction in all of the Sm2−xCaxZr2O7−x/2 (x = 0, 0.05, 0.1) samples in dry air lie within the range 0.7–0.95 eV, characteristic of similar oxygen-ion-conducting systems [13,42,43,44,45]. Note that there is the Ca-doping effect above 700 °C in the pure oxygen-ion conduction region: the bulk conductivity of the Ca-doped solid solutions exceeds that of undoped Sm2Zr2O7.
It is seen (Table 4) that below 600 °C the activation energies for conduction in Sm2−xCaxZr2O7−x/2 (x = 0, 0.05, 0.1) samples in wet air is lower than that of dry air. This is typical for proton-conducting oxides.
Below 600 °C, the bulk conductivity of Sm2Zr2O7 exceeds that of the Sm2−xCaxZr2O7−x/2 (x = 0.05, 0.1) solid solutions (Figure 6). Increasing the degree of substitution reduces the bulk conductivity of the solid solutions. Below 600 °C, protons contribute to conduction in both Sm2Zr2O7 and the Ca-doped solid solutions. However, the influence of the wet atmosphere in Sm2Zr2O7 is negligible (Figure 5a and Figure 6). In accordance with TG data (Figure 4a), there is no structurally bound water and interstitial protons in disordered Sm2Zr2O7. Sm2Zr2O7 has predominantly intrinsic oxygen-ion conductivity [29,45]. It is known from the literature that Sm2Zr2O7 is an intrinsic ionic conductor and that the fraction of anti-site pairs in its cation sublattice reaches 8.1% [45]. Disordered pyrochlore structures typically contain not only cation anti-site pairs but also oxygen vacancies:
SmSmx + ZrZrx → SmZr + ZrSm
Oo× → VO(48f) ●● + Oi (8b)
Therefore, the pyrochlore structure of Sm2Zr2O7 contains a sufficient concentration of intrinsic oxygen vacancies, but only a small part of them can be involved in the formation of mobile protons at sufficient hydrophilicity of the compound (Figure 6).
With the Ca doping, extrinsic oxygen-ion conductivity appears. Clearly, Ca substitution on the Sm3+ site also produces oxygen vacancies, and most of them can take part in proton transfer (Figure 6). In the case of heterovalent substitution of Ca2+ for Sm3+, the following scheme can be written for the (Sm2−xCax)Zr2O7−x/2 solid solutions:
4CaO + 4SmSm×+2ZrZr× + 3OO× → 4CaSm + 2SmZr + 3VO●● + Sm2Zr2O7.
Analyzing Figure 6 one can see, that with Ca doping, the bulk conductivity decreases below 600 °C, but at the same time, the effect of the influence of the wet atmosphere increases. Clearly, the extrinsic oxygen vacancies can be involved in the formation of mobile protons at sufficient hydrophilicity of the compound:
H2O + VO•• + OO× = 2(OH)O.
This process leads to decreasing of the oxygen-ion conductivity contribution across Sm2−xCaxZr2O7−x/2 (x = 0, 0.05) series (Figure 6). Further decrease in the bulk oxygen-ion conductivity for the Sm2−xCaxZr2O7−x/2 (x = 0.1) solid solution is associated with a deviation from stoichiometry inside of grains owing to the grain-boundary CaZrO3 perovskite-based phase formation. It is possible that intrinsic oxygen vacancies concentration mainly decreases, whereas extrinsic oxygen vacancies number does not change or increases (Figure 6). The authors of Reference [29] also reported that the total electrical conductivity of Sm2−xCaxZr2O7−x/2 decreases with increasing CaO content below 600 °C in air.
In Reference [46] for (La1-yCay)2(Ce1-xZrx)2O7-δ (y = 0, 0.02, 0.1; x = 0, 0.5, 0.75) pyrochlore–fluorite series was suggested that Ca doping decreases the ionic (oxygen–ion and proton) conductivity owing to the trapping of the mobile ions by the acceptor CaLa´.
In the case of acceptor substitution of Ca for Dy in ordered pyrochlore Dy2Ti2O7, Rietveld refinement of the structure of the (Dy1.8Ca0.2)Ti2O6.9 pyrochlore solid solution detected neither cation antistructure pairs nor related oxygen vacancies [47]. All of the oxygen vacancies presented were the result of substitution. A different situation occurs in the case of Sm1.95Ca0.05Zr2O6.975. According to the XRD data in Table S1, Sm1.95Ca0.05Zr2O6.975 contains not only oxygen vacancies due to Ca substitution for Sm but also vacancies due to cation anti-site pairs (~2–3%). We suppose that degrees of substitution ~5% (x = 0.1) may cause deviations from stoichiometry in the grain bulk and the formation of a small amount of a new perovskite-based phase, according to XRD data (Figure 1, scan 3; the lines (100) and (110) of CaZrO3 perovskite are marked by asterisks), that confirms earlier results [29] and correlates well with a small difference in the lattice parameters for Sm1.95Ca0.05Zr2O6.975 and Sm1.9Ca0.1Zr2O6.95 (Table 2). The formation of the SrHfO3 and SrZrO3 perovskites as impurity phases was observed upon 10% (x = 0.2) Sr doping on the Gd site in gadolinium hafnate and gadolinium zirconate [28,34]. It seems likely that this is possible in La1.95Sr0.05Zr2O6.975 as well [18]. At high synthesis temperatures (higher than 1700 °C) Huo et al. [18] also observed deviations from stoichiometry in the grain bulk of La1.95Sr0.05Zr2O6.975.
It is seen in Figure 7a,b that grain boundaries in the Sm2−xCaxZr2O7−x/2 (x = 0.05, 0.1) pyrochlore solid solutions also have proton conductivity. Grain-boundary conductivity in wet air exceeds that in dry air. In addition, Figure 7a,b illustrates the relationship between bulk and grain-boundary conductivities in dry and wet air. It is seen that, in this case, the total conductivity is determined by the bulk component in all of the samples except Sm2−xCaxZr2O7−x/2 (x = 0.1) (Figure 7b). In Sm2−xCaxZr2O7−x/2 (x = 0.1), the total conductivity is limited by grain-boundary conductivity below 650 °C and by bulk conductivity in the range of 650–750 °C. In contrast to Sr-doped gadolinium zirconates and hafnates [28,34] and Sr-doped lanthanum zirconate [18], where the total conductivity is limited by grain-boundary conductivity, an opposite situation occurs for Sm2−xCaxZr2O7−x/2 (x = 0.05). In both dry and wet air, the grain boundaries in the Sm2−xCaxZr2O7−x/2 (x = 0.05) solid solution (3 × 10⁻³ S/cm at 600 °C) have a factor of 5–10 higher conductivity in comparison with the grain bulk (7.5 × 10⁻⁴ S/cm at 600 °C) (Figure 7). The grain-boundary conductivity of the Sm2−xCaxZr2O7−x/2 (x = 0.1) solid solution (5% Ca substitution) is slightly lower than that of Sm2−xCaxZr2O7−x/2 (x = 0.05) (Figure 7). The difference between the bulk and grain-boundary conductivity contributions decreases with increasing substitution degree in Sm2−xCaxZr2O7−x/2 (x = 0.05, 0.1), which is obviously due to an increase in structural disorder inside of Sm2−xCaxZr2O7−x/2 (x = 0.1) grains owing to the grain-boundary CaZrO3 perovskite-based phase formation.
The total conductivity of the Sm2−xCaxZr2O7−x/2 (x = 0, 0.05, 0.1) series in dry and wet air is presented in Figure 8. It is seen that, in both dry and wet air, the total conductivity decreases with increasing Ca content below 600 °C.
Perovskite CaZrO3 exists in two polymorphs: orthorhombic (at low temperatures) and cubic (at high temperatures), with a transition between them near 1950 °C [48]. The conductivity of unsubstituted perovskite CaZrO3, whose typical lines are present in the XRD pattern of Sm2−xCaxZr2O7-d (x = 0.1) (Figure 1, scan 3; the lines of the CaZrO3 impurity phase are marked by asterisks), is markedly lower: ~6 × 10⁻⁵ S/cm at 600 °C [49]. Ca1-xZrO3-δ (0 ≤ x ≤ 1) ceramics with cation nonstoichiometry have mixed proton–hole conductivity [49], which decreases with increasing cation nonstoichiometry. At the same time, there is a widely known pioneering study of the proton conductivity of rare-earth-doped calcium, strontium, and barium zirconates with the perovskite structure [50]. Iwahara et al. [50] failed to obtain high-density ceramics for electrochemical measurements in the case of CaZrO3-based solid solutions doped with Y, Nd, Dy, and Yb on the Zr site. Such ceramics were produced only for Al, Ga, In, and Sc dopants and had proton conductivity above 1.3 × 10⁻⁴ S/cm at 600 °C. In a recent study [51], glycine–glycerin–nitrate combustion synthesis followed by annealing at 1500 °C for 5 h made it possible to obtain dense (98%) CaZr0.95Sc0.05O3-δ ceramics with an orthorhombically distorted pyrochlore structure (sp. gr. Pnma) and 600 °C proton conductivity as high as 6 × 10⁻⁴ S/cm. Therefore, the proton conductivity of CaZrO3 doped with rare earths, including Sm and Gd, can be rather high, suggesting that proton conductivity can contribute to the grain-boundary conductivity of the synthesized Sm2−xCaxZr2O7−x/2 (x = 0.05, 0.1) pyrochlore solid solutions. In this context, there is considerable interest in a study by Davies et al. [52], who analyzed the proton conductivity of CaZrO3 doped with large (La and Nd) and small (Yb and Sc) rare-earth cations using EXAFS and computer simulation. The highest proton conductivity was found in CaZrO3 doped with the small cations on the Zr site: CaZr0.95R0.05O3-δ (R = Yb, Sc). In this study, Sm and Gd—intermediate rare-earth cations—can act as dopants on the Zr site.
As mentioned above, undoped CaZrO3 undergoes an orthorhombic (sp. gr. Pnma)–cubic (sp. gr. Pm3m) polymorphic transformation at 1950 °C [48]. It is reasonable to expect high proton conductivity of the Sm doped CaZrO3 perovskite phase (~ 4 × 10⁻³ S/cm at 600 °C (Figure 7)) [35] forming on grain boundaries of pyrochlore Sm2Zr2O7 based phase used as substrates for the growth of high-conductivity cubic perovskite Sm doped CaZrO3 phase at 1600 °C.

3.5. Conductivity of the Gd2−xCaxZr2O7−x/2 (x = 0.05, 0.1) Solid Solutions in Dry and Wet Air

We failed to separately assess the grain-boundary conductivity of the Gd1.95Ca0.05Zr2O6.975 solid solution, so Figure 9 and Table 4 present the activation energy for the total conductivity of Gd2Zr2O7 (it was synthesized using mechanical activation and annealing at 1500 °C for 36 h and its conductivity was measured in ambient air [35]), Gd1.95Ca0.05Zr2O6.975 and Gd1.9Ca0.1Zr2O6.95 in dry and wet air (this work). It is seen that Ca doping has a negligible effect on the Arrhenius plot and that the Gd2−xCaxZr2O7−x/2 (x = 0.05, 0.1) solid solutions have no proton conductivity. In a previous study, Fournier et al. [26], who synthesized a Gd2−xCaxZr2O7−x/2 (x = 0, 0.05, 0.2, 0.3) series at 1700 °C, observed a marked reduction in the total conductivity with increasing Ca content in air, and, most likely, this is due to the transition from pyrochlore structure to fluorite. Unfortunately, structural studies in Reference [26] were not conducted. In the present work, the synthesis temperature was below (1600 ° C) and throughout the Gd2−xCaxZr2O7−x/2 (x = 0, 0.05, 0.1) series (Figure 9), the total conductivity at 600 °C was actually the same and is ~ (3–5) × 10−4 S/cm.
Recall that Gd2Zr2O7 is the most disordered pyrochlore oxide in the rare-earth zirconate family. It is probably for this reason that Ca doping of highly disordered pyrochlore solid solutions has no advantageous effect, especially at such high temperatures of synthesis as 1600–1700 °C, since under these conditions not pyrochlores, but fluorites are formed. Therefore, the conductivity of pyrochlore Sm2−xCaxZr2O7−x/2 (x = 0.05) is slightly higher: 8 × 10⁻⁴ S/cm at 600 °C (Figure 6), than that of fluorite Gd2−xCaxZr2O7−x/2 (x = 0.05).
Figure 10 compares the bulk and grain-boundary conductivities of the Gd2−xCaxZr2O7-d (x = 0.1) solid solution, for which we were able to separately assess these components. It is seen that, like in the Sm series, there is grain-boundary proton conductivity (below 700 °C) and that the grain-boundary conductivity is an order of magnitude higher than the bulk conductivity in a wide temperature range: 440–700 °C. According to Figure 9, there is no bulk proton conductivity in the Gd series, but the Gd2−xCaxZr2O7−x/2 (x = 0.1) solid solution has grain-boundary proton conductivity (Figure 10). The loss of bulk proton conductivity in Gd2−xCaxZr2O7−x / 2 (x = 0.05) can be associated with a high degree of disordering of its pyrochlore structure. If we calculate Gd2−xCaxZr2O7−x/2 (x = 0.05) as disordered pyrochlore, we obtain that Gd2−xCaxZr2O7−x/2 (x = 0.05) contains 36–50% anti-site pair (Table 2 and Table S2) and is actually fluorite. The loss of the preferred directions for bulk proton transfer is associated with a strong disordering of the pyrochlore structure, despite hydrophilic properties of Gd2−xCaxZr2O7−x/2 (x = 0.05, 0.1) pyrochlores (Figure 4c). The slight weight loss (Figure 4c) found in TG experiments for Gd2−xCaxZr2O7−x/2 (x = 0.1) is most likely related to the proton component of the Gd-doped CaZrO3-δ perovskite.
As in the case of the Sm2−xCaxZr2O7−x/2 (x = 0.1) solid solution, we assume that a high-conductivity of Gd-doped phase is due to cubic perovskite CaZrO3, which could be present on grain boundaries of Gd2−xCaxZr2O7−x/2 (x = 0.1), with conductivity a factor of 2.5 higher than that of Sm doped CaZrO3 (Figs.10 and 7 b). Recently the admixture of CaZrO3 was observed for the same composition Gd1.9Ca0.1Zr2O6.95, obtained by a hydrothermal process followed by annealing at 1500 °C for 4 h [38]. Note that, unlike SrZrO3 and SrHfO3 [28,34], the intergranular Gd-doped CaZrO3 phase has higher conductivity (both the oxygen-ion and proton components) and does not limit the total conductivity of the material.

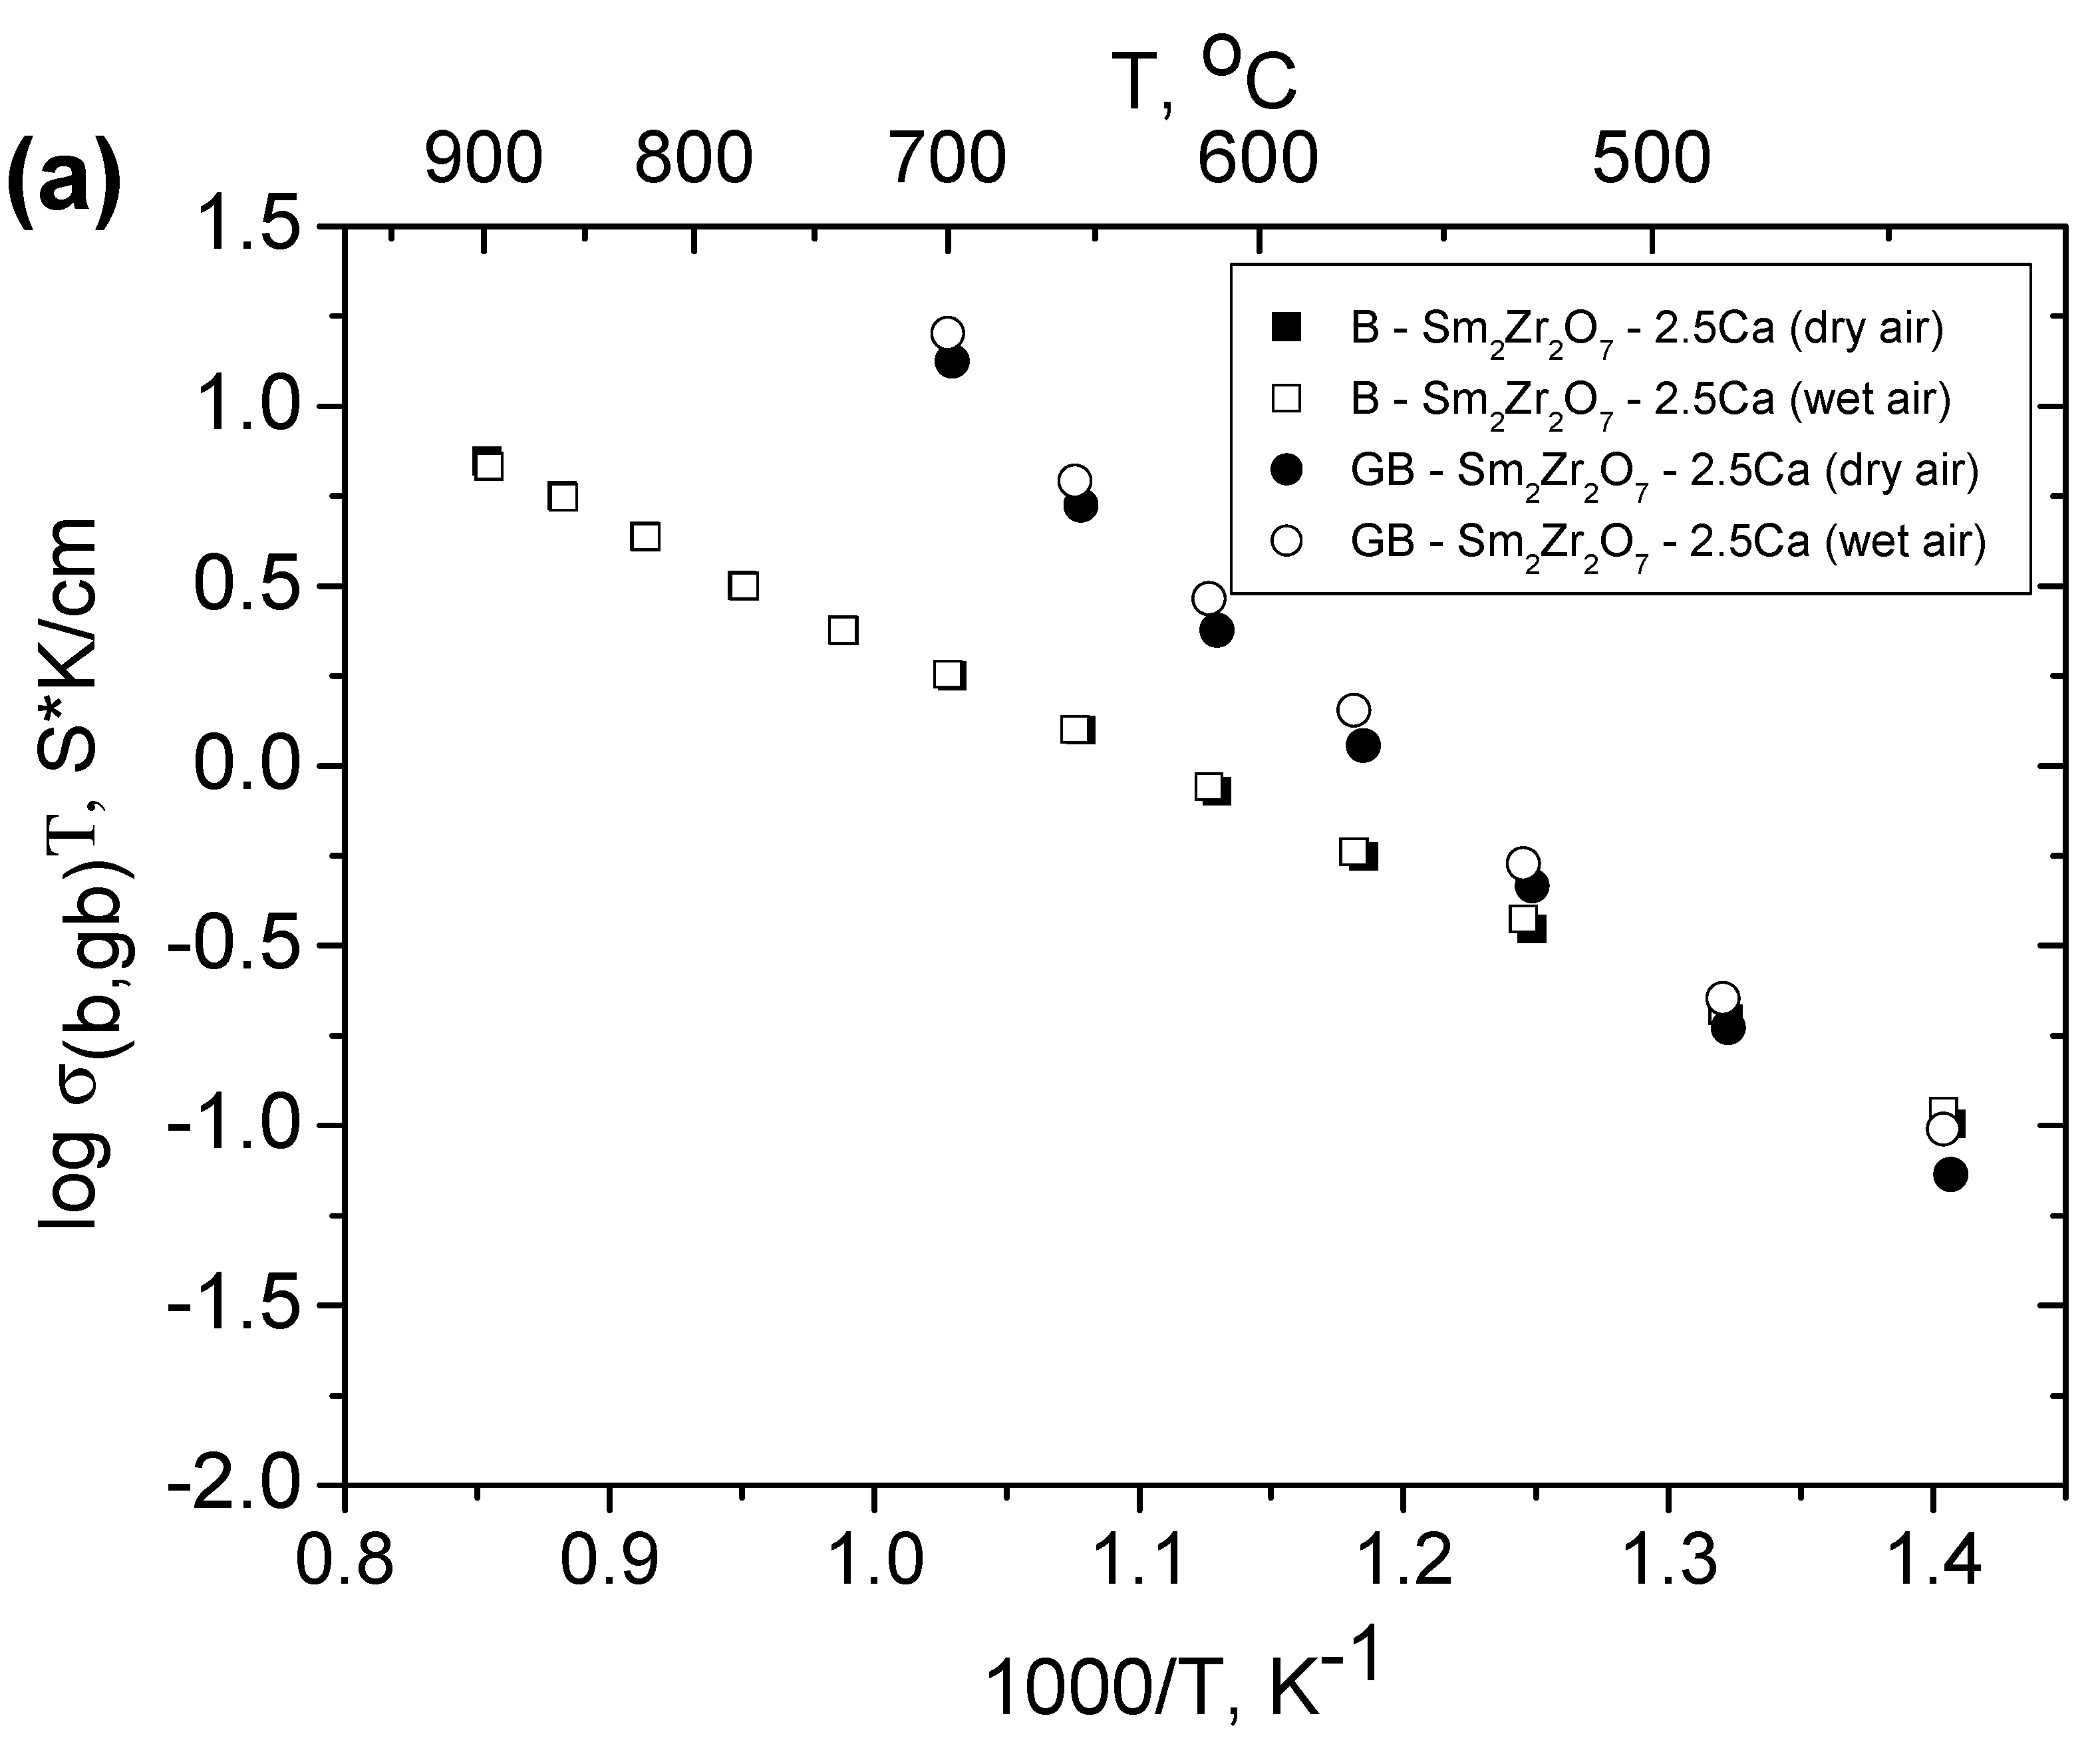
3.6. Relationship between the Grain Boundary and Bulk Conductivities of Ordered and Disordered Pyrochlores

Perriot et al. [53] performed molecular dynamics simulations to investigate the role of grain boundaries (GBs) on ionic diffusion in pyrochlores as a function of the GBs type, Ln/M ratio and level of cation disorder in Ln2M2O7 pyrochlores. They reported that in highly disordered pyrochlores, the diffusive behavior at the GBs is bulk-like, and the two contributions (bulk and GB) can no longer be distinguished.
Analysis of the present data for disordered pyrochlore Gd2−xCaxZr2O7−x/2 (x = 0.05) (Table 2, Figure 1a) from this point of view also suggests that there is no distinction between the bulk and grain-boundary conductivities of this material (not shown here). Distinctions emerge at a higher degree of substitution, in Gd2−xCaxZr2O7−x/2 with x = 0.1 (Figure 10), due to the presence of an intergranular impurity phase with the perovskite structure. This is also evidenced by the calculation results in Table 2. Analysis of the Rietveld refinement results for disordered Gd2−xCaxZr2O7−x/2 (x = 0.05) indicates that this solid solution actually has the fluorite structure (Table 2). Then the bulk and grain-boundary conductivities of Gd2−xCaxZr2O7−x/2 (x = 0.1) can readily be distinguished (Figure 10) because of the formation of an intergranular CaZrO3 -based perovskite phase. In the opposite case, the bulk and grain-boundary conductivities would be the same for both compositions Gd2−xCaxZr2O7−x/2 (x = 0.05, 0.1).
In the case of the more ordered pyrochlore zirconate Sm2−xCaxZr2O7−x/2 (x = 0.05), the bulk and grain-boundary conductivities can readily be distinguished and the latter is markedly higher (Figure 7a,b). The calculation results in Table S1 indicate the presence of ~ 2–3 % cation anti–site pairs (SmZr + ZrSm) in Sm2−xCaxZr2O7−x/2 (x = 0.05), along with Ca substitution on the Sm site. With Ca doping increasing, the disorder in Sm2−xCaxZr2O7−x/2 (x = 0.1) pyrochlore increases due to the deviation of the stoichiometry of the grain interior because formation of the intergranular Sm doped CaZrO3 phase. As a result, the difference between the bulk and grain-boundary components decreases (Figure 7a,b).
If bulk conductivity decreases and grain-boundary conductivity rises with dopant concentration in the samples obtained at high temperature T ≥ 1600 °C, this is most likely due to the formation of a new, intergranular phase, accompanied by deviations from stoichiometry in the grain bulk. The likely reason for this effect is that the degree of substitution exceeds the solubility limit in the pyrochlore phase with a given Ln/M (M = Ti, Zr, Hf, Sn) ratio. If both bulk and grain-boundary conductivities increase with dopant concentration, the dopant is most likely evenly distributed between the grain bulk and grain boundaries of the ordered pyrochlore phase, as in the case of Ca-, Mg-, and Zn-doped Ln2Ti2O7 (Ln = Dy, Ho, Yb) [54].
Raising the Ca concentration to above the optimal one at a given temperature leads to deviations from stoichiometry in the grain bulk and second-phase (perovskite) precipitation on grain boundaries. Heating of doped pyrochlores also leads to deviations from stoichiometry in the grain bulk and second-phase precipitation on grain boundaries. In the case of doping of pyrochlores with a lower degree of cation disorder (less than 4.5% antistructure pairs; e.g., Yb2Ti2O7 [55]), an effective dopant of suitable size is evenly distributed between the grain bulk and grain boundaries, increasing the oxygen vacancy concentration both in the grain bulk and on grain boundaries.
It is interesting to note that in Reference [29], where the synthesis of the Sm2−xCaxZr2O7−x/2 series was carried out at a higher temperature of 1700 °C, the degree of substitution of Ca for Sm in the Sm2−xCaxZr2O7−x/2 was x = 0.025, and in this paper, where the synthesis was carried out at 1600 °C, the degree of substitution is 0.05 ≤ x ≤ 0.1.

3.7. Oxygen–Ion Conductivity of the Sm2−xCaxZr2O7−x/2 (x = 0.05, 0.1), Gd2−xCaxZr2O7−x/2 (x = 0.1) Solid Solutions in the 700 ≤ T≤ 950 °C Temperature Interval

The total conductivity measurements as a function of oxygen partial pressure of Sm2−xCaxZr2O7−x/2 (x = 0.05, 0.1) (Figure 11a,b) and Gd2−xCaxZr2O7−x/2 (x = 0.1) (Figure 11c), shows a typical ionic conductivity plateau, which should be attributed to the intrinsic and extrinsic oxygen vacancies co-existed in the structure.
For the Ca-doped Sm2Zr2O7 pyrochlore the increase of Ca content enhances the ionic conductivity as expected due to the positive oxygen vacancies formation the compensate for the addition of the negative defect CaSm´. For the higher Ca content composition (x = 0.1) the oxygen partial pressure dependences suggest that the extrinsic behavior dominates, while for the composition with lower Ca content (x = 0.05), a slight increase of the conductivity was observed at low oxygen partial pressures, which suggests that the intrinsic n-type conductivity can start to contribute to the overall conductivity for this working conditions. It can be assumed that, at 0.05 < x < 0.1, the maximum of calcium doping of the gadolinium sublattice is reached, as a result of which optimal values of ionic conductivity are obtained. However, at x = 0.1, a proton-conducting phase with a perovskite structure is formed at the grain boundaries.
For the disordered Ca-doped Gd2Zr2O7 solid solution with fluorite structure, the extrinsic behavior was also founded for x = 0.1 composition, however with a slight lower conductivity than the correspondent composition with x = 0.1 for the Ca- doped Sm2Zr2O7. Structural differences and the possible occurrence of second phases in both systems can justify these differences in conductivity.
The possibility of having n-type conductivity for high oxygen partial pressures is not evident, and there are also no changes in the activation energy values between high and low oxygen pressures, suggesting the same conductivity mechanism in all oxygen partial pressure ranges. In this temperature range, due to differences in activation energies, the overall conductivity is controlled by the bulk resistance, so possible changes in the grain-boundary conductivity mechanism are not observed. It should be noted that in this temperature range the impedance spectra only show the arc corresponding to the electrode/interface behavior and it is only possible to determine the total conductivity, which occurs in the left intersection of this arc with the x-axis.

4. Conclusions

Doping with divalent Ca cations increases the conductivity of the rare-earth zirconates and titanates only if they have the pyrochlore structure, and the effect is larger for ordered Ln2Zr2O7 (Ln = La) and Ln2Ti2O7 (Ln = Dy – Yb) pyrochlores [55]. In the case of highly disordered pyrochlores near the pyrochlore–fluorite morphotropic phase boundary, there is no such effect. In undoped Sm2Zr2O7, the concentration of intrinsic oxygen vacancies responsible for proton transport much lower than that in Sm2−xCaxZr2O7−d (x = 0.05, 0.1) Ca-doped solid solutions. Extrinsic oxygen vacancies, as a result of Ca-doping process, to a greater degree than that of intrinsic vacancies can be involved in the formation of mobile protons.
The 500 °C proton conductivity contribution of Sm2−xCaxZr2O7−x/2 (x = 0.05, 0.1) is ~ 1 × 10⁻⁴ S/cm. Sm2−xCaxZr2O7−x/2 (x = 0.05, 0.1) solid solutions have proton conductivity both in the grain bulk and on grain boundaries, in agreement with TG data, and below 600 °C their bulk oxygen–ion and proton conductivity decreases with increasing Ca-doping level, but at the same time, the effect of the influence of the wet atmosphere on conductivity increases. It is possible that Ca doping decreases the ionic (oxygen-ion and proton) conductivity owing to the decreasing of unit cell volume because the change of Ca coordination number from 8 to 7 in the pyrochlore structure exists at low temperatures or it is possible due to the negative effect of deviation from stoichiometry inside of grain bulk of Sm2−xCaxZr2O7−x/2 (x = 0.1).
The Ca-doping effect exists in Sm2−xCaxZr2O7−x/2 (x = 0. 0.05, 0.1) solid solutions above 700 °C, where they are pure oxygen-ion conductors: the bulk conductivity of the Ca-doped solid solutions exceeds that of undoped Sm2Zr2O7 and the region of dominant oxygen conductivity increases with increasing dopant concentration.
The highly disordered Gd2−xCaxZr2O7−x/2 (x = 0.1) pyrochlore has oxygen-ion bulk conductivity, whereas proton transport contributes to its grain-boundary conductivity. The loss of bulk proton conductivity in Gd2−xCaxZr2O7−x/2 (x = 0.05, 0.1) can be associated with formation of the fluorite structure. Ca-doping of highly disordered pyrochlores (containing ~8% or more anti-site pairs [44,45]) usually reduces their bulk conductivity.
In both series, grain-boundary conductivity exceeds bulk conductivity in the temperature range up to 700–750 °C. In the case of Gd2−xCaxZr2O7−x/2 (x = 0.1), they differ by an order of magnitude. As a result of the pyrochlore-to-fluorite morphotropic phase transition, bulk proton conductivity disappears and oxygen-ion conductivity decreases. The high grain-boundary proton conductivity of Ln2−xCaxZr2O7−x/2 (Ln = Sm, Gd; x = 0.05, 0.1) is attributable to the formation of a CaZrO3-based impurity phase doped with Sm or Gd, respectively, the composition of which is assumed to be CaZr1−xLnxO3−δ (Ln = Sm, Gd).
We believe that, in the synthesis of Ca- and Sr-doped rare-earth zirconates with the pyrochlore structure, the ceramics preparation temperature plays an important role. After high-temperature synthesis near 1600 °C and above, there is typically a grain-boundary contribution to conductivity and, accordingly, the bulk and grain-boundary contributions can be separated. Grain-boundary conductivity often limits the total conductivity, but may have an advantageous effect, exceeding bulk conductivity. As a result, the process is only limited by bulk conductivity. In most cases, grain-boundary conduction in divalently doped pyrochlore zirconates after annealing at ~1600 °C and higher temperatures is due to deviations from stoichiometry in the grain bulk and the formation of MZrO3–based (M = Ca, Sr) impurity phases, which increase or decrease grain-boundary conductivity.
Another factor favourable for this process (grain-boundary conduction appearance) is the ratio of the ionic radii of the host and dopant cations in the pyrochlore structure. For example, Ca is too large dopant for the Ln2Zr2O7 (Ln = Sm, Gd) pyrochlores and, according to the present results, the Ln2−xCaxZr2O7−x/2 (Ln = Sm, Gd; x = 0.1) materials (doped with just 5% Ca) contain a proton-conducting intergranular impurity phase.
The results of the study of bulk proton conductivity contribution in Sm2Zr2O7 and Gd2−xCaxZr2O7−x/2 (x = 0.1) with disordered pyrochlore and fluorite structure, respectively, show that the bulk proton conductivity in them is insignificant or absent.
The optimal value of Ca doping for proton conductivity in Sm2−xCaxZr2O7−x/2 (x = 0, 0.05, 0.1) is found at 0.05 < x < 0.1, which corresponds to theoretical calculations x = 0.08 [30].
To sum up, this work presents the oxygen-ion/proton and bulk/gb conductivity ratios for the Sm2−xCaxZr2O7−x/2 (x = 0, 0.05, 0.1) pyrochlores and Gd2−xCaxZr2O7−x/2 (x = 0.05, 0.1) fluorites, shows the relationship between high values of conductivity (oxygen–ion and proton) of 3+/4+ pyrochlores and location of 3+/4+ pyrochlores near morphotropic boundaries, analyzes optimal temperature annealing and optimal dopant concentration for different rare-earth zirconates as potential materials for proton-conducting fuel cells (PC-SOFCs).

Supplementary Materials

The following are available online at https://www.mdpi.com/1996-1944/12/15/2452/s1, Table S1. Comparison of Rietveld refinement factors for Sm1.95Ca0.05Zr2O6.975 composition, Table S2. Comparison of Rietveld refinement factors for Sm1.9Ca0.1Zr2O6.95 composition, Figure S1. Mapping of the area with the micron-size agglomerate formed from small grains (Figure 3c): (a) Ca; (b) Zr; (c) Sm; (d) overlapping of the maps for individual elements.

Author Contributions

Data curation, E.G.; formal analysis, J.C.C.A. and S.A.C.; funding acquisition, N.V.L.; methodology, A.V.S.; resources, E.Y.K.; software, E.P.K.; supervision, O.K.K.; validation, I.V.K.; Writing–review & editing, L.G.S.

Funding

This research was funded by Institute of Chemical Physics Russian Academy of Science 0052-2014-001, state registration number АААА-А17-111711600093–8.

Conflicts of Interest

The authors declare no conflict of interest.

References

  1. Yamazaki, Y.; Hernandez-Sanchez, R.; Haile, S.M. Cation non-stoichiometry in yttrium-doped barium zirconate: phase behavior, microstructure, and proton conductivity. J. Mater. Chem. 2010, 20, 8158–8166. [Google Scholar] [CrossRef] [Green Version]
  2. Wuensch, B.J.; Eberman, K.W.; Heremans, C.; Ku, E.M.; Onnerud, P.; Yeo, E.M.E.; Haile, S.; Stalik, J.K.; Jorgensen, J.D. Connection between oxygen-ion conductivity of pyrochlore fuel-cell materials and structural change with composition and temperature. Solid State Ion. 2000, 129, 111–133. [Google Scholar] [CrossRef]
  3. Moon, P.K.; Tuller, H.L. Ionic conduction in the Gd2Ti2O7−Gd2Zr2O7 system. Solid State Ion. 1988, 28–30, 470–474. [Google Scholar] [CrossRef]
  4. Tuller, H.L. Oxygen ion conduction and structural disorder in conductive oxides. J. Phys. Chem. Solids 1994, 55, 1393–1404. [Google Scholar] [CrossRef]
  5. Heremans, C.; Wuensch, B.J.; Stalick, J.K.; Prince, E. Fast-Ion Conducting Y2(ZryTi1−y)2O7 pyrochlores: Neutron rietveld analysis of disorder induced by Zr substitution. Solid State Chem. 1995, 117, 108–121. [Google Scholar] [CrossRef]
  6. Yamamura, H.; Nishino, H.; Kakinuma, K.; Nomura, K. Electrical conductivity anomaly around fluorite-pyrochlore phase boundary. Solid State Ion. 2003, 158, 359–365. [Google Scholar] [CrossRef]
  7. Diaz-Guillen, M.R.; Moreno, K.J.; Diaz-Guillen, J.A.; Fuentes, A.F.; Ngai, K.L. Garcia-Barriocanal, J.; Santamaria, J.; Leon, C. Cation size effects in oxygen ion dynamics of highly disordered pyrochlore-type ionic conductors. Phys. Rev. B 2008, 78, 104304. [Google Scholar] [CrossRef]
  8. Shlyakhtina, A.V.; Shcherbakova, L.G. Polymorphism and high-temperature conductivity of Ln2M2O7 (Ln = Sm-Lu, M= Ti, Zr, Hf) pyrochlores. Solid State Ion. 2011, 192, 200–204. [Google Scholar] [CrossRef]
  9. Shlyakhtina, A.V.; Shcherbakova, L.G. New solid electrolytes of the pyrochlore family. Russ. J. Electrochem. 2012, 1, 1–25. [Google Scholar] [CrossRef]
  10. Shukla, R.; Vasundhara, K.; Krishna, P.S.R.; Shinde, A.B.; Sali, S.K.; Kulkarni, N.K.; Achary, S.N.; Tyagi, A.K. High temperature structural and thermal expansion behavior of pyrochlore-type praseodymium zirconate. Int. J. Hydrogen Energy 2015, 40, 15672–15678. [Google Scholar] [CrossRef]
  11. Gill, J.K.; Pandey, O.P.; Singh, K. Role of sintering temperature on thermal, electrical and structural properties of Y2Ti2O7 pyrochlores. Int. J. Hydrogen Energy 2011, 36, 14943–14947. [Google Scholar] [CrossRef]
  12. Zhang, X.; Peng, L.; Fang, X.; Cheng, Q.; Liu, W.; Peng, H.; Gao, Z.; Zhou, W.; Wang, X. Ni/Y2B2O7 (B = Ti, Sn, Zr and Ce) catalysts for methane steam reforming: On the effects of B site replacement. Int. J. Hydrogen Energy 2018, 43, 8298–8312. [Google Scholar] [CrossRef]
  13. Shlyakhtina, A.V.; Abrantes, J.C.C.; Gomes, E.; Shchegolikhin, A.N.; Vorobieva, G.A.; Maslakov, K.I.; Shcherbakova, L.G. Effect of Pr3+/Pr4+ ratio on the oxygen ion transport and thermomechanical properties of the pyrochlore and fluorite phases in the ZrO2–Pr2O3 system. Int. J. Hydrogen Energy 2016, 41, 9982–9992. [Google Scholar] [CrossRef]
  14. Valdés-Ibarra, M.R.; Díaz-Guillén, J.A.; Padmasree, K.P.; Montemayor, S.M.; Rodríguez-Varela, F.J.; Fuentes, A.F. Oxygen ion conducting pyrochlore oxides prepared by an ultrasound-assisted wet chemistry route: Ca-doped Gd2Ti2O7 nanocrystals. Int. J. Hydrogen Energy 2019, 44, 12515–12524. [Google Scholar] [CrossRef]
  15. Shlyakhtina, A.V.; Savvin, S.N.; Levchenko, A.V.; Knotko, A.V.; Fedtke, P.; Busch, A.; Barfels, T.; Wienecke, M.; Shcherbakova, L.G. Study of bulk and grain-boundary conductivity of Ln2+xHf2−xO7-δ (Ln = Sm-Gd; x = 0, 0.096) pyrochlores. J. Electroceram. 2010, 24, 300–307. [Google Scholar] [CrossRef]
  16. Fedtke, P.; Shlyakhtina, A.V.; Busch, A.; Barfels, T.; Wienecke, M.; Shcherbakova, L.G. Effect of oxygen partial pressure on the bulk and grain-boundary components of conductivity in (Yb1-xCax)2Ti 2O7-δ (x = 0, 0.05, 0.1) solid solutions. Mater. Res. Bull. 2013, 48, 2707–2711. [Google Scholar] [CrossRef]
  17. Shlyakhtina, A.V.; Belov, D.A.; Stefanovich, S.Y.; Nesterova, E.A.; Karyagina, O.K.; Shcherbakova, L.G. Optimization of synthesis conditions for rare-earth titanate based oxygen ion conductors. Solid State Ion. 2013, 230, 52–58. [Google Scholar] [CrossRef]
  18. Huo, D.; Baldinozzi, G.; Simeone, D.; Khodja, H.; Surble, S. Grain size—Dependent electrical properties of La1.95Sr0.05Zr2O7-δ as potential proton ceramic fuel cell electrolyte. Solid State Ion. 2016, 298, 35–43. [Google Scholar] [CrossRef]
  19. van Dijk, M.P.; Mijlhoff, F.C.; Burggraaf, A.J. Pyrochlore microdomain formation in fluorite Oxides. J. Solid State Chem. 1986, 62, 377–385. [Google Scholar] [CrossRef]
  20. Tsipis, E.V.; Shlyakhtina, A.V.; Shcherbakova, L.G.; Kolbanev, I.V.; Kharton, V.V.; Vyshatko, N.P.; Frade, J.R. Mechanically-Activated Synthesis and Mixed Conductivity of TbMO4−δ (M. = Zr, Hf) Ceramics. J. Electroceram. 2003, 10, 153–164. [Google Scholar] [CrossRef]
  21. Rejith, R.S.; Thomas, J.K.; Solomon, S. Structural, optical and impedance spectroscopic characterizations of RE2Zr2O7 (RE = La, Y) ceramics. Solid State Ion. 2018, 323, 112–122. [Google Scholar] [CrossRef]
  22. Labrincha, J.A.; Frade, J.R.; Marques, F.M.B. Protonic conduction in La2Zr2O7—Based pyrochlore materials. Solid State Ion. 1997, 99, 33–40. [Google Scholar] [CrossRef]
  23. Omata, T.; Otsuka-Yao-Matsuo, S. Electrical properties of proton-conducting Ca2+—Doped La2Zr2O7 with a pyrochlore-type structure. J. Electrochem. Soc. 2001, 148, E252–E261. [Google Scholar] [CrossRef]
  24. Antonova, E.P.; Farlenkov, A.S.; Tropin, E.S.; Eremin, V.A.; Khodimchuk, A.V.; Ananiev, M.V. Oxygen isotope exchange, water uptake and electrical conductivity of Ca-doped lanthanum zirconate. Solid State Ion. 2017, 306, 112–117. [Google Scholar] [CrossRef]
  25. Omata, T.; Ikeda, K.; Tokashiki, R.; Otsuka-Yao-Matsuo, S. Proton solubility for La2Zr2O7 with a pyrochlore structure doped with a series of alkaline-earth ions. Solid State Ion. 2004, 167, 389–397. [Google Scholar] [CrossRef]
  26. Fournier, T.; Nots, J.Y.; Muller, J.; Joubert, J.C. Conductivite ionique des phases de type pyrochlore Gd2−xCaxZr2O7−x/2 et Gd2−xCaxSc2O7−x/2. Solid State Ion. 1985, 15, 71–74. [Google Scholar] [CrossRef]
  27. Moriga, T.; Yoshiasa, A.; Kanamaru, F.; Koto, K.; Yoshimura, M.; Somiya, S. Crystal structure analyses of the pyrochlore and fluorite—Type Zr2Gd2O7 and anti-phase domain structure. Solid State Ion. 1989, 31, 319–328. [Google Scholar] [CrossRef]
  28. Govindan Kutty, K.V.; Mathews, C.K.; Rao, T.N.; Varadaraju, U.V. Oxide ion conductivity in some substituted rare earth pyrozirconates. Solid State Ion. 1995, 80, 99–110. [Google Scholar] [CrossRef]
  29. Xia, X.-L.; Ouyang, J.-H.; Liu, Z.-G. Influence of CaO on structure and electrical conductivity of pyrochlore –type Sm2Zr2O7. J. Powder Sources 2009, 189, 888–893. [Google Scholar] [CrossRef]
  30. Eurenius, K.E.J.; Ahlberg, E.; Knee, C.S. Role of B-site ion on proton conduction in acceptor-doped Sm2B2O7-δ (B = Ti, Sn, Zr and Ce) pyrochlores and C-type compounds. Dalton Trans. 2011, 40, 3946–3954. [Google Scholar] [CrossRef]
  31. Shimura, T.; Komori, M.; Iwahara, H. Ionic conduction in pyrochlore—Type oxides containing rare-earth elements at high temperature. Solid State Ion. 1996, 86–88, 685–689. [Google Scholar] [CrossRef]
  32. Shlyakhtina, A.V.; Pigalskiy, K.S.; Belov, D.A.; Lyskov, N.V.; Kharitonova, E.P.; Kolbanev, I.V.; Borunova, A.B.; Karyagina, O.K.; Sadovskaya, E.M.; Sadykov, V.A.; et al. Proton and oxygen ion conductivity in the pyrochlore/fluorite family of Ln2−xCaxScMO7−δ (Ln = La, Sm, Ho, Yb; M = Nb, Ta; x = 0, 0.05, 0.1) niobates and tantalates. Dalton Trans. 2018, 47, 2376–2392. [Google Scholar] [CrossRef] [PubMed]
  33. Shenu, A. Structural Analysis and Its Implications for Oxide ion Conductivity of Lanthanide Zirconate Pyrochlores. PhD Thesis, School of Biological and Chemical Sciences, Queen Mary University of London, London, UK, 2018. [Google Scholar]
  34. Govindan Kutty, K.V.; Mathews, C.K.; Varadaraju, U.V. Effect of aliovalent ion substitution on the oxide ion conductivity in rare-earth pyrohafnates RE2−xSrxHf2O7−δ and RE2Hf2−xAlxO7− δ (RE = Gd and Nd; x = 0, 0.1, and 0.2). Solid State Ion. 1998, 110, 335–340. [Google Scholar]
  35. Moreno, K.J.; Fuentes, A.F.; Garcia-Barriocanal, J.; Leon, C.; Santamaria, J. Mechanochemical synthesis and ionic conductivity in the Gd2(Sn1−yZry)2O7 (0 ≤ y ≤ 1) solid solution. J. Solid State. Chem. 2006, 179, 323–330. [Google Scholar] [CrossRef]
  36. Foex, M.; Traverse, J.-P.; Coutures, J. Etude dela structure crystalline des zirconates alcalino-terreux a haute temperature. CR Acad. Sci. Ser. C 1967, 264, 1837–1840. [Google Scholar]
  37. Subramanian, M.A.; Aravamudan, G.; Subba Rao, G.V. Oxide pyrochlores—A review. Prog. Solid State Chem. 1983, 15, 55–143. [Google Scholar] [CrossRef]
  38. Zhong, F.; Zhao, J.; Shi, L.; Xiao, Y.; Cai, G.; Zheng, Y.; Long, J. Alkalin-Earth Metals-Doped Pyrochlore Gd2Zr2O7 as oxygen conductors for improved NO2 sensing performance. Sci. Rep. 2017, 7, 4684. [Google Scholar] [CrossRef] [PubMed]
  39. Kochedykov, V.A.; Zakir’yanova, I.D.; Korzun, I.V. Study of thermal decomposition of products of interaction of REE oxides with the components of the air atmosphere. Anal. Kontrol. 2005, 9, 58–63. [Google Scholar]
  40. Colomban, P. Proton and Protonic Species: The Hidden Face of Solid State Chemistry. How to Measure H-Content in Materials? Fuel Cells 2013, 13, 6–18. [Google Scholar] [CrossRef]
  41. López-Vergara, A.; Porras-Vázquez, J.M.; Infantes-Molina, A.; Canales-Vázquez, J.; Cabeza, A.; Losilla, E.R.; Marrero-López, D. Effect of preparation conditions on the polymorphism and transport properties of La6−xMoO12−δ (0 ≤ x ≤ 0.8). Chem. Mater. 2017, 29, 6966–6975. [Google Scholar] [CrossRef]
  42. Shlyakhtina, A.V.; Knotko, A.V.; Boguslavskii, M.V.; Stefanovich, S.Y.; Kolbanev, I.V.; Larina, L.L.; Shcherbakova, L.G. Effect of non-stoichiometry and synthesis temperature on the structure and conductivity of Ln2+xM2−xO7−x/2(Ln = Sm-Gd; M = Zr, Hf; x = 0–0.286). Solid State Ion. 2007, 178, 59–66. [Google Scholar] [CrossRef]
  43. Shlyakhtina, A.V.; Belov, D.A.; Knotko, A.V.; Avdeev, M.; Kolbanev, I.V.; Vorobieva, G.A.; Karyagina, O.K.; Shcherbakova, L.G. Oxide ion transport in (Nd2−xZrx)Zr2O7+δ electrolytes by an interstitial mechanism. J. Alloys Compd. 2014, 603, 274–281. [Google Scholar] [CrossRef]
  44. Shlyakhtina, A.V.; Belov, D.A.; Knotko, A.V.; Kolbanev, I.V.; Streletskii, A.N.; Karyagina, O.K.; Shcherbakova, L.G. Oxygen interstitial and vacancy conduction in symmetric Ln2±xZr−± xO7± x/2 (Ln—Nd, Sm) solid solutions. Inorg. Mater. 2014, 50, 1035–1049. [Google Scholar] [CrossRef]
  45. Shlyakhtina, A.V.; Belov, D.A.; Knotko, A.V.; Kolbanev, I.V.; Streletskii, A.N.; Shcherbakova, L.G. Interstitial oxide ion conduction in (Sm2−xZrx)Zr2O7+δ. Solid State Ion. 2014, 262, 543–547. [Google Scholar] [CrossRef]
  46. Besikiotis, V.; Ricote, S.; Jensen, M.H.; Norby, T.; Haugsrud, R. Conductivity and hydration trends in disordered fluorite and pyrochlore oxides: A study on lanthanum cerate-zirconate based compounds. Solid State Ion. 2012, 229, 26–32. [Google Scholar] [CrossRef]
  47. Belov, D.A.; Shlyakhtina, A.V.; Stefanovich, S.Y.; Shchergolikhin, A.N.; Knotko, A.V.; Karyagina, O.K.; Shcherbakova, L.G. Antiferroelectric phase transition in pyrochlore-like (Dy1−xCax)2Ti2O7−δ (x = 0, 0.01) high-temperature conductors. Solid State Ion. 2011, 192, 188–194. [Google Scholar] [CrossRef]
  48. Du, Y.; Jin, Z.; Huang, P. Calculation of the Zirconia-Calcia System. J. Am. Ceram. Soc. 2005, 75, 3040–3048. [Google Scholar] [CrossRef]
  49. Hwang, S.C.; Choi, G.M. The effect of cation nonstoichiometry on the electrical conductivity of acceptor-doped CaZrO3. Solid State Ion. 2006, 177, 3099–3103. [Google Scholar] [CrossRef]
  50. Iwahara, H.; Yajima, T.; Hibino, T.; Ozaki, K.; Suzuki, H. Proton conduction in calcium, strontium, barium zirconates. Solid State Ion. 1993, 61, 65–69. [Google Scholar] [CrossRef]
  51. Lyagaeva, J.; Danilov, N.; Korona, D.; Farlenkov, A.; Medvedev, D.; Demin, A.; Animitsa, I.; Tsiakaras, P. Improved ceramic and electrical properties of CaZrO3-based proton-conducting materials prepared by a new convenient combustion synmethod. Ceram. Int. 2017, 43, 7184–7192. [Google Scholar] [CrossRef]
  52. Davies, R.A.; Islam, M.S.; Chadwick, A.V.; Rush, G.E. Cation dopant sites in the CaZrO3 proton conductor: A combined EXAFS and computer simulation study. Solid State Ion. 2000, 130, 115–122. [Google Scholar] [CrossRef]
  53. Perriot, R.; Dholabhai, P.P.; Uberiaga, B.P. Disorder-induced transition from grain boundary to bulk dominated ionic diffusion in pyrochlores. Nanoscale 2017, 9, 6826–6836. [Google Scholar] [CrossRef]
  54. Belov, D.A.; Shlyakhtina, A.V.; Stefanovich, S.Y.; Kolbanev, I.V.; Belousov, Y.A.; Karyagina, O.K.; Shcherbakova, L.G. Acceptor doping of Ln2Ti2O7 (Ln = Dy, Ho, Yb) pyrochlores with divalent cations (Mg, Ca, Sr, Zn). Mater. Res. Bull. 2009, 44, 1613–1620. [Google Scholar] [CrossRef]
  55. Shlyakhtina, A.V.; Knotko, A.V.; Boguslavskii, M.V.; Stefanovich, S.Y.; Peryshkov, D.V.; Kolbanev, I.V.; Shcherbakova, L.G. Effect of the synthesis procedure, doping and non-stoichiometry on the order-disorder transformation in Ln2Ti2O7 (Ln = Tm-Lu) oxygen-ion conductors. Solid State Ion. 2005, 176, 2297–2304. [Google Scholar] [CrossRef]
Figure 1. (а) XRD patterns of the Sm2−xCaxZr2O7−x/2(1) x = 0, (2) x = 0.05, (3) x = 0.1; (b) Rietveld data of Sm2−xCaxZr2O7−x/2 (x = 0.05) XRD pattern: the measured (blue line), the calculated (red line), the difference between measured and calculated data (green line). Vertical bars show calculated reflections for different phases Sm 1.95Ca0.05Zr2O6.975 (lower) and Si internal standard (upper). Rwp = 3.36%, Rp = 4.49%, Rexp = 3.47%, GOF = 1.34.
Materials 12 02452 g001
Figure 2. (a) XRD patterns of the Gd2−xCaxZr2O7−x/2 (1) x = 0.05, (2) x = 0.1, and (3) Gd1.9Mg0.1Zr2O6.95; (b) Rietveld data of Gd2−xCaxZr2O7−x/2 (x = 0.05) XRD pattern: the measured (blue line), the calculated (red line), the difference between measured and calculated data (green line). Vertical bars show calculated reflections for different phases Gd1.95Ca0.05Zr2O6.975 (lower) and Si internal standard (upper). Rwp = 2.92%, Rp = 3.67%, Rexp = 2.82%, GOF = 1.26.
Materials 12 02452 g002
Figure 3. SEM images of (a) Sm2Zr2O7 ceramics; (b) Sm1.9Ca0.1Zr2O6.95 ceramics; (c) the micron-size agglomerate formed from small grains in Sm1.9Ca0.1Zr2O6.95 ceramics.
Materials 12 02452 g003aMaterials 12 02452 g003b
Figure 4. TG curves for (a) newly synthesized sample Sm2Zr2O7 (1–1st heating–cooling; 2–2nd heating–cooling; 3–3rd heating–cooling cycles); (b) newly synthesized and hydrated for 4 weeks samples Sm1.9Ca0.1Zr2O6.95 (1–newly synthesized sample 1st heating; 2–hydrated sample 1st heating; 3–hydrated sample 2nd heating); (c) newly synthesized sample Gd1.9Ca0.1Zr2O6.95 (1–1st heating–cooling; 2–2nd heating–cooling cycles). The solid line indicates the heating stage, the dashed line indicates the cooling stage.
Materials 12 02452 g004aMaterials 12 02452 g004b
Figure 5. Impedance spectra of (a) Sm2Zr2O7, (b) Sm2−xCaxZr2O7−x/2 (x = 0.1), and (c) Gd2−xCaxZr2O7−x/2 (x = 0.1) at 530 and 615 °C in dry and wet air.
Materials 12 02452 g005
Figure 6. Bulk conductivity of Sm2−xCaxZr2O7−x/2 (x = 0, 0.05, 0.1) in dry and wet air.
Materials 12 02452 g006
Figure 7. Bulk and grain-boundary conductivities of (a) Sm2−xCaxZr2O7−x/2 (x = 0, 0.05) and (b) Sm2−xCaxZr2O7−x/2 (x = 0, 0.1) in dry and wet air.
Materials 12 02452 g007aMaterials 12 02452 g007b
Figure 8. The total conductivity of Sm2−xCaxZr2O7−x/2 (x = 0, 0.05, 0.1) in dry and wet air.
Materials 12 02452 g008
Figure 9. The total conductivity of Gd2−xCaxZr2O7−x/2 (x = 0.05, 0.1) in dry and wet air. The bulk conductivity data for undoped Gd2Zr2O7 in ambient air are borrowed from Moreno et al. [35].
Materials 12 02452 g009
Figure 10. Bulk and grain-boundary conductivities of Gd2−xCaxZr2O7−x/2 (x = 0.1) in dry and wet air.
Materials 12 02452 g010
Figure 11. Total electrical conductivity of (a) Sm2−xCaxZr2O7−x/2 (x = 0.05), (b) Sm2−xCaxZr2O7−x/2 (x = 0.1), (c) Gd2−xCaxZr2O7−x/2 (x = 0.1) as a function of the oxygen partial pressure, for temperatures between 700 and 950 °C.
Materials 12 02452 g011aMaterials 12 02452 g011b
Table 1. Characteristics of the compounds under investigation.
Sample No.FormulaSintering AnnealingPhase Composition According to XRDColorRelative Density, %
1Sm2Zr2O71600 °C, 10 hPyrochlore (P)Cream89
2Sm1.95Ca0.05Zr2O6.9751600 °C, 4 hPyrochlore (P) Cream91.6
3Sm1.9Ca0.1Zr2O6.951600 °C, 4 hPyrochlore (P) Reddish-brown92.6
4Gd1.95Ca0.05Zr2O6.9751600 °C, 4 hFluorite (F) Gray89.1
5Gd1.9Ca0.1Zr2O6.951600 °C, 4 hFluorite (F) Gray89
Table 2. Rietveld data for Sm2−xCaxZr2O7−x/2 (x = 0, 0.05, 0.1) and Gd2−xCaxZr2O7−x/2 (x = 0.05, 0.1).
CompositionSiteOccupancyxyzRexp, %
Rwp, %
Rp, %
GOF
Parameter a, Å
Sm2Zr2O7
space group: F d 3 ¯ m
SmSm (16d)0.905(5)0.5000.5000.5003.46
4.16
3.28
1.20
a =10.5975(1)
ZrSm (16d)0.095(5)0.5000.5000.500
ZrZr (16c)0.905(5)0.0000.0000.000
SmZr (16c)0.095(5)0.0000.0000.000
O(1) (8b)10.3750.3750.375
O(2) (48f)10.3390.1250.125
Sm1.95Ca0.05Zr2O6.975
space group: F d 3 ¯ m
SmSm (16d)0.975(1)0.5000.5000.5003.36
4.49
3.47
1.34
a = 10.5925(1)
ZrSm (16d)00.5000.5000.500
CaSm (16d)0.0250.5000.5000.500
ZrZr (16c)10.0000.0000.000
SmZr (16c)00.0000.0000.000
CaZr (16c)00.0000.0000.000
O(1) (8b)10.3750.3750.375
O(2) (48f)10.3390.1250.125
Sm1.9Ca0.1Zr2O6.95
space group: F d 3 ¯ m
SmSm (16d)0.930(2)0.5000.5000.5003.51
4.94
3.79
1.41
a = 10.5923(1)
ZrSm (16d)0.030(2)0.5000.5000.500
CaSm (16d)0.040.5000.5000.500
ZrZr (16c)0.960(2)0.0000.0000.000
SmZr (16c)0.030(2)0.0000.0000.000
CaZr (16c)0.010.0000.0000.000
O(1) (8b)10.3750.3750.375
O(2) (48f)10.3390.1250.125
Gd1.95Ca0.05Zr2O6.975
space group: F d 3 ¯ m
GdGd (16d)0.585(40)0.5000.5000.5002.92
3.72
2.88
1.27
a = 10.5326(1)
ZrGd (16d)0.400(40)0.5000.5000.500
CaGd (16d)0.0150.5000.5000.500
ZrZr (16c)0.600(40)0.0000.0000.000
GdZr (16c)0.390(40)0.0000.0000.000
CaZr (16c)0.010.0000.0000.000
O(1) (8b)10.3750.3750.375
O(2) (48f)10.3390.1250.125
Gd1.95Ca0.05Zr2O6.975
space group: F m 3 ¯ m
GdGd (4a)0.4875(1)0.0000.0000.0002.92
3.67
2.82
1.26
a = 5.2663(1)
ZrGd (4a)0.5000(1)0.0000.0000.000
CaGd (4a)0.0125(1)0.0000.0000.000
O(1) (8c)0.87500.2500.2500.250
Gd1.9Ca0.1Zr2O6.95
space group: F d 3 ¯ m
GdGd (16d)0.580(40)0.5000.5000.5002.80
3.66
2.83
1.31
a = 10.5321(1)
ZrGd (16d)0.390(40)0.5000.5000.500
CaGd (16d)0.030.5000.5000.500
ZrZr (16c)0.610(40)0.0000.0000.000
GdZr (16c)0.370(40)0.0000.0000.000
CaZr (16c)0.020.0000.0000.000
O(1) (8b)10.3750.3750.375
O(2) (48f)10.3390.1250.125
Gd1.9Ca0.1Zr2O6.95
space group: F m 3 ¯ m
GdGd (4a)0.475(1)0.0000.0000.0002.80a = 5.2661(1)
ZrGd (4a)0.500(1)0.0000.0000.0003.62
CaGd (4a)0.025(1)0.0000.0000.0002.81
O(1) (8c)0.8750.2500.2500.2501.29
Table 3. Comparison of the nominal cations stoichiometry and SEM/EDX point analysis of Sm1.9Ca0.1Zr2O6.95 ceramics.
Analyzing AreaConcentration, at.%Ratio
SmCaZr[Zr]/[Ca][Sm]/[Ca][Zr]/[Sm]
Nominal stoichiometry47.52.550.020.019.01.1
SEM/EDX point analysis
Micron-size grain(s) only (well co-sintered) 55.21.743.126.533.90.8
51.52.546.018.520.70.9
Grain boundary 57.51.640.925.736.10.7
57.61.640.825.536.00.7
51.22.046.822.925.10.9
100–300 nm grains on the surface of micron-size well co-sintered grains 57.52.040.520.729.30.7
51.83.145.114.416.60.9
Individual grains with the size of 0.6–1.1 mkm 73.62.923.58.125.20.3
49.14.946.09.410.10.9
58.03.738.310.315.60.7
Micron-size agglomerate formed from small grains, Figure 3c26.054.519.50.40.50.7
20.366.713.00.20.30.6
Table 4. Activation energy for total, bulk and gb conductivity in ambient air in the compounds studied.
CompoundStructure (XRD Data)Temperature, °СActivation Energy for Total Conductivity, eV (Dry Air)Activation Energy for Total Conductivity, eV (Wet Air)
Sm2Zr2O7PyrochloreAbove 500 °С 0.7 0.7
Below 500 °С0.830.73
Sm1.95Ca0.05Zr2O6.975Pyrochlore300–900 °С0.820.79
Sm1.9Ca0.1Zr2O6.975Pyrochlore300–900 °С0.950.89
Gd1.95Ca0.05Zr2O6.975Fluorite Above 580 °С 0.99 0.99
Below 580 °С1.151.15
Gd1.9Ca0.1Zr2O6.95Fluorite Above 580 °С 1.03 1.03
Below 580 °С1.171.17

