Structural Properties and Thermoelectric Performance of the Double-Filled Skutterudite (Sm,Gd)y(FexNi1-x)4Sb12


 ,
, 

Abstract
1. Introduction
2. Materials and Methods
2.1. Synthesis
2.2. Optical and Electronic Microscopy
2.3. X-ray Diffraction
2.4. Microhardness
2.5. Measurements of Transport Properties
3. Results and Discussion
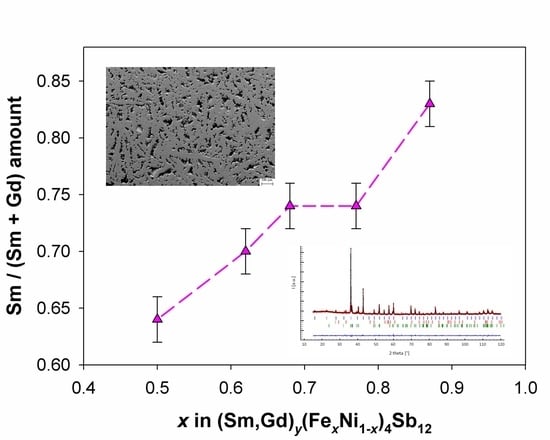
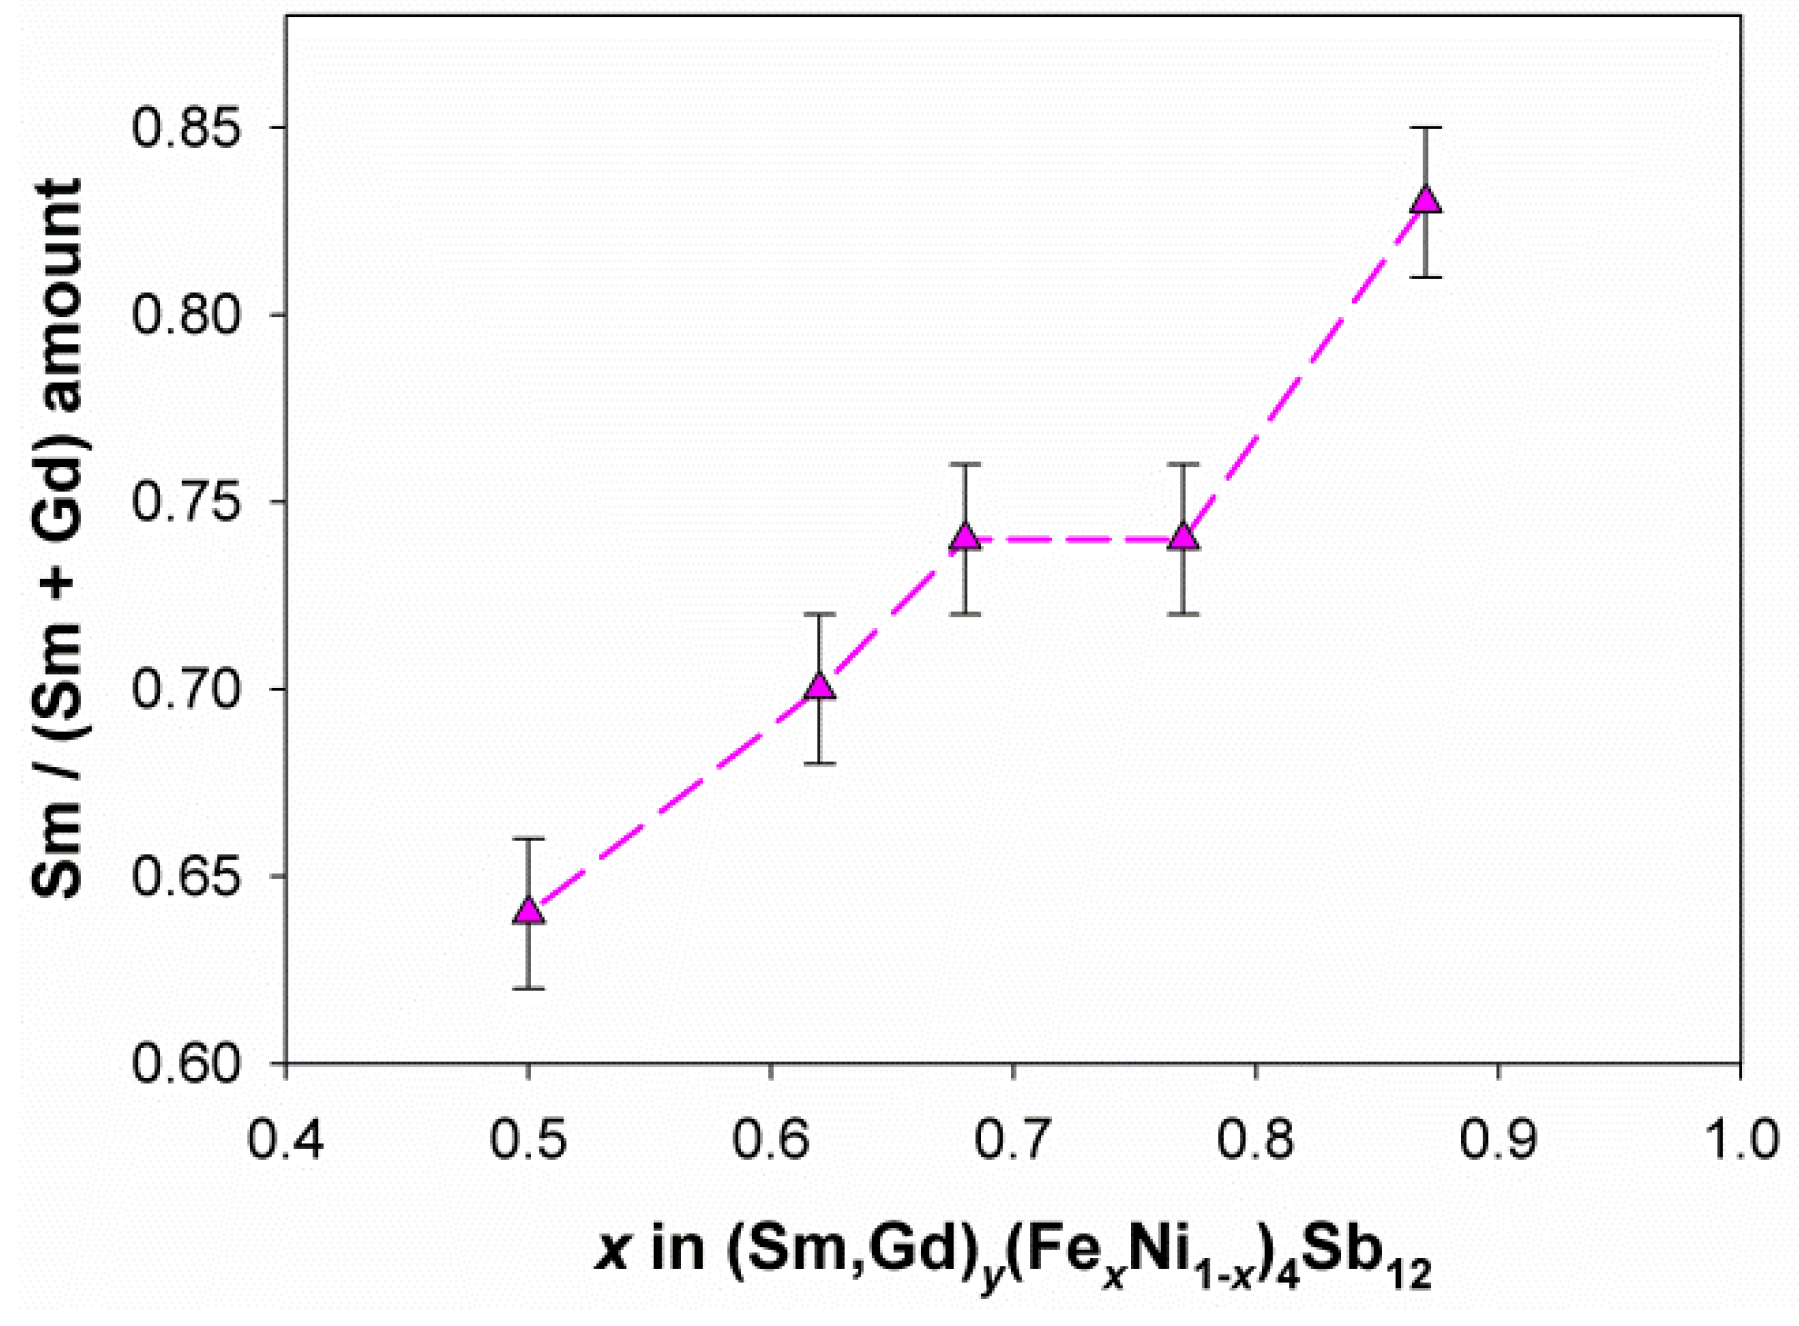
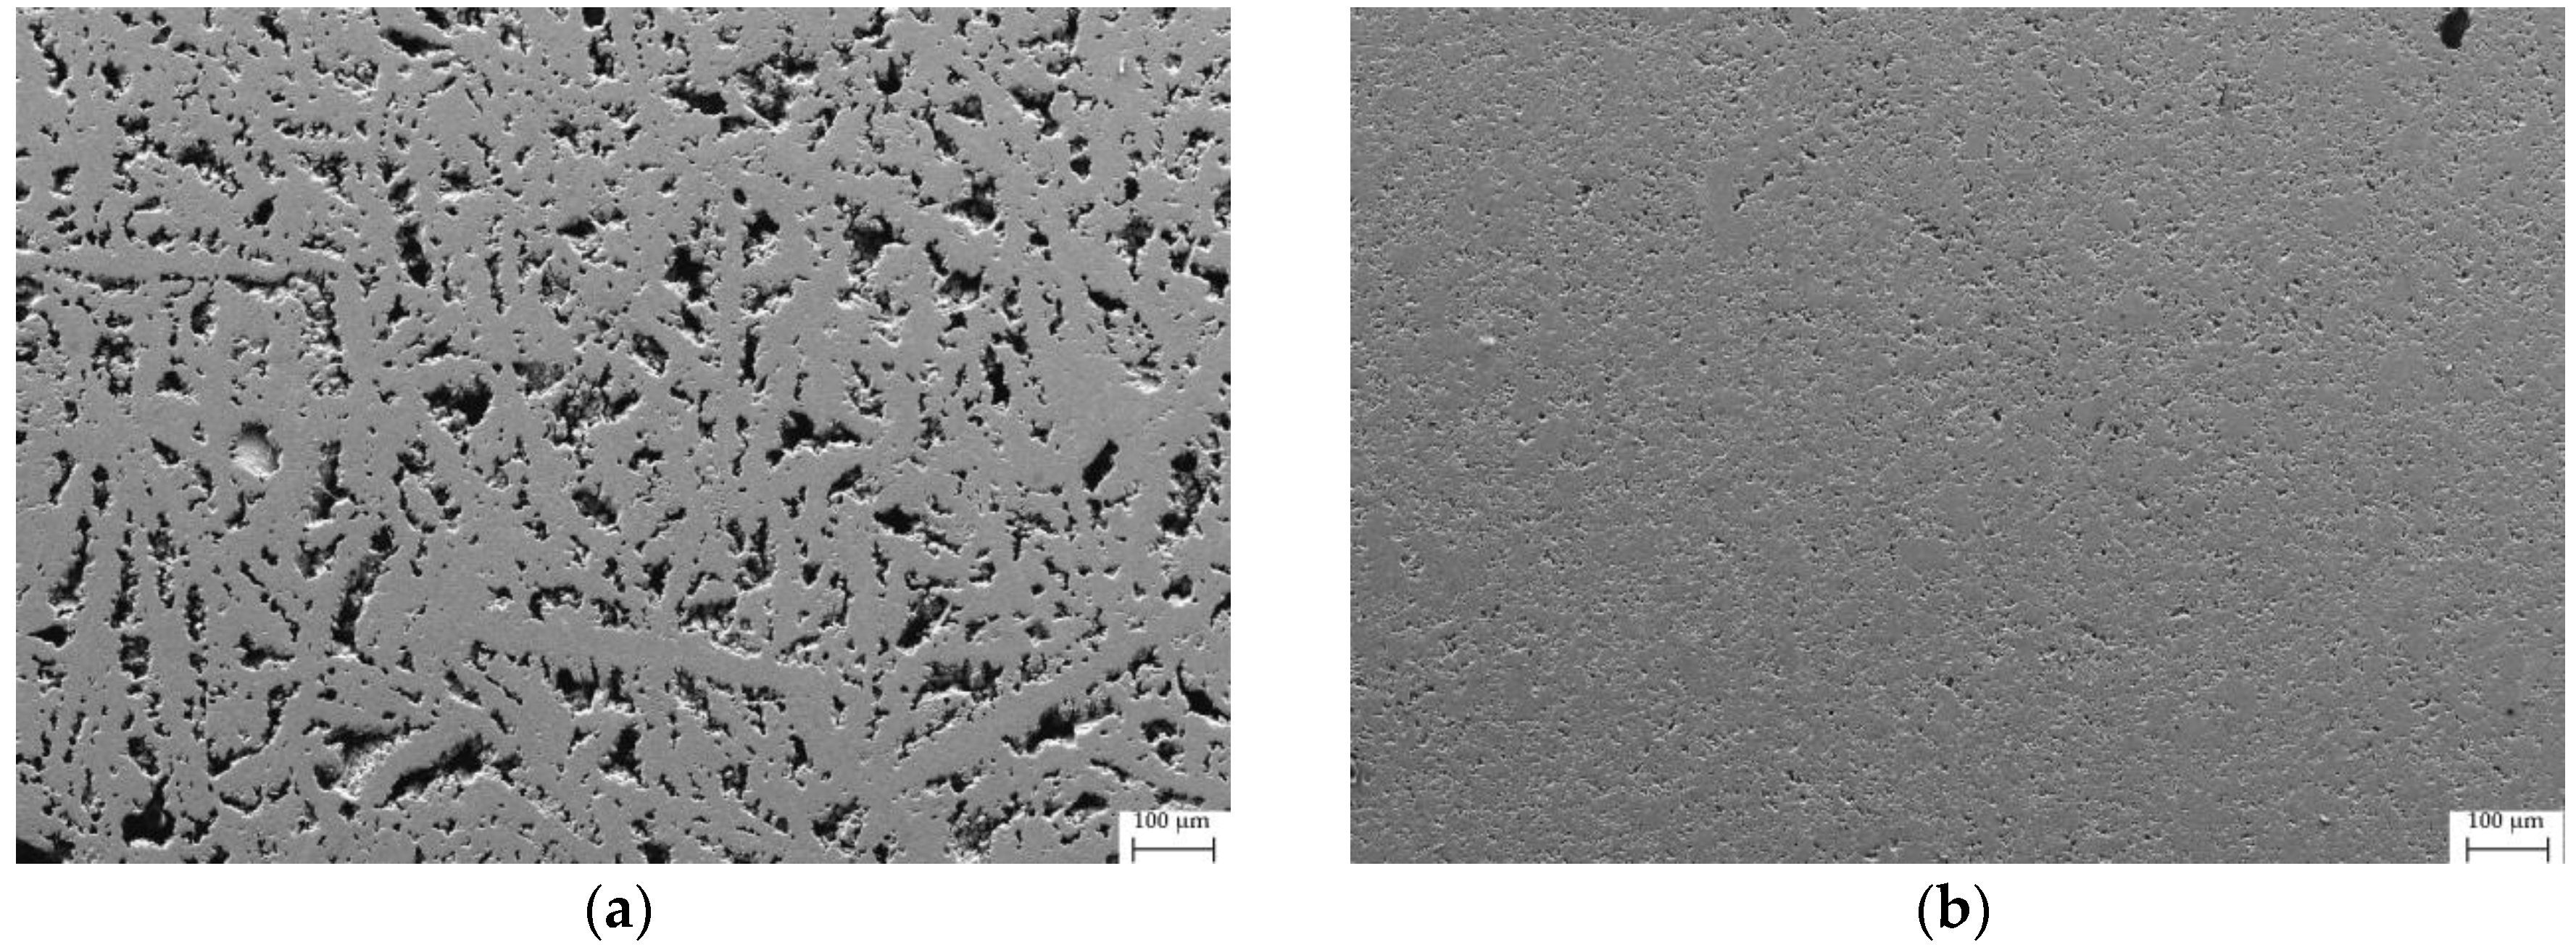
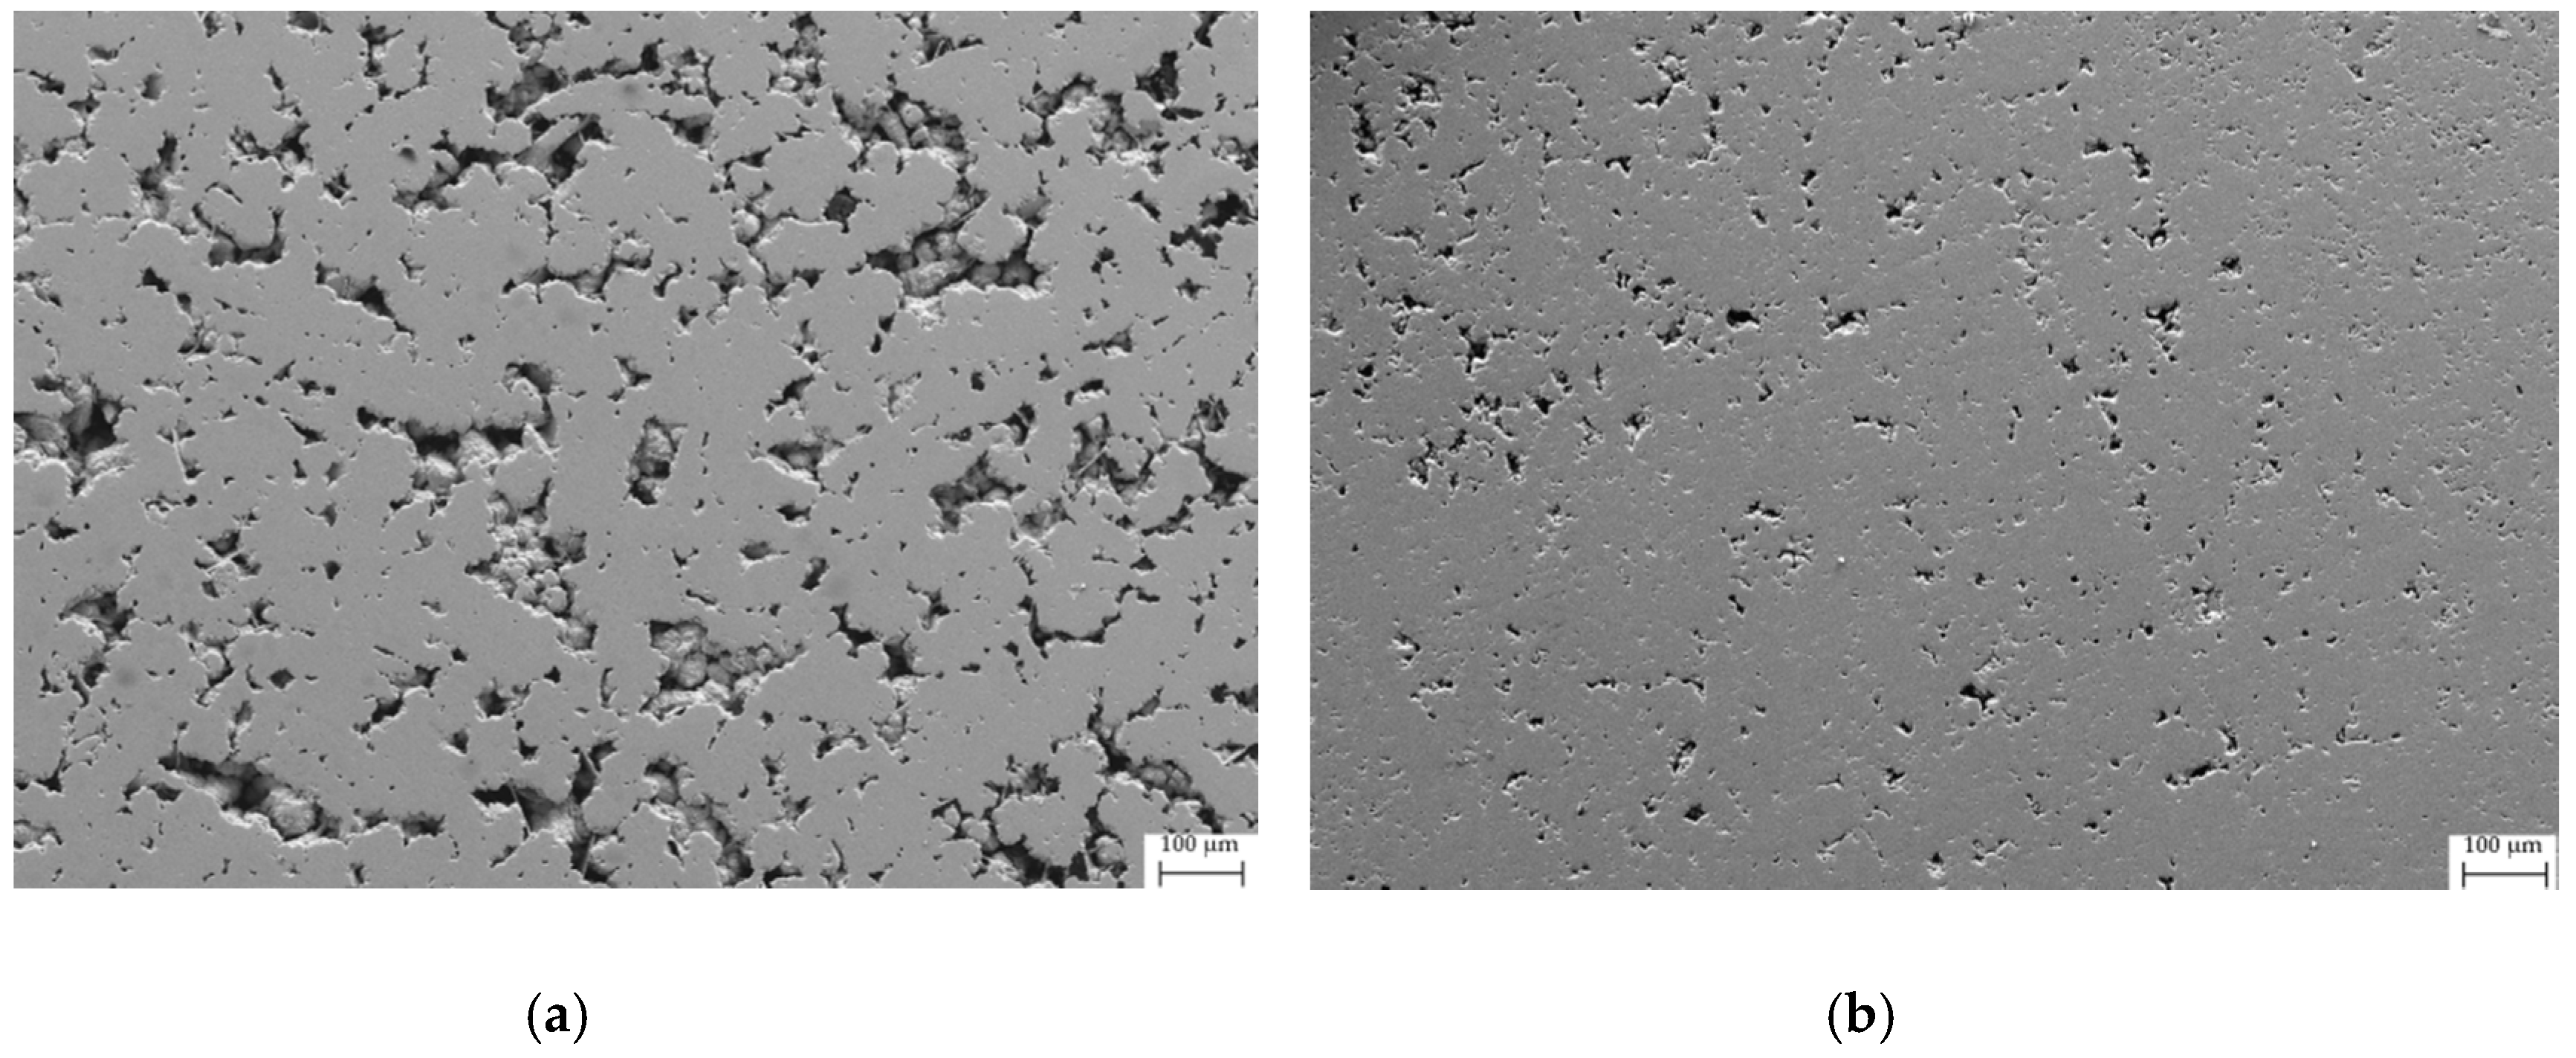
3.1. Compositional and Morphological Characterization
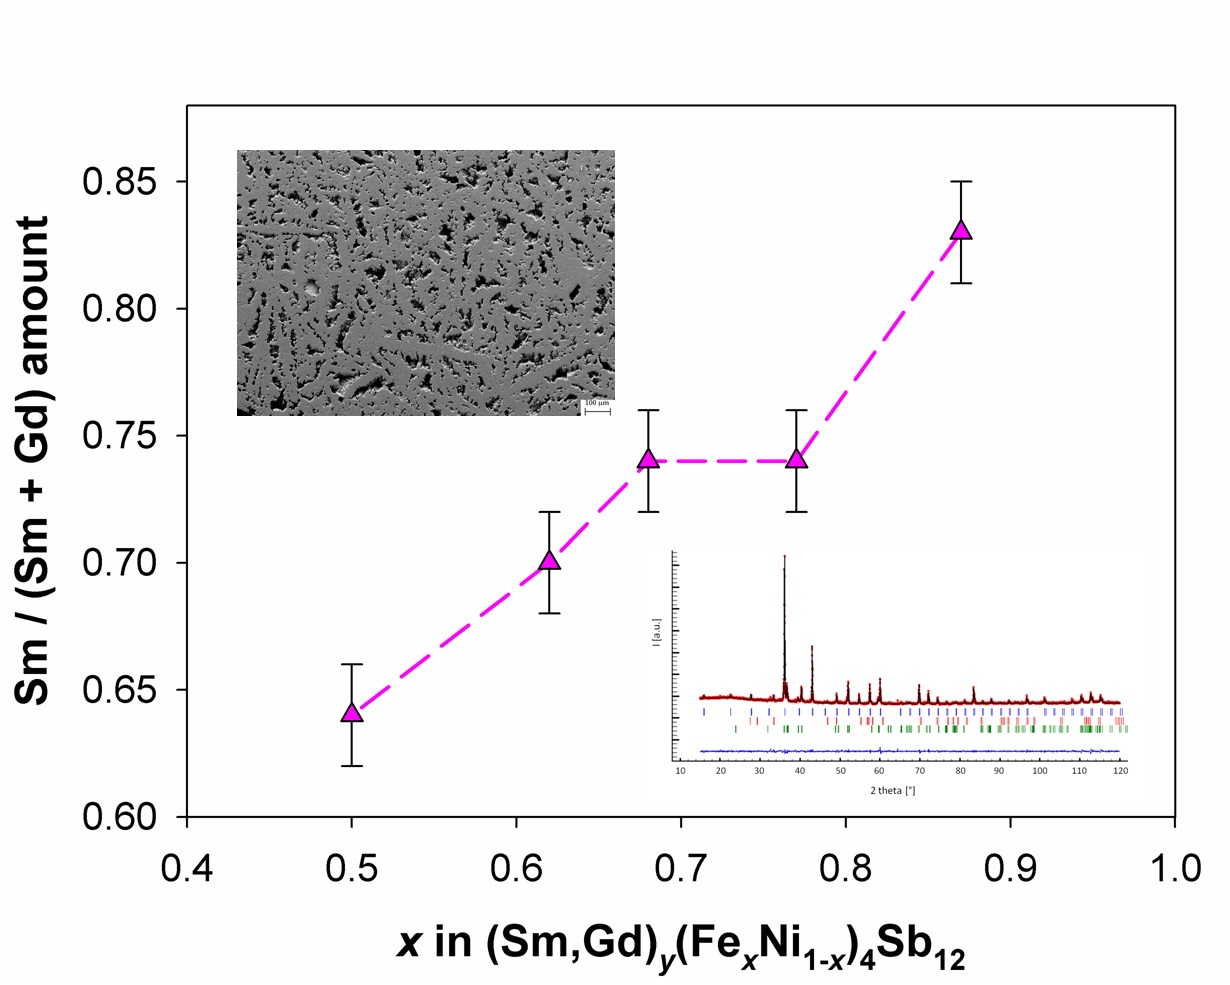
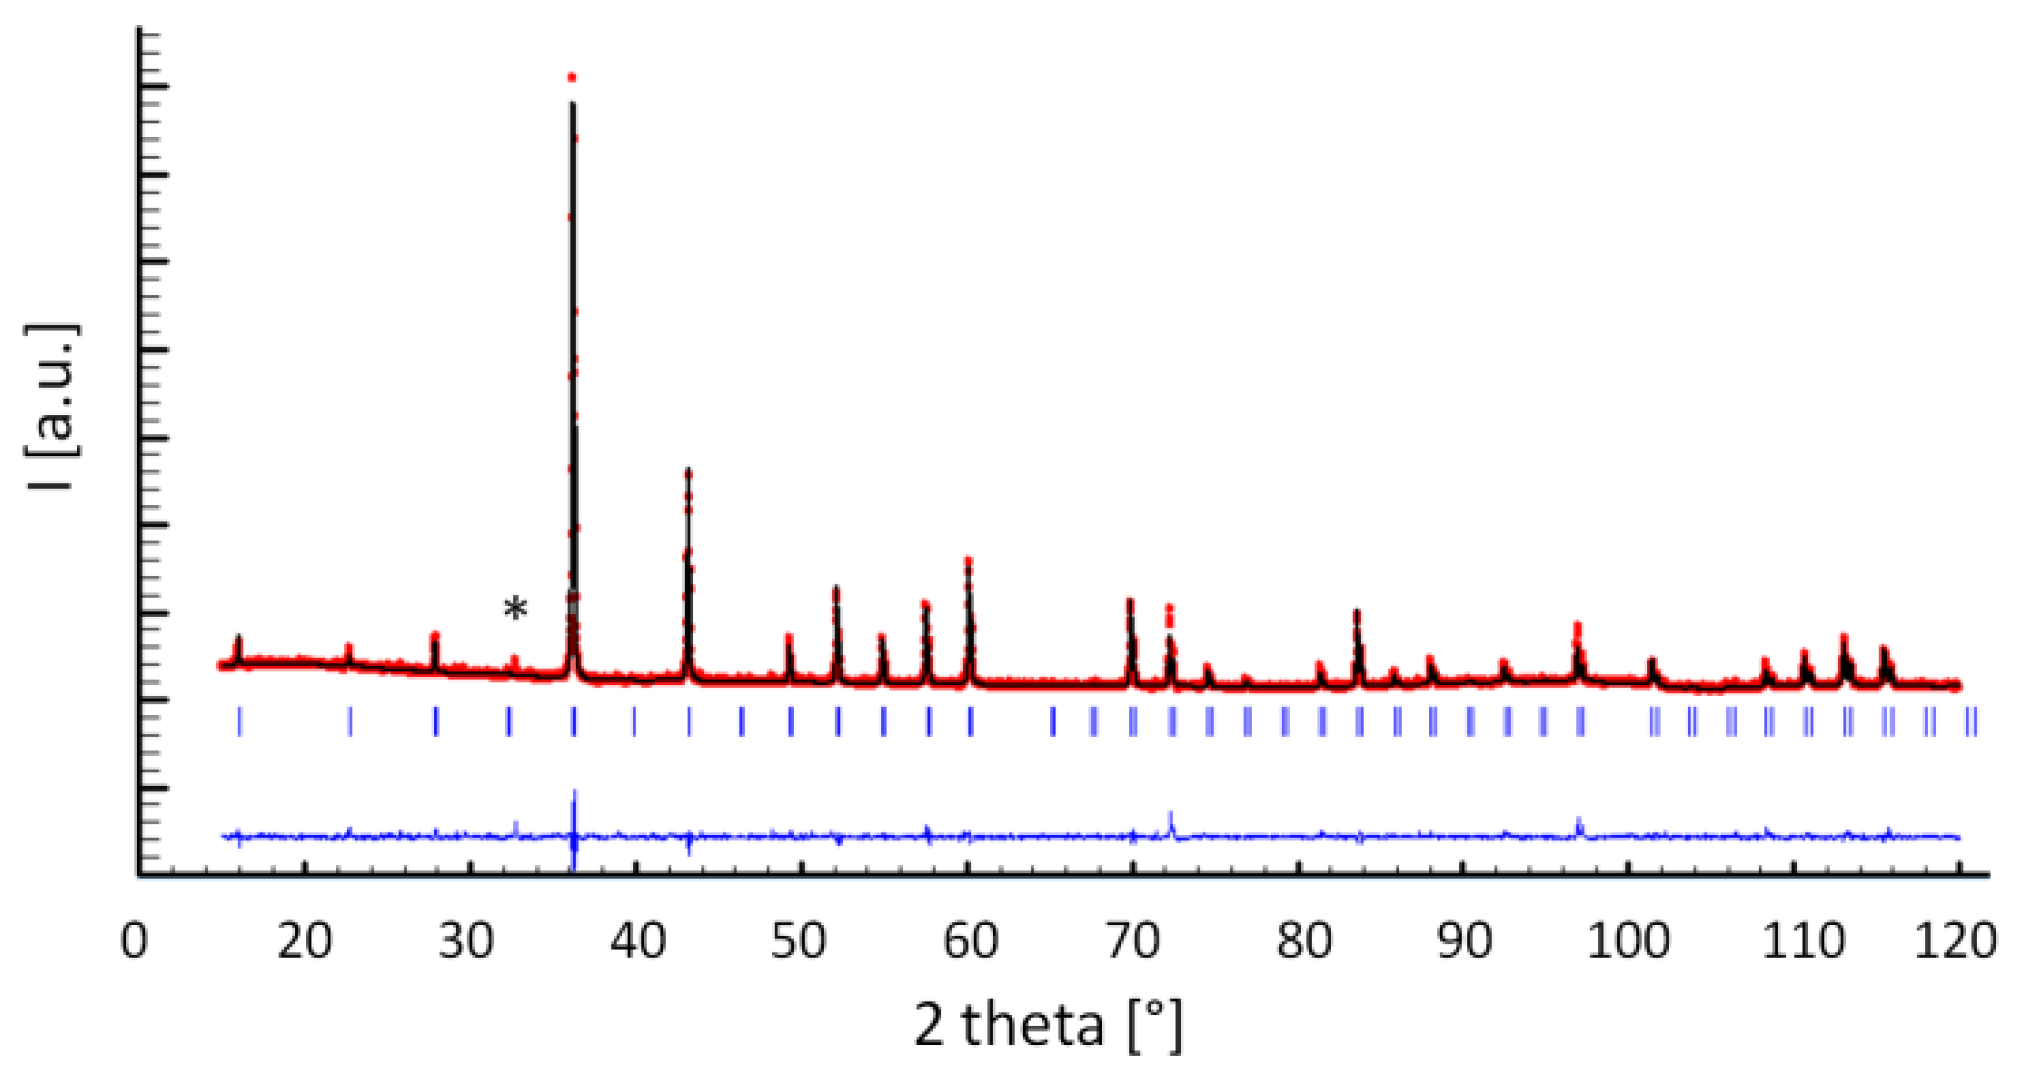
3.2. Structural Features
3.3. Densification of Samples
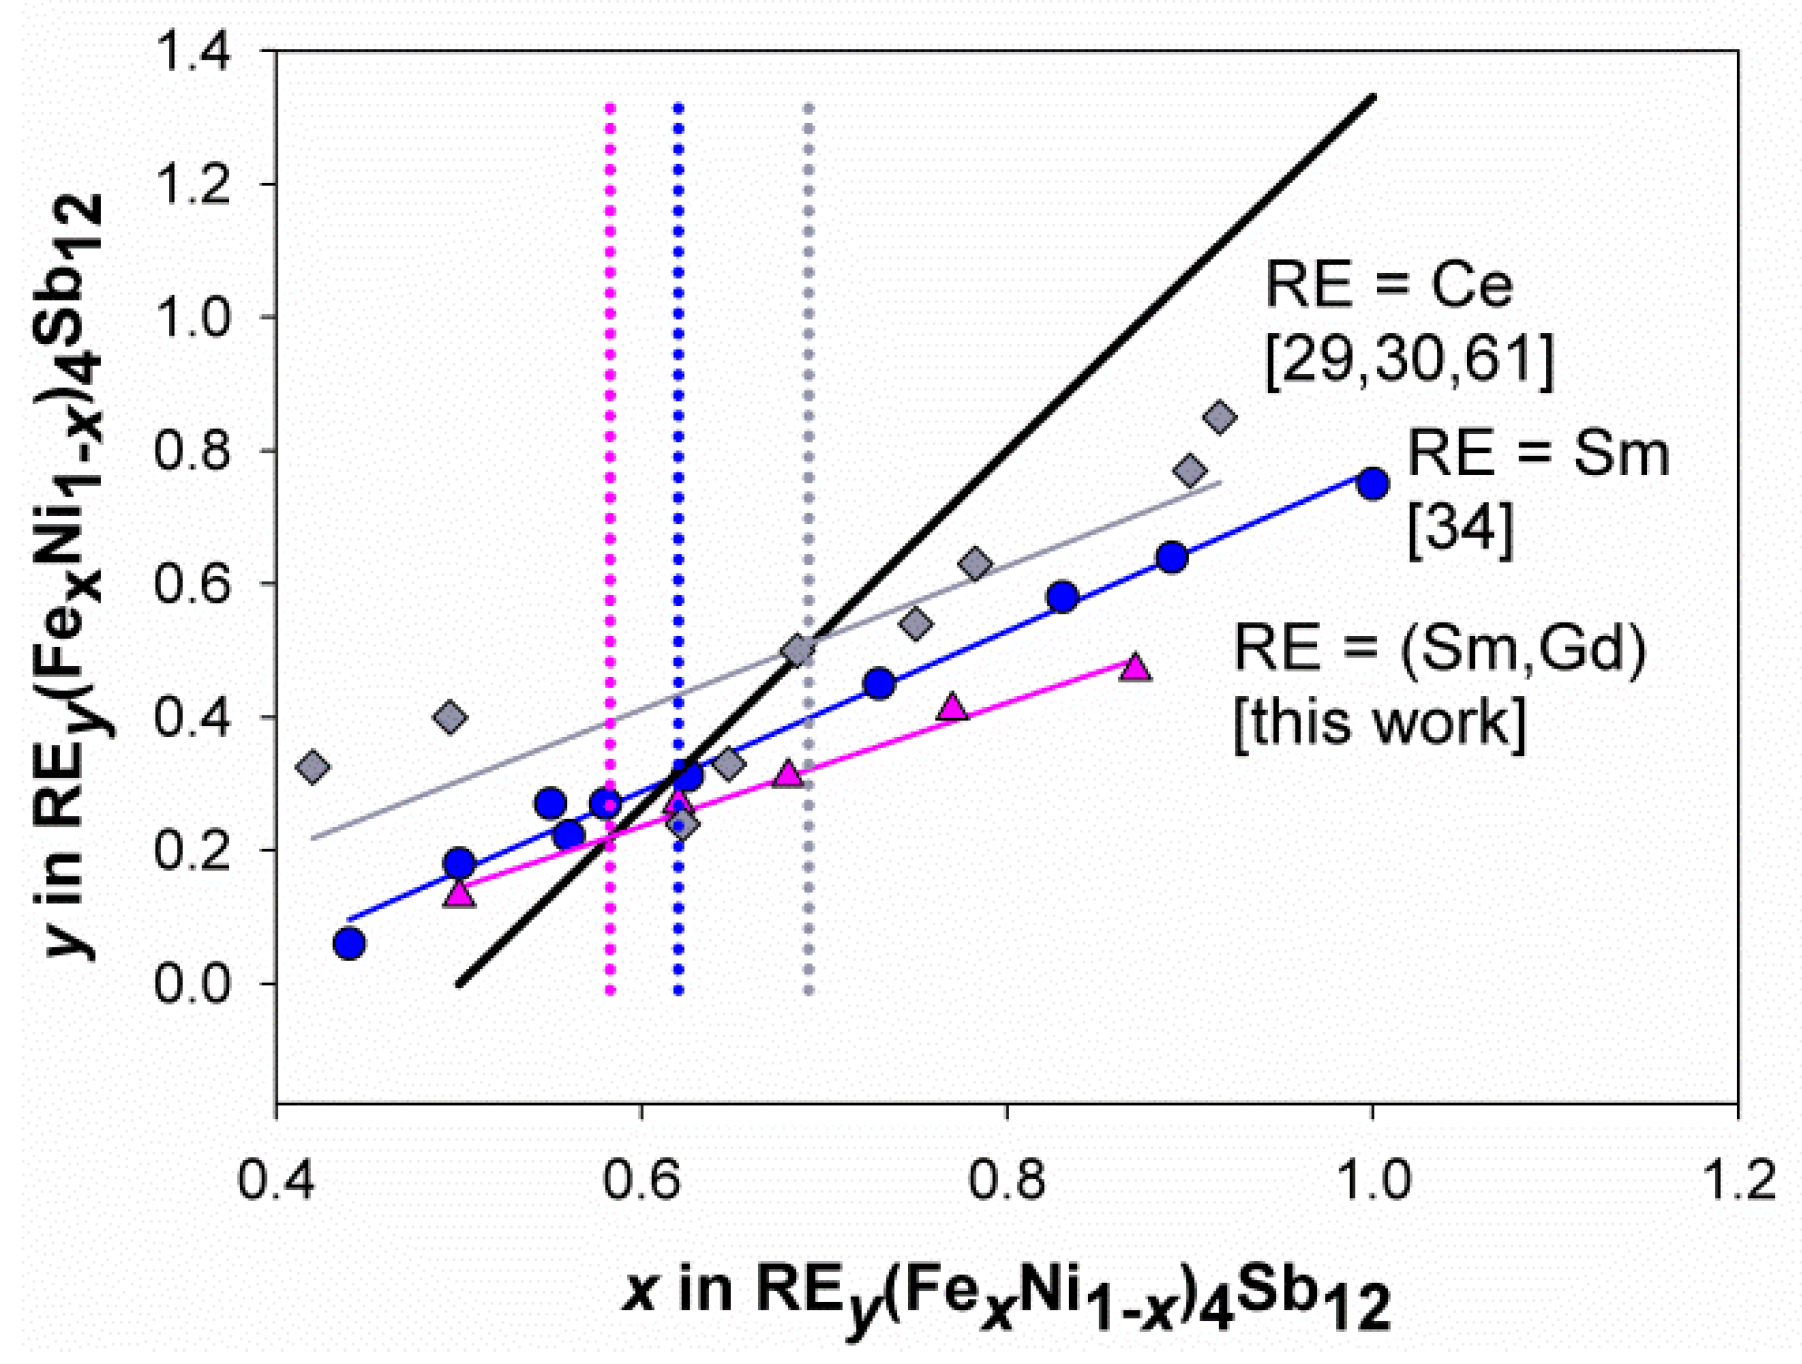
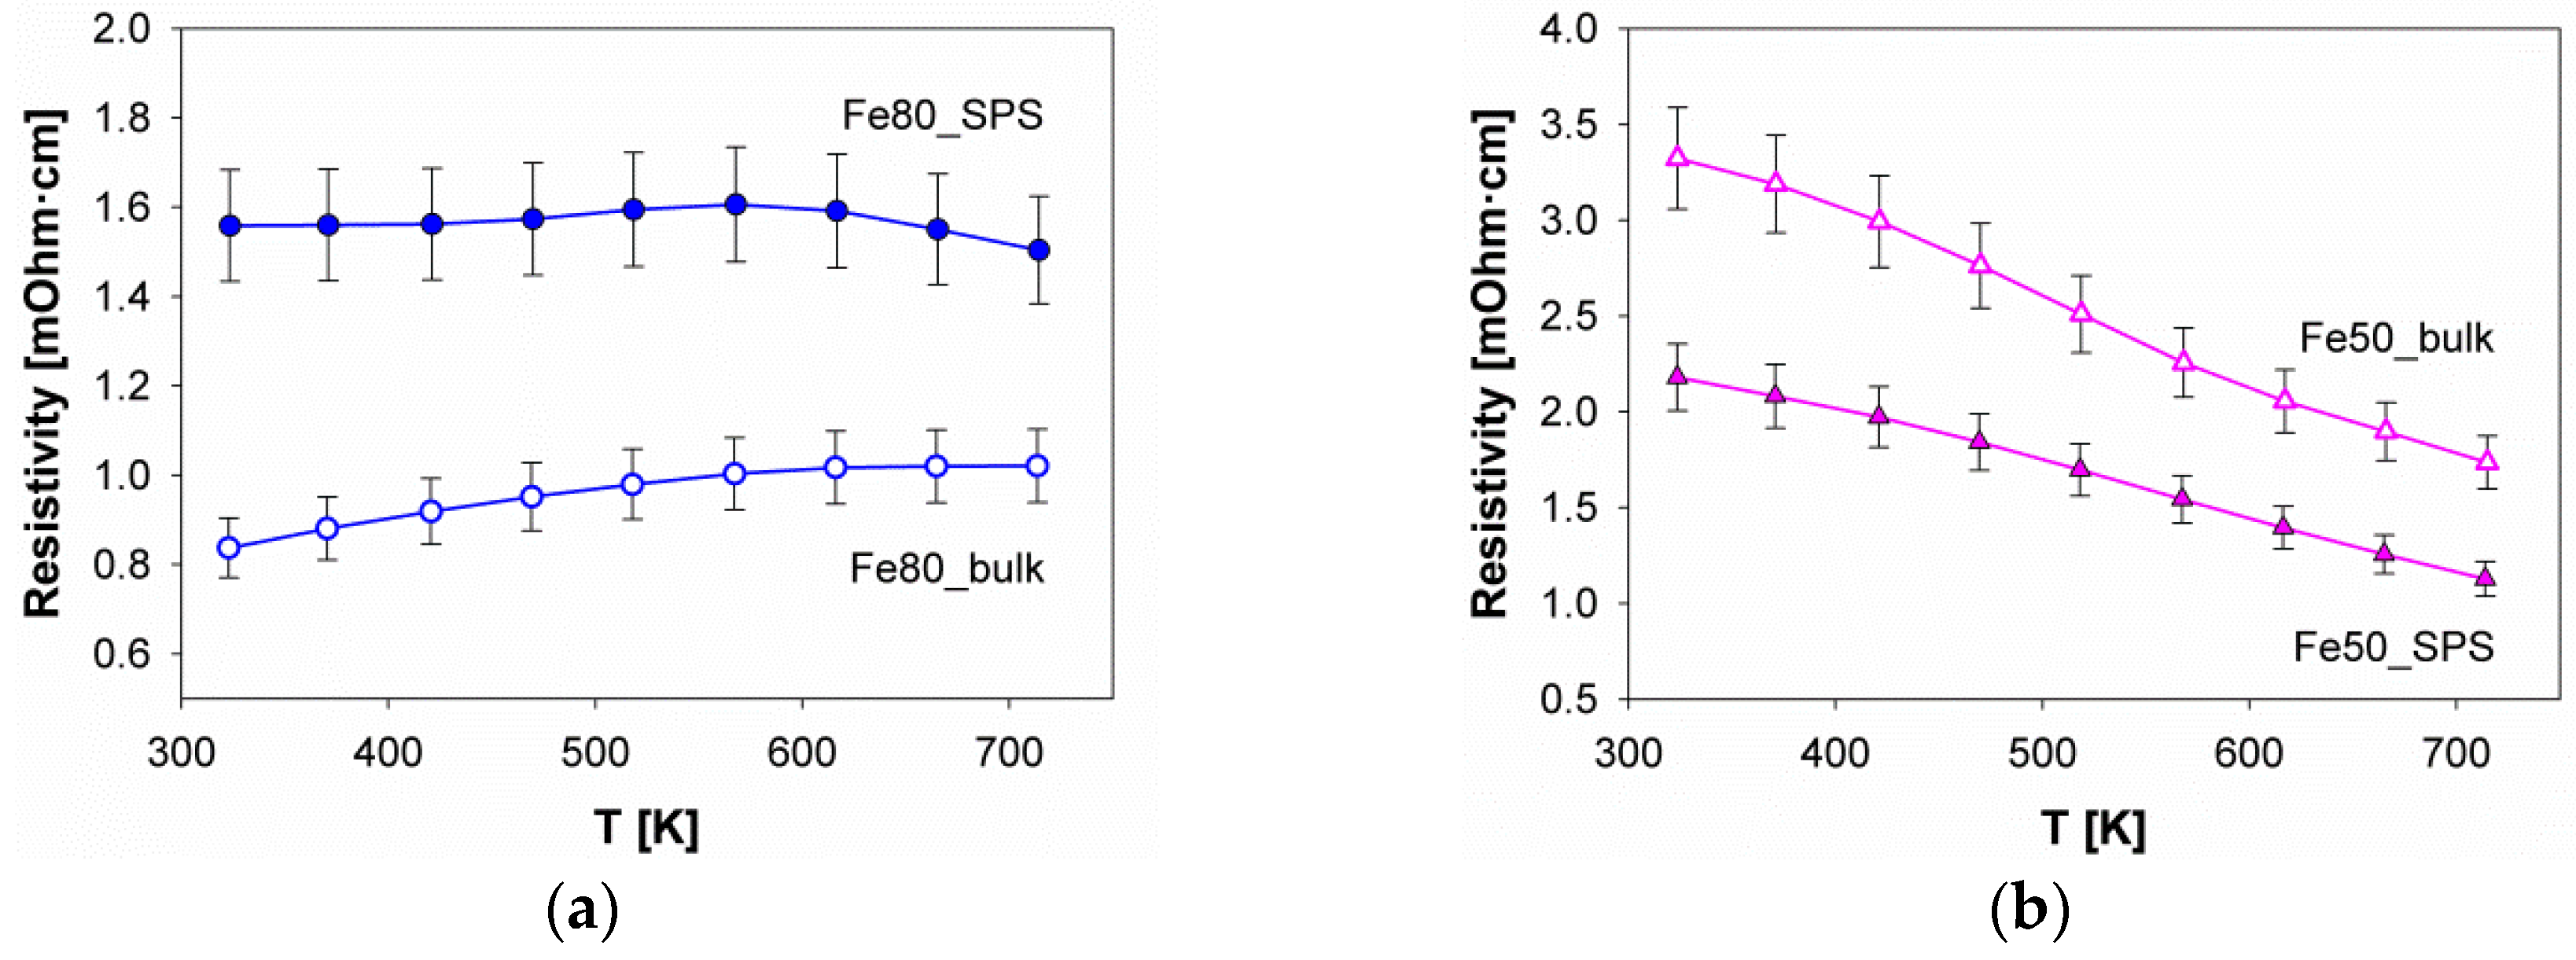
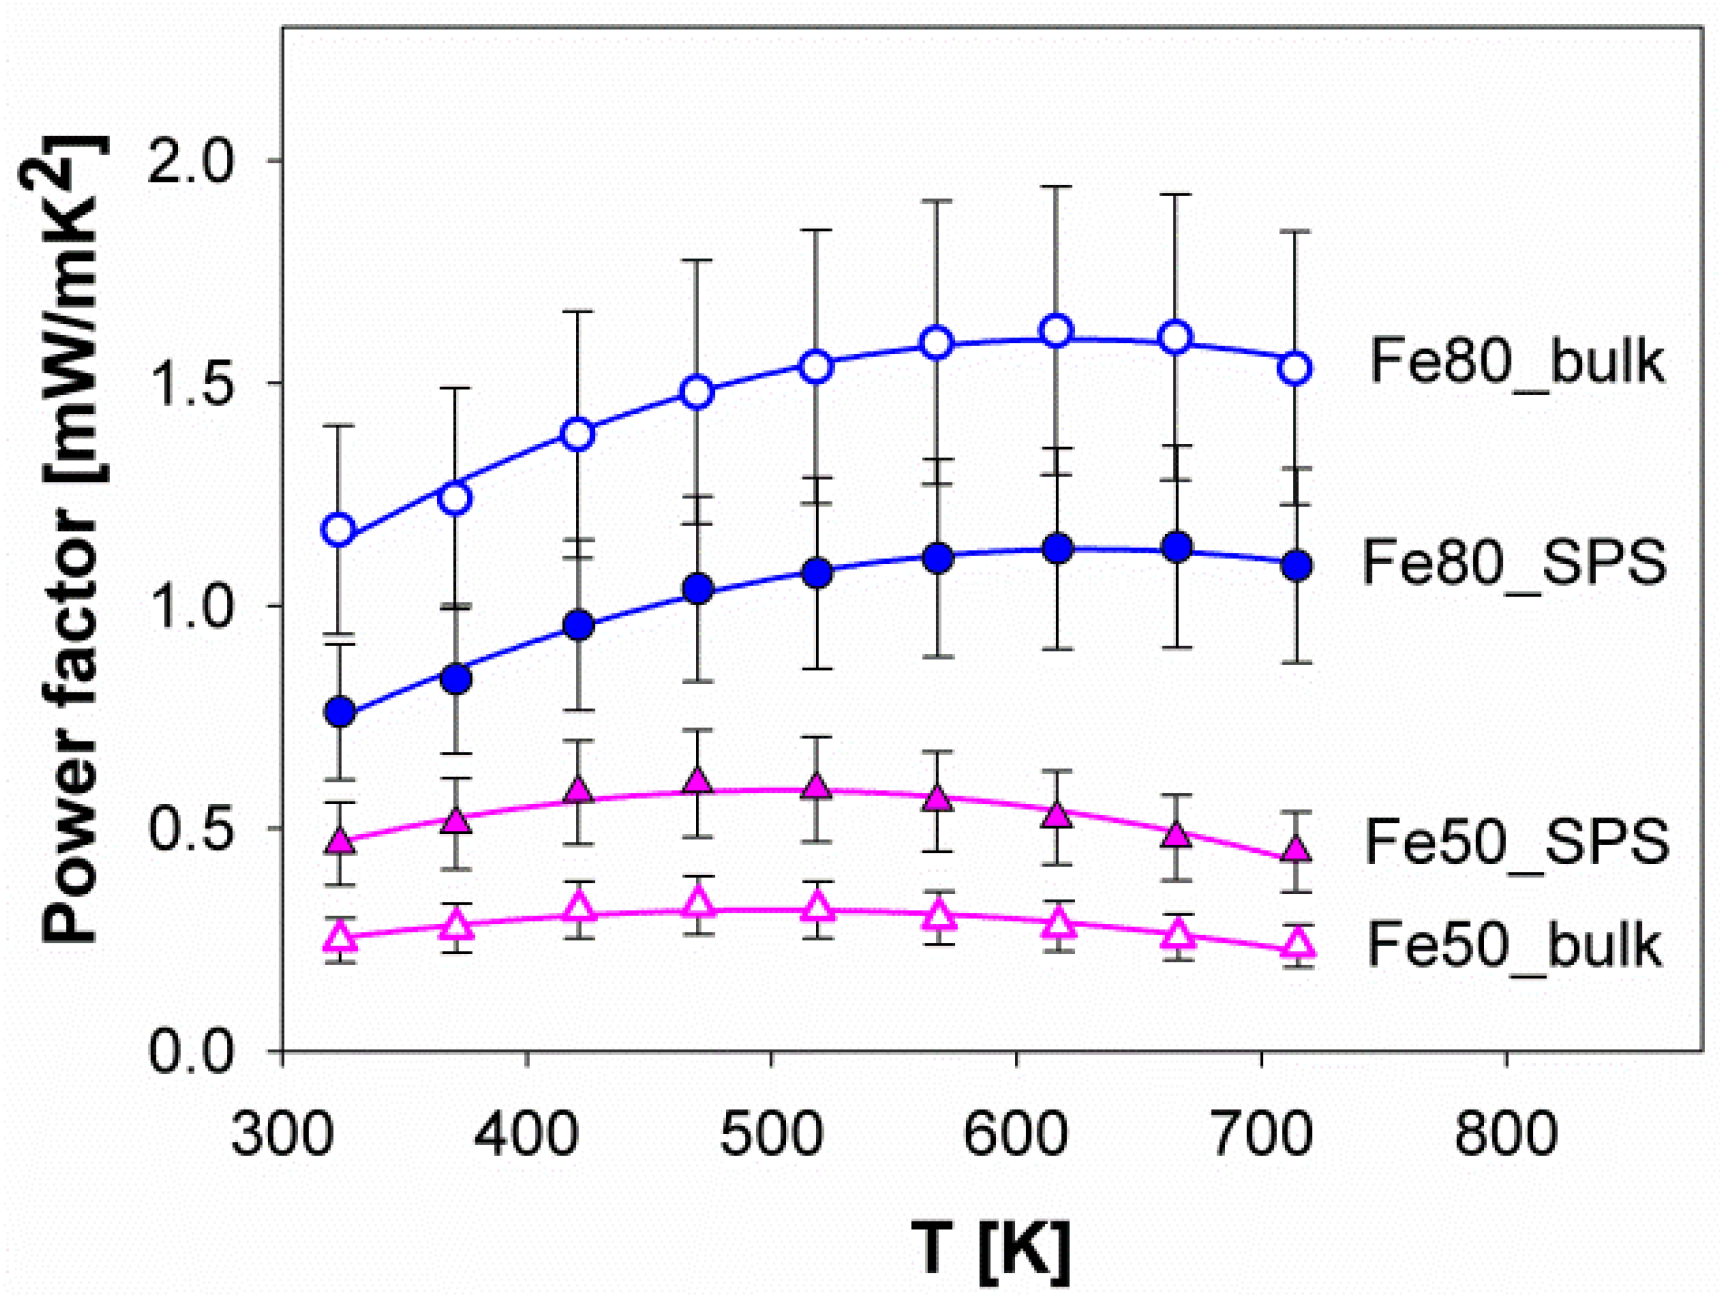
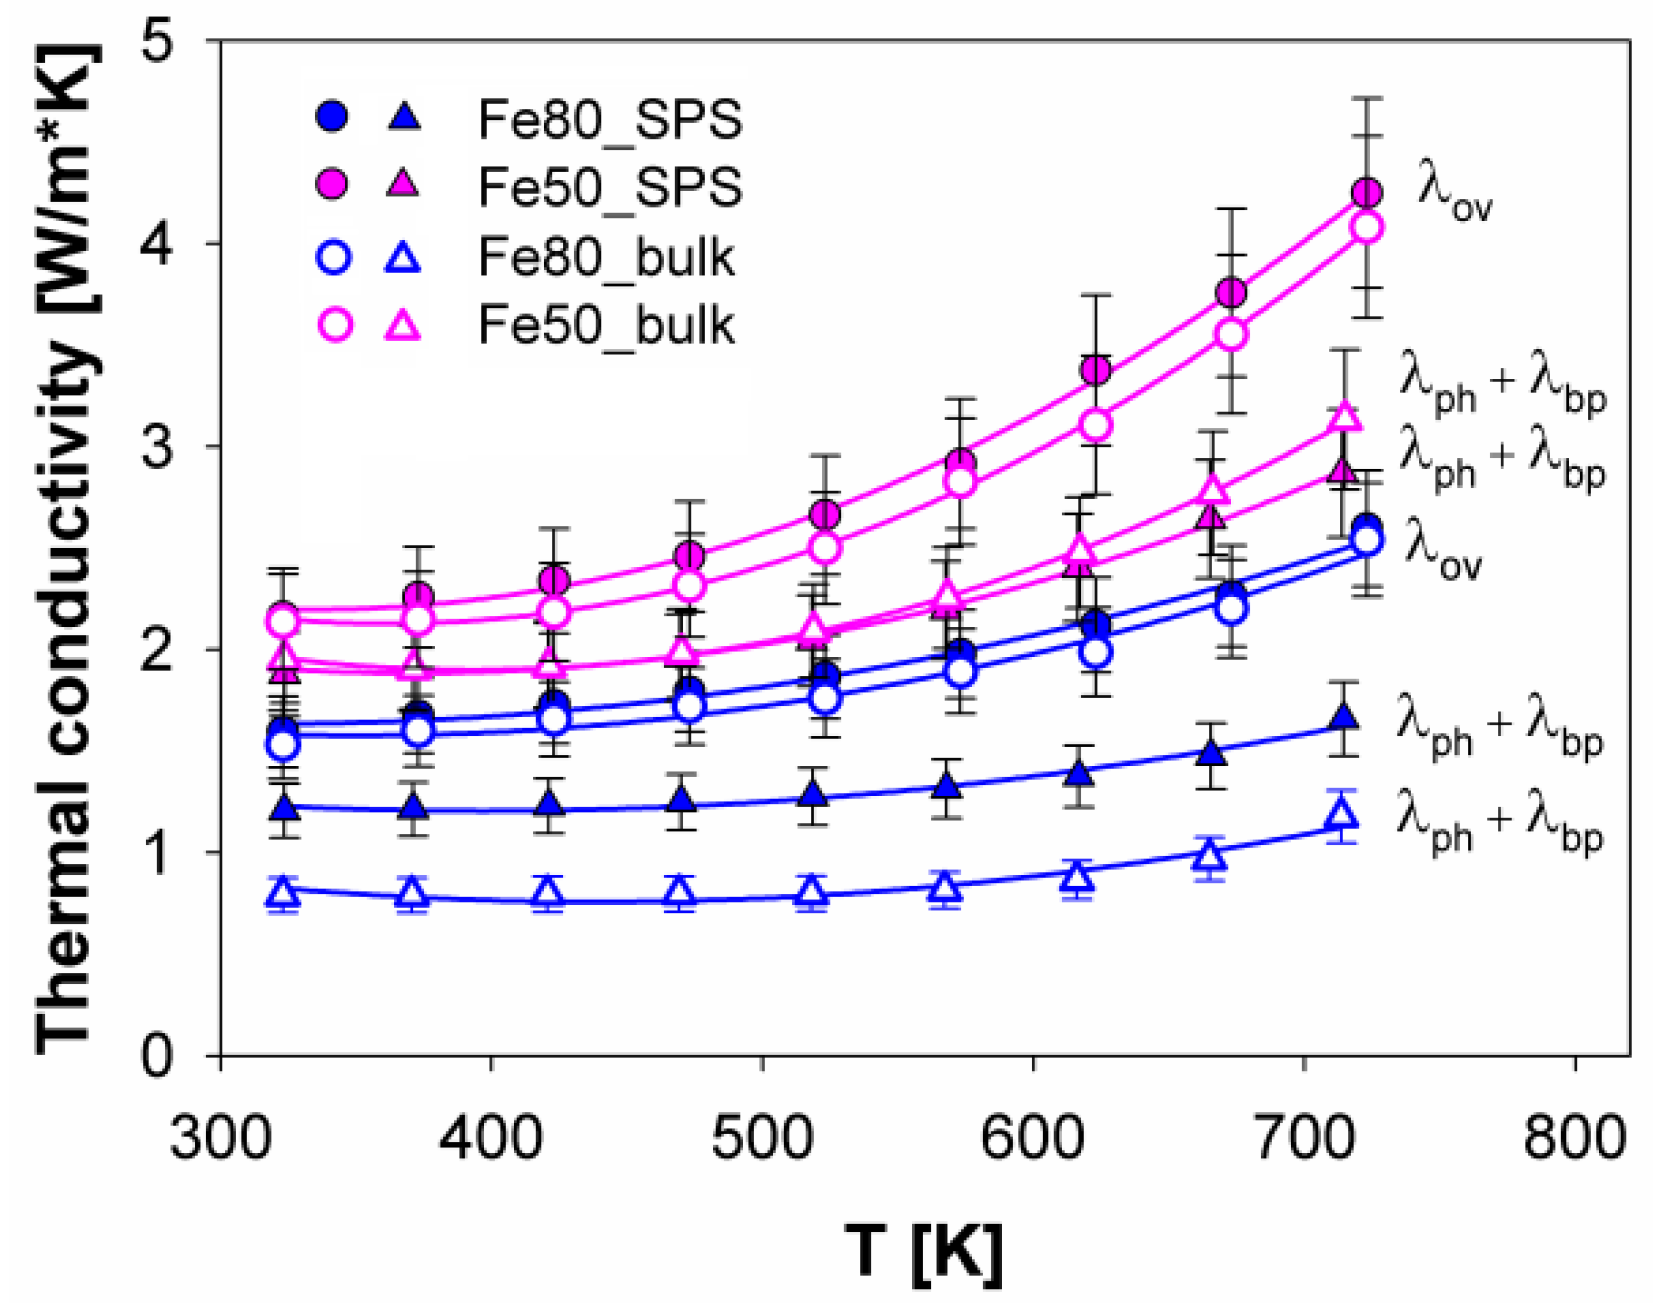
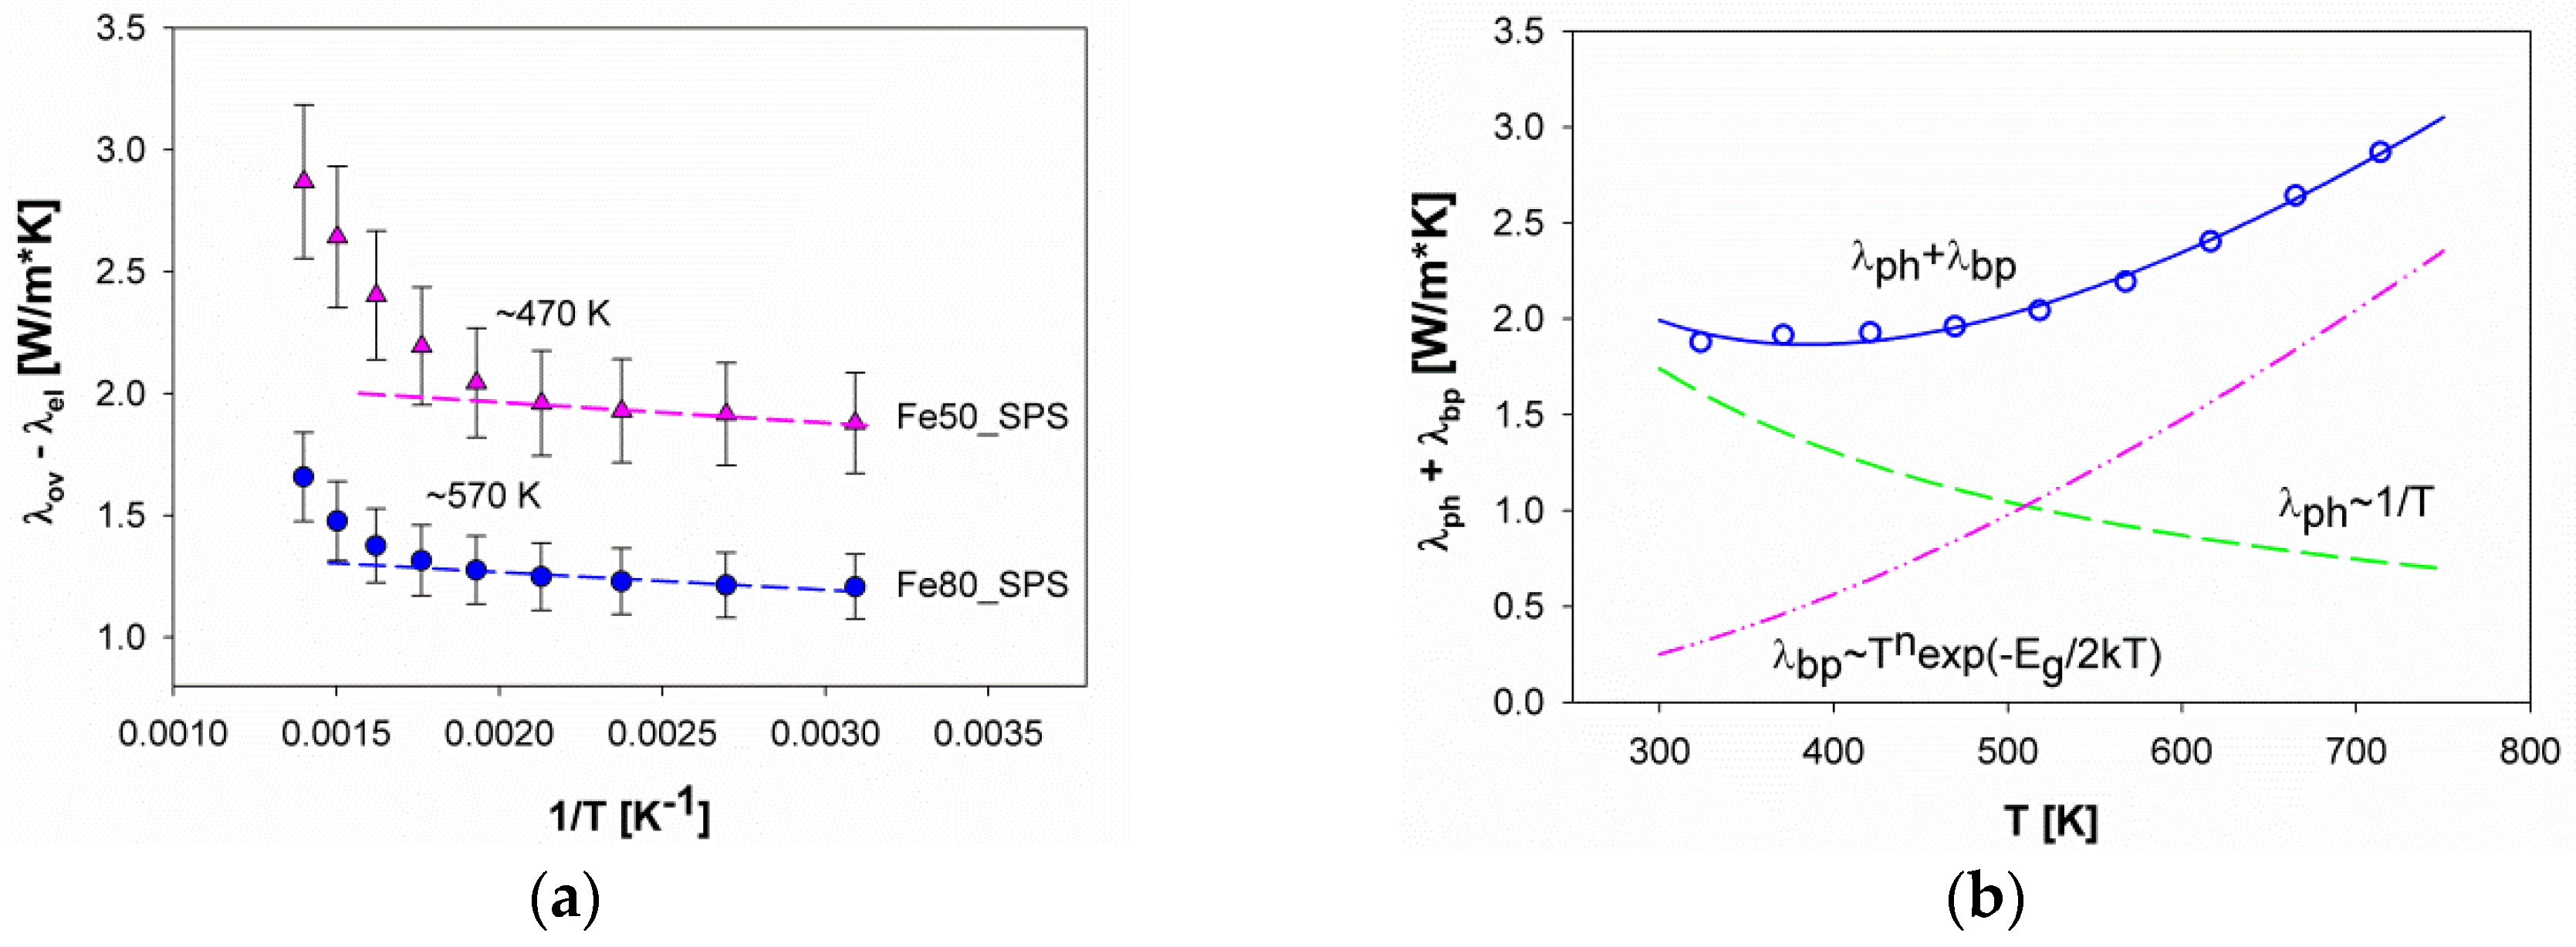
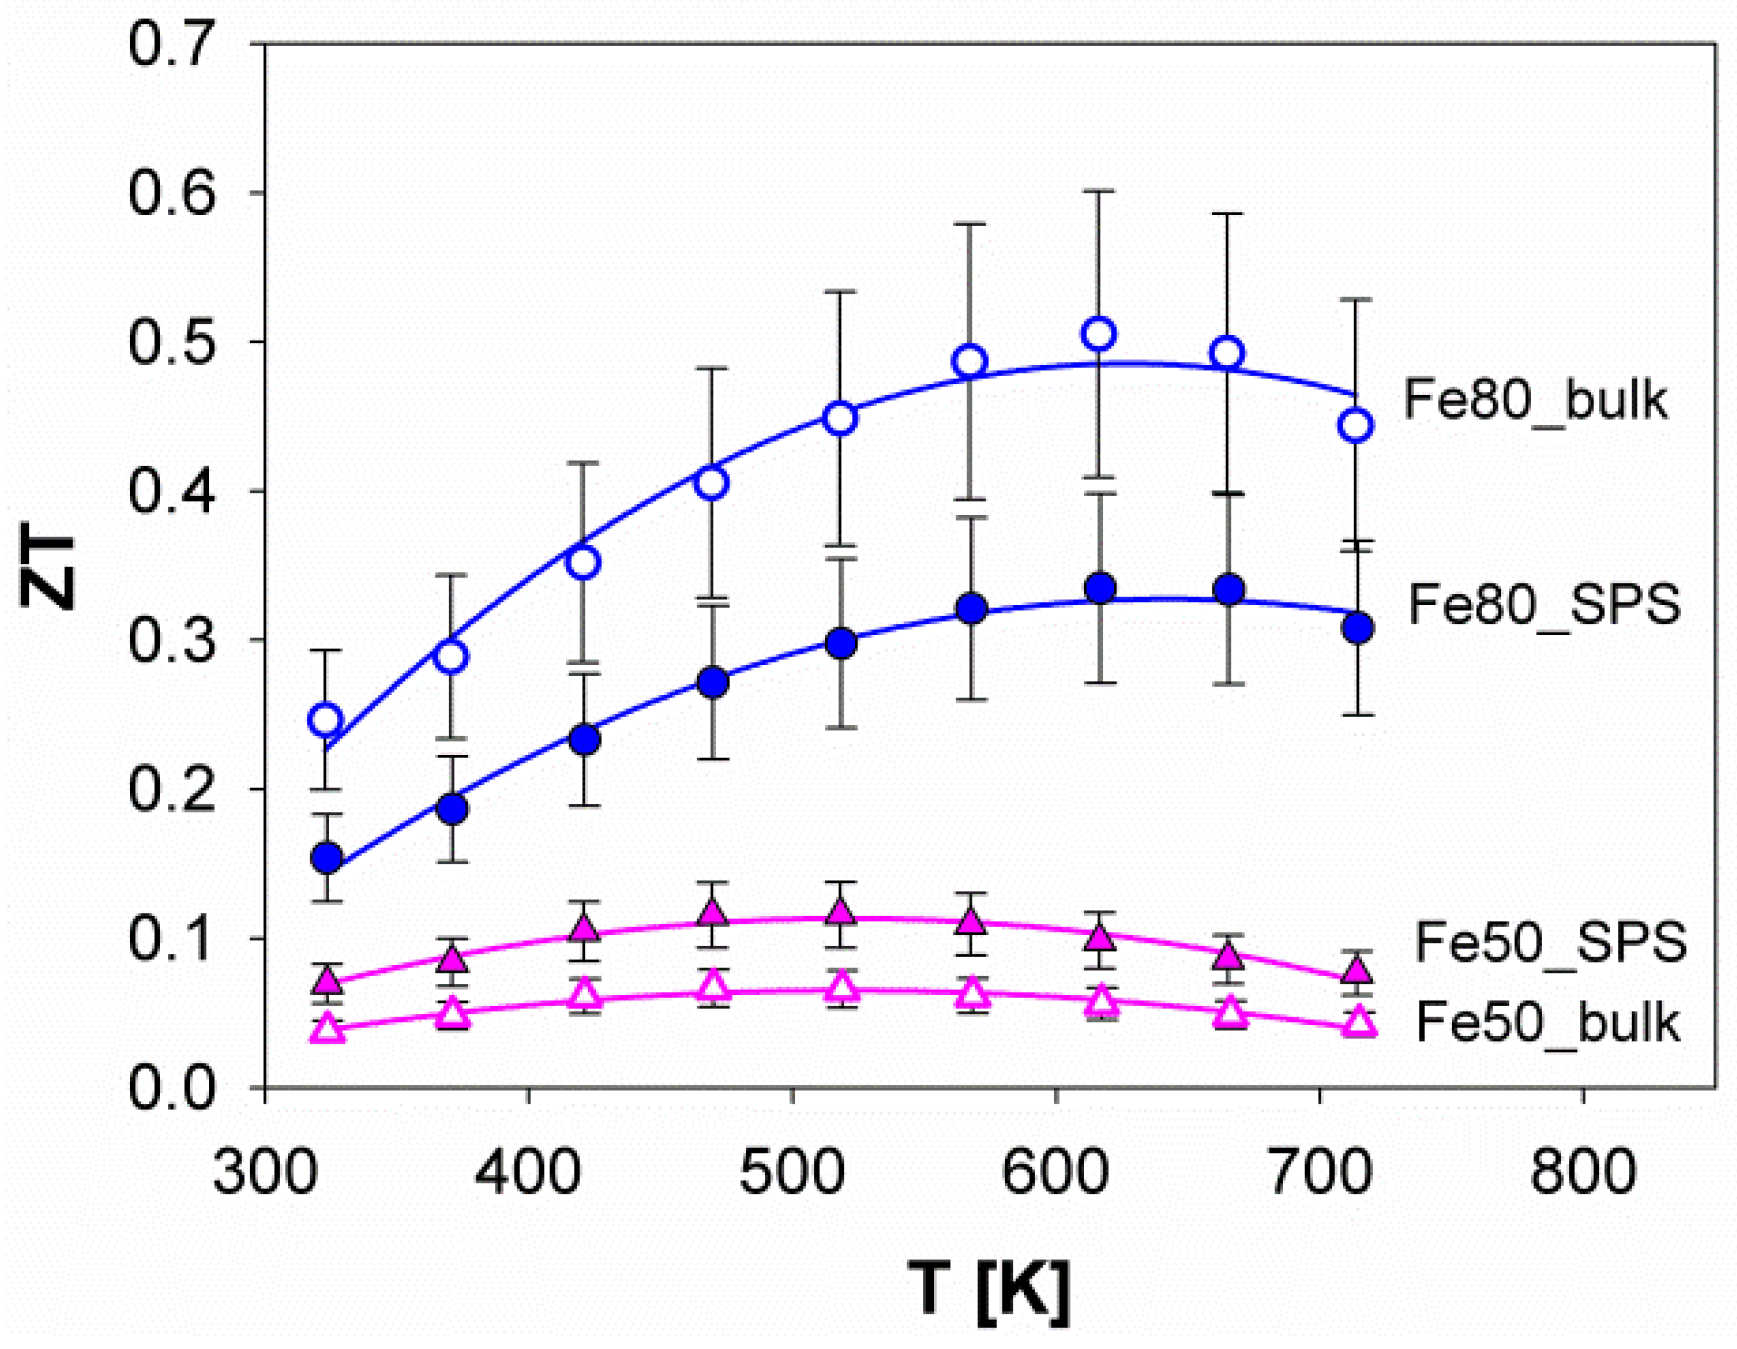
3.4. Thermoelectric Properties
4. Conclusions
Author Contributions
Funding
Acknowledgments
Conflicts of Interest
References
- Mori, T.; Priya, S. Materials for energy harvesting: At the forefront of a new wave. MRS Bull. 2018, 43, 176–180. [Google Scholar] [CrossRef]
- Petsagkourakis, I.; Tybrandt, K.; Crispin, X.; Ohkubo, I.; Satoh, N.; Mori, T. Thermoelectric materials and applications for energy harvesting power generation. Sci. Tech. Adv. Mater. 2018, 19, 836–862. [Google Scholar] [CrossRef] [PubMed]
- Wang, S.; Yang, J.; Toll, T.; Yang, J.; Zhang, W.; Tang, X. Conductivity-limiting bipolar thermal conductivity in semiconductors. Sci. Rep. 2015, 5, 10136. [Google Scholar] [CrossRef] [PubMed]
- Ceyda Yelgel, Ö.; Srivastava, G.P. Thermoelectric properties of n-type Bi2(Te0.85Se0.15)3 single crystals doped with CuBr and SbI3. Phys. Rev. B 2012, 85, 125207. [Google Scholar] [CrossRef]
- You, Y.; Su, X.; Liu, W.; Yan, Y.; Fu, J.; Cheng, X.; Zhang, C.; Tang, X. Structure and thermoelectric property of Te doped paracostibite CoSb1-xTexS compounds. J. Solid State Chem. 2018, 262, 1–7. [Google Scholar] [CrossRef]
- Carlini, R.; Artini, C.; Borzone, G.; Masini, R.; Zanicchi, G.; Costa, G.A. Synthesis and characterization of the compound CoSbS. J. Therm. Anal. Calorim. 2011, 103, 23–27. [Google Scholar] [CrossRef]
- Basit, A.; Yang, J.; Jiang, Q.; Zhou, Z.; Xin, J.; Li, X.; Li, S. Effect of Sn doping on thermoelectric properties of p-type manganese telluride. J. Alloy Compd. 2019, 777, 968–973. [Google Scholar] [CrossRef]
- Liu, Z.; Mao, J.; Liu, T.H.; Chen, G.; Ren, Z. Nano-microstructural control of phonon engineering for thermoelectric energy harvesting. MRS Bull. 2018, 43, 181–186. [Google Scholar] [CrossRef]
- Dura, O.J.; Andujar, R.; Falmbigl, M.; Rogl, P.; Lòpez de la Torre, M.A.; Bauer, E. The effect of nanostructure on the thermoelectric figure-of-merit of La0.875Sr0.125CoO3. J. Alloy Compd. 2017, 711, 381–386. [Google Scholar] [CrossRef]
- Xu, W.; Liu, Y.; Chen, B.; Liu, D.B.; Lin, Y.H.; Marcelli, A. Nano-inclusions: A novel approach to tune the thermal conductivity of In2O3. Phys. Chem. Chem. Phys. 2013, 15, 17595–17600. [Google Scholar] [CrossRef]
- Srinivasan, B.; Fontaine, B.; Gucci, F.; Dorcet, V.; Graves Saunders, T.; Yu, M.; Cheviré, F.; Boussard-Pledel, C.; Halet, J.F.; Gautier, R.; et al. Effect of the processing route on the thermoelectric performance of nanostructured CuPb18SbTe20. Inorg. Chem. 2018, 57, 12976–12986. [Google Scholar] [CrossRef]
- Liu, W.; Shi, X.; Moshwan, R.; Hong, M.; Yang, L.; Chen, Z.-G.; Zou, J. Enhancing thermoelectric performance of (Cu1-xAgx)2Se via CuAgSe secondary phase and porous design. Sust. Mater. Tech. 2018, 17, e00076. [Google Scholar] [CrossRef]
- Birkel, C.S.; Douglas, J.E.; Lettiere, B.R.; Seward, G.; Verma, N.; Zhang, Y.; Pollock, T.M.; Seshadri, R.; Stucky, G.D. Improving the thermoelectric properties of half-Heusler TiNiSn through inclusion of a second full-Heusler phase: microwave preparation and spark plasma sintering of TiNi1+xSn. Phys. Chem. Chem. Phys. 2013, 15, 6990–6997. [Google Scholar] [CrossRef]
- Ferluccio, D.A.; Smith, R.I.; Buckman, J.; Bos, J.-W.G. Impact of Nb vacancies and p-type doping of the NbCoSn-NbCoSb half-Heusler thermoelectric. Phys. Chem. Chem. Phys. 2018, 20, 3979–3987. [Google Scholar] [CrossRef] [PubMed]
- Khan, A.U.; Kobayashi, K.; Tang, D.-M.; Yamauchi, Y.; Hasegawa, K.; Mitome, M.; Xue, Y.; Jiang, B.; Tsuchiya, K.; Golberg, D.; et al. Nano-micro-porous skutterudites with 100% enhancement in ZT for high performance thermoelectricity. Nano Energy 2017, 31, 152–159. [Google Scholar] [CrossRef]
- Mori, T. Novel principles and nanostructuring methods for enhanced thermoelectrics. Small 2017, 13, 1702013. [Google Scholar] [CrossRef] [PubMed]
- Slack, G.A. New Materials and Performance Limits for Thermoelectric Cooling. In CRC Handbook of Thermoelectrics, 1st ed.; Rowe, D.M., Ed.; Taylor and Francis: Boca Raton, FL, USA, 1995; pp. 407–439. [Google Scholar]
- Uher, C. Skutterudite-Based Thermoelectrics. In Thermoelectrics Handbook—Macro to Nano, 1st ed.; Rowe, D.M., Ed.; Taylor and Francis: Boca Raton, FL, USA, 2005; Chapter 34; pp. 1–17. [Google Scholar]
- Dolyniuk, J.A.; Owens-Baird, B.; Wang, J.; Zaikina, J.V.; Kovnir, K. Clathrate thermoelectrics. Mater. Sci. Eng. R 2016, 108, 1–46. [Google Scholar] [CrossRef]
- Abramchuk, N.S.; Carrillo-Cabrera, W.; Veremchuk, I.; Oeschler, N.; Olenev, A.V.; Prots, Y.; Burkhardt, U.; Dikarev, E.V.; Grin, J.; Shevelkov, A.V. Homo- and Heterovalent Substitutions in the New Clathrates I Si30P16Te8–xSex and Si30+xP16–xTe8–xBrx: Synthesis, Crystal Structure, and Thermoelectric Properties. Inorg. Chem. 2012, 51, 11396–11405. [Google Scholar] [CrossRef]
- Chen, S.; Ren, Z. Recent progress of half-Heusler for moderate temperature thermoelectric applications. Mater. Today 2013, 16, 387–395. [Google Scholar] [CrossRef]
- Sales, B.C. Filled skutterudites. In Handbook on the Physics and Chemistry of Rare Earths, 1st ed.; Gschneidner, K.A., Jr., Bünzli, J.-C.G., Pecharsky, V.K., Eds.; North Holland: Amsterdam, The Netherlands, 2003; Volume 33, pp. 1–34. [Google Scholar]
- Chakoumakos, B.C.; Sales, B.C. Skutterudites: Their structural response to filling. J. Alloy Compd. 2006, 407, 87–93. [Google Scholar] [CrossRef]
- Uher, C. In search of efficient n-type skutterudite thermoelectrics. In Proceedings of the 21st Conference on Thermoelectrics, Long Beach, CA, USA, 29 August 2002; IEEE: Piscataway, NJ, USA, 2002; pp. 35–41. [Google Scholar]
- Keppens, V.; Mandrus, D.; Sales, B.C.; Chakoumakos, B.C.; Dai, P.; Coldea, R.; Maple, M.B.; Gajewski, D.A.; Freeman, E.J.; Bennington, S. Localized vibrational modes in metallic solids. Nature 1998, 395, 876–878. [Google Scholar] [CrossRef]
- Sootsman, J.R.; Chung, D.Y.; Kanatzidis, M. New and old concepts in thermoelectric materials. Angew. Chem. Int. Edit. 2009, 48, 8616–8639. [Google Scholar] [CrossRef]
- Tang, Y.; Chen, S.; Jeffrey-Snyder, G. Temperature dependent solubility of Yb in Yb-CoSb3 skutterudite and its effect on preparation, optimization and lifetime of thermoelectrics. J. Materiomics. 2015, 1, 75–84. [Google Scholar] [CrossRef]
- Liu, R.; Cho, J.Y.; Yang, J.; Zhang, W.; Chen, L. Thermoelectric transport properties of RyFe3NiSb12 (R = Ba, Nd and Yb). J. Mater. Sci. Technol. 2014, 30, 1134–1140. [Google Scholar] [CrossRef]
- Chapon, L.; Ravot, D.; Tedenac, J.C. Nickel-substituted skutterudites: synthesis, structural and electrical properties. J. Alloy Compd. 1999, 282, 58–63. [Google Scholar] [CrossRef]
- Bérardan, D.; Alleno, E.; Godart, C.; Rouleau, O. Rodriguez-Carvajal, Preparation and chemical properties of the skutterudites (Ce-Yb)yFe4-x(Co/Ni)xSb12. Mater. Res. Bull. 2005, 40, 537–551. [Google Scholar] [CrossRef]
- Bourgouin, B.; Bérardan, D.; Alleno, E.; Godart, C.; Rouleau, O.; Leroy, E. Preparation and thermopower of new mischmetal-based partially filled skutterudites MmyFe4−x(Co/Ni)xSb12. J. Alloy Compd. 2005, 399, 47–51. [Google Scholar] [CrossRef]
- Rogl, G.; Grytsiv, A.; Falmbigl, M.; Bauer, E.; Rogl, P.; Zehetbauer, M.; Gelbstein, Y. Thermoelectric properties of p-type didymium (DD) based skutterudites DDy(Fe1−xNix)4Sb12 (0.13 ≤ x ≤ 0.25, 0.46 ≤ y ≤ 0.68). J. Alloy Compd. 2012, 537, 242–249. [Google Scholar] [CrossRef]
- Zhang, L.; Grytsiv, A.; Bonarski, B.; Kerber, M.; Setman, D.; Schafler, E.; Rogl, P.; Bauer, E.; Hilscher, G.; Zehetbauer, M. Impact of high pressure torsion on the microstructure and physical properties of Pr0.67Fe3CoSb12, Pr0.71Fe3.5Ni0.5Sb12, and Ba0.06Co4Sb12. J. Alloy Compd. 2010, 494, 78–83. [Google Scholar] [CrossRef]
- Artini, C.; Zanicchi, G.; Costa, G.A.; Carnasciali, M.M.; Fanciulli, C.; Carlini, R. Correlations between structural and electronic properties in the filled skutterudite Smy(FexNi1-x)4Sb12. Inorg. Chem. 2016, 55, 2574–2583. [Google Scholar] [CrossRef]
- Artini, C.; Fanciulli, C.; Zanicchi, G.; Costa, G.A.; Carlini, R. Thermal expansion and high temperature structural features of the filled skutterudite Smβ(FeαNi1-α)4Sb12. Intermetallics 2017, 87, 31–37. [Google Scholar] [CrossRef]
- Rogl, G.; Grytsiv, A.; Heinrich, P.; Bauer, E.; Kumar, P.; Peranio, N.; Eibl, O.; Horky, J.; Zehetbauer, M.; Rogl, P. New bilk p-type skutterudites DD0.7Fe2.7Co1.3Sb12-xXx (X = Ge, Sn) reaching ZT > 1.3. Acta Mater. 2015, 91, 227–238. [Google Scholar] [CrossRef]
- Duan, F.; Zhang, L.; Dong, J.; Sakamoto, J.; Xu, B.; Li, X.; Tian, Y. Thermoelectric properties of Sn substituted p-type Nd filled skutterudites. J. Alloy Compd. 2015, 639, 68–73. [Google Scholar] [CrossRef]
- Rogl, G.; Grytsiv, A.; Bauer, E.; Rogl, P.; Zehetbauer, M. Thermoelectric properties of novel skutterudites with didymium: DDy(Fe1-xCox)4Sb12 and DDy(Fe1-xNix)4Sb12. Intermetallics 2010, 18, 57–64. [Google Scholar] [CrossRef]
- Kitagawa, H.; Hasaka, M.; Morimura, T.; Nakashima, H.; Kondo, S. Skutterudite structure and thermoelectric property in CefFe8-xCoxSb24 (f = 0-2, x = 0-8). Mater. Res. Bull. 2000, 35, 185–192. [Google Scholar] [CrossRef]
- Kong, L.; Jia, X.; Zhang, Y.; Sun, B.; Liu, B.; Liu, H.; Wang, C.; Liu, B.; Chen, J.; Ma, H. N-type Ba0.3Ni0.15Co3.85Sb12 skutterudite: High pressure processing technique and thermoelectric properties. J. Alloy Compd. 2018, 734, 36–42. [Google Scholar] [CrossRef]
- Zhang, L.; Rogl, G.; Grytsiv, A.; Puchegger, S.; Koppensteiner, J.; Spieckermann, F.; Kabelka, H.; Reinecker, M.; Rogl, P.; Schranz, W.; et al. Mechanical properties of filled antimonide skutterudites. Mater. Sci. Eng. B 2010, 170, 26–31. [Google Scholar] [CrossRef]
- Rogl, G.; Grytsiv, A.; Royanian, E.; Heinrich, P.; Bauer, E.; Rogl, P.; Zehetbauer, M.; Puchegger, S.; Reinecker, M.; Schranz, W. New p and n-type skutterudites with ZT>1 and nearly identical thermal expansion and mechanical properties. Acta Mater. 2013, 61, 4066–4079. [Google Scholar] [CrossRef]
- Kaltzoglou, A.; Vaqueiro, P.; Knight, K.S.; Powell, A.V. Synthesis, characterization and physical properties of the skutterudites YbxFe2Ni2Sb12 (0 ≤ x ≤ 0.4). J. Solid State Chem. 2012, 193, 36–41. [Google Scholar] [CrossRef]
- Dahal, T.; Jie, Q.; Lan, Y.; Guo, C.; Ren, Z. Thermoelectric performance of Ni compensated cerium and neodymium double filled p-type skutterudites. Phys. Chem. Chem. Phys. 2014, 16, 18170–18175. [Google Scholar] [CrossRef]
- Ballikaya, S.; Uzar, N.; Yildirim, S.; Salvador, J.R.; Uher, C. High thermoelectric performance of In, Yb, Ce multiple filled CoSb3 based skutterudite compounds. J. Solid State Chem. 2012, 193, 31–35. [Google Scholar] [CrossRef]
- Rogl, G.; Zhang, L.; Rogl, P.; Grytsiv, A.; Falmbigl, M.; Rajs, D.; Kriegisch, M.; Müller, H.; Bauer, E.; Koppensteiner, J.; et al. Thermal expansion of skutterudites. J. Appl. Phys. 2010, 107, 043507. [Google Scholar] [CrossRef]
- Matsubara, M.; Masuoka, Y.; Asahi, R. Effects of doping IIIB elements (Al, Ga, In) on thermoelectric properties of nanostructured n-type filled skutterudite compounds. J. Alloy Compd. 2019, 774, 731–738. [Google Scholar] [CrossRef]
- Karthikeyan, N.; Sivaprasad, G.; Jaiganesh, G.; Anbarasu, V.; Partha Pratim, J.; Sivakumar, K. Thermoelectric properties of Se and Zn/Cd/Sn double substituted Co4Sb12 skutterudite compounds. Phys. Chem. Chem. Phys. 2017, 19, 28116–28126. [Google Scholar]
- Artini, C.; Castellero, A.; Baricco, M.; Buscaglia, M.T.; Carlini, R. Structure, microstructure and microhardness of rapidly solidified Smy(FexNi1-x)4Sb12 (x = 0.45, 0.50, 0.70, 1) thermoelectric compounds. Solid State Sci. 2018, 79, 71–78. [Google Scholar] [CrossRef]
- Carlini, R.; Khan, A.U.; Ricciardi, R.; Mori, T.; Zanicchi, G. Synthesis, characterization and thermoelectric properties of Sm filled Fe4-xNixSb12. J. Alloy Compd. 2016, 655, 321–326. [Google Scholar] [CrossRef]
- Artini, C.; Latronico, G.; Carlini, R.; Saini, S.; Takeuchi, T.; Choi, S.; Baldini, A.; Anselmi-Tamburini, U.; Valenza, F.; Mele, P. Effect of different processing routes on the power factor of the filled skutterudite Smy(FexNi1-x)4Sb12. ES Mater. Manuf. 2019. [Google Scholar] [CrossRef]
- Artini, C.; Parodi, N.; Latronico, G.; Carlini, R. Formation and decomposition process of the filled skutterudite Smy(FexNi1-x)4Sb12 (0.40 ≤ x ≤ 1) as revealed by differential thermal analysis. J. Mater. Eng. Perform. 2018, 27, 6259–6265. [Google Scholar] [CrossRef]
- Artini, C.; Carlini, R. Influence of composition and thermal treatments on microhardness of the filled skutterudite Smy(FexNi1-x)4Sb12. J. Nanosci. Nanotechnol. 2017, 17, 1634–1639. [Google Scholar] [CrossRef]
- Carlini, R.; Parodi, N.; Soggia, F.; Latronico, G.; Carnasciali, M.M.; Artini, C. Corrosion behavior of Smy(FexNi1-x)4Sb12 (0.40 ≤ x ≤ 0.80) in sodium chloride solutions studied by electron microscopy and ICP-AES. J. Mater. Eng. Perform. 2018, 27, 6266–6273. [Google Scholar] [CrossRef]
- Weast, R.C. Handbook of Chemistry and Physics, 56th ed.; CRC Press: Cleveland, OH, USA, 1975. [Google Scholar]
- Schindelin, J.; Arganda-Carreras, I.; Frise, E.; Kaynig, V.; Longair, M.; Pietzsch, T.; Preibisch, S.; Rueden, C.; Saalfeld, S.; Schmid, B.; et al. Fiji: an open-source platform for biological-image analysis. Nat. Methods 2012, 9, 676–682. [Google Scholar] [CrossRef]
- Schneider, C.A.; Rasband, W.S.; Eliceiri, K.W. NIH Image to ImageJ: 25 years of image analysis. Nat. Methods 2012, 9, 671–675. [Google Scholar] [CrossRef]
- Rodriguez-Carvajal, J. Recent advances in magnetic structure determination by neutron powder diffraction. Physica B 1993, 192, 55–69. [Google Scholar] [CrossRef]
- Alleno, E.; Bérardan, D.; Byl, C.; Candolfi, C.; Daou, R.; Decourt, R.; Guilmeau, E.; Hébert, S.; Hejtmanek, J.; Lenoir, B.; et al. A round robin test of the uncertainty on the measurement of the thermoelectric dimensionless figure of merit of Co0.97Ni0.03Sb3. Rev. Sci. Instr. 2015, 86, 011301. [Google Scholar] [CrossRef]
- Shannon, R.D. Revised effective ionic radii and systematic studies of interatomic distances in halides and chalcogenides. Acta Crystallogr. A 1976, 32, 751–767. [Google Scholar] [CrossRef]
- Morimura, T.; Hasaka, M. Partially filled skutterudite structure in CefFe8-xNixSb24. Scr. Mater. 2003, 48, 495–500. [Google Scholar]
- Shi, X.; Kong, H.; Li, C.-P.; Uher, C.; Yang, J.; Salvador, J.R.; Wang, H.; Chen, L.; Zhang, W. Low thermal conductivity and high thermoelectric figure of merit in n-type BaxYbyCo4Sb12 double-filled skutterudites. Appl. Phys. Lett. 2008, 92, 182101. [Google Scholar] [CrossRef]
- Rogl, G.; Grytsiv, A.; Bursik, J.; Horky, J.; Anbalagan, R.; Bauer, E.; Mallik, R.C.; Rogl, P.; Zehetbauer, M. Changes in microstructure and physical properties of skutterudites after severe plastic deformation. Phys. Chem. Chem. Phys. 2015, 17, 3715–3722. [Google Scholar] [CrossRef]
- Li, X.; Zhang, Q.; Kang, Y.; Chen, C.; Zhang, L.; Yu, D.; Tian, Y.; Xu, B. High pressure synthesized Ca-filled CoSb3 skutterudites with enhanced thermoelectric properties. J. Alloy Compd. 2016, 677, 61–65. [Google Scholar] [CrossRef]
- Artini, C.; Joseph, B.; Costa, G.A.; Pani, M. Crystallographic properties of the Ce1-xLuxO2-x/2 system at pressures up to 7 GPa. Solid State Ionics 2018, 320, 152–158. [Google Scholar] [CrossRef]
- Goldsmid, H.J.; Sharp, J.W. Estimation of the thermal band gap of a semiconductor from Seebeck measurements. J. Electron. Mater. 1999, 28, 869–872. [Google Scholar] [CrossRef]
- He, Q.; Hu, S.; Tang, X.; Lan, Y.; Yang, J.; Wang, X.; Ren, Z.; Hao, Q.; Chen, G. The great improvement effect of pores on ZT in Co1-xNixSb3 system. Appl. Phys. Lett. 2008, 93, 042108. [Google Scholar] [CrossRef]
- Horne, R.A. Effect of oxide impurities on the thermoelectric powers and electrical resistivities of bismuth, antimony, tellurium, and bismuth-tellurium alloys. J. Appl. Phys. 1959, 30, 393. [Google Scholar] [CrossRef]
- Janaki, J.; Mani, A.; Satya, A.T.; Geetha Kumariy, T.; Kalavathi, S.; Bharathi, A. Influence of Ni doping on the electrical and structural properties of FeSb2. Phys. Status Solidi B 2012, 249, 1756–1760. [Google Scholar] [CrossRef]
- Uher, C.; Hu, S.; Yang, J. Cerium filling and lattice thermal conductivity of skutterudites. In Proceedings of the 17th International Conference on Thermoelectrics, Nagoya, Japan, 28 May 1998; pp. 306–309. [Google Scholar]
- Kim, H.-S.; Gibbs, Z.M.; Tang, Y.; Wang, H.; Snyder, G.J. Characterization of Lorenz number with Seebeck coefficient measurement. APL Mater. 2015, 3, 041506. [Google Scholar] [CrossRef]
- Aversano, F.; Branz, S.; Bassani, E.; Fanciulli, C.; Ferrario, A.; Boldrini, S.; Baricco, M.; Castellero, A. Effect of rapid solidification on the synthesis and thermoelecrtric properties of Yb-filled Co4Sb12 skutterudite. J. Alloy Compd. 2019, 796, 33–41. [Google Scholar] [CrossRef]


| Sample | Refined Composition | Additional Phases | χ2 | RB |
|---|---|---|---|---|
| Fe90_bulk | Sm0.39(1)Gd0.08(1)(Fe0.87(1)Ni0.13(1))4Sb12 | Sb (1 wt.%), (Fe,Ni)Sb2 (14 wt.%), (Fe,Ni)(Gd,Sm)Sb3 * | 6.4 | 5.8 |
| Fe80_ bulk | Sm0.31(1)Gd0.11(1)(Fe0.78(1)Ni0.22(1))4Sb12 | Sb (11 wt.%), (Fe,Ni)Sb2*, (Sm,Gd)2Sb5 * | 4.0 | 4.0 |
| Fe80_SPS | Sm0.34(1)Gd0.08(1)(Fe0.76(1)Ni0.24(1))4Sb12 | Sb (2 wt.%), (Fe,Ni)Sb2 (7 wt.%), (Sm,Gd)2Sb5 * | 4.2 | 3.0 |
| Fe70_ bulk | Sm0.23(1)Gd0.08(1)(Fe0.68(1)Ni0.32(1))4Sb12 | Sb (11 wt.%), (Fe,Ni)Sb2*, Sb5(Gd,Sm)2 * | 14.8 | 6.9 |
| Fe63_ bulk | Sm0.19(1)Gd0.08(1)(Fe0.63(1)Ni0.37(1))4Sb12 | Sb *, (Fe,Ni)SmSb3 * | 5.8 | 4.8 |
| Fe50_ bulk | Sm0.09(1)Gd0.05(1)(Fe0.51(1)Ni0.49(2))4Sb12 | (Fe,Ni)Sb2 (1 wt.%), (Ni,Fe)(Gd,Sm)Sb3 * | 12.2 | 4.7 |
| Fe50_SPS | Sm0.08(1)Gd0.07(1)(Fe0.51(1)Ni0.49(2))4Sb12 | (Fe,Ni)Sb2 (2 wt.%), (Ni,Fe)(Gd,Sm)Sb3 *, Ni0.4Sb2(Sm,Gd) * | 6.5 | 5.8 |
| Sample | Porosity [%] | Vickers Microhardness | Density [g/cm3] | Density [%] |
|---|---|---|---|---|
| Fe80_bulk | 19 | 328(70) | 6.40 | 82 |
| Fe80_SPS | 10 | 433(50) | 6.87 | 88 |
| Fe50_bulk | 16 | 460(49) | 6.62 | 87 |
| Fe50_SPS | 4 | 475(55) | 7.33 | 97 |
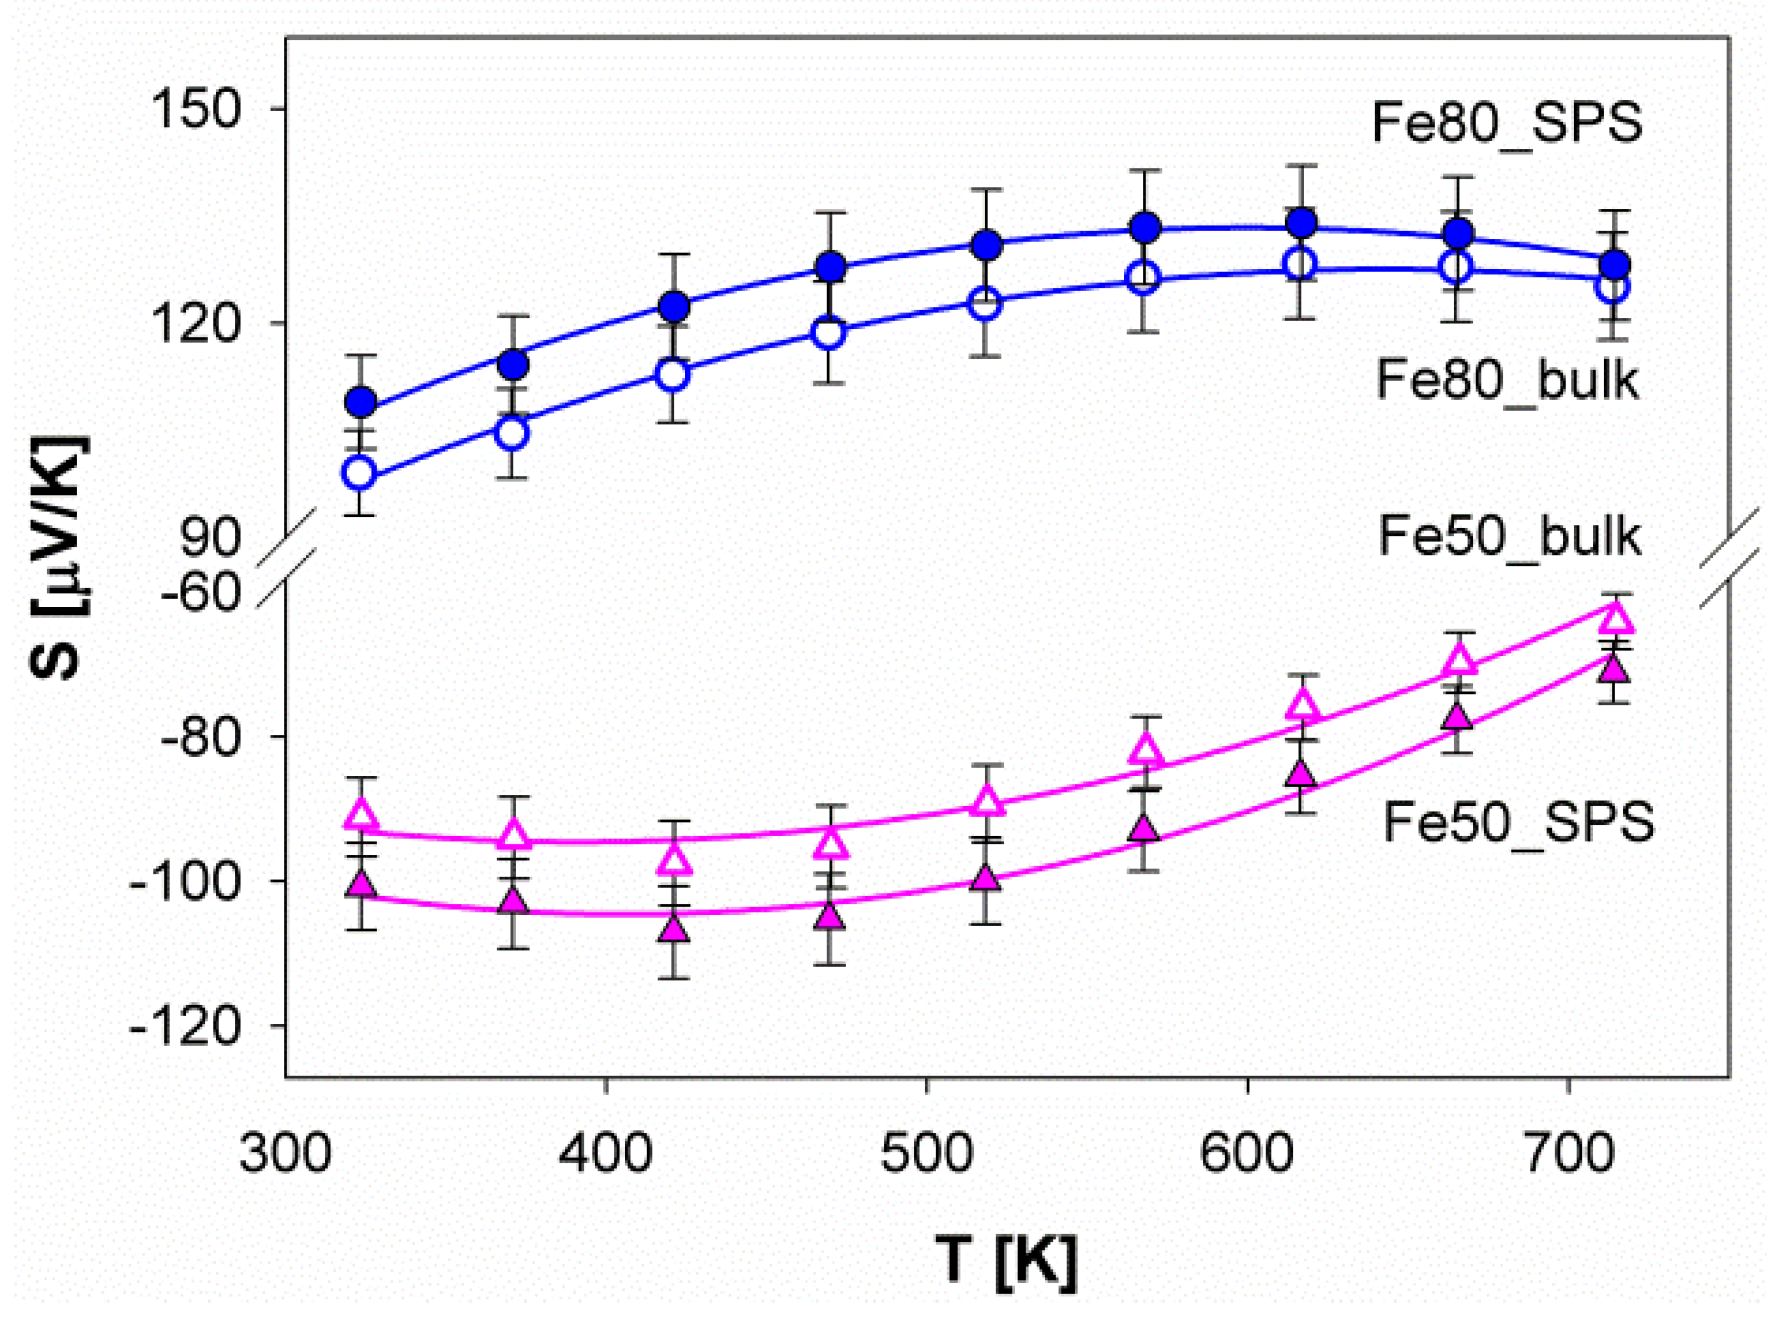
| Sample | Smax [μV/K] | Tmax [K] | Eg [meV] |
|---|---|---|---|
| Fe80_bulk | 128 | 642 | 164 |
| Fe80_SPS | 133 | 600 | 160 |
| Fe50_bulk | −97 | 409 | 79 |
| Fe50_SPS | −106 | 413 | 88 |
© 2019 by the authors. Licensee MDPI, Basel, Switzerland. This article is an open access article distributed under the terms and conditions of the Creative Commons Attribution (CC BY) license (http://creativecommons.org/licenses/by/4.0/).
Share and Cite
Artini, C.; Carlini, R.; Spotorno, R.; Failamani, F.; Mori, T.; Mele, P. Structural Properties and Thermoelectric Performance of the Double-Filled Skutterudite (Sm,Gd)y(FexNi1-x)4Sb12. Materials 2019, 12, 2451. https://doi.org/10.3390/ma12152451
Artini C, Carlini R, Spotorno R, Failamani F, Mori T, Mele P. Structural Properties and Thermoelectric Performance of the Double-Filled Skutterudite (Sm,Gd)y(FexNi1-x)4Sb12. Materials. 2019; 12(15):2451. https://doi.org/10.3390/ma12152451
Chicago/Turabian StyleArtini, Cristina, Riccardo Carlini, Roberto Spotorno, Fainan Failamani, Takao Mori, and Paolo Mele. 2019. "Structural Properties and Thermoelectric Performance of the Double-Filled Skutterudite (Sm,Gd)y(FexNi1-x)4Sb12" Materials 12, no. 15: 2451. https://doi.org/10.3390/ma12152451
APA StyleArtini, C., Carlini, R., Spotorno, R., Failamani, F., Mori, T., & Mele, P. (2019). Structural Properties and Thermoelectric Performance of the Double-Filled Skutterudite (Sm,Gd)y(FexNi1-x)4Sb12. Materials, 12(15), 2451. https://doi.org/10.3390/ma12152451