Multi-Scale Structural Assessment of Cellulose Fibres Cement Boards Subjected to High Temperature Treatment


Abstract
1. Introduction
2. Materials and Methods
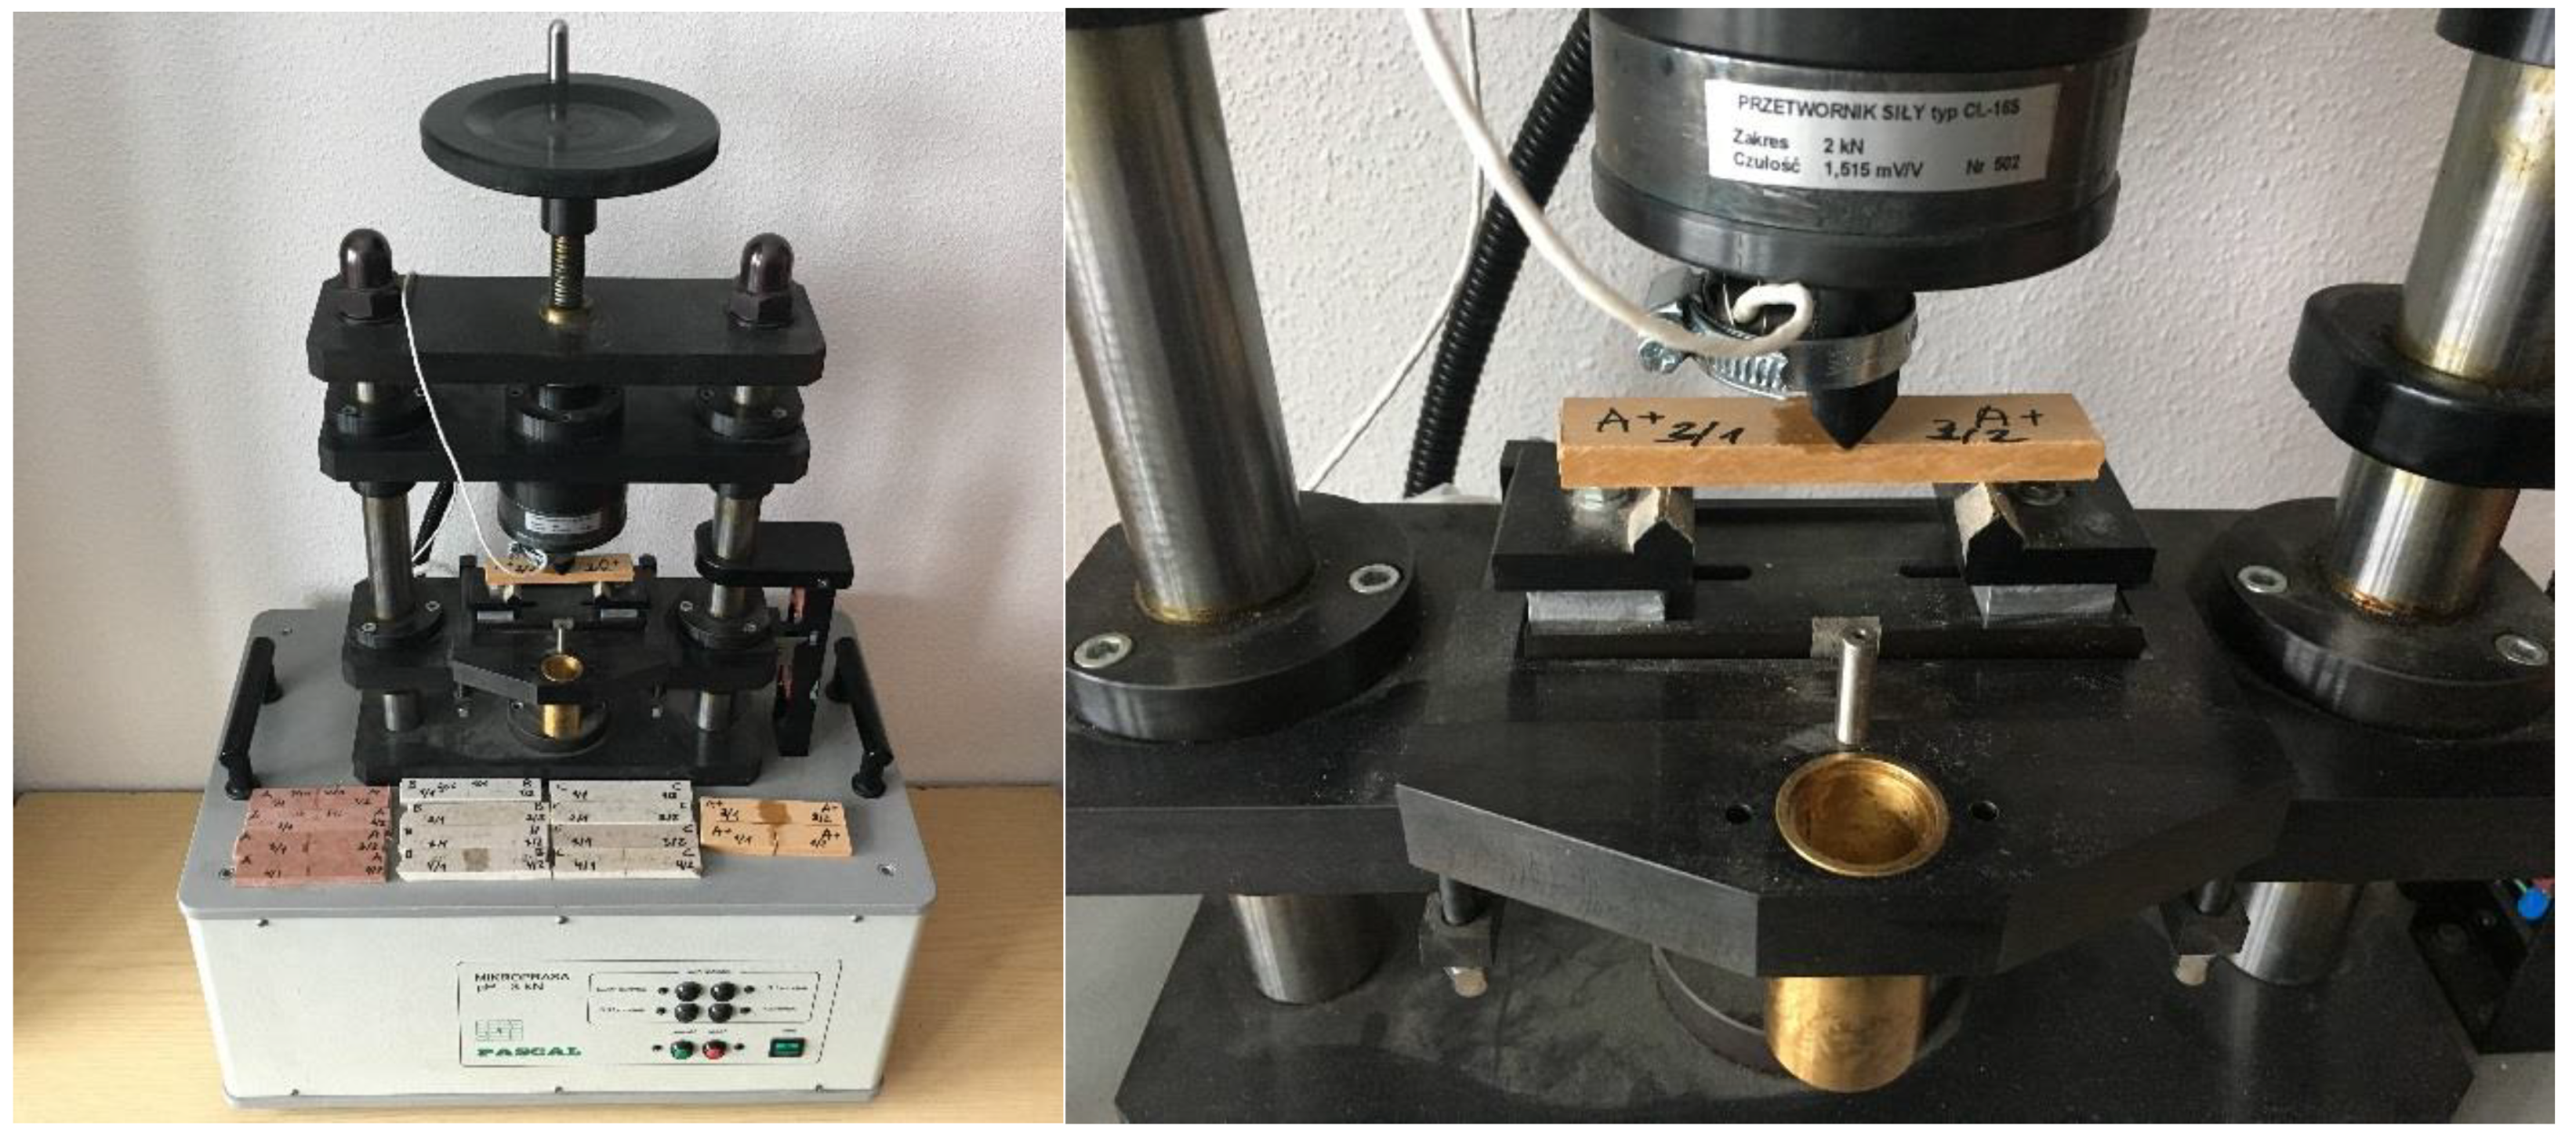
- F is the loading force (N);
- ls is the length of the support span (mm);
- b is the specimen width (mm); and
- e is the specimen thickness (mm).
3. Results of Multiscale Approach
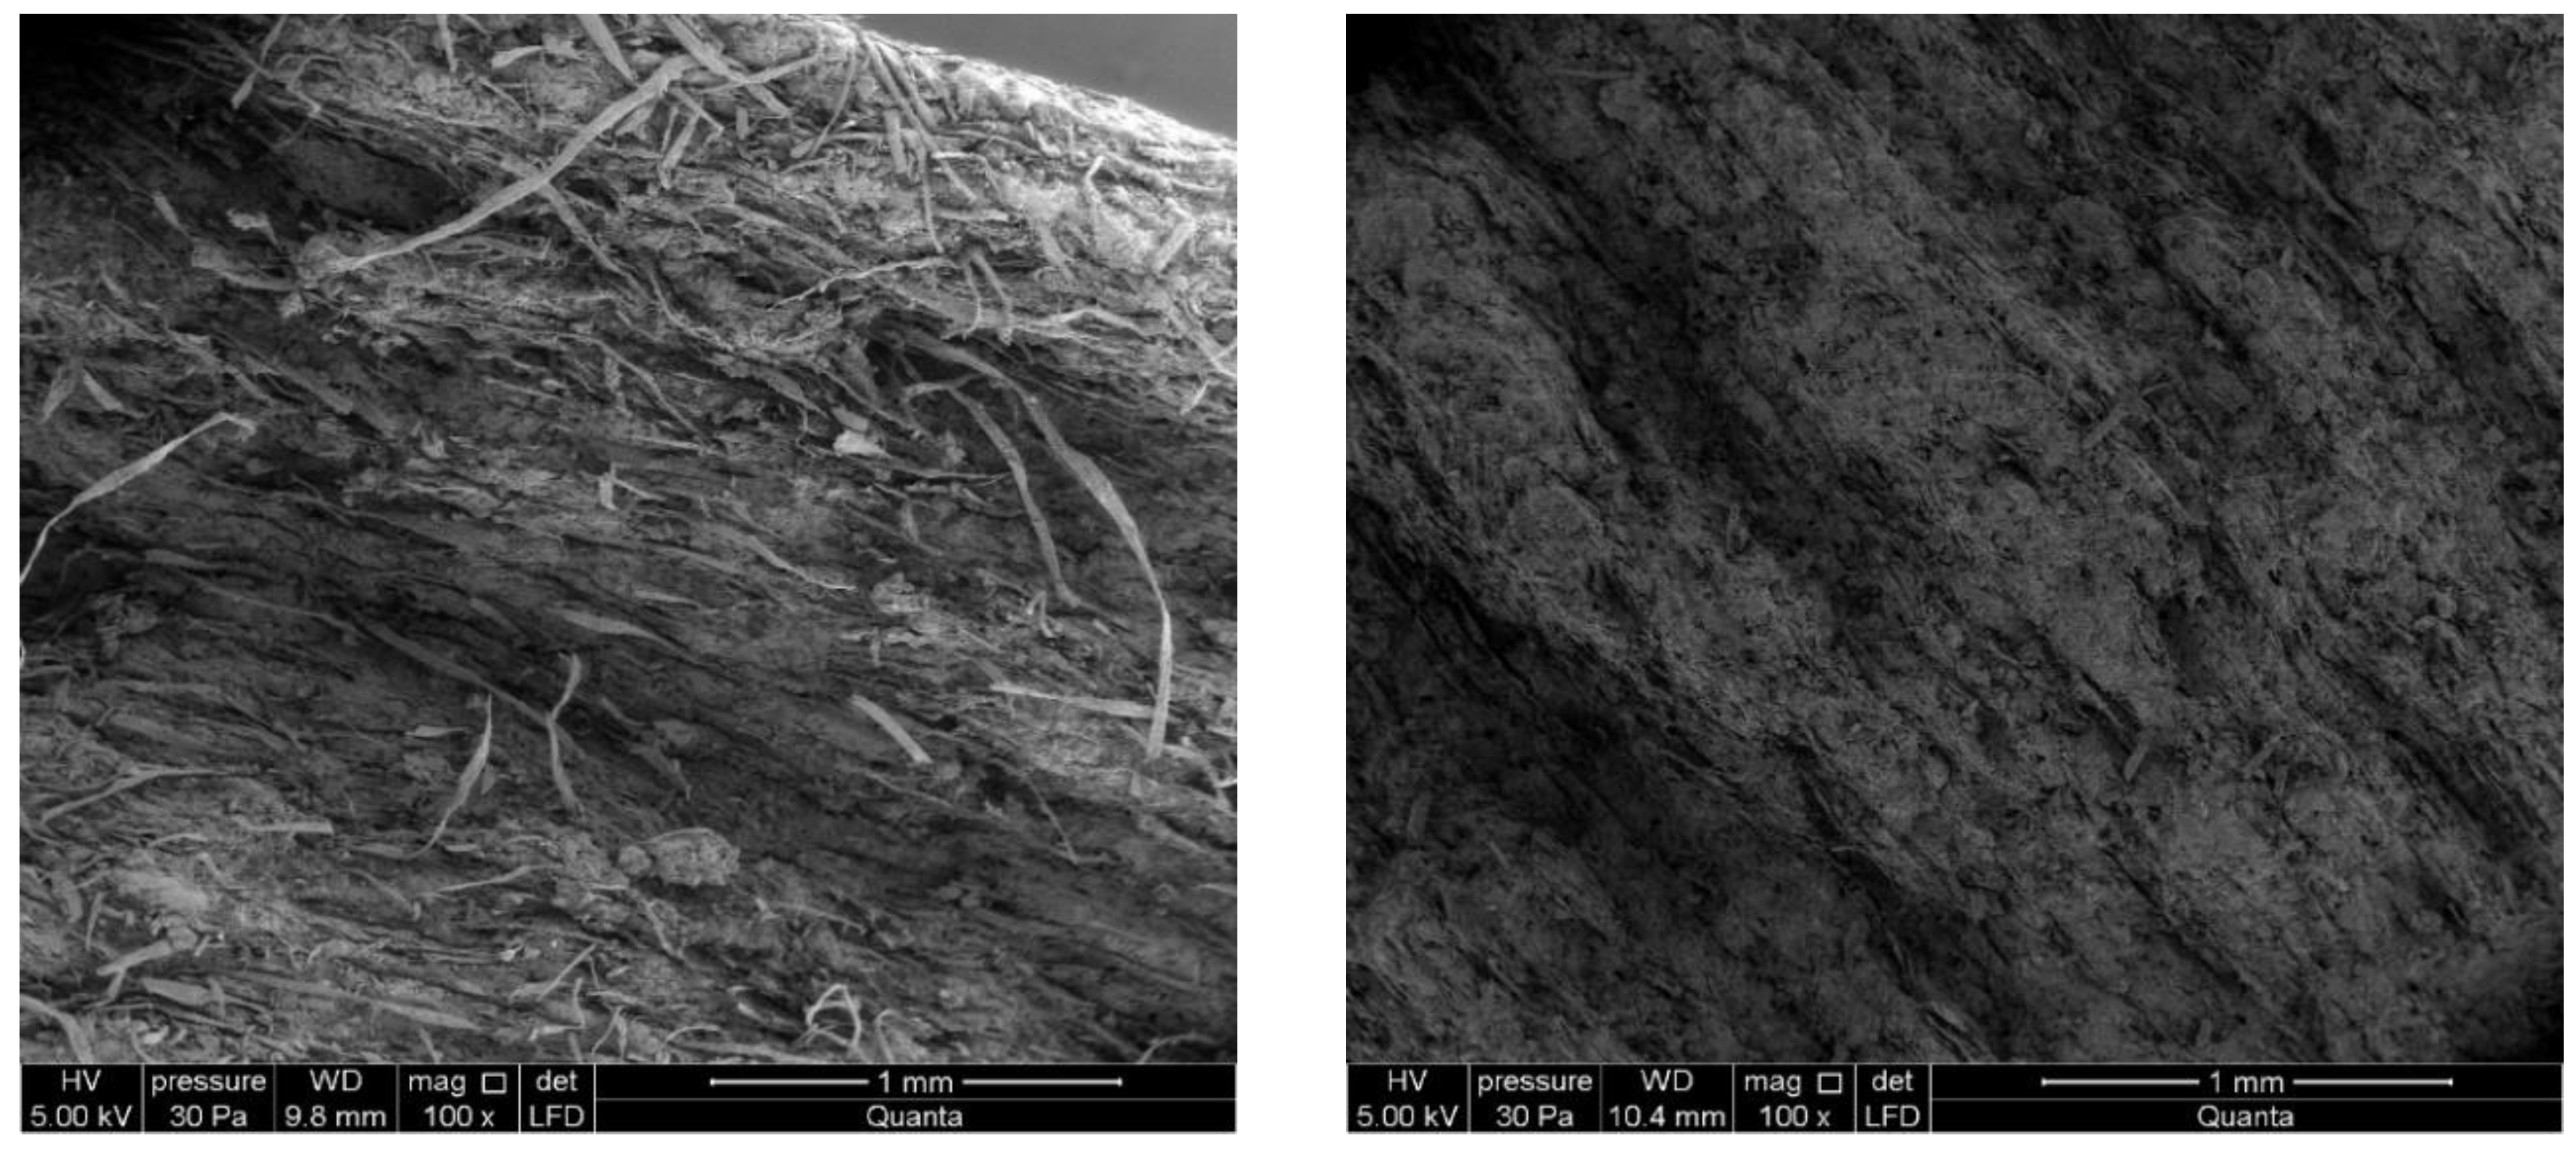
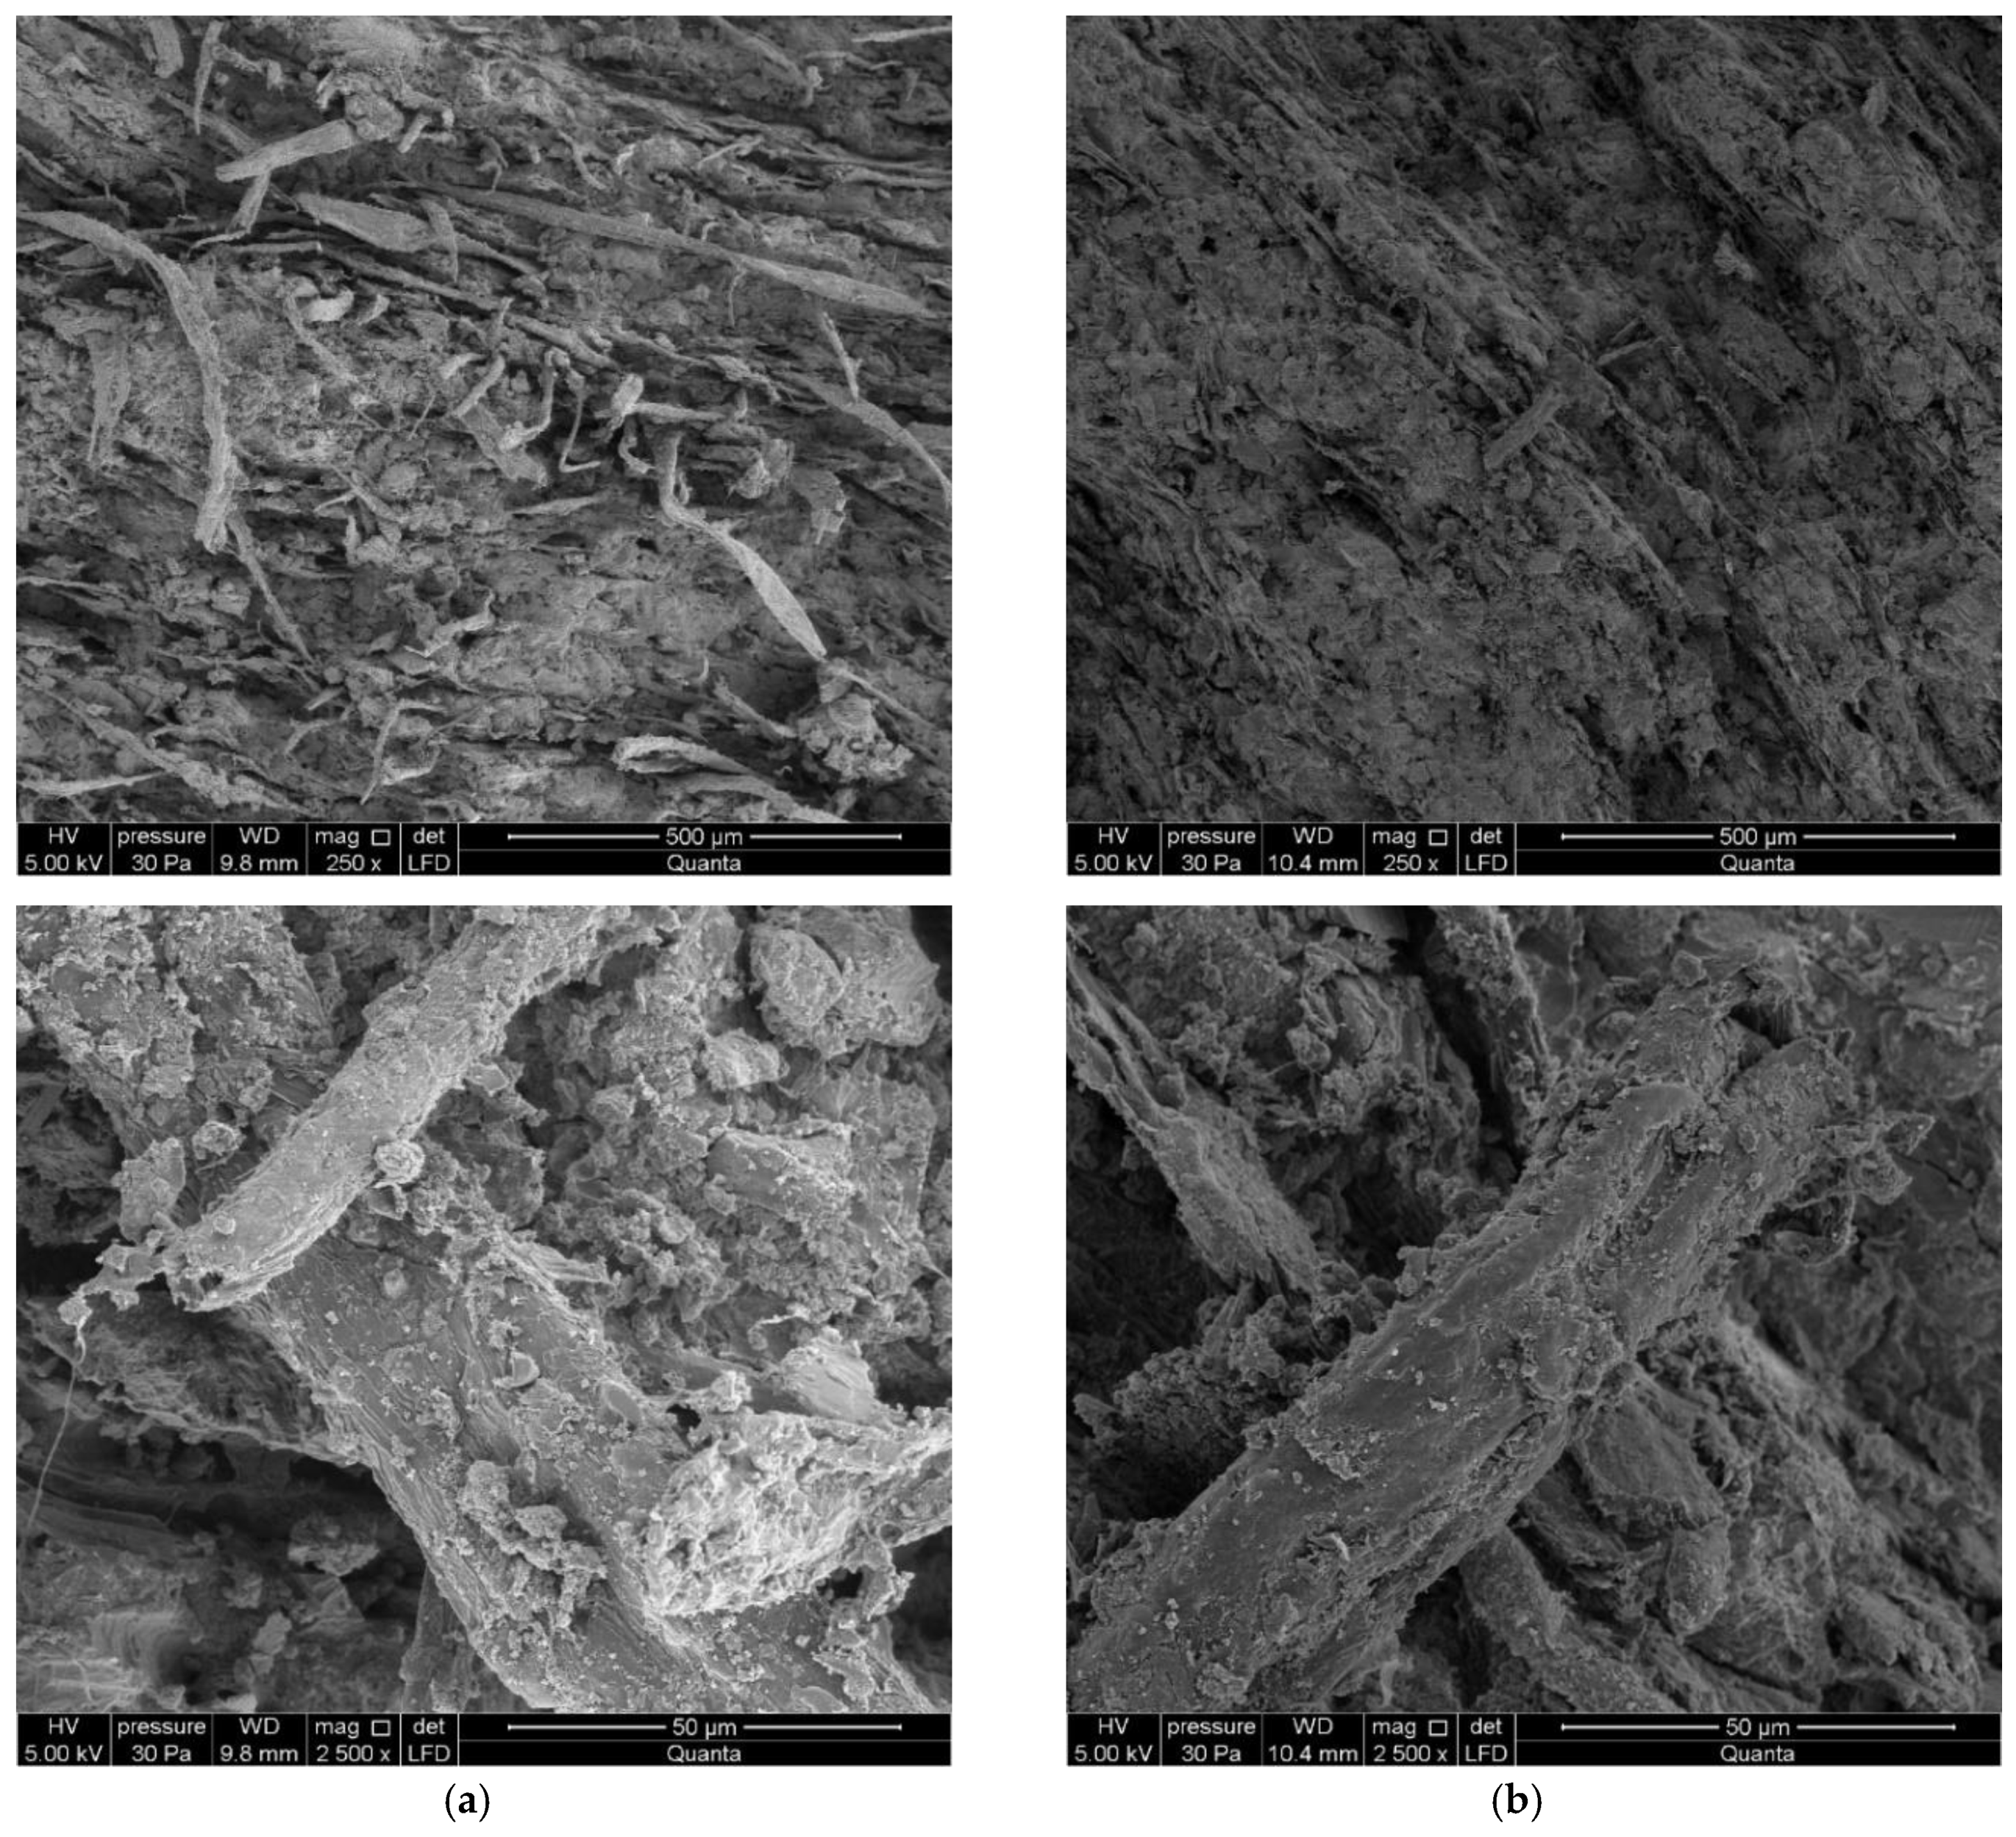
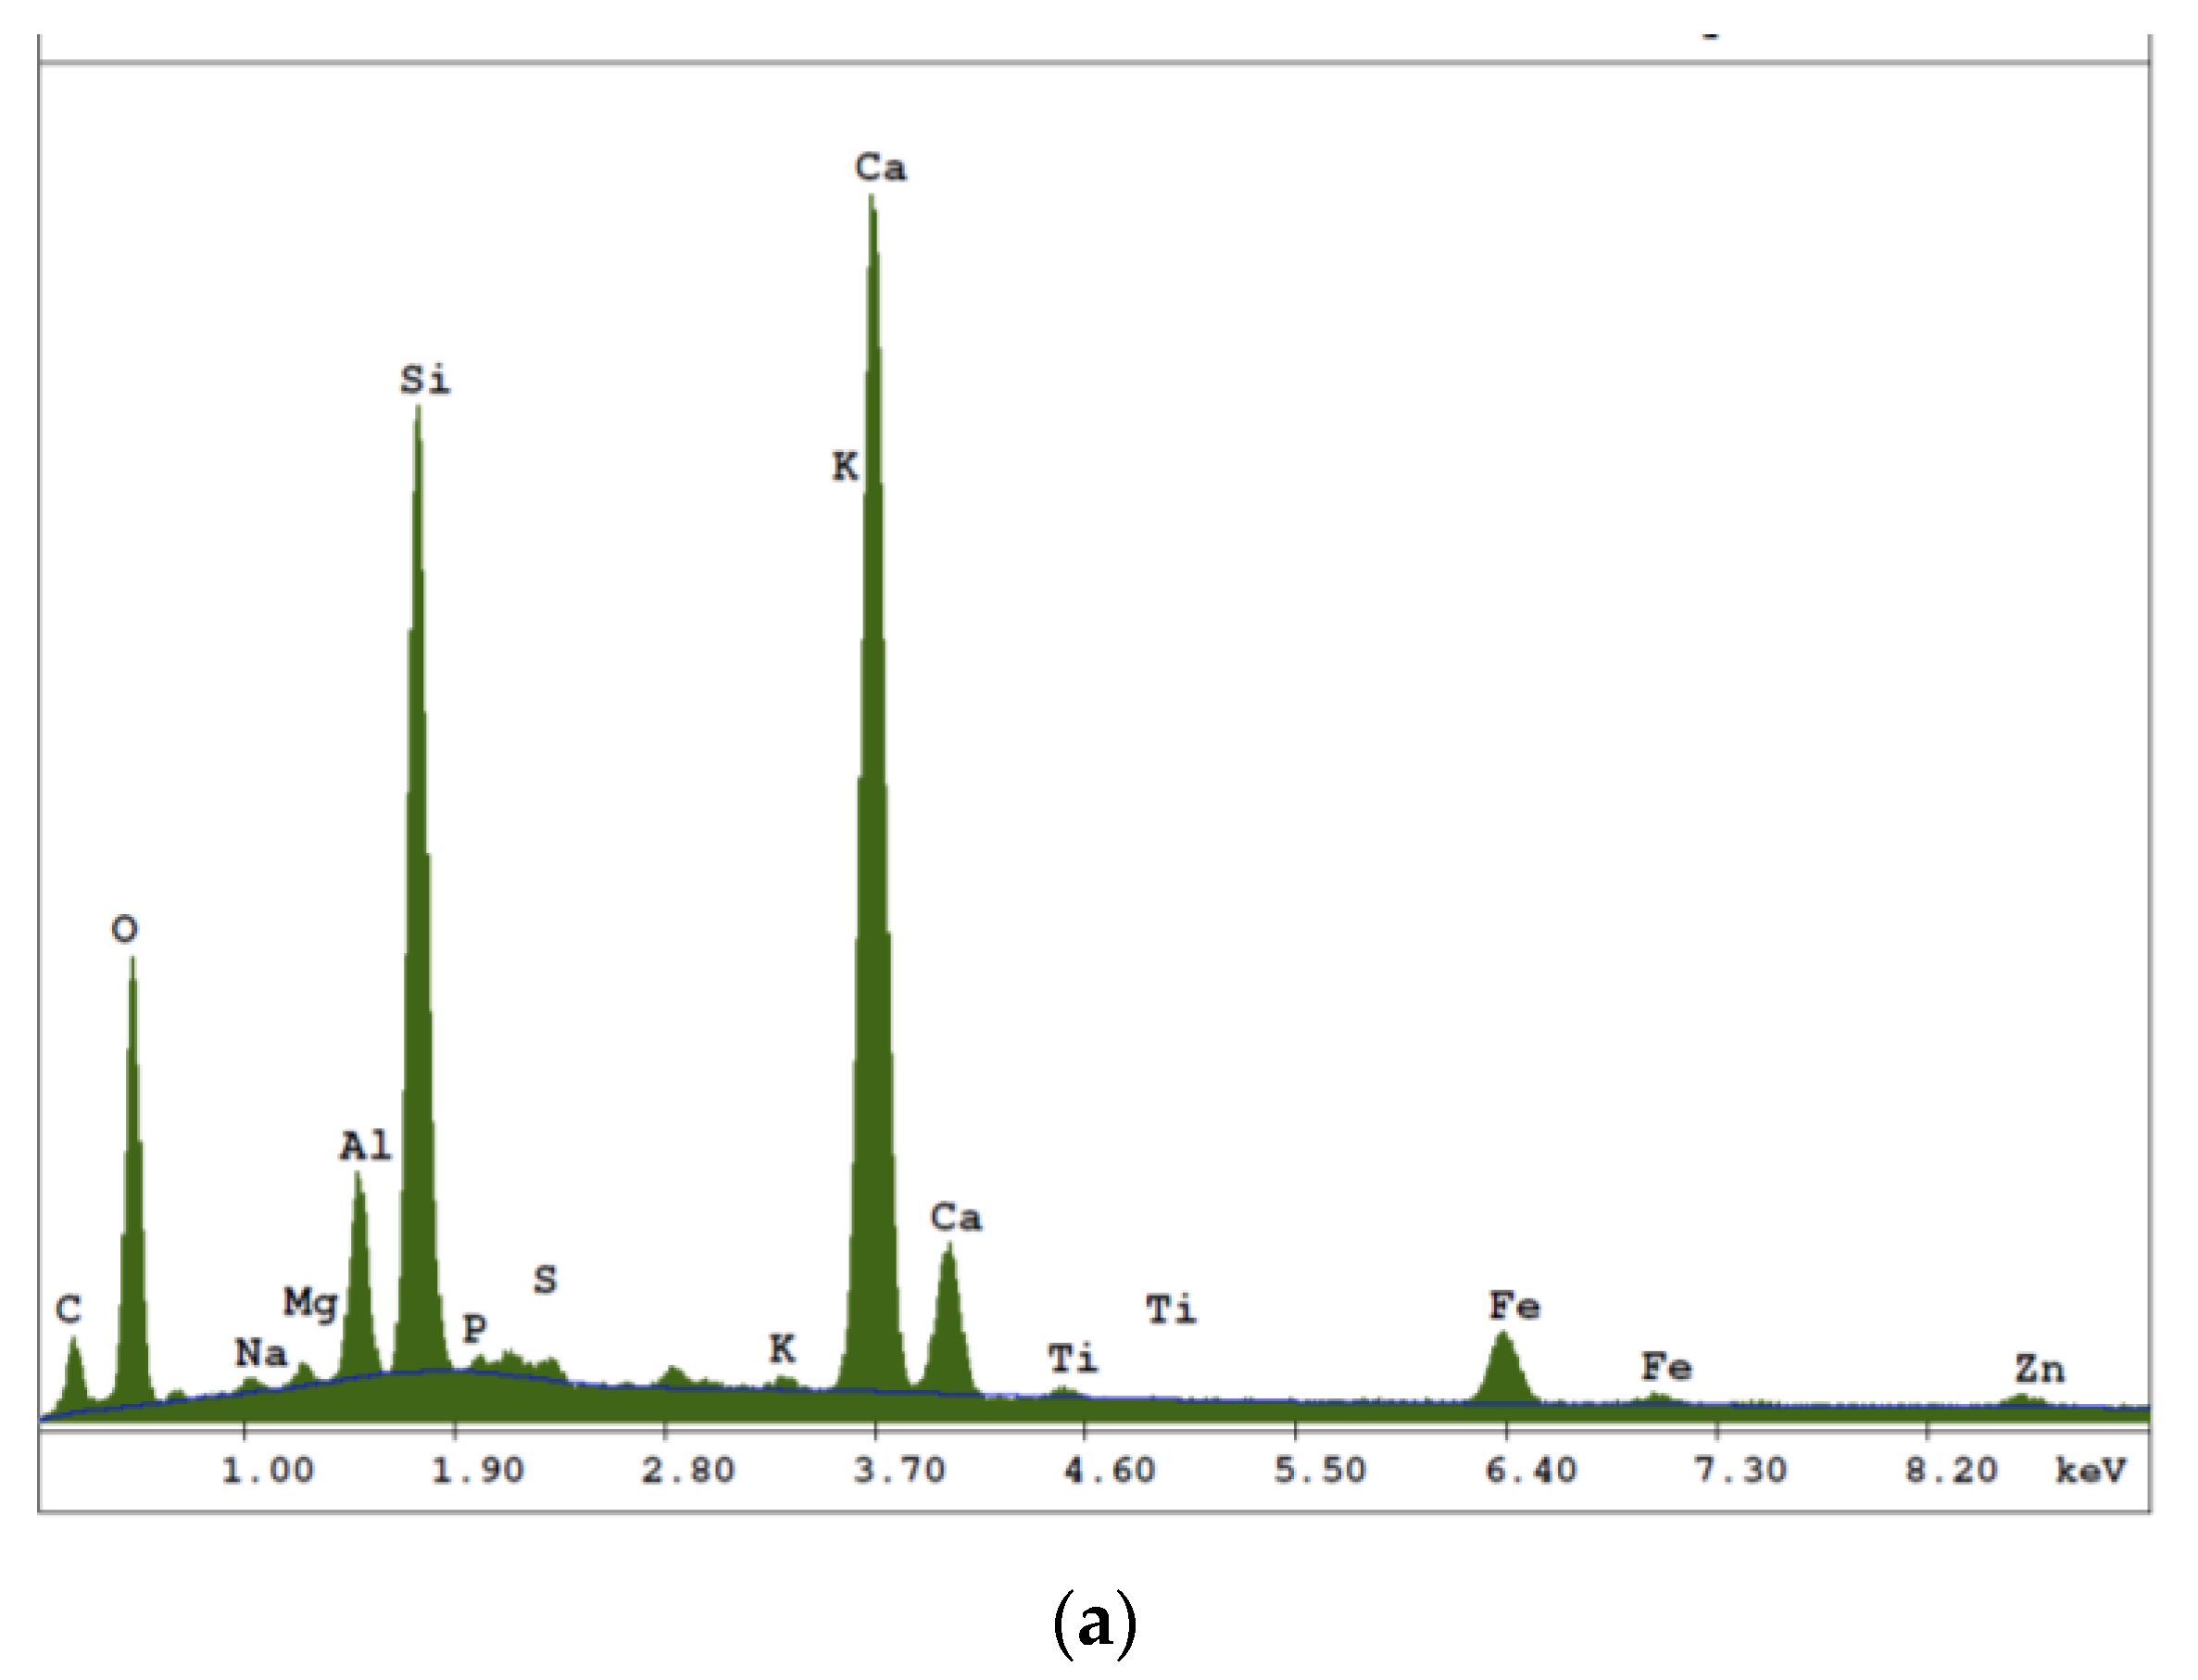
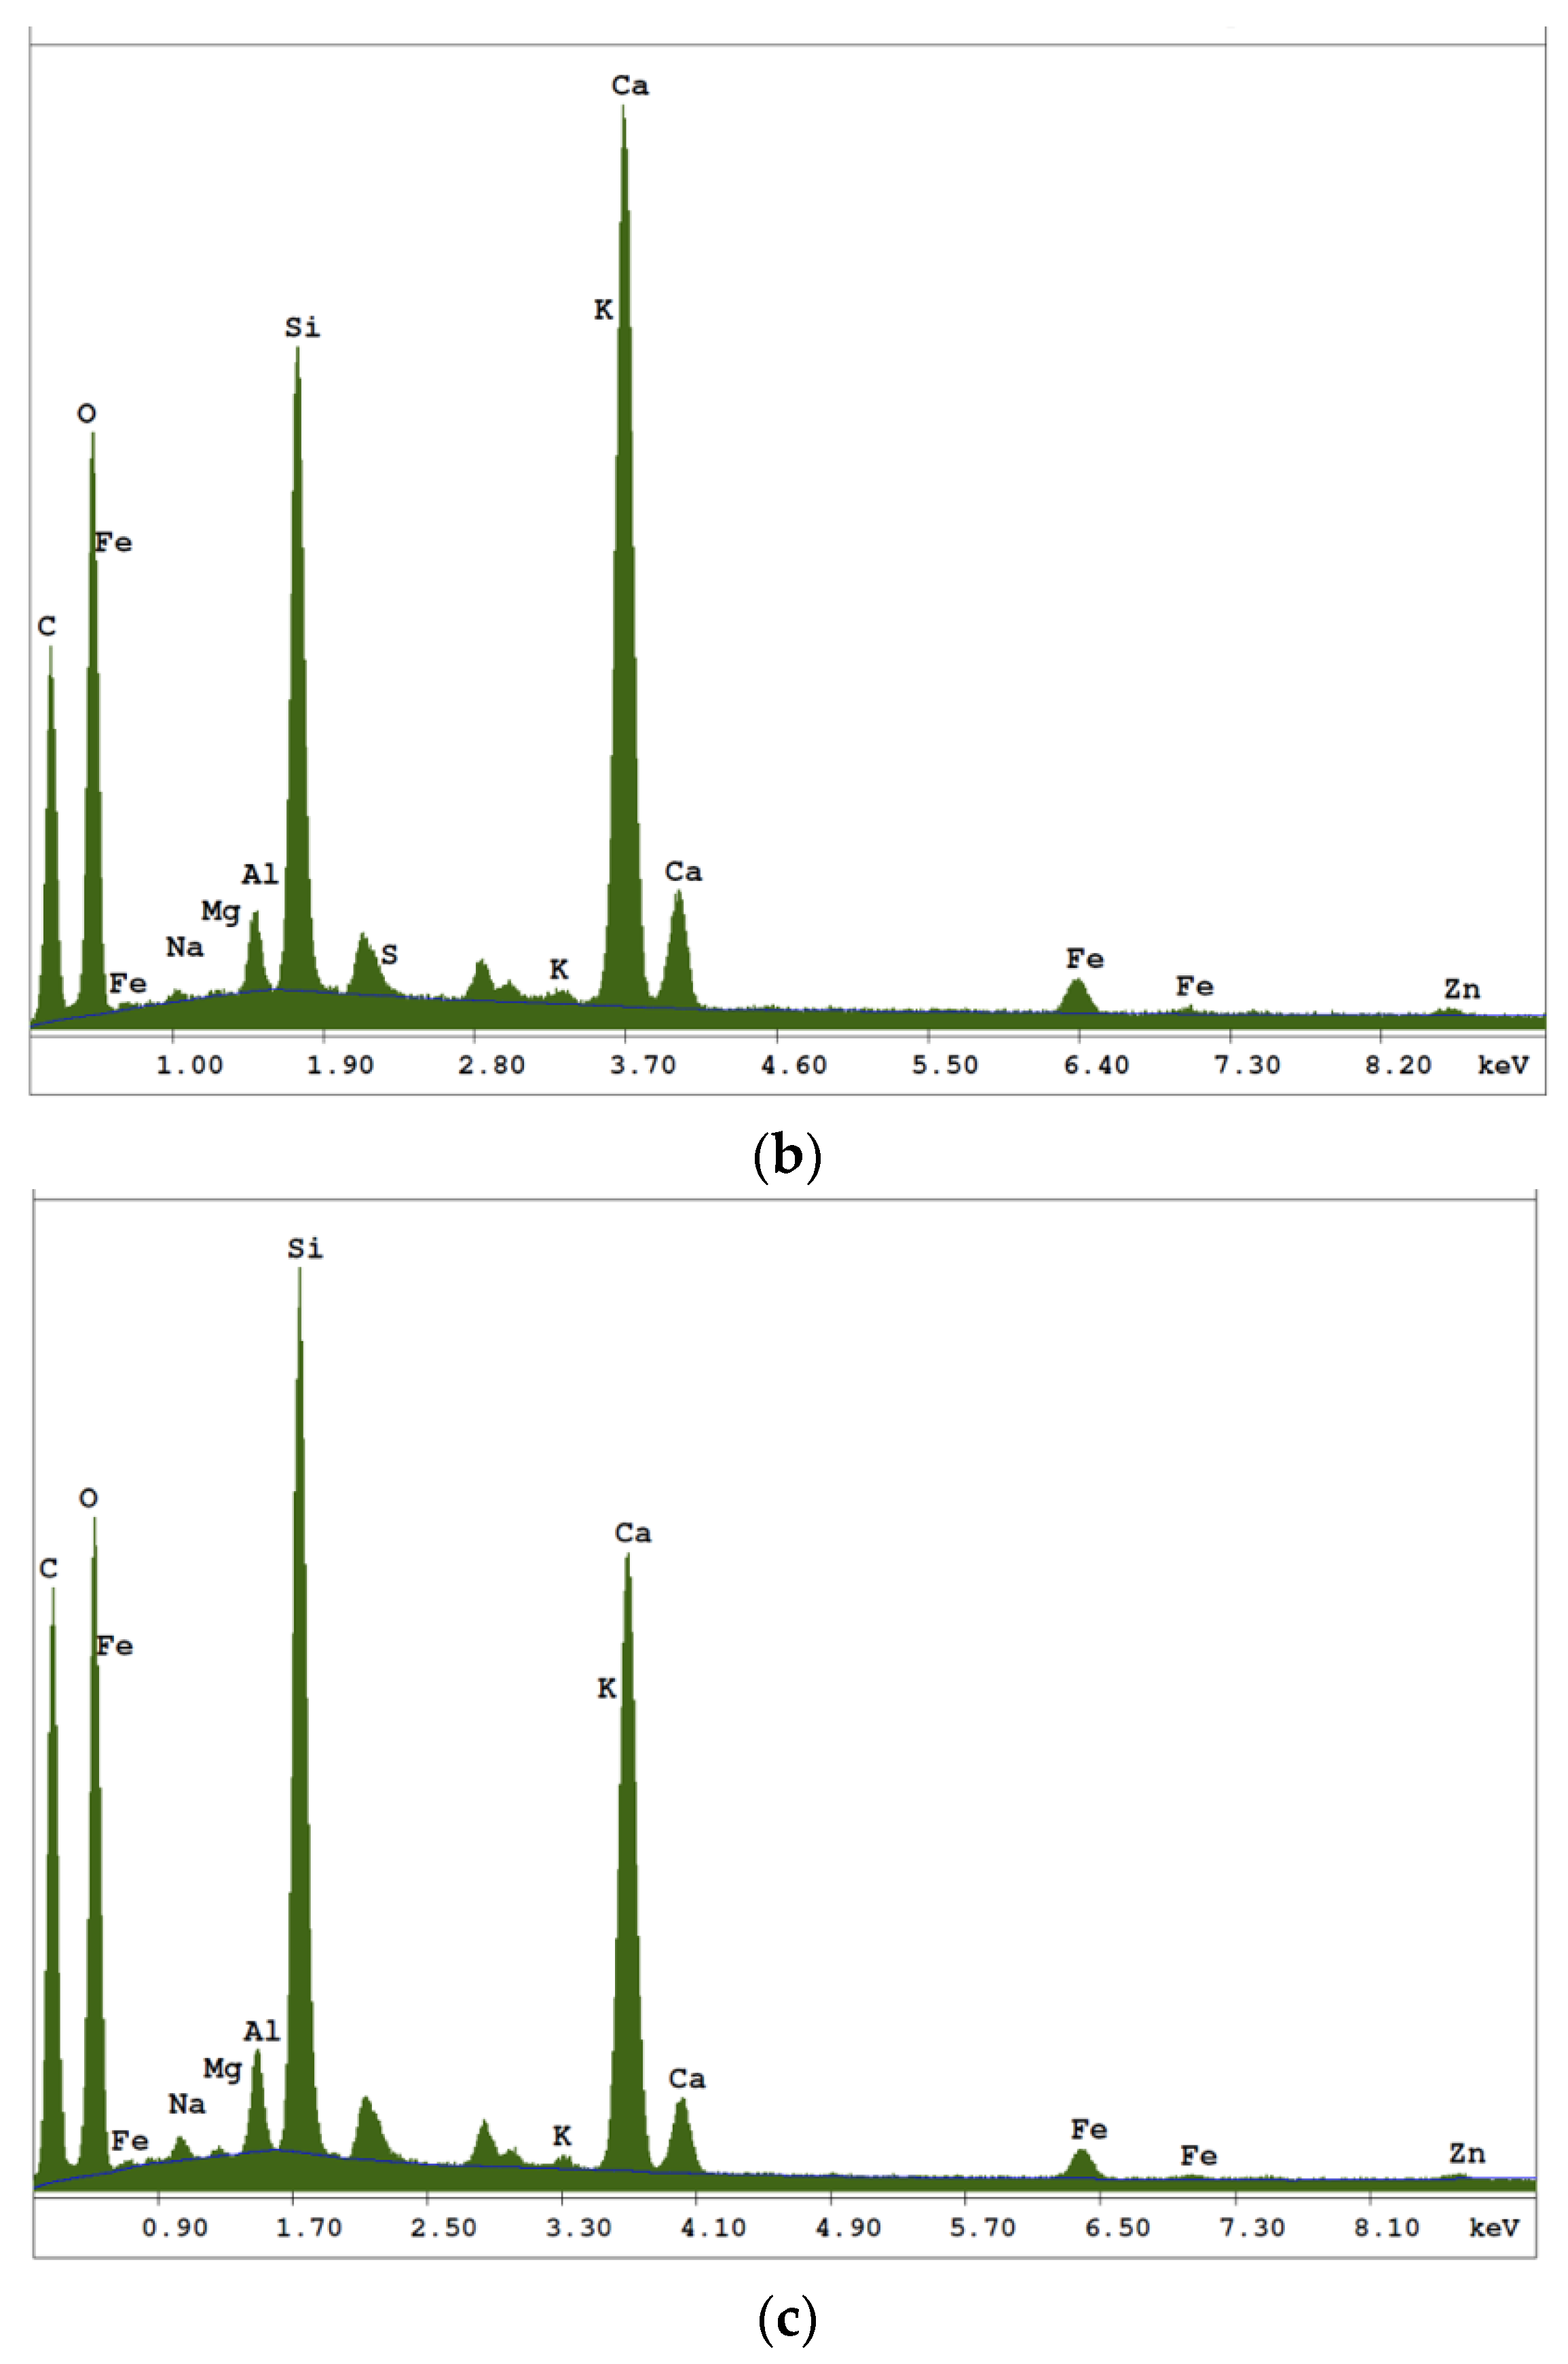
3.1. SEM Analysis
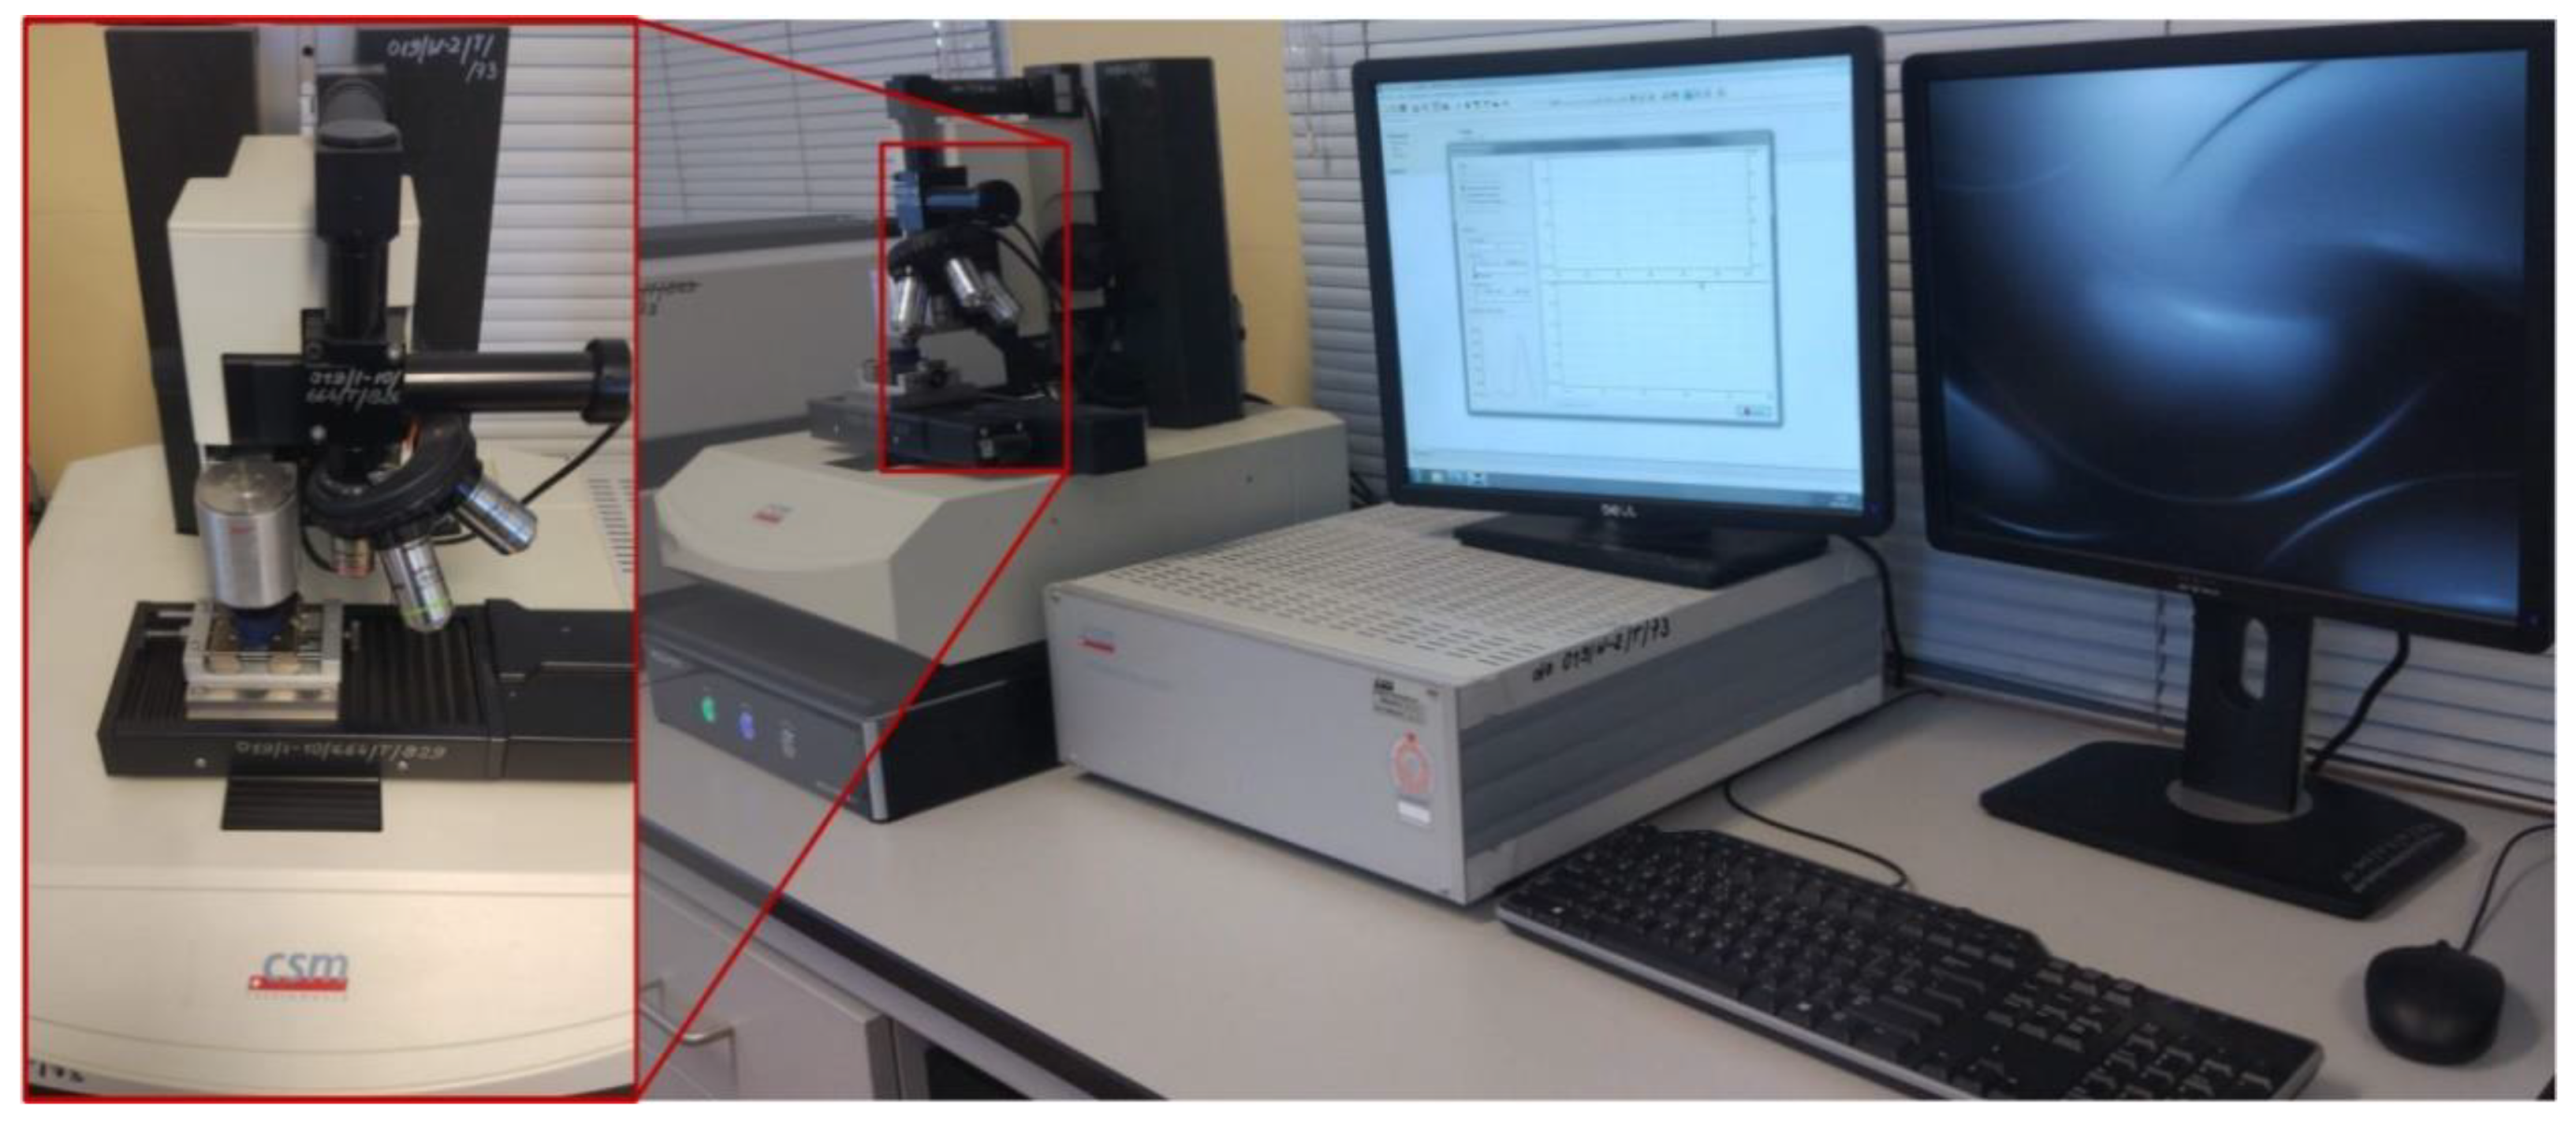
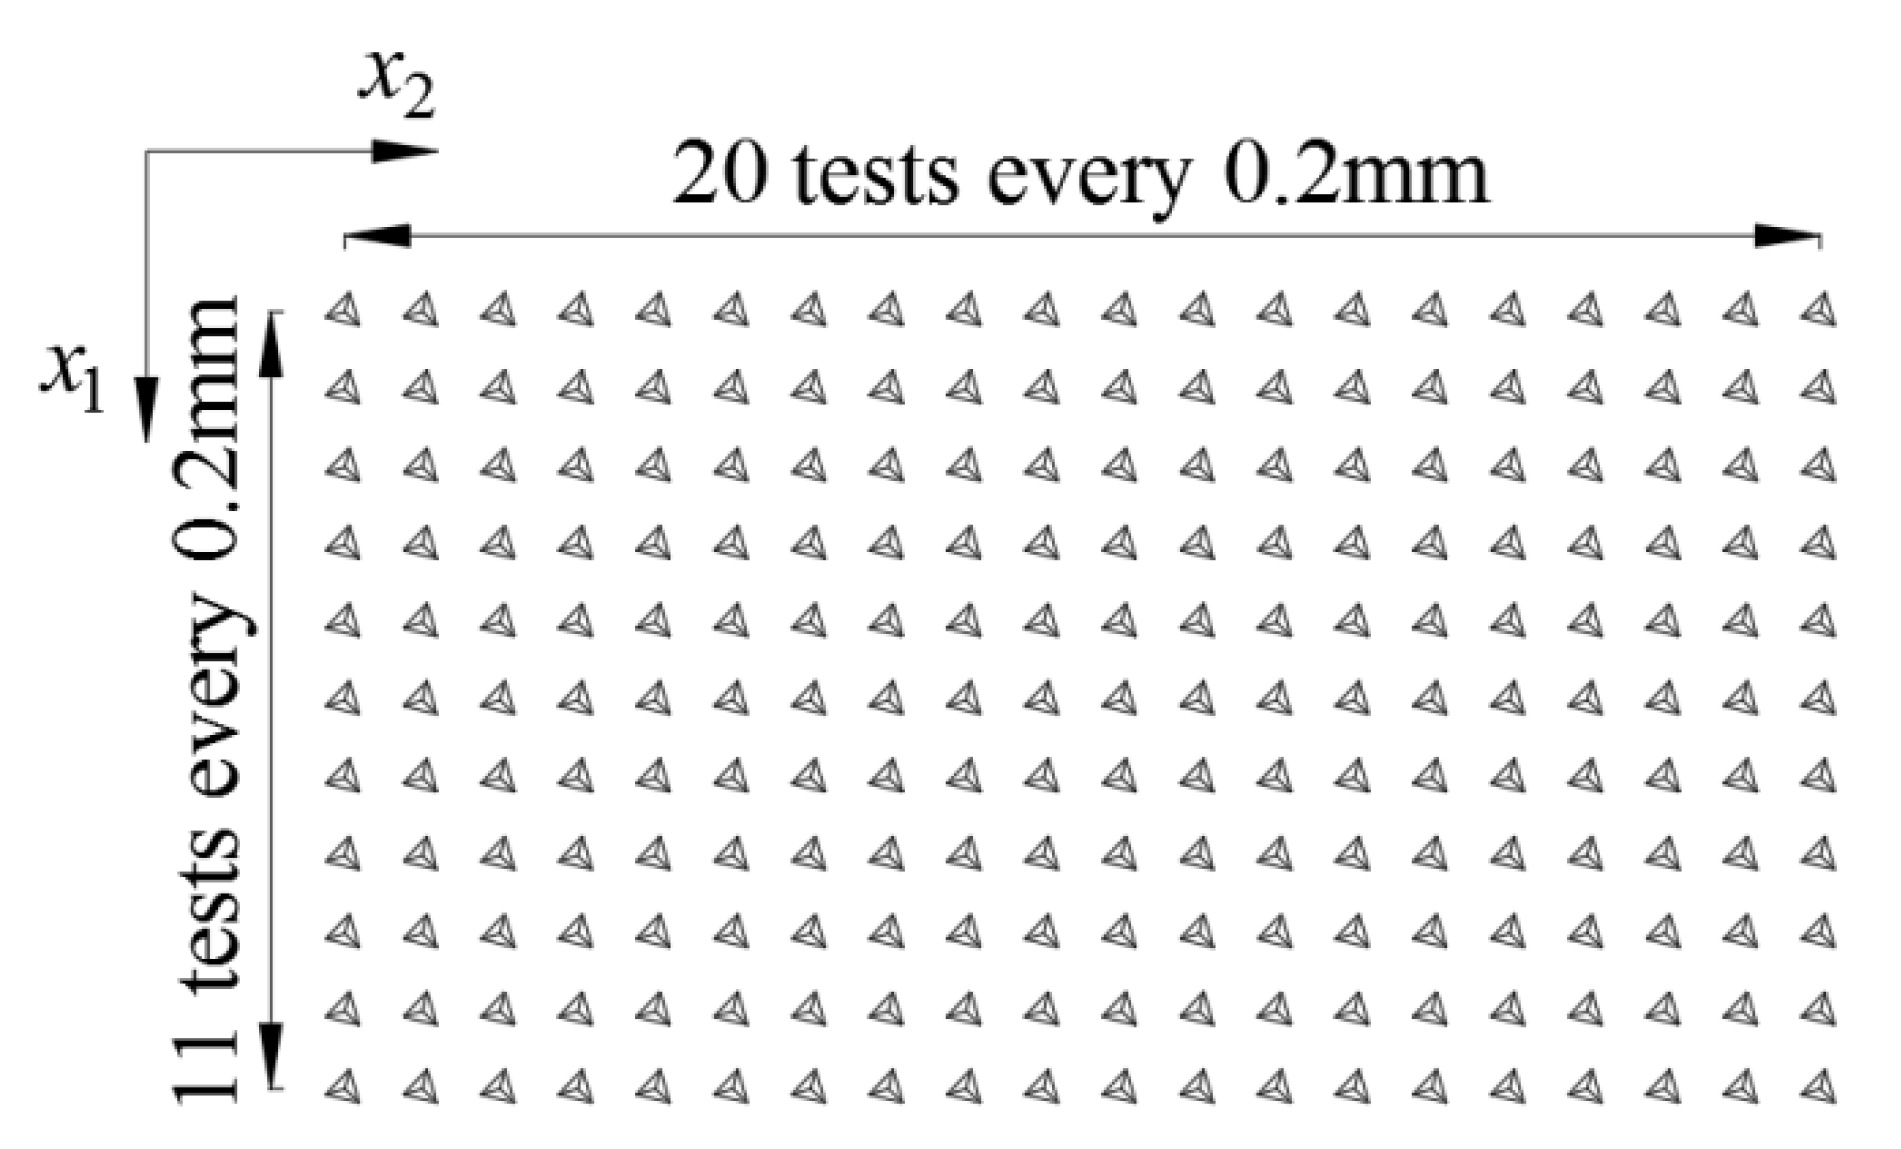
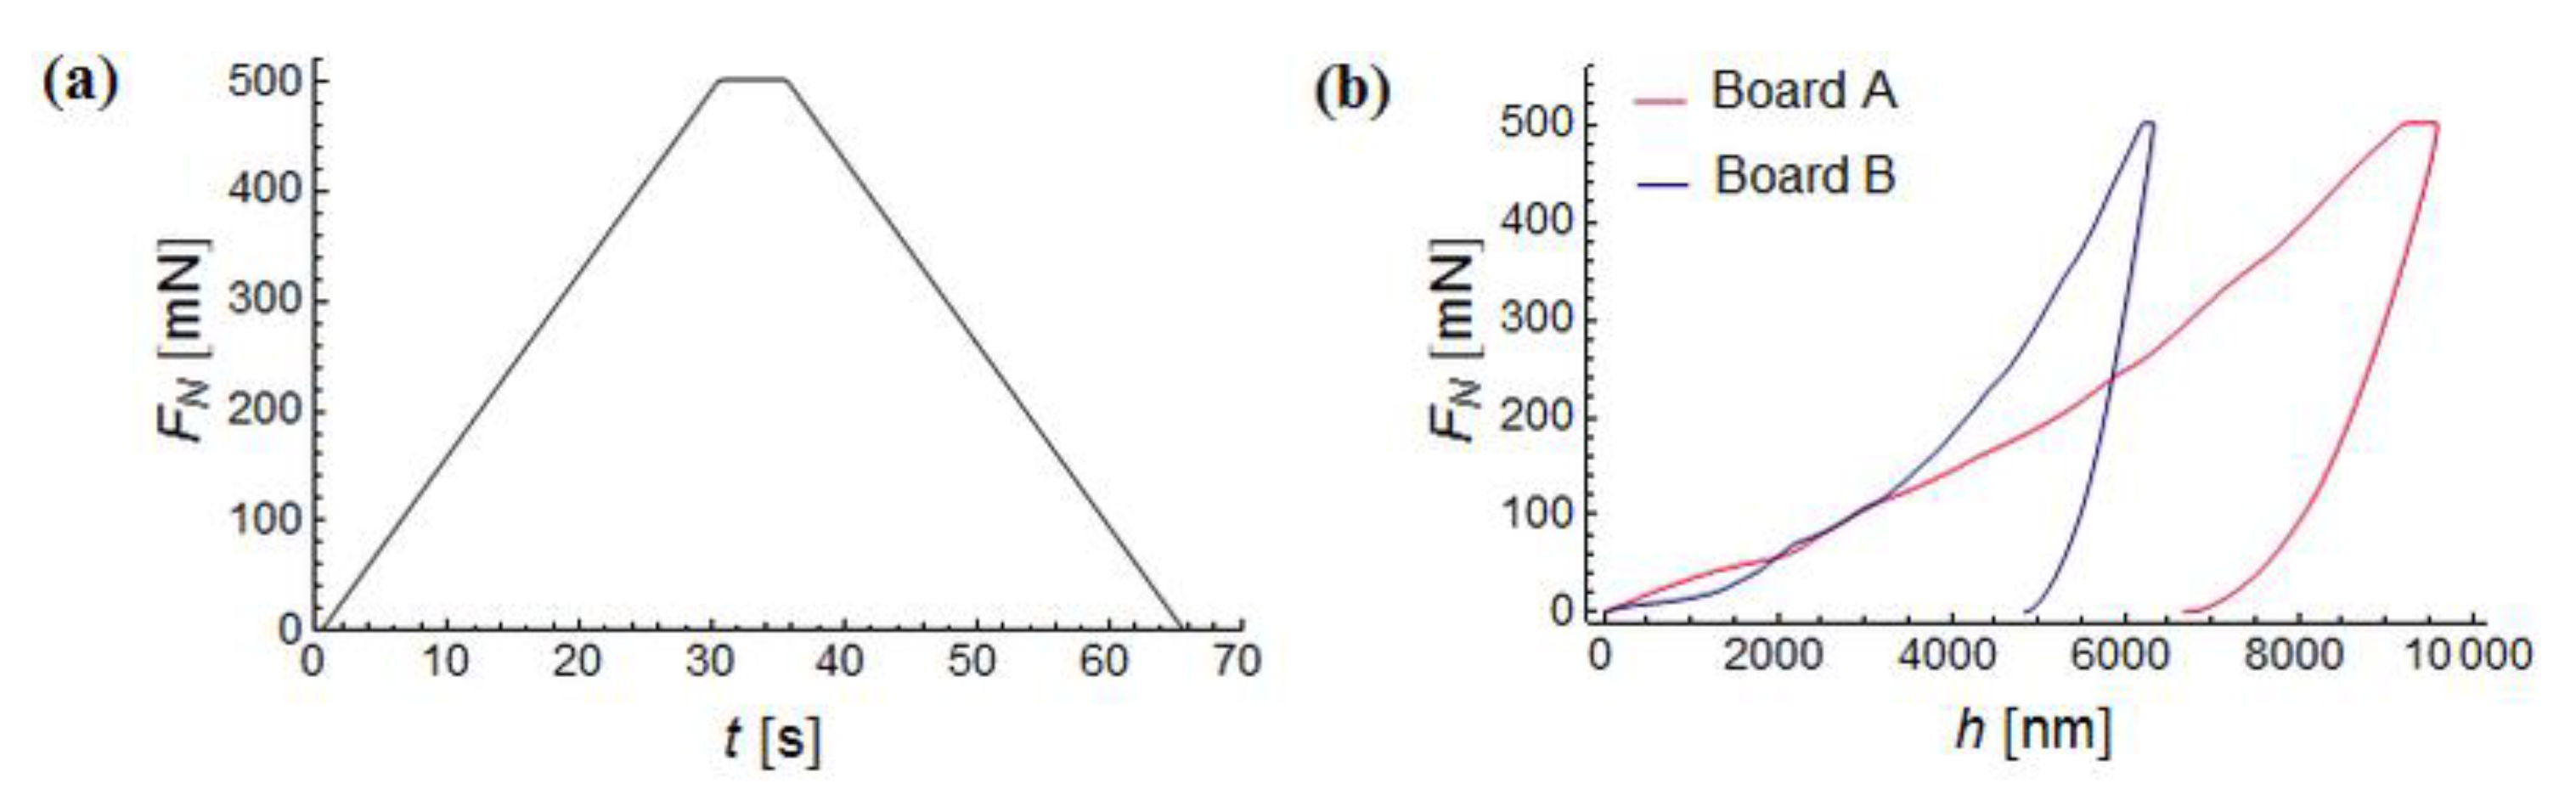
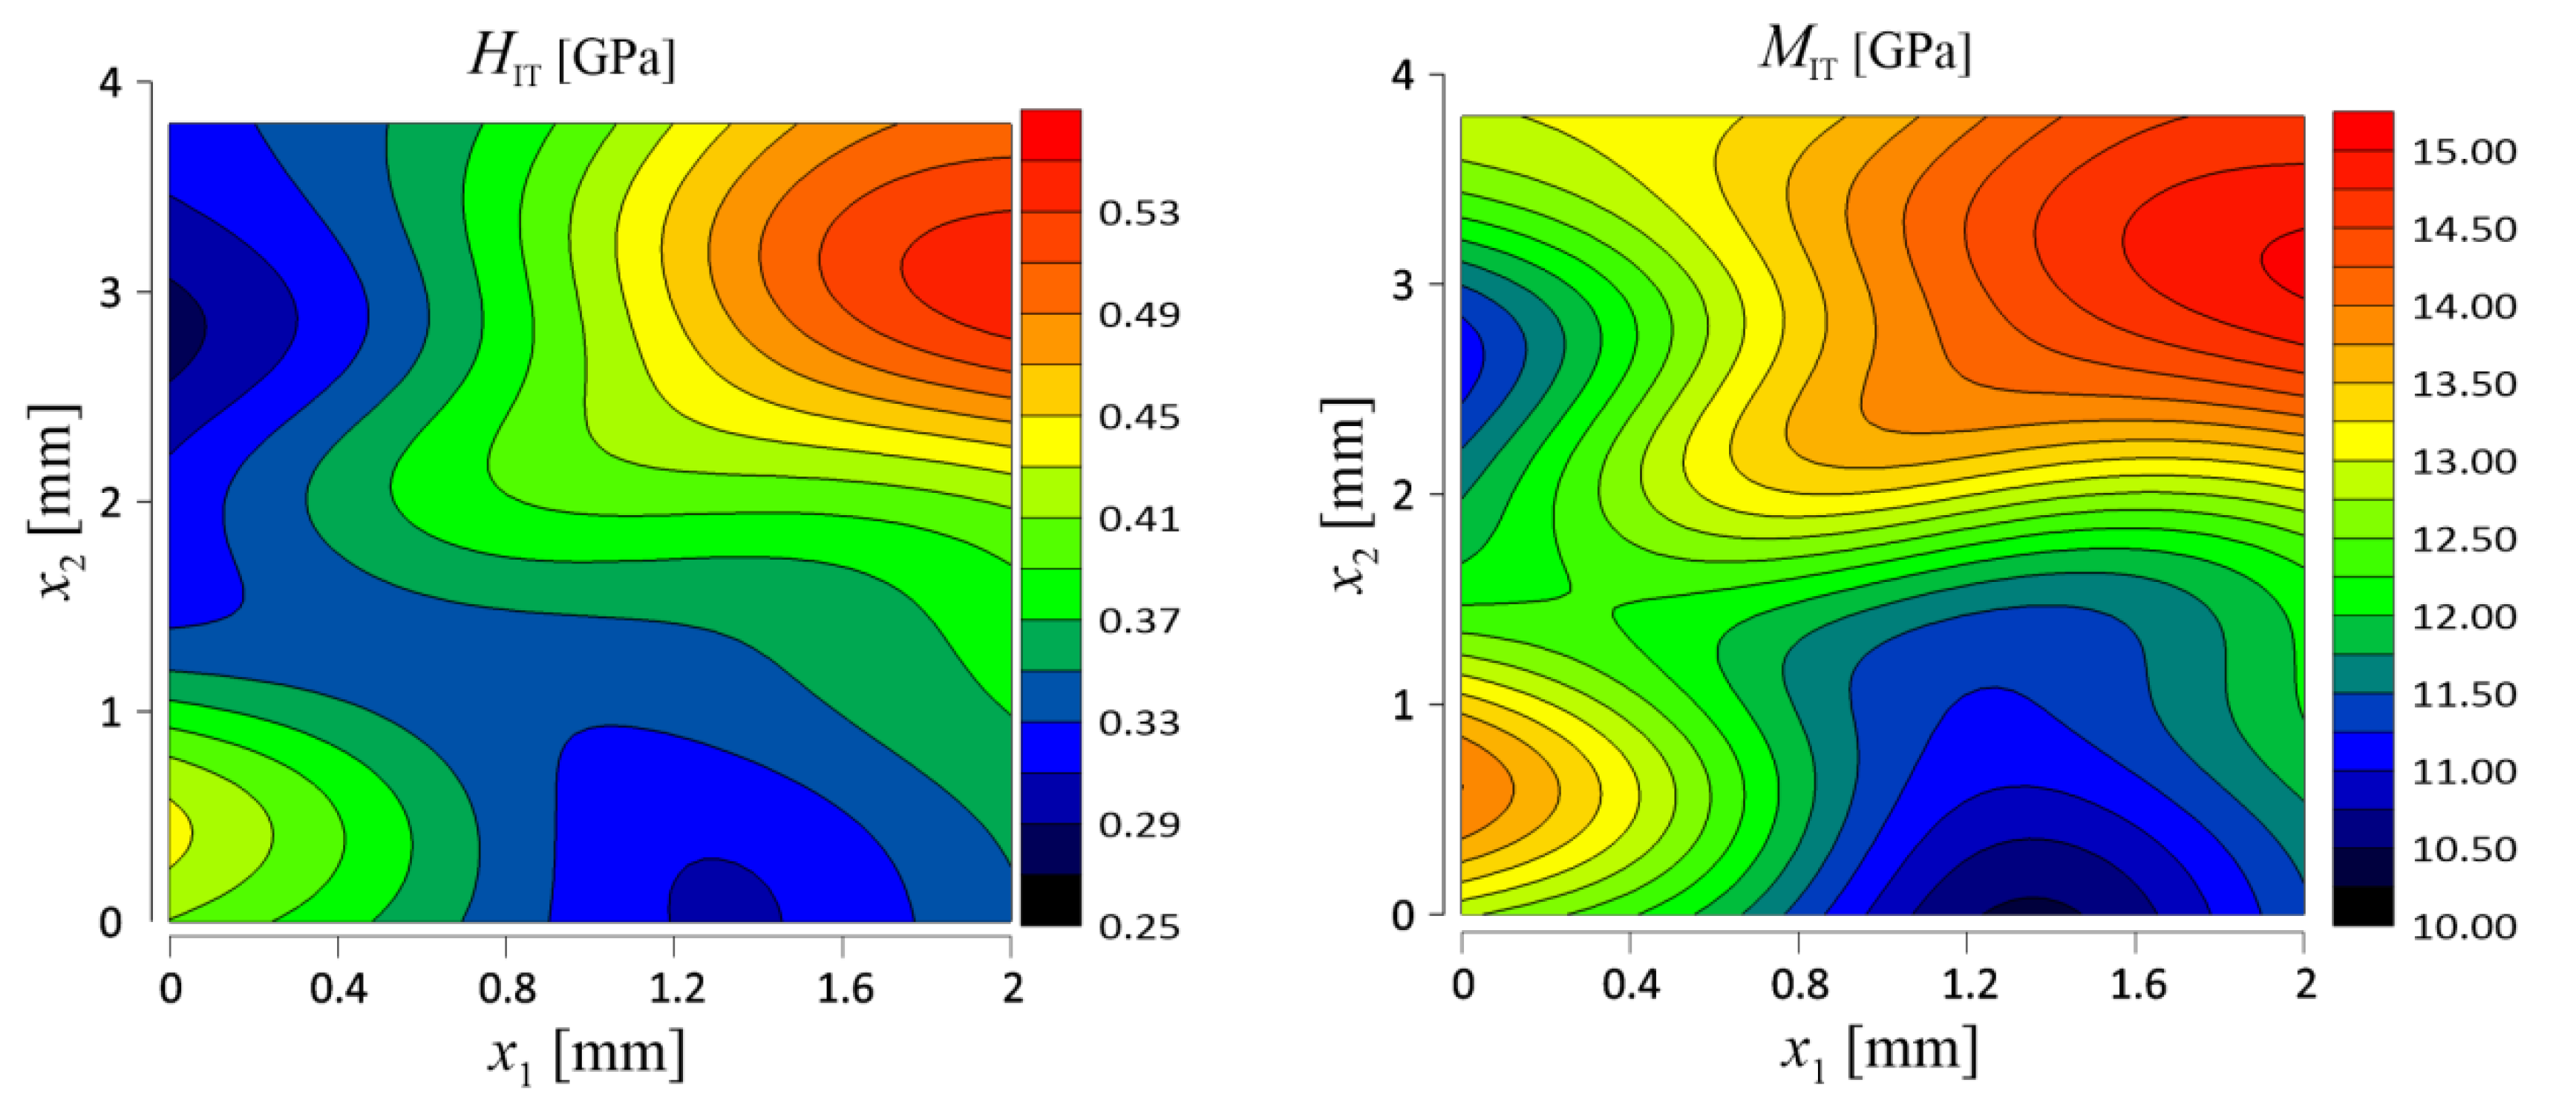
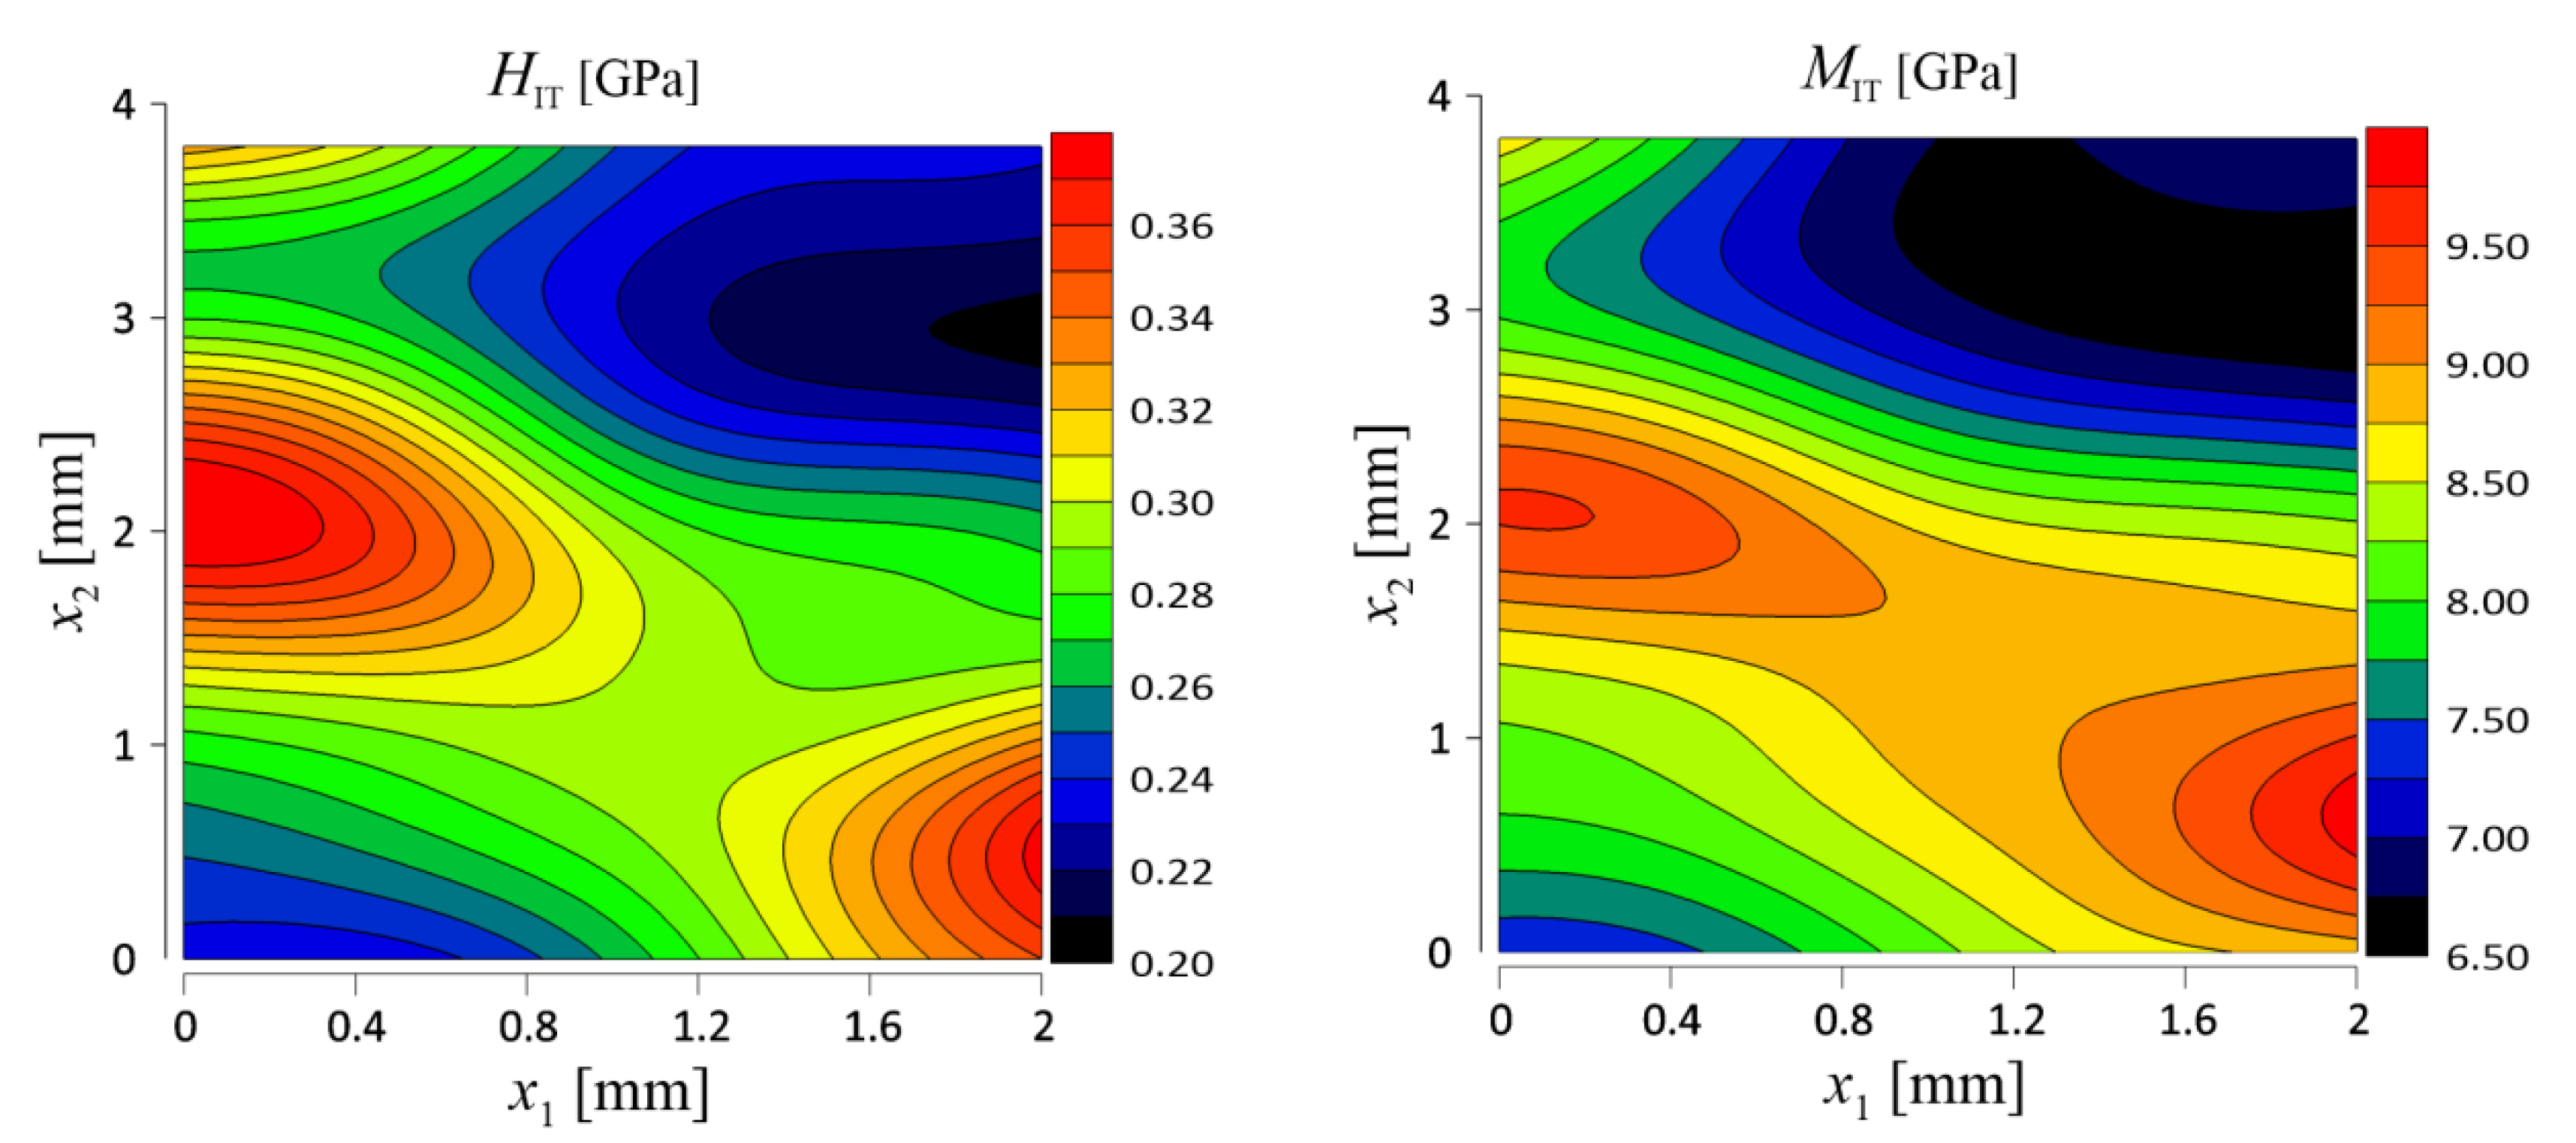
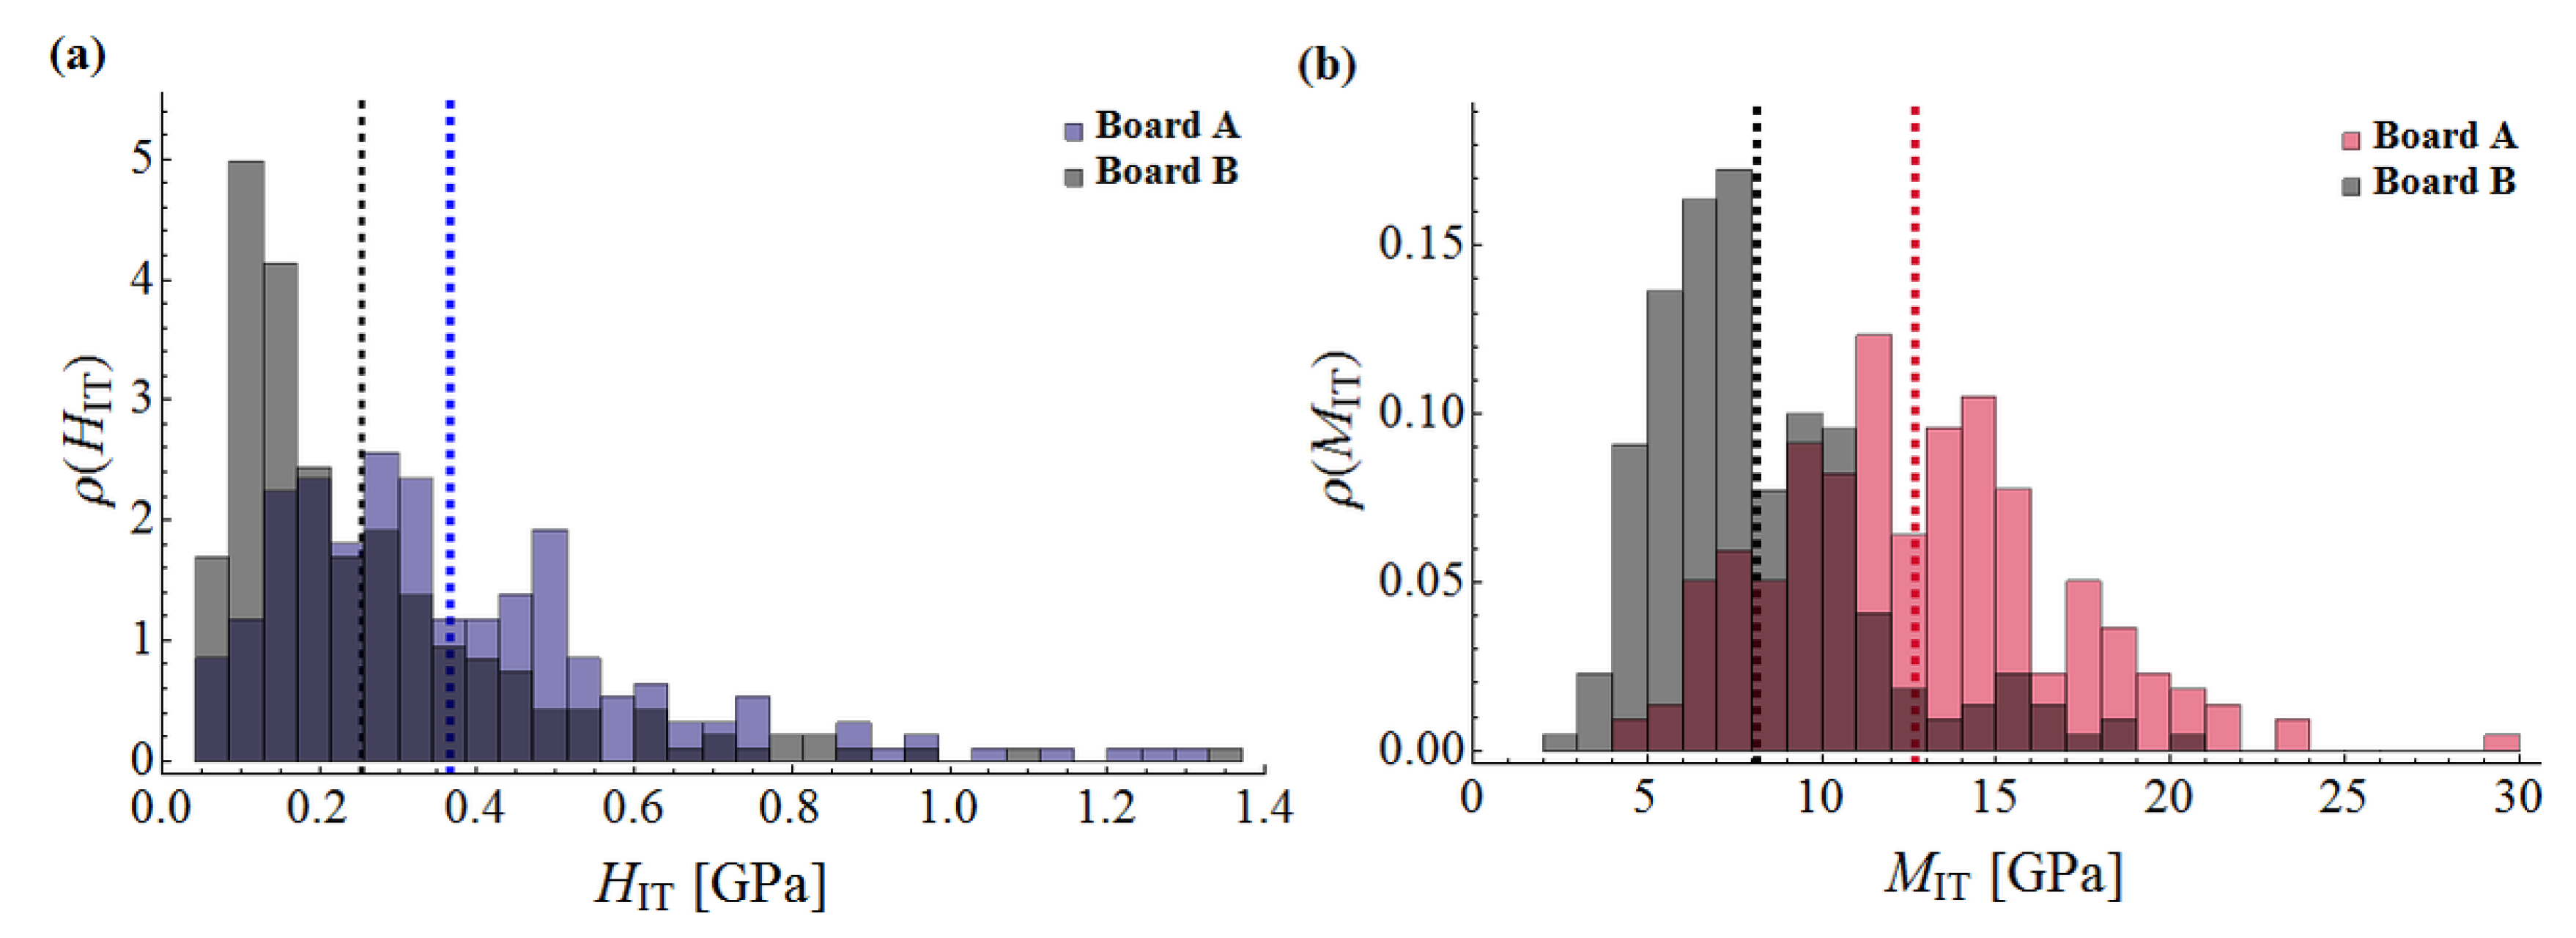
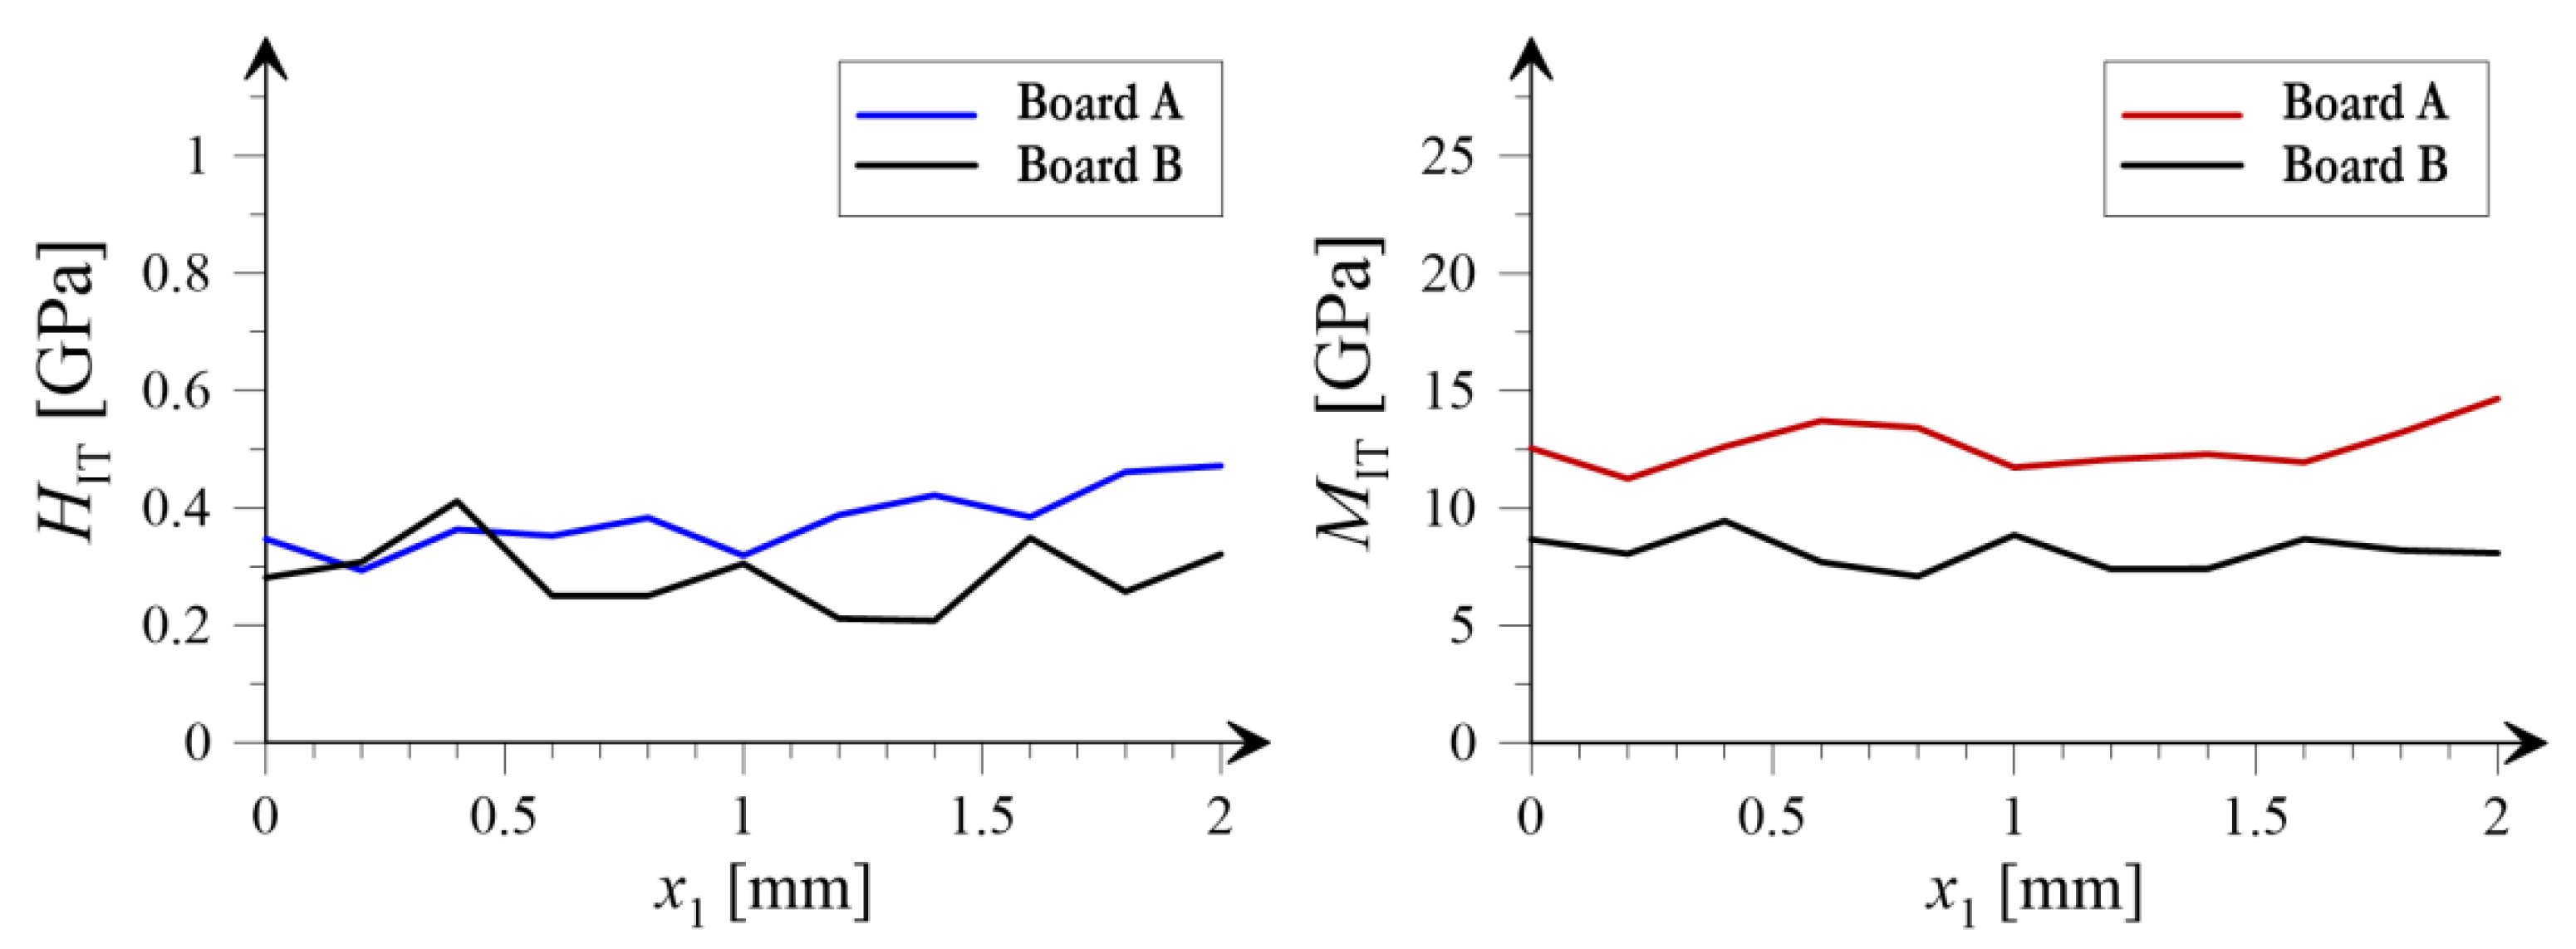
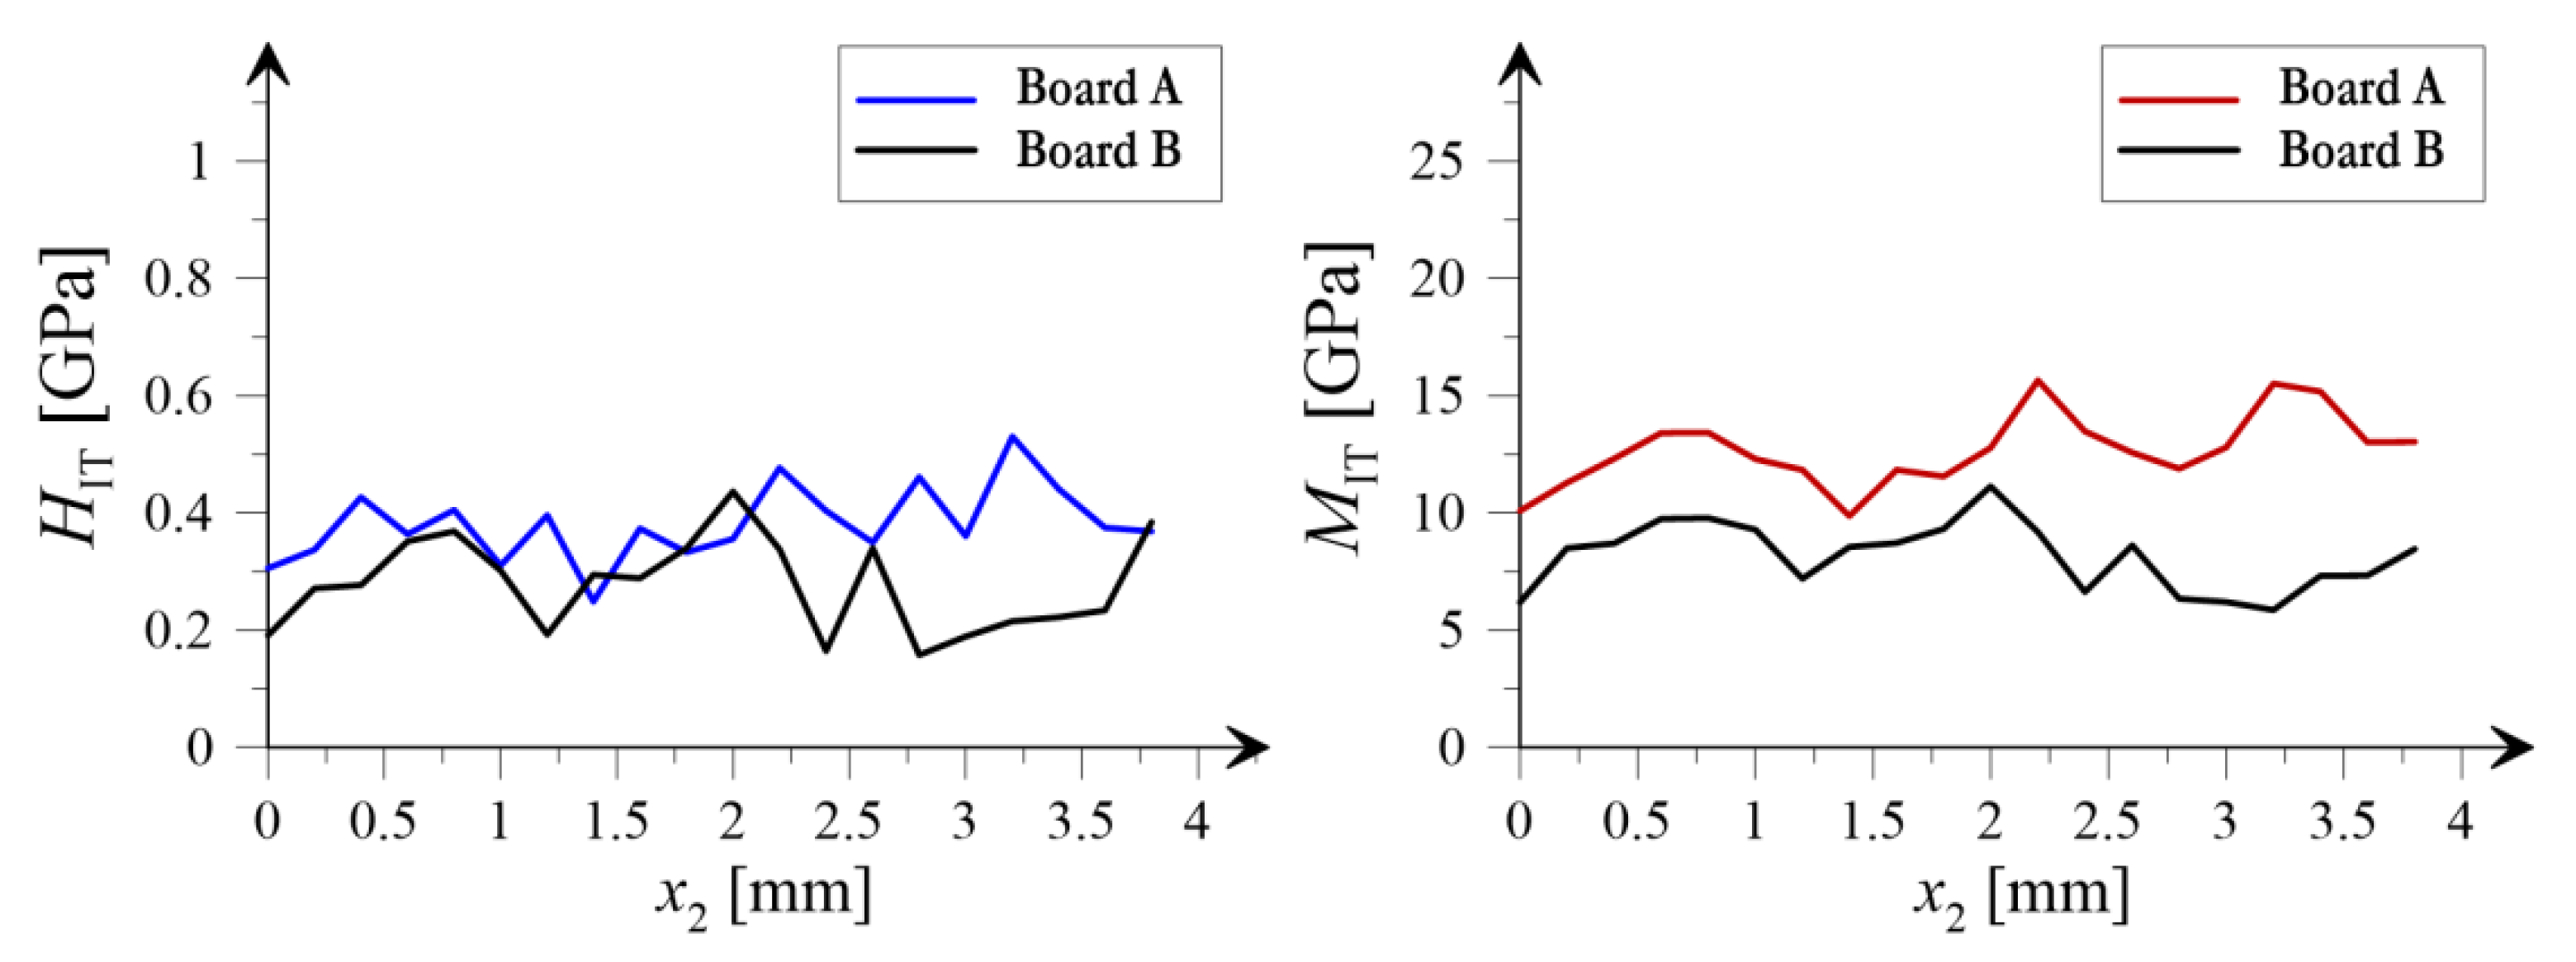
3.2. Nanoindentation
4. Discussion of Results
5. Final Conclusions
Author Contributions
Funding
Conflicts of Interest
References
- Akhavan, A.; Catchmark, J.; Rajabipour, F. Ductility enhancement of autoclaved cellulose fiber reinforced cement boards manufactured using a laboratory method simulating the Hatschek process. Constr. Build. Mater. 2017, 135, 251–259. [Google Scholar] [CrossRef]
- Ardanuy, M.; Claramunt, J.; Toledo Filho, R.D. Cellulosic fiber reinforced cement-based composites: A review of recent research. Constr. Build. Mater. 2015, 79, 115–128. [Google Scholar] [CrossRef]
- Chady, T.; Schabowicz, K.; Szymków, M. Automated multisource electromagnetic inspection of fibre-cement boards. Autom. Constr. 2018, 94, 383–394. [Google Scholar] [CrossRef]
- Schabowicz, K.; Gorzelańczyk, T. A nondestructive methodology for the testing of fibre cement boards by means of a non-contact ultrasound scanner. Constr. Build. Mater. 2016, 102, 200–207. [Google Scholar] [CrossRef]
- Tonoli, G.H.D.; Santos, S.F.; Savastano, H.; Delvasto, S.; Mejía de Gutiérrez, R.; Del M. Lopez de Murphy, M. Effects of natural weathering on microstructure and mineral composition of cementitious roofing tiles reinforced with fique fibre. Cem. Concr. Compos. 2011, 33, 225–232. [Google Scholar] [CrossRef]
- Savastano, H.; Warden, P.G.; Coutts, R.S.P. Microstructure and mechanical properties of waste fibre-cement composites. Cem. Concr. Compos. 2005, 27, 583–592. [Google Scholar] [CrossRef]
- Schabowicz, K.; Ranachowski, Z.; Jóźwiak-Niedźwiedzka, D.; Radzik, Ł.; Kudela, S.; Dvorak, T. Application of X-ray microtomography to quality assessment of fibre cement boards. Constr. Build. Mater. 2016, 110, 182–188. [Google Scholar] [CrossRef]
- Nowak, T.; Karolak, A.; Sobótka, M.; Wyjadłowski, M. Assessment of the Condition of Wharf Timber Sheet Wall Material by Means of Selected Non-Destructive Methods. Materials 2019, 12, 1532. [Google Scholar] [CrossRef] [PubMed]
- Cnudde, V.; Cnudde, J.P.; Dupuis, C.; Jacobs, P.J.S. X-ray micro-CT used for the localization of water repellents and consolidants inside natural building stones. Mater. Charact. 2004, 53, 259–271. [Google Scholar] [CrossRef]
- Guo, L.P.; Carpinteri, A.; Sun, W.; Qin, W.C. Measurement and analysis of defects in high-performance concrete with three-dimensional micro-computer tomography. J. Southeast Univ. 2009, 25, 83–88. [Google Scholar]
- Wang, Q.; Huang, X.; Zhou, W.; Li, J. Three-dimensional reconstruction and morphologic characteristics of porous metal fiber sintered sheet. Mater. Charact. 2013, 86, 49–58. [Google Scholar] [CrossRef]
- Liu, J.; Li, C.; Liu, J.; Cui, G.; Yang, Z. Study on 3D spatial distribution of steel fibers in fiber reinforced cementitious composites through micro-CT technique. Constr. Build. Mater. 2013, 48, 656–661. [Google Scholar] [CrossRef]
- Ranachowski, Z.; Schabowicz, K. The contribution of fiber reinforcement system to the overall toughness of cellulose fiber concrete panels. Constr. Build. Mater. 2017, 156, 1028–1034. [Google Scholar] [CrossRef]
- Schabowicz, K.; Jóźwiak-Niedźwiedzka, D.; Ranachowski, Z.; Kudela, S.; Dvorak, T. Microstructural characterization of cellulose fibres in reinforced cement boards. Arch. Civ. Mech. Eng. 2018, 18, 1068–1078. [Google Scholar] [CrossRef]
- Ranachowski, Z.; Ranachowski, P.; Dębowski, T.; Gorzelańczyk, T.; Schabowicz, K. Investigation of Structural Degradation of Fiber Cement Boards Due to Thermal Impact. Materials 2019, 12, 944. [Google Scholar] [CrossRef] [PubMed]
- Schabowicz, K.; Gorzelańczyk, T.; Szymków, M. Identification of the degree of fibre-cement boards degradation under the influence of high temperature. Autom. Constr. 2019, 101, 190–198. [Google Scholar] [CrossRef]
- Schabowicz, K.; Gorzelańczyk, T.; Szymków, M. Identification of the Degree of Degradation of Fibre-Cement Boards Exposed to Fire by Means of the Acoustic Emission Method and Artificial Neural Networks. Materials 2019, 12, 656. [Google Scholar] [CrossRef]
- Constantinides, G.; Ravi Chandran, K.S.; Ulm, F.J.; Van Vliet, K.J. Grid indentation analysis of composite microstructure and mechanics: Principles and validation. Mater. Sci. Eng. A 2006, 430, 189–202. [Google Scholar] [CrossRef]
- Oliver, W.C.; Pharr, G.M. An improved technique for determining hardness and elastic modulus using load and displacement sensing indentation experiments. J. Mater. Res. 1992, 7, 1564–1583. [Google Scholar] [CrossRef]
- Cheng, Y.T.; Cheng, C.M. Scaling, dimensional analysis, and indentation measurements. Mater. Sci. Eng. R Rep. 2004, 44, 91–149. [Google Scholar] [CrossRef]
- Oliver, W.C.; Pharr, G.M. Measurement of hardness and elastic modulus by instrumented indentation: Advances in understanding and refinements to methodology. J. Mater. Res. 2004, 19, 3–20. [Google Scholar] [CrossRef]
- Randall, N.X.; Vandamme, M.; Ulm, F.J. Nanoindentation analysis as a two-dimensional tool for mapping the mechanical properties of complex surfaces. J. Mater. Res. 2009, 24, 679–690. [Google Scholar] [CrossRef]
- Giannakopoulos, A.E.; Suresh, S. Determination of elastoplastic properties by instrumented sharp indentation. Scr. Mater. 1999, 40, 1191–1198. [Google Scholar] [CrossRef]
- Constantinides, G.; Ulm, F.J.; Van Vliet, K. On the use of nanoindentation for cementitious materials. Mat. Struct. 2003, 36, 191–196. [Google Scholar] [CrossRef]
- Miller, M.; Bobko, C.; Vandamme, M.; Ulm, F.J. Surface roughness criteria for cement paste nanoindentation. Cem. Concr. Res. 2008, 38, 467–476. [Google Scholar] [CrossRef]
- Ulm, F.J.; Vandamme, M.; Bobko, C.; Ortega, J.A.; Tai, K.; Ortiz, C. Statistical Indentation Techniques for Hydrated Nanocomposites: Concrete, Bone, and Shale. J. Am. Ceram. Soc. 2007, 90, 2677–2692. [Google Scholar] [CrossRef]
- Cellulose Fibre Cement Flat Sheets-Product Specification and Test Methods; EN 12467; British Standards Institution: London, UK, 2018.
- Rajczakowska, M.; Stefaniuk, D.; Łydżba, D. Microstructure Characterization by Means of X-ray Micro-CT and Nanoindentation Measurements. Studi. Geotech. Mech. 2015, 37, 75–84. [Google Scholar] [CrossRef]
- Rajczakowska, M.; Łydżba, D. Durability of crystalline phase in concrete microstructure modified by the mineral powders: Evaluation by nanoindentation tests. Studi. Geotech. Mech. 2016, 38, 65–74. [Google Scholar] [CrossRef]
- Ganneau, F.P.; Constantinides, G.; Ulm, F.J. Dual-indentation technique for the assessment of strength properties of cohesive-frictional materials. Int. J. Solids Struct. 2006, 43, 1727–1745. [Google Scholar] [CrossRef]
- Cariou, S.; Ulm, F.J.; Dormieux, L. Hardness–packing density scaling relations for cohesive-frictional porous materials. J. Mech. Phys. Solids 2008, 56, 924–952. [Google Scholar] [CrossRef]


| Symbol of the Board | A | B |
|---|---|---|
| Type of the board | fibre-cement, exterior | fibre-cement, exterior, after 3 h of burning (230 °C) |
| Thickness of board [mm] | 8 | 8 |
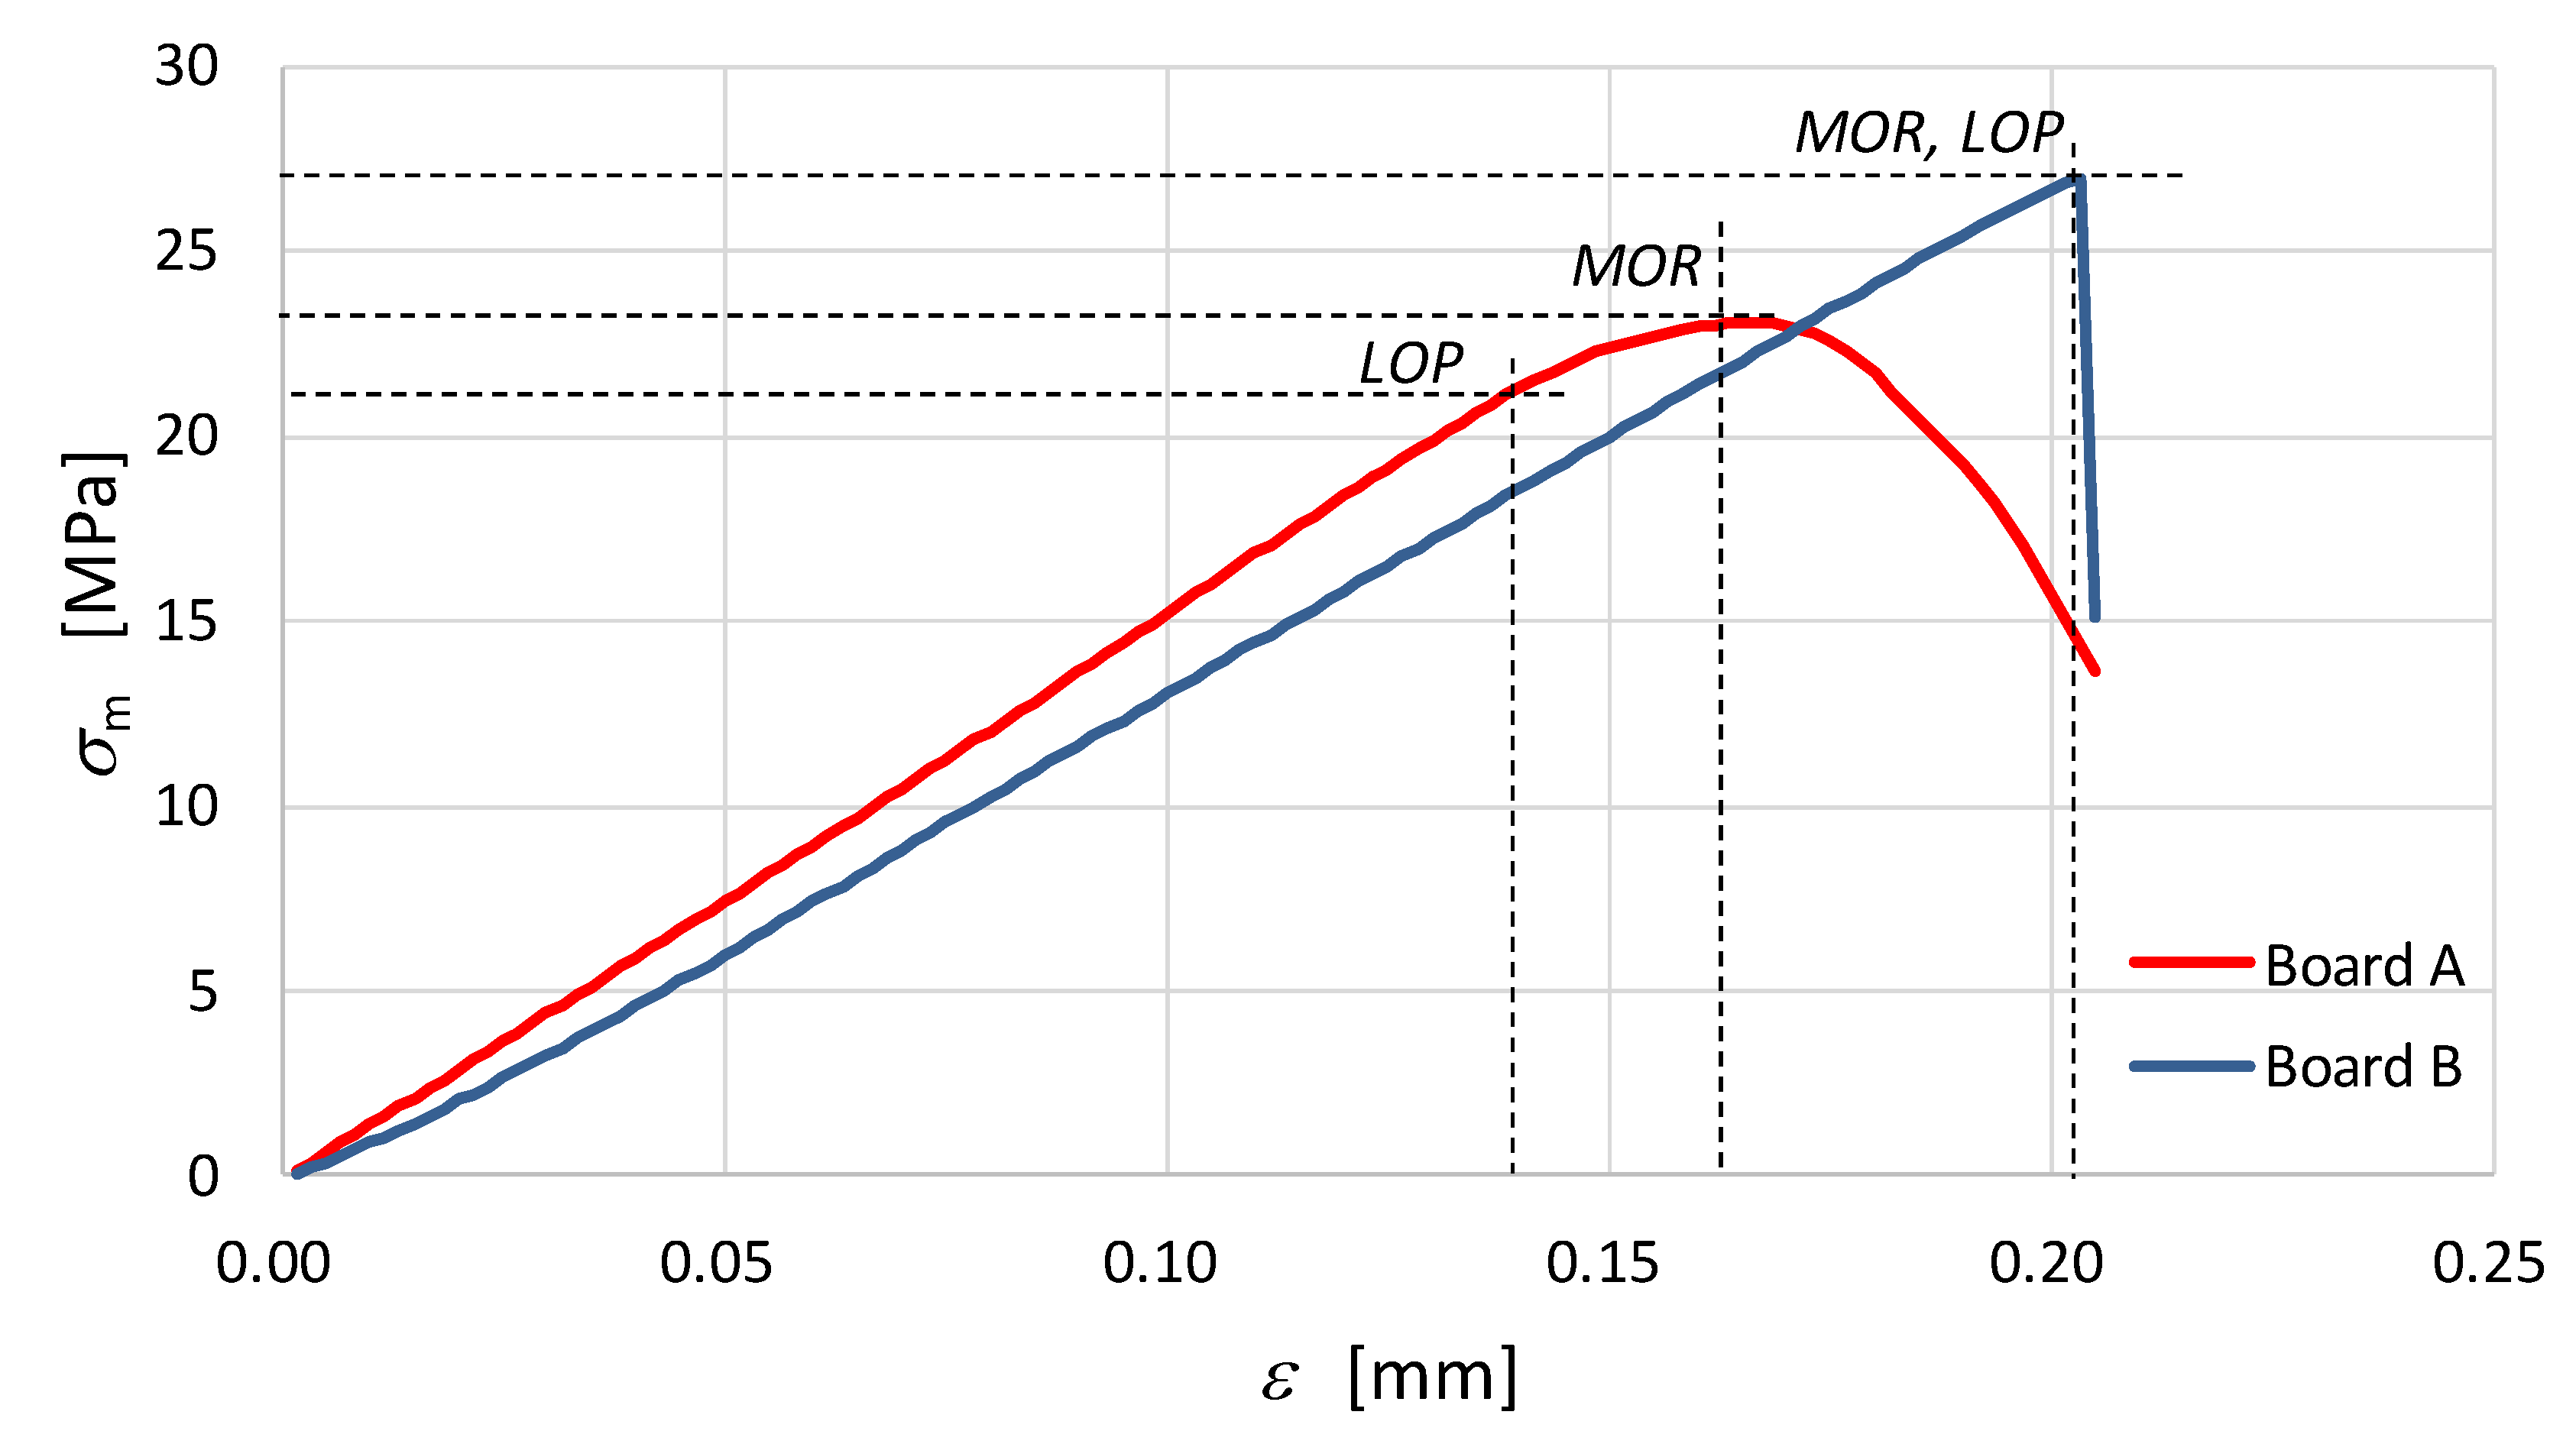
| Bending strength [MPa] | 23.54 * | 26.86 * |
| Density [kg/m3] | 1600 | 1500 |
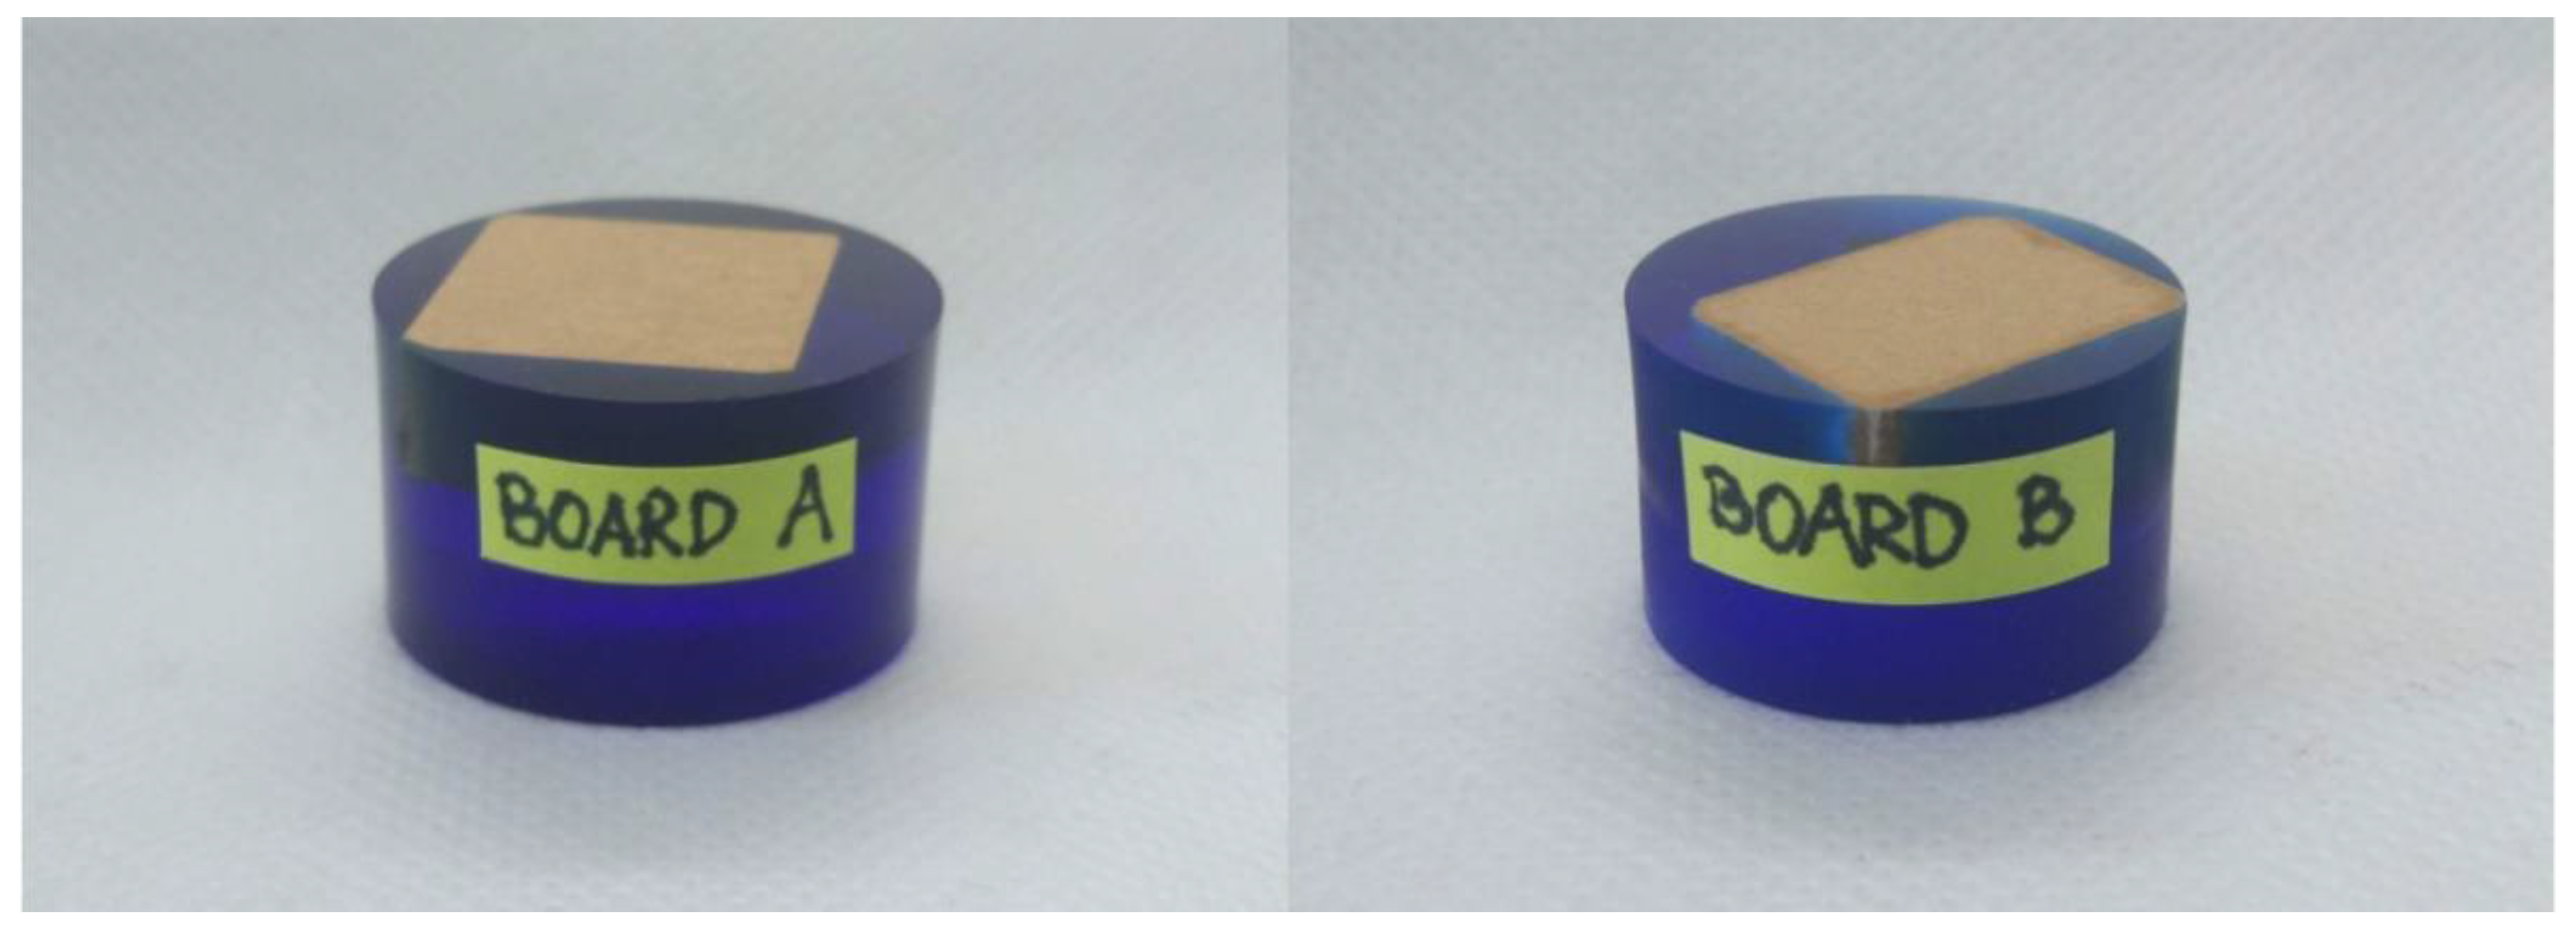
| Photo of the board |  | |
| Parameter | Specimen before High Temperature Treatment (Board A) | Specimen after High Temperature Treatment (Board B) | |
|---|---|---|---|
| Mean value of hardness | [GPa] | 0.382 | 0.285 |
| Standard deviation of hardness | [GPa] | 0.226 | 0.201 |
| Coefficient of variation * of hardness | 0.592 | 0.705 | |
| Mean value of indentation modulus | [GPa] | 12.686 | 8.147 |
| Standard deviation of indentation modulus | [GPa] | 4.093 | 3.138 |
| Coefficient of variation * of indentation modulus | 0.318 | 0.385 | |
© 2019 by the authors. Licensee MDPI, Basel, Switzerland. This article is an open access article distributed under the terms and conditions of the Creative Commons Attribution (CC BY) license (http://creativecommons.org/licenses/by/4.0/).
Share and Cite
Gorzelańczyk, T.; Pachnicz, M.; Różański, A.; Schabowicz, K. Multi-Scale Structural Assessment of Cellulose Fibres Cement Boards Subjected to High Temperature Treatment. Materials 2019, 12, 2449. https://doi.org/10.3390/ma12152449
Gorzelańczyk T, Pachnicz M, Różański A, Schabowicz K. Multi-Scale Structural Assessment of Cellulose Fibres Cement Boards Subjected to High Temperature Treatment. Materials. 2019; 12(15):2449. https://doi.org/10.3390/ma12152449
Chicago/Turabian StyleGorzelańczyk, Tomasz, Michał Pachnicz, Adrian Różański, and Krzysztof Schabowicz. 2019. "Multi-Scale Structural Assessment of Cellulose Fibres Cement Boards Subjected to High Temperature Treatment" Materials 12, no. 15: 2449. https://doi.org/10.3390/ma12152449
APA StyleGorzelańczyk, T., Pachnicz, M., Różański, A., & Schabowicz, K. (2019). Multi-Scale Structural Assessment of Cellulose Fibres Cement Boards Subjected to High Temperature Treatment. Materials, 12(15), 2449. https://doi.org/10.3390/ma12152449