Examining the Distribution of Strength across the Thickness of Reinforced Concrete Elements Subject to Sulphate Corrosion Using the Ultrasonic Method


Abstract
1. Introduction
- The volume of Candlot’s salt must exceed some threshold value which depends on the capillary porosity of concrete,
- Only Candlot’s salt formed after the hydration of cement leads to expansion,
- Candlot’s salt must be formed at the boundaries of solid phases of concrete.
2. Materials and Methods
2.1. Materials
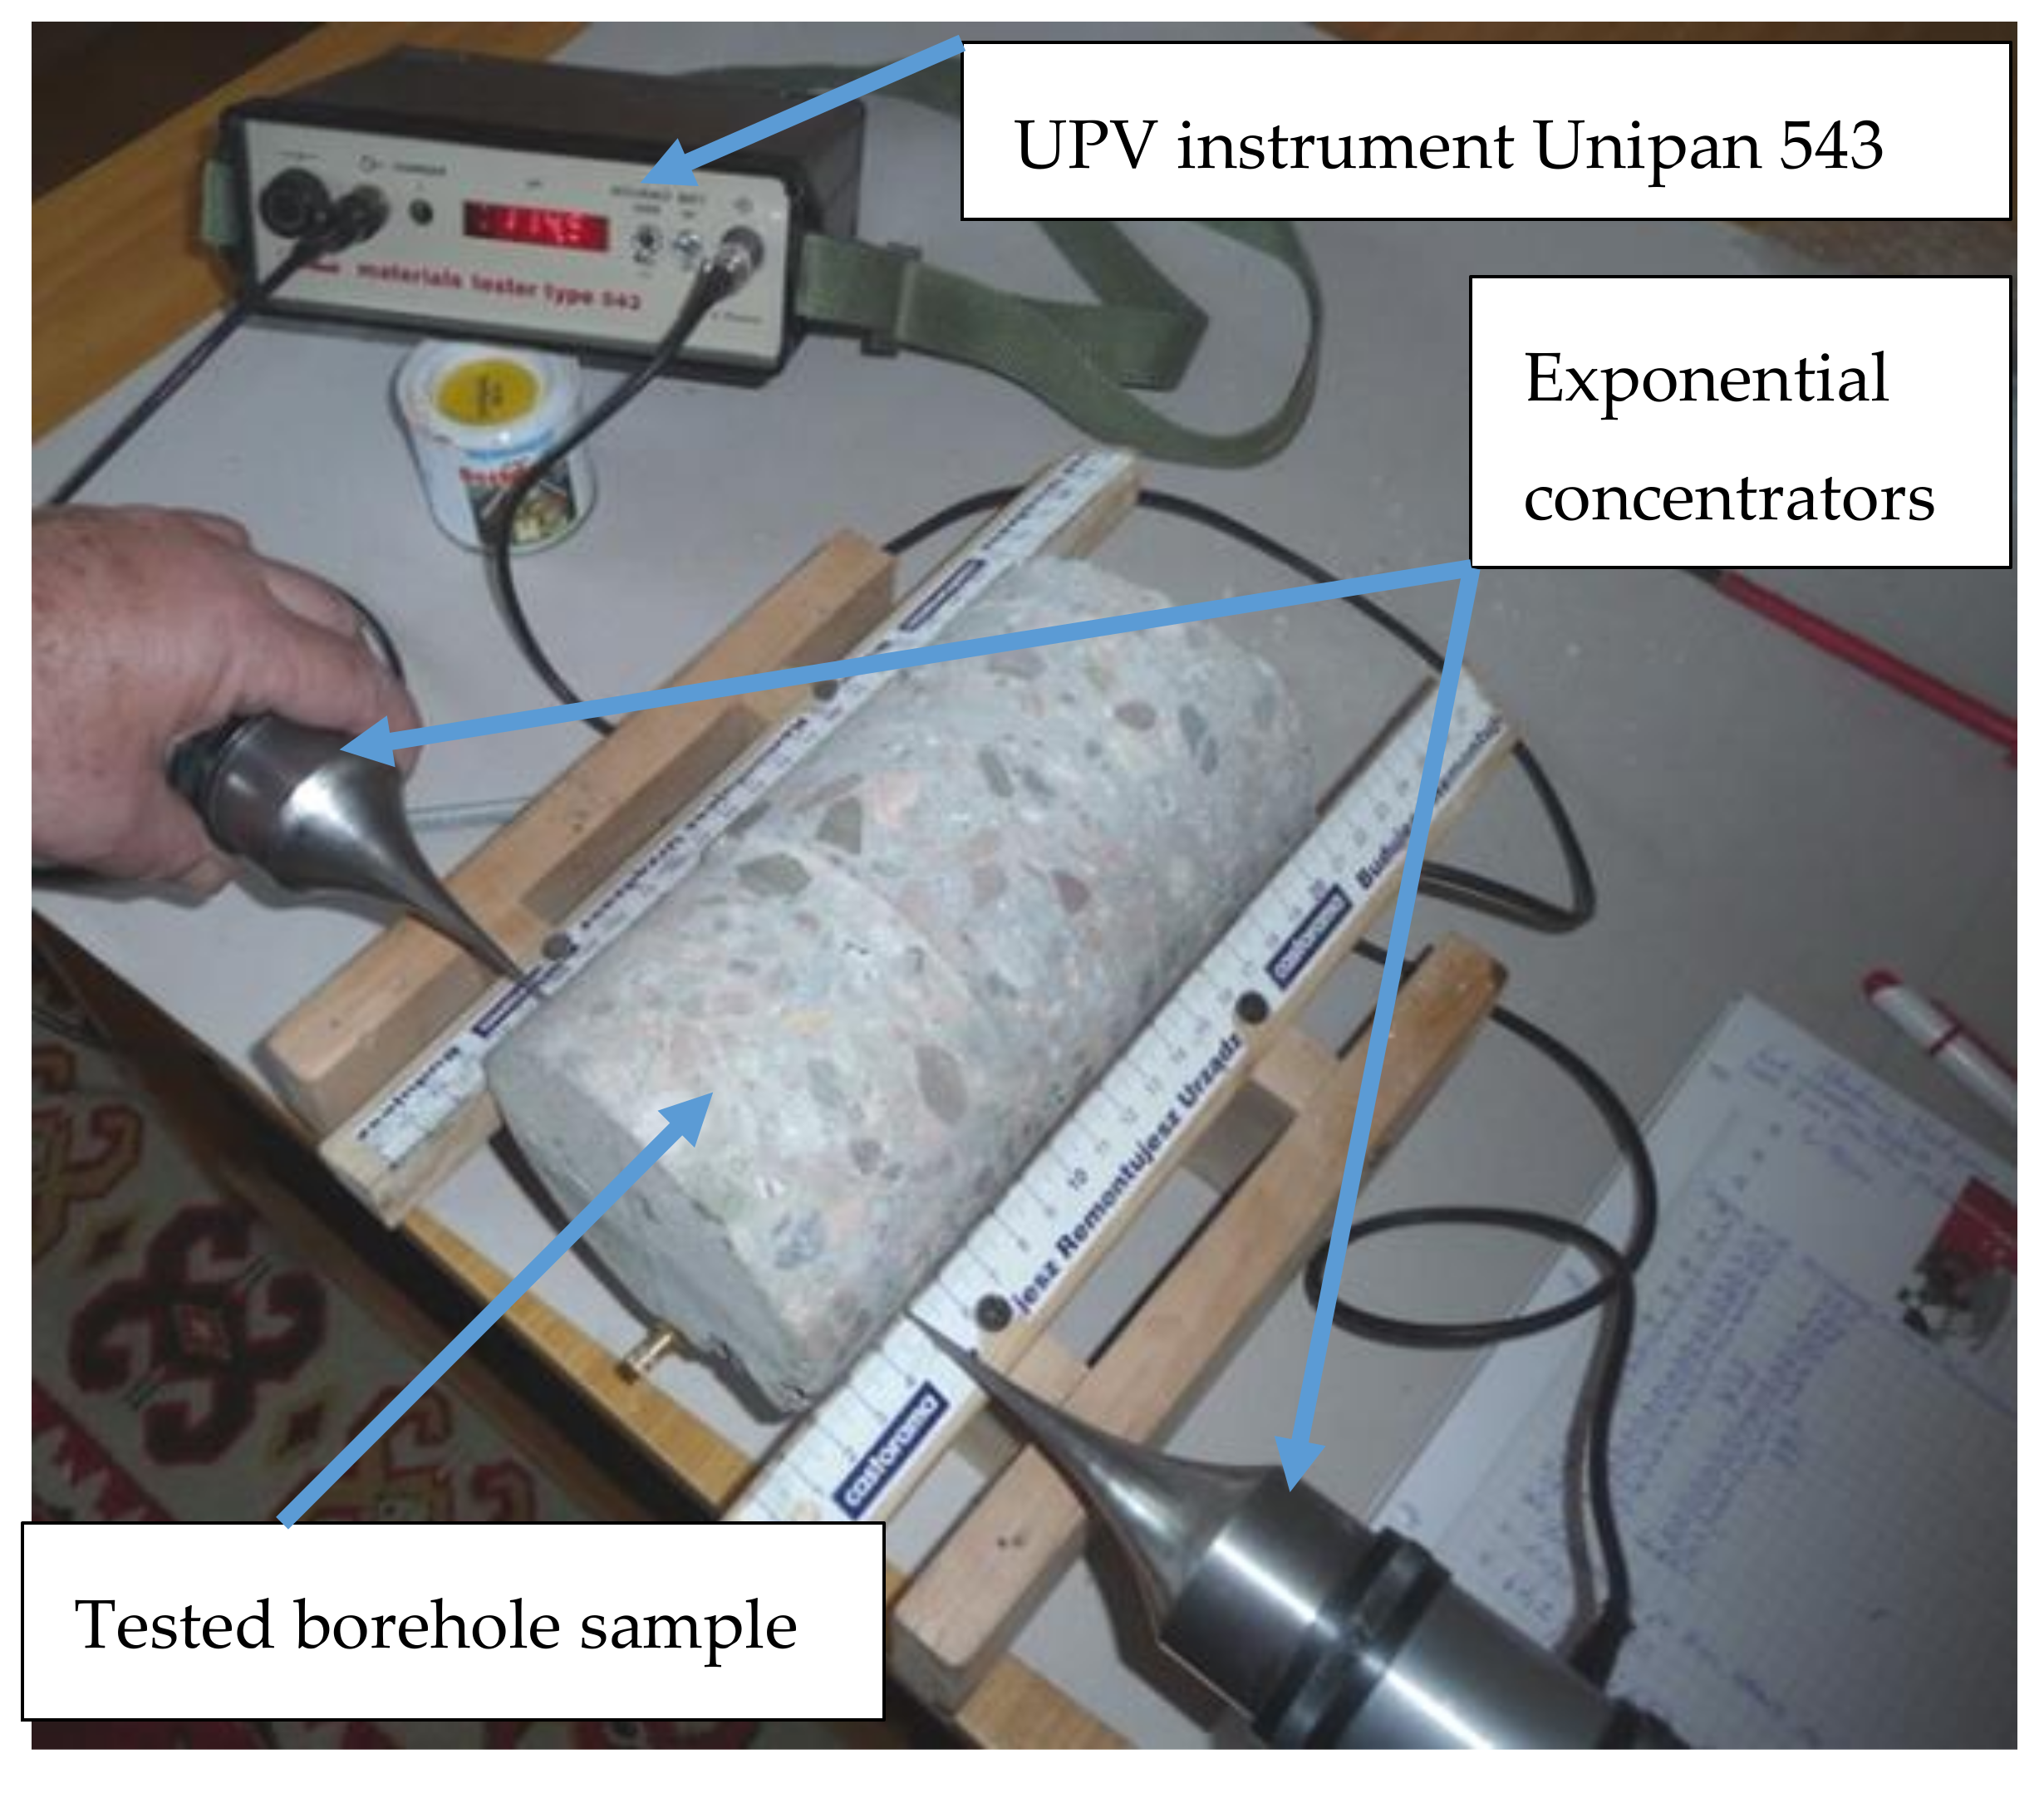
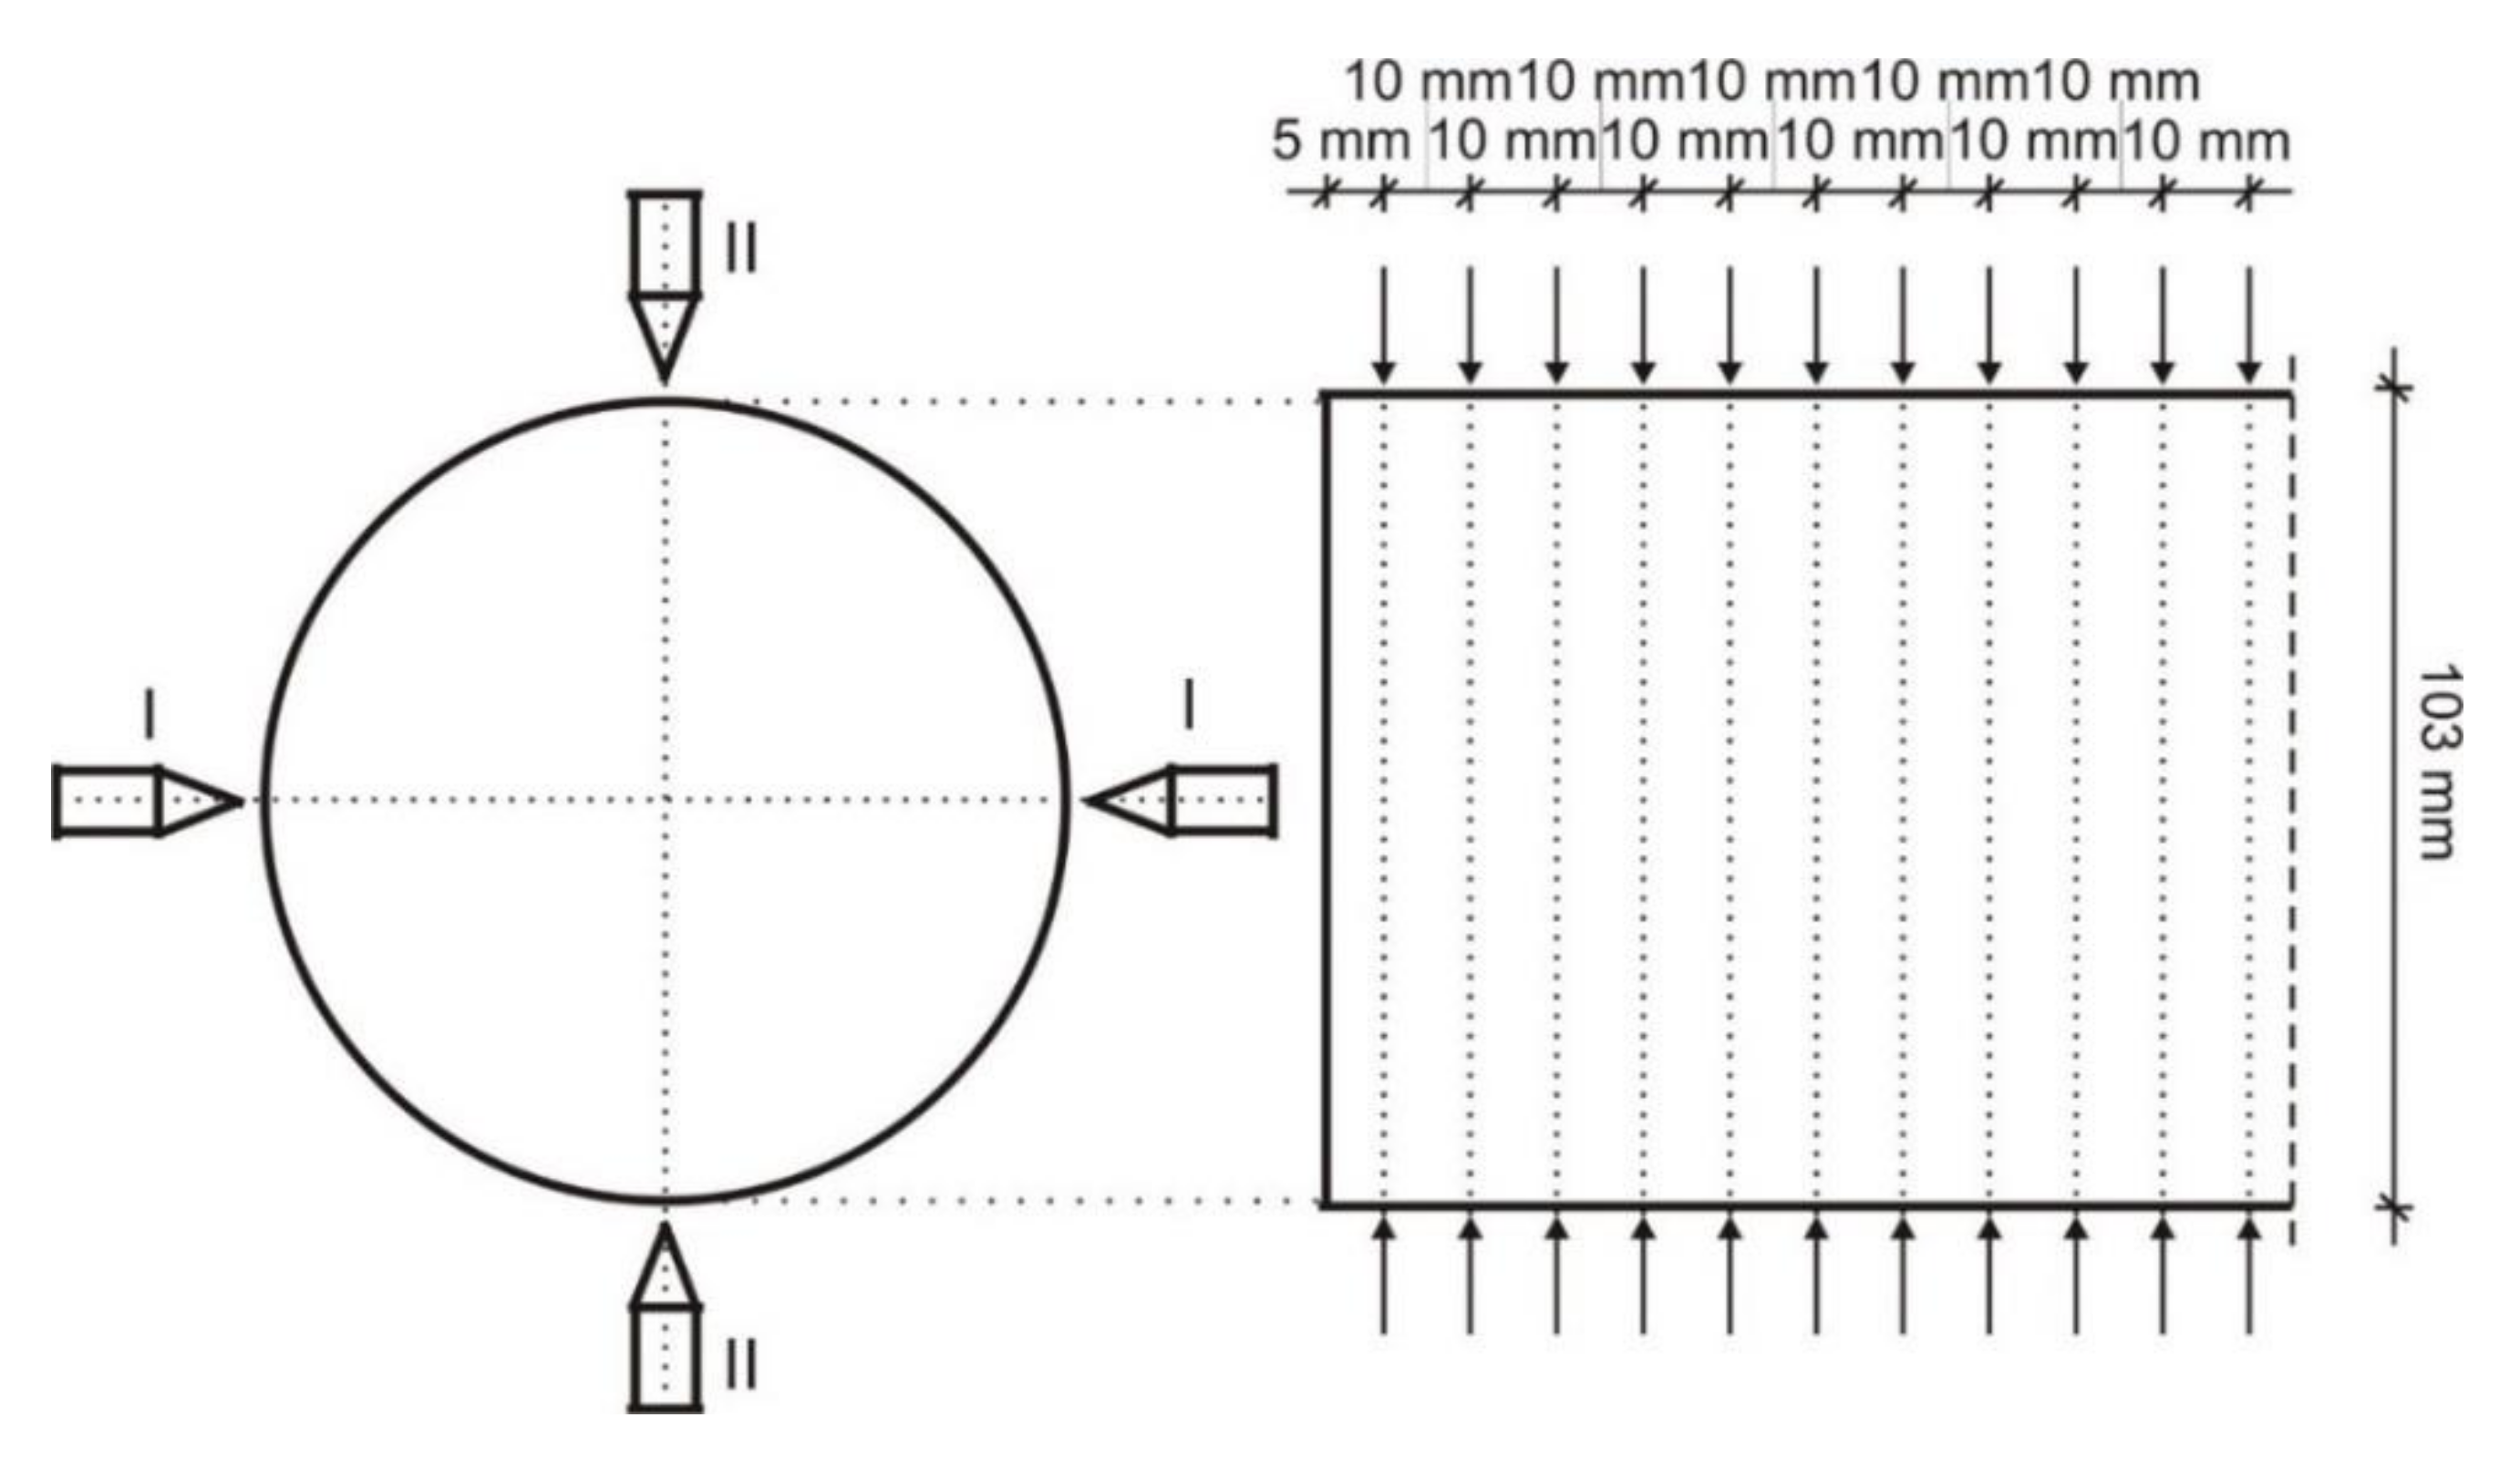
2.2. Methods
3. Results
3.1. Quantification of Sulphates in Tested Material
3.2. Calibration of Ultrasound Pulse Velocity-Compression Strength Curve Based on the Destructive Tests
3.3. Testing the Strength of Concrete across the Tank Wall Thickness
4. Conclusions
- Ultrasound testing methodology allowed determination of the distribution of strength as a function of depth of concrete elements under sulphate attack.
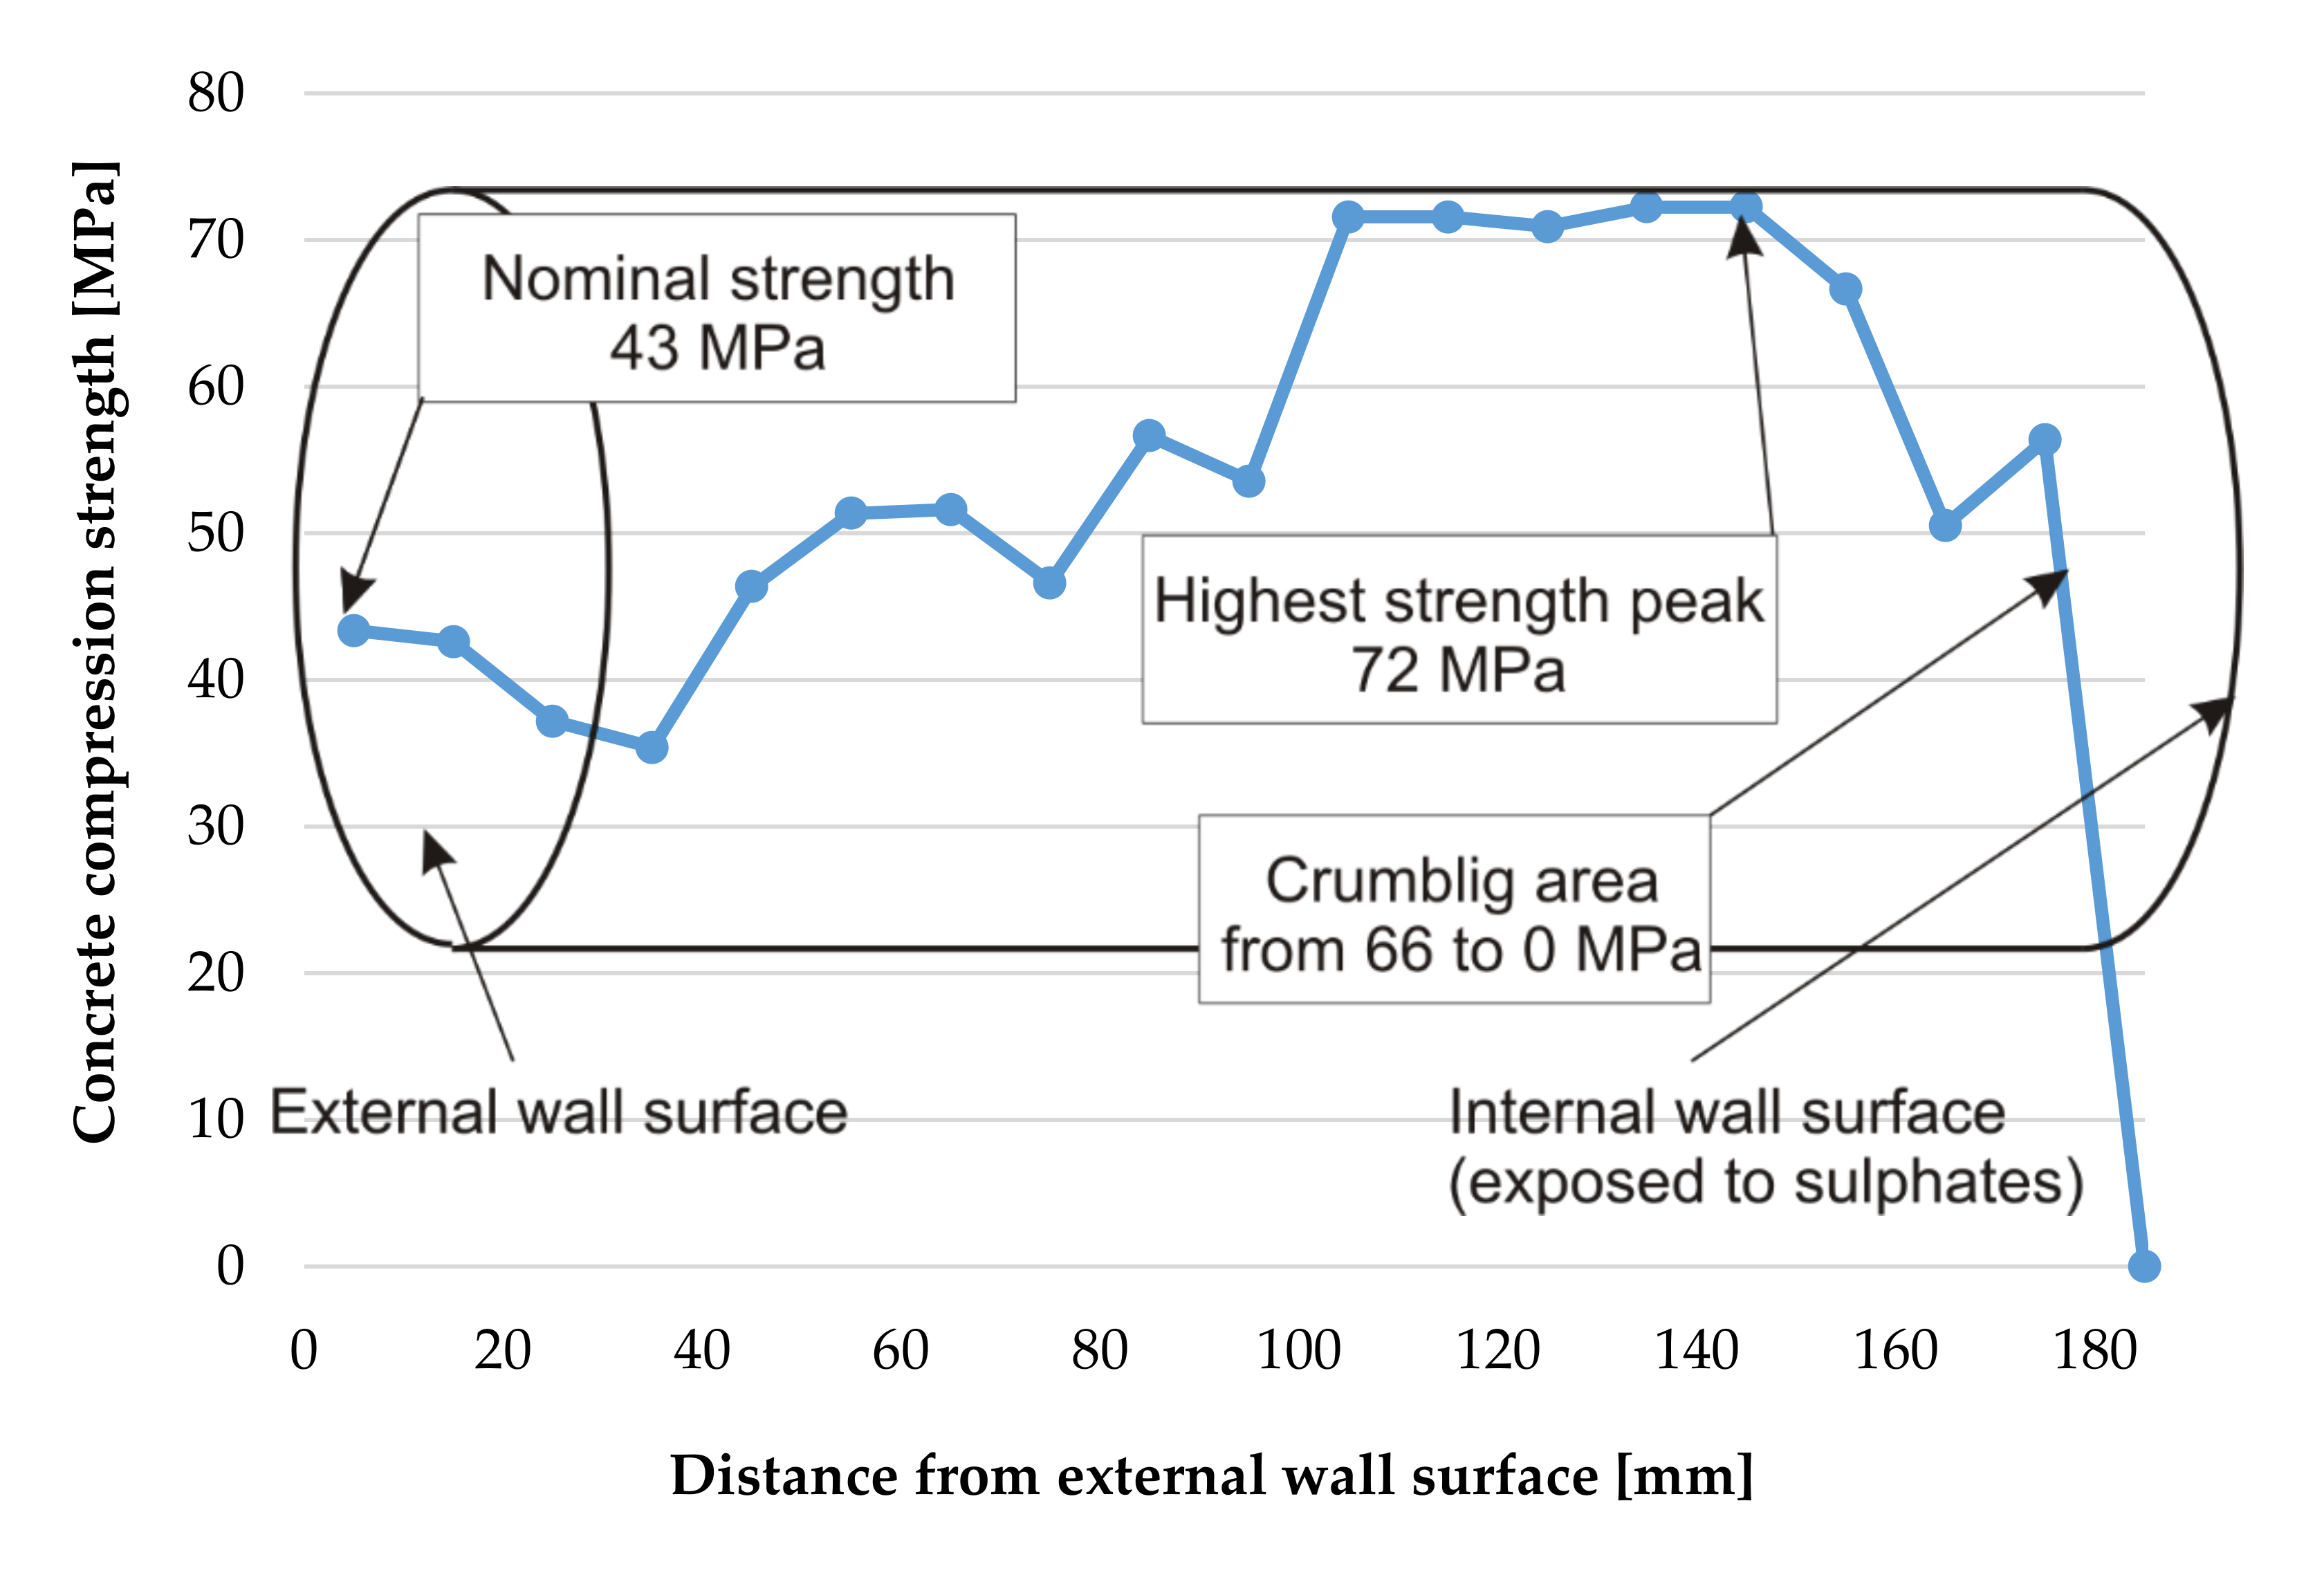
- The compressive strength of the concrete exposed to sulphate attack from one side is variable across its depth.
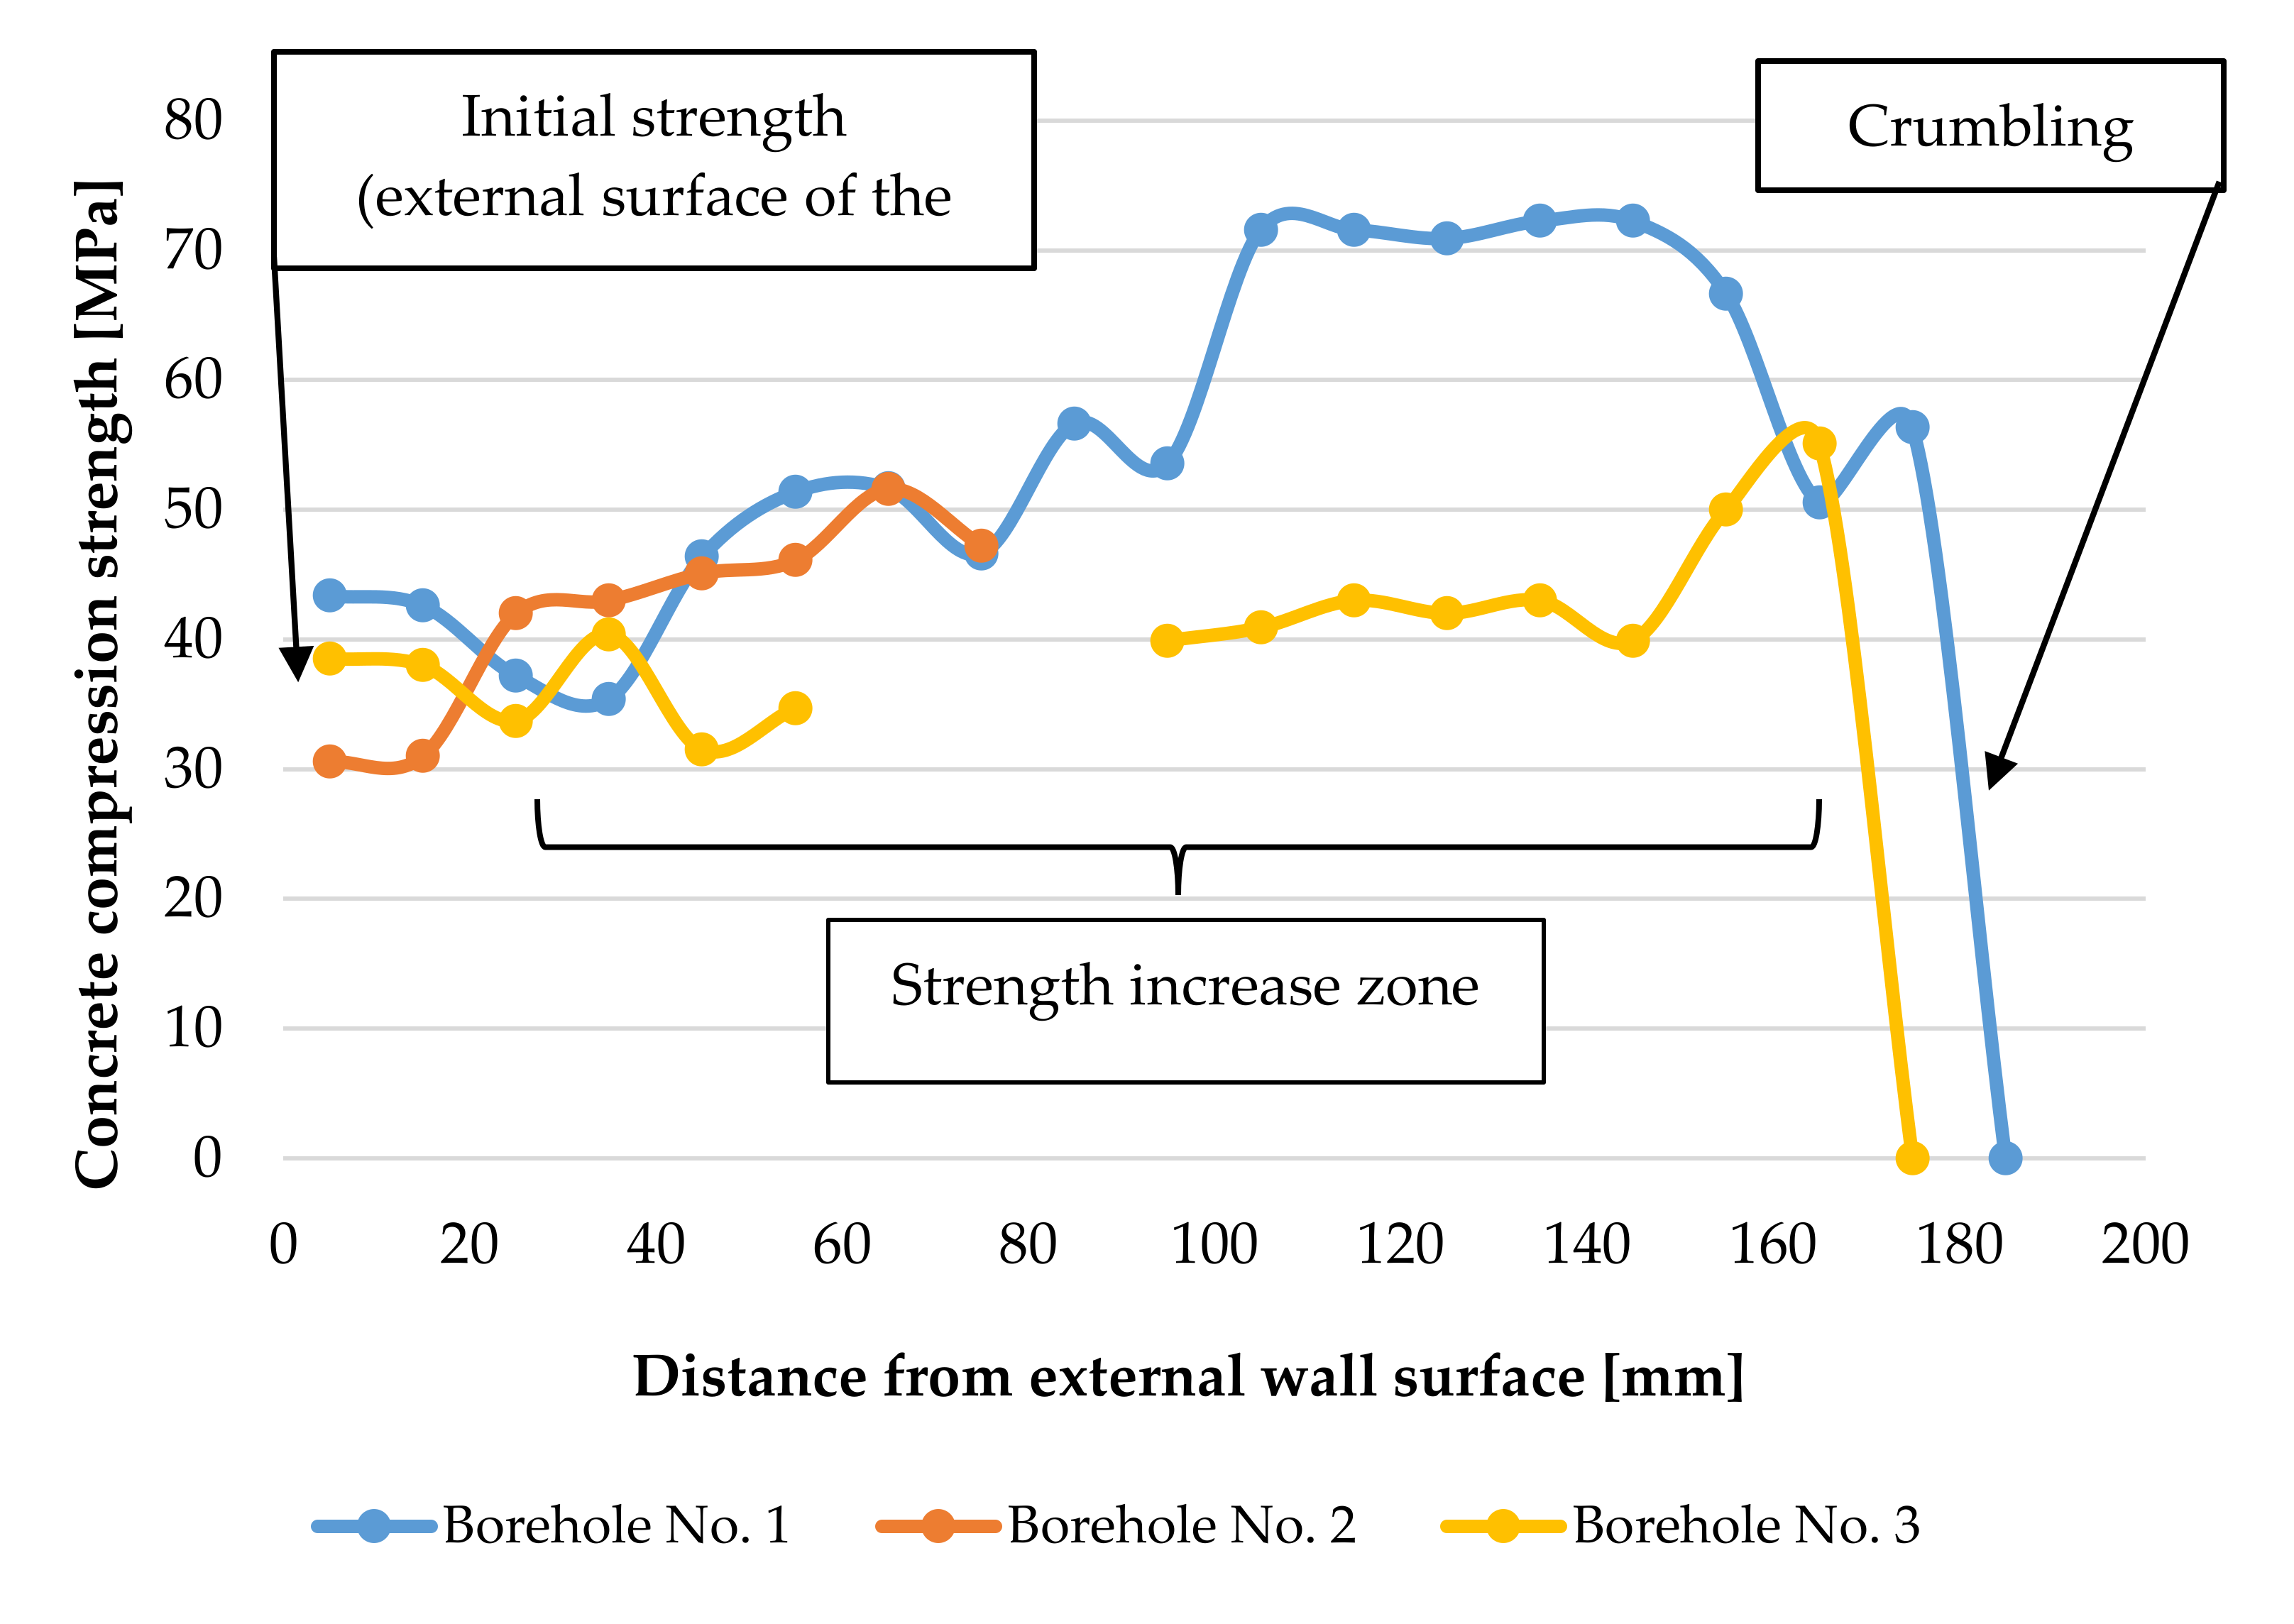
- The experimentally tested distribution of compressive strength at the depth of the elements showed an upward trend in the entire cross section towards the surface subject to corrosion.
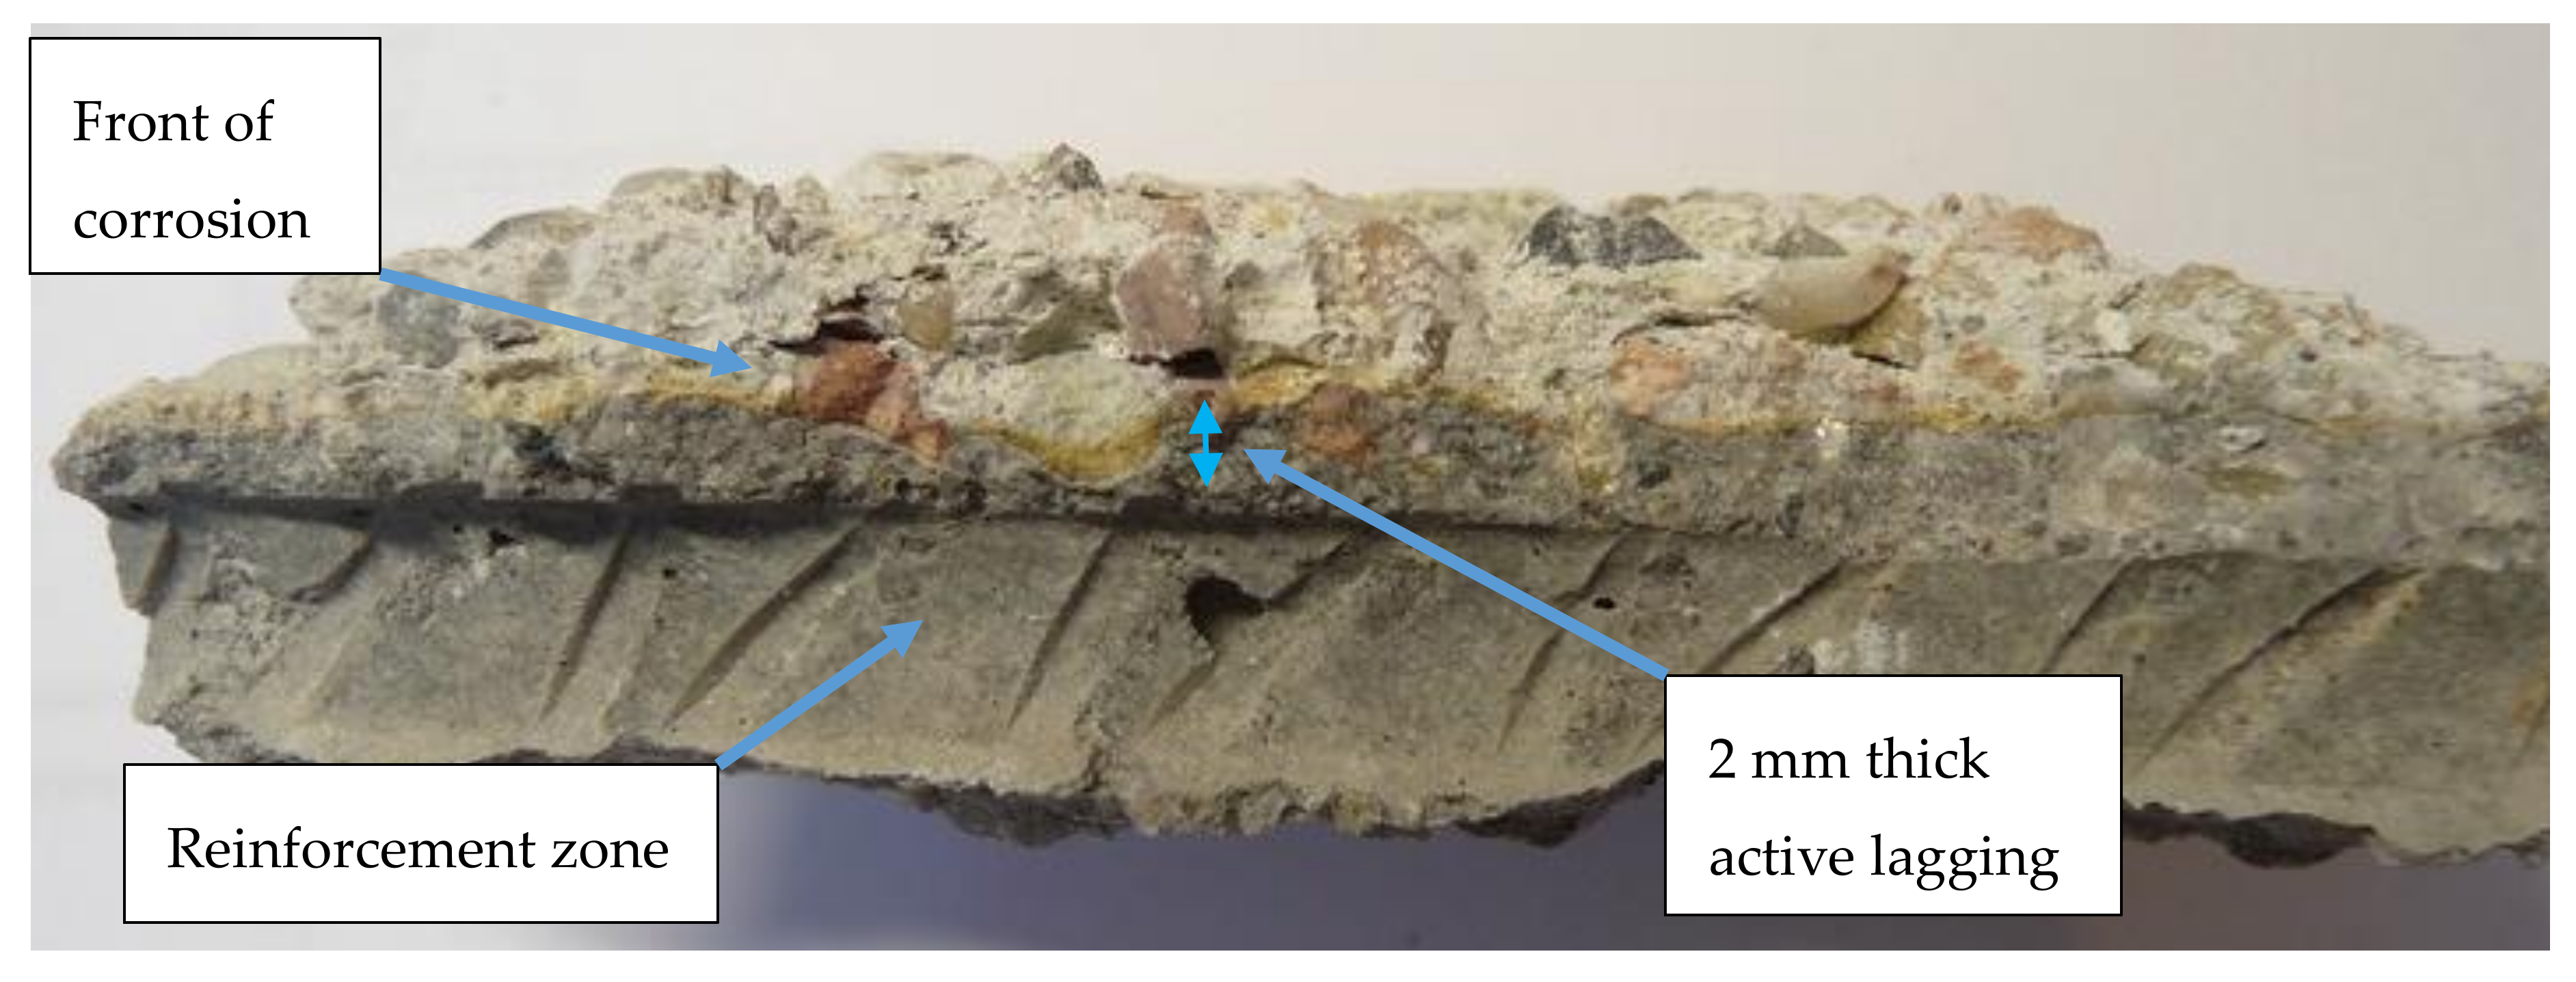
- A decrease of strength appears only in the destroyed, crumbled zone of the concrete structure. The destroyed zone of tested elements did not exceed a depth of 10 mm from the surface exposed to sulphates attack.
- In the presented research, the difference in concrete strength between cross sections near the exposed and unexposed sides varied from an increase of 44% (borehole No. 3) to 83% (borehole No. 1).
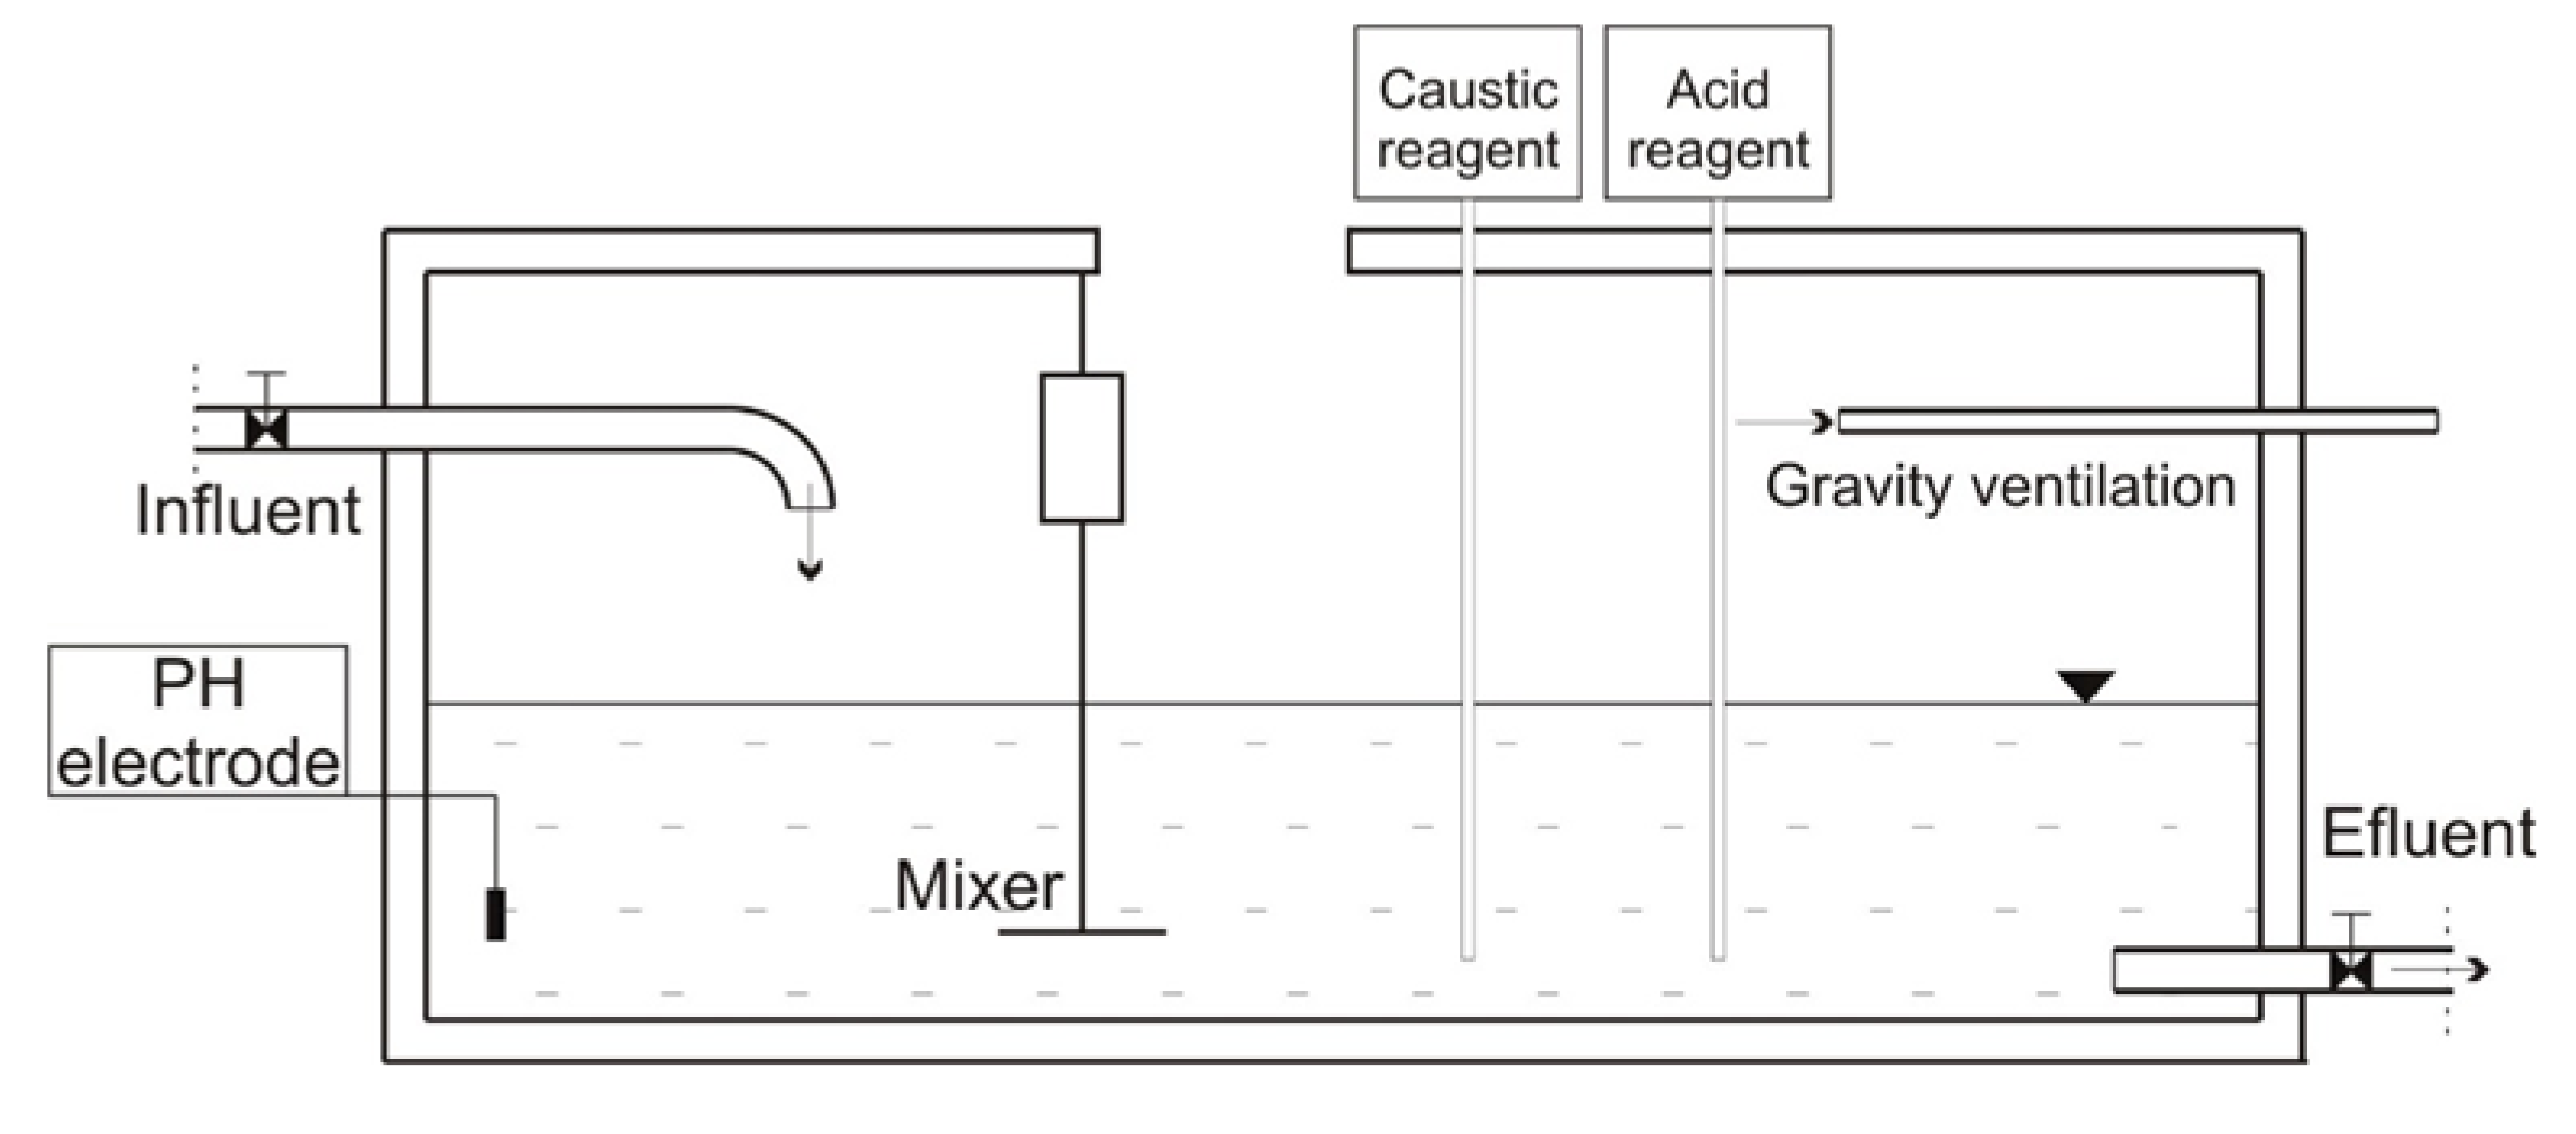
- The performed tests indicate that gases may be a more corrosive environment, especially with high humidity, than liquids, therefore the coefficients of diffusion resistance or other permeability parameters, e.g., g/m2/24 hours, are important parameters characterizing anticorrosive coatings. Chemical resistance to various acids, alkalis or other compounds is tested for the specific aggressive compound at a given level.
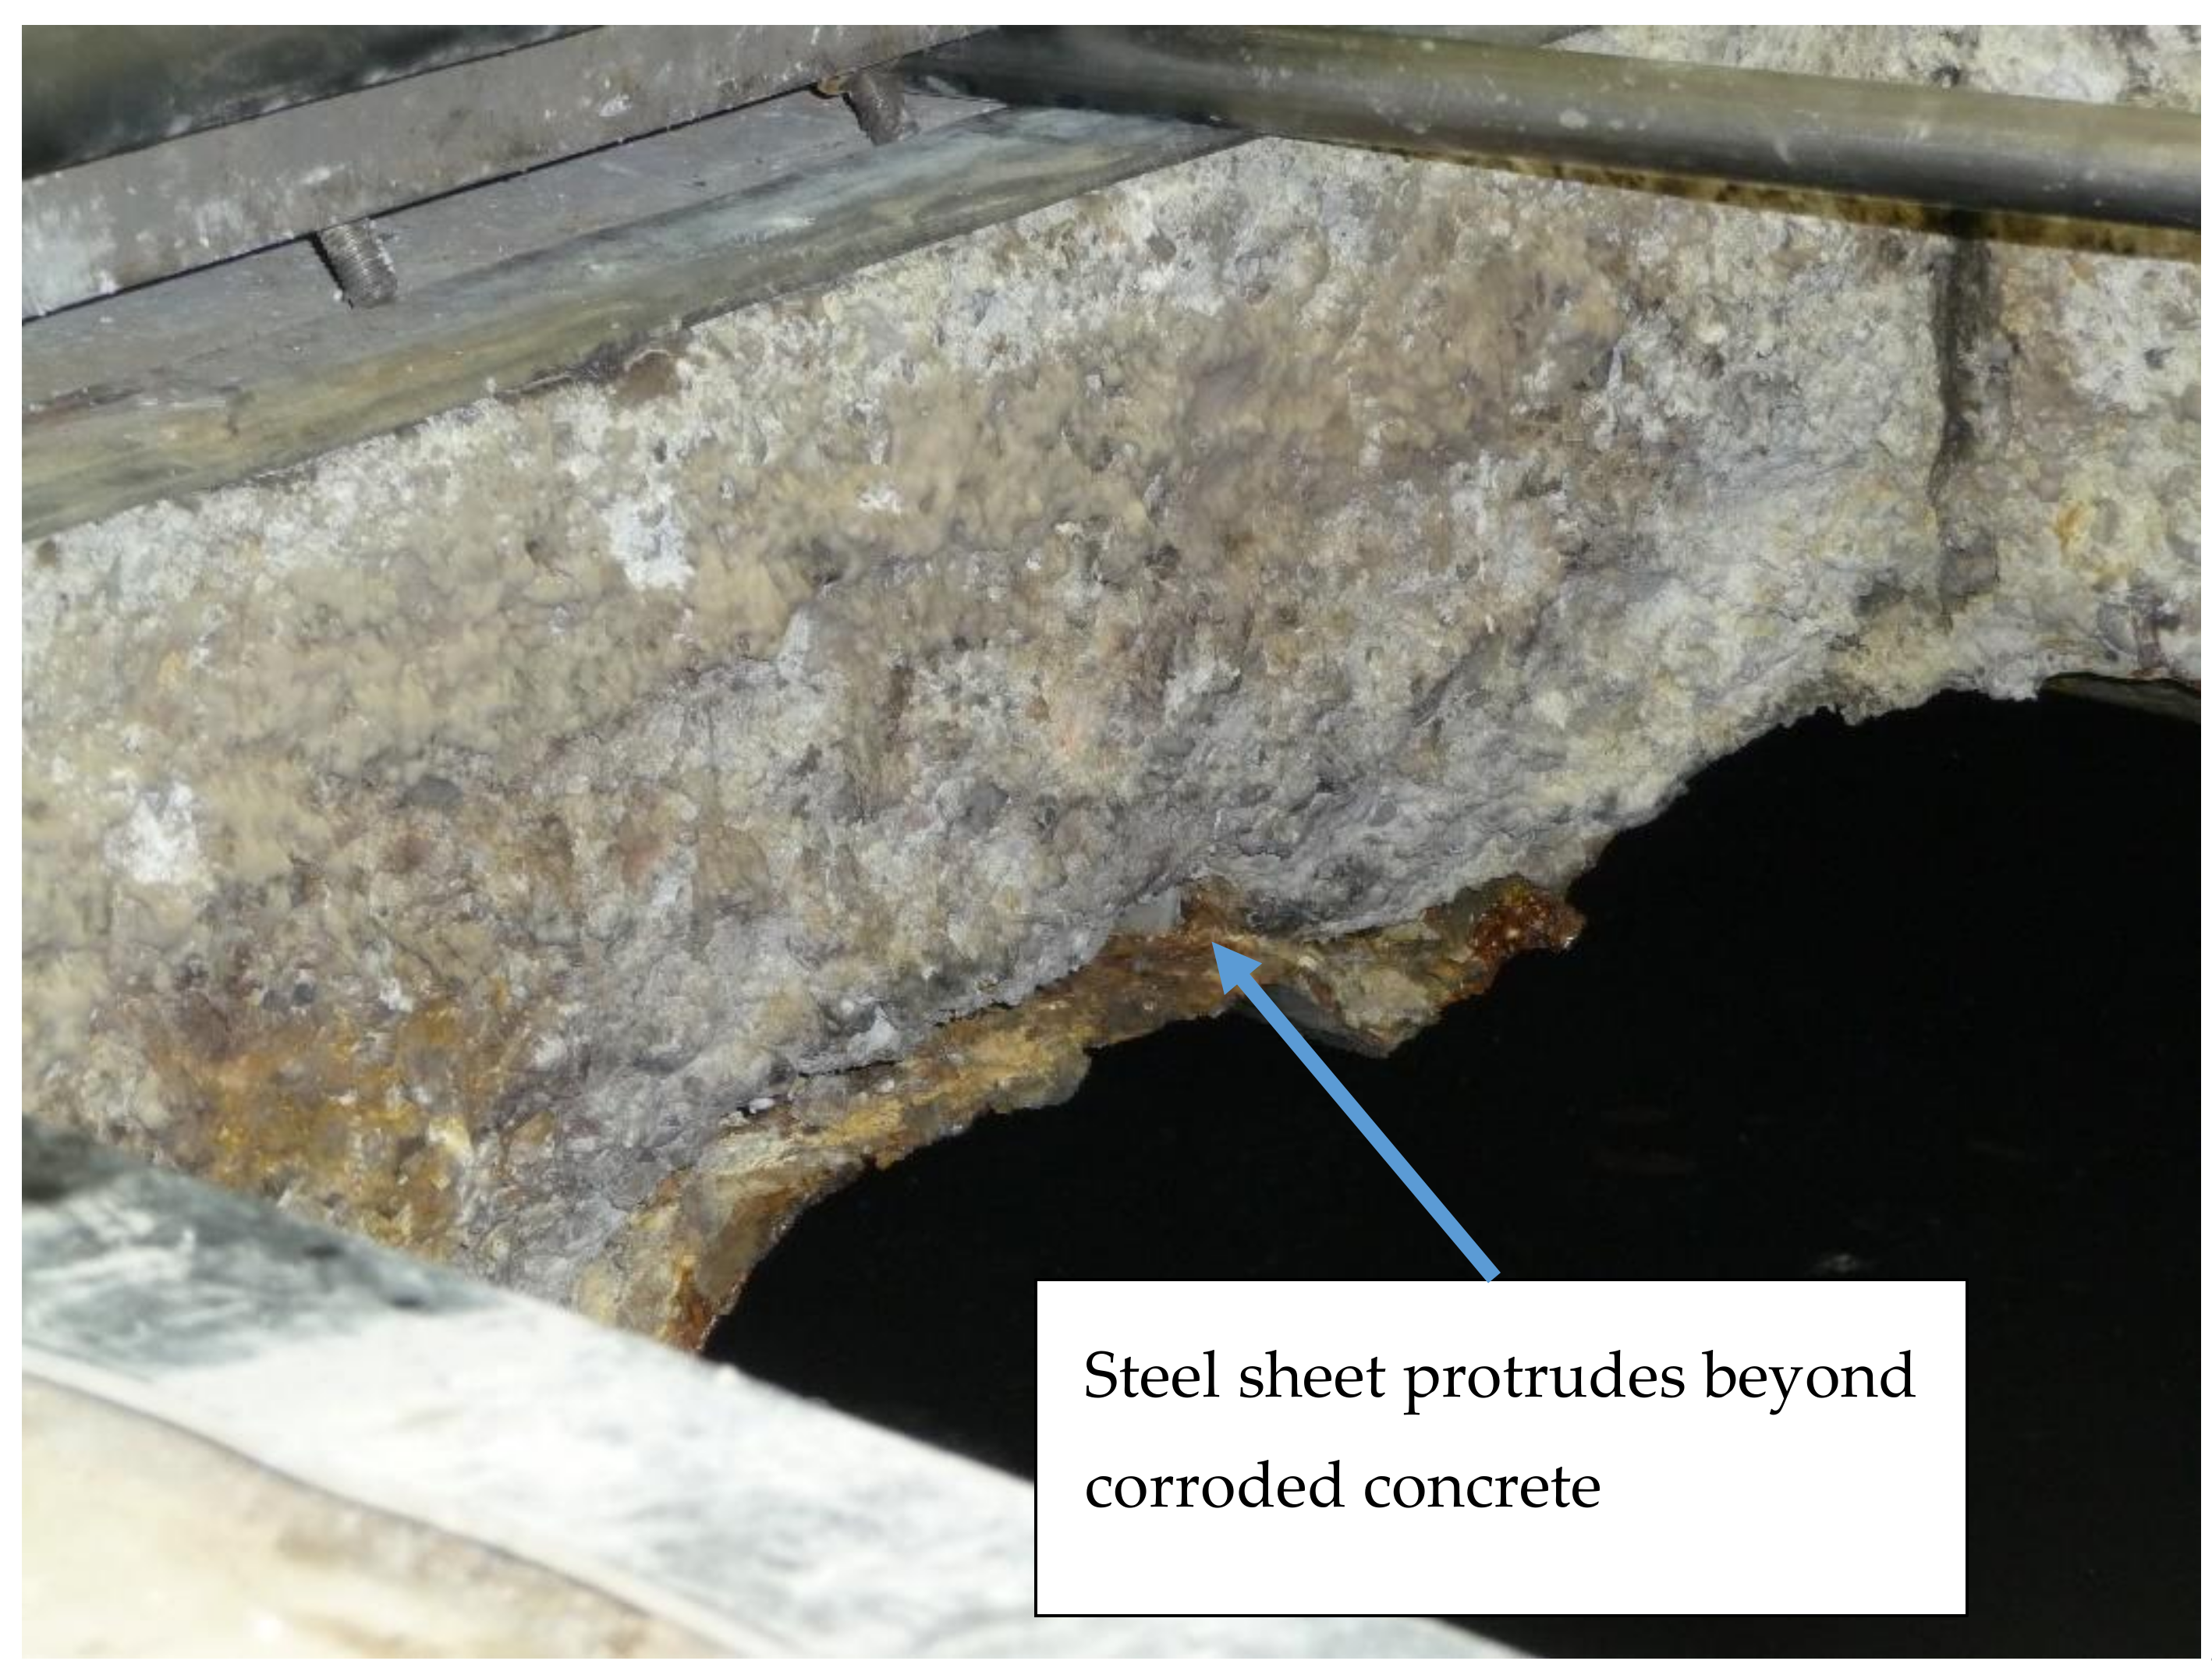
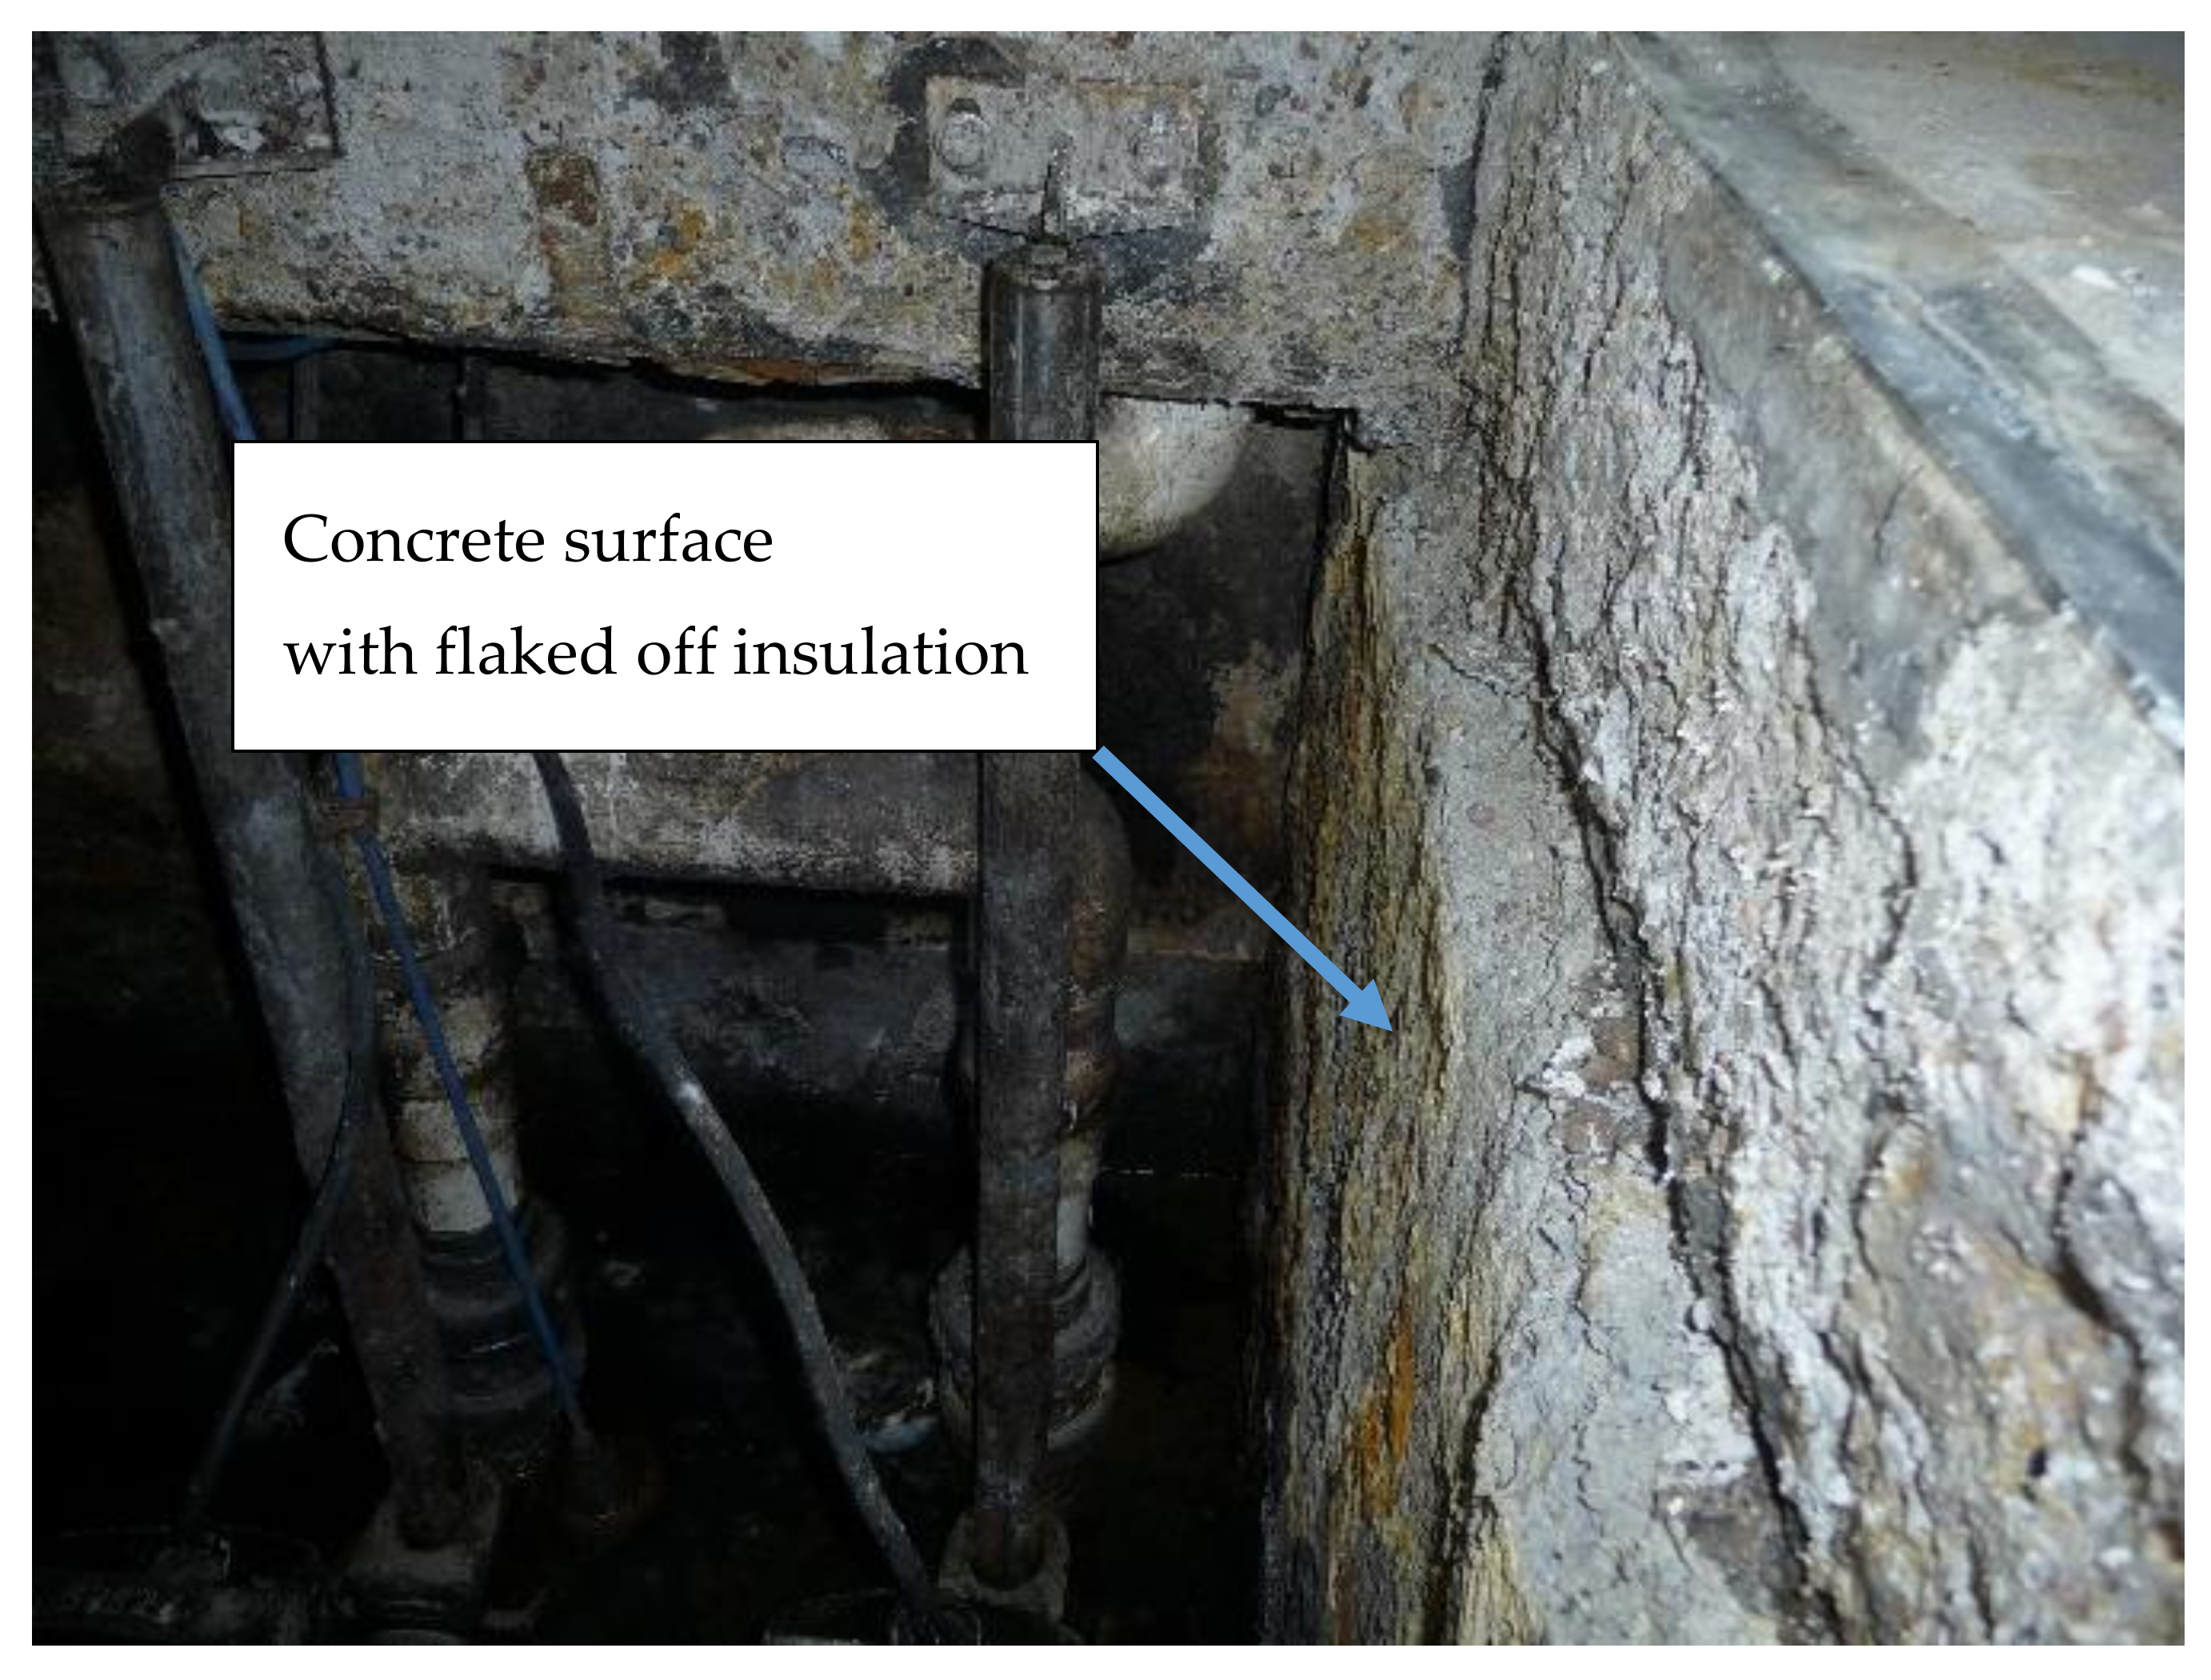
- In the tested tank, sulphur-containing gas (hydrogen sulphide) easily penetrated through the thin bituminic layer, based on the measurements at a thickness of 0.97 mm, and in contact with cement and lime formed sulphates, considerable quantities of which were found in the concrete.
- Since the lagging thickness had decreased already down to 2 mm, danger exists not only for the concrete but also for steel. The rate of concrete corrosion in the tank is probably influenced by the concentration of the gases above the liquid. If the tank had a properly built gravity ventilation, the concrete damage process would be much slower, because relative air humidity in the tank would also be much lower with effectively running ventilation.
Author Contributions
Funding
Conflicts of Interest
References
- Feldman, R.F. Porestructure, Permeability and Diffusivity as Related to Durability. In Eighth International Congress on the Chemistry of Cement; Bertrand Brasil: Rio de Janeiro, Brazil, 1986; Volume 1, Theme 4. [Google Scholar]
- Gruner, M. Corrosion and Protection of Concrete; PWN: Warsaw, Poland, 1983. (In Polish) [Google Scholar]
- Flaga, K. The Role of the Tightness of the Aggregate Skeleton in the Design of a Concrete Mix. Inz. Bud. 1984, 7, 14–16. (In Polish) [Google Scholar]
- Chodor, L. Repair and Protection of Reinforced Concrete. |Chodor-Projekt|. Available online: http://chodor-projekt.net/encyclopedia/naprawa-i-ochrona-zelbetu/ (accessed on 15 July 2018).
- Maj, M.; Ubysz, A. Cracked reinforced concrete walls of chimneys, silos and cooling towers as result of using formworks. In MATEC Web of Conferences 146, Proceedings of Building Defects 2017, České Budějovice, Czech Republic, November 23–24, 2017; Šenitková, I.J., Ed.; EDP Sciences: Les Ulis, France, 2018; Volume 02002, pp. 1–8. [Google Scholar] [CrossRef][Green Version]
- Trapko, T.; Musiał, M.P. Failure of pillar of sports and entertainment hall structure. In MATEC Web of Conferences 146, Proceedings of Building Defects 2017, České Budějovice, Czech Republic, November 23–24, 2017; Šenitková, I.J., Ed.; EDP Sciences: Les Ulis, France, 2018; Volume 02002, pp. 1–8. [Google Scholar] [CrossRef]
- Wells, T.; Melchers, R.E.; Bond, P. Factors involved in the long term corrosion of concrete sewers. In Proceedings of the 49th Annual Conference of the Australasian Corrosion Association, Corrosion and Prevention, Coffs Harbour, Australia, 15–19 November 2009. [Google Scholar]
- Sun, C.; Chen, J.; Zhu, J.; Zhang, M.; Ye, J. A new diffusion model of sulfate ions in concrete. Constr. Build. Mater. 2013, 39, 39–45. [Google Scholar] [CrossRef]
- Bonakdar, A.; Mobasher, B.; Chawla, N. Diffusivity and micro-hardness of blended cement materials exposed to external sulfate attack. Cem. Concr. Compos. 2012, 34, 76–85. [Google Scholar] [CrossRef]
- Idiart, A.E.; L’opez, C.M.; Carol, I. Chemo-mechanical analysis of concrete cracking and degradation due to external sulfate attack: A meso-scale model. Cem. Concr. Compos. 2011, 33, 411–423. [Google Scholar] [CrossRef]
- Lorente, S.; Yssorche-Cubaynes, M.-P.; Auger, J. Sulfate transfer through concrete: Migration and diffusion results. Cem. Concr. Compos. 2011, 33, 735–741. [Google Scholar] [CrossRef]
- Condor, J.; Asghari, K.; Unatrakarn, D. Experimental results of diffusion coefficient of sulfate ions in cement type 10 and class G. Energy Procedia 2011, 4, 5267–5274. [Google Scholar] [CrossRef]
- Roziere, E.; Loukili, A.; Hachem, R.; Grondin, F. Durability of concrete exposed to leaching and external sulphate attacks. Cem. Concr. Res. 2009, 39, 1188–1198. [Google Scholar] [CrossRef]
- Santhanam, M.; Cohen, M.D.; Olek, J. Modeling the effects of solution temperature and concentration during sulfate attack on cement mortars. Cem. Concr. Res. 2002, 32, 585–592. [Google Scholar] [CrossRef]
- Pommersheim, J.M.; Clifton, J.R. Expansion of cementitious materials exposed to sulfate solutions, scientific basis for nuclear waste management. Mater. Res. Soc. 1994, 333, 363–368. [Google Scholar] [CrossRef]
- Parande, A.K.; Ramsamy, P.L.; Ethirajan, S.; Rao, C.R.K.; Palanisamy, N. Deterioration of reinforced concrete in sewer environments. Inst. Civ. Eng. -Munic. Eng. 2006, 159, 11–20. [Google Scholar] [CrossRef]
- Basista, M.; Weglewski, W. Chemically-assisted damage of concrete: A model of expansion under external sulfate attack. Int. J. Damage Mech. 2008, 18, 155–175. [Google Scholar] [CrossRef]
- Basista, M.; Weglewski, W. Micromechanical modelling of sulphate corrosion in concrete: Influence of ettringite forming reaction. Theor. Appl. Mech. 2008, 35, 29–52. [Google Scholar] [CrossRef]
- Pommersheim, J.; Clifton, J.R. Sulphate Attack of Cementitious Materials: Volumetric Relations and Expansion; National Institute of Standards and Technology: Gaithersburg, MD, USA, 1994; pp. 1–19. [Google Scholar]
- Skalny, J.; Marchand, J.; Odler, I. Sulphate Attack on Concrete; Spon Press: London, UK, 2002. [Google Scholar]
- Zhou, Y.; Tian, H.; Sui, L.; Xing, F.; Han, N. Strength Deterioration of Concrete in Sulfate Environment: An Experimental Study and Theoretical Modeling. Adv. Mater. Sci. Eng. 2015, 2015, 951209. [Google Scholar] [CrossRef]
- Shi, F.; Wang, J.H. Performance degradation of cube attacked by sulfate. Concrete 2013, 3, 52–53. [Google Scholar]
- Du, J.M.; Liang, Y.N.; Zhang, F.J. Mechanism and Performance Degradation of Underground Structure Attacked by Sulfate; China Railway Publishing House: Beijing, China, 2011. [Google Scholar]
- Neville, A.M. Properties of Concrete; Polski Cement Sp. z o.o.: Cracow, Poland, 2000. (In Polish) [Google Scholar]
- Petersons, N. Should standard cube test specimens be replaced by test specimens taken from structures? Mater. Struct. 1968, 1, 425–435. [Google Scholar] [CrossRef]
- Stawiski, B. The heterogeneity of mechanical properties of concrete in formed constructions horizontally. Arch. Civ. Mech. Eng. 2012, 12, 90–94. [Google Scholar] [CrossRef]
- Jasinski, R.; Drobiec, Ł.; Mazur, W. Validation of Selected Non-Destructive Methods for Determining the Compressive Strength of Masonry Units Made of Autoclaved Aerated Concrete. Materials 2019, 12, 389. [Google Scholar] [CrossRef]
- Bogas, J.A.; Gomes, M.G.; Gomes, A. Compressive strength evaluation of structural lightweight concrete by non-destructive ultrasonic pulse velocity method. Ultrasonics 2013, 53, 962–972. [Google Scholar] [CrossRef]
- Brunarski, L. Estimation of concrete strength in construction. Build. Res. Inst. Quat. 1998, 2–3, 28–45. [Google Scholar]
- Anugonda, P.; Wiehn, J.S.; Turner, J.A. Diffusion of ultrasound in concrete. Ultrasonics 2001, 39, 429–435. [Google Scholar] [CrossRef]
- Sansalone, M.; Streett, W.B. Impact-Echo Nondestructive Evaluation of Concrete and Masonry; Bullbrier Press: Ithaca, NY, USA, 1997. [Google Scholar]
- Breysse, D. Nondestructive evaluation of concrete strength: An historical review and a new perspective by combining NDT methods. Constr. Build. Mater. 2012, 33, 139–163. [Google Scholar] [CrossRef]
- Facaoaru, I. Contribution à i’étude de la relation entre la résistance du béton à la compression et de la vitesse de propagation longitudinale des ultrasons. RILEM 1961, 22, 125–154. [Google Scholar]
- Leshchinsky, A. Non-destructive methods instead of specimens and cores, quality control of concrete structures. In Proceedings of the Second International RILEM/CEB Symposium, Belgium, 12–14 June 1991; pp. 377–386. [Google Scholar]
- Bungey, J.H. The validity of ultrasonic pulse velocity testing of in-place concrete for strength. NDT Int. 1980, 13, 296–300. [Google Scholar] [CrossRef]
- Szpetulski, J. Testing of compressive strength of concrete in construction. Constr. Rev. 2016, 3, 21–24. (In Polish) [Google Scholar]
- Gudra, T.; Stawiski, B. Non-destructive strength characterization of concrete using surface waves. NDT Int. 2000, 33, 1–6. [Google Scholar] [CrossRef]
- Komlos, K.; Popovics, S.; Nurnbergerova, T.; Babal, B.; Popovics, J.S. Ultrasonic Pulse Velocity Test of Concrete Properties as Specified in Various Standards. Cem. Concr. Compos. 1996, 18, 357–364. [Google Scholar] [CrossRef]
- PN-B-06261. Non-Destructive Testing of Structures; Ultrasound method of testing compressive strength of concrete; Polish Committee for Standardization: Warsaw, Poland, 1974. [Google Scholar]
- EN 12504-4. Testing Concrete-Part 4: Determination of Ultrasonic Pulse Velocity; European Committee for Standardization: Brussels, Belgium, 2004. [Google Scholar]
- EN 13791. Assessment of In-Situ Compressive Strength in Structures and Precast Concrete Components; Polish Committee for Standardization: Brussels, Belgium, 2004. [Google Scholar]
- Stawiski, B.; Kania, T. Determination of the influence of cylindrical samples dimensions on the evaluation of concrete and wall mortar strength using ultrasound method. Procedia Eng. 2013, 57, 1078–1085. [Google Scholar]
- Alam, B.; Afzal, S.; Akbar, J.; Ashraf, M.; Shahzada, K.; Shabab, M.E. Mitigating Sulphate Attack in High Performance Concrete. Int. J. Adv. Struct. Geotech. Eng. 2013, 2, 11–15. [Google Scholar]
- Genovés, V.; Vargas, F.; Gosálbez, J.; Carrión, A.; Borrachero, M.V.; Payá, J. Ultrasonic and impact spectroscopy monitoring on internal sulphate attack of cement-based materials. Mater. Des. 2017, 125, 46–54. [Google Scholar] [CrossRef]
- Cumming, S.R. Non-Destructive Testing to Monitor Concrete Deterioration Caused by Sulfate Attack; University of Florida: Gainesville, FL, USA, 2004. [Google Scholar]
- Kocjan, R. Analytical Chemistry; Qualitative analysis, Quantitative analysis, Instrumental analysis; PZWL: Warsawa, Poland, 2015. (In Polish) [Google Scholar]
- Blumenthal, P.L.; Guernsey, S.C. The Determination of Sulfur as Barium Sulfate; Research Bulletin No. 26; AES: Ames, IA, USA, 1915. [Google Scholar]
- Reid, J.M.; Czerewko, M.A.; Cripps, J.C. Sulfate Specification for Structural Backfills; Report TRL447; TRL: Berkshire, UK, 2005. [Google Scholar]
- St. John, T.W. Quantifying acid-soluble sulfates in geological materials: A comparative study of the British Standard gravimetric method with ICP-OES/AES. In Proceedings of the 19th International Conference on Soil Mechanics and Geotechnical Engineering, Seoul, Korea, 15 September 2017. [Google Scholar]
- Piasta, W.; Marczewska, J.; Jaworska, M. Some aspects and mechanisms of sulphate attack. Struct. Environ. 2014, 6, 19–24. [Google Scholar]
- Brown, W.; Taylor, H. The role of ettringite in external sulfate attack. Mater. Sci. Concr. 1999, 5, 73–98. [Google Scholar]
- Yu, C.; Sun, W.; Scrivener, K. Mechanism of expansion of mortars immersed in sodium sulfate solutions. Cem. Concr. Res. 2012, 43, 105–111. [Google Scholar]
- Whitaker, M.; Black, L. Current knowledge of external sulfate attack. Adv. Cem. Res. 2015, 27, 1–14. [Google Scholar] [CrossRef]


| Distance from Internal Wall Surface [mm] | Concrete Sample Mass [g] | Mass of BaSO4 (a) [g] | Mass of SO42− (x) [g] | SO42− [% by Sample Weight] | SO42− Mean Value [%] |
|---|---|---|---|---|---|
| 0 | 10.2327 | 0.3796 | 0.1563 | 1.527 | 1.524 |
| 10.1276 | 0.3873 | 0.1594 | 1.574 | ||
| 10.3214 | 0.3691 | 0.1519 | 1.472 | ||
| 20 | 9.9885 | 0.3211 | 0.1321 | 1.323 | 1.345 |
| 10.1445 | 0.3436 | 0.1414 | 1.394 | ||
| 10.3417 | 0.3312 | 0.1363 | 1.318 | ||
| 50 | 10.1424 | 0.1163 | 0.0479 | 0.472 | 0.548 |
| 9.9672 | 0.1480 | 0.0609 | 0.611 | ||
| 10.1228 | 0.1382 | 0.0569 | 0.562 | ||
| 100 | 9.8276 | 0.0766 | 0.0315 | 0.321 | 0.315 |
| 10.1412 | 0.1015 | 0.0418 | 0.412 | ||
| 10.3429 | 0.0533 | 0.0219 | 0.212 |
| Sample No. | Core Size [cm × cm] | Ultrasound Longitudinal Wave Velocity CL [km/s] | fc,Ø-fc,cube Conversion Factor | Compression Strength [MPa] | ||
|---|---|---|---|---|---|---|
| Destructive Test | fc from Equation (6) | |||||
| fc, Ø | fc, cube | |||||
| 1 | 10.3 × 10.3 | 3.63 | 1.00 | 68.92 | 68.92 | 72.27 |
| 2 | 10.3 × 10.3 | 2.94 | 37.55 | 37.55 | 35.28 | |
| 3 | 5.0 × 5.0 | 3.08 | 1.08 | 41.94 | 45.3 | 42.79 |
| 4 | 5.0 × 5.0 | 2.91 | 32.66 | 35.27 | 33.68 | |
| 5 6 | 5.0 × 5.0 5.0 × 5.0 | 3.14 3.42 | 40.90 59.62 | 44.17 87.14 | 46.00 61.01 | |
| Mean value | - | 3.19 | - | 46.20 | 48.47 | 48.51 |
| Ordinal Number | Ultrasound Netto Passing Time in Direction I-I tn I-I [μs] | Ultrasound Netto Passing Time in Direction II-II tn II-II [μs] | Mean Ultrasound Netto Passing Time tn [μs] | Ultrasound Longitudinal Wave Velocity CL [km/s] | Concrete Compression Strength fc [N/mm2] |
|---|---|---|---|---|---|
| 1 | 33.00 | 34.30 | 33.65 | 3.09 | 43.36 |
| 2 | 33.40 | 34.20 | 33.80 | 3.08 | 42.62 |
| 3 | 34.20 | 35.70 | 34.95 | 2.98 | 37.20 |
| 4 | 35.30 | 35.40 | 35.35 | 2.94 | 35.39 |
| 5 | 33.50 | 32.60 | 33.05 | 3.15 | 46.37 |
| 6 | 33.00 | 31.20 | 32.10 | 3.24 | 51.36 |
| 7 | 30.60 | 33.50 | 32.05 | 3.25 | 51.63 |
| 8 | 32.20 | 33.80 | 33.00 | 3.15 | 46.62 |
| 9 | 30.30 | 32.00 | 31.15 | 3.34 | 56.65 |
| 10 | 29.60 | 33.80 | 31.70 | 3.28 | 53.55 |
| 11 | 28.40 | 29.10 | 28.75 | 3.62 | 71.59 |
| 12 | 28.50 | 29.00 | 28.75 | 3.62 | 71.59 |
| 13 | 28.70 | 29.00 | 28.85 | 3.61 | 70.92 |
| 14 | 28.70 | 28.60 | 28.65 | 3.63 | 72.27 |
| 15 | 28.70 | 28.60 | 28.65 | 3.63 | 72.27 |
| 16 | 28.70 | 30.30 | 29.50 | 3.53 | 66.66 |
| 17 | 32.20 | 32.30 | 32.25 | 3.23 | 50.55 |
| 18 | 31.40 | 31.00 | 31.20 | 3.33 | 56.37 |
| Mean (1–18) | 31.13 | 31.91 | 31.52 | 3.32 | 55.39 |
| 19 | - | - | - | - | 0.00 |
| Ordinal Number | Ultrasound Passing Time, Direction I-I tn I-I [μs] | Ultrasound Passing Time, Direction II-II tn II-II [μs] | Mean Ultrasound Passing Time tn [μs] | Ultrasound Longitudinal Wave Velocity CL [km/s] | Concrete Compression Strength fc [N/mm2] |
|---|---|---|---|---|---|
| 1 | 17.70 | 17.00 | 17.35 | 2.85 | 30.57 |
| 2 | 18.50 | 16.10 | 17.30 | 2.86 | 31.05 |
| 3 | 16.20 | 16.10 | 16.15 | 3.06 | 41.93 |
| 4 | 16.10 | 16.00 | 16.05 | 3.08 | 42.95 |
| 5 | 16.40 | 15.30 | 15.85 | 3.12 | 45.04 |
| 6 | 15.80 | 15.70 | 15.75 | 3.14 | 46.11 |
| 7 | 15.00 | 15.50 | 15.25 | 3.25 | 51.63 |
| 8 | 15.80 | 15.50 | 15.65 | 3.16 | 47.18 |
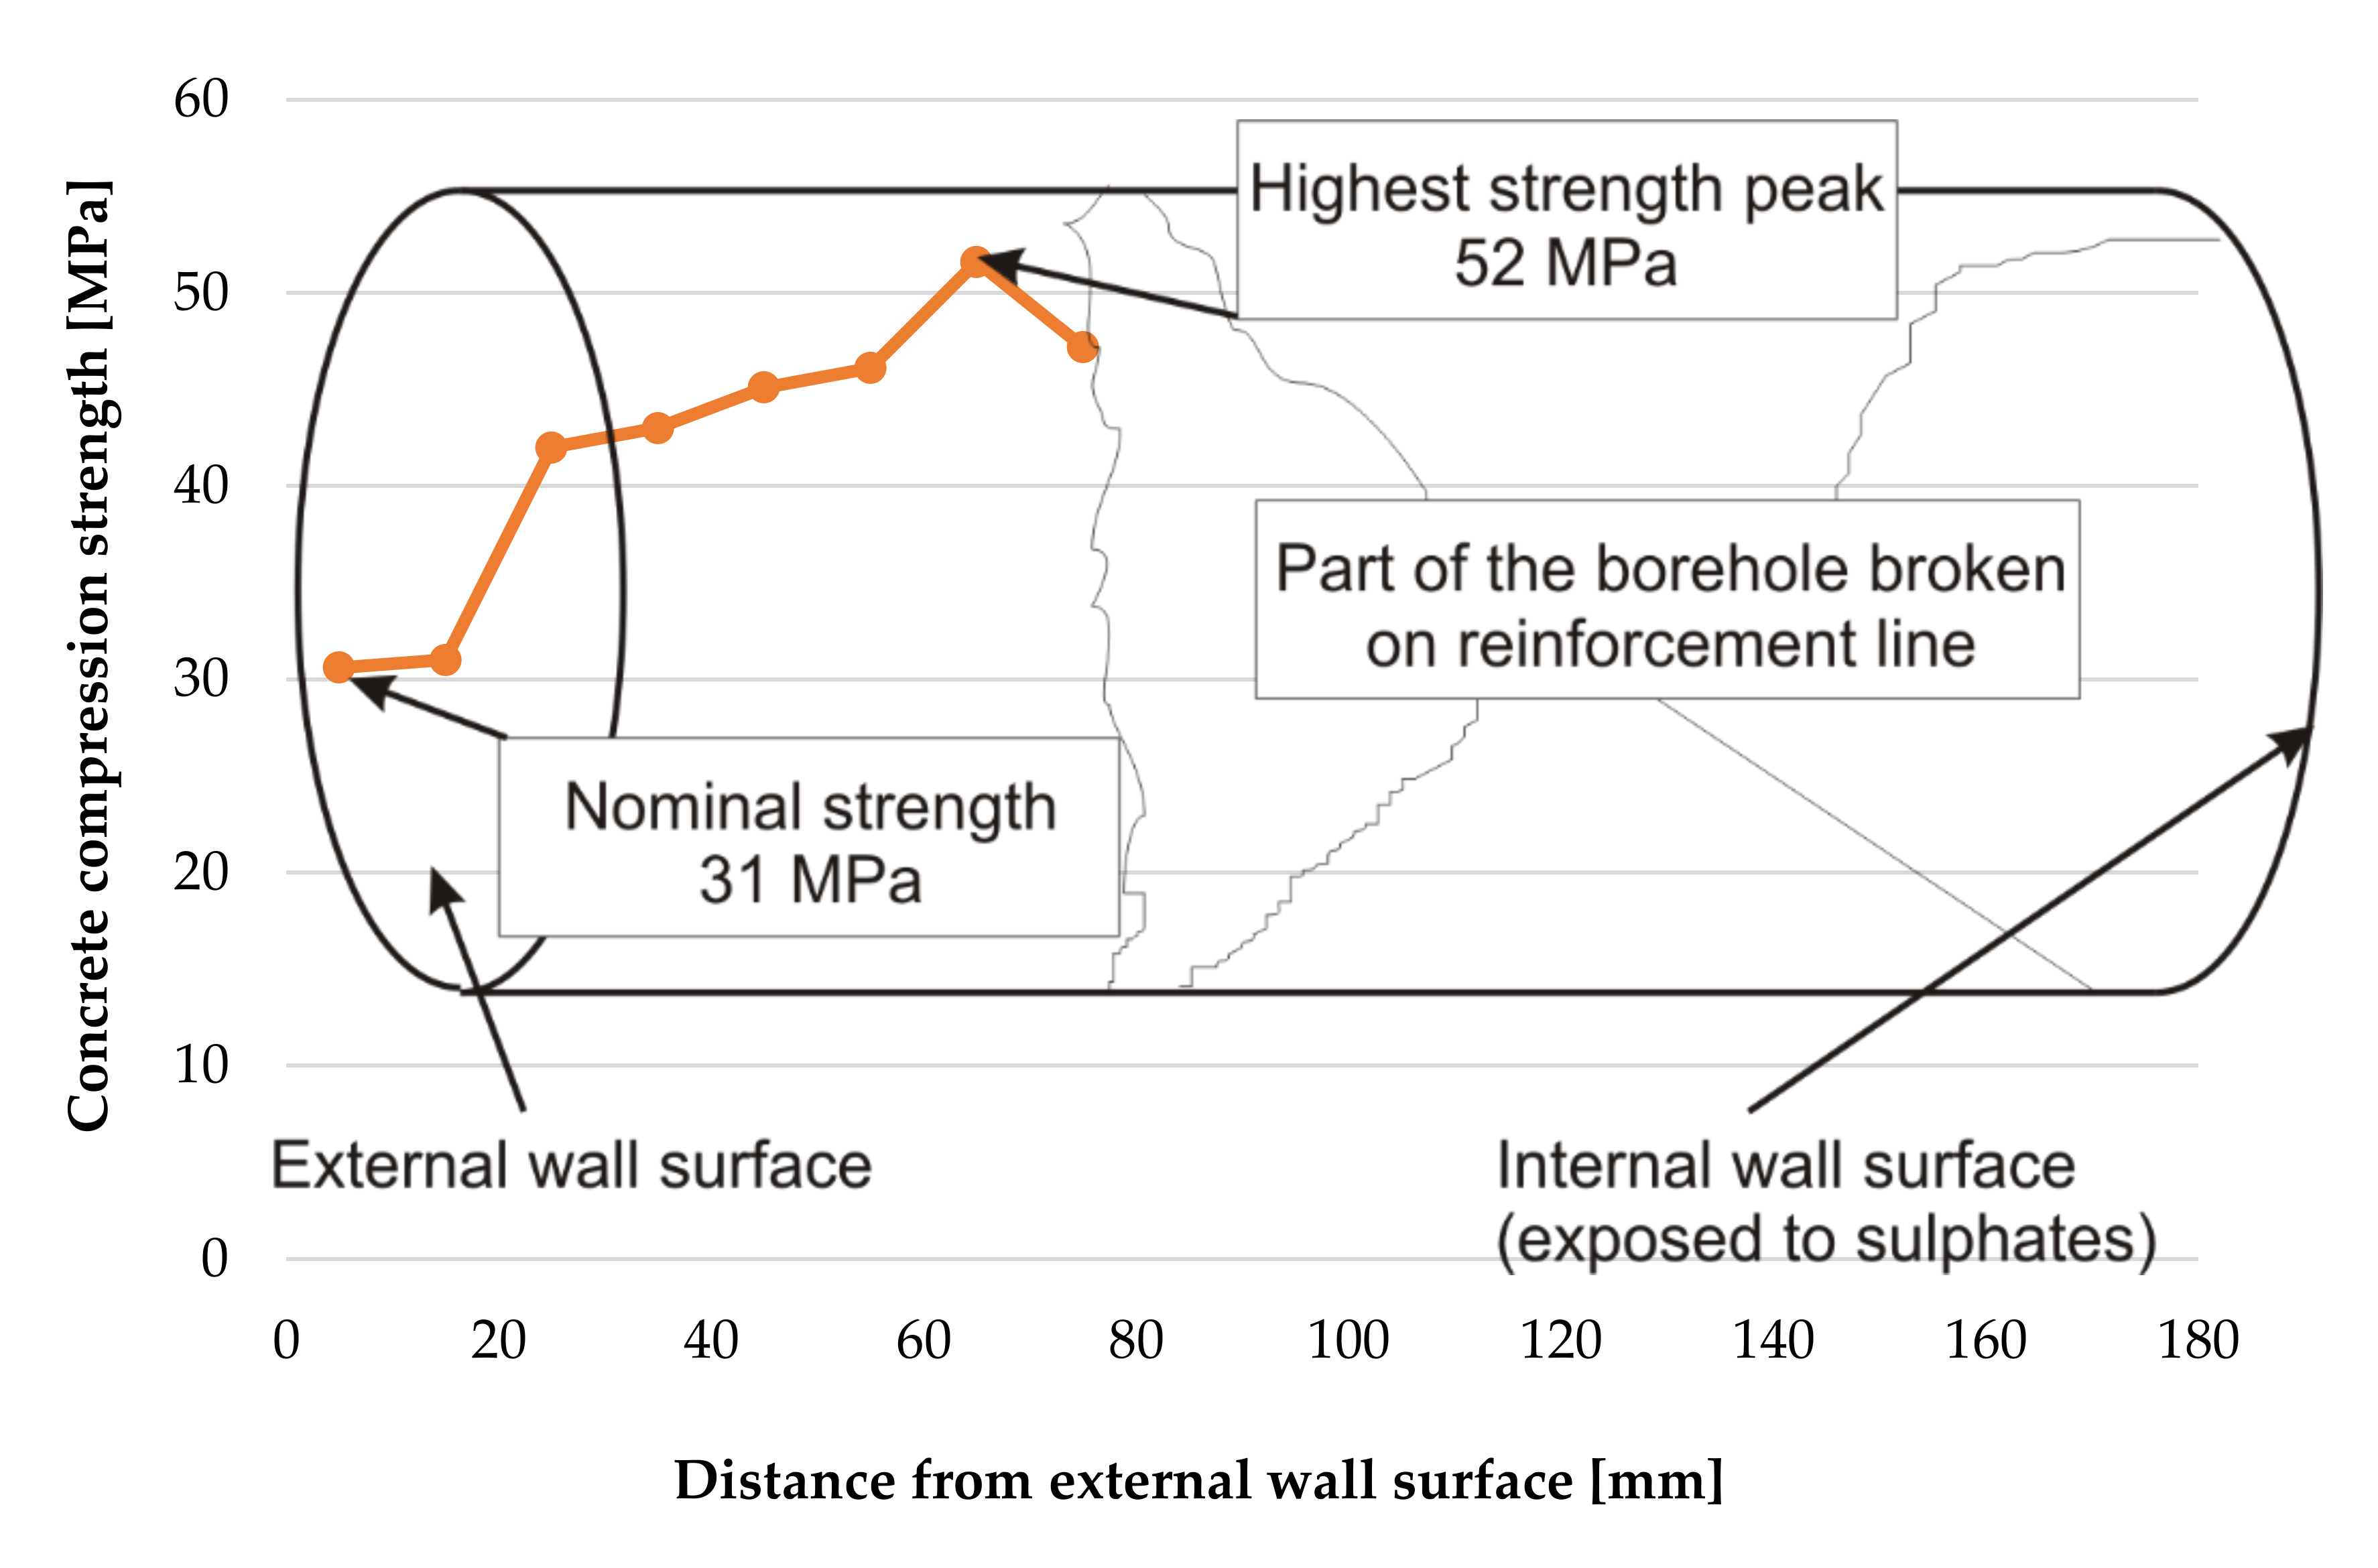
| Mean (1–8) | 16.44 | 15.90 | 16.17 | 3.07 | 42.06 |
| Ordinal Number | Ultrasound Passing Time, Direction I-I tn I-I [μs] | Ultrasound Passing Time, Direction II-II tn II-II [μs] | Mean Ultrasound Passing Time tn [μs] | Ultrasound Longitudinal Wave Velocity CL [km/s] | Concrete Compression Strength fc [N/mm2] |
|---|---|---|---|---|---|
| 1 | 16.00 | 17.00 | 16.50 | 3.00 | 38.5 |
| 2 | 16.30 | 16.80 | 16.55 | 2.99 | 38.0 |
| 3 | 16.60 | 17.40 | 17.00 | 2.91 | 33.7 |
| 4 | 16.00 | 16.60 | 16.30 | 3.04 | 40.4 |
| 5 | 16.90 | 17.60 | 17.25 | 2.87 | 31.5 |
| 6 | 16.90 | 16.90 | 16.90 | 2.93 | 34.7 |
| 7–9 | - | - | - | - | |
| 10 | 16.30 | 16.40 | 16.35 | 3.03 | 39.9 |
| 11 | 16.20 | 16.30 | 16.25 | 3.05 | 40.9 |
| 12 | 15.60 | 16.50 | 16.05 | 3.08 | 43.0 |
| 13 | 15.70 | 16.60 | 16.15 | 3.06 | 42.0 |
| 14 | 15.30 | 16.80 | 16.05 | 3.08 | 43.0 |
| 15 | 16.30 | 16.40 | 16.35 | 3.03 | 39.9 |
| 16 | 14.80 | 16.00 | 15.40 | 3.21 | 50.0 |
| 17 | 15.10 | 14.80 | 14.95 | 3.31 | 55.1 |
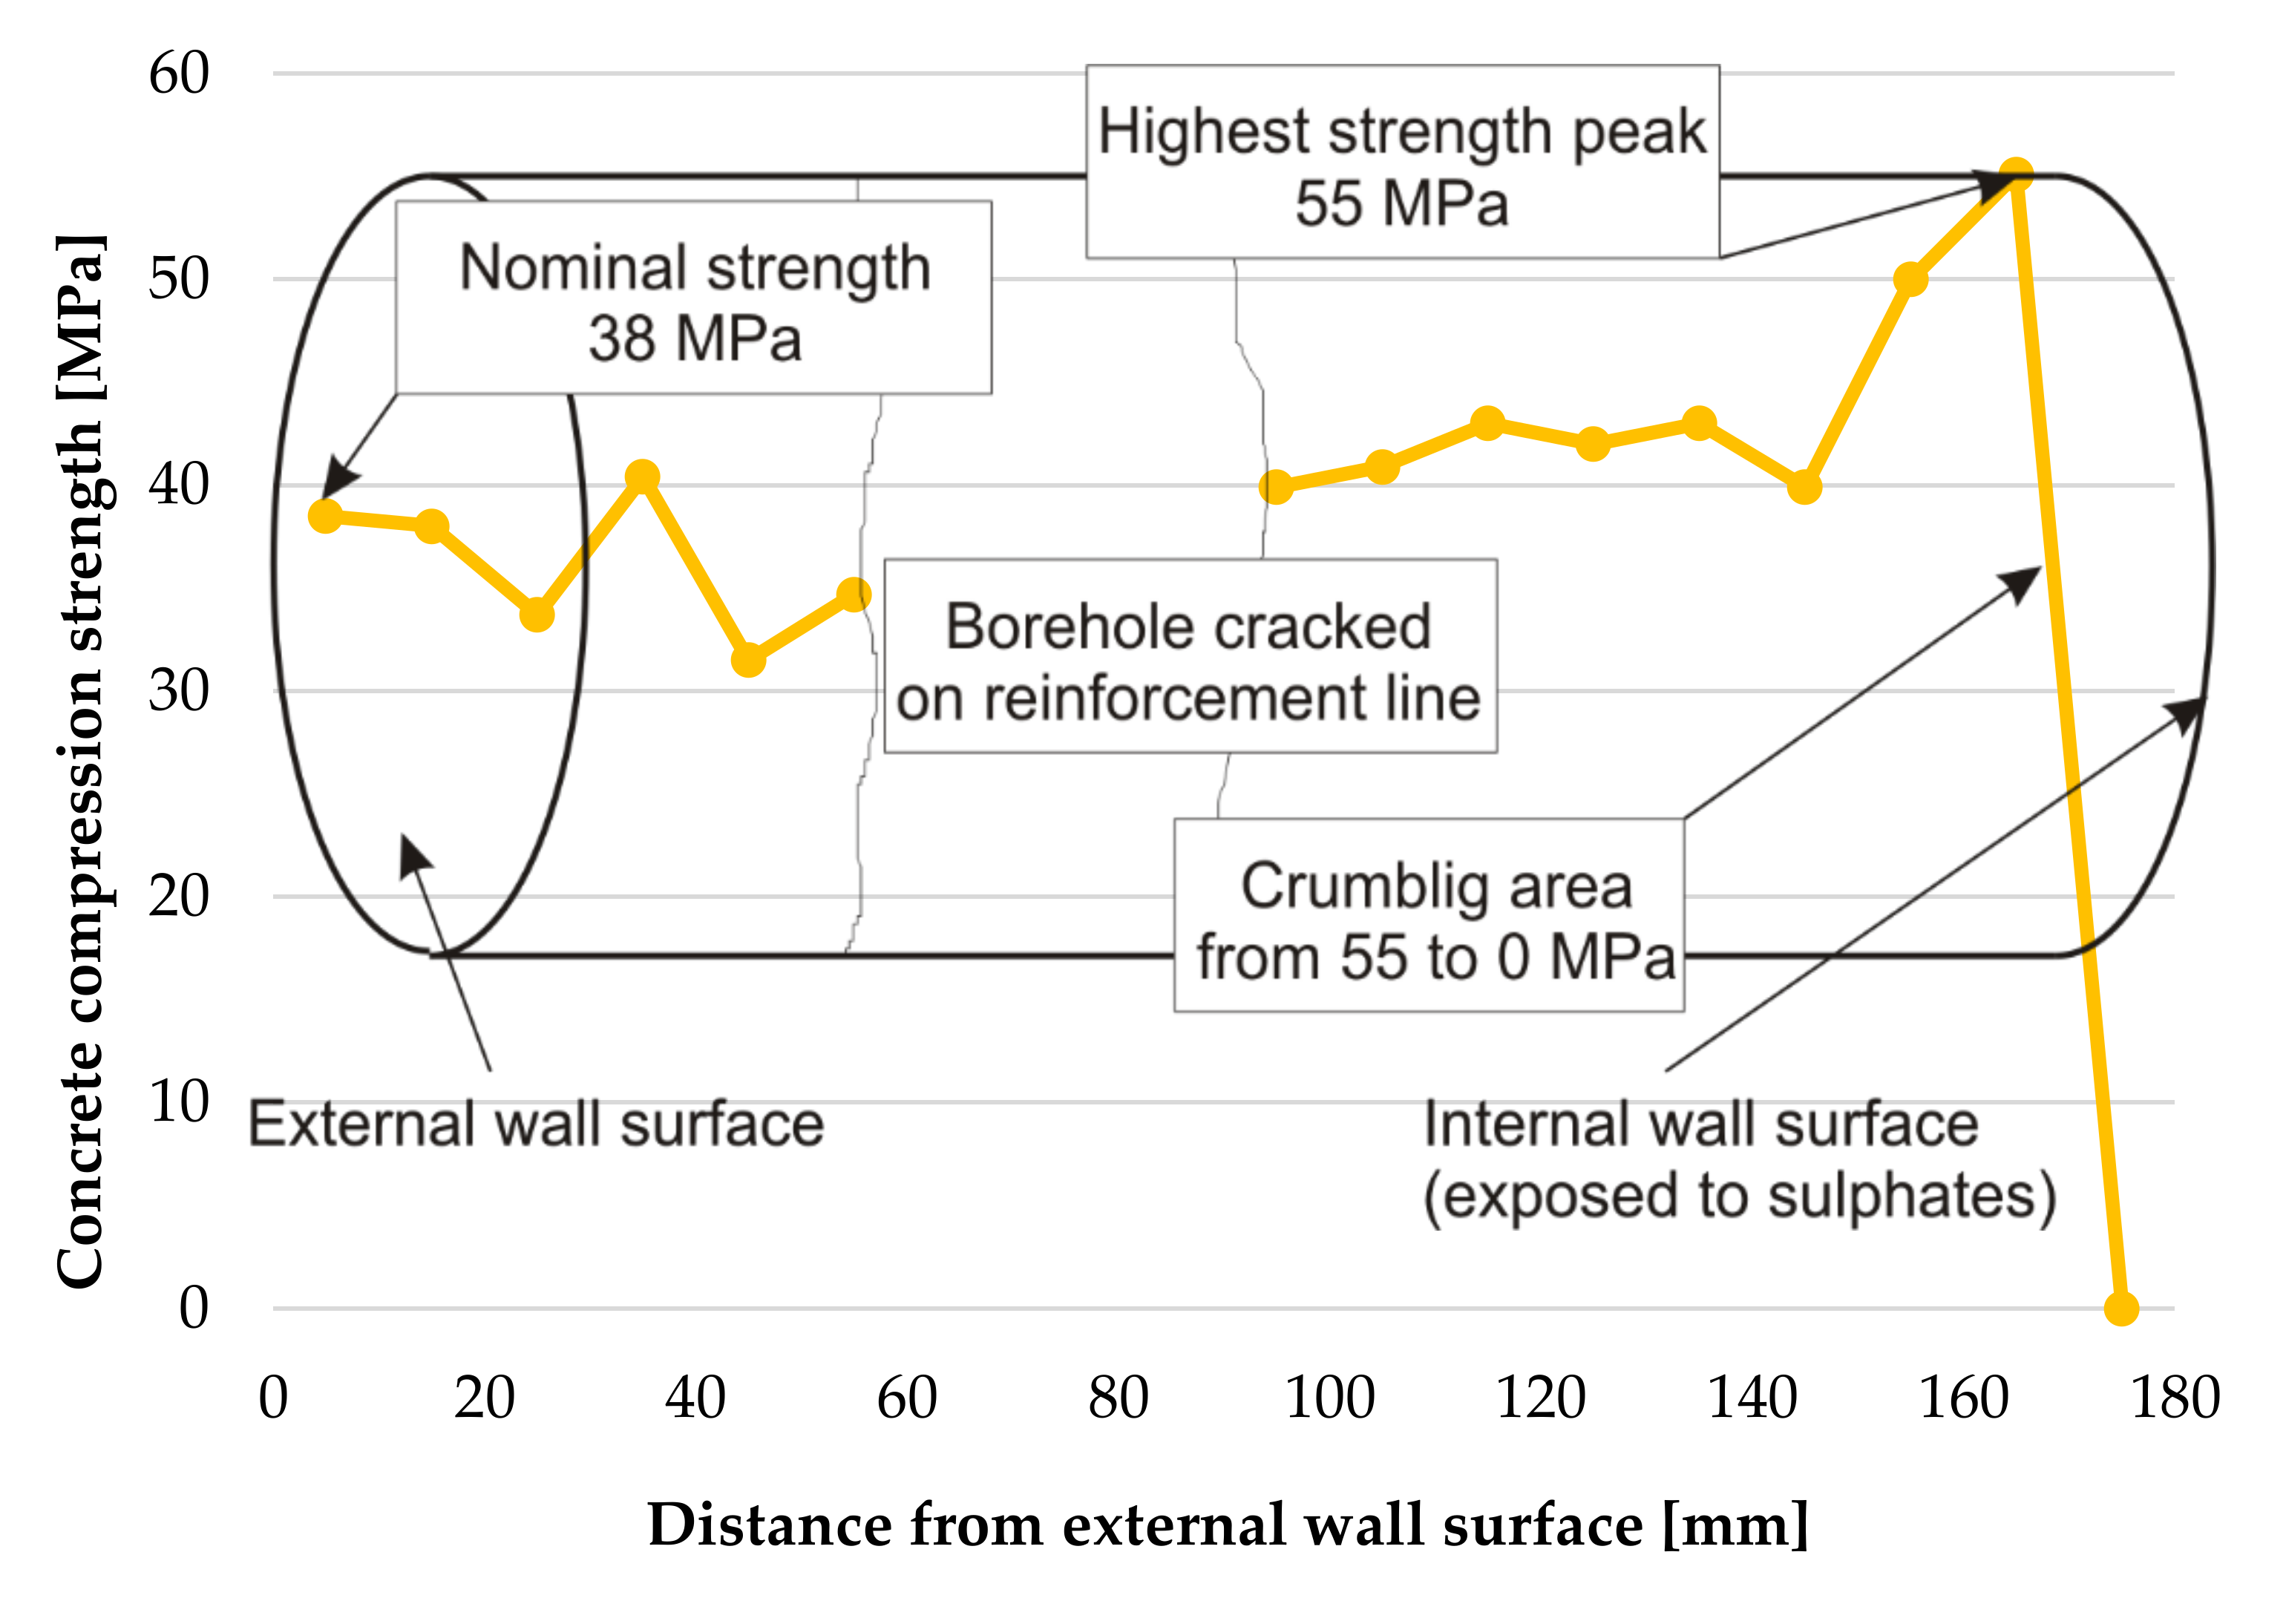
| Mean (1–6,10–17) | 16.00 | 16.58 | 16.29 | 3.04 | 40.8 |
| 18 | - | - | - | - | 0.00 |
© 2019 by the authors. Licensee MDPI, Basel, Switzerland. This article is an open access article distributed under the terms and conditions of the Creative Commons Attribution (CC BY) license (http://creativecommons.org/licenses/by/4.0/).
Share and Cite
Stawiski, B.; Kania, T. Examining the Distribution of Strength across the Thickness of Reinforced Concrete Elements Subject to Sulphate Corrosion Using the Ultrasonic Method. Materials 2019, 12, 2519. https://doi.org/10.3390/ma12162519
Stawiski B, Kania T. Examining the Distribution of Strength across the Thickness of Reinforced Concrete Elements Subject to Sulphate Corrosion Using the Ultrasonic Method. Materials. 2019; 12(16):2519. https://doi.org/10.3390/ma12162519
Chicago/Turabian StyleStawiski, Bohdan, and Tomasz Kania. 2019. "Examining the Distribution of Strength across the Thickness of Reinforced Concrete Elements Subject to Sulphate Corrosion Using the Ultrasonic Method" Materials 12, no. 16: 2519. https://doi.org/10.3390/ma12162519
APA StyleStawiski, B., & Kania, T. (2019). Examining the Distribution of Strength across the Thickness of Reinforced Concrete Elements Subject to Sulphate Corrosion Using the Ultrasonic Method. Materials, 12(16), 2519. https://doi.org/10.3390/ma12162519