3.1. Void Distribution in Zeolite-Modified Asphalt
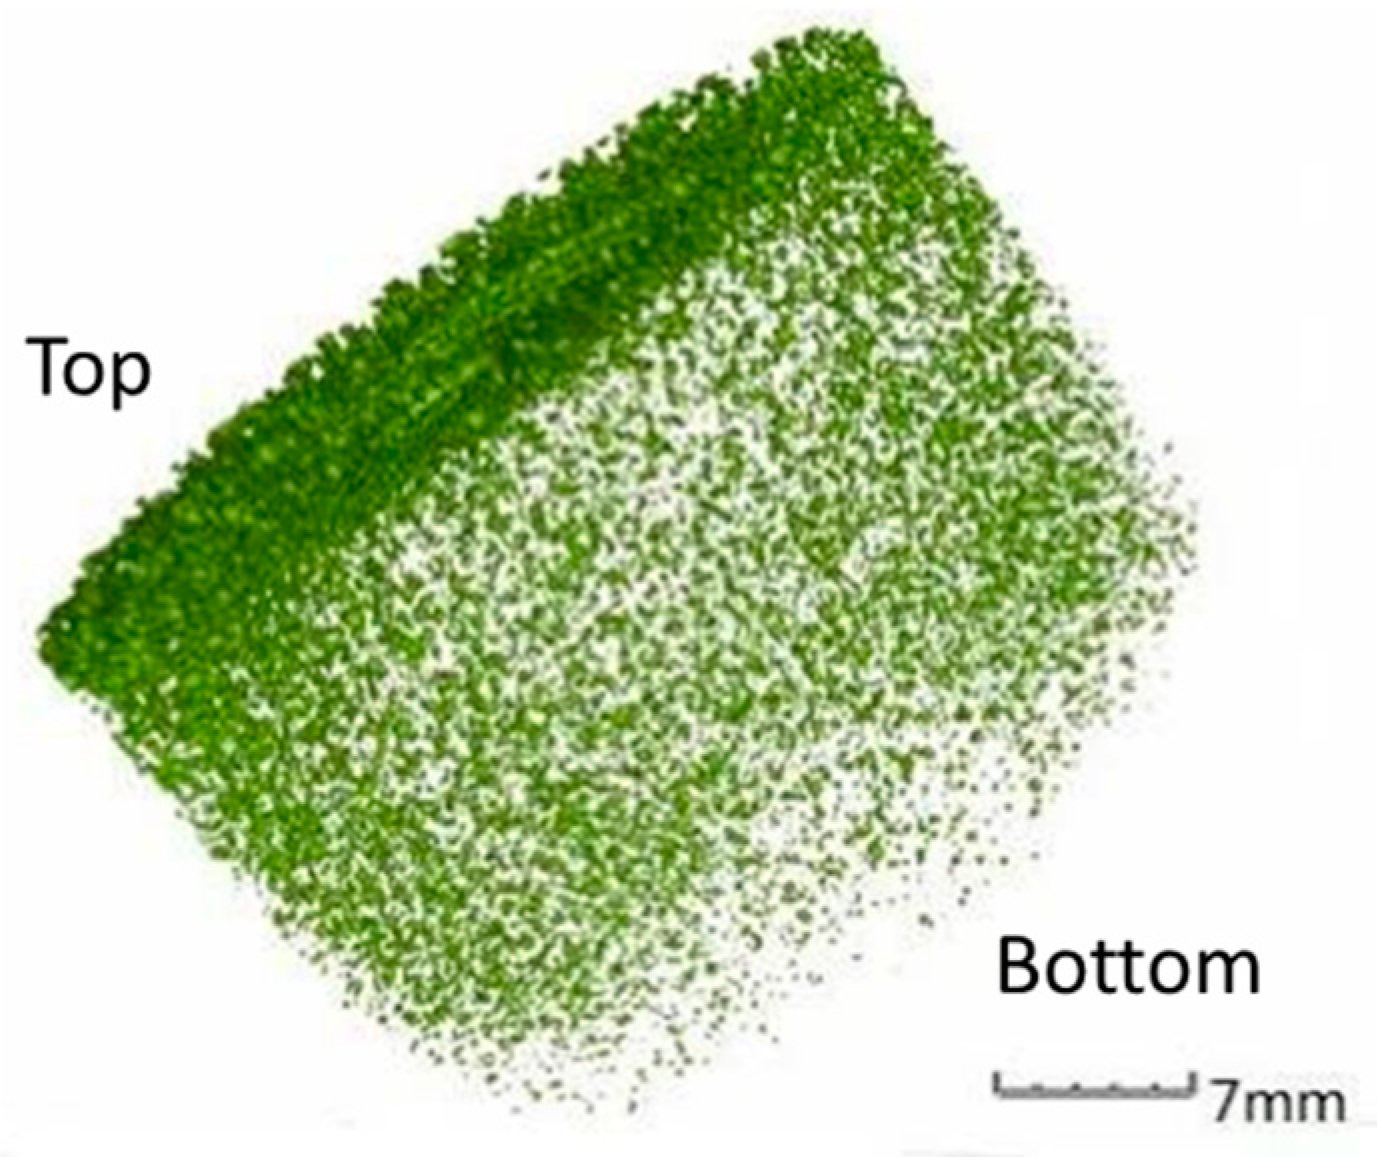
For investigating the void distribution in asphalt binder, zeolite is added to the asphalt binder. The zeolite amount added is 0.3% by weight of the asphalt mixture, and the optimum asphalt–aggregate ratio is 4.4%. Therefore, the proportion of zeolite in the asphalt binder is 7.1%. The asphalt binder is heated to 120 °C and mixed with zeolite for 1 min. After mixing, the asphalt is poured into a cylindrical container. After cooling, the asphalt is scanned by CT equipment. Images are taken every 0.1 mm along the height of the specimen during scanning. After processing the scanned images, the quantity of the voids is counted, and the distribution of the voids in the asphalt is analyzed accordingly. The spatial distribution of voids in the asphalt is shown in
Figure 2.
From
Figure 2, it can be seen that after adding zeolite to the asphalt, the voids produced by the zeolite in the asphalt exhibit characteristics of “more and larger voids at the top”. That is to say, the voids in the asphalt collect at the surface of asphalt, and the diameter of the bubbles is larger; meanwhile, at the bottom of asphalt, the bubbles are fewer and smaller. The spatial distribution of voids generated by the zeolite is related to the content of zeolite water, the existence state of the zeolite water, and temperature [
27]. To analyze the effect of temperature on the size and distribution of voids, zeolite is added to asphalt at 100 °C and 120 °C, and then the zeolite-modified asphalt is mixed uniformly, molded and cooled. After CT scanning and image processing, the distribution of the voids is analyzed. The quantity and volume of voids in the asphalt are shown in
Table 6 and
Table 7, respectively, and the unit of measurement for void volume is mm
3.
From
Table 6, it can be seen that at the condition of 100 °C, the voids system in zeolite asphalt is dominated by voids smaller than 0.1 mm
3. The quantity of voids smaller than 0.1 mm
3 is larger than at 120 °C, but the quantity percentage is lower. This phenomenon shows that with the increase of temperature, the evolution trend of smaller voids to larger voids is obvious. Void volume distribution can better explain the evolution of voids, as shown in
Table 7. First of all, the voids ratio is much larger at 120 °C, showing that temperature has a significant effect on the overall voids ratio. For the voids volume distribution, the volume of micro voids smaller than 0.1 mm
3 is greater, and the volume distribution of different sized voids is more uniform at 100 °C. However, for 120 °C, voids larger than 1 mm
3 account for the vast majority. The results above illustrate that with the increase of temperature, the smaller voids (<1 mm
3) are merged into larger voids (>1 mm
3). Above all, the effect of temperature is reflected in increasing the overall void ratio and changing the distribution of different size voids, which include the decrease in void quantity and the increase in the volume of larger voids (>1 mm
3).
3.2. Void Distribution of Asphalt Mixture with Zeolite Additive
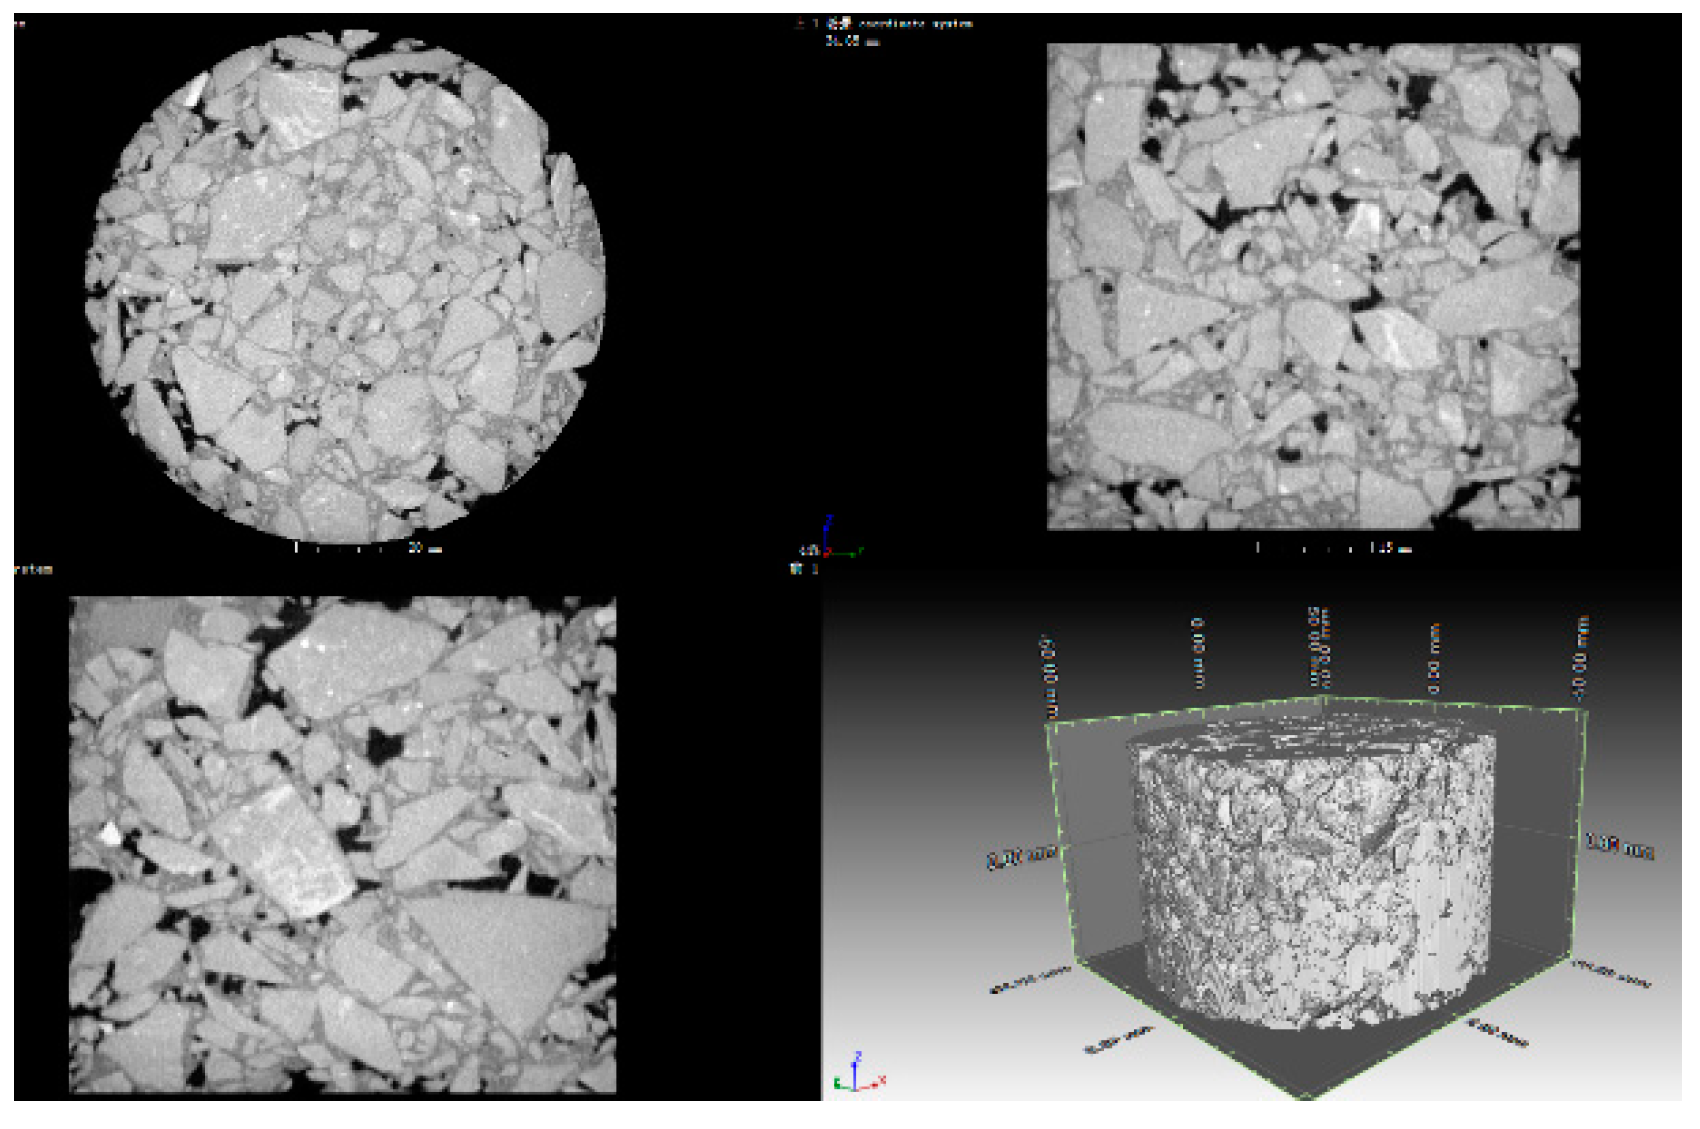
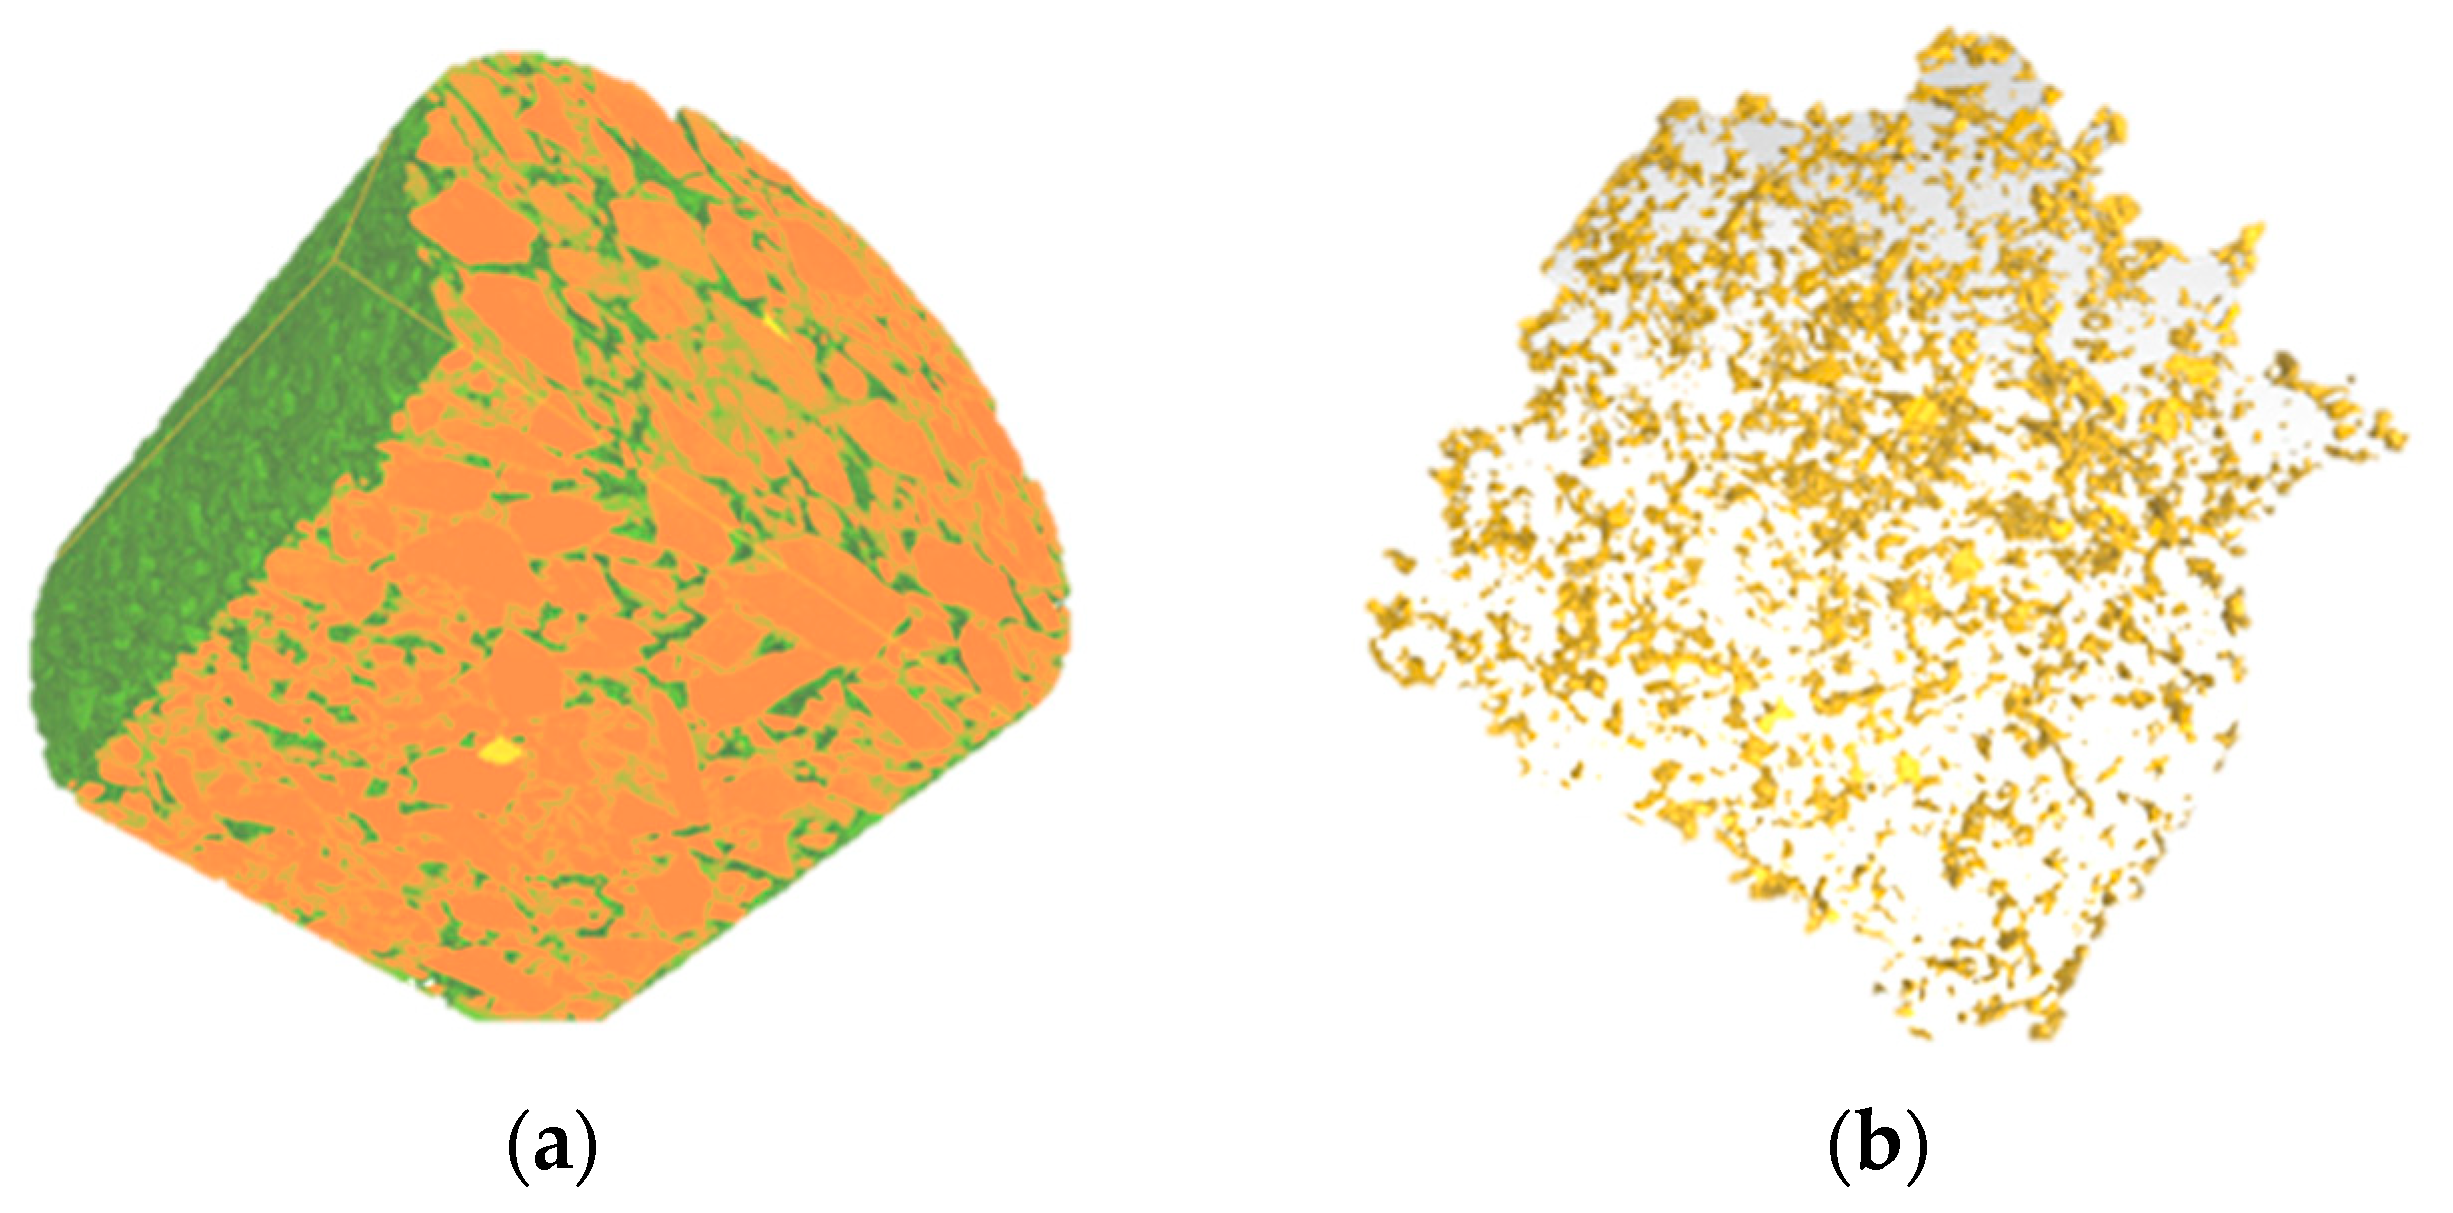
The combination of industrial CT and image technology provides a way to study the internal structure of materials. The internal voids characteristics and distribution of zeolite warm mix asphalt mixture are investigated by CT scanning technology, which can directly evaluate the compaction effect. The images of zeolite asphalt mixture compacted at different temperatures are analyzed by CT scanning.
Figure 3 shows the three-dimensional CT images of the asphalt mixture.
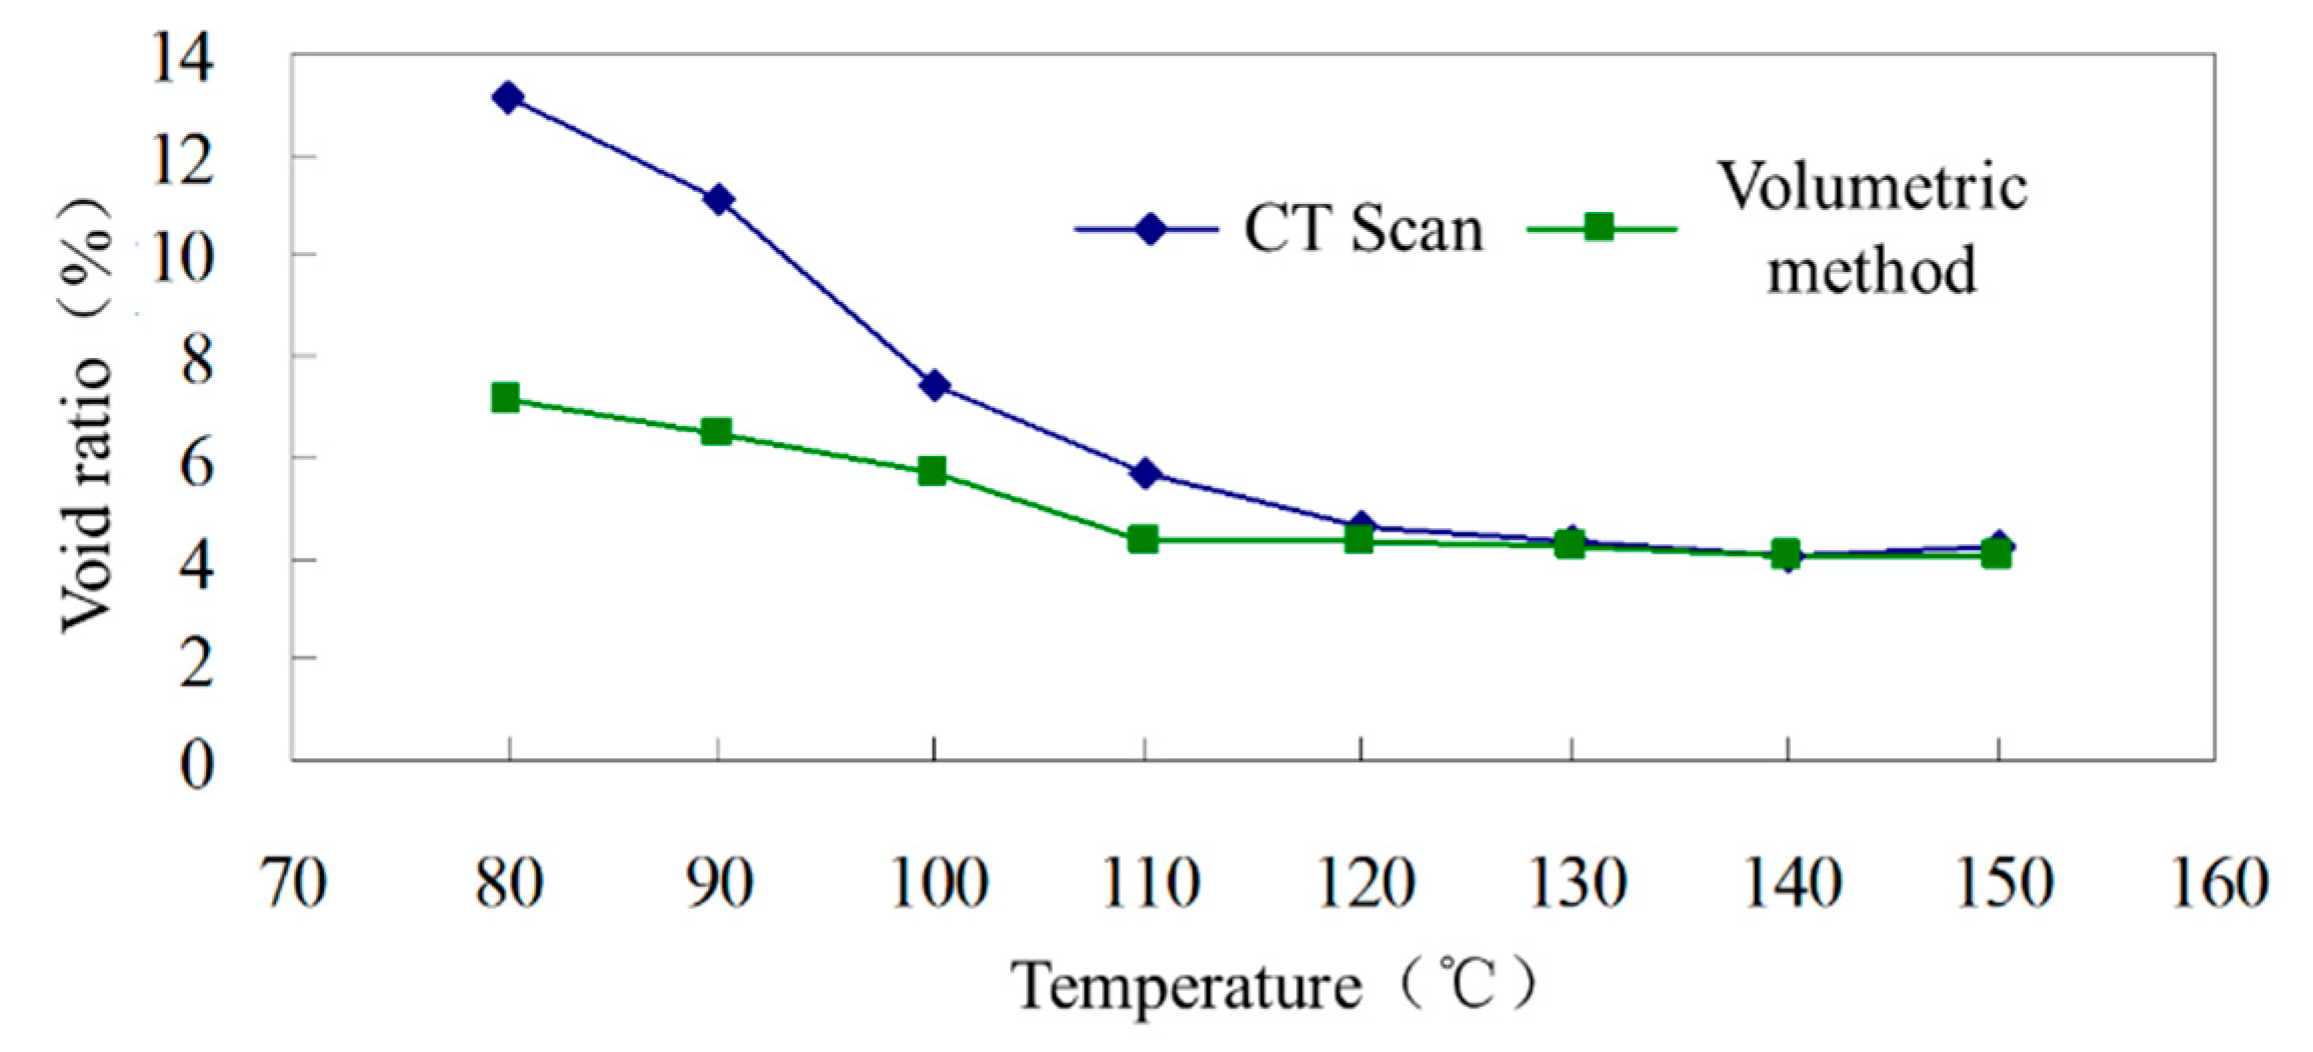
The internal voids of zeolite asphalt mixtures mixed and compacted at different temperatures are extracted and analyzed. Among them, the zeolite asphalt mixtures are mixed and compacted by Marshall method at 80–140 °C. In contrast, the temperature for the hot mix asphalt mixture is 150 °C. Before mixing, the aggregate and asphalt binder are heated at the same temperature for 4 h. The void ratio of each specimen is extracted and calculated by CT method, and compared with that calculated by volumetric method in Chinese specification JTG E20-2011 [
28]. Based on the comparison between warm and hot mix asphalt mixture, the compaction effect of zeolite asphalt mixture can be evaluated. The voids of asphalt mixtures at different temperatures are shown in
Table 8 and
Figure 4.
In
Figure 4, the void ratio of hot mix asphalt mixture at 150 °C is presented in the same figure for comparison. The void ratio of zeolite asphalt mixture decreases with the increase of compacting temperature, and the void ratio for hot and warm mix mixtures is similar at the temperature range between 120 °C and 150 °C. This illustrates that the compaction temperature of zeolite asphalt mixture should be maintained at above 120 °C. For the same asphalt mixture, the void ratio calculated by the volumetric method basically coincides with that calculated by CT scan above 120 °C. When the temperature is lower than 120 °C, the void ratio obtained by CT scan is larger than that obtained using the volumetric method. The lower the temperature is, the larger the difference between the two results.
The main reason for this difference is that in the test of the volumetric method, some large surface voids are not included in the void ratio calculation, because they do not absorb water. However, the CT scan method utilizes the material density difference to identify voids, and surface voids can be identified as voids. The difference between void recognition methods leads to the difference in results between the CT scan and volumetric methods. The lower the temperature is, the larger surface voids there are, and the greater the difference between the two void ratio results.
Void ratio can be used to evaluate the compaction effect of asphalt mixture macroscopically. However, as a composite three-dimensional structure, the void ratio cannot fully reflect its void structure. The distribution of internal voids of asphalt mixture with the same void ratio may be different. With the help of CT technology, the characteristics of void structure in asphalt mixture can be described at micro scale. For zeolite asphalt mixture, it can also be used as a method for evaluating compaction effect.
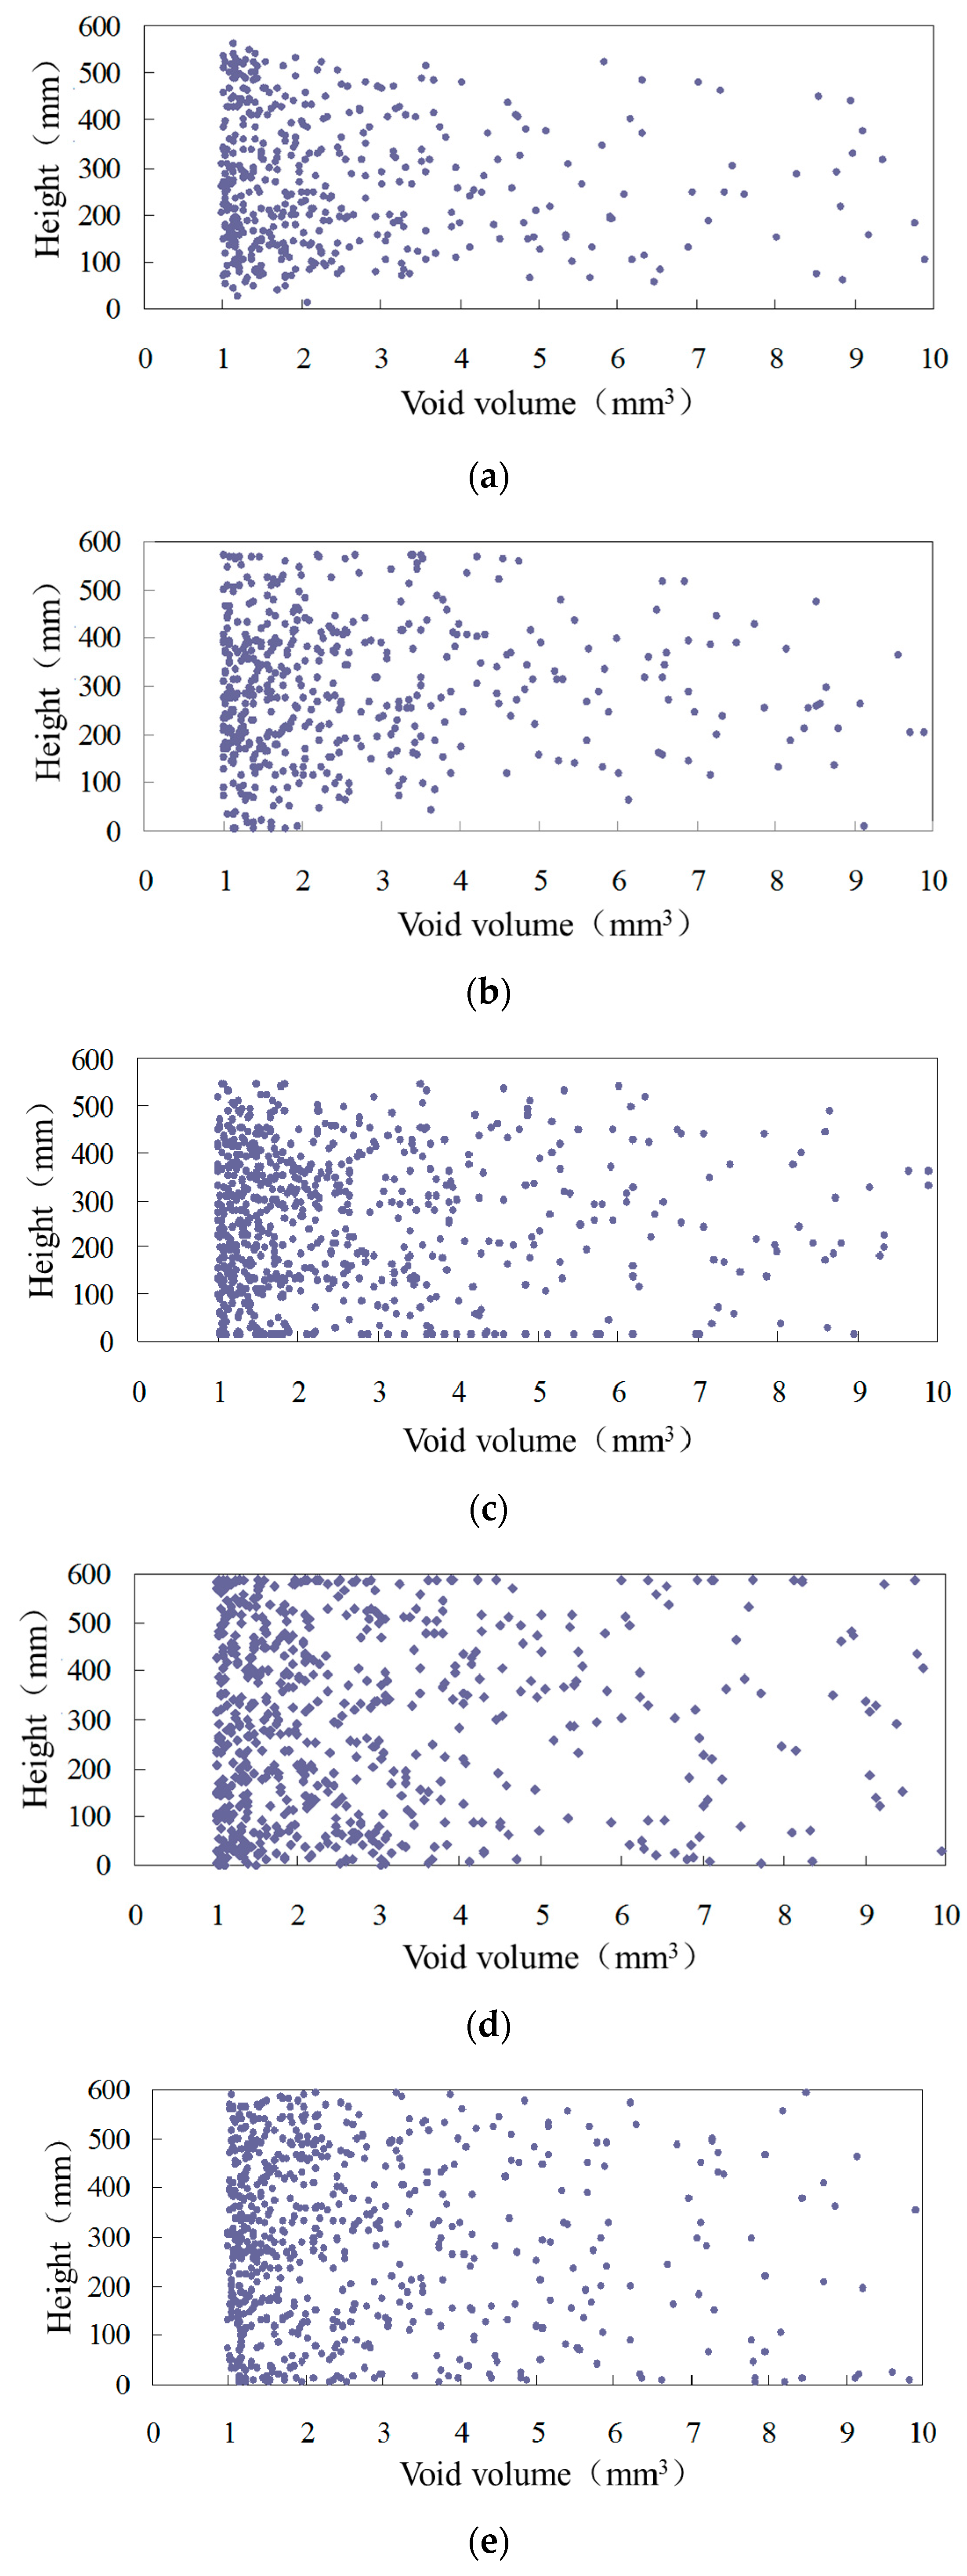
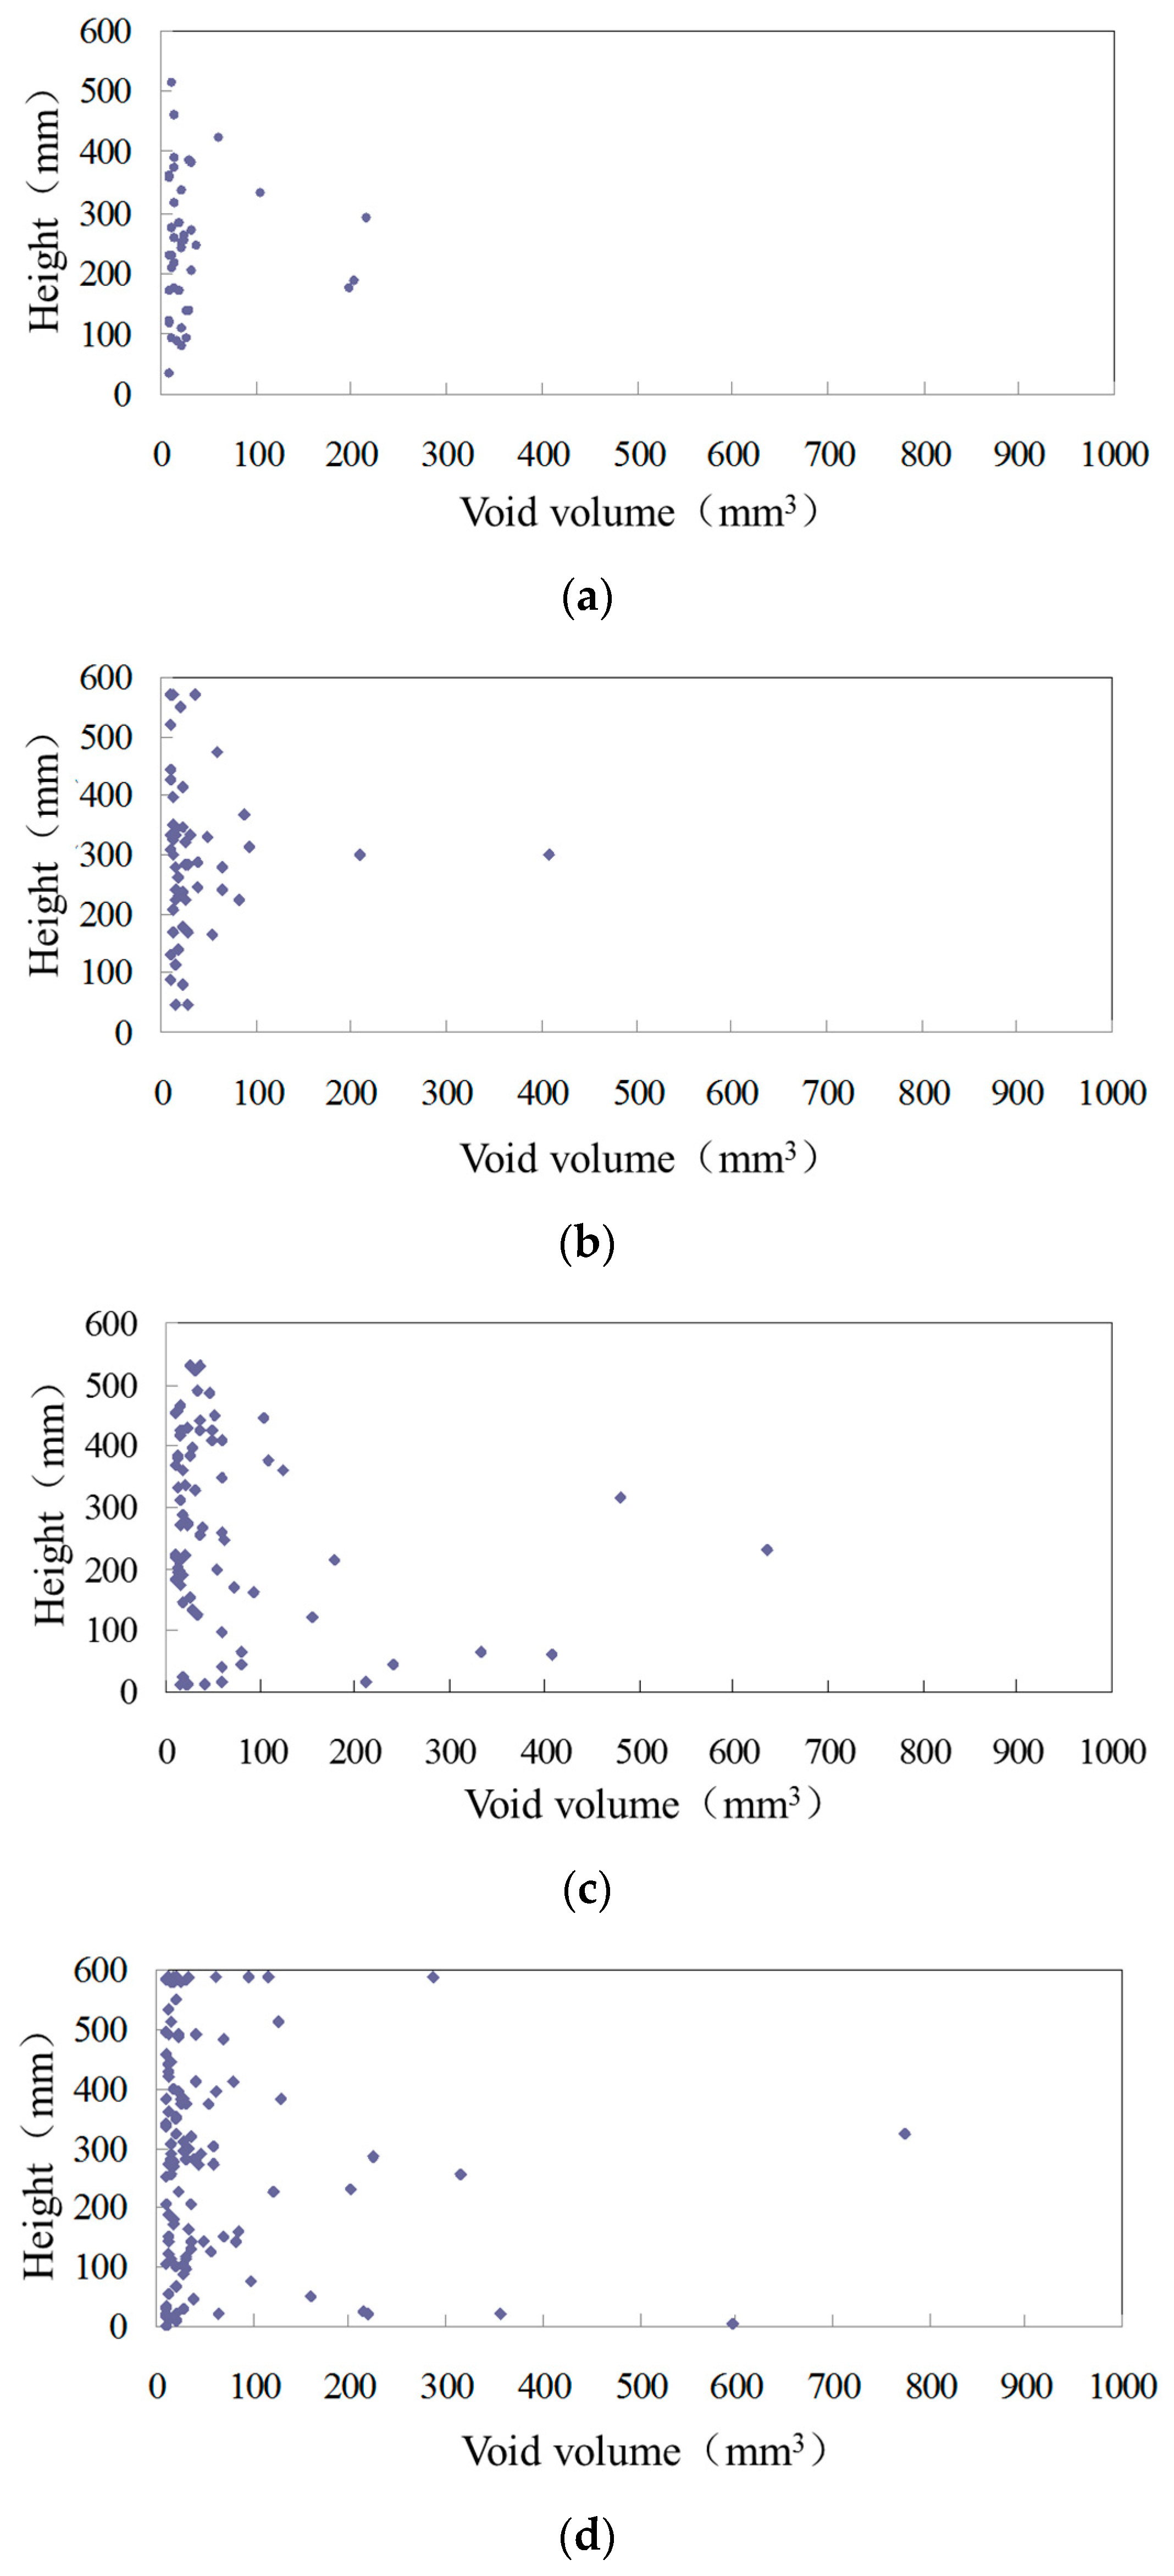
For the description of the spatial distribution of voids, the centroids of voids at different heights of the sample are extracted. To fully reflect the distribution of voids in the sample, the voids are divided into 1–10 mm
3 and 10–1000 mm
3 categories in order to draw the void distribution maps. The distributions of different sized voids are shown in
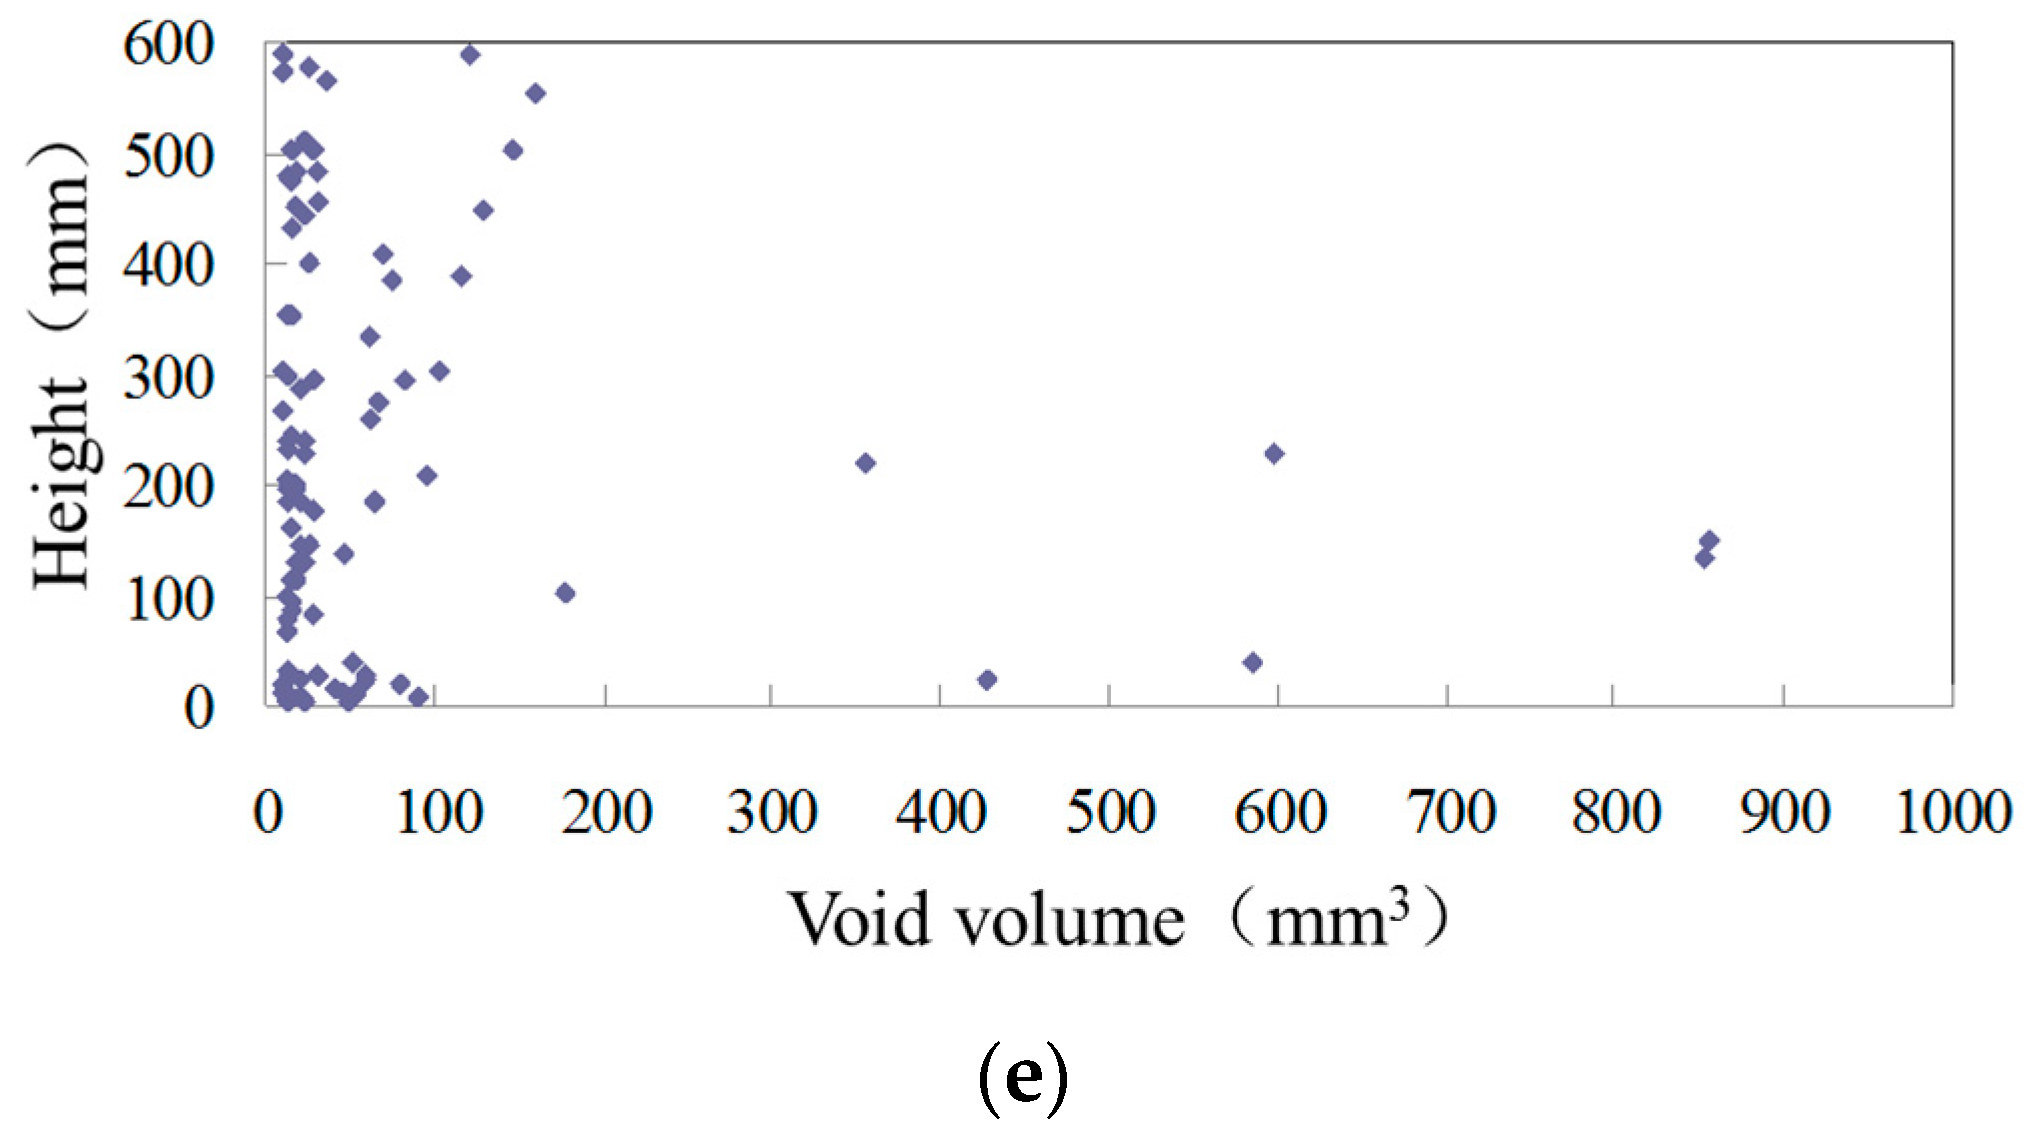
Figure 5 and
Figure 6, in which the longitudinal coordinates are the height of the specimen and the abscissa coordinates are the volume of the voids. Each point in the figure represents a void with a certain volume at a certain height of the specimen, that is, each point represents a void.
In the internal void distribution maps of
Figure 5, voids with different volumes have different distribution densities. The smaller the void volume, the larger the density, and the more uniform the distribution along the vertical direction. Most of the voids in asphalt mixtures are between 1 mm
3 and 2 mm
3, and these have the widest distribution range and are densely distributed at different heights of specimens. This shows that the small voids are most widely distributed at different heights of asphalt mixtures. With the increase in void volume, the distribution density in the mixture decreases. In
Figure 6, the voids of 10–100 mm
3 are the main part, while voids larger than 100 mm
3 are sporadically distributed in the mixture. The larger the void volume, the lower the density of the distribution in the asphalt mixture, and the further toward the middle and bottom of the specimen the distribution area aggregates.
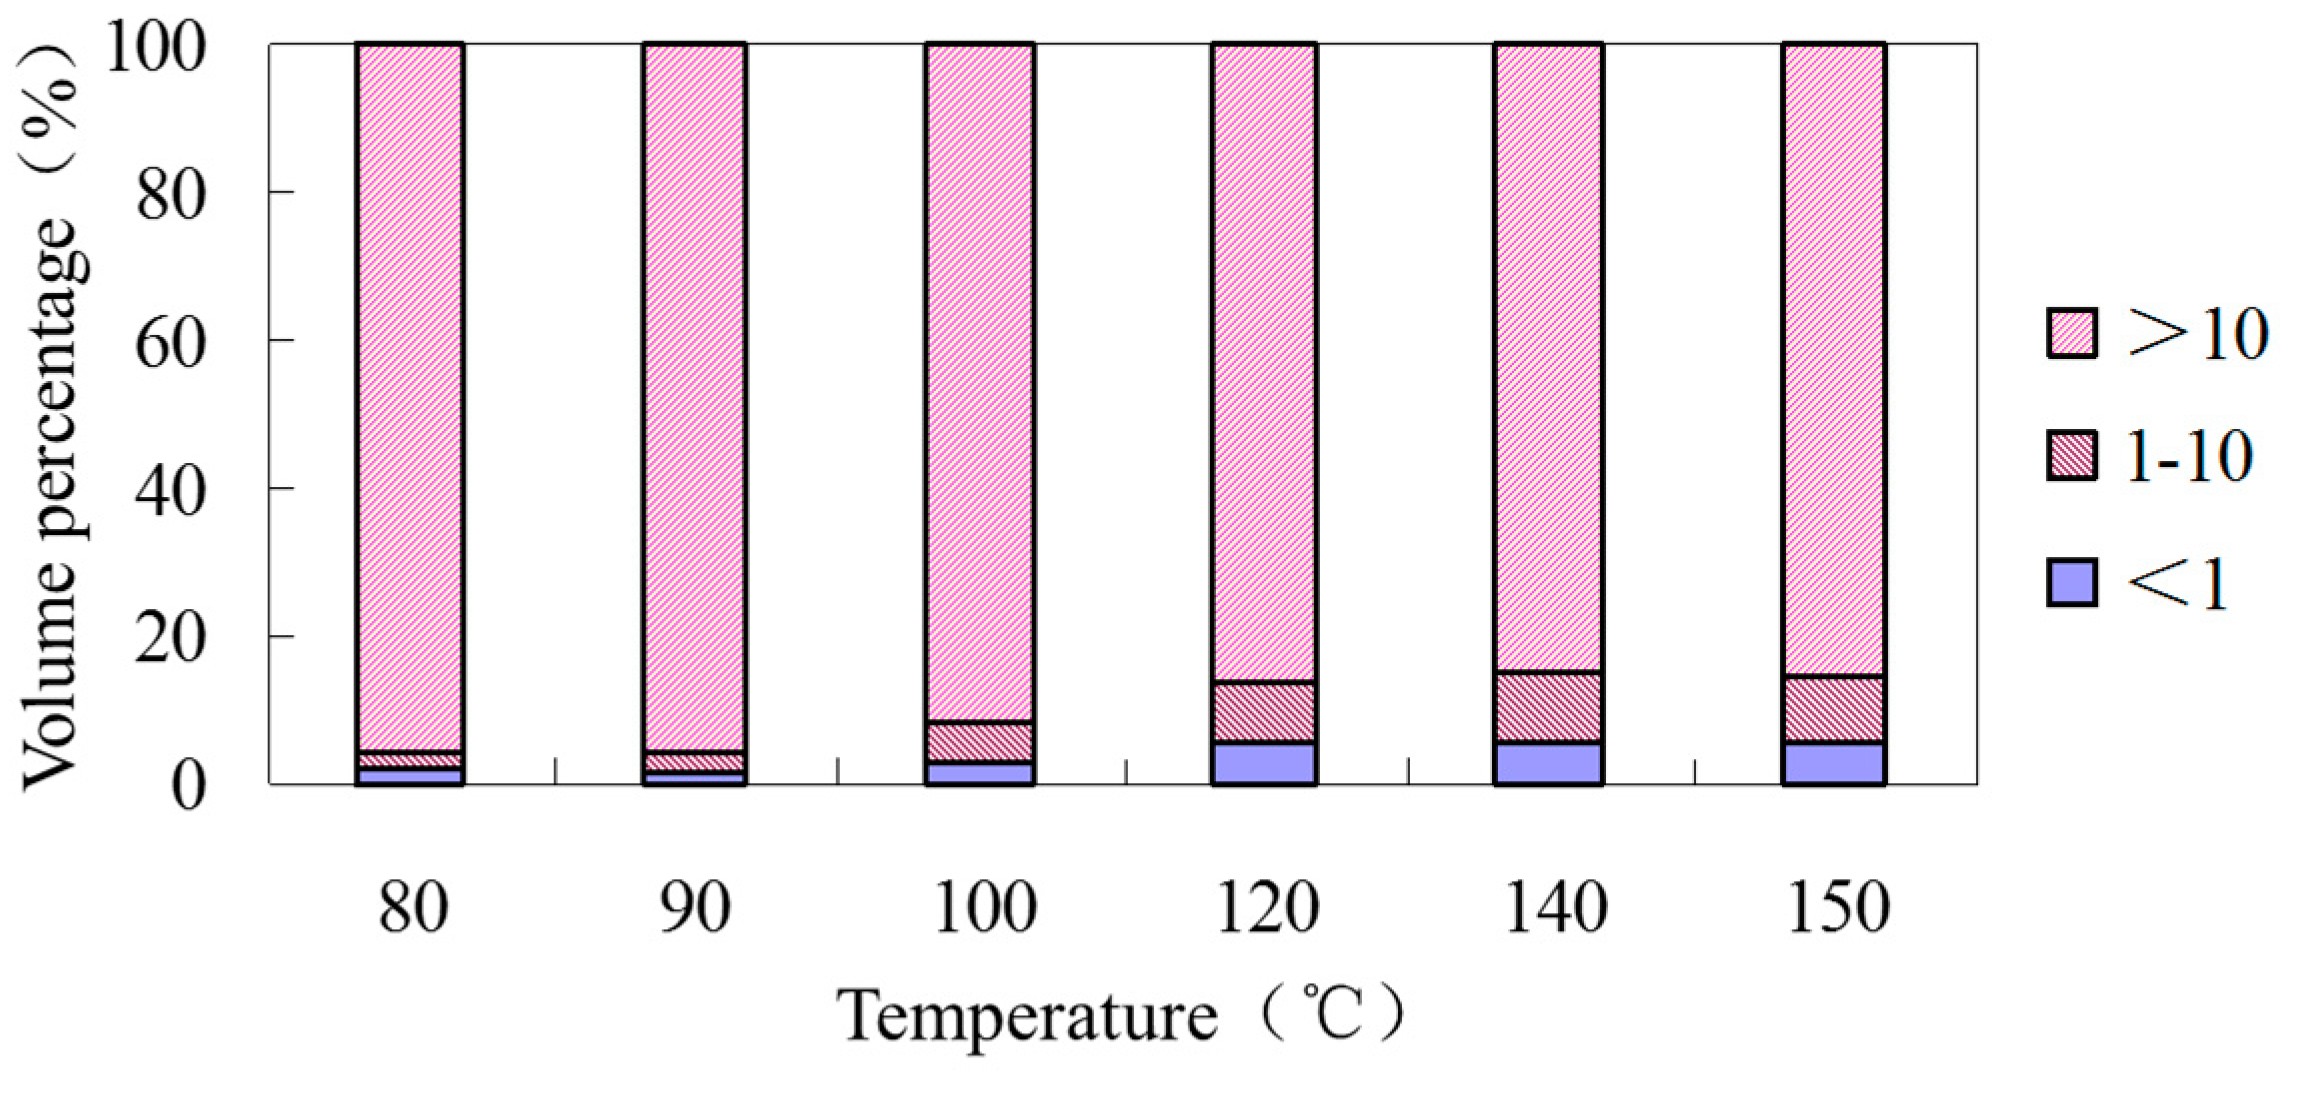
To understand the proportion of different sized voids, the extracted voids are analyzed by statistical methods. Considering the quantity and volume of voids, two indicators are used to describe the characteristics of voids: Void volume and void quantity. To cover all the voids in the asphalt mixture, the voids are divided into three categories: smaller than 1 mm
3, 1–10 mm
3 and larger than 10 mm
3. The results are shown in
Table 9 and
Table 10.
From
Table 9 and
Table 10, it can be seen that, compared to the hot mix asphalt mixtures mixing at 150 °C, under low-temperature (80–100 °C) mixing conditions, the quantity of small voids (<1 mm
3), the maximum void volume and the average void volume are larger. When the temperature is higher than 120 °C, there is less difference between the maximum and average void volume. The results show that the void distribution of the warm mix asphalt mixture is close to that of the hot mix asphalt mixture when the temperature is higher than 120 °C, but when the temperature is lower than 120 °C, larger interconnected voids will appear in the warm mix asphalt mixture, resulting in a higher maximum void volume. The volume percentage of different size voids is summarized in
Figure 7.
The volume proportions of voids in zeolite asphalt mixture at 120 °C and 140 °C are similar to that of hot mix asphalt mixture, which indicates that the void structures of hot and warm mix asphalt mixtures are basically the same. However, below 100 °C, the proportion of large voids increases, and the small voids decrease correspondingly.
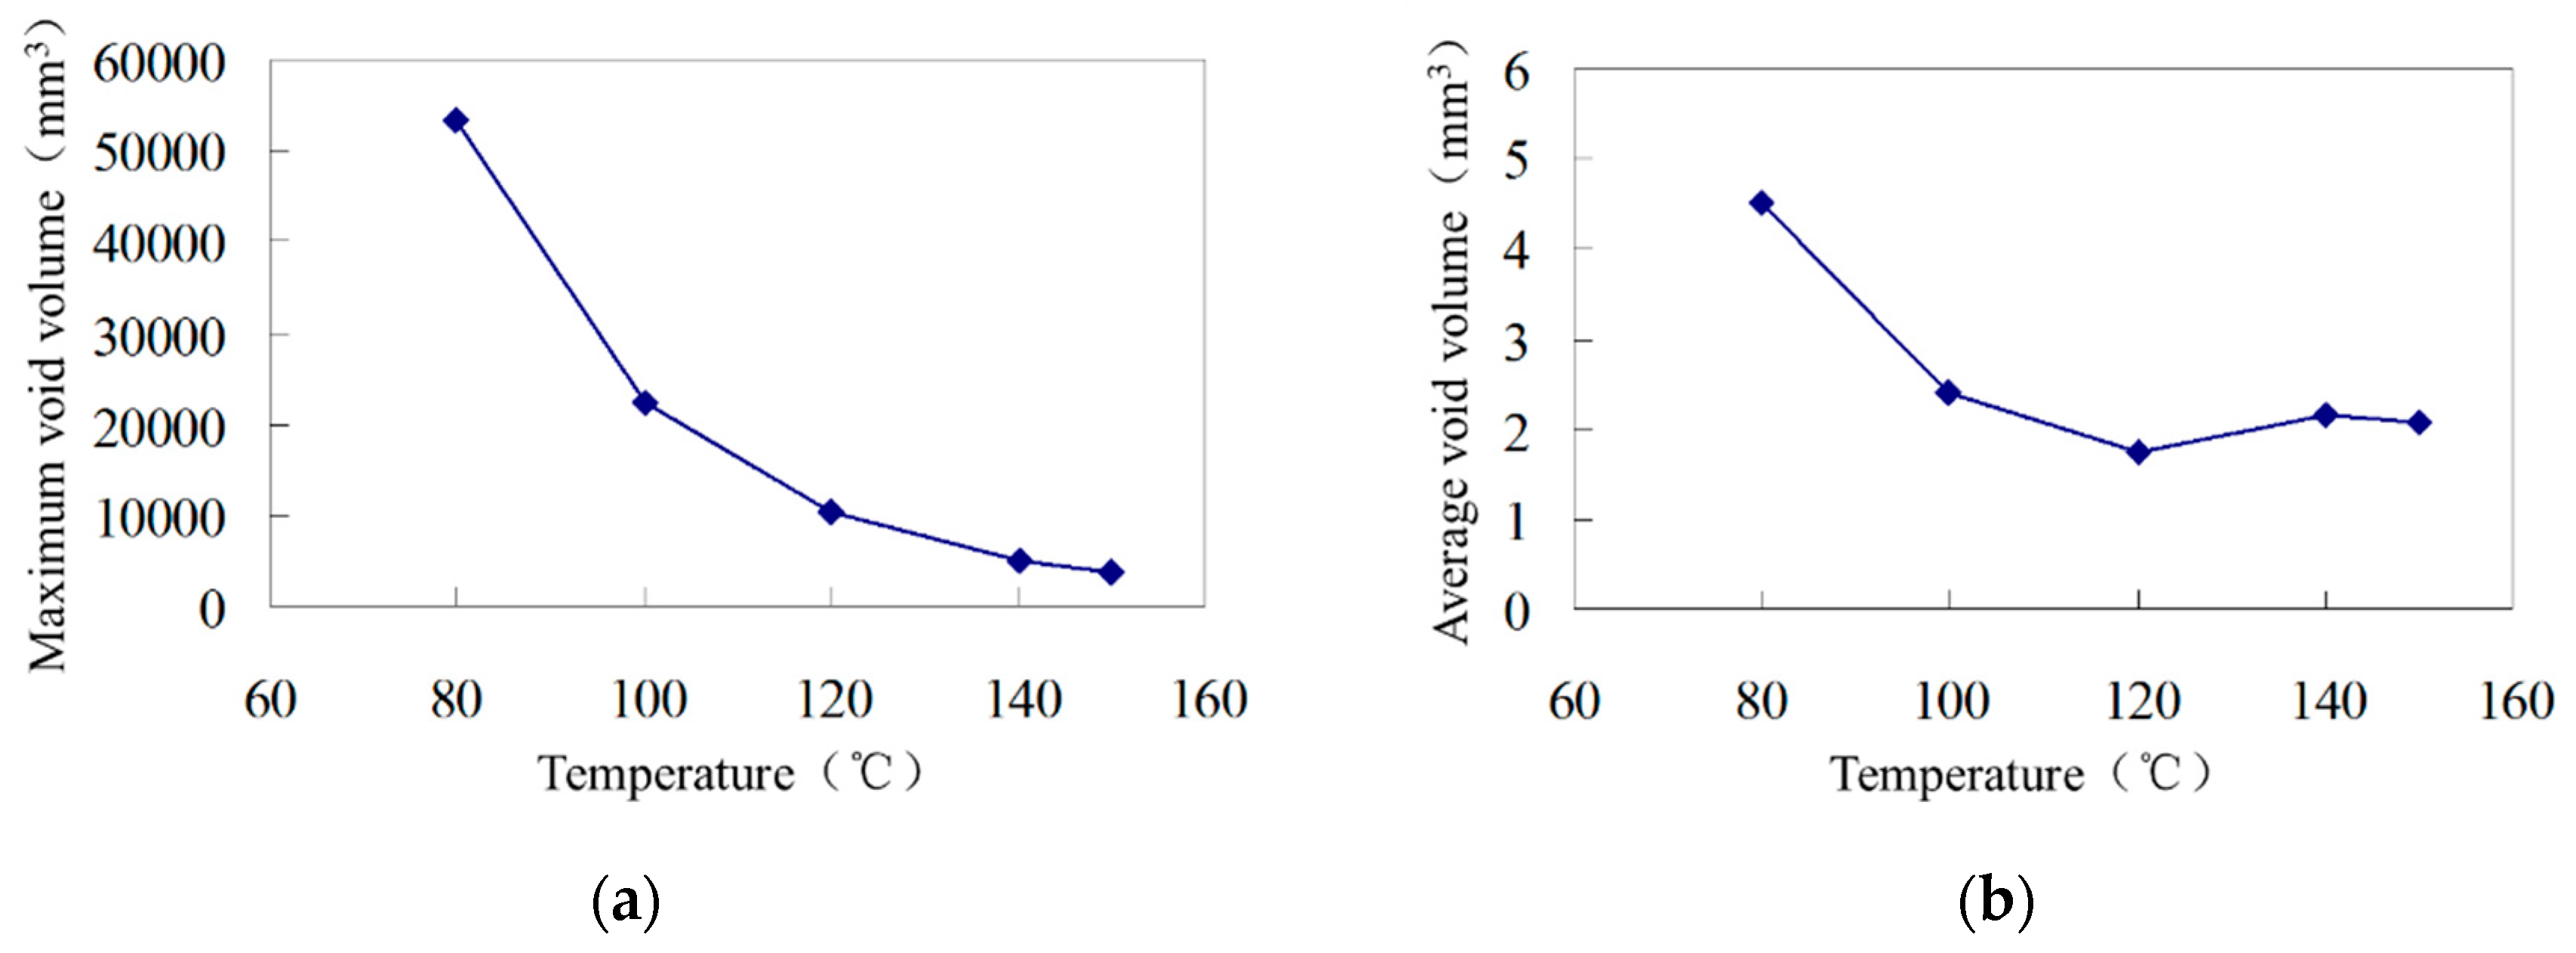
The average void volume is defined as the total void volume divided by the quantity of voids. The average void volumes of asphalt mixtures at different mixing temperatures are shown in
Figure 8. With the increase in temperature, the maximum and average void volumes in the mixture decrease. Therefore, the internal void structure of the asphalt mixture is sensitive to the mixing temperature, and different temperatures lead to different void compositions of the asphalt mixture. Similarly, it can be seen that the maximum and average void volumes can reflect the void characteristics of the mixture. Zeolite asphalt mixture is equivalent to hot mix asphalt mixture at 120 °C and 140 °C, while at temperatures below 120 °C, the maximum and average void volume increase significantly.
It can be seen that the compaction temperature of zeolite asphalt mixture should be maintained at above 120 °C based on the void ratio and void composition information. In this condition, zeolite asphalt mixture has a void ratio and internal void composition close to that of hot mix asphalt mixture. When the temperature is lower than that, the void ratio and average void volume of asphalt mixture increase obviously, and the large void volume, in particular, increases greatly, making it difficult for the mixture to achieve ideal compaction effect.


