
Effect of Starch Loading on the Thermo-Mechanical and Morphological Properties of Polyurethane Composites


 and
and
Abstract
:1. Introduction
2. Results and Discussion
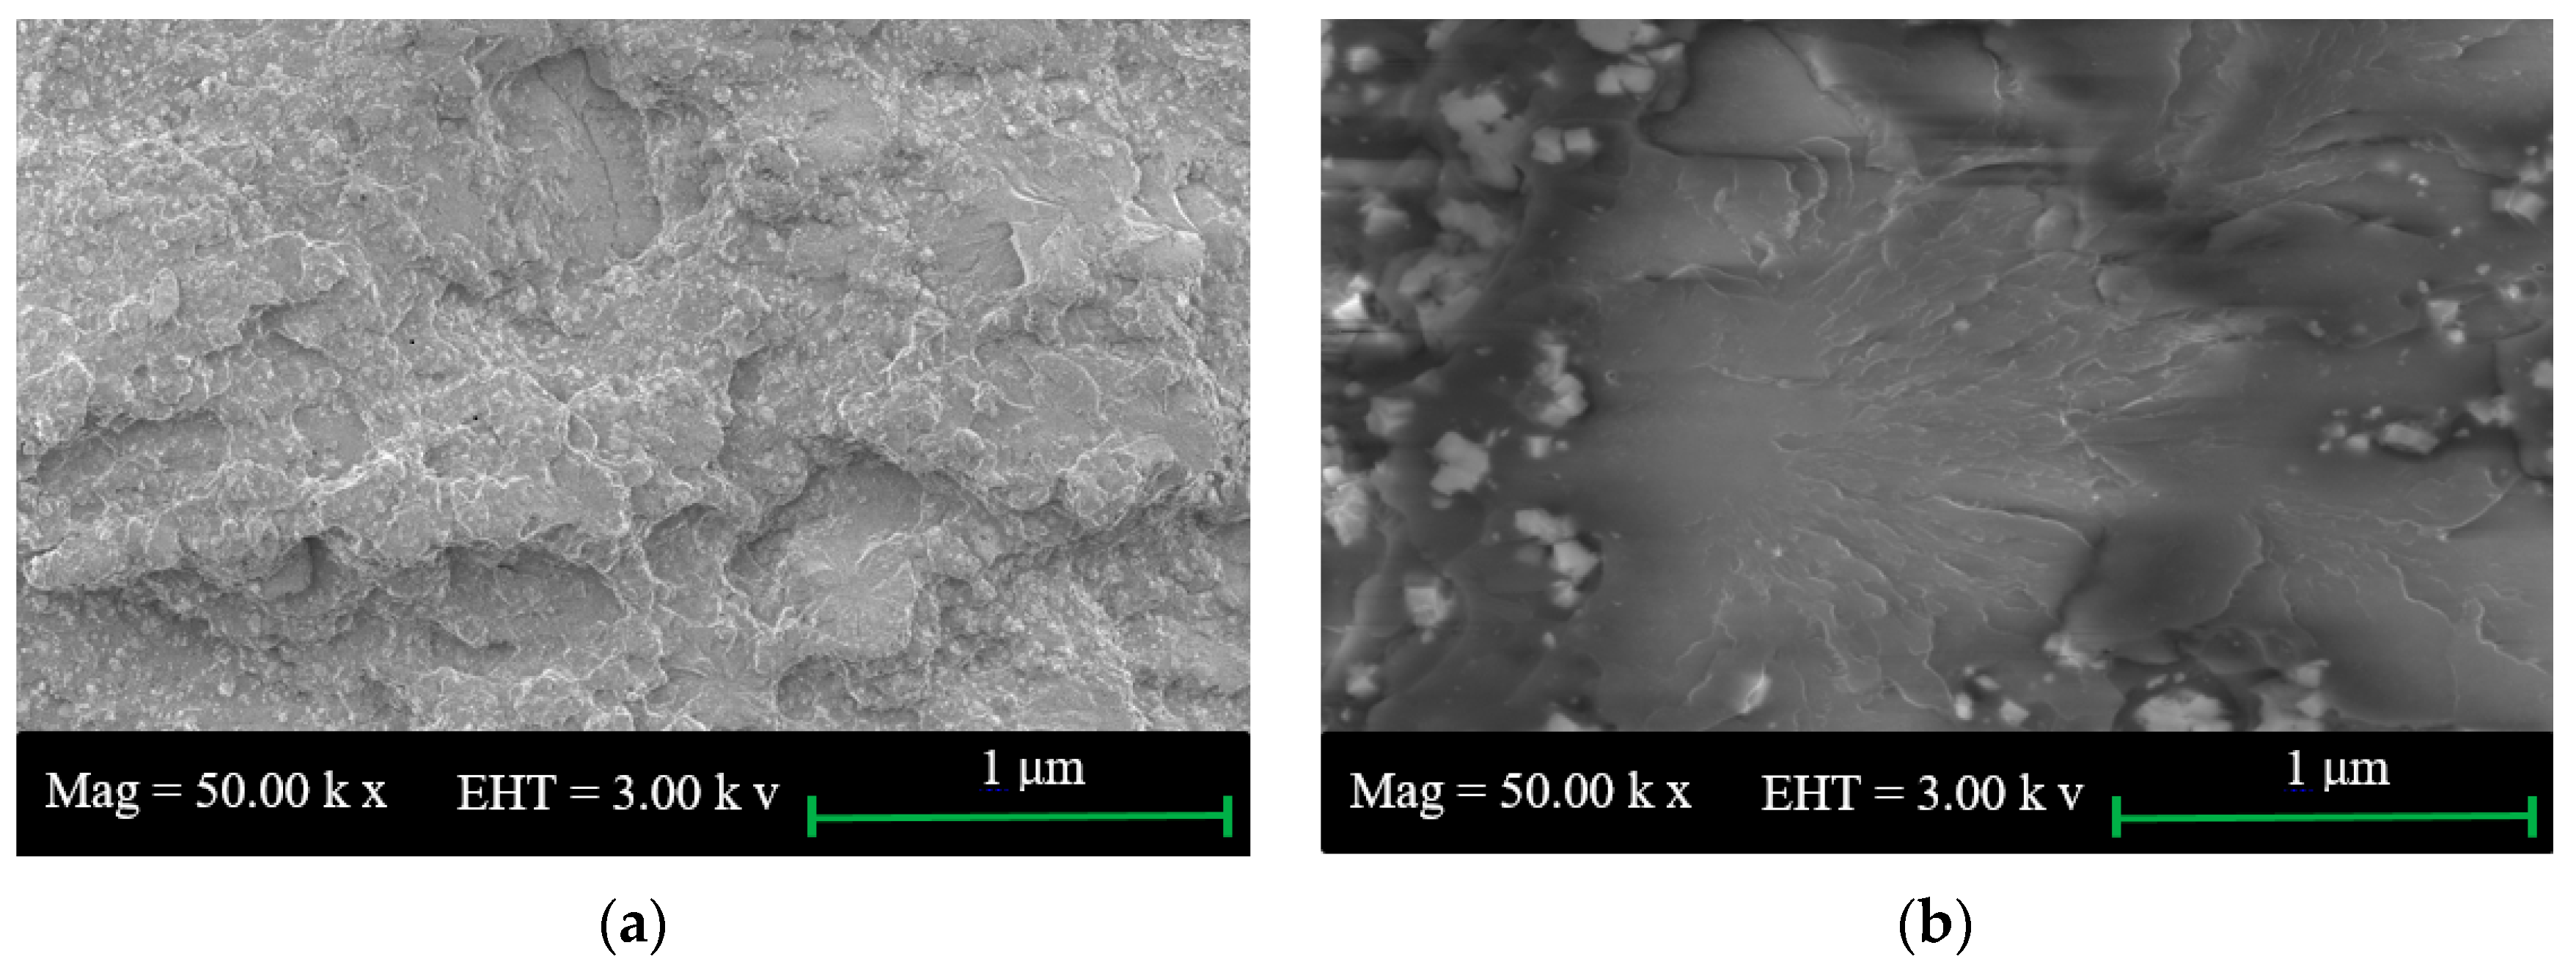
2.1. SEM of Starch and Neat PU
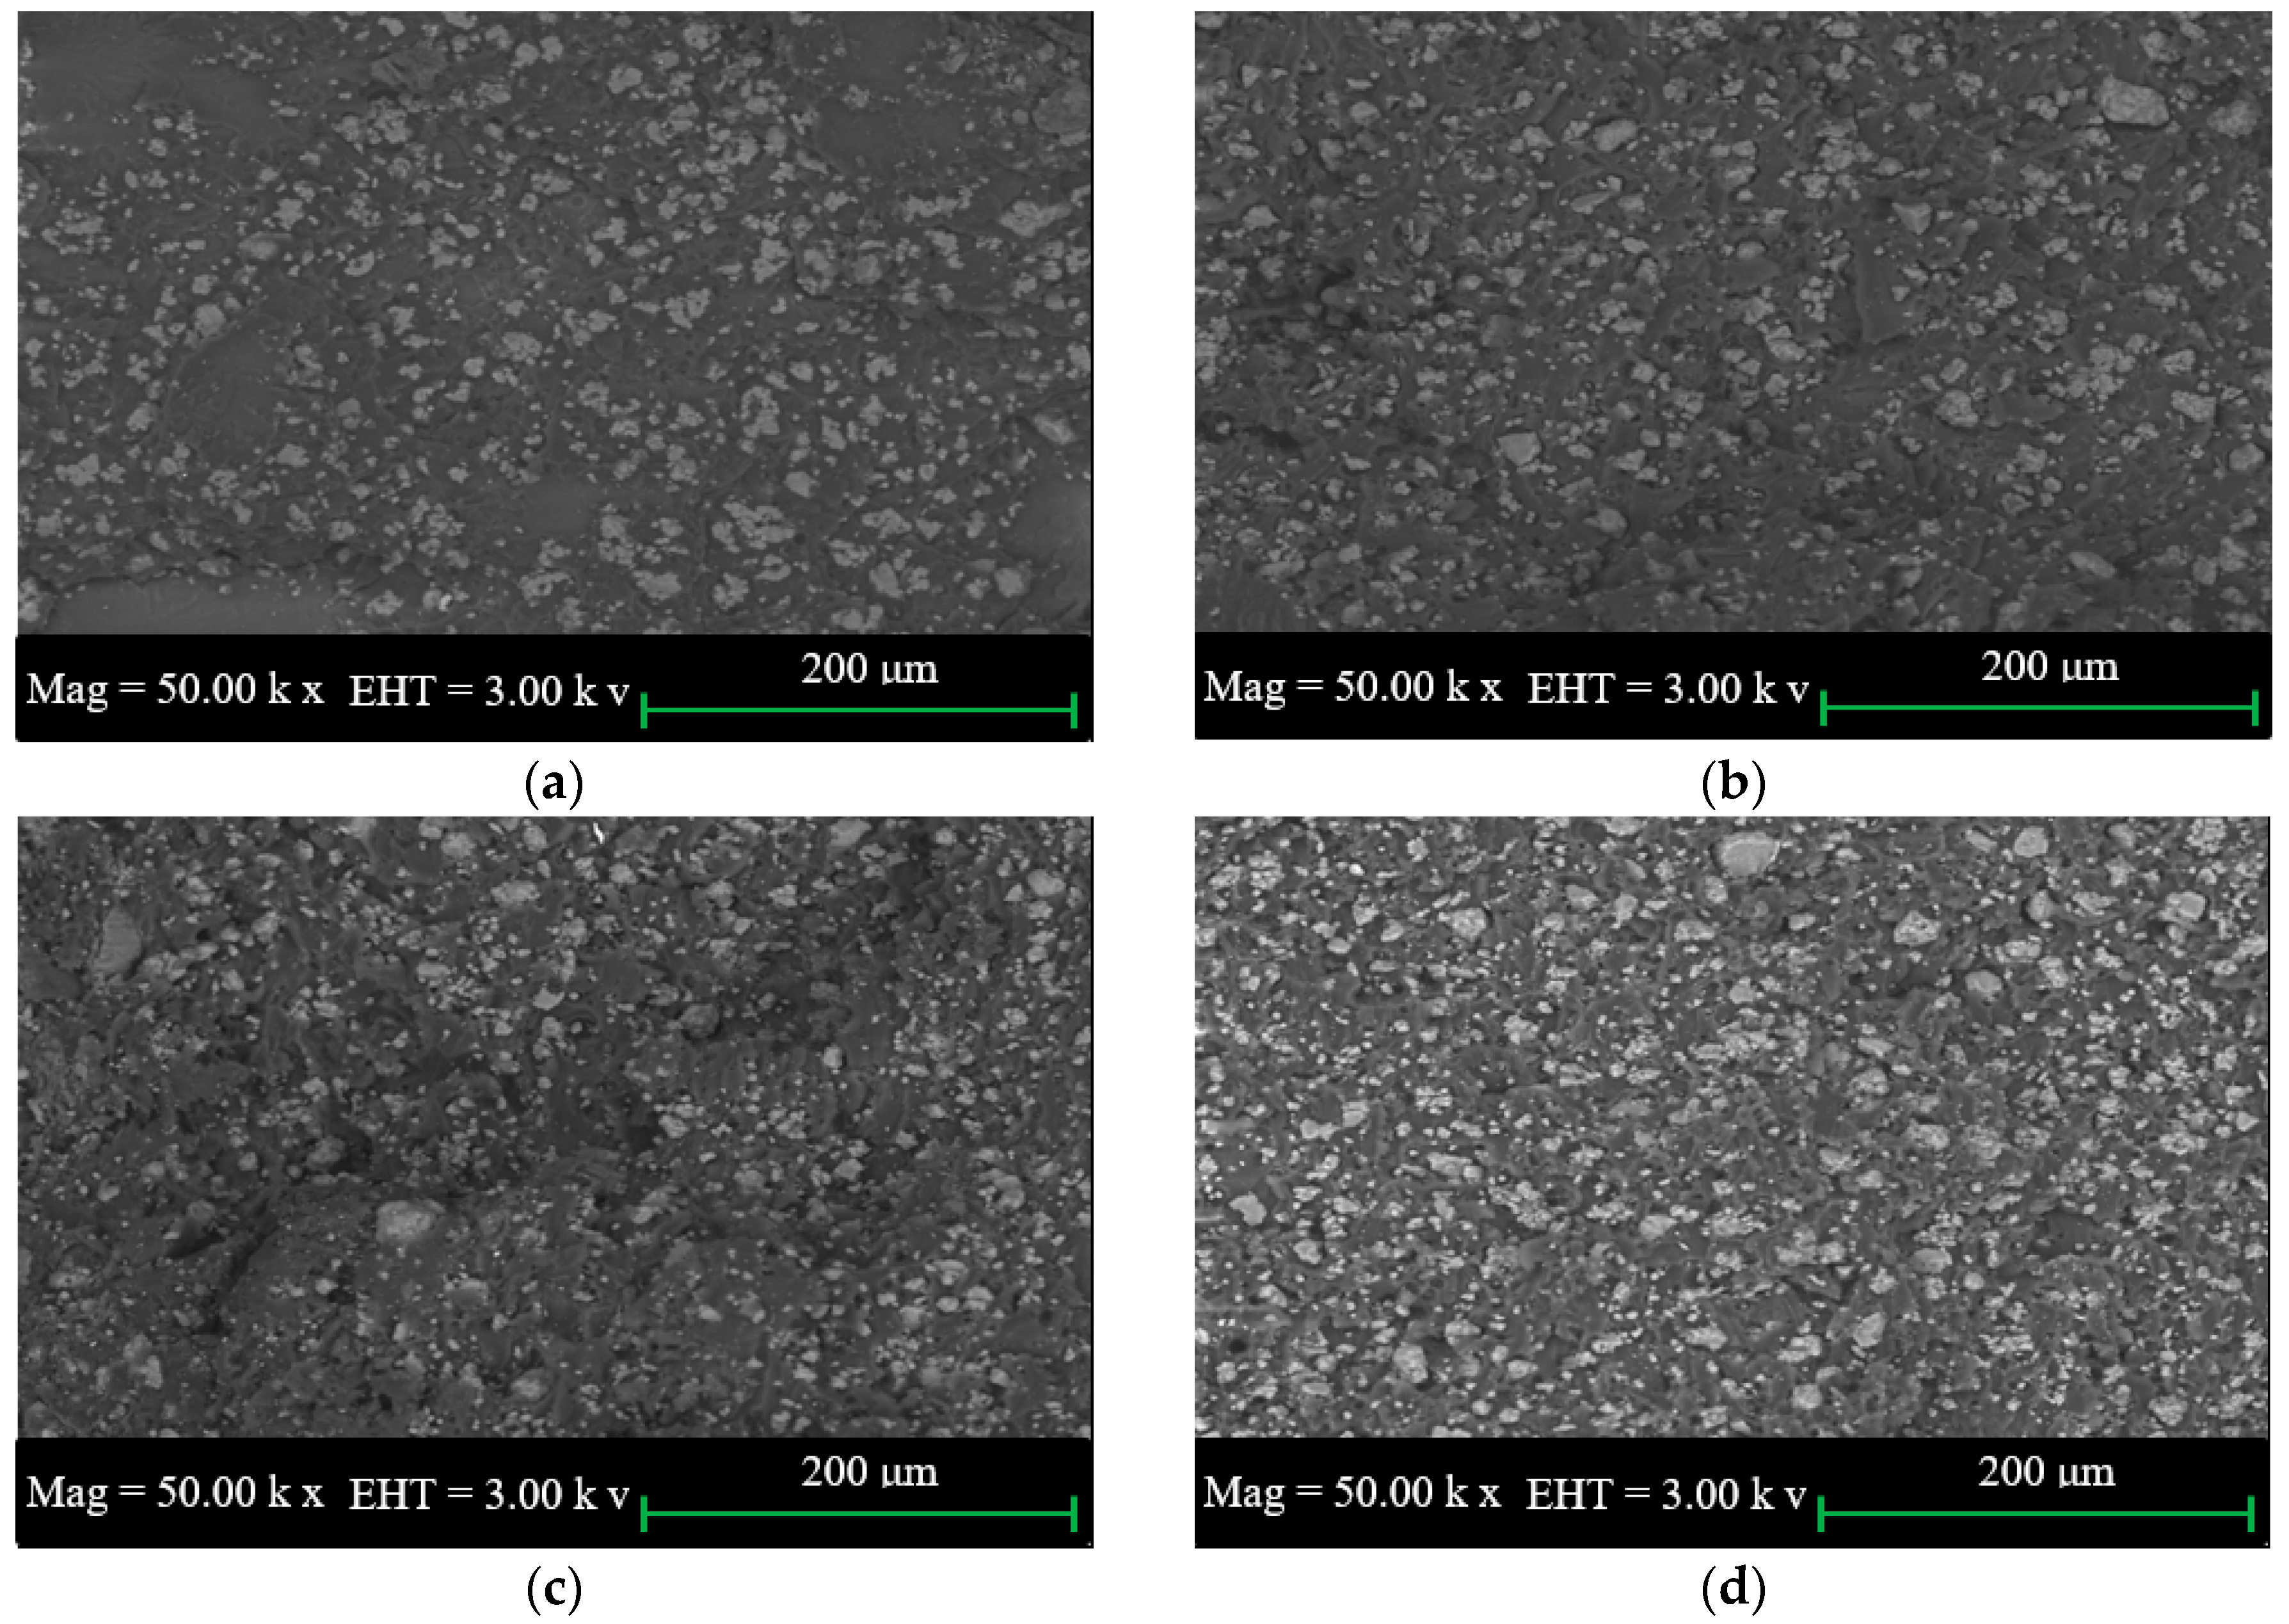
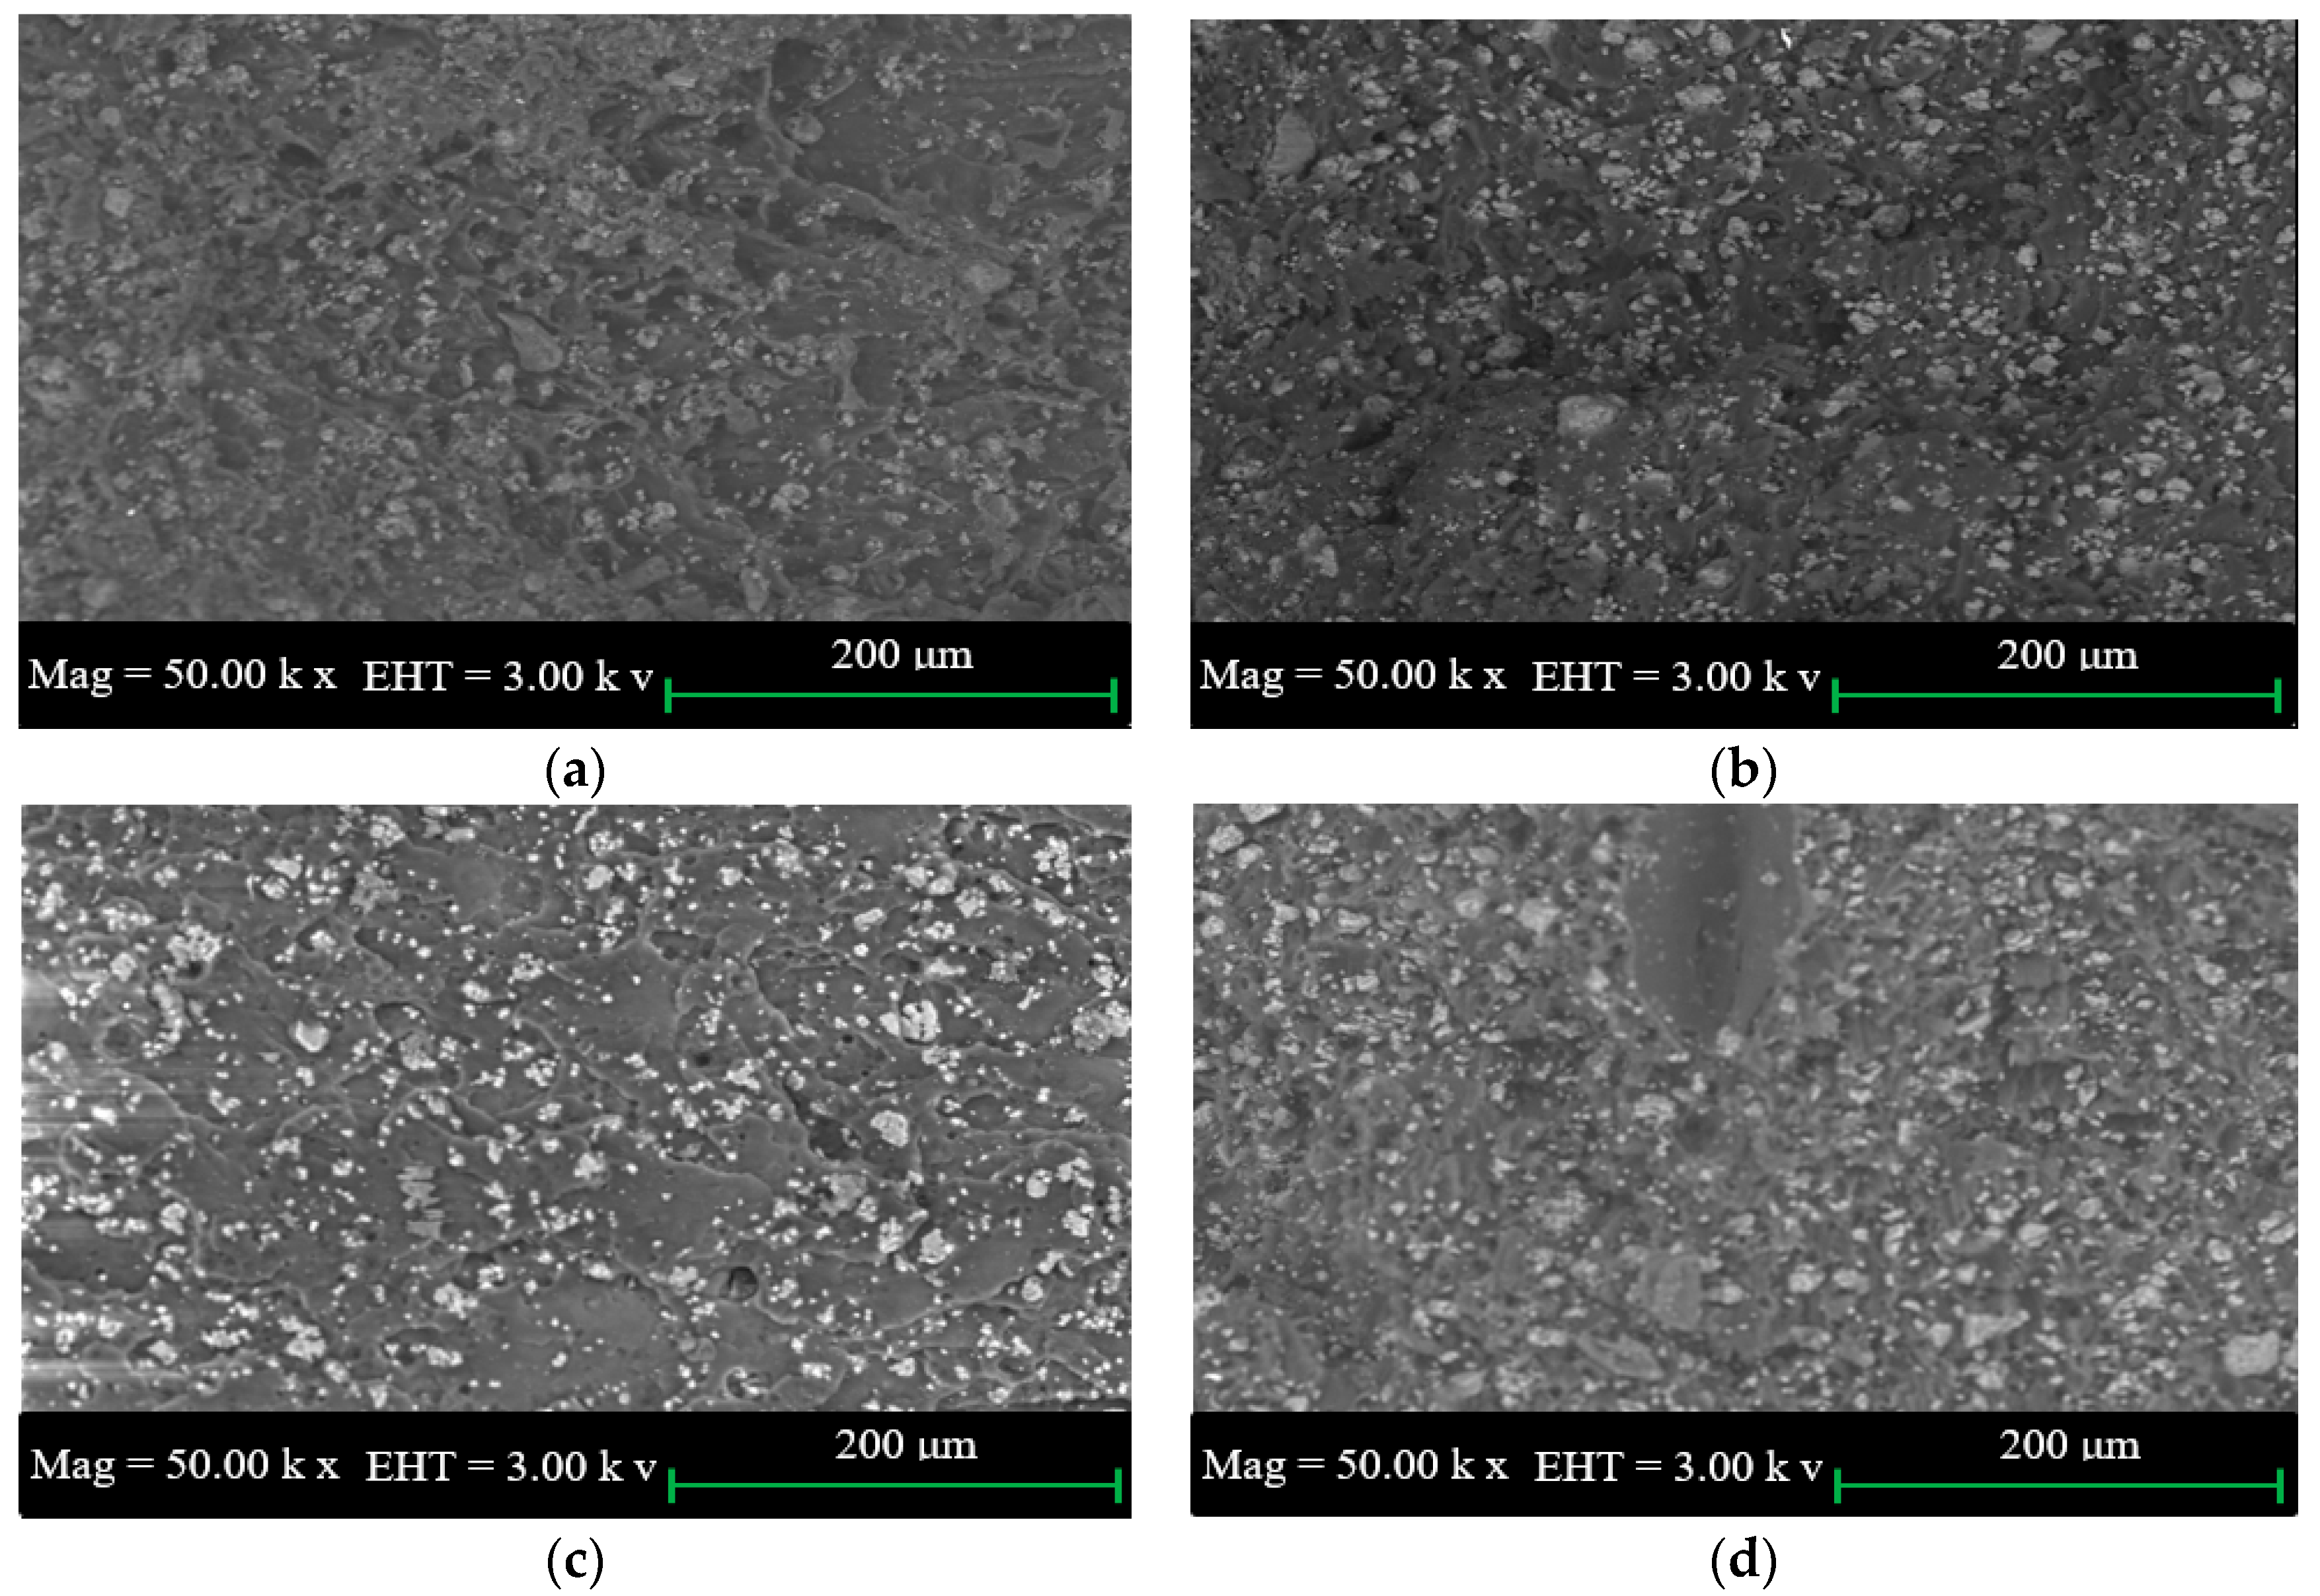
2.2. SEM for Tensile and Impact Fractured Surface of PUS
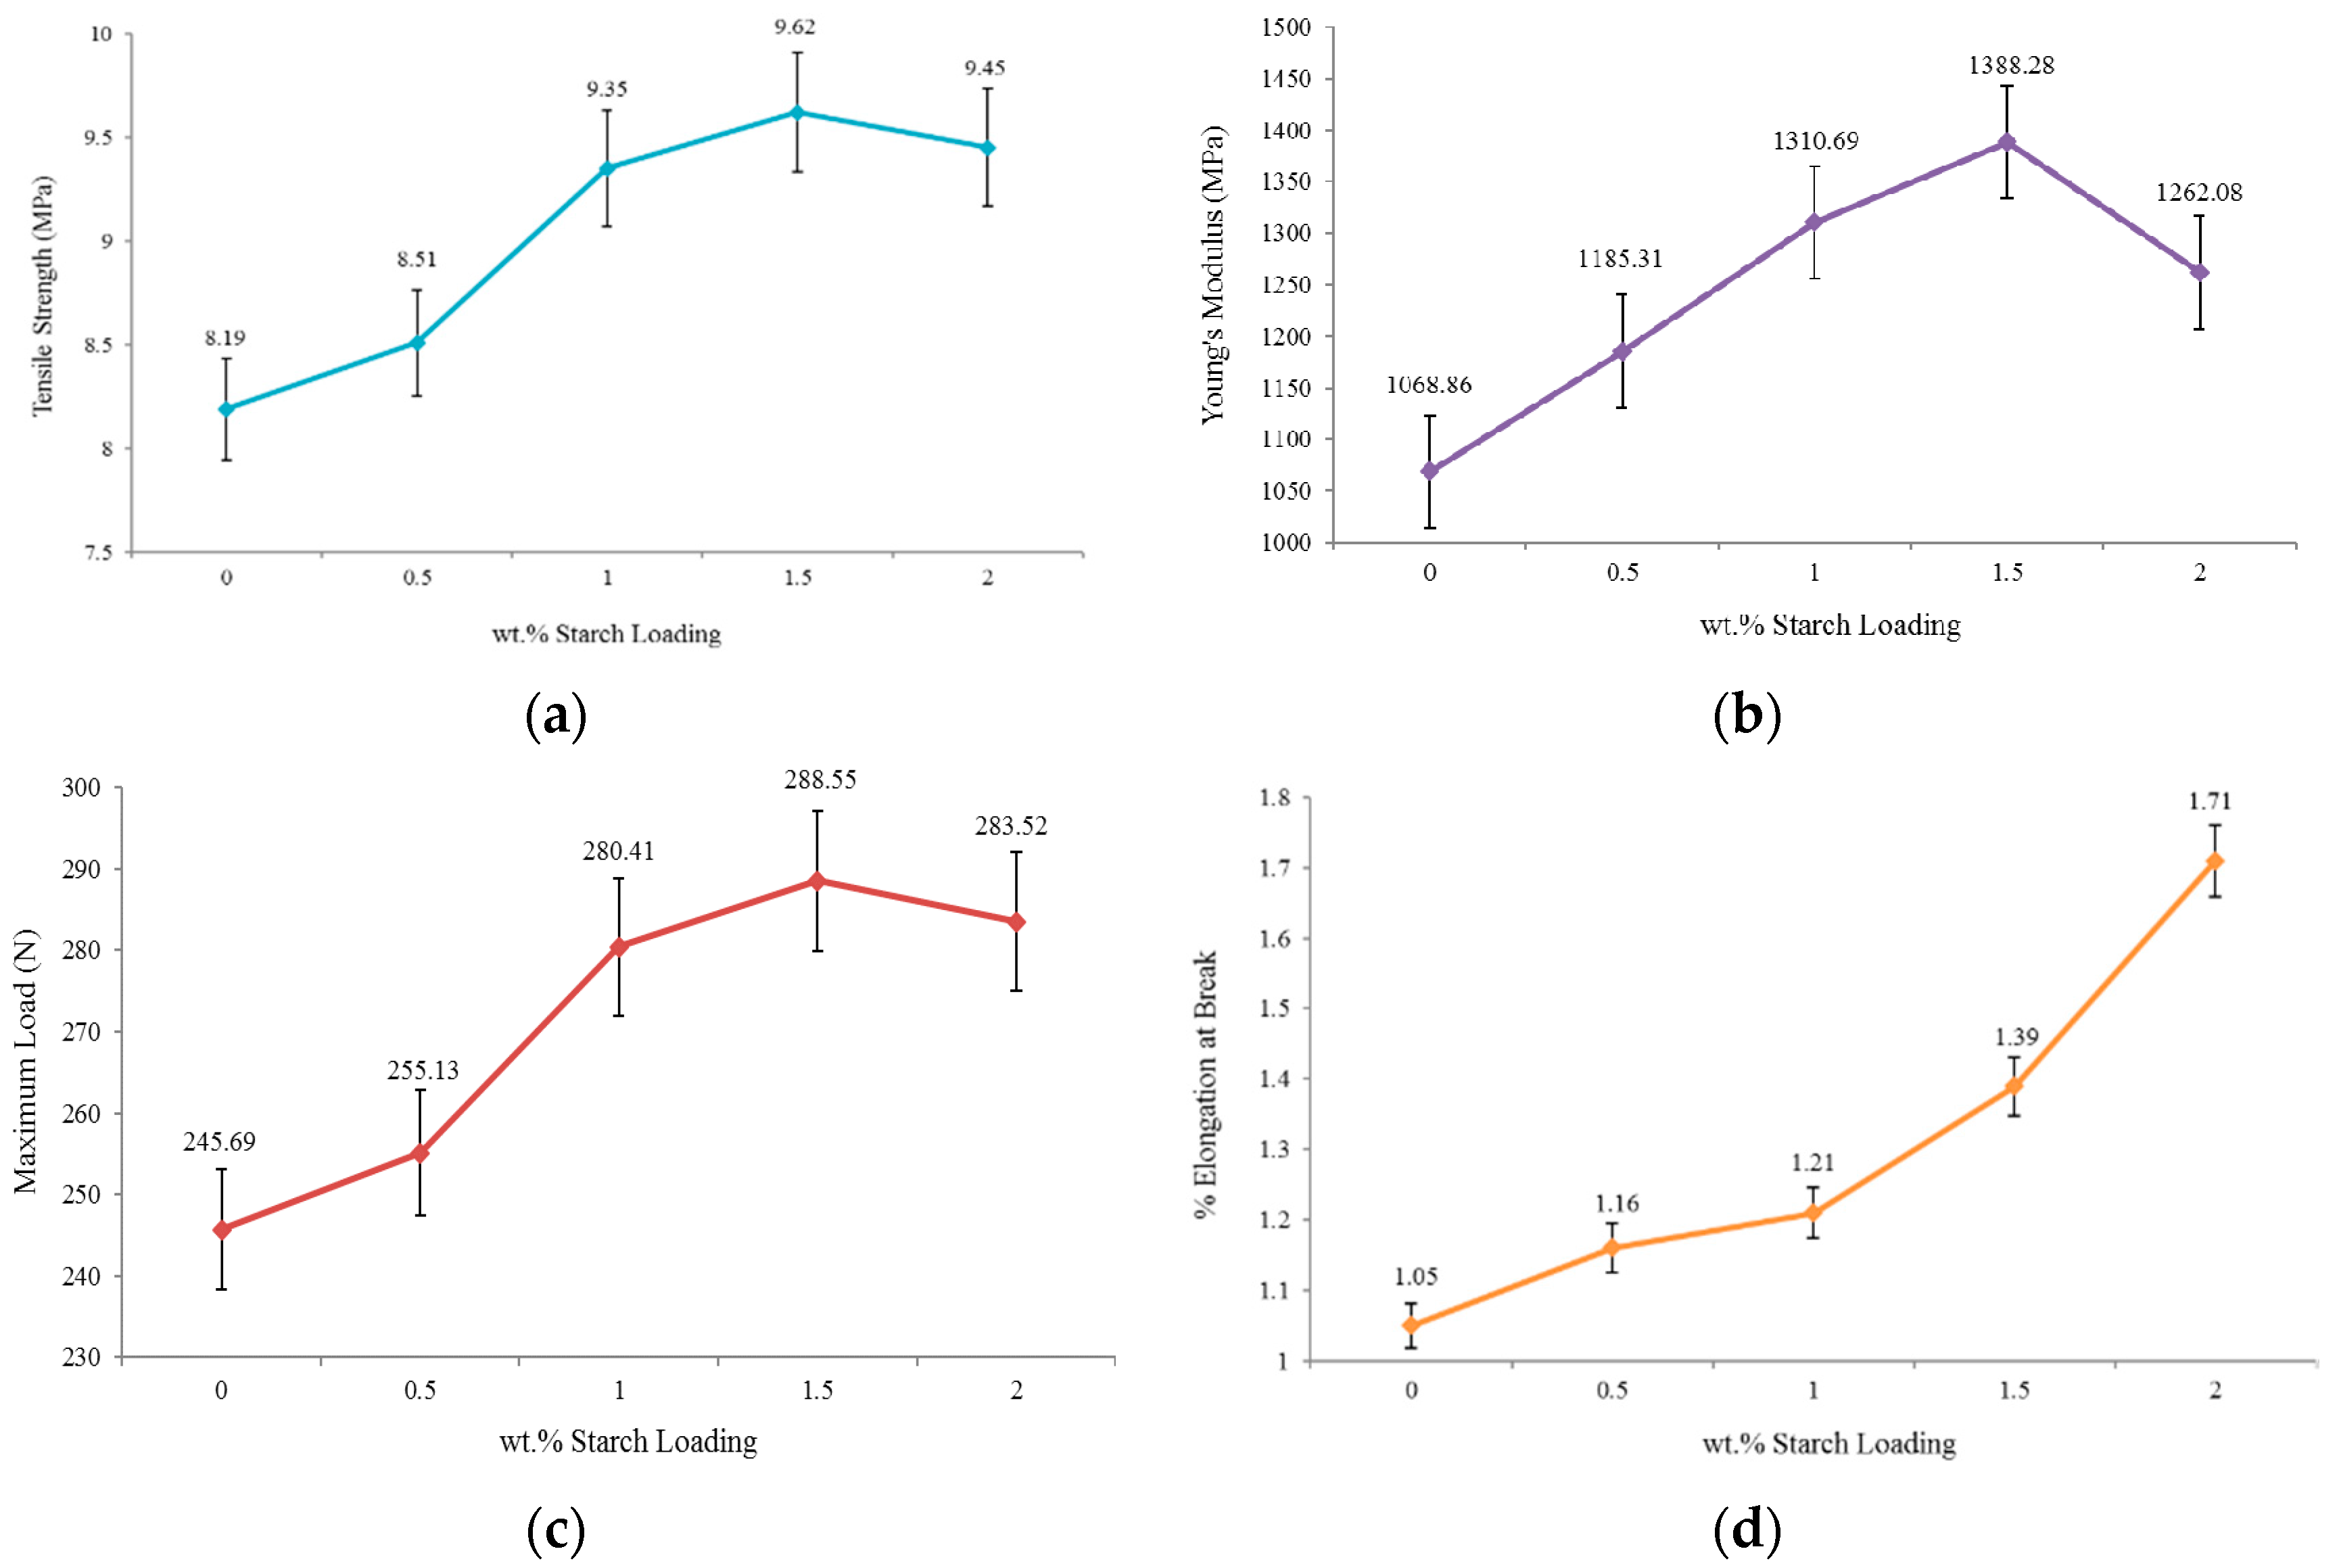
2.3. Tensile Test
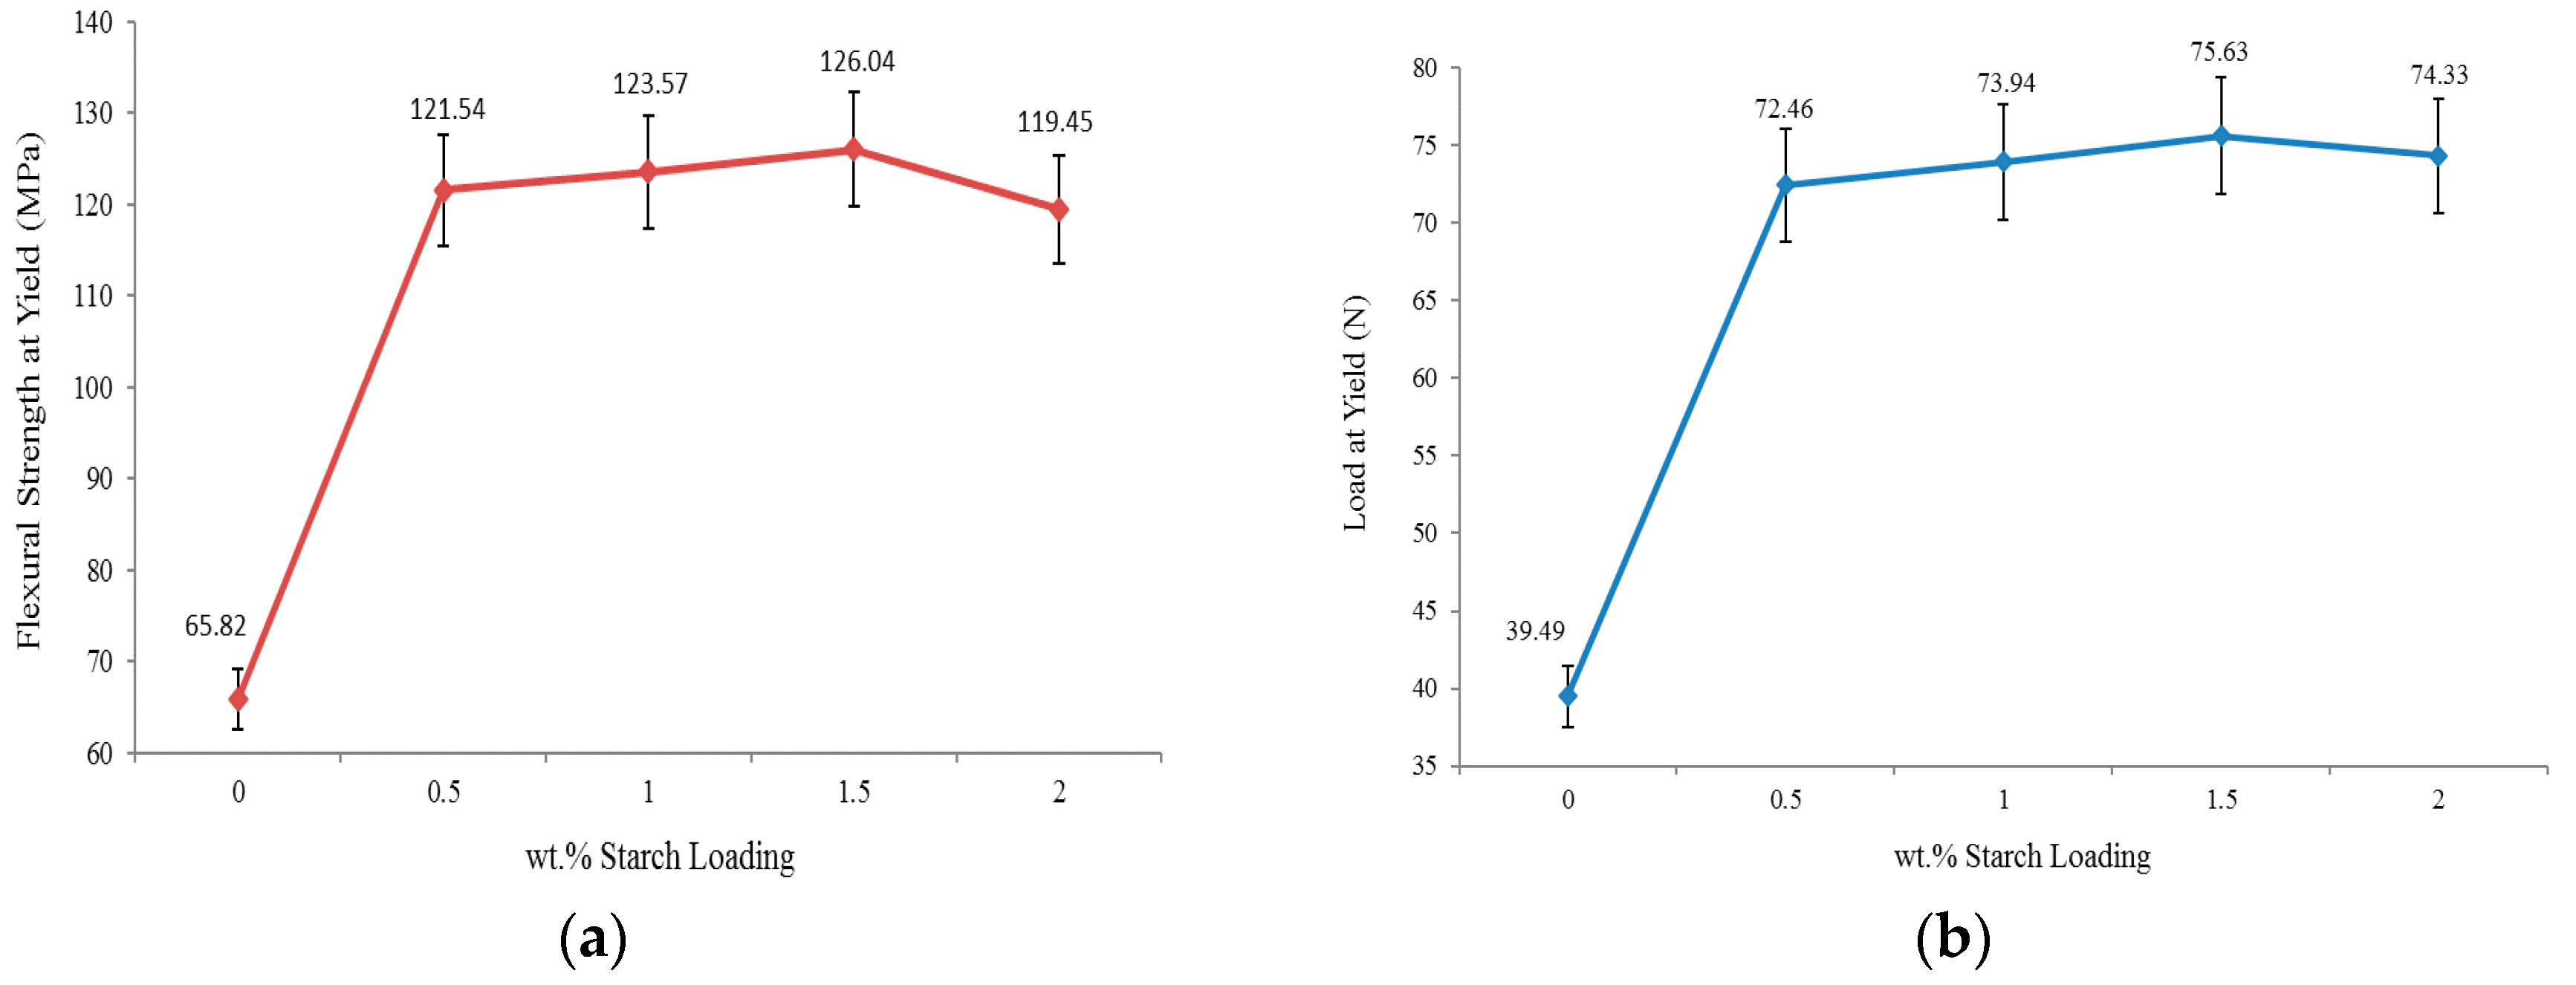
2.4. Flexural Test
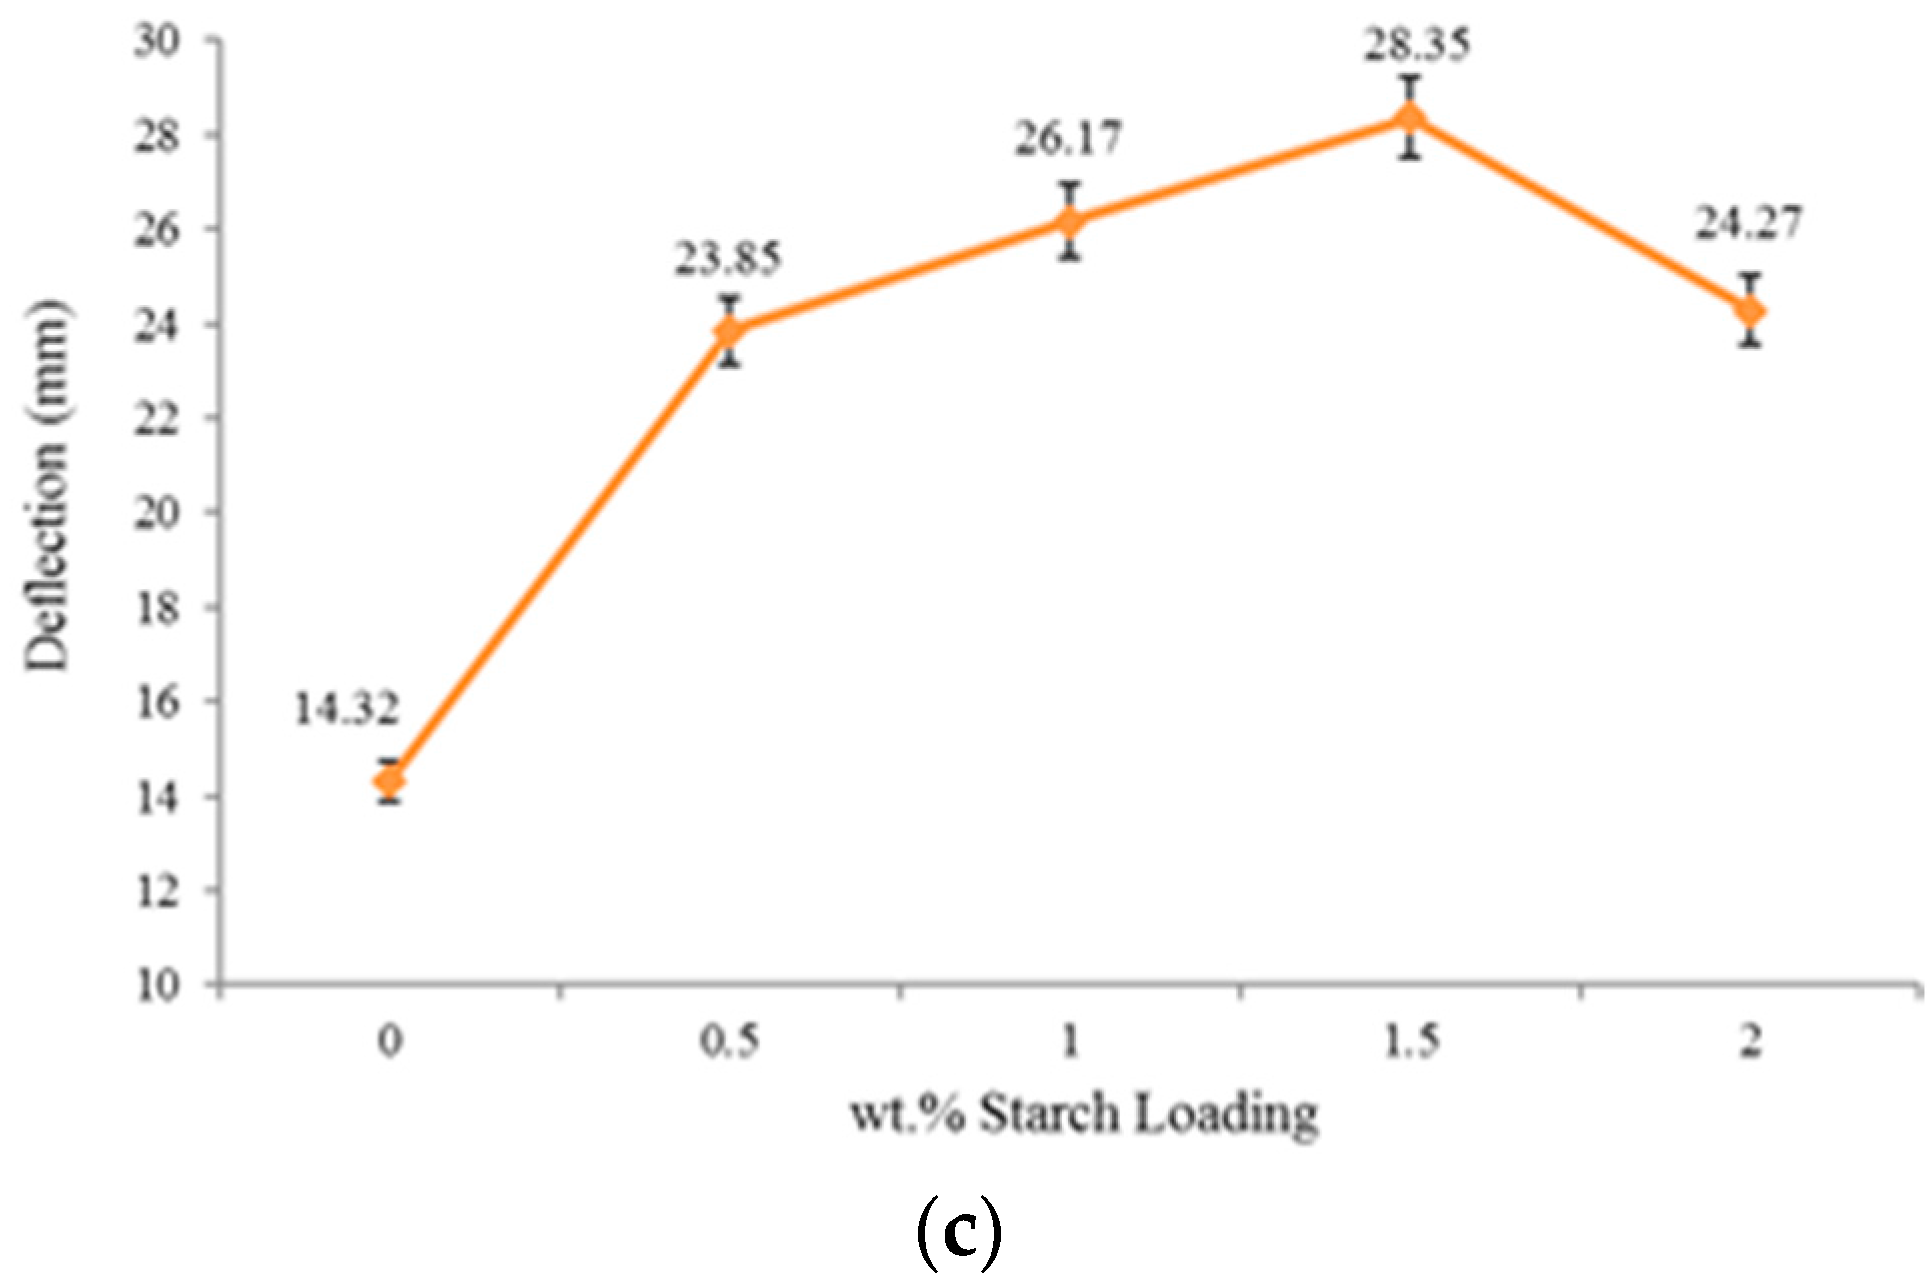
2.5. Impact Test
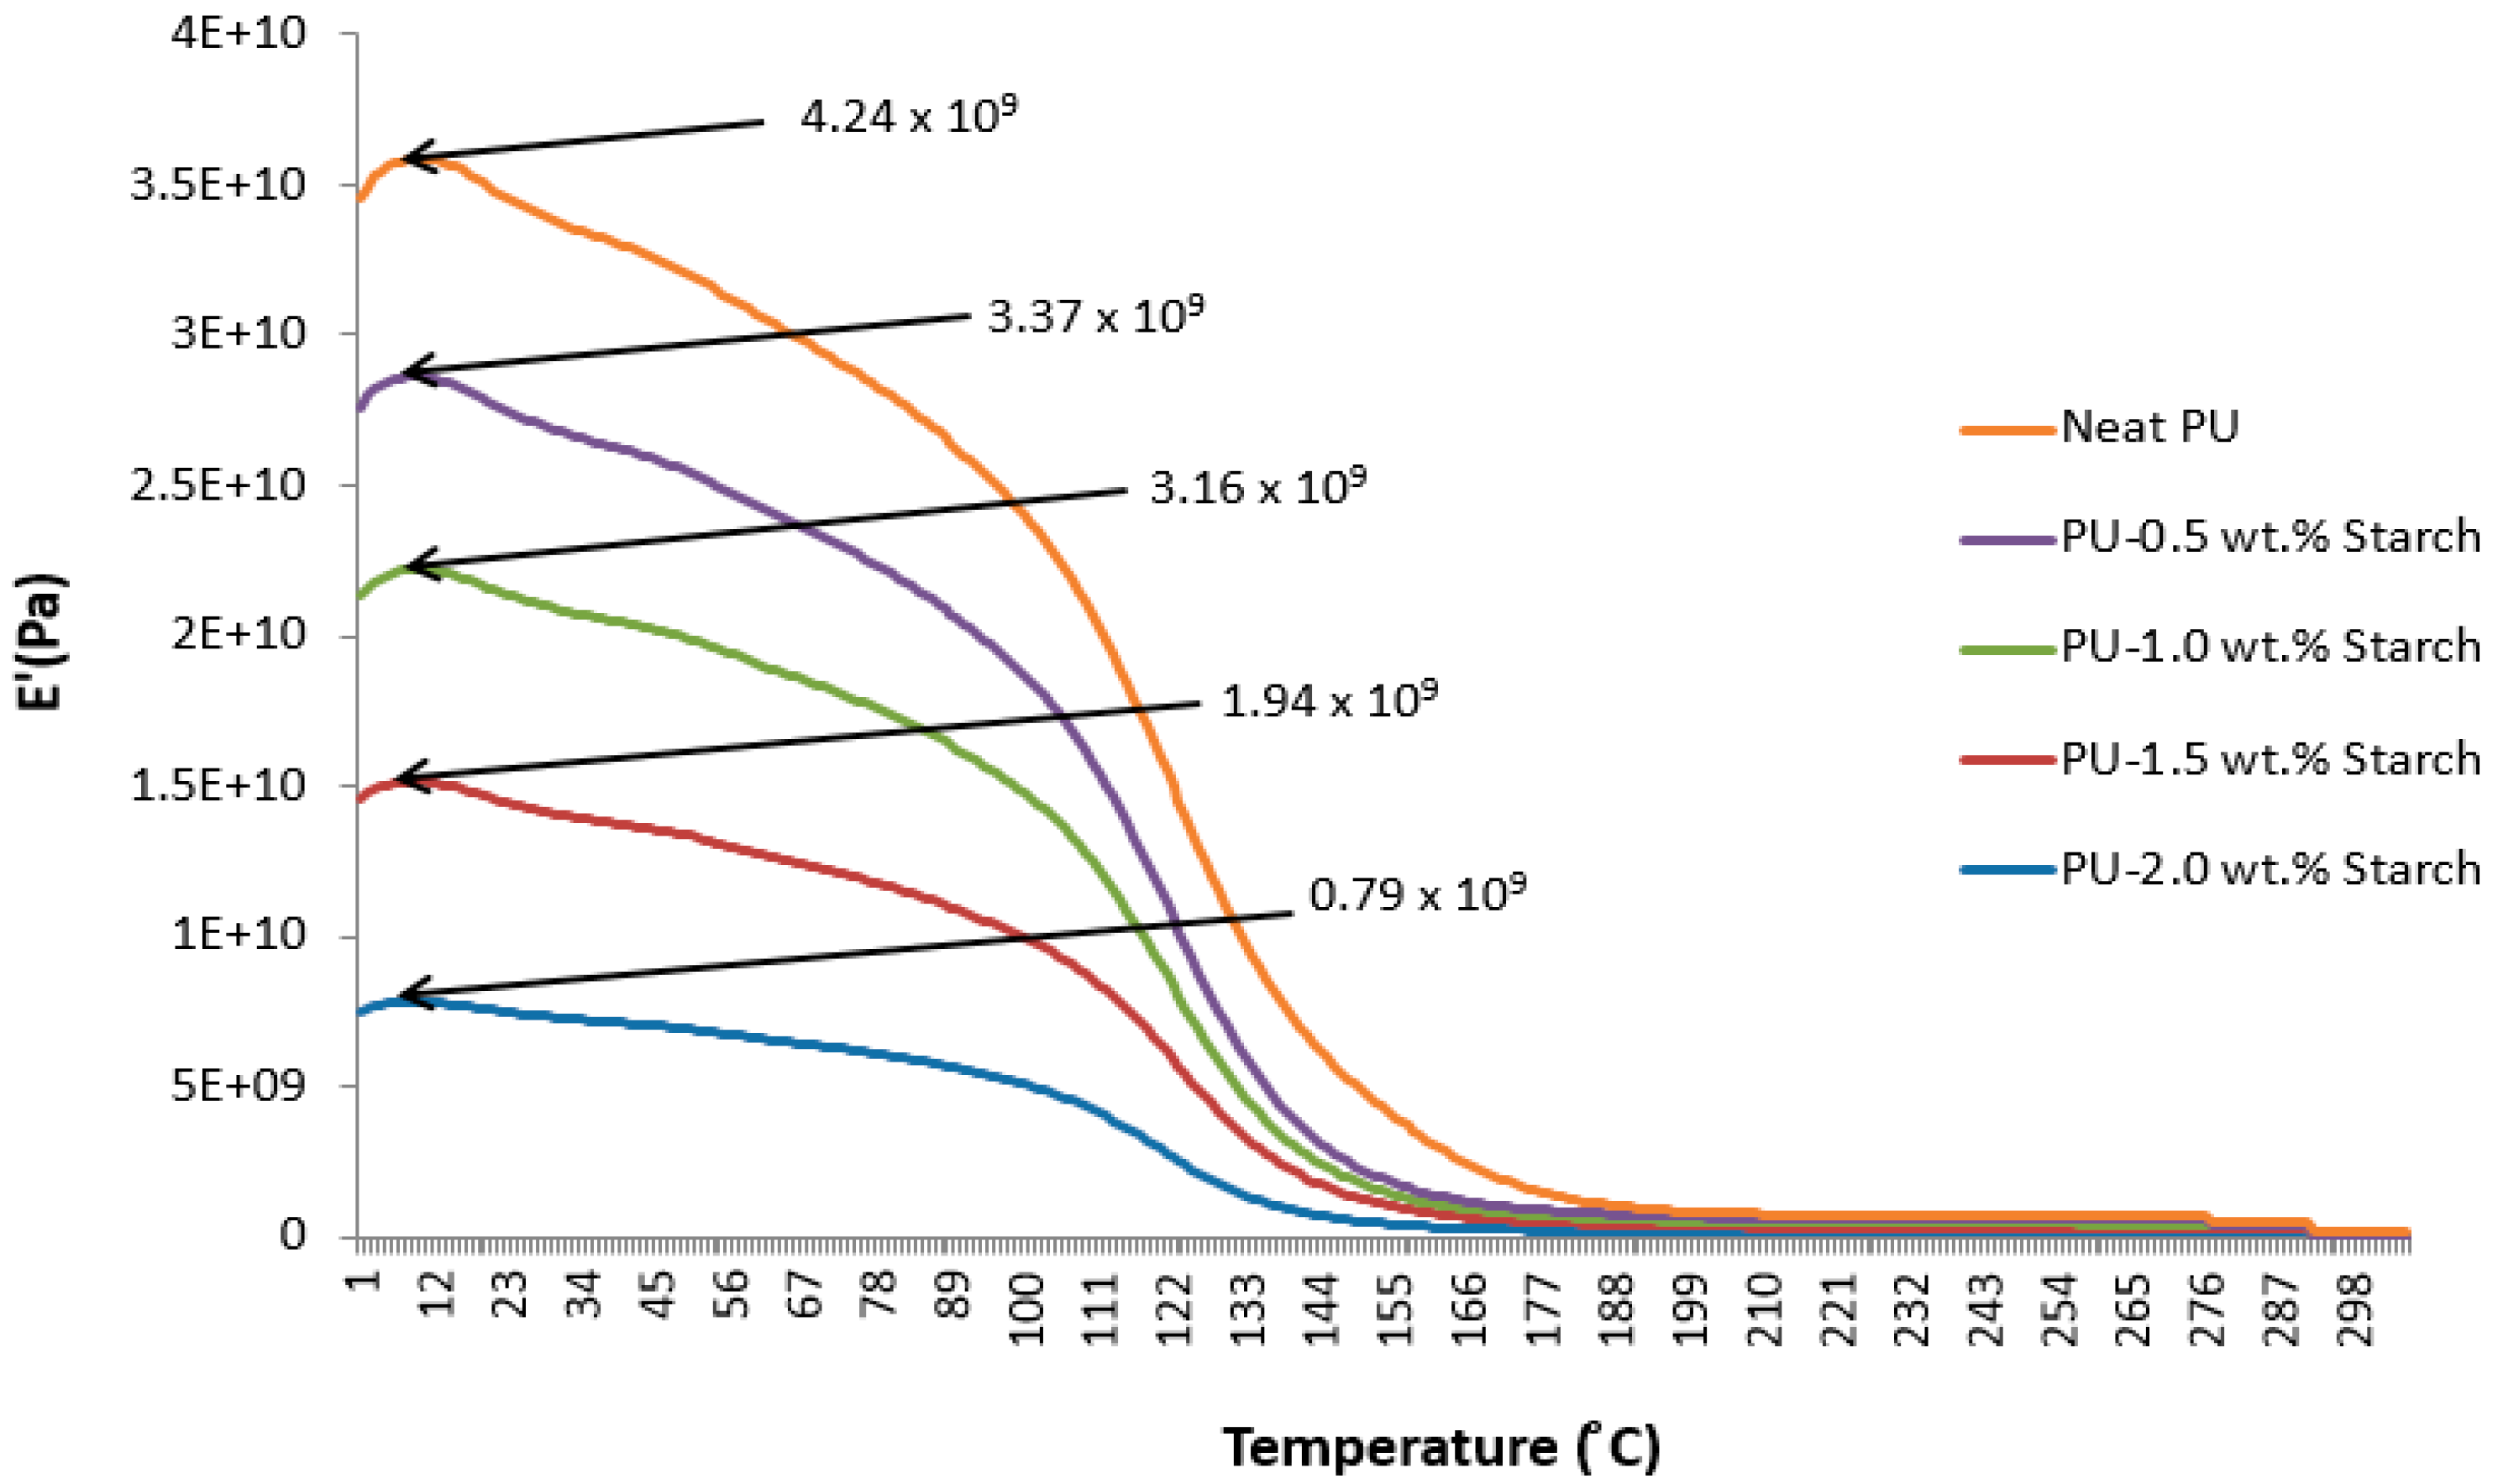
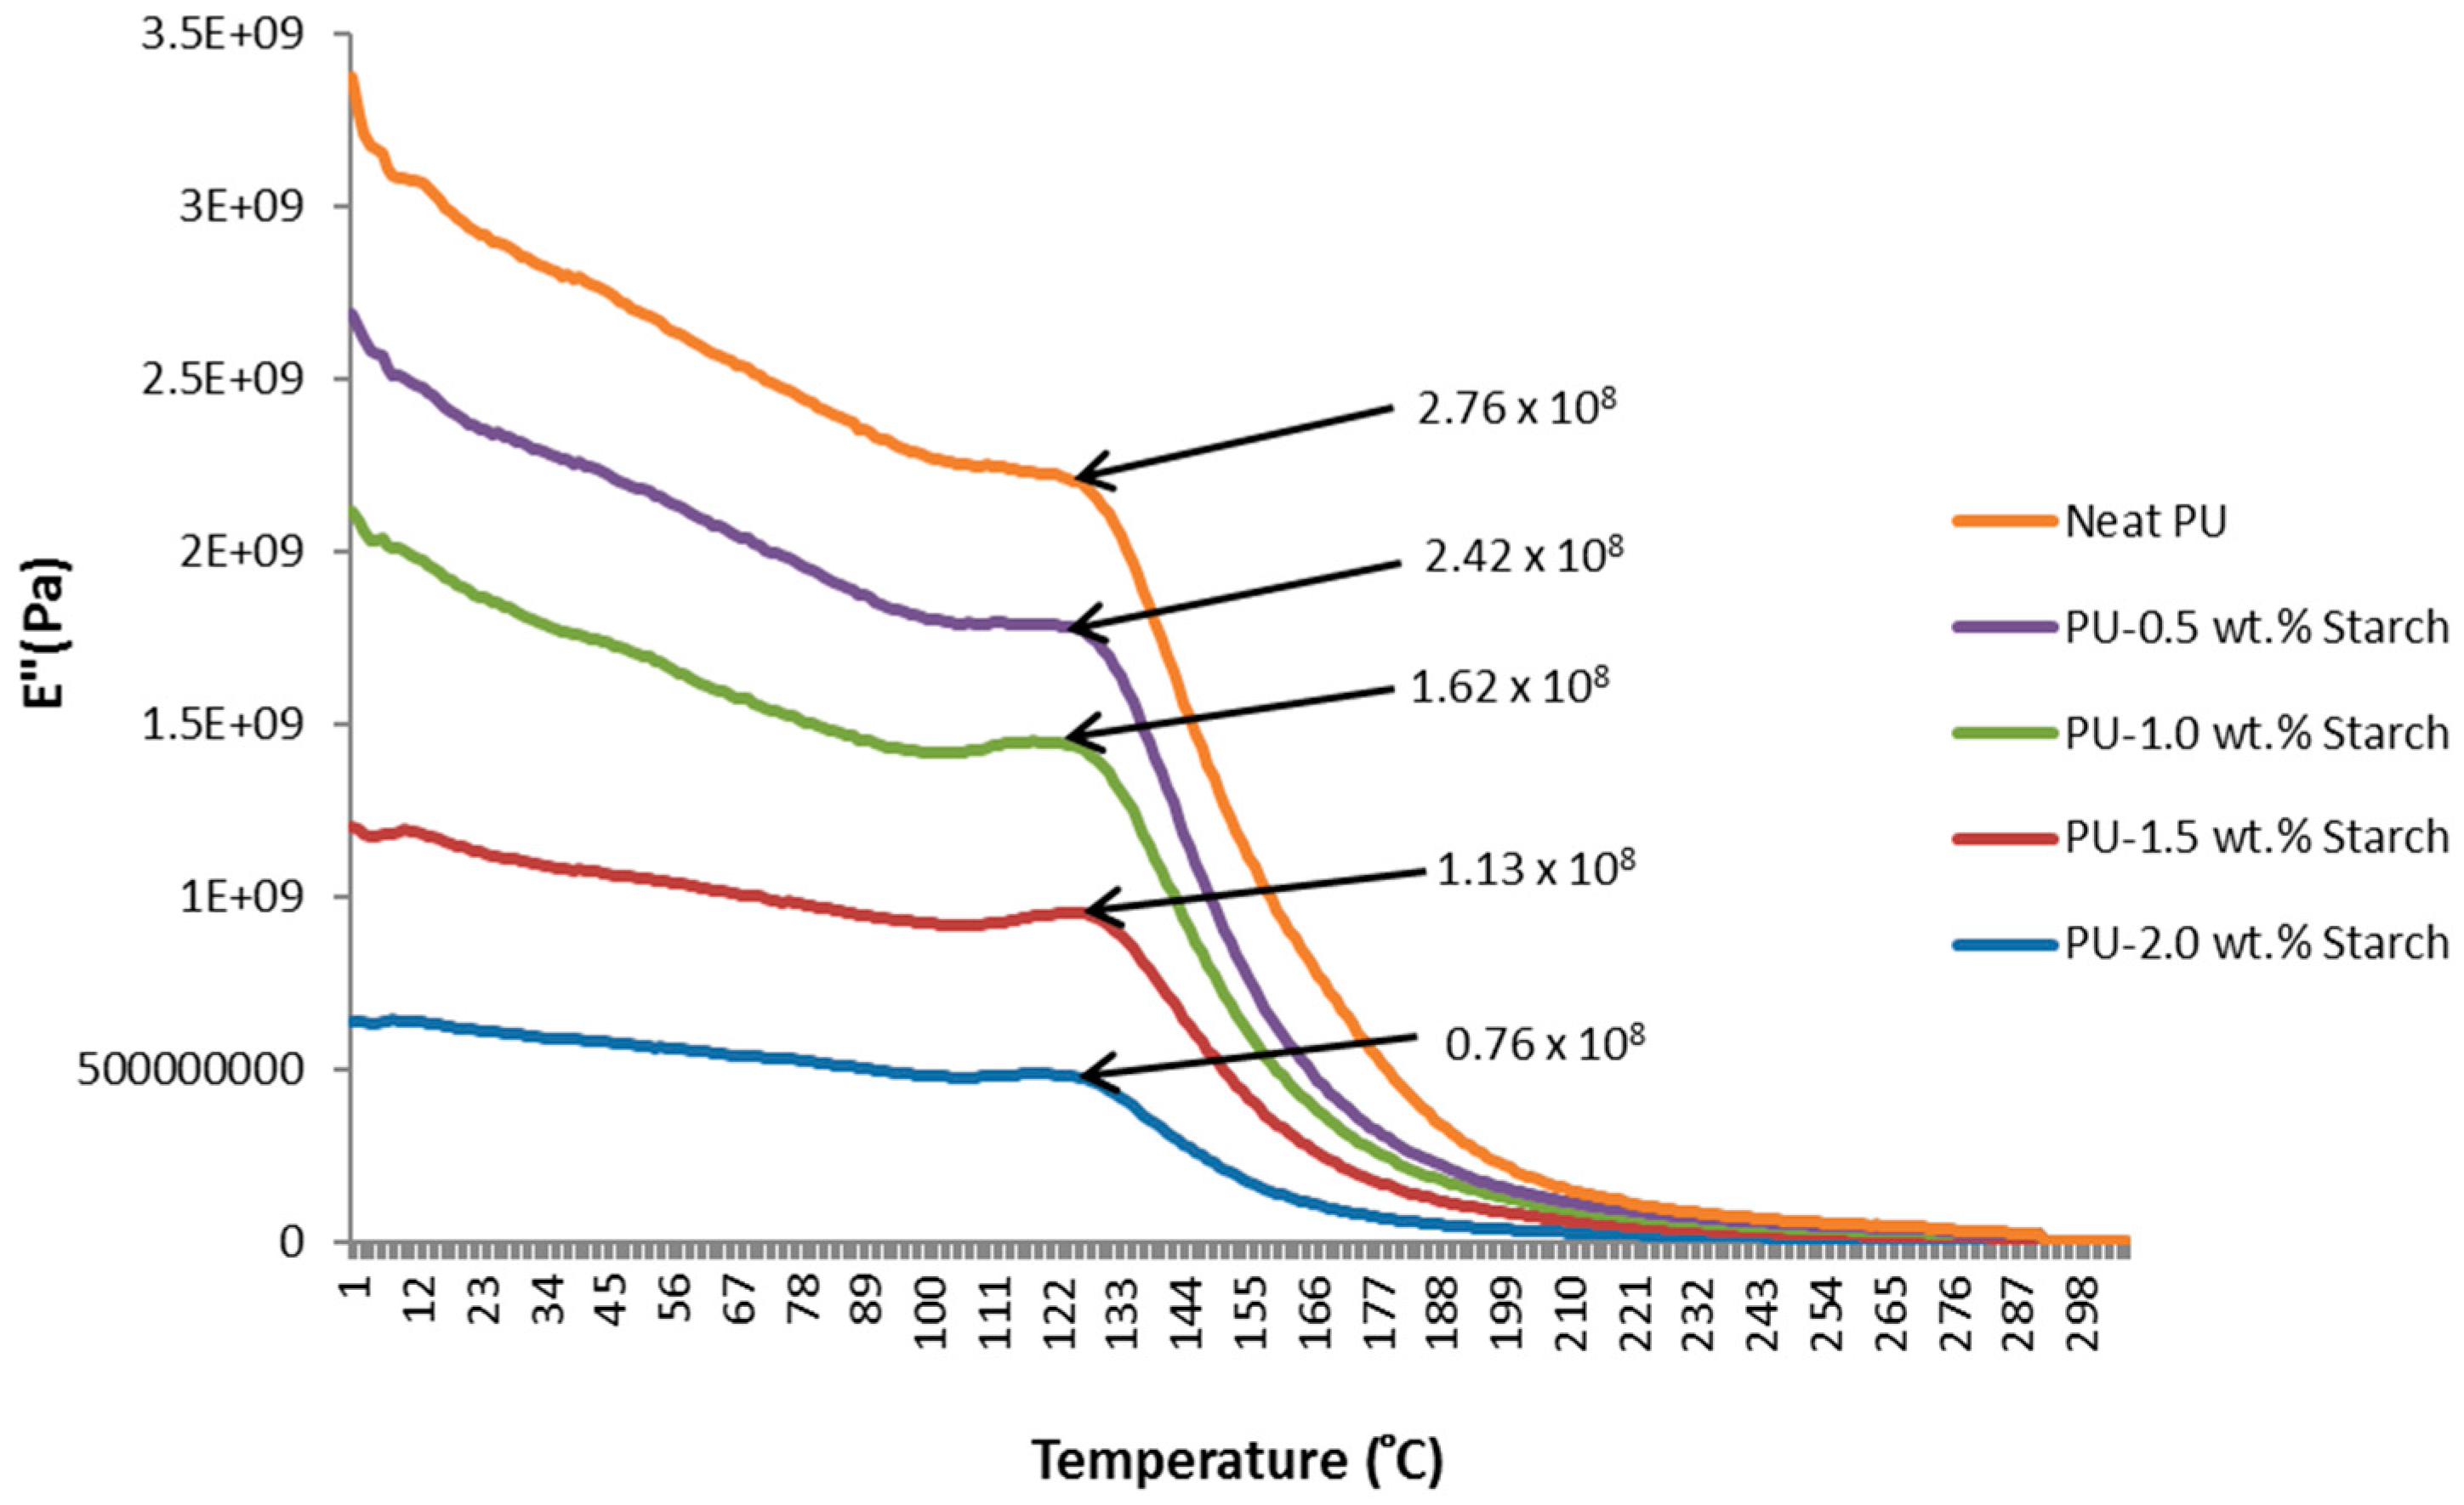
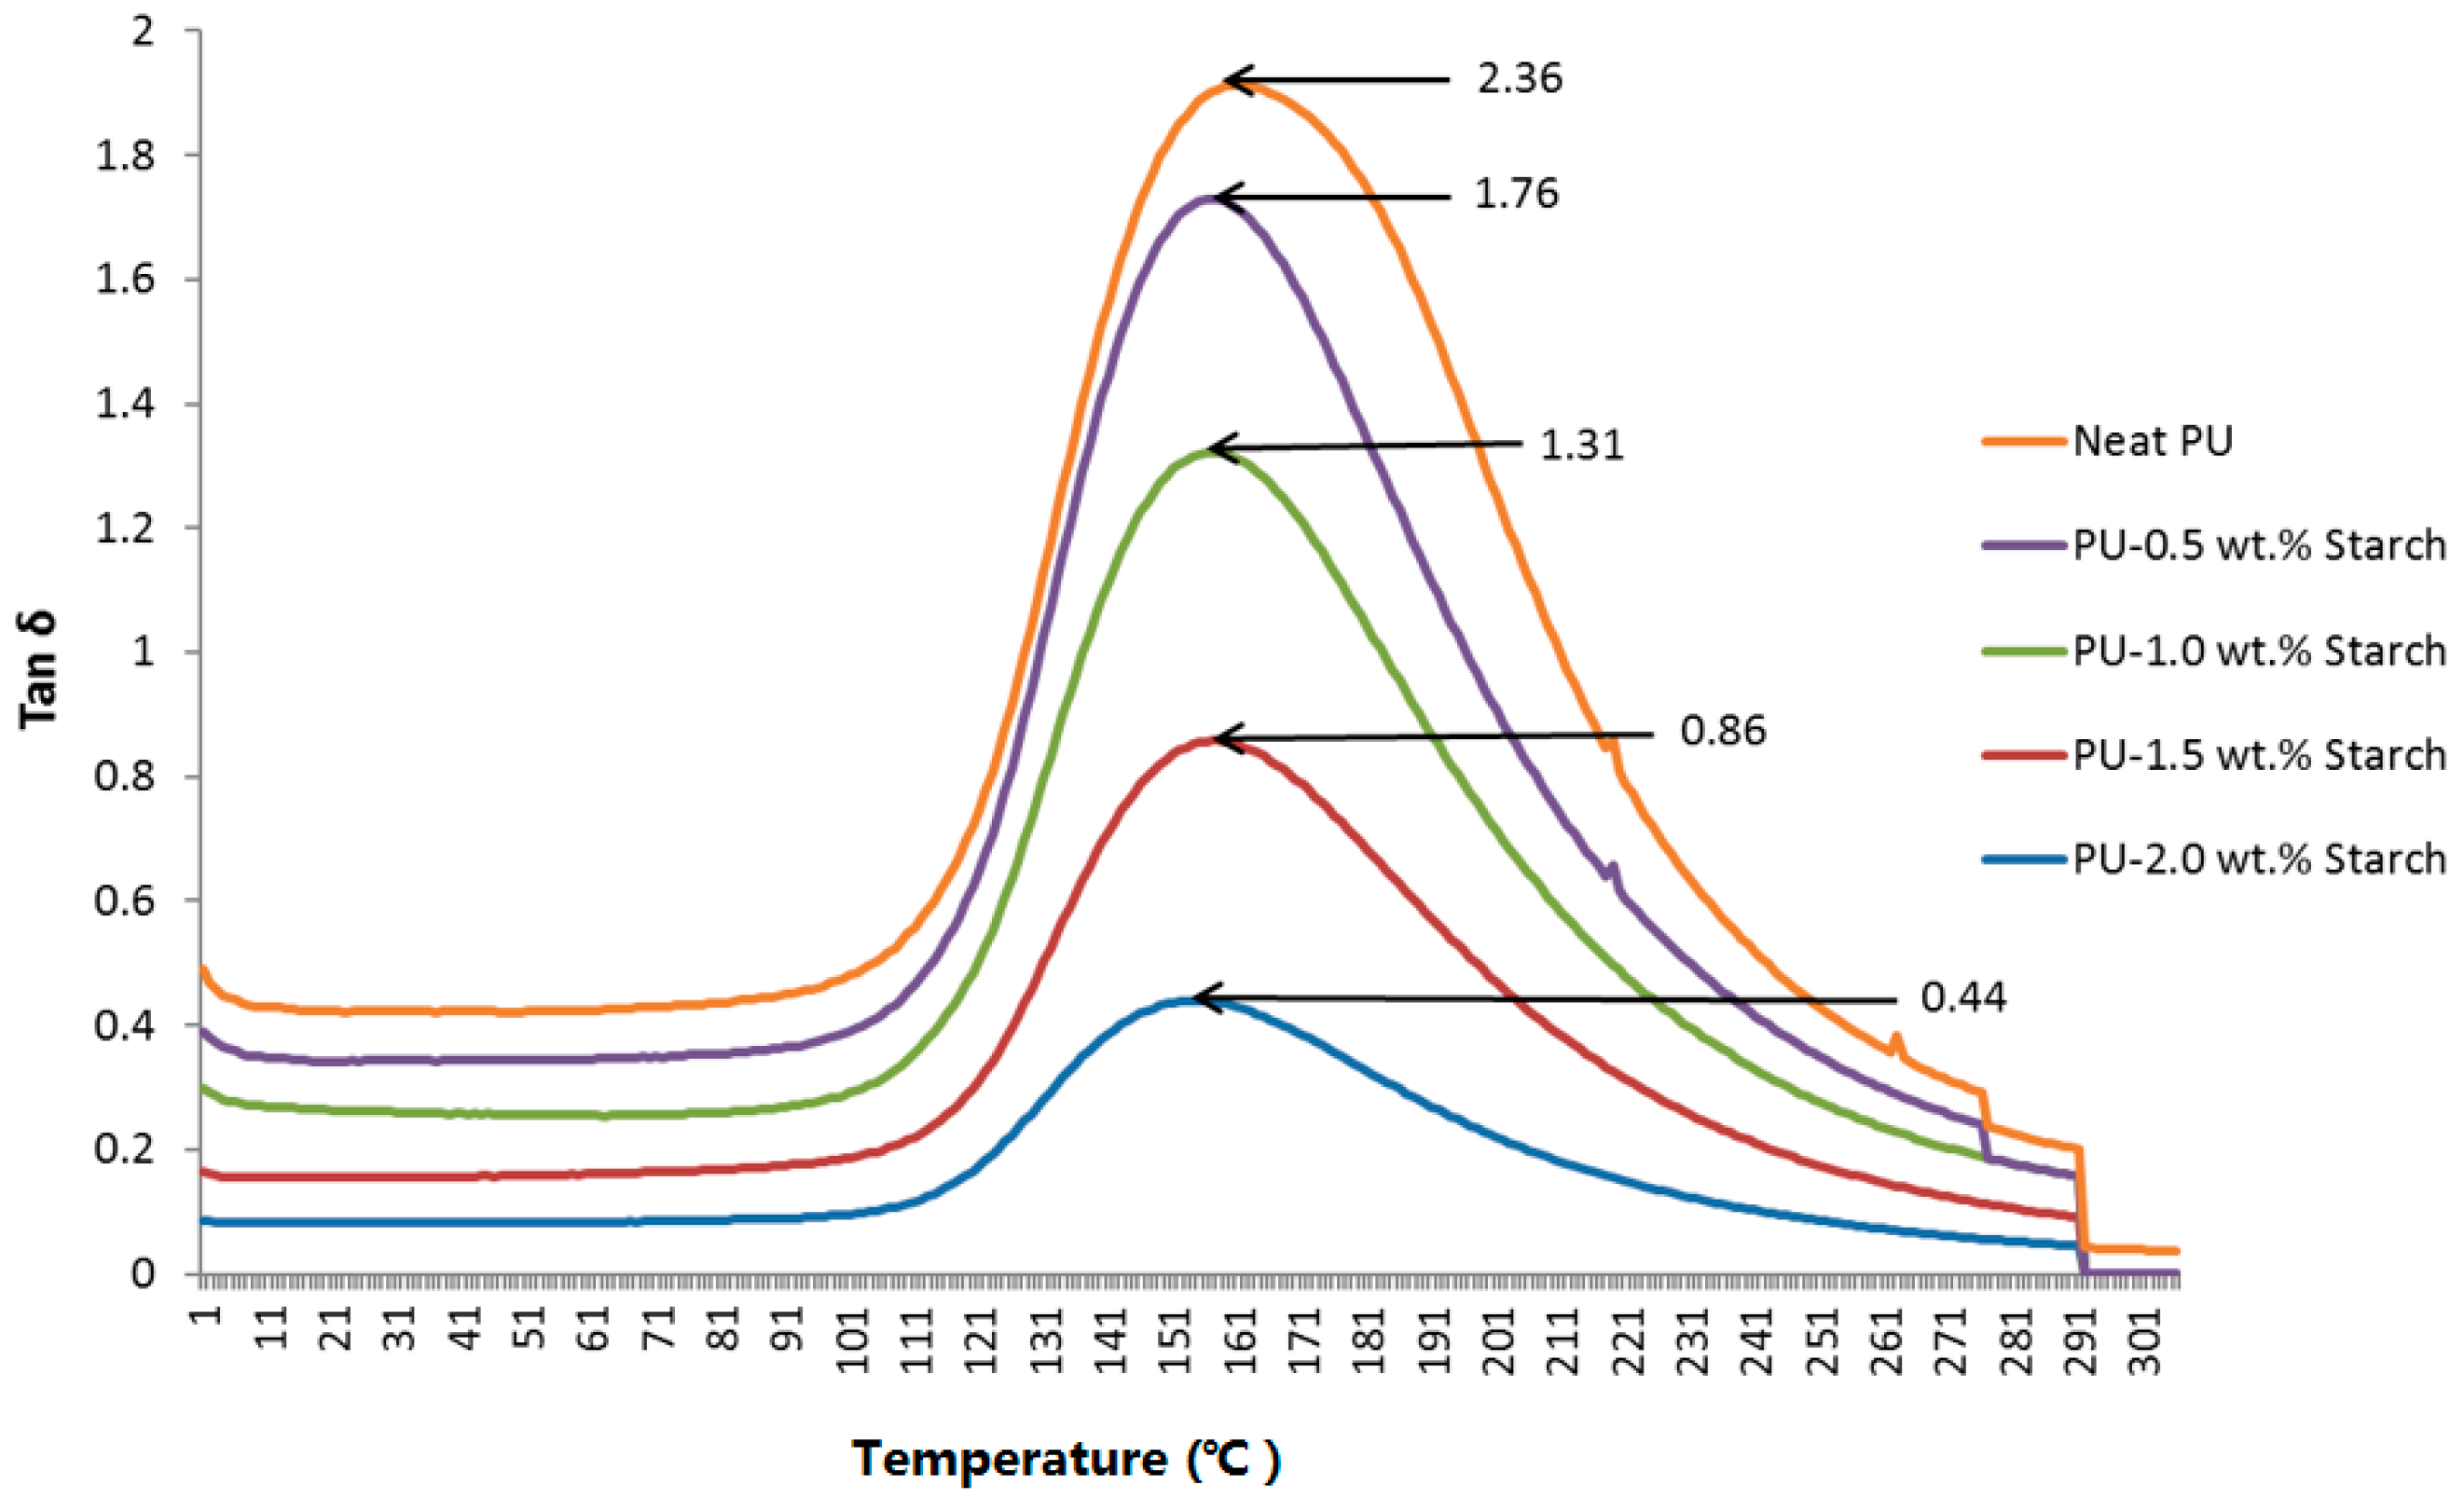
2.6. Dynamic Mechanical Analysis (DMA)
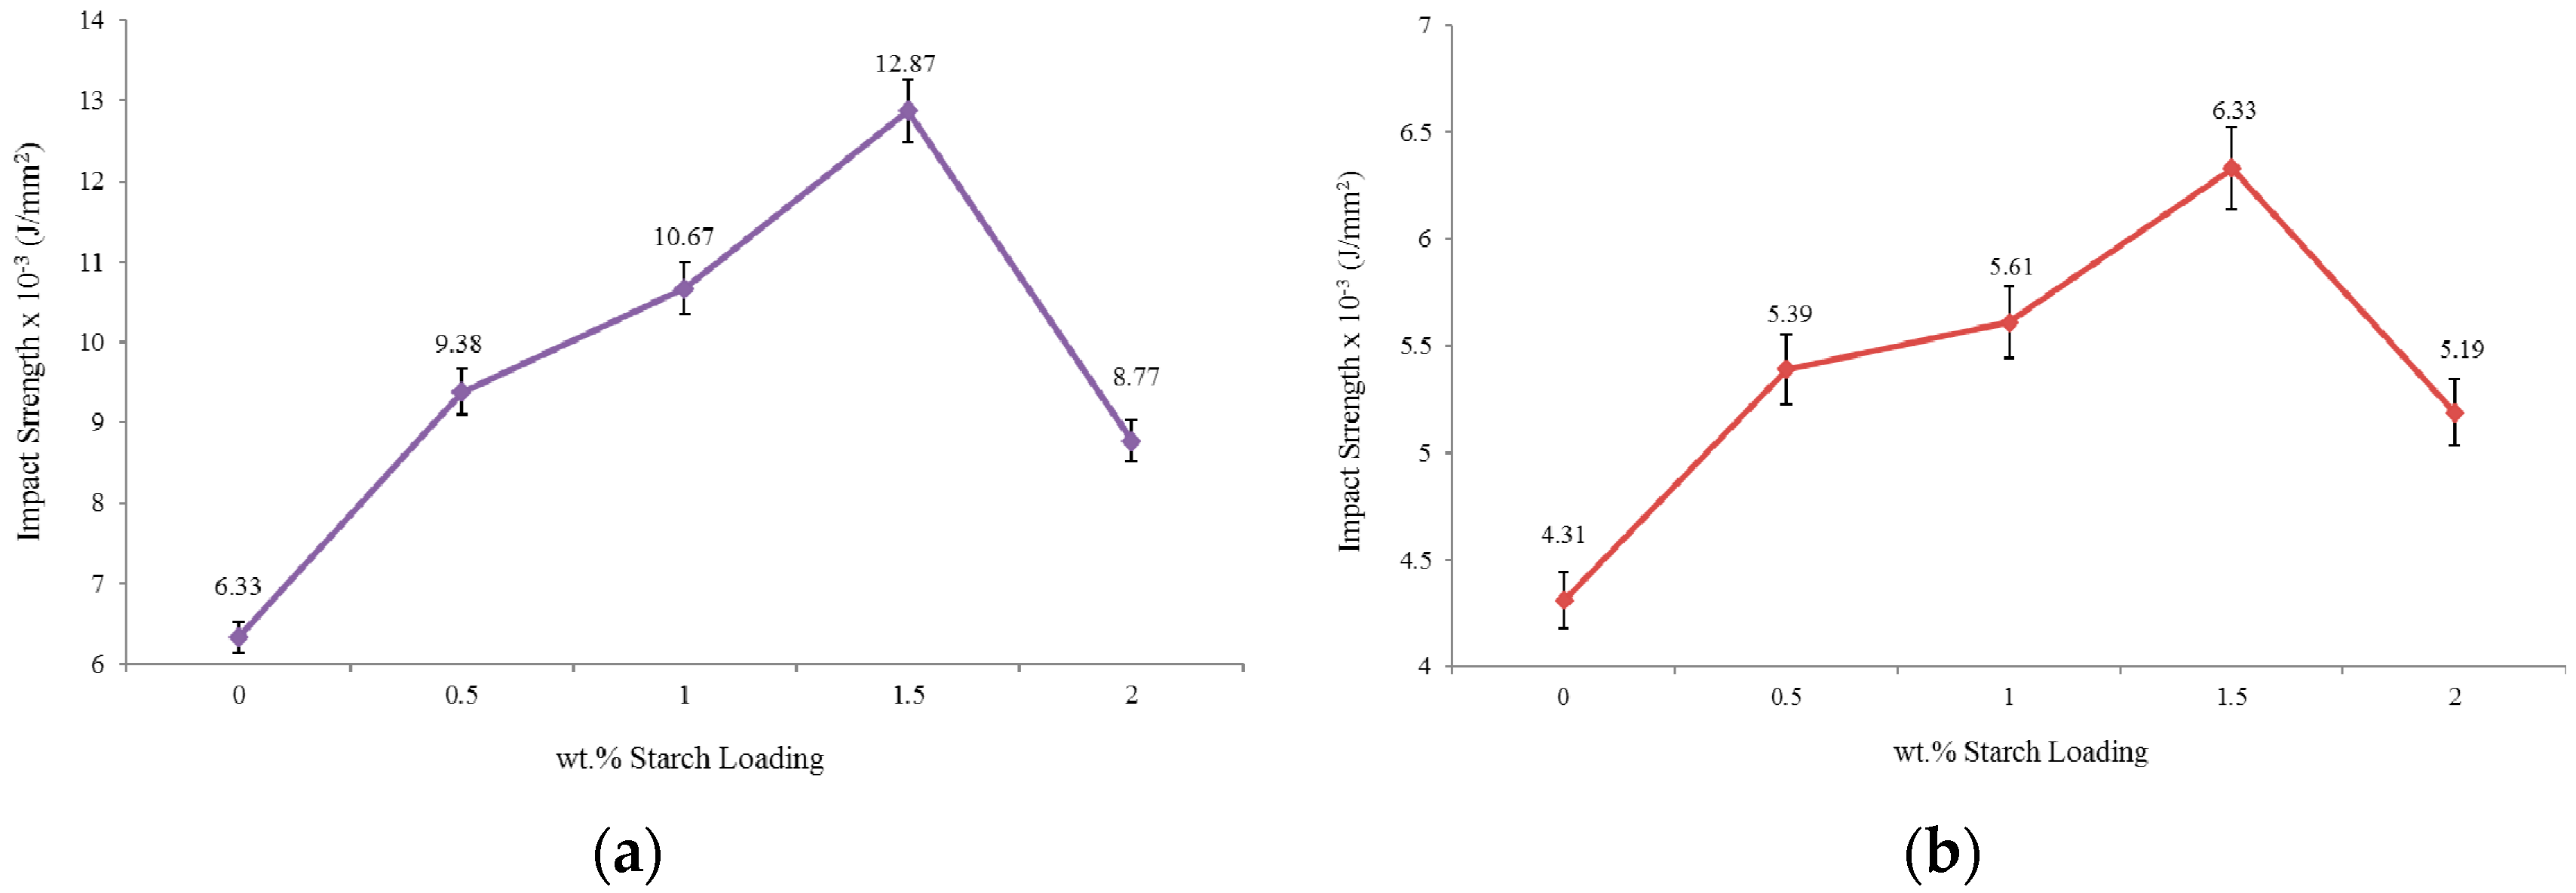
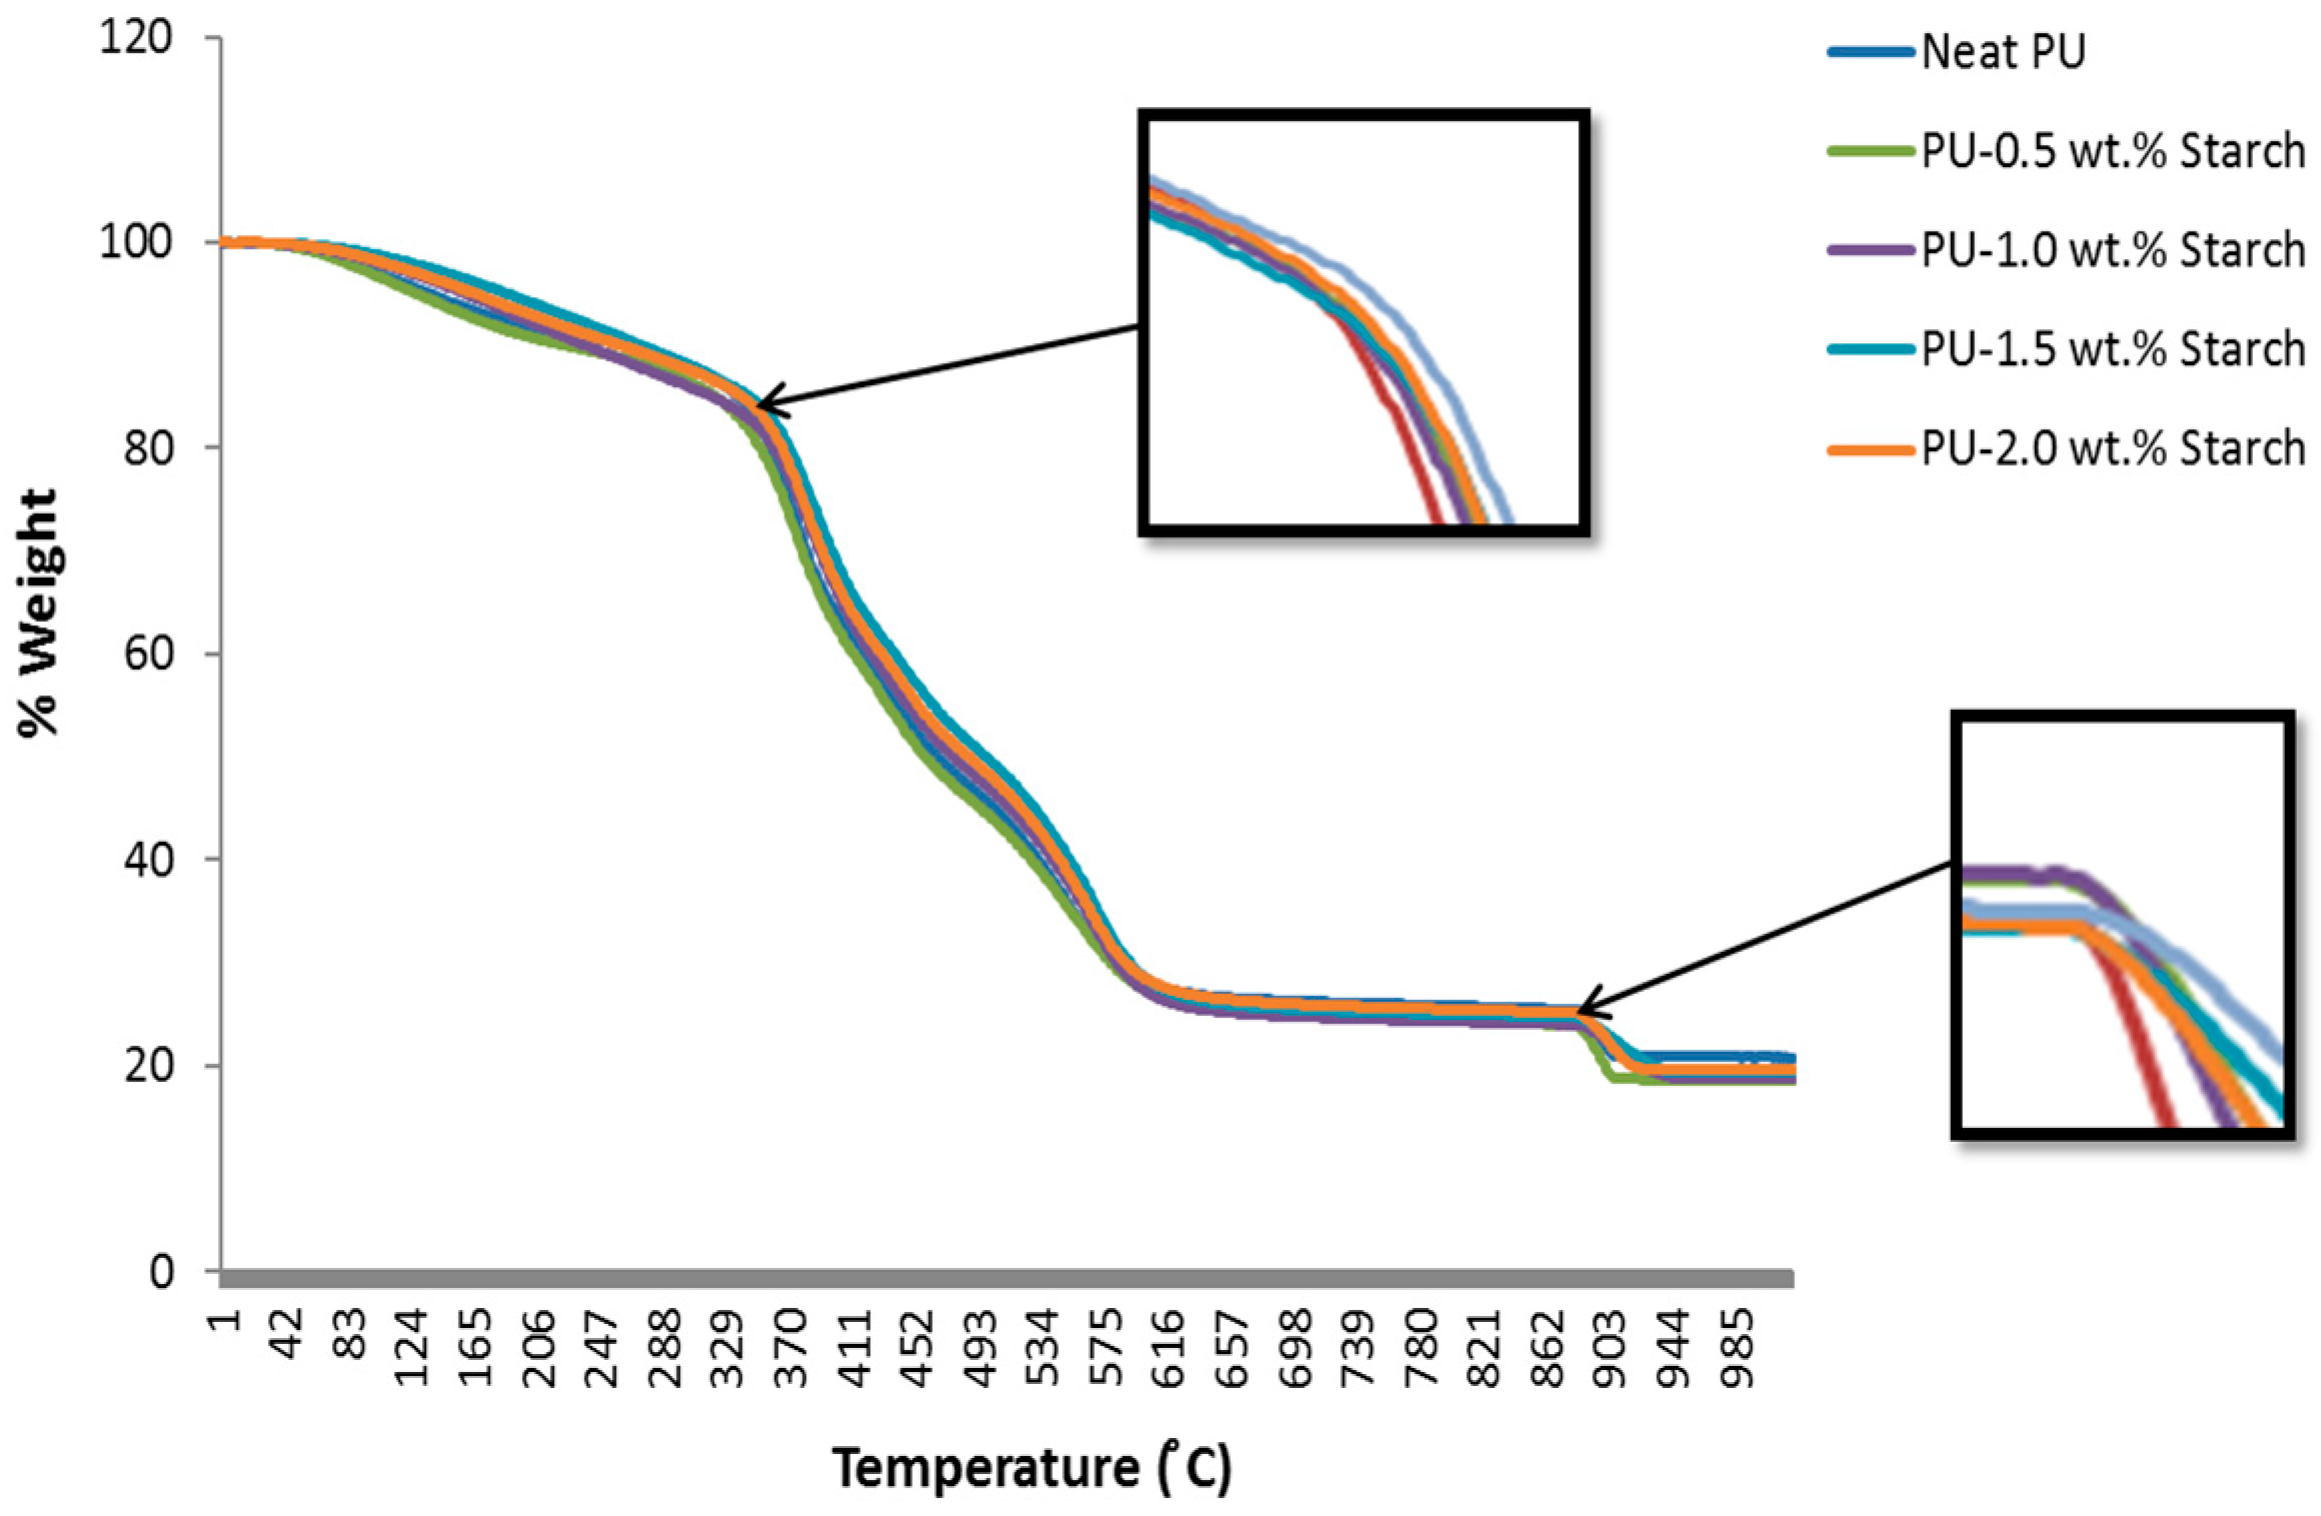
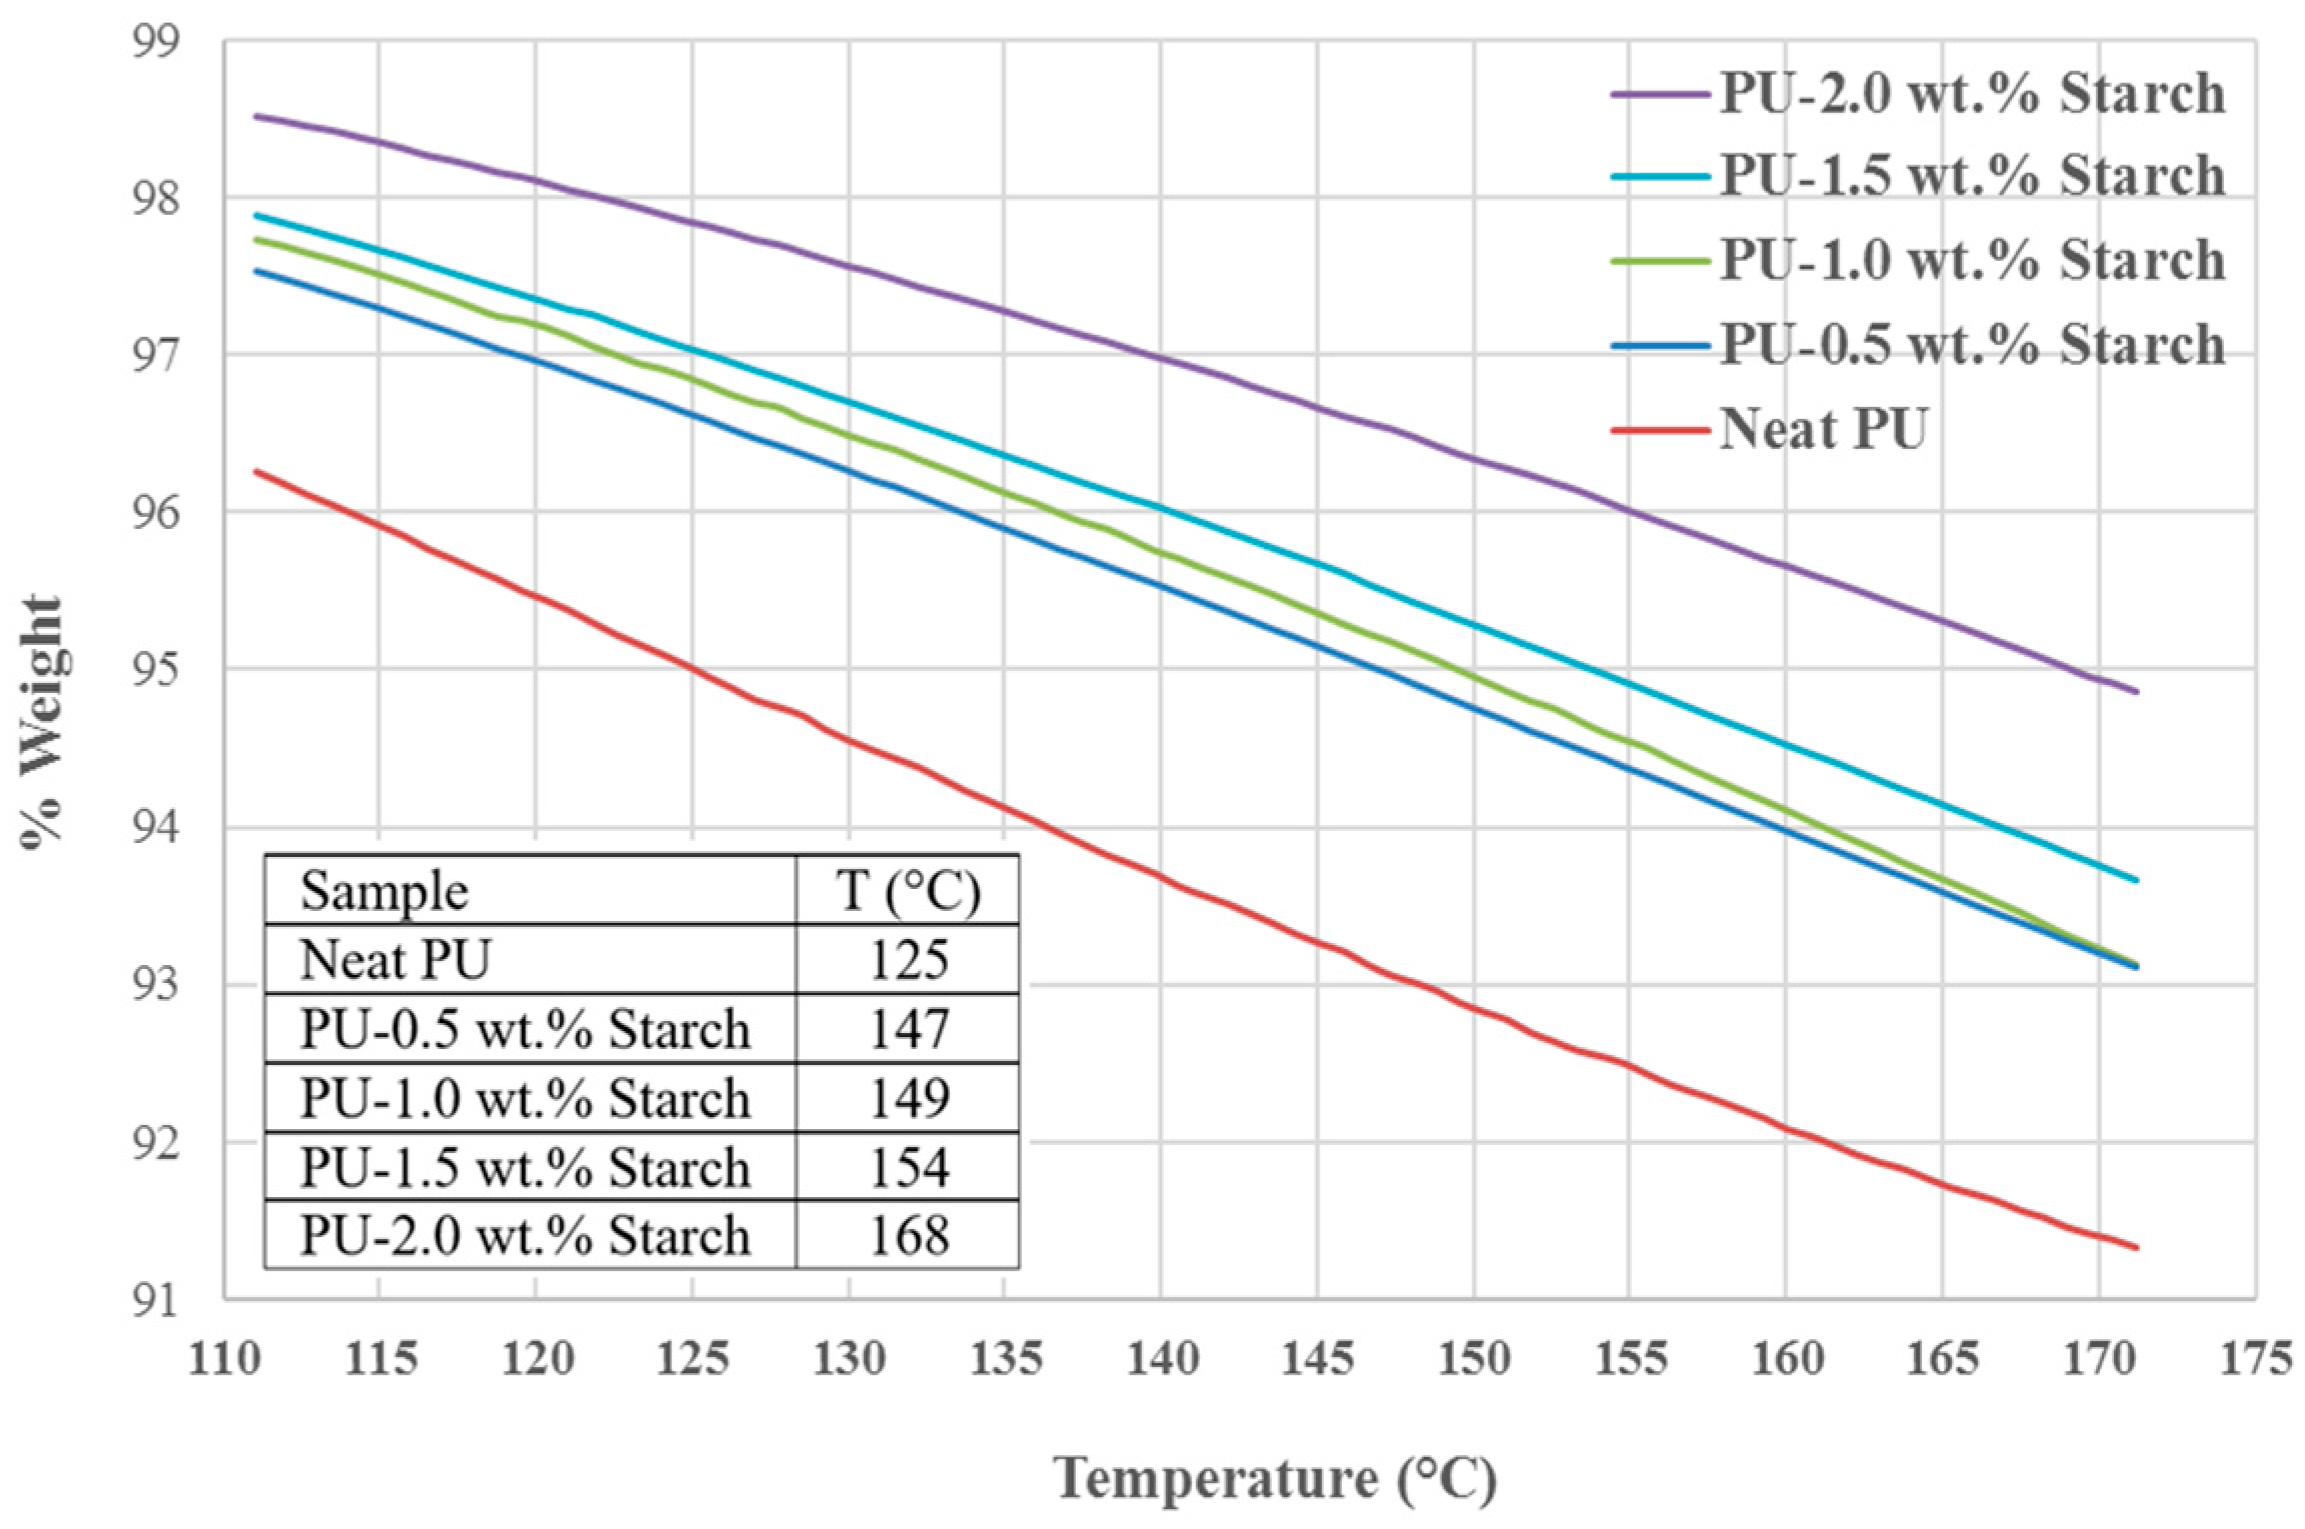
2.7. Thermogravimetric Analysis (TGA)
3. Materials and Methods
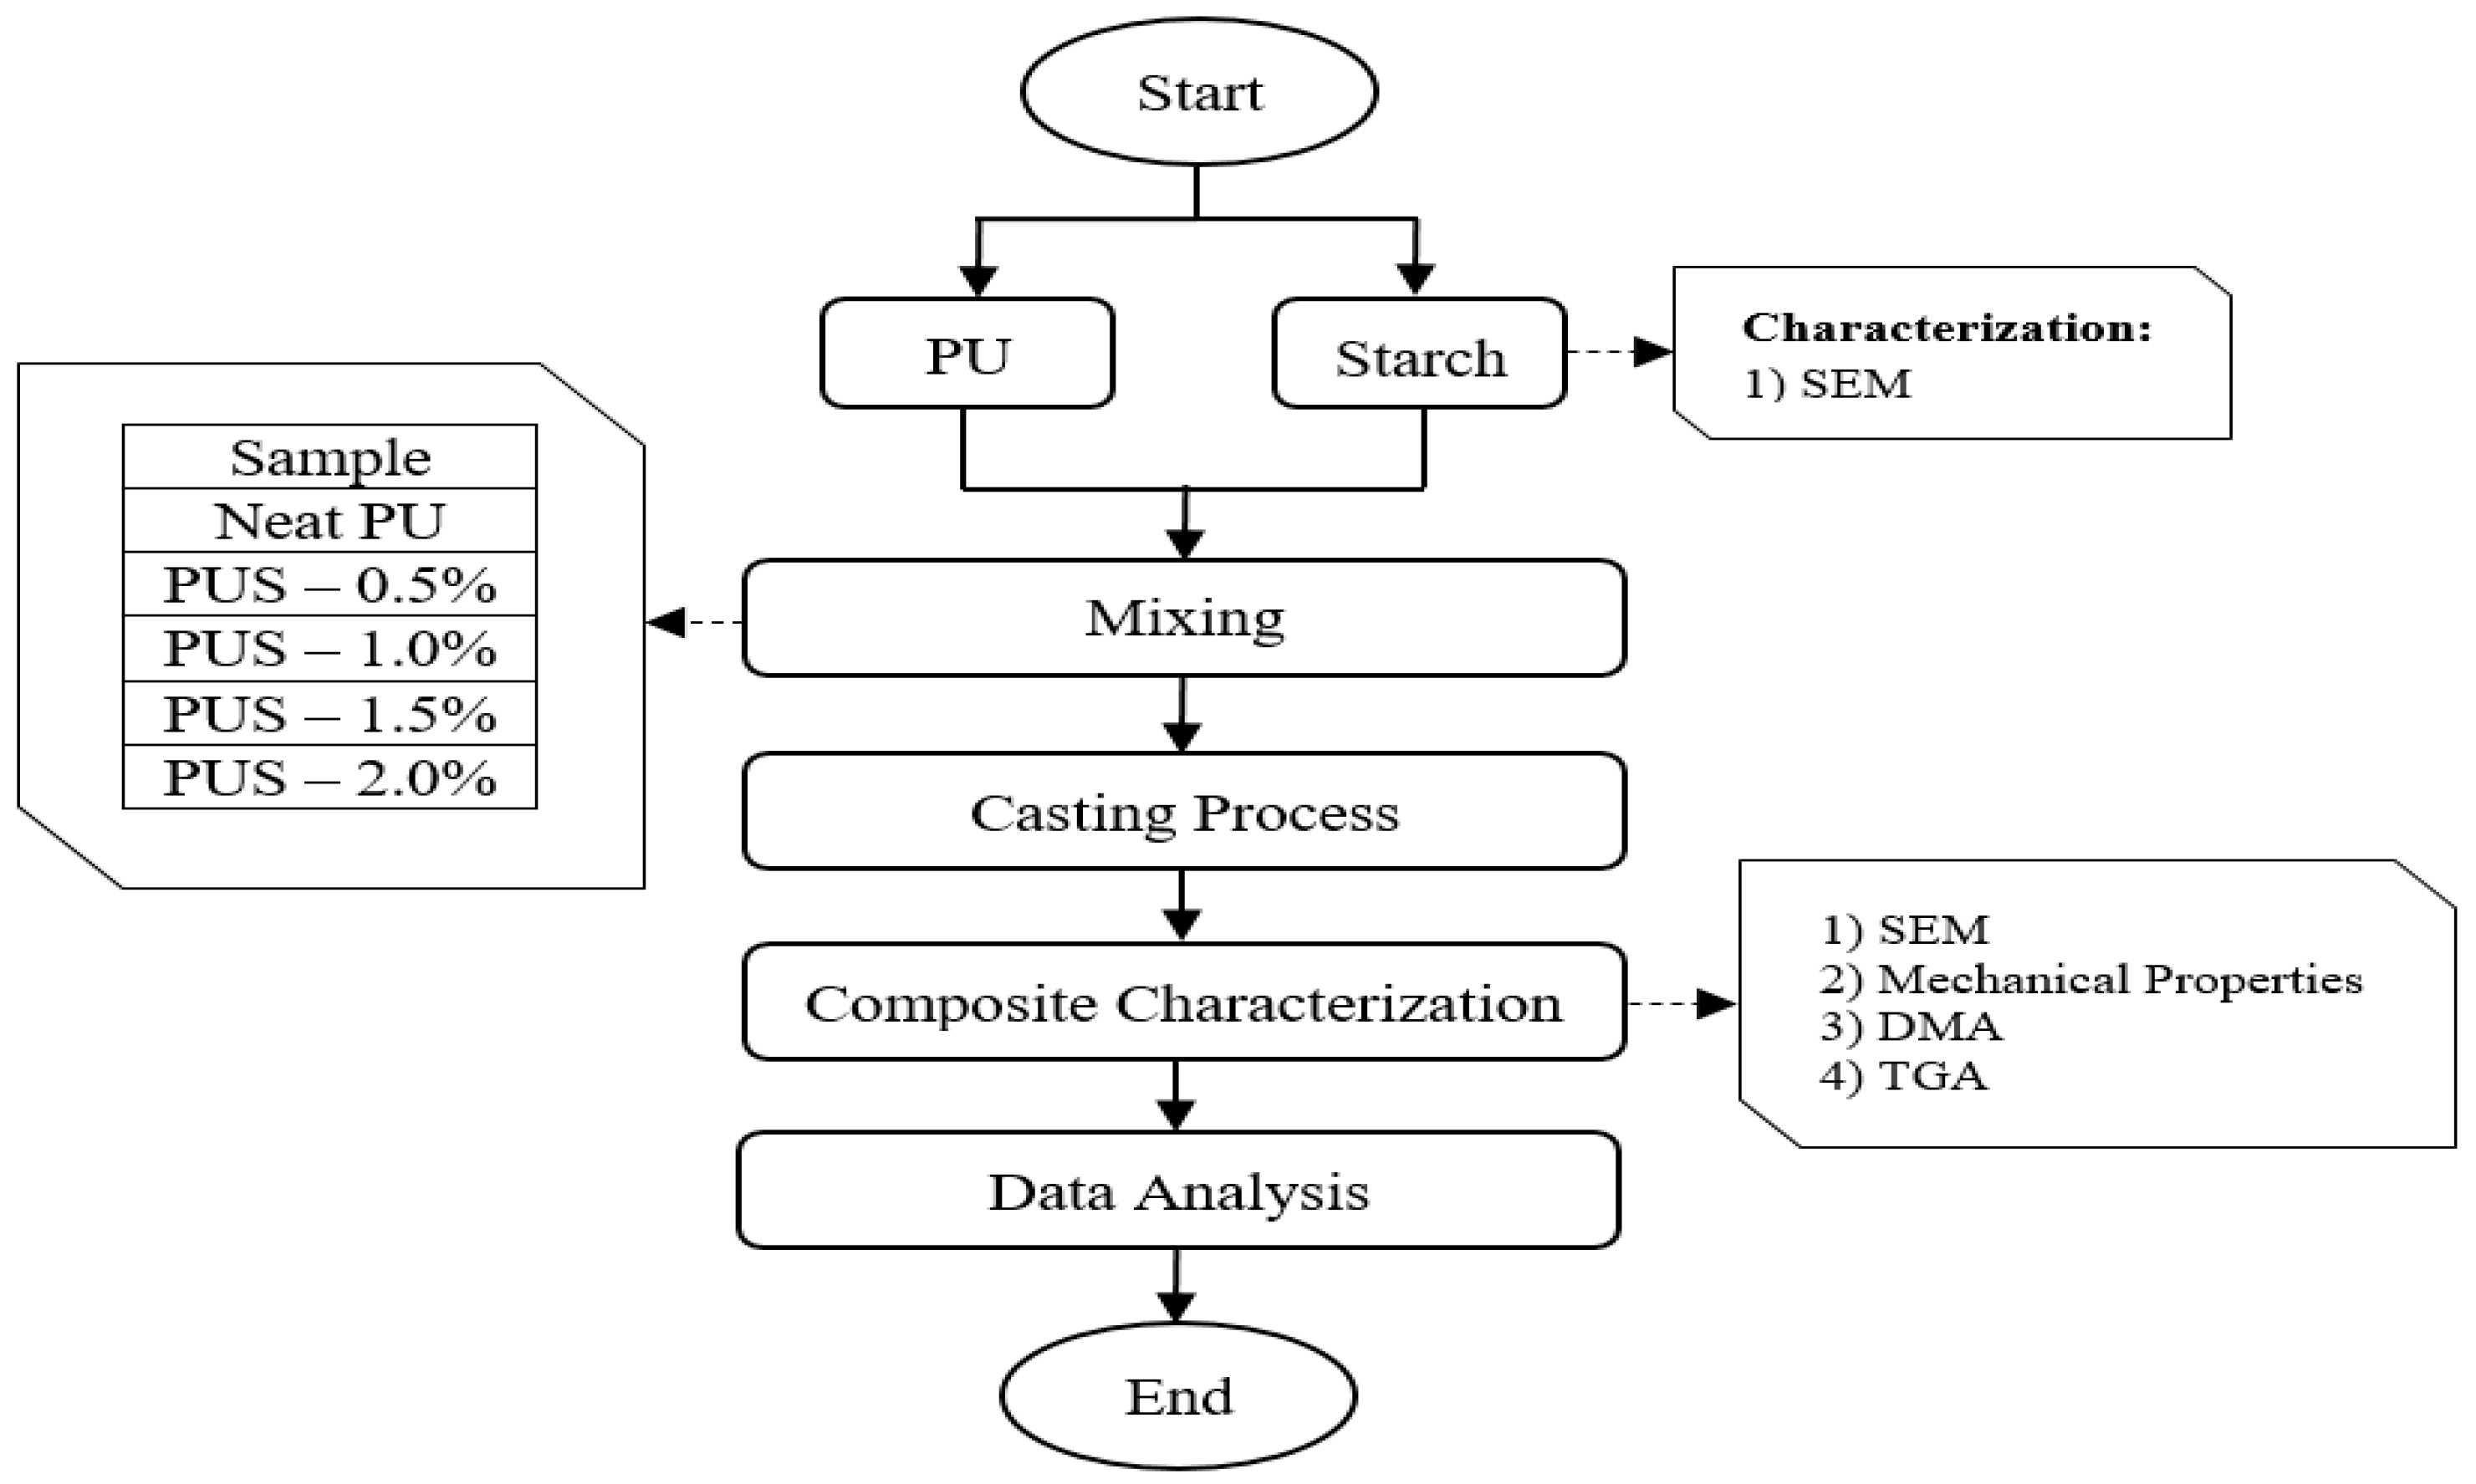
3.1. Sample Preparation and Experimental Set-Up
3.2. Instrumentation
4. Conclusions
Acknowledgments
Author Contributions
Conflicts of Interest
References
- Da Róz, A.; Curvelo, A.; Gandini, A. Preparation and characterization of cross-linked starch polyurethanes. Carbohydr. Polym. 2009, 77, 526–529. [Google Scholar] [CrossRef]
- Fanta, G.; Swanson, C.; Doane, W. Complexing between starch and poly (ethylene-co-acrylic acid)—A comparison of starch varieties and complexing conditions. Carbohydr. Polym. 1992, 17, 51–58. [Google Scholar] [CrossRef]
- Ma, X.-F.; Yu, J.; Wan, J. Urea and ethanolamine as a mixed plasticizer for thermoplastic starch. Carbohydr. Polym. 2006, 64, 267–273. [Google Scholar] [CrossRef]
- Van Soest, J.J.; Hulleman, S.; de Wit, D.; Vliegenthart, J. Crystallinity in starch bioplastics. Ind. Crops Prod. 1996, 5, 11–22. [Google Scholar] [CrossRef]
- Zia, F.; Zia, K.M.; Zuber, M.; Kamal, S.; Aslam, N. Starch based polyurethanes: A critical review updating recent literature. Carbohydr. Polym. 2015, 134, 784–798. [Google Scholar] [CrossRef] [PubMed]
- Chaudhary, A.; Miler, M.; Torley, P.; Sopade, P.; Halley, P. Amylose content and chemical modification effects on the extrusion of thermoplastic starch from maize. Carbohydr. Polym. 2008, 74, 907–913. [Google Scholar] [CrossRef]
- Okoli, C.P.; Adewuyi, G.O.; Zhang, Q.; Diagboya, P.N.; Guo, Q. Mechanism of dialkyl phthalates removal from aqueous solution using γ-cyclodextrin and starch based polyurethane polymer adsorbents. Carbohydr. Polym. 2014, 114, 440–449. [Google Scholar] [CrossRef] [PubMed]
- Nagle, D.J.; Celina, M.; Rintoul, L.; Fredericks, P.M. Infrared microspectroscopic study of the thermo-oxidative degradation of hydroxy-terminated polybutadiene/isophorone diisocyanate polyurethane rubber. Polym. Degrad. Stab. 2007, 92, 1446–1454. [Google Scholar] [CrossRef]
- Xu, Y.; Petrovic, Z.; Das, S.; Wilkes, G.L. Morphology and properties of thermoplastic polyurethanes with dangling chains in ricinoleate-based soft segments. Polymer 2008, 49, 4248–4258. [Google Scholar] [CrossRef]
- Chen, Y.; Liu, Y.; Fan, H.; Li, H.; Shi, B.; Zhou, H.; Peng, B. The polyurethane membranes with temperature sensitivity for water vapor permeation. J. Membr. Sci. 2007, 287, 192–197. [Google Scholar] [CrossRef]
- Yilgor, I.; Yilgor, E.; Guler, I.G.; Ward, T.C.; Wilkes, G.L. FTIR investigation of the influence of diisocyanate symmetry on the morphology development in model segmented polyurethanes. Polymer 2006, 47, 4105–4114. [Google Scholar] [CrossRef]
- Gaaz, T.S.; Sulong, A.B.; Kadhum, A.A.H. Effect of HNTs addition in the injection moulded thermoplastic polyurethane matrix on the mechanical and thermal properties. Sains Malays. 2016, 45, 1235–1242. [Google Scholar]
- Malíková, M.; Rychlý, J.; Matisová-Rychlá, L.; Csomorová, K.; Janigová, I.; Wilde, H.-W. Assessing the progress of degradation in polyurethanes by chemiluminescence. I. Unstabilised polyurethane films. Polym. Degrad. Stab. 2010, 95, 2367–2375. [Google Scholar] [CrossRef]
- Gaaz, T.S.; Sulong, A.B.; Kadhum, A.A.H.; Nassir, M.H.; Al-Amiery, A.A. Optimizing injection molding parameters of different halloysites type-reinforced thermoplastic polyurethane nanocomposites via taguchi complemented with ANOVA. Materials 2016, 9, 947. [Google Scholar] [CrossRef]
- Yıldız, B.; Seydibeyoğlu, M.Ö.; Güner, F.S. Polyurethane–zinc borate composites with high oxidative stability and flame retardancy. Polym. Degrad. Stab. 2009, 94, 1072–1075. [Google Scholar] [CrossRef]
- Marney, D.; Russell, L.; Wu, D.; Nguyen, T.; Cramm, D.; Rigopoulos, N.; Wright, N.; Greaves, M. The suitability of halloysite nanotubes as a fire retardant for nylon 6. Polym. Degrad. Stab. 2008, 93, 1971–1978. [Google Scholar] [CrossRef]
- Gaaz, T.S.; Sulong, A.B.; Akhtar, M.N.; Raza, M.R. Morphology and tensile properties of thermoplastic polyurethane-halloysite nanotube nanocomposites. Int. J. Automot. Mech. Eng. 2015, 12, 2845. [Google Scholar]
- Li, B.; Davidson, J.M.; Guelcher, S.A. The effect of the local delivery of platelet-derived growth factor from reactive two-component polyurethane scaffolds on the healing in rat skin excisional wounds. Biomaterials 2009, 30, 3486–3494. [Google Scholar] [CrossRef] [PubMed]
- Gangadoo, S.; Chapman, J. Emerging biomaterials and strategies for medical applications: A review. Mater. Technol. 2015, 30, B3–B7. [Google Scholar] [CrossRef]
- Gao, F. Advances in Polymer Nanocomposites: Types and Applications; Woodhead Publishing Limited: Cambridge, UK, 2012. [Google Scholar]
- Gaaz, T.S.; Sulong, A.B.; Kadhum, A.A.H.; Nassir, M.H.; Al-Amiery, A.A. Optimizing physio-mechanical properties of halloysite reinforced polyurethane nanocomposites by taguchi approach. Sci. Adv. Mater. 2017, 9, 949–961. [Google Scholar] [CrossRef]
- Tai, N.; Adhikari, R.; Shanks, R.; Adhikari, B. Flexible starch-polyurethane films: Physiochemical characteristics and hydrophobicity. Carbohydr. Polym. 2017, 163, 236–246. [Google Scholar] [CrossRef] [PubMed]
- Duarah, R.; Singh, Y.P.; Mandal, B.B.; Karak, N. Sustainable starch modified polyol based tough, biocompatible, hyperbranched polyurethane with a shape memory attribute. New J. Chem. 2016, 40, 5152–5163. [Google Scholar] [CrossRef]
- Hetflejš, J.; Šabata, S.; Podešva, J.; Kovářová, J.; Prokůpek, L.; Netopilík, M.; Spěváček, J.; Sýkora, J. Novel stabilisers acting simultaneously as molecular-weight regulators in soluble elastomeric polyurethanes. Polym. Degrad. Stab. 2010, 95, 579–586. [Google Scholar] [CrossRef]
- Lecouvet, B.; Sclavons, M.; Bourbigot, S.; Devaux, J.; Bailly, C. Water-assisted extrusion as a novel processing route to prepare polypropylene/halloysite nanotube nanocomposites: Structure and properties. Polymer 2011, 52, 4284–4295. [Google Scholar] [CrossRef]
- Njuguna, J.; Pielichowski, K.; Desai, S. Nanofiller-reinforced polymer nanocomposites. Polym. Adv. Technol. 2008, 19, 947–959. [Google Scholar] [CrossRef]
- Mahfuz, H.; Islam, M.S.; Rangari, V.K.; Saha, M.C.; Jeelani, S. Response of sandwich composites with nanophased cores under flexural loading. Compos. Part B Eng. 2004, 35, 543–550. [Google Scholar] [CrossRef]
- Deng, S.; Zhang, J.; Ye, L.; Wu, J. Toughening epoxies with halloysite nanotubes. Polymer 2008, 49, 5119–5127. [Google Scholar] [CrossRef]
- Fernández-d’Arlas, B.; Khan, U.; Rueda, L.; Martin, L.; Ramos, J.A.; Coleman, J.N.; González, M.L.; Valea, A.; Mondragon, I.; Corcuera, M.A.; et al. Study of the mechanical, electrical and morphological properties of PU/MWCNT composites obtained by two different processing routes. Compos. Sci. Technol. 2012, 72, 235–242. [Google Scholar] [CrossRef]
- Anderson, K.S.; Hillmyer, M.A. The influence of block copolymer microstructure on the toughness of compatibilized polylactide/polyethylene blends. Polymer 2004, 45, 8809–8823. [Google Scholar] [CrossRef]
- Wang, F.; Hickner, M.; Kim, Y.S.; Zawodzinski, T.A.; McGrath, J.E. Direct polymerization of sulfonated poly (arylene ether sulfone) random (statistical) copolymers: Candidates for new proton exchange membranes. J. Membr. Sci. 2002, 197, 231–242. [Google Scholar] [CrossRef]
- Sulong, A.B.; Gaaz, T.S.; Sahari, J. Mechanical and Physical Properties of Injection Molded Halloysite Nanotubes-Thermoplastic Polyurethane Nanocomposites. Procedia Soc. Behav. Sci. 2015, 195, 2748–2752. [Google Scholar] [CrossRef]


| Test | Starch % | 0 | 0.5 | 1.0 | 1.5 | 2.0 | |
|---|---|---|---|---|---|---|---|
| Type of Test | |||||||
| Tensile | Tensile Stress (MPa) | 8.19 | 8.51 | 9.35 | 9.62 | 9.45 | |
| Young’s Modulus (MPa) | 1068.86 | 1185.31 | 1310.69 | 1388.28 | 1262.08 | ||
| Maximum Load (N) | 245.69 | 255.13 | 280.41 | 288.55 | 283.52 | ||
| Elongation at Break (%) | 1.05 | 1.16 | 1.21 | 1.39 | 1.71 | ||
| Flexural | Flexural Stress at Yield (Mpa) | 65.82 | 121.54 | 123.57 | 126.04 | 119.45 | |
| Load at Yield (N) | 39.49 | 72.46 | 73.94 | 75.63 | 74.33 | ||
| Deflection (mm) | 14.32 | 23.85 | 26.17 | 28.35 | 24.27 | ||
| Impact | Impact Strength un-Notched × 10−3 (J/mm2) | 6.33 | 9.38 | 10.67 | 12.87 | 8.77 | |
| Impact Strength Single-Notched × 10−3 (J/mm2) | 4.31 | 5.39 | 5.61 | 6.33 | 5.19 | ||
| Property | PU | Starch |
|---|---|---|
| Chemical Formula | C27H36N2O10 | (C6H10O5)n |
| Chemical Structure | 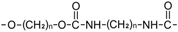 |  |
| Molar Mass (g/mol) | 548.589 | Variable |
| Appearance | Yellow | White |
| Density (g/cm3) | 1.2 | 1.5 |
© 2017 by the authors. Licensee MDPI, Basel, Switzerland. This article is an open access article distributed under the terms and conditions of the Creative Commons Attribution (CC BY) license (http://creativecommons.org/licenses/by/4.0/).
Share and Cite
Gaaz, T.S.; Sulong, A.B.; Ansari, M.N.M.; Kadhum, A.A.H.; Al-Amiery, A.A.; Nassir, M.H. Effect of Starch Loading on the Thermo-Mechanical and Morphological Properties of Polyurethane Composites. Materials 2017, 10, 777. https://doi.org/10.3390/ma10070777
Gaaz TS, Sulong AB, Ansari MNM, Kadhum AAH, Al-Amiery AA, Nassir MH. Effect of Starch Loading on the Thermo-Mechanical and Morphological Properties of Polyurethane Composites. Materials. 2017; 10(7):777. https://doi.org/10.3390/ma10070777
Chicago/Turabian StyleGaaz, Tayser Sumer, Abu Bakar Sulong, M. N. M. Ansari, Abdul Amir H. Kadhum, Ahmed A. Al-Amiery, and Mohamed H. Nassir. 2017. "Effect of Starch Loading on the Thermo-Mechanical and Morphological Properties of Polyurethane Composites" Materials 10, no. 7: 777. https://doi.org/10.3390/ma10070777
APA StyleGaaz, T. S., Sulong, A. B., Ansari, M. N. M., Kadhum, A. A. H., Al-Amiery, A. A., & Nassir, M. H. (2017). Effect of Starch Loading on the Thermo-Mechanical and Morphological Properties of Polyurethane Composites. Materials, 10(7), 777. https://doi.org/10.3390/ma10070777