1. Introduction
Prediction tools have become important for agents participating in electricity markets. Electricity generation companies need to schedule electrical energy production to satisfy the forecasted load. In this sense, demand forecasting plays an important role for electricity power suppliers, because both excess and insufficient energy production may lead to increased costs and a significant reduction of profits. Therefore, it is quite important to obtain forecasts for electricity demand as accurately as possible [
1].
The electricity load time series shows complex characteristics influenced by diverse factors, such as meteorological conditions, seasonal patterns, or socioeconomic factors. As a consequence, the demand presents some peculiarities such as the presence of outliers, that turn the forecasting process into a particularly challenging task.
It is worth highlighting the difference between the forecasting of the occurrence of an outlier and its detection. The detection consists of discovering the outliers in an already known set of values, which is a common goal in robust statistics [
2]. The majority of robust statistical techniques try to obtain a time series model from data once the outliers have been replaced. Thus, these techniques perform a posteriori detection; that is, they determine whether a point is an outlier or not, but once it has already occurred. However, the problem considered here is more difficult, since a prediction of the occurrence of an outlier is made with the goal of electricity companies activating adequate action protocols or using forecasting methods specifically designed for the prediction of the magnitude of outliers once it is known that an outlier is going to occur.
In this work, given a time series of hourly electricity loads up to day
d, the goal is to forecast if an outlier will occur over the 24 h loads for day
. A new methodology based on imbalanced classification [
3] is presented, which, to the best of the authors’ knowledge, has yet to be exploited in outlier forecasting problems.Note that robust statistics techniques will be of utmost importance in order to transform a prediction problem into a classification problem, since the class is built from detected outliers in the dataset.
The remainder of the paper is organized as follows. A review of the most recently published works regarding outlier forecasting in demand time series can be found in
Section 2.
Section 3 introduces the proposed methodology, showing how to transform the outlier occurrence forecasting into a binary classification general scheme. The results obtained for the Spanish electricity demand time series are reported and discussed in
Section 4. Finally,
Section 5 summarizes the main conclusions achieved.
2. Related Work
The problem of a posteriori outliers detection in time series has been widely studied in the literature, and has been addressed by many approaches. This is due to the high impact that the existence of outliers can cause by generating inaccurate models [
4], since they may deeply influence the estimates that classical methods propose [
5].
To deal with this issue, there is a large family of robust statistical methods [
6]. Gelper et al. proposed an adapted version of the classical exponential and Holt–Winters smoothing methodologies, providing them with robustness [
7]. Another version of a robust multivariate exponential smoothing applied to time series can be found in [
8]. Following classical methods, a work that enhanced Auto Regressive Moving Average (ARMA) by adding robustness can be found in [
9], in which the authors succeeded in limiting the effect of outlying data to the time stamp in which they happen.
Robust estimations can be found in electricity prices. In fact, a battery of over 300 models were considered in [
10] to forecast the long-term seasonal component. The authors concluded that those based on wavelet are significantly better in terms of forecasting spot prices for up to a year ahead.
A robust weighted combination load forecasting method based on forecast model filtering and adaptive variable weight determination was proposed in [
11]. In particular, the authors proposed an Immune Algorithm-Particle Swarm Optimization that was applied to Chinese data.
However, this work is concerned with a priori outlier detection or, in other words, with predicting the occurrence of these anomalous values in real time. A method for the prediction of outlier occurrence was proposed in [
12]. In particular, The Pattern Sequence Forecasting (PSF) algorithm [
13] was adapted to deal with spike values in the field of electricity price forecasting. As a case study, the markets of New York, Australia, and the Iberian Peninsula were examined. An early version of this algorithm can be found in [
14].
An approach based on multi-feature wavelet and an Extreme Learning Machine (ELM) algorithm for the forecasting of outlier occurrence in the Chinese stock market was proposed in [
15]. To ensure the universal application of the algorithm, the authors selected two market indexes in Shanghai and Shenzhen, as well as six other individual stocks.
Later in 2016, the outlier occurrence prediction in the stock market was again addressed in [
16]. In this case, the wavelet transform and an adaptive ELM algorithm were used to analyze daily values of the petroleum sector index from Tehran, Iran. The model was compared to several methods, showing some improvement in the results achieved.
3. Methodology
This section describes the proposed methodology for the forecasting of the occurrence of outliers in time series. The first step consists of formulating the outlier prediction problem as a binary classification problem. Later, a classifier is applied to predict the occurrence of outliers. As the number of outliers is usually small, this formulation of the problem generates an imbalanced binary classification problem.
3.1. Formulation of the Problem
The attributes are composed of a window of past values of the time series, and the class can be 1 or 0, depending on whether or not an outlier has occurred in the prediction horizon. Therefore, firstly the labels 1 or 0 have to be constructed for each instance of the dataset.
Figure 1 shows the basic idea behind the proposed methodology. All the steps composing this methodology are described in subsequent sections.
3.1.1. Detecting Outliers
The outliers are detected in the historical data by applying a robust statistical method. In particular, the robust method proposed in Gelper et al. [
7] to detect outliers in time series has been considered. This method carries out a cleansing process of the time series to replace the outliers by a more likely value prior to generation of the time series forecasting model.
Namely, a time series value is replaced, and is therefore considered an outlier, if the difference between the observed value at time
t and its predicted value at time
is too large. Thus, the set of outliers
of a time series is defined by:
where
k typically is set to 2 or 3, depending on if moderate or extreme outliers are considered, respectively. The predicted value
is obtained by a robust exponential smoothing model, and
is a robust estimation of the scale of the
errors. Namely, the prediction and the scale are defined in a recursive way as:
where
is the cleaned value of
given by Equations (
4) and (
5),
ρ is the loss-function defined by Equation (
6), and
λ and
are smoothing parameters between 0 and 1 which have to be determined in the learning phase from a training set.
The
value is an input parameter related to the parameter
k (for example,
for a common value of
[
7]). The initial values used to obtain the prediction and the scale in a recursive way are usually the mean and the standard deviation, respectively, of the first values in the time series.
3.1.2. Labeling the Dataset
Once the set of outliers for the historical data have been discovered, the instances of the dataset must be labeled with their corresponding class. Given an instance composed of
m past values of the time series and a prediction horizon of
h, the label is 1 if an outlier occurs over the
h next values of the time series (in our case,
h). That is, the class
C is defined by:
3.2. Imbalanced Classification
The methodology applied in order to forecast the occurrence of outliers for the twenty-four hours of the next day is described in this section.
Since outliers are anomalous data, an imbalanced classification problem is obtained when the prediction of outliers is formulated as a binary classification problem. Therefore, the class representing the outliers is a minority class, but the class of interest.
The approaches proposed to solve imbalanced classification problems can be split into two differentiated groups: algorithm-based approaches that design specific algorithms to deal with the minority class, and data-based approaches, which apply a preprocessing step to try to balance the classes before applying a learning algorithm [
3]. In this work, a selection of representative methods of the first group are firstly used, and thereafter, the algorithm with the best performance will be combined with different preprocessing methods in order to improve the results of the forecasts.
Table 1 shows both preprocessing and classification techniques that have been analyzed to provide a forecasting of outliers in the electricity demand time series. Due to the good behavior exhibited in oversampling methods [
3], a number of oversampling-based preprocessing techniques greater than those based on undersampling have been tested. All these techniques can be found in the KEEL open source java software project [
17].
4. Results
The above-described methodology has been applied to the electricity demand of the Spanish market [
36].
This section is structured as follows: first, a brief description of the electricity demand time series is included. Second, the usual quality parameters in an imbalanced context are presented. Third, the robust exponential smoothing model is obtained in order to detect outliers, and for this reason, the election of both λ and is discussed here. Finally, the accuracy of the predictions of outliers is validated.
4.1. Dataset
The electricity demand time series from 1 January 2007 to 20 June 2016 has been recorded to carry out the analysis presented in this work. The time series is measured at hourly intervals and is composed of a total of 82,975 samples, which have been split into 49,785 samples for the training set corresponding to the period from 1 January 2007 to 8 September 2012, and 33,190 samples for the test set corresponding to days from 9 September 2012 to 20 June 2016.
4.2. Evaluation Measures
The parameters used to assess the accuracy of the classifiers are introduced in this section. Note that in subsequent equations, true positives () is the number of outliers properly predicted; true negatives () is the number of days that were not properly-predicted outliers; false positives () is the number of days that were not outliers and were predicted as outliers; and false negatives () is the number of outliers which were predicted as common days. Note that the prediction horizon is 24 h, and therefore, the measures of evaluation are defined with respect to a day.
According to these definitions, the sensitivity is the ratio of outliers properly predicted by the classification technique. Its formula is defined as follows:
Another parameter is the specificity, which is the ratio of days that were not properly predicted outliers. The mathematical expression is:
The positive predictive value (
PPV) is the probability of predicting an outlier correctly. Its formula is:
Finally, the negative predictive value (
NPV) is the probability that a point that was not an outlier was properly predicted. Its formula is:
The performance of most classifiers is evaluated with the accuracy or error measures, defined by the proportion of instances correctly or incorrectly classified for both classes. However, these measures do not distinguish between the number of correct labels for each class, which is important in the context of imbalanced classification problems, as the class corresponding to outliers is the class of interest in this kind of problem. For that, measures intending to achieve good quality results for both classes are preferred in order to assess the performance of the imbalanced classification techniques. The following measures have been considered:
F-measure or balanced
F-score (
F) is the harmonic mean of the PPV and sensitivity measures:
The area under the receiver operating characteristic (ROC) curve (
AUC). The ROC curve shows the relation between sensitivity and specificity. That is, trade-offs between benefits (true positives) and costs (false positives).
where
is the false positive rate; that is, the ratio between the number of false positives and the total number of days that are not outliers.
The geometric mean (
GM) of the sensitivity and specificity measures:
Matthew’s Correlation Coefficient (
MCC), proposed in [
37], provides better balance among the four basic metrics
,
,
, and
.
4.3. Training to Detect Outliers
In this section, the learning phase to obtain the robust exponential smoothing model is carried out. Note that this model allows the detection of outliers to label the dataset in order to apply a supervised learning for classification tasks.
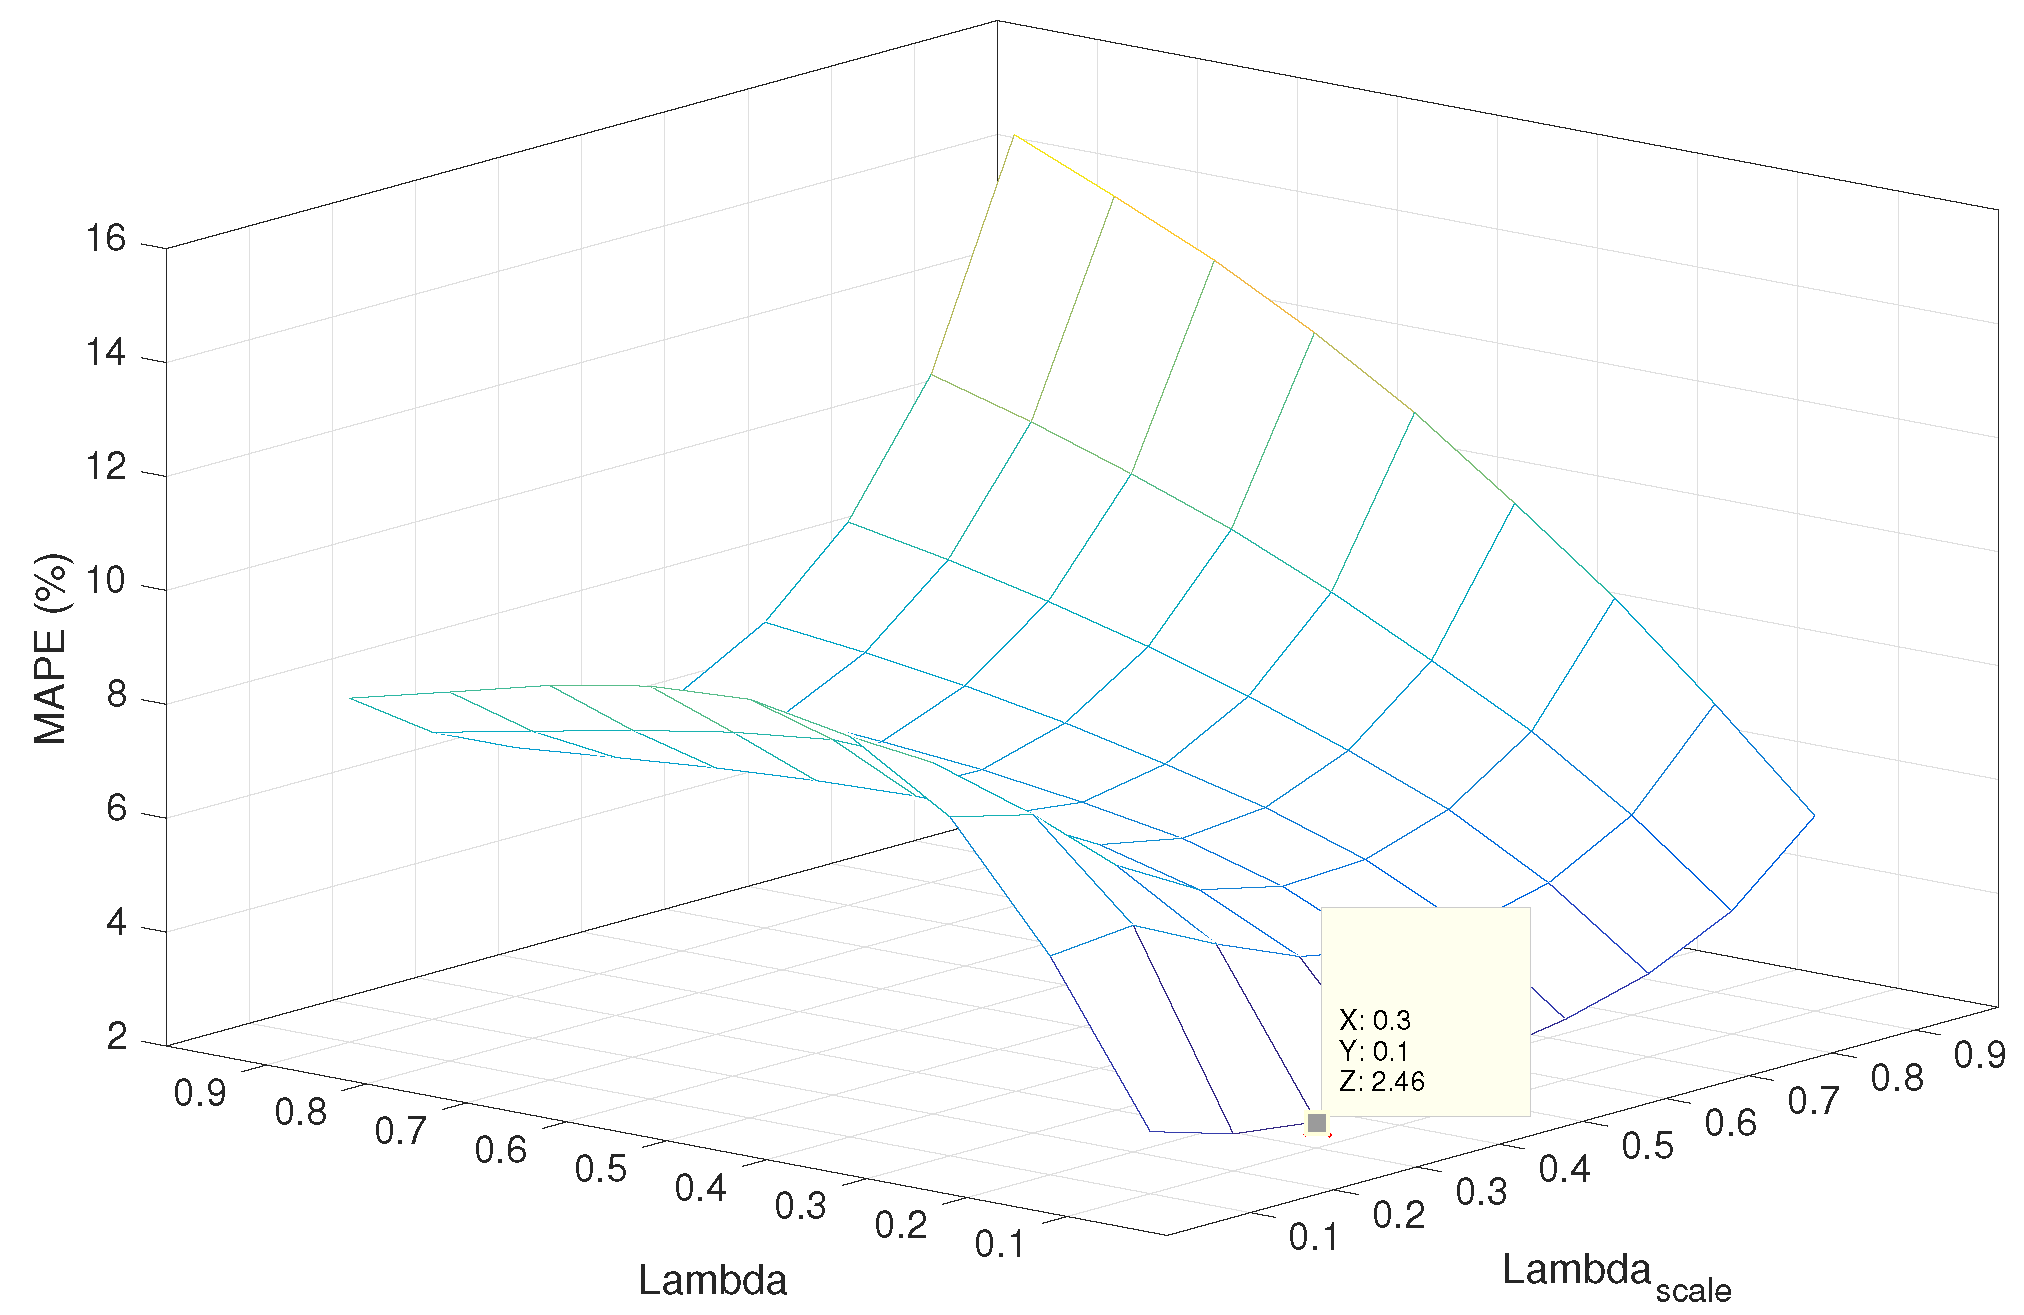
The training consists of computing the parameters of the model,
λ and
, from the historical time series. For this reason, the mean absolute percentage error (MAPE) when predicting the time series with the robust exponential smoothing model has been minimized for
λ and
, varying from
to
by increments of
. The first fifty values of the demand time series have been used as the starting period to compute the initial value
in Equation (
2) and
in Equation (
3).
Figure 2 presents the surface representing the error for the different values of
λ and
. It can be noticed that the minimum error is
and is reached for
and
.
The detection of outliers is made with the resulting model, and a total of 551 outliers were detected. This means a percentage of 15.98% of outliers in the times series, and therefore, the selection of imbalanced techniques to forecast outliers in the electricity demand is justified.
4.4. Outlier Occurrence Forecasting
The results obtained from the application of the classification techniques specified in
Table 1 to the test set are reported in this section. The distribution of outliers for both training and test sets is of 374 outliers (18.08%) and 177 outliers (12.83%), respectively.
Table 2 shows the quality measures for the test set for each classification technique. The control quality parameter is
MCC, since it provides a global measure of all indicators. However,
PPV is also considered, given the nature of the addressed problem. It can be concluded that algorithms Bagging and C-SVMCS achieve the best results, with
MCC around 0.6. Additionally, the best
PPV values are also reached for these algorithms. As for the rest of the parameters, they exhibit satisfactory values with, for instance,
AUC around 0.8, or F-measures slightly inferior to 0.8. As for the rest of the algorithms, their
MCC values range from 0.181 (DataBoost-IM) to 0.462 (AdaBoost), which are not particularly good for
MCC (remember that
, −1 being the worst value, and 1 the best).
For this reason, Bagging and C-SVMCS have been selected as candidate algorithms to reach the best results, and preprocessing algorithms have been applied as an initial step.
Table 3 shows the performance of the Bagging algorithm when all preprocessing algorithms described in
Section 3 are previously applied to the time series in order to balance the two classes. Analogously,
Table 4 summarizes the results of combining the preprocessing algorithms with C-SVMCS.
From the analysis of these two tables, several conclusions can be drawn. First, MCC increases for both algorithms, thus showing that results are better in general terms. The TL preprocessing algorithm increased the MCC value to 0.616 for Bagging, and the SMOTE-ENN algorithm to 0.619 for C-SVMCS. Second, with these algorithms, PPV values are the two best (a bit lower for Bagging, 0.571; and a bit higher for C-SVMCS, 0.558). Third, in general, the values for the F, AUC-ROC, and GM measures have improved, and the values from both sensitivity and specificity remain quite high. This shows that, despite the use of imbalanced classes, the algorithms are able to distinguish between one class and another.
5. Conclusions
This work presents a new methodology for the forecasting of outlier occurrence in time series, with application to the Spanish electricity demand. The main step consists of transforming the problem into an imbalanced classification problem, paying particular attention to how the class is defined, in order to ensure that the prediction of outliers over a prediction horizon of twenty four hours is made. A representative number of classification algorithms specifically designed for imbalanced problems has been tested, showing that the Bagging and C-SVMCS algorithms reach the best results. Later, the results of these algorithms when several preprocessing algorithms are applied have been reported, with the objective of improving the quality measures. In this case, F, AUC-ROC, and GM measures greater than 0.8 and MCC greater than 0.6 have been obtained when the TL and SMOTE-ENN preprocessing techniques were applied. From the results obtained, it can be concluded that the new methodology proposed here provides a satisfactory accuracy. Future work is directed towards predicting not only the days that will present anomalous behavior, but also the magnitude of the outliers. That is, the problem will be formulated as a multiclass imbalanced classification problem, and outliers of different magnitudes will be classified in different classes.
Acknowledgments
The authors would like to thank the Spanish Ministry of Economy and Competitiveness, Junta de Andalucía for the support under projects TIN2014-55894-C2-R and P12-TIC-1728, respectively.
Author Contributions
Alicia Troncoso and Francisco Martínez-Álvarez conceived the paper. Francisco Javier Duque-Pintor and Manuel Jesús carried out the experimentation. All authors contributed to the writing of the paper.
References
- Martínez-Álvarez, F.; Troncoso, A.; Asencio-Cortés, G.; Riquelme, J.C. A survey on data mining techniques applied to energy time series forecasting. Energies 2015, 8, 13162–13193. [Google Scholar] [CrossRef]
- Maronna, R.A.; Martin, R.D.; Yohai, V.J. Robust Statistics: Theory and Methods; Wiley: Hoboken, NJ, USA, 2007. [Google Scholar]
- Galar, M.; Fernández, A.; Barrenechea, E.; Bustince, H.; Herrera, F. A review on ensembles for the class imbalance problem: Bagging-, boosting-, and hybrid-based approaches. IEEE Trans. Syst. Man Cybern. C 2012, 42, 463–484. [Google Scholar] [CrossRef]
- Galeano, P.; Peña, D.; Tsay, R.S. Outlier detection in multivariate time series by projection pursuit. J. Am. Stat. Assoc. 2006, 101, 645–669. [Google Scholar] [CrossRef]
- Carnero, M.A.; Peña, D.P.; Ruiz, E. Effects of outliers on the identification and estimation of GARCH models. J. Time Ser. Anal. 2007, 28, 471–497. [Google Scholar] [CrossRef]
- Rousseeuw, P.J.; Hubert, M. Robust statistics for outlier detection. WIREs Data Min. Knowl. Discov. 2011, 1, 73–79. [Google Scholar] [CrossRef]
- Gelper, S.; Fried, R.; Croux, C. Robust forecasting with exponential and Holt-Winters smoothing. J. Forecast. 2010, 29, 285–300. [Google Scholar] [CrossRef]
- Croux, C.; Gelper, S.; Mahieu, K. Robust exponential smoothing of multivariate time series. Comput. Stat. Data Anal. 2010, 54, 2999–3006. [Google Scholar] [CrossRef]
- Muler, N.; Peña, D.; Yohai, V.J. Robust estimation for ARMA models. Ann. Stat. 2009, 37, 816–840. [Google Scholar] [CrossRef]
- Nowotarski, J.; Tomczyk, J.; Weron, R. Robust estimation and forecasting of the long-term seasonal component of electricity spot prices. Energy Econ. 2013, 39, 13–27. [Google Scholar] [CrossRef] [Green Version]
- Li, L.; Mu, C.; Ding, S.; Wang, Z.; Mo, R.; Song, Y. A robust weighted combination forecasting method based on forecast model filtering and adaptive variable weight determination. Energies 2016, 9, 20. [Google Scholar] [CrossRef]
- Martínez-Álvarez, F.; Troncoso, A.; Riquelme, J.C.; Aguilar-Ruiz, J.S. Discovery of motifs to forecast outlier occurrence in time series. Pattern Recognit. Lett. 2011, 32, 1652–1665. [Google Scholar] [CrossRef]
- Martínez-Álvarez, F.; Troncoso, A.; Riquelme, J.C.; Aguilar-Ruiz, J.S. Energy time series forecasting based on pattern sequence similarity. IEEE Trans. Knowl. Data Eng. 2011, 23, 1230–1243. [Google Scholar] [CrossRef]
- Martínez-Álvarez, F.; Troncoso, A.; Riquelme, J.C. Improving time series forecasting by discovering frequent episodes in sequences. Lect. Notes Comput. Sci. 2009, 5772, 357–368. [Google Scholar]
- Fang, Z.; Zhao, J.; Fei, F.; Wang, Q.; He, X. An approach based on multi-feature wavelet and ELM algorithm for forecasting outlier occurrence in Chinese stock market. J. Theor. Appl. Inf. Technol. 2013, 49, 369–377. [Google Scholar]
- Hosseinioun, N. Forecasting outlier occurrence in stock market time series based on wavelet transform and adaptive ELM algorithm. J. Math. Financ. 2016, 6, 127–133. [Google Scholar] [CrossRef]
- Alcalá-Fernández, J.; Fernández, A.; Luengo, J.; Derrac, J.; García, S.; Sánchez, L.; Herrera, F. Keel data-mining software tool: Data set repository, integration of algorithms and experimental analysis framework. J. Multiple-Valued Logic Soft Comput. 2011, 17, 255–287. [Google Scholar]
- He, H.; Bai, Y.; García, E.A.; Li, S. Adasyn: Adaptive synthetic sampling approach for imbalanced learning. In Proceedings of the International Joint Conference on Neural Networks, Hong Kong, China, 1–8 June 2008; pp. 1322–1328.
- Schapire, R.E. The strength of weak learnability. Mach. Learn. 1990, 5, 197–227. [Google Scholar] [CrossRef]
- Tang, S.; Chen, S. The generation mechanism of synthetic minority class examples. In Proceedings of the Conference on Information Technology and Applications in Biomedicine, Shenzhen, China, 30–31 May 2008; pp. 444–447.
- Freund, Y.; Schapire, R.E. A decision-theoretic generalization of on-line learning and an application to boosting. J. Comput. Syst. Sci. 1997, 55, 119–139. [Google Scholar] [CrossRef]
- Batista, G.; Prati, R.C.; Monard, M.C. A study of the behavior of several methods for balancing machine learning training data. SIGKDD Explor. 2004, 6, 20–29. [Google Scholar] [CrossRef]
- Schapire, R.E.; Singer, Y. Improved boosting algorithms using confidence-rated predictions. Mach. Learn. 1996, 37, 297–336. [Google Scholar] [CrossRef]
- Napierała, K.; Stefanowski, J.; Wilk, S. Learning from imbalanced data in presence of noisy and borderline examples. Lect. Notes Comput. Sci. 2010, 6086, 158–167. [Google Scholar]
- Breiman, L. Bagging predictors. Mach. Learn. 1996, 24, 123–140. [Google Scholar] [CrossRef]
- Chawla, N.V.; Bowyer, K.W.; Hall, L.O.; Kegelmeyer, W.P. SMOTE: Synthetic minority over-sampling technique. J. Artif. Intell. Res. 2002, 16, 321–357. [Google Scholar]
- Liu, X.-Y.; Wu, J.; Zhou, Z.-H. Exploratory undersampling for class-imbalance learning. IEEE Trans. Syst. Man Cybern. B 2009, 39, 539–550. [Google Scholar]
- Ting, K.M. An instance-weighting method to induce cost-sensitive trees. IEEE Trans. Knowl. Data Eng. 2002, 14, 659–665. [Google Scholar] [CrossRef]
- Tang, Y.; Zhang, Y.-Q.; Chawla, N.V.; Krasser, S. SVMs modeling for highly imbalanced classification. IEEE Trans. Syst. Man Cybern. B 2009, 39, 281–288. [Google Scholar] [CrossRef] [PubMed]
- Stefanowski, J.; Wilk, S. Selective pre-processing of imbalanced data for improving classification performance. Lect. Notes Comput. Sci. 2008, 5182, 283–292. [Google Scholar]
- Guo, H.; Viktor, H.L. Learning from imbalanced data sets with boosting and data generation: The DataBoost-IM approach. SIGKDD Explor. 2004, 6, 30–39. [Google Scholar] [CrossRef]
- Hart, P.E. The condensed nearest neighbour rule. IEEE Trans. Inf. Theory 1968, 14, 515–516. [Google Scholar] [CrossRef]
- Barandela, R.; Valdovinos, R.M.; Sánchez, J.S. New applications of ensembles of classifiers. Pattern Anal. Appl. 2003, 6, 245–256. [Google Scholar] [CrossRef]
- Tomek, I. Two modifications of CNN. IEEE Trans. Syst. Man Cybern. B 1976, 6, 769–772. [Google Scholar]
- Wang, S.; Yao, X. Multiclass imbalance problems: Analysis and potential solutions. IEEE Trans. Syst. Man Cybern. B 2012, 42, 1119–1130. [Google Scholar] [CrossRef] [PubMed]
- Spanish Electricity Price Market Operator. Available online: https://demanda.ree.es/movil/ (accessed on 10 July 2016).
- Matthews, B.W. Comparison of the predicted and observed secondary structure of T4 phage lysozyme. Biochim. Biophys. Acta Protein Struct. 1975, 405, 442–451. [Google Scholar] [CrossRef]
© 2016 by the authors; licensee MDPI, Basel, Switzerland. This article is an open access article distributed under the terms and conditions of the Creative Commons Attribution (CC-BY) license (http://creativecommons.org/licenses/by/4.0/).


 and
and 


