Article

Aerosol Black Carbon Emissions from Domestic Biomass Fuel Burning Installations

by
Eugenija Farida Dzenajavičienė
*,
Egidijus Lemanas
and
Nerijus Pedišius
Laboratory of Heat-Equipment Research and Testing, Lithuanian Energy Institute, 44403 Kaunas, Lithuania
*
Author to whom correspondence should be addressed.
Deceased author.
Energies 2026, 19(9), 2164; https://doi.org/10.3390/en19092164
Submission received: 5 March 2026 / Revised: 21 April 2026 / Accepted: 25 April 2026 / Published: 30 April 2026
(This article belongs to the Section B: Energy and Environment)

Abstract

The black carbon (BC) emission resulting from human activity comes mainly from fossil fuels and solid biomass burning, as well as transport fuels due to incomplete combustion. The biggest sources of BC pollution are currently diesel transport and domestic heating appliances burning solid fossil fuels or biomass. Firewood and pellet fuels were used for this BC research. The study used four domestic heating appliances using wood and agricultural waste pellets, as well as several types of firewood. The tests used a gravimetric particulate analysis method to determine the total amount of particulate matter. In further physical and chemical analyses, the emissions are broken down into components, i.e., substances of known composition that can be separated from the sample and weighed. In our study, the BC emissions varied from 0 to 120 mg/MJ depending on the type of boiler (automatic or manual), the combustion mode (based on oxygen supply), and the type of fuel. Emissions varied from 0–8 mg/MJ in a modern pellet-fired and automatically-controlled boiler, and from 1–25 mg/MJ in a wood-fired water heating boiler, with the highest emissions found for softwood (spruce). In the pellet stove with automatic feeding and control, BC emissions varied between 1 and 120 mg/MJ, with the highest emissions detected for wood pellets, and in the wood-burning fireplace, the emissions varied between 6 and 80 mg/MJ, with the highest emissions detected for birch firewood.

1. Introduction

Black carbon is one of the pollutants, mostly found as a fraction of particulate matter PM2.5 (solid particles and liquid droplets), which is formed when solid biomass or fossil fuels are incompletely and inefficiently burned. In principle, the process of BC formation generates higher emissions of all pollutants, especially carbon monoxide (CO) and various volatile organic compounds (VOCs).
According to the Climate & Clean Air Coalition to Reduce Short-lived Climate Pollutants [1], BC has a significant impact on climate change and agricultural productivity, accelerates the melting of ice, and harms human health. BC has up to 1500 times greater impact on global warming compared to the same amount of CO2. The main BC emissions sectors globally are household energy (43.4%), transport (25.5%), industry (12.7%), agriculture (5.2%), waste (5.1%), fossil fuel operation (2.9%), and other sectors (0.6%) [2]. The main primary sources of BC are diesel engines, heating appliances, domestic stoves, and forest fires. Due to these factors, the amount of BC produced is increasing and may have an even greater negative impact on climate change [3].
In 2022, about 5.33 million tonnes of BC emissions were emitted globally, and the largest share comes from the use of biomass, mainly in residential and commercial sectors. Ten percent of the world’s population is responsible for more than half of all carbon emissions: China—131,475 kilotonnes (22%), India—71,113 kilotonnes (11.9%), the United States—70,786 kilotonnes (11.8%), Russia—27,283 kilotonnes (4.6%), and the UK—25,798 kilotonnes (4.3%) [4].
Regardless of the differences between continents or individual countries, BC emissions are growing globally. The global inventory [5] covered 73 detailed sources during the period from 1960 to 2017. The estimated annual emissions appeared to be 32% higher than the average of several previous inventories due to interaction between population growth, increasing energy consumption, growth in the number of vehicles, and the continued use of inefficient residential stoves.
Research indicates that BC emissions vary widely by region and have far-reaching consequences. Studies of BC in ice cores in the Northern Hemisphere, which is influenced by North America, the UK, Russia, and Northern Europe [6], as well as studies from the Southern Hemisphere in Antarctica [7], where influences come from Africa, South America, and Australia, show that BC from fossil fuel and biomass burning darkens snow and makes it melt faster. The BC footprint in Antarctica from research and tourism has likely increased as the population of the continent has grown in recent decades [8].
Moreover, BC emissions also have an impact on the marine environment, as BC emissions over the fall season preceding the boreal winter are positively correlated with El Niño indices. El Niño can increase biomass burning emissions by enhancing dry air conditions: a tenfold increase in BC emissions substantially warms the atmosphere and enhances the motion of ascending air above the BC layer, leading to changes in the atmospheric circulation over the western Pacific [9].
Results from studies in China showed the regions with the largest BC concentration centres in the country. Since the beginning of the century, the average rate in the decline of BC concentration across China was 0.36 μg/m3/year (p < 0.001). Studies of BC emissions in the Indo-Gangetic Plain in India have shown that advanced models are needed to clearly characterise the microphysics of BC, and to show the impact of biofuel combustion on local air quality and the increase in light absorption by BC [10,11].
Later investigations disclosed the effects of open biomass burning, which caused a 20-year global warming of ~0.4 K [12]. Emissions, including BC, were calculated using the ECLIPSE project data, and results were displayed for 25 global regions. Though regional changes in BC were not as dramatic as for particulate matter (PM) for continents such as Asia and Africa, the increase in global BC emissions is due to new sources, such as residential combustion and industrial processes [13]. Furthermore, the growth of the human population and the development of cities lead to increasing air pollution, which has a significant impact on human health. Unfortunately, the sources of pollutants are not properly controlled. The concentration of emissions constantly exceeds the norms recommended by the World Health Organization, and the seasonal changes in the concentration of emissions or composition of particles are small. The greatest influence on the amount of solid particles is caused by organic substances (49 ± 7%) and water-soluble inorganic ions [14].
Globally, the amount of biomass burned by humanity has been steadily increasing, except in some countries, such as China, where residential biofuel consumption, one of the major biomass-using sectors, has been decreasing over time. Primary emissions of PM2.5, BC, and organic carbon (OC) from biomass combustion are estimated to be about 51, 4.6, and 29 Tg, respectively, accounting for almost 70%, 55%, and 90% of total global emissions from all sources. It should be noted that emissions from domestic residential heating appliances are the main sources of such emissions [15]. BC was identified as a significant driver of Arctic warming as well. The introduction of mitigation technologies could reduce warming, both within the Arctic and globally [16].
Central Europe reported a significant reduction in BC emissions during the 2020 COVID lockdown. Across Europe, BC emissions were on average around 23 kt lower than in the previous 5-year period (2015–2019), which highlights a significant reduction due to the stagnation caused by the pandemic. Based on BC measurements in similar regions, the reduction since 2015 was similar to that of each previous year [17]. In total, in the EU 27 countries in 2022, BC emissions amounted to 181,000 metric tons, which is 6.2% less than in 2021. Since 2000, BC emissions in these countries have decreased by 47% [18].
The impact of pollution emissions on ambient air quality from both intentional and unintentional burning (like forest fires) of biomass in various sectors and the impact of such polluted air on human health are widely discussed [15]. The main impacts of particle matter from burning, including BC, as defined in research by British and Chinese investigations, are linked to asthma, lung cancer, respiratory and cardiovascular diseases, infant mortality, and low birth weight [19,20]. Other studies have suggested links between long-term BC exposure and neurological effects, including impaired cognitive development in children, as well as perinatal health [21]. Because of the small particle size, BC can penetrate very deeply into the respiratory tract and enter the bloodstream. There is no threshold below which exposure to particles does not cause hazardous effects [22,23].
The BC emission inventory reports currently being prepared and submitted are not controlled and rigorously reviewed like other mandatory monitored emissions. Therefore, the EU’s decision to make BC reporting mandatory rather than voluntary would be a step in the right direction towards creating a legal basis for reporting [16]. Thus, the issue of estimating and measuring BC emissions becomes very important and requires defining reliable assessment methods. The EMEP/EEA Guidebook [24] mostly recommends that BC emissions be calculated as a percentage of particulate matter emissions. It also assumes that elemental carbon and BC are the same. Generally, although not always, BC factors are given as a dimensionless proportion of PM2.5 emissions rather than an emission factor per se.
BC emissions are evaluated using various methods. The contribution of wood burning (along with fossil fuels) to BC concentrations was quantified in Athens, Greece, using the aethalometer model, and results show that BC emissions increased by 30% during the coldest months of the winter period [25]. Detailed inventories of BC in New Zealand were made via modelling and defined as higher than 10 μg m−3 compared to BC concentrations in London, which were 0.17–0.33 μg m−3. Modelling also shows that a 14-fold increase in wood fuel consumption for heating accounts for 40–55% growth of BC emissions in the UK over 40 years [26].
Measurements of the optical properties of BC particles from different sources (fossil fuel versus biomass burning) in different regions are also important to better constrain their radiative forcing and avoid absorption enhancement due to lensing [27]. The impact of organic carbon (OC), including BC aerosols, on atmospheric light absorption can be assessed via quantification of these components in the emissions, while they were measured under controlled conditions to quantify optical properties from a single source. The absorption intensity of carbon emissions was much lower (less than 4.2 times) at 660 nm compared to 175 times at 370 nm [28].
Similar measurements of organic and BC mass concentrations were also performed in Lithuania‘s environment. The highest hourly BC aerosol mass concentration in urban background environments (17.23 μg·m−3) was over seven times higher compared to the mean BC concentration (2.34 μg·m−3) and even over 20 times higher compared to coastal/marine and rural sites (0.84 and 0.77 μg·m−3) [29]. A seven-channel aethalometer was used to assess seasonal variations of BC aerosols at a marine/coastal location, which showed over two times higher concentrations during the cold period from October–April compared to the warm May–September period (835 ng m−3 to 362 ng m−3) [30].
Fine particle and BC emission estimates for several selected countries as well as in EU 27 were presented in the Danish study [31], which shows the predicted estimated growth of BC emissions from 56% (152,290 tonnes) in residential burning in 2015 to 69% (111,380 tonnes) in 2030 on average in EU 27, though total values tend to decrease due to transfer to renewables.
The technologies that can reduce global BC emissions are available today. In contrast to other pollutants, the EMEP/EEA Guidebook mostly recommends that BC emissions be calculated as a percentage of particulate matter emissions [24].
A non-destructive and rapid optical method is used to distinguish end-member standards for BC and was found to be very sensitive for estimating airborne levels of BC. Similar results can also be obtained using the thermal-optical analysis method [32]. The EURAMET Study [33] provides an overview of existing methods and available instruments for aerosol absorption measurements, where filter-based methods dominate, although they have their drawbacks.
Research in China [32] used an integrated framework combining satellite observations from the Ozone Monitoring Instrument (OMI), an extreme gradient boosting (XGBoost) algorithm that shows the spatiotemporal evolution of BC emissions and the associated premature mortality in China over 20 years based on a “top-down” inversion approach, and an exposure–response model.
Numerical experiments by switching and replacing inventories are used to estimate the impacts of biomass burning emission inventories on atmospheric CO2 concentration simulations, based on the global chemical transport model GEOS-Chem. The results showed an increase in the concentration of global carbon emissions of 2.4 ppm annually. This study furthered the understanding of the critical role of biomass burning in atmospheric CO2 [34].
Multi-source spaceborne data were integrated to estimate carbon emissions from forest fires. A hierarchy model was proposed to estimate biomass and carbon emissions. ICESat-2 strong beams are superior in biomass estimation compared with weak beams [35].
Emissions from residential combustion come from small stationary combustion installations for heating and cooking by residential consumers, which may be differentiated from non-residential combustion emissions based on the heating capacity of the individual combustion appliances—residential appliances are typically considered to be <50 kWth [16].
For our investigation, we need to estimate BC emissions directly from the flue gas channel of individual biomass boilers. An investigation of particle matter and BC emissions from individual heating installations of various quality and using different biomass fuels was performed in Switzerland, showing the positive impact of selective targeting of specific appliance classes on emissions. BC emissions appeared to be sensitive to hardwood/softwood mix [36]. Another investigation was performed by Finnish scientists, which disclosed that residential wood combustion is the biggest source of particle matter and BC emissions in Finland, where BC accounts for 55% of the respective national BC emissions. The investigation was performed using the model with coherent calculation for multiple pollutants from anthropogenic emission sources [37].
It was defined that there are no generally accepted methods to measure BC in atmospheric aerosol. Different methods are sensitive to aerosol size distribution and chemical composition. Methods generally correlate, and average values of BC agreed within their standard deviations [38]. One more investigation was performed by Czech researchers, which investigated organic compounds in char and soot from biomass combustion in boilers of various emission classes (EC). This investigation disclosed that EC 2 and EC 3 boilers produce between 14 and 25% soot [39].
Laboratory experiments to assess BC are typically conducted to characterise the performance of domestic heating equipment, and, in particular, operating in different conditions (in terms of burning rate), burning different types of wood fuels, and the condition of the wood (dry or wet). Since the combustion process is very sensitive to the burning conditions, a small change in the conditions may result in a large variation in the emission factors [16].
The authors have started research on BC with verification of the gravimetric method of particulate analysis for assessment of BC in household installations, as this method was earlier used for assessment of particle matter from industrial boilers burning biomass. The initial assessment showed that such a method provides comparable verified results [40].
In Europe, including Lithuania, currently the biggest sources of BC pollution are firstly diesel transport, and secondly domestic heating appliances burning solid fossil fuels or biomass.
Our work assesses BC emissions from several types of domestic boilers that are the most widely used among populations living in individual houses and burning various biomass fuels. These boilers are the most widely available on the market and the most widely used in Lithuania and other Baltic and Nordic countries. Our work also assesses the emissions from biomass fuel heating appliances and the ways to reduce these emissions through the implementation of measures to replace old boilers.

2. Materials and Methods

2.1. Materials

Firewood and pellet fuels were used for BC research. As domestic pellet boilers can use wood pellets as well as agricultural waste pellets, two types of pellets—wood and agricultural waste—were tested:
-
Wood pellets: mixed wood and coniferous wood;
-
Agricultural waste pellets: triticale straw, rape straw, sunflower husks;
-
Firewood: (hardwood) oak tree, ash tree, and birch tree; (softwood) spruce.
All parameters were determined in an accredited laboratory using the equipment listed below and based on the requirements of the standards:
-
Total moisture content was determined with a low-temperature laboratory electric furnace Binder FD 115 (Tuttlingen, Germany) according to the requirements of the standard EN ISO 18134-1 [41];
-
Ash content was determined with a muffle laboratory electric furnace Nabertherm LVT/9/11/P330 (Lilienthal, Germany) according to the standard EN ISO 18122 [42].
-
Total content of carbon (C), hydrogen (H), and nitrogen (N) was determined with the analyser Flash 2000 (Waltham, MA, USA) according to the requirements of standard EN ISO 16948 [43].
-
Total content of sulphur (S) was determined with the ion chromatograph Dionex ISC-5000 DC (Sunnyvale, CA, USA) according to the requirements of standard EN ISO 16994 [44].
-
Calorific value was determined with an automatic calorimeter IKA C5000 (Staufen, Germany) according to the requirements of the standard EN ISO 18125 [45].

2.2. Testing Equipment and Methods

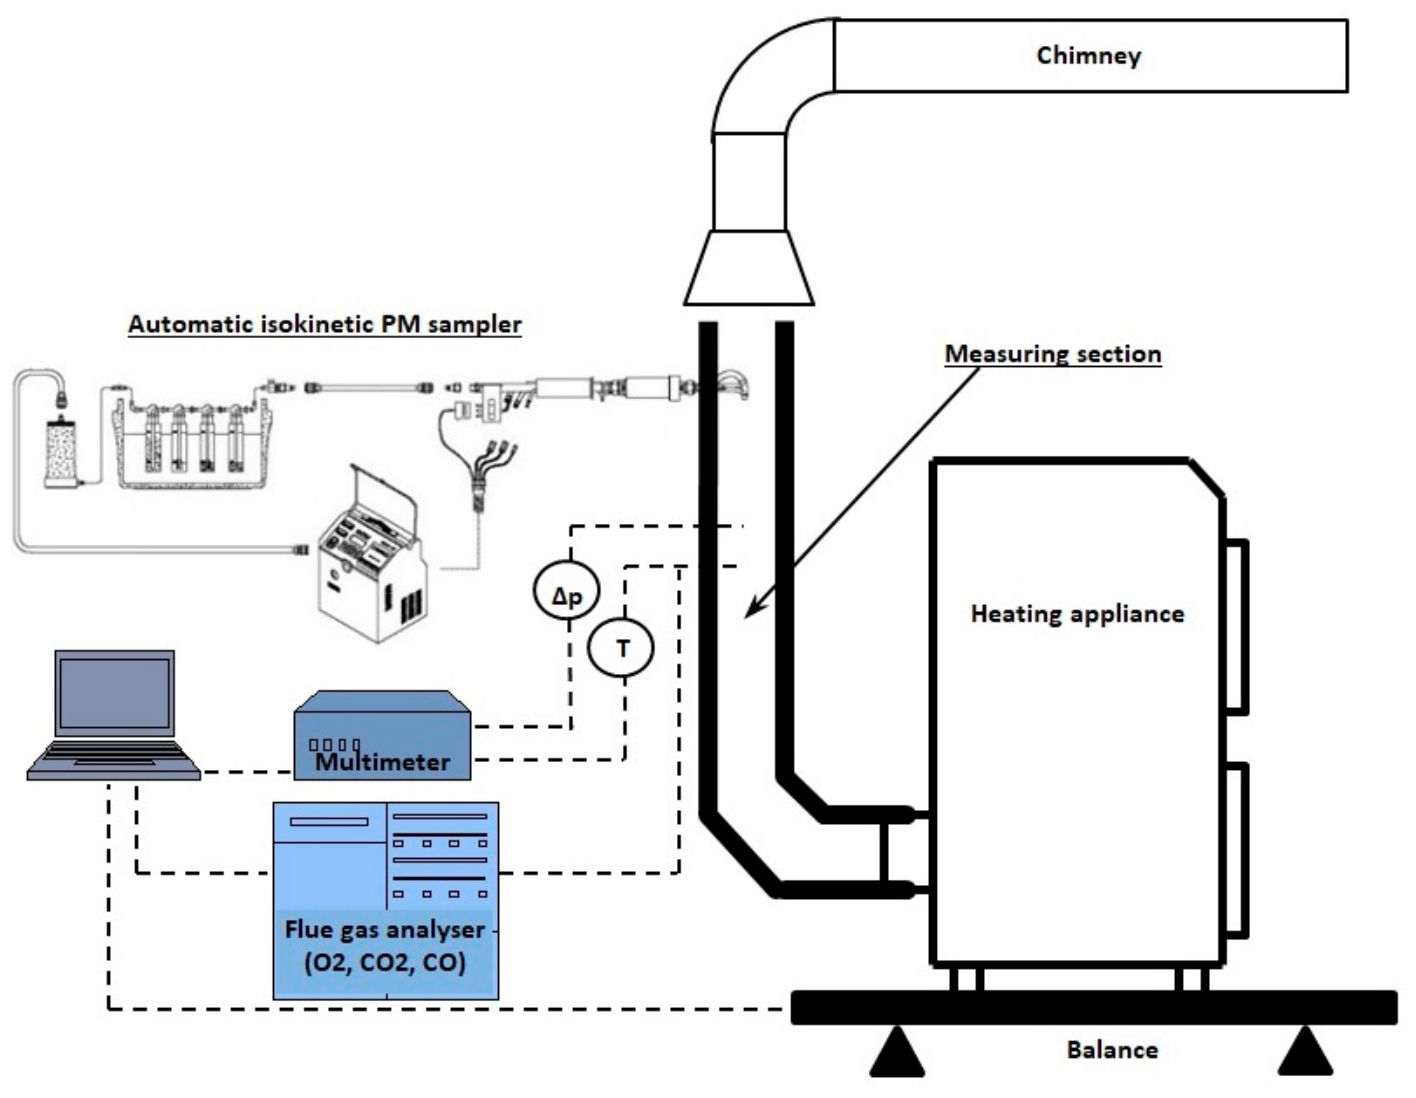
At the laboratory of the Lithuanian Energy Institute, a thermal equipment test rig, flue gas analysers, a particulate matter (PM) sampling unit, and auxiliary equipment for sample processing were used. A simplified testing installation scheme of the thermal equipment test rig is provided in Figure 1. Depending on the type of heating appliance, the unit was installed on balances for accurate fuel consumption measurements and connected to water and heat metering circuits (in the case of solid fuel boilers), as well as to a flue gas measurement section. These systems enable the measurement and recording of key operational parameters, including heat output, efficiency, flue gas flow characteristics and emissions.
The testing installation scheme is shown in Figure 1 below.
For BC research, particulate matter was collected with an automatic isokinetic sampler, TCR Tecora Isostack Basic HV, according to the requirements of standard EN 13284-1 [46]. This method is based on gravimetric particulate analysis to determine the total PM concentration. Subsequently, PM samples were subjected to physical and chemical analyses, during which the collected material was fractionated into material of known composition, such as volatile organic compounds (VOCs), black carbon, and mineral compounds, which were then separated from the sample and weighed.
The study used four domestic heating appliances, the main technical characteristics of which are given in Table 1. The heating devices were installed in the described test rig and operated according to the manufacturer’s instructions. The initial operating parameters, such as fuel and combustion air quantity, draft, temperature, etc., were not changed, and were used as determined by the manufacturer.

2.3. Data Analysis and Processing

Taking into account that domestic biofuel combustion installations are of varying quality and age, and use a variety of fuels, sometimes of very low quality, the fuel in boilers and stoves was burned simulating combustion in three modes: “oxygen excess” (mode 1), “manufacturer’s setting” (mode 2) and “oxygen deficient” (mode 3). Three different combustion modes were set by varying the amount of combustion air supplied.
The excess/deficiency of air in a water heating boiler with a pellet burner was adjusted by moving the primary air damper 25–30% from the manufacturer’s recommended position, which increased/decreased the excess air by about 10%.
For the fireplace insert, the excess/deficiency of air was regulated by fully opening or closing the primary air damper. Depending on the type of fuel, fully opening the damper increased the excess air by about 20–40%, and closing the damper reduced it by about 20–30%.
The air supply of a wood pellet stove is regulated electronically. In excess air mode, the fan speed increased by 40%, which increased the lambda (combustion efficiency or excess air factor) by an average of 25%. In the air deficiency mode, the fan speed was reduced by 20%, which decreased the lambda by 15–25%.
The modes of the wood-fired water heating boiler were regulated by fully opening or closing the secondary air damper. In this case, in mode 1, the air volume increased by an average of 10%, and in mode 3, it decreased by 10%.
To determine black carbon (BC) emissions from heating appliances, particulate matter (PM) was collected using filter cartridges filled with glass wool. The collected samples were heated in stages at different temperatures and weighed. This way, the amount of volatile compounds, BC, and finally mineral compounds was determined. After each step, the cartridge filters were weighed to determine the amount of BC released.
For each test, the weights of the burnt fuels and the main characteristics were determined: moisture content [%], ash content [%], dry net calorific value [kJ/kg], and wet net calorific value [kJ/kg]. The chemical elements of the base fuel composition shall also be determined [%]: carbon, hydrogen, nitrogen, sulphur, and oxygen.
The following temperatures are relevant for the determination of particulate matter emissions from the combustion of biofuels and are based on literature data describing the thermal decomposition behaviour of cellulose, the main component of solid biomass fuels [47]:
  • At temperatures between 60 and 150 °C, the drying process of wood takes place.
  • At 150–200 °C the combustion of cellulose starts.
  • At 200 °C, the primary decomposition of cellulose starts.
  • At 300 °C, the process of cellulose degradation begins.
  • At 550 °C, the cellulose degradation process ends together with the combustion process.
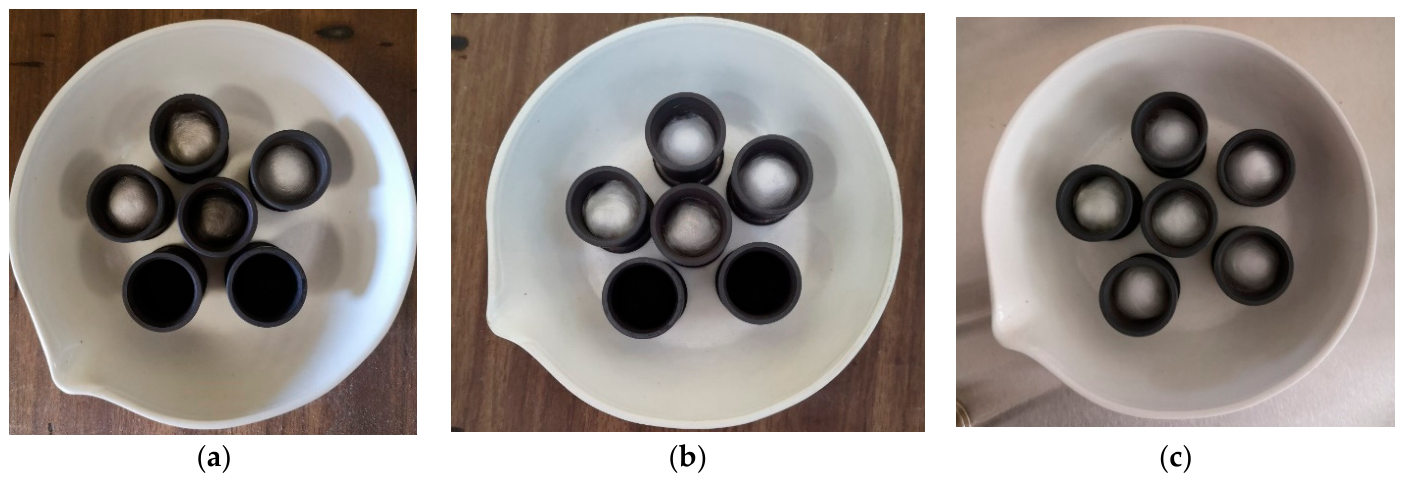
Figure 2 presents the view of cartridges with filters after burning in laboratory furnaces at temperatures of 160 °C, 300 °C, and 550 °C.
The following procedures shall be used to evaluate the following processes and temperature regimes:
  • Before particulate measurements, filter cartridges are filled with glass wool filters and heated in an oven at 180 °C for 1 h, as specified in the standard EN 13284-1 “Emissions from stationary sources. Determination of low mass particle concentrations”. After drying, the cartridges are stored in the desiccator in the weighing room for at least 8 h to ensure that the filter is conditioned uniformly throughout its use. The cartridges are then weighed, and the weight of the empty cartridge, filled only with the filter, is determined.
  • Pre-weighed filter cartridges are used during heating appliance tests, when a sample of particulate matter is taken for 30 min in the combustion products measurement section using an automatic isokinetic sampler in the heating appliance’s steady-state operating mode.
  • After the measurements, the cartridges with the particulate samples are placed at 160 °C for 1 h, as specified in the standard EN 13284-1. After drying, the cartridges are again stored in the desiccator in the weighing room for at least 8 h. The cartridges are then weighed, and the total amount of particulate matter is calculated using the following formula (1):
    c = m V × ( 21 O r e f 21 O m )
    where: m—mass of PM (mg), V—sample volume (m3), Oref—oxygen reference concentration (%), Om—measured oxygen concentration (%).
4.
In the next step, the cartridges are placed in the oven at 300 °C for 5 h. The filters are again stored in a desiccator for 8 h and then weighed to determine the volume of volatiles emitted. In this case m in the given formula (1) is the change in mass after heating.
5.
In the third stage, the cartridges are heated at 550 °C for 5 h. All BC is combusted. The difference in weight between the cartridges annealed to 300 °C, and the cartridges annealed to 550 °C indicates the amount of aerosolised BC.
6.
Finally, the difference in mass between the cartridges annealed to 550 °C and their initial weights before sampling indicates the mineral content (non-combustible products).
The BC emissions were weighed, and their weight was determined in mg and in the flue gas flow in mg/m3. The wet lower calorific value (MJ/kg) and the amount (kg) of fuel used are introduced to give the amount of BC per fuel used (mg/MJfuel) in formula (2):
c B C f u e l = c B C × k 1000 × 1 m f u e l
where: cCB—concentration of BC (mg/m3), k—fuel factor, mfuel—amount of fuel (kg).

3. Results

The characteristics and composition of fuels under investigation are presented in Table 2.
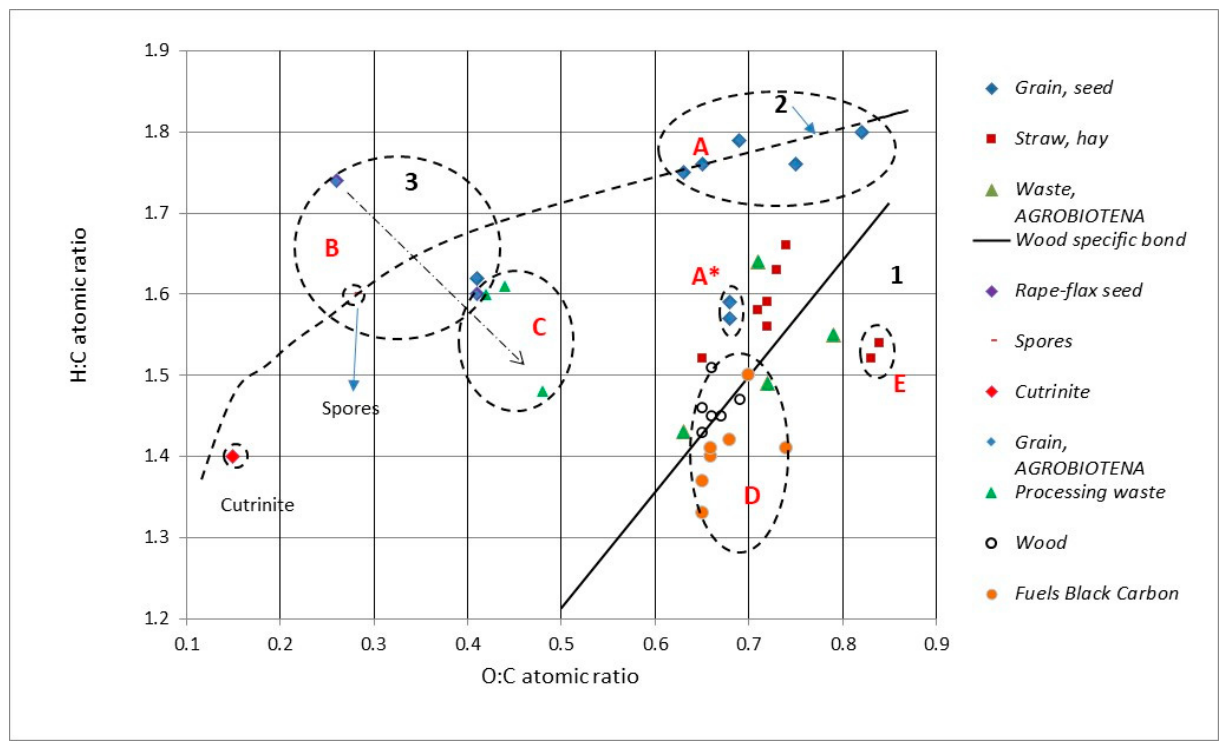
The carbon content is lower in straw pellets, which is closer to 45%, as other woody fuels, as well as oily husk pellets, have higher carbon content, approximately 50%. In practice, nitrogen is only present in negligible amounts in wood fuel and in only slightly higher amounts (<1%) in agricultural waste pellets. The test results of the fuel used in the tests correlate well with the Van Krevelen diagram (Figure 3).
A study on the chemical composition of agricultural residues from different types of agricultural biomass was carried out in the laboratory [48]. In the course of this work, the chemical composition of mainly wood fuels was added to the study. It is important to consider the atomic ratios of O/C and H/C, which are characteristic of a certain type of biomass and are closely related to its calorific value. According to the Van Krevelen diagram for different fuels, wood and straw pellets have relatively lower H/C (1.3–1.7) but similar O/C molar ratios (0.6–0.9), which means that the fuel with a lower H/C ratio has a lower calorific value, and a high O/C ratio means higher CO2 emissions [49].
To ensure the reliability of the results, at least five tests were carried out on each fuel sample in different modes of combustion.
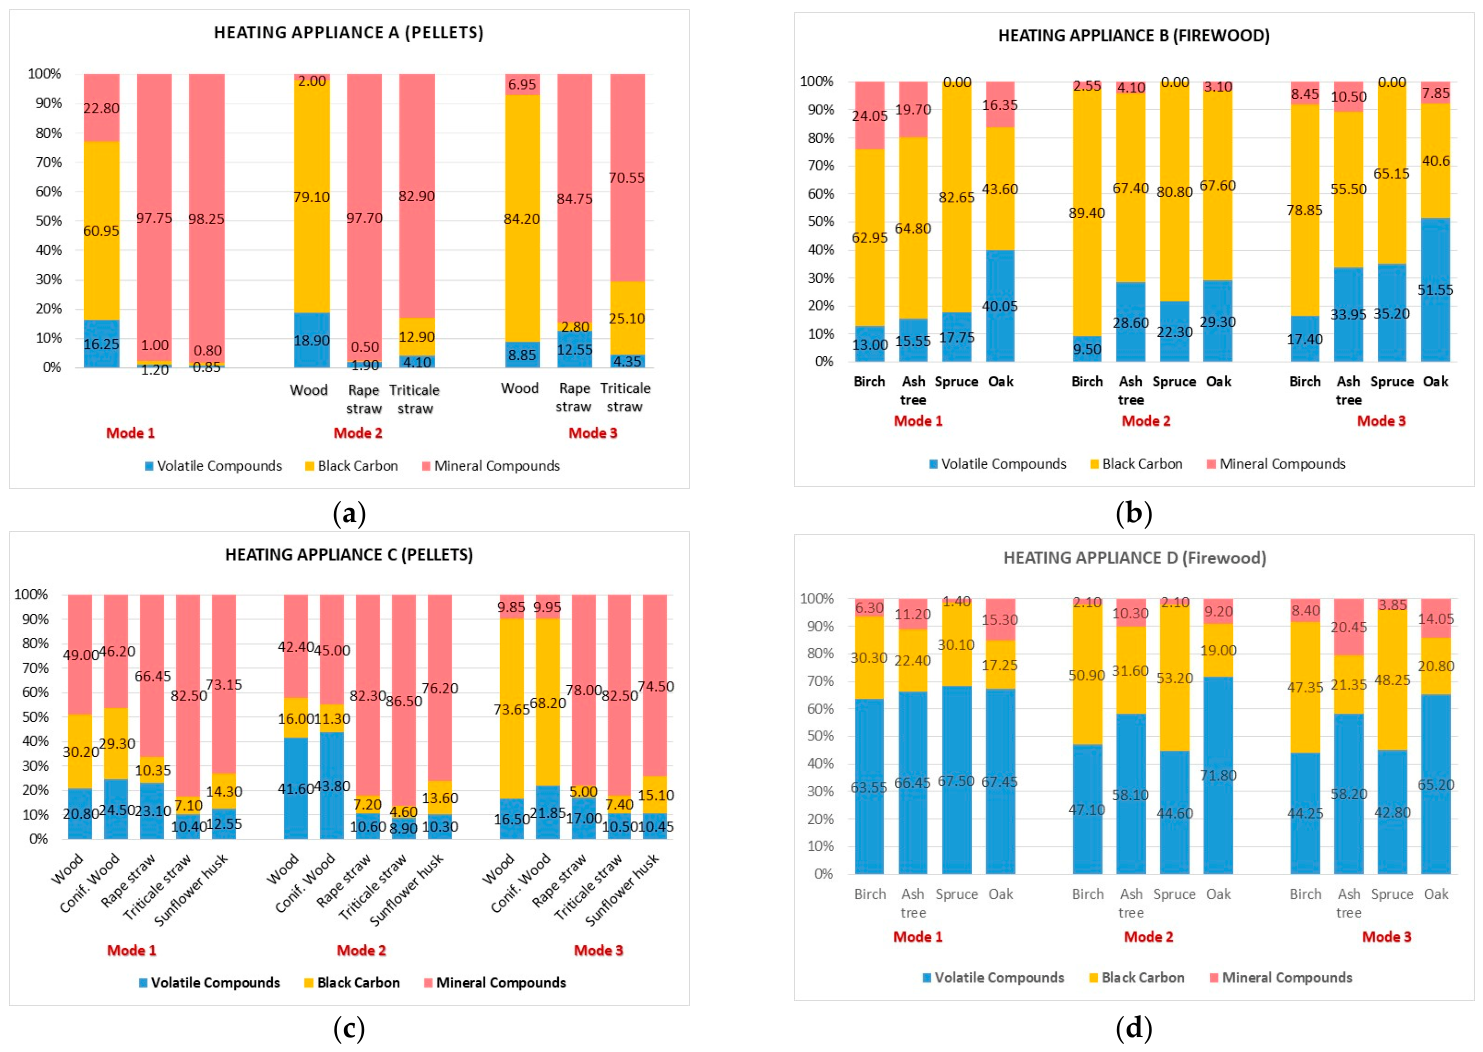
The composition of the PM emissions from biomass fuel combustion is presented in Figure 4.
It is evident that, despite higher total PM emissions, agricultural biomass pellets have the lowest relative BC emissions, but their combustion is more complicated for consumers due to slagging and requires specialised appliances for this fuel.
Compared to agricultural biomass, BC emissions are significantly higher for wood pellets, but are not significant in pellet heating appliances, except for air-deficient combustion (mode 3) (appliances (a) and (c) in Figure 4).
In the case of firewood, BC emissions account for a significantly higher share, but this difference is more influenced by the simpler construction of wood-fired boilers, the coarse fuel fraction, and the combustion principle, rather than the operating mode (appliances (b) and (d) in Figure 4) [50].
The variation in BC emissions results from the four heating appliances by biomass fuel burned, in mg per megawatt of fuel burned, is shown in Table 3. On average, these emissions are lower in water-heating boilers and higher in lower heat output space heaters.
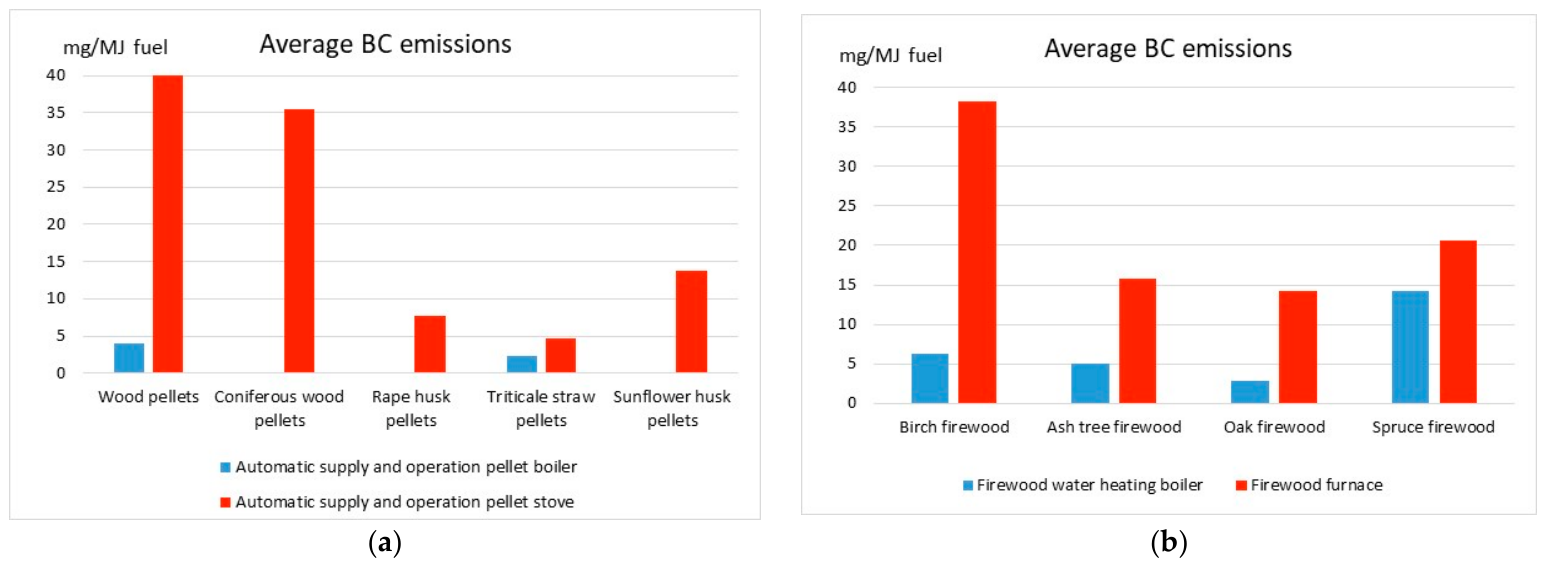
These differences are illustrated in Figure 5, where we see that the BC emission of an automatic solid fuel boiler is insignificant and even several dozen times lower than that of an automatic pellet stove. A similar trend is also seen when comparing wood-fired appliances, i.e., the emissions of a wood-fired solid fuel boiler are several times lower than those of a wood-fired stove. The heat output and quality of the heating appliance have a significant impact on the pollution of the appliance.
To assess the country’s demand for firewood and biomass-based fuels for dwellings (i.e., domestic solid fuel appliances), the emissions of BC for all the fuels involved in the tests can be calculated based on national statistics, which show total fuel consumption per capita or square meter of dwellings.
Taking the example of Lithuania, which consumed 19,353 TJ of firewood, other fuelwood and fuel from agricultural waste in 2021 [51], BC emissions can range from nearly 0 ÷ 180 t/year from burning agricultural waste or wood pellets, up to 200 ÷ 600 t/year from burning hardwood firewood, and even between 350 and 1230 t/year for the most popular wood types, such as pine or birch.
Here we can notice that the lowest BC emissions will be for automatic feeding and control heating appliances using wood pellets, and the largest for manual furnaces, burning birch and spruce firewood.
Studies on BC emissions have been carried out in almost all regions of the world, but most of them have been conducted in the ambient air, rather than as direct pollution from facilities. In this case, it is not always possible to distinguish between emissions from transport, industry, and domestic heating appliances, although domestic heating appliance are often the second largest BC emitters in the world and in Europe.

4. Discussion

The results of this study, which was carried out using a gravimetric method, can be compared with at least two other studies carried out by Swiss and Finnish researchers. These studies have been carried out using a variety of methods and national statistics, including experimental measurements that help to correctly interpret BC formation under different combustion conditions.
The Swiss study was carried out for two hardwood and one softwood species, for firewood and modern fuels (pellets, briquettes), and seven heating appliances, such as an open fireplace, closed fireplace, fireplace, stove, pellet boiler, masonry stove, and food production unit [36].
Here, the BC emission concentrations for hardwood range from 1 ÷ 12 mg/MJ for the pellet boiler and 112 ÷ 336 mg/MJ for other less modern appliances; for modern fuels 1 mg/MJ for the pellet boiler and 8 ÷ 45 mg/MJ for other old household heating appliances; and softwood fuels 1 mg/MJ for the pellet boiler, and for the rest of the appliances vary from 55 to 397 mg/MJ.
These differences are explained by the influence of combustion conditions on the formation of BC. In modern heating appliances, such as pellet boilers, controlled and precise air supply and stable and controlled fuel dosing ensure stable combustion temperature and better fuel combustion, which reduces the formation of solid particle matter. In contrast, older types and manually controlled heating appliances often operate in inappropriate conditions, i.e., with insufficient or excessive oxygen, which suppresses or cools the flame and thus leads to incomplete combustion. All this increases the formation of BC.
The Finnish study further supports these findings by comparing normal and smouldering combustion for a range of heating appliances, such as wood chip boilers with automatic fuel feeding, pellet boilers with automatic fuel feeding, manually loaded boilers with and without storage capacity, and manually loaded modern boilers (this group corresponds to district heating systems). Wood-fired domestic heaters were also studied. This group is quite broad and includes open fireplaces, various kitchen units, various masonry heating units, masonry sauna units, wood stoves, and modern wood stoves [37].
The results confirm that combustion control has a decisive influence on BC emissions. Smouldering combustion, characterised by relatively low combustion temperatures and a deficiency of combustion air, leads to significantly higher BC formation.

5. Conclusions

Heating appliances used in district heating systems emit between 1 and 8 mg/MJfuel of BC in modern and up to 210 mg/MJfuel in old heating boilers, and between 6 and 8 mg/MJfuel and up to 260 mg/MJfuel in domestic heating appliances. However, in modern heating appliances, the emissions of BC vary between 6 and 74 mg/MJfuel.
In this study, using gravimetric particle analysis to determine BC, and based on the selection of appropriate temperature ranges for solid particle treatment, we determined that BC emissions varied from 0 to 120 mg/MJ depending on the type of boiler, the combustion mode, and the type of fuel. It can be argued that the selected test methodology is suitable for BC determination. The results correlate with studies carried out by other researchers and confirm that the main factors determining BC emissions are the combustion technology and operating conditions. Here, emissions varied from 0 ÷ 8 mg/MJ in a modern automatic pellet feeding and control boiler, and from 1 ÷ 25 mg/MJ in a wood-fired automatic water heating boiler, with the highest emissions found for softwood (spruce firewood). In the automatic feed and control pellet stove, BC emissions varied between 1 and 120 mg/MJ, with the highest emissions detected for wood pellets, and in the wood-burning fireplace, the emissions varied between 6 and 80 mg/MJ, with the highest emissions detected for birch firewood.
The results show that older and inefficient combustion appliances remain one of the main sources of BC emissions in households. This highlights the importance of optimal combustion conditions, such as the right ratio of fuel and combustion air. One of the most effective measures is the replacement of old and inefficient biomass boilers, stoves, and fireplaces with new automatically controlled pellet boilers that meet the highest efficiency and emission class. Such an upgrade of heating devices, based on the results of the research, could reduce national BC emissions by a factor of 10 to 70.
Globally, such a reduction of BC emissions in households would have a significant impact on climate change and a positive impact on human health. Therefore, the installation of modern heating appliances, the modernization of heating systems, and emission control should be considered important directions in emission reduction policy.

Author Contributions

N.P.: Conceptualization, methodology, supervision. E.F.D.: Writing original draft, writing—Reviewing and Editing, validation. E.L.: Data curation, investigation, resources. Author N.P. passed away prior to the publication of this manuscript. All other authors have read and agreed to the published version of this manuscript.

Funding

This research received no external funding.

Data Availability Statement

All data obtained during the experimental tests are available at the Lithuanian Energy Institute, Laboratory of Heat-Equipment Research and Testing.

Conflicts of Interest

The authors declare no conflicts of interest.

Abbreviations

The following abbreviations are used in this manuscript:
BCblack carbon
CO2carbon dioxide
COcarbon monoxide
VOCsvolatile organic compounds
PMparticulate matter
OCorganic carbon
EMEP/EEAEuropean Monitoring and Evaluation Programme/European Environment Agency
EUEuropean Union
BrCbrown carbon
EURAMETEuropean Association of National Metrology Institutes
OMIOzone Monitoring Instrument
ECemission classes
Ccarbon
Hhydrogen
Nnitrogen
Ssulphur
MJmegajoule

References

  1. SLCPs: Assessment of Short-Lived Climate Pollutants (LSCPs) from Forest Fire and Open Burning in the Lower Mekong Subregion to Support the ASEAN Haze Control. Final Report by Ekbordin Winijkul and Team, Environmental Engineering and Management School of Environmental Resources and Development Asian Institute of Technology (AIT), November 2024. Available online: https://www.ccacoalition.org/sites/default/files/resources/files/AssessmentSLCPs_LMS_FinalReport_20241117.pdf (accessed on 25 September 2025).
  2. O’Rourke, P.R.; Smith, S.J.; Mott, A.; Ahsan, H.; McDuffie, E.E.; Crippa, M.; Klimont, Z.; McDonald, B.; Wang, S.; Nicholson, M.B.; et al. CEDS v_2021_04_21 Release Emission Data (v_2021_02_05) [Data Set]. Zenodo. 2021. Available online: https://zenodo.org/records/4741285 (accessed on 18 March 2026).
  3. Coppola, A.I.; Wagner, S.; Lennartz, S.T.; Seidel, M.; Ward, N.D.; Dittmar, T.; Santin, C.; Jones, M.W. The black carbon cycle and its role in the Earth system. Nat. Rev. Earth Environ. 2022, 3, 516–532. [Google Scholar] [CrossRef]
  4. Global Black Carbon Emissions 1750–2022. Institute for Global Sustainability. Visualizing Energy. Published Online by Boston University. 2024. Available online: https://visualizingenergy.org/global-black-carbon-emissions-1750-2022/ (accessed on 18 March 2026).
  5. Xu, H.; Ren, Y.; Zhang, W.; Meng, W.; Yun, X.; Yu, X.; Li, J.; Zhang, Y.; Shen, G.; Ma, J.; et al. Updated Global Black Carbon Emissions from 1960 to 2017: Improvements, Trends, and Drivers. Environ. Sci. Technol. 2021, 55, 7869–7879. [Google Scholar] [CrossRef]
  6. Eckhardt, S.; Pisso, I.; Evangeliou, N.; Zwaaftink, C.G.; Plach, A.; McConnell, J.; Sigl, M.; Ruppel, M.; Zdanowicz, C.; Lim, S.; et al. Revised historical Northern Hemisphere black carbon emissions based on inverse modeling of ice core records. Nat. Commun. 2023, 14, 271. [Google Scholar] [CrossRef]
  7. Zhang, B.; Chellman, N.J.; Kaplan, J.O.; Mickley, L.J.; Ito, T.; Wang, X.; Wensman, S.M.; McCrimmon, D.; Steffensen, J.P.; McConnell, J.R.; et al. Improved biomass burning emissions from 1750 to 2010 using ice core records and inverse modelling. Nat. Commun. 2024, 15, 3651. [Google Scholar] [CrossRef] [PubMed]
  8. Cordero, R.R.; Sepúlveda, E.; Feron, S.; Damiani, A.; Fernandoy, F.; Neshyba, S.; Rowe, P.M.; Asencio, V.; Carrasco, J.; Alfonso, J.A.; et al. Black carbon footprint of human presence in Antarctica. Nat. Commun. 2022, 13, 984. [Google Scholar] [CrossRef] [PubMed]
  9. Xie, B.; Yang, Y.; Wang, H.; Wang, P.; Liao, H. Biomass Burning Emissions of Black Carbon over the Maritime Continent and ENSO Variability. J. Clim. 2023, 36, 8365–8376. [Google Scholar] [CrossRef]
  10. He, C.; Niu, X.; Ye, Z.; Wu, Q.; Liu, L.; Zhao, Y.; Ni, J.; Li, B.; Jin, J. Black carbon pollution in China from 2001 to 2019: Patterns, trends, and drivers. Environ. Pollut. 2023, 324, 121381. [Google Scholar] [CrossRef]
  11. Kompalli, S.K.; Babu, S.; Ajith, T.C.; Moorthy, K.; Satheesh, S.K.; Boopathy, R.; Das, T.; Liu, D.; Allan, J.; Coe, H. Ageing of biomass burning emissions in the Indo-Gangetic Plain outflow: Implications for black carbon light-absorption enhancement. Atmos. Res. 2023, 294, 106949. [Google Scholar] [CrossRef]
  12. Jacobson, M.Z. Effects of biomass burning on climate, accounting for heat and moisture fluxes, black and brown carbon, and cloud absorption effects. J. Geophys. Res. Atmos. 2014, 119, 8980–9002. [Google Scholar] [CrossRef]
  13. Klimont, Z.; Kupiainen, K.; Heyes, C.; Purohit, P.; Cofala, J.; Rafaj, P.; Borken-Kleefeld, J.; Schöpp, W. Global anthropogenic emissions of particulate matter including black carbon. Atmos. Chem. Phys. 2017, 17, 8681–8723. [Google Scholar] [CrossRef]
  14. Kirago, L.; Gatari, M.J.; Gustafsson, Ö.; Andersson, A. Black carbon emissions from traffic contribute substantially to air pollution in Nairobi, Kenya. Commun. Earth Environ. 2022, 3, 74. [Google Scholar] [CrossRef]
  15. Jiang, K.; Xing, R.; Luo, Z.; Huang, W.; Yi, F.; Men, Y.; Zhao, N.; Chang, Z.; Zhao, J.; Pan, B.; et al. Pollutant emissions from biomass burning: A review on emission characteristics, environmental impacts, and research perspectives. Particuology 2024, 85, 296–309. [Google Scholar] [CrossRef]
  16. EU Action on Black Carbon in the Arctic. Review of Reporting Systems for National Black Carbon Emissions Inventories: EU Action on Black Carbon in the Arctic—Technical Report 2. April 2019. iv + 72p. Available online: https://www.amap.no/documents/download/3377/inline (accessed on 25 September 2025).
  17. Evangeliou, N.; Platt, S.M.; Eckhardt, S.; Lund Myhre, C.; Laj, P.; Alados-Arboledas, L.; Backman, J.; Brem, B.T.; Fiebig, M.; Flentje, H.; et al. Changes in black carbon emissions over Europe due to COVID-19 lockdowns. Atmos. Chem. Phys. 2021, 21, 2675–2692. [Google Scholar] [CrossRef]
  18. Black Carbon Emissions in the European Union (EU-27) 2000–2022. Published by Ian Tiseo, 13 August 2024. Available online: https://www.statista.com/statistics/1171112/black-carbon-emission-european-union-eu-28/ (accessed on 25 September 2025).
  19. ANSES: Particulate Matter in Ambient Air. Health Effects According to Components, Sources and Particle Size. Impact on Air Pollution of the Technologies and Composition of the Motor Vehicle Fleet Operating in France. ANSES Opinion: Amended Summary Report and Recommendations from the Collective Expert Appraisal. Scientific Edition, August 2019—124p. Available online: https://www.anses.fr/fr/system/files/AIR2014SA0156RaEN.pdf (accessed on 25 September 2025).
  20. Baumgartnera, J.; Zhang, Y.; Schauer, J.J.; Huang, W.; Wang, Y.; Ezzati, M. Highway proximity and black carbon from cookstoves as a risk factor for higher blood pressure in rural China. Proc. Natl. Acad. Sci. USA 2014, 111, 13229–13234. [Google Scholar] [CrossRef] [PubMed]
  21. Emden, J.; Murphy, L. Lethal but Legal. Air Pollution from Domestic Burning. Institute for Public Policy Research. October 2018. 46p. Available online: https://www.jstor.org/tc/accept?origin=%2Fstable%2Fpdf%2Fresrep21884.1.pdf&is_image=False (accessed on 25 September 2025).
  22. Karanasiou, A.; Alastuey, A.; Amato, F.; Renzi, M.; Stafoggia, M.; Tobias, A.; Reche, C.; Forastiere, F.; Gumy, S.; Mudu, P.; et al. Short-term health effects from outdoor exposure to biomass burning emissions: A review. Sci. Total Environ. 2021, 781, 146739. [Google Scholar] [CrossRef]
  23. Chen, J.; Li, C.; Ristovski, Z.; Milic, A.; Gu, Y.; Islam, M.S.; Wang, S.; Hao, J.; Zhang, H.; He, C.; et al. A review of biomass burning: Emissions and impacts on air quality, health and climate in China Jianmin. Sci. Total Environ. 2017, 579, 1000–1034. [Google Scholar] [CrossRef]
  24. EMEP/EEA: Air Pollutant Emission Inventory Guidebook. EEA Report 2023. Available online: https://www.eea.europa.eu/en/analysis/publications/emep-eea-guidebook-2023 (accessed on 25 September 2025).
  25. Diapouli, E.; Kalogridis, A.C.; Markantonaki, C.; Vratolis, S.; Fetfatzis, P.; Colombi, C.; Eleftheriadis, K. Annual Variability of Black Carbon Concentrations Originating from Biomass and Fossil Fuel Combustion for the Suburban Aerosol in Athens, Greece. Atmosphere 2017, 8, 234. [Google Scholar] [CrossRef]
  26. Mitchell, E.J.S.; Coulson, G.; Butt, E.W.; Forster, P.M.; Jones, J.M.; Williams, A. Heating with Biomass in the United Kingdom: Lessons from New Zealand. Atmos. Environ. 2017, 152, 431–454. [Google Scholar] [CrossRef]
  27. Qi, L.; Wang, S. Fossil fuel combustion and biomass burning are sources of global black carbon from GEOS-Chem simulation and carbon isotope measurements. Atmos. Chem. Phys. 2019, 19, 11545–11557. [Google Scholar] [CrossRef]
  28. Olson, M.R.; Garcia, M.V.; Robinson, M.A.; Van Rooy, P.; Dietenberger, M.A.; Bergin, M.; Schauer, J.J. Investigation of black and brown carbon multiple wavelength-dependent light absorption from biomass and fossil fuel combustion source emissions. J. Geophys. Res. Atmos. 2015, 120, 6682–6697. [Google Scholar] [CrossRef]
  29. Pauraitė, J.; Mordas, G.; Byčenkienė, S.; Ulevicius, V. Spatial and Temporal Analysis of Organic and Black Carbon Mass Concentrations in Lithuania. Atmosphere 2015, 6, 1229–1242. [Google Scholar] [CrossRef]
  30. Bycenkiene, S.; Ulevicius, V.; Kecorius, S. Characteristics of black carbon aerosol mass concentration over the East Baltic region from two-year measurements. J. Environ. Monit. 2011, 13, 1027–1038. [Google Scholar] [CrossRef]
  31. Pollution from Residential Burning. Danish Experience in an International Perspective 2016. Kåre Press-Kristensen, Tanja Willumsen, Green Transition Denmark. Koch&Falk. Edition: 3rd Edition. 2022. Available online: https://www.ccacoalition.org/resources/pollution-residential-burning-danish-experience-international-perspective (accessed on 25 September 2025).
  32. Zhao, W.; Zhao, Y.; Zheng, Y.; Chen, D.; Xin, J.; Li, K.; Che, H.; Li, Z.; Ma, M.; Hang, Y. Long-term variability in black carbon emissions constrained by gap-filled absorption aerosol optical depth and associated premature mortality in China. Atmos. Chem. Phys. 2024, 24, 6593–6612. [Google Scholar] [CrossRef]
  33. EURAMET: Black Carbon: Metrology for Light Absorption by Atmospheric Aerosols. Final Publishable Report by EURAMET, 16ENV02 Black Carbon. 2016. 41p. Available online: https://www.euramet.org/research-innovation/search-research-projects/details/project/metrology-for-light-absorption-by-atmospheric-aerosols/ (accessed on 25 September 2025).
  34. Su, M.; Shi, Y.; Yang, Y.; Guo, W. Impacts of different biomass burning emission inventories: Simulations of atmospheric CO2 concentrations based on GEOS-Chem. Sci. Total Environ. 2023, 876, 162825. [Google Scholar] [CrossRef]
  35. Liu, M.; Popescu, S. Estimation of biomass burning emissions by integrating ICESat-2, Landsat 8, and Sentinel-1 data. Remote Sens. Environ. 2022, 280, 113172. [Google Scholar] [CrossRef]
  36. Meyer, N.K. Particulate, black carbon and organic emissions from small scale residential wood combustion appliances in Switzerland. Biomass Bioenergy 2012, 36, 31–42. [Google Scholar] [CrossRef]
  37. Savolahti, M.; Karvosenoja, N.; Tissari, J.; Kupiainen, K.; Sippula, O.; Jokiniemi, J. Black carbon and fine particle emissions in Finnish residential wood combustion: Emission projections, reduction measures and the impact of combustion practices. Atmos. Environ. 2016, 140, 495–505. [Google Scholar] [CrossRef]
  38. Höfer, I.; Kaltschmitt, M.; Beckendorff, A. Emissions from Solid Biofuel Combustion, Pollutant Formation and Control Options; Institute of Environmental Technology and Energy Economics (IUE), Hamburg University of Technology (TUHH): Hamburg, Germany, 2017. [Google Scholar] [CrossRef]
  39. Růžičková, J.; Kucbela, M.; Raclavská, H.; Švédová, B.; Raclavský, K.; Juchelková, D. Comparison of organic compounds in char and soot from the combustion of biomass in boilers of various emission classes. J. Environ. Manag. 2019, 236, 769–783. [Google Scholar] [CrossRef] [PubMed]
  40. Bycenkiene, S.; Pashneva, D.; Uoginte, I.; Pauraite, J.; Minderytė, A.; Davuliene, L.; Plauskaite, K.; Skapas, M.; Dudoitis, V.; Touqeer, G.; et al. Evaluation of the anthropogenic black carbon emissions and deposition on Norway spruce and silver birch foliage in the Baltic region. Environ. Res. 2022, 207, 112218. [Google Scholar] [CrossRef]
  41. ISO 18134-1:2022; Solid Biofuels—Determination of Moisture Content—Part 1: Reference Method. ISO Tarptautinė Standartizacijos Organizacija: Geneva, Switzerland, 2022. Available online: https://eshop.lsd.lt/public#!/product/info/0a640308-84af-17ba-8184-c3c1fbec00ea (accessed on 24 April 2026).
  42. ISO 18122:2022; Solid Biofuels—Determination of Ash Content. ISO Tarptautinė Standartizacijos Organizacija: Geneva, Switzerland, 2022. Available online: https://eshop.lsd.lt/public#!/product/info/0a64031d-8211-1029-8184-762685b30677 (accessed on 24 April 2026).
  43. ISO 16948:2015; Solid Biofuels—Determination of Total Content of Carbon, Hydrogen and Nitrogen. ISO Tarptautinė Standartizacijos Organizacija: Geneva, Switzerland, 2015. Available online: https://eshop.lsd.lt/public#!/product/info/0a640324-6747-1da0-8168-8adfadca1c24 (accessed on 24 April 2026).
  44. ISO 16994:2016; Solid Biofuels—Determination of Total Content of Sulfur and Chlorine. ISO Tarptautinė Standartizacijos Organizacija: Geneva, Switzerland, 2016. Available online: https://eshop.lsd.lt/public#!/product/info/0a640324-6747-1da0-8168-815006b5174d (accessed on 24 April 2026).
  45. ISO 18125:2017; Solid Biofuels—Determination of Calorific Value. ISO Tarptautinė Standartizacijos Organizacija: Geneva, Switzerland, 2017. Available online: https://eshop.lsd.lt/public#!/product/info/0a640324-6747-1da0-8168-7c8308020f6d (accessed on 24 April 2026).
  46. EN 13284-1:2017; Stationary Source Emissions—Determination of Low Range Mass Concentration of Dust—Part 1: Manual Gravimetric Method. ISO Tarptautinė Standartizacijos Organizacija: Geneva, Switzerland, 2017. Available online: https://eshop.lsd.lt/public#!/product/info/0a64031c-6147-15df-8161-4e88a77d0e5b (accessed on 24 April 2026).
  47. Shen, D.K.; Gu, S. The Mechanism for thermal decomposition of cellulose and its main products. Bioresour. Technol. 2009, 100, 6496–6504. [Google Scholar] [CrossRef]
  48. Praspaliauskas, M.; Pedišius, N.; Čepauskienė, D.; Valantinavičius, M. Study of chemical composition of agricultural residues from various agromass types. Biomass Conv. Bioref. 2020, 10, 937–948. [Google Scholar] [CrossRef]
  49. Zhao, X.; Zhou, H.; Sikarwar, V.S.; Zhao, M.; Park, A.H.; Paul, H.A.; Fennell, S.; Laihong, S.; Fan, L.S. Biomass-based chemical looping technologies: The good, the bad and the future. Energy Environ. Sci. 2017, 10, 1885–1910. [Google Scholar] [CrossRef]
  50. Lindberg, J.; Wurth, M.; Frank, B.P.; Tang, S.; LaDuke, G.; Trojanowski, R.; Butcher, T.; Mahajan, D. Realistic operation of two residential cordwood-fired outdoor hydronic heater appliances—Part 3: Optical properties of black and brown carbon emissions. J. Air Waste Manag. Assoc. 2022, 72, 777–790. [Google Scholar] [CrossRef]
  51. Statistics Lithuania: Environment, Agriculture and Energy in Lithuania (Edition 2022). Available online: https://osp.stat.gov.lt/lietuvos-aplinka-zemes-ukis-ir-energetika-2022/izanga (accessed on 20 February 2026).
Figure 1. The testing installation scheme.
Energies 19 02164 g001
Figure 2. Views of cartridges with filters after heating procedures: (a) after heating at 160 °C; (b) after heating at 300 °C; (c) after heating at 550 °C.
Energies 19 02164 g002
Figure 3. Van Krevelin diagram, where types of fuel used under the BC project are provided in the context of the variety of biomass fuel data collected by the laboratory. Dashed lines and circles with capital letters were used to define the types of fuels, which were investigated under the former researches of the laboratory. Here are the curves: 1—wood-specific bond: H/C = 1.425 (O/C) + 0.5004; 2—grain, seed-specific bond: H/:C = f(O/C); 3—oily seeds after pressing specific bond: rape, flax, sunflower (B), and rape cake (C); A—grain, seeds; A*—wheat grain, corn cob; B—oily rape, flax, and sunflower seeds; C—oily rape seed cake; D—pellets and wood from this BC research; E—wheat and buckwheat straw.
Energies 19 02164 g003
Figure 4. Average particulate matter emission composition of biofuel combustion, [%]. (a) Water heating boiler with pellet burner; (b) Firewood insert for fireplaces; (c) Wood pellet stove; (d) Firewood water heating boiler.
Energies 19 02164 g004
Figure 5. Average BC emissions by type of biomass fuel used in pellet (a) and firewood (b) heating appliances.
Energies 19 02164 g005
Table 1. The basic characteristics declared by the manufacturer of pellets, firewood burning boilers, and stoves, which were used for the investigation of BC emissions.
ParametersMeasure UnitWater Heating Boiler with Pellet BurnerFirewood Insert for FireplacesWood Pellet StoveFirewood Water Heating Boiler
Nominal heat outputkW2558.520
Efficiency%85658578
Class 5------3
Flue gas temperature°C200350240215
Maximum working pressurebar1.5------1.5
Maximum working temperature°C85------85
CO concentration%<0.50.30.037<0.5
Dimensions (H × W × L)mm1085 × 2410 × 1050588 × 495 × 445940 × 453 × 4831085 × 710 × 1050
Table 2. Main physical properties and composition of biomass fuel under investigation.
Agro-WasteWood (Pellets)Wood (Firewood)
Rape Straw PelletsTriticale Straw PelletsSunflower Husk PelletsMixed Wood PelletsConiferous Wood PelletsBirchAsh treeSpruceOak
Moisture content, %11.42 ± 0.0312.13 ± 0.038.38 ± 0.017.69 ± 0.036.93 ± 0.018.05 ± 0.028.68 ± 0.088.49 ± 0.019.66 ± 0.01
Ash content, %4.66 ± 0.164.42 ± 0.073.19 ± 0.190.47 ± 0.040.37 ± 0.040.76 ± 0.090.61 ± 0.020.18 ± 0.030.48 ± 0.03
LCV(db), MJ/kg17.54 ± 0.3517.85 ± 0.6618.85 ± 0.7819.17 ± 0.4818.51 ± 0.3919.10 ± 0.5418.68 ± 0.7818.89 ± 0.5719.02 ± 1.11
LCV(ar), MJ/kg15.27 ± 0.3615.41 ± 0.7617.07 ± 0.8017.52 ± 0.4917.06 ± 0.4017.38 ± 0.5516.86 ± 0.7917.09 ± 0.5816.96 ± 1.12
Carbon (C)(db), %46.90 ± 1.1544.95 ± 1.2751.49 ± 1.0949.96 ± 1.1251.80 ± 1.0950.13 ± 1.1349.69 ± 1.1250.11 ± 1.1650.44 ± 1.23
Hydrogen (H)(db), %5.56 ± 0.455.29 ± 0.595.88 ± 0.445.82 ± 0.636.30 ± 0.435.74 ± 0.465.84 ± 0.455.89 ± 0.455.57 ± 0.48
Nitrogen (N)(db), %0.68 ± 0.320.53 ± 0.340.96 ± 0.310.12 ± 0.32<0.02 10.16 ± 0.32<0.01 1<0.01 1<0.01 1
Sulphur (S)(db), %0.10 ± 0.28<0.01 1<0.02 1<0.01 1<0.02 1<0.01 1<0.01 1<0.01 1<0.01 1
Oxygen (O)(db), %42.10 244.81 241.65 243.63 241.86 243.21 243.86 243.82 243.51 2
Note: Results are presented with expanded uncertainties. 1 Symbol means below detection limit. 2 Deducted values.
Table 3. Black carbon emissions from the combustion of nine biomass fuels in the excess air (mode 1), producer set (mode 2), deficient air (mode 3) combustion process in four types of heating appliances (mg/MJfuel).
Heating AppliancePellet Boiler with Automatic Feeding and ControlPellet Stove with Automatic Feeding and Control
Fuel
Mode 1Mode 2Mode 3Mode 1Mode 2Mode 3
Wood pellets0.85–0.9719.003.9–12.32.3–2.912.0973.73–118.89
Coniferous wood pellets 1.27–1.371.0580.91–92.82
Rape straw pellets0.05–0.130.060.09–0.168.42–14.046.623.81–5.36
Triticale straw pellets0.11–0.162.803.96–4.921.65–6.842.703.74–8.47
Sunflower husk pellets 13.8–16.413.4510.9–15.5
Heating ApplianceWood-Burning Water-Heating BoilerWood-Burning Fireplace
Fuel
Mode 1Mode 2Mode 3Mode 1Mode 2Mode 3
Birch firewood3.59–4.088.903.81–11.3210.67–37.347.2–78.7221.25–48.95
Ash tree firewood4.46–4.717.030.81–7.8418.8–22.88.812.5–16.15
Oaktree firewood1.37–4.523.021.76–3.865.7–17.3528.513–6.2
Spruce firewood10.18–12.6112.949.95–25.3618.44–26.5722.4322.17–13.36
Note: The expanded uncertainty of the BC measurement did not exceed 16.5%.
Disclaimer/Publisher’s Note: The statements, opinions and data contained in all publications are solely those of the individual author(s) and contributor(s) and not of MDPI and/or the editor(s). MDPI and/or the editor(s) disclaim responsibility for any injury to people or property resulting from any ideas, methods, instructions or products referred to in the content.