Article

Techno-Economic Assessment of Solar Photovoltaic for Agro-Processing in Rural Africa: Evidence from Shea Butter Processing Facility


by
Bignon Stéphanie Nounagnon
1,*,
Yrébégnan Moussa Soro
1,
Wiomou Joévin Bonzi
2,
Sebastian Romuli
2,
Klaus Meissner
2 and
Joachim Müller
2
1
Laboratoire Énergies Renouvelables et Efficacité Énergétique (LabEREE), Département Génie Électrique, Énergétique et Industriel, Institut International D’Ingénierie de l’Eau et de l’Environnement (2iE), Ouagadougou 01 BP 594, Burkina Faso
2
Tropics and Subtropics Group, Institute of Agricultural Engineering, University of Hohenheim, 70593 Stuttgart, Germany
*
Author to whom correspondence should be addressed.
Energies 2026, 19(9), 2163; https://doi.org/10.3390/en19092163
Submission received: 10 February 2026 / Revised: 21 March 2026 / Accepted: 30 March 2026 / Published: 30 April 2026
(This article belongs to the Section A2: Solar Energy and Photovoltaic Systems)

Abstract

This study evaluates the techno-economic performance of solar photovoltaic (PV) systems for powering a 7 t/day shea butter processing plant to address electricity constraints limiting rural processing and local value capture. Annual electricity demand is modeled under three operational scenarios: (i) a typical processing season from November to February; (ii) an extended season until mid-May; and (iii) near year-round operation with eleven months of processing. Using detailed load modeling and techno-economic simulations in HOMER Pro, off-grid PV/battery systems and grid-connected PV hybrids are compared using the levelized cost of electricity (LCOE). In scenario 1, the national grid remains the most cost-effective solution. Scenario 2 reveals that integrating 35% solar PV into the grid becomes economically attractive, offering a recoverable value of 263.33 thousand USD within 7.73 years. In scenario 3, the grid/PV/battery configuration emerges as the optimal solution, providing the lowest cost of electricity at 0.246 USD/kWh compared to 0.319 USD/kWh for a grid-only supply and delivering an internal rate of return (IRR) of 20.7%. Under the same scenario, the standalone PV/battery system also demonstrates strong economic viability, with a cost of 0.292 USD/kWh and an IRR of 9.2%, lower than average tariffs from PV mini-grid developers in sub-Saharan Africa. These results demonstrate the profitability and viability of PV-based systems in powering food processing facilities in off-grid regions.

1. Introduction

Productive use schemes are the most valuable and durable strategies for introducing renewable energy (RE) in rural areas, due to the vast range of opportunities they induce in addressing poverty-related challenges [1]. Unlike domestic energy use, such as lighting and cooking, which mainly meet vital needs, productive use focuses on activities that create economic value. These include powering machinery in agriculture, small-scale industries, and services such as food processing, irrigation, refrigeration, and telecommunications. A closely related and rapidly expanding field is agrivoltaics, in which photovoltaic panels and agricultural activities coexist on the same land, simultaneously generating electricity and sustaining crop productivity—offering promising co-benefits for energy and food security in rural and peri-urban contexts [2,3].
The current research is typically drawn around shea butter production using the mechanical screw press (MSP) technique. Shea butter is a native sub-Saharan African (SSA) product involving over 16 million women and supplying industries including cosmetics, pharmaceuticals, and food [4]. To date, the shea tree grows only in the Sahel-Sudanian-Savannah regions. Shea butter processing requires energy-intensive processes such as roasting, oil extraction, and cold storage [5]. Unfortunately, evidence shows that difficulties in accessing clean energy sources in rural shea-rich communities make shea butter processing activities extremely arduous. As a result, 90% of the shea kernels are exported from rural regions to cities and overseas for processing [6].
Shea-rich countries still experience one of the lowest electrification rates and access to modern and reliable energy infrastructure worldwide [1]. In rural areas of these countries, the average electrification rate is as low as 3% in Burkina Faso, while peri-urban and urban access may reach 60% but remains highly unreliable [7,8]. To address energy poverty, several shea-rich countries have developed comprehensive and tailored electrification strategy plans, including a large portfolio for RE and specifically solar photovoltaic (PV) technology [9].
Standalone or hybrid solar PV systems have been explored as potential energy solutions in various food processing industries, including dairy, fish and meat processing, and food drying. However, each sector faces unique challenges related to processing operations, timing, and seasonal fluctuations in raw material availability and product demand. These factors contribute to non-standard and complex energy consumption patterns throughout the day and year. For example, field interviews in shea butter processing plants revealed that energy demand for cold storage increases from March to mid-May due to rising ambient temperatures. Moreover, solar PV systems must contend with day-night cycles and seasonal weather variations, necessitating meticulous system sizing and load profile analysis. This is typically achieved through energy audits involving individual load assessments, electricity bill analysis, or computational load simulations.
Previous studies have demonstrated the importance of tailored solar PV system design based on detailed energy consumption profiling. Mo [10], in designing energy supplement alternatives to grid power for a food manufacturing plant in Melbourne using PV technology, thoroughly studied the plant’s load profile over a year using data from electricity bills. Based on the plant’s energy consumption, he proposed a grid-tied solar power system minimizing excess production during low-demand intervals. Dean et al. [11] estimated the annual electricity consumption of a dairy farm based on milk production, considering that conventional milking machines are utilized. Solar PV systems were designed with HOMER Pro software. The findings encouraged small PV systems to achieve an average payback period of five years. Bonzi [12] defined a year-round synthetic load profile of a service-based peanut oil extraction small-scale company in rural Senegal using MATLAB-Simulink. The profile reflected the real energy consumption trend and served for designing a hybrid grid/PV/battery system. The grid-connected system of an 18 kWp PV array and 16 kWh battery storage was competitive to the grid-only system, achieving 0.142 USD/kWh as the cost of electricity compared to 0.317 USD/kWh.
Complementary research has been conducted on energy access for shea butter processing [13,14]. However, in these studies, the shea butter has not been extracted by a screw press, but by the kneading process, where the focus is on thermal energy requirements. A notable implementation occurred in 2019 when an equipment manufacturer deployed a micro-scale solar PV-powered kneading-based shea butter processing line in Burkina Faso [15,16]. However, no investigation has been carried out to assess the real electricity consumption of an existing MSP-based shea butter processing plant. Furthermore, to date, there is no published scientific work addressing the powering of a real-life MSP-based shea butter processing plant using solar PV.
In this study, an energy audit was conducted in an MSP-based shea butter processing plant. It consisted of assessing the shea butter production process and real-time electricity consumption data to establish a comprehensive daily power profile. The objective is to explore the technical and economic feasibility of sustaining MSP-based shea butter processing activities using solar PV technology. This research focuses on three key aspects: (i) assessing the annual load profile of an MSP-based shea butter processing plant; (ii) designing a dedicated solar PV-based power supply system; (iii) evaluating the associated cost of electricity and economic parameters, including the internal rate of return (IRR) and discounted payback period (DPP), thereby providing a comprehensive framework for adopting solar PV technology in similar contexts.

2. Materials and Methods

2.1. Location

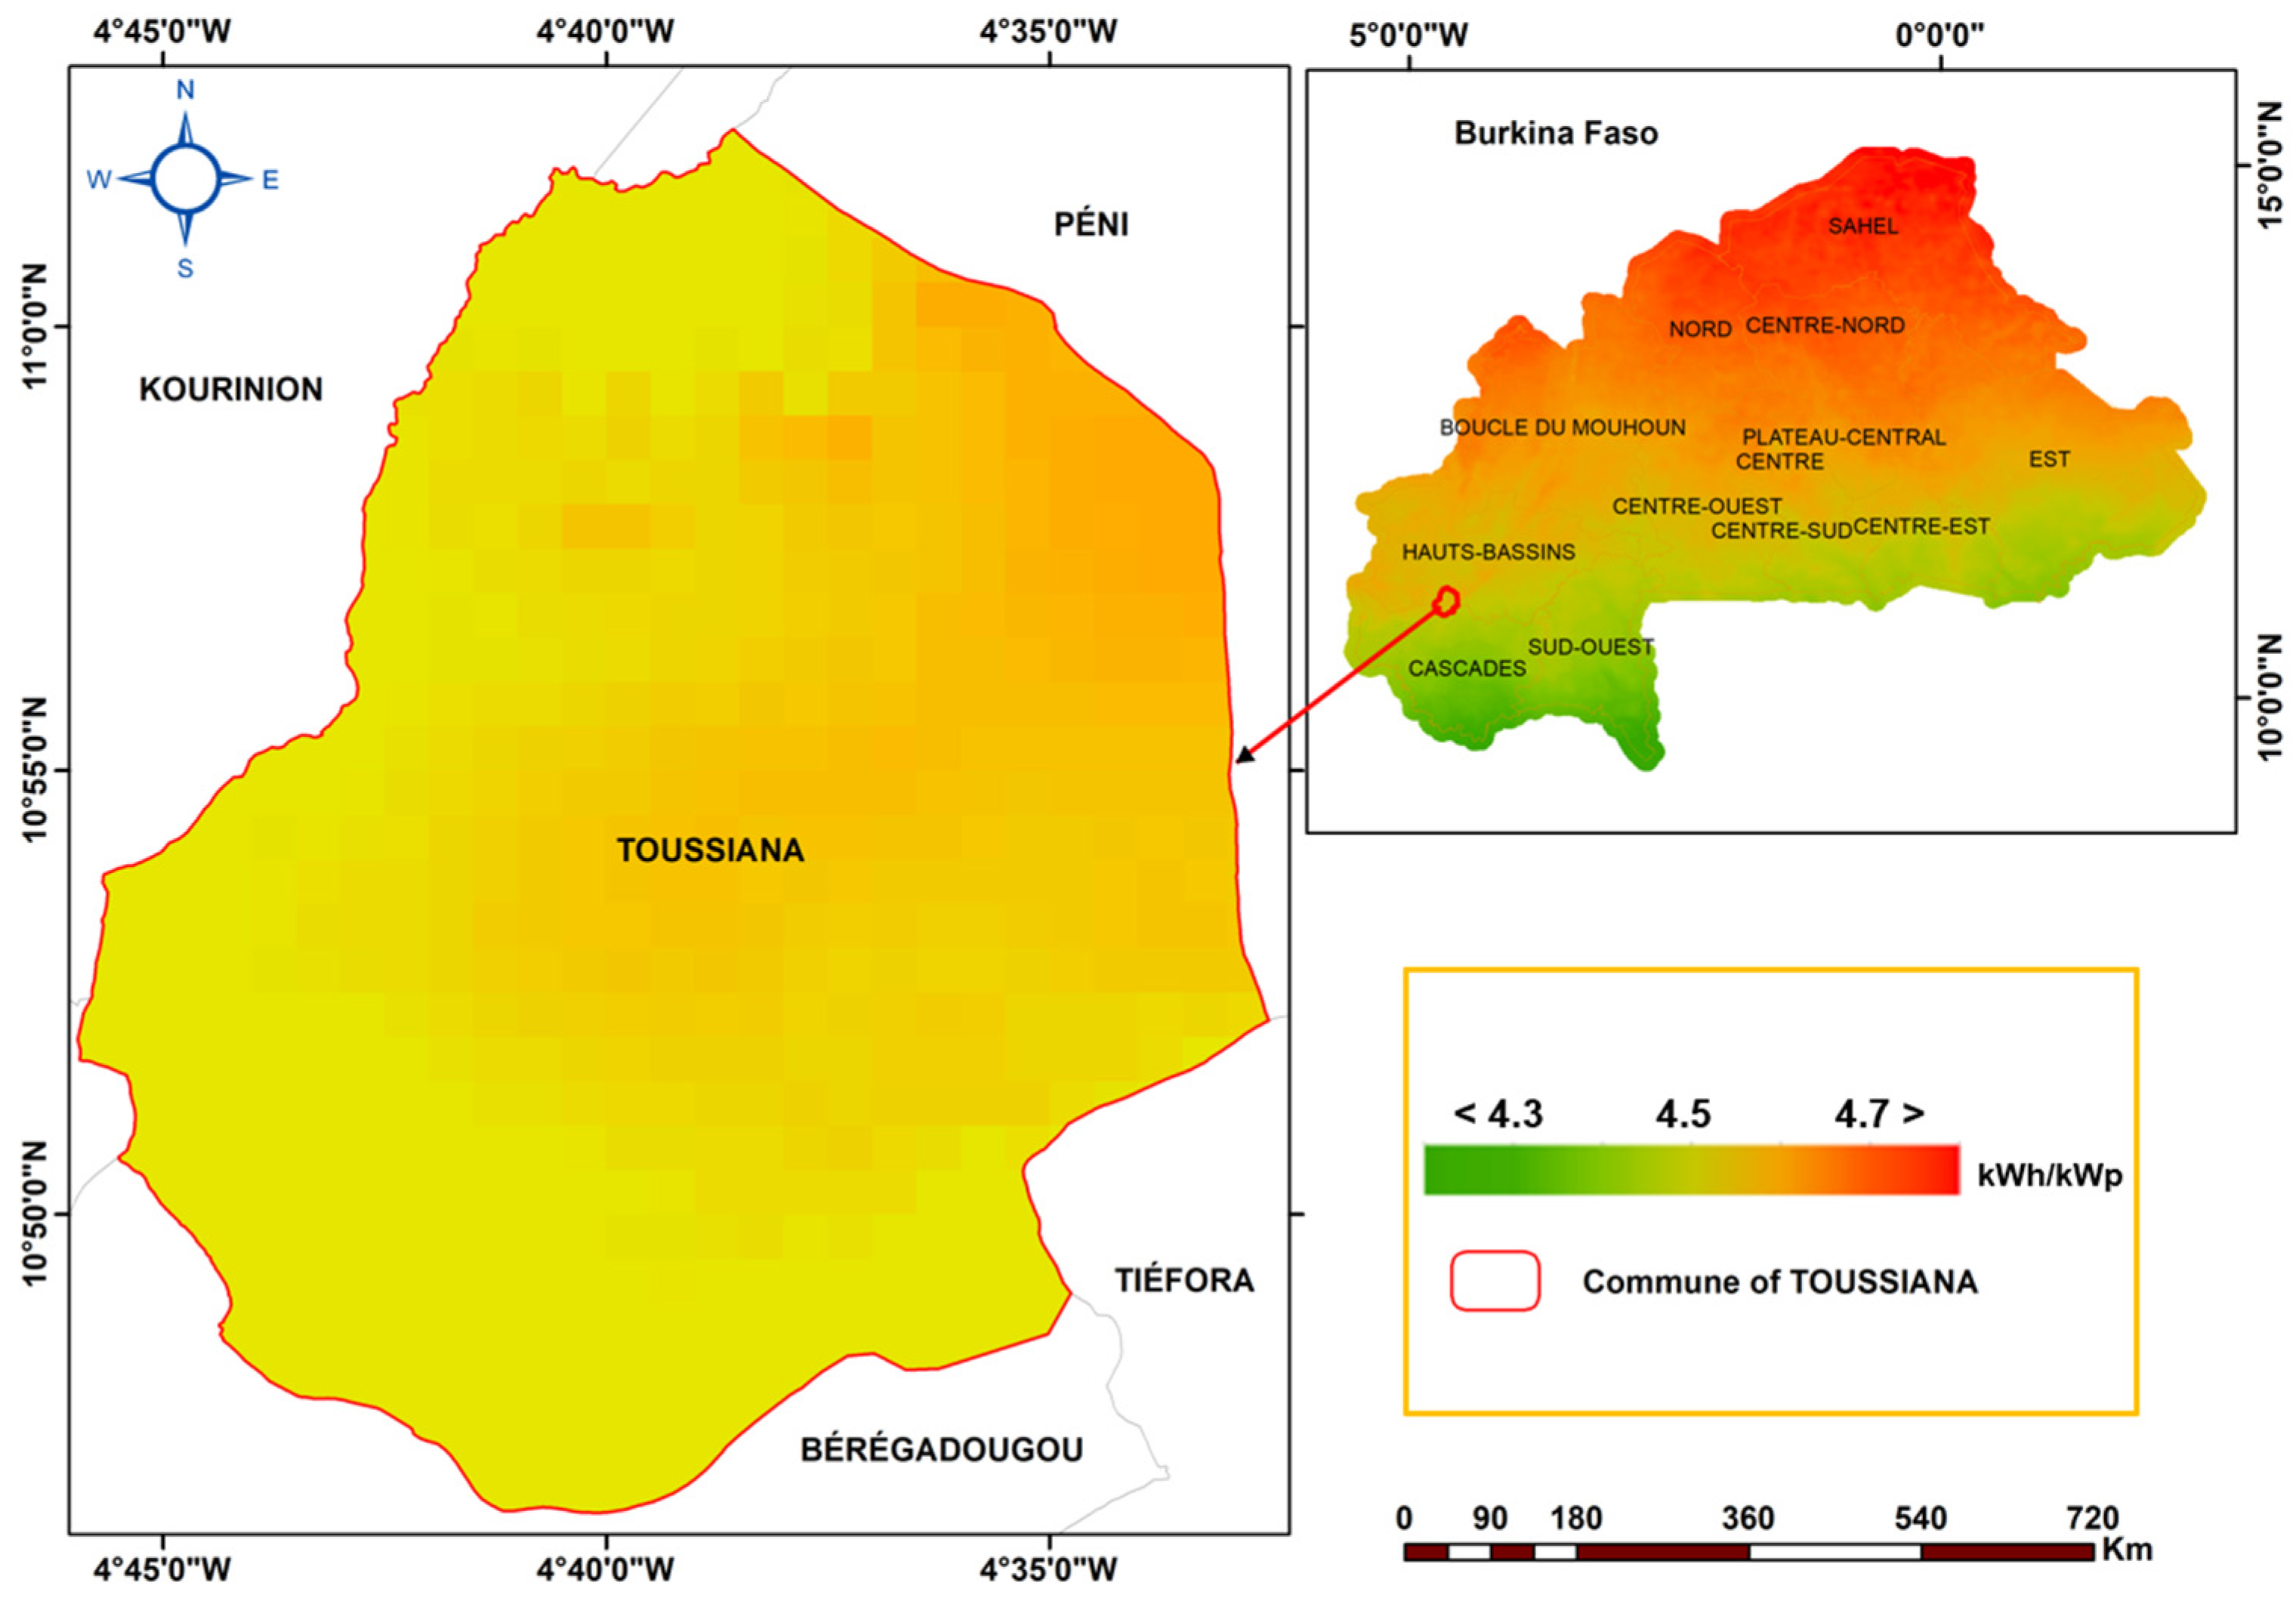
This study assessed SOTOKACC, a shea butter processing company located in the peri-urban area of Toussiana in the South-West region of Burkina Faso (10.84004 N, −4.62586 E). The company primarily relies on the MSP technique for shea butter extraction. The butter is certified as organic and fair trade by ECOCERT and is sold on European markets [17,18]. Toussiana belongs to the Sudanian-Savannah climatic zone and experiences two critical weather conditions throughout the year: a rainy season (mid-May to September) with average temperatures of 27 °C, and a dry season (October to early May). The dry season includes the harmattan (November to February), when temperatures average 25 °C, while the rest of the dry season sees averages of 31 °C. The daily average solar PV energy potential in Toussiana is estimated at 4.5 kWh per installed kWp (see Figure 1).

2.2. Description of Shea Butter Processing at SOTOKACC and Schedules

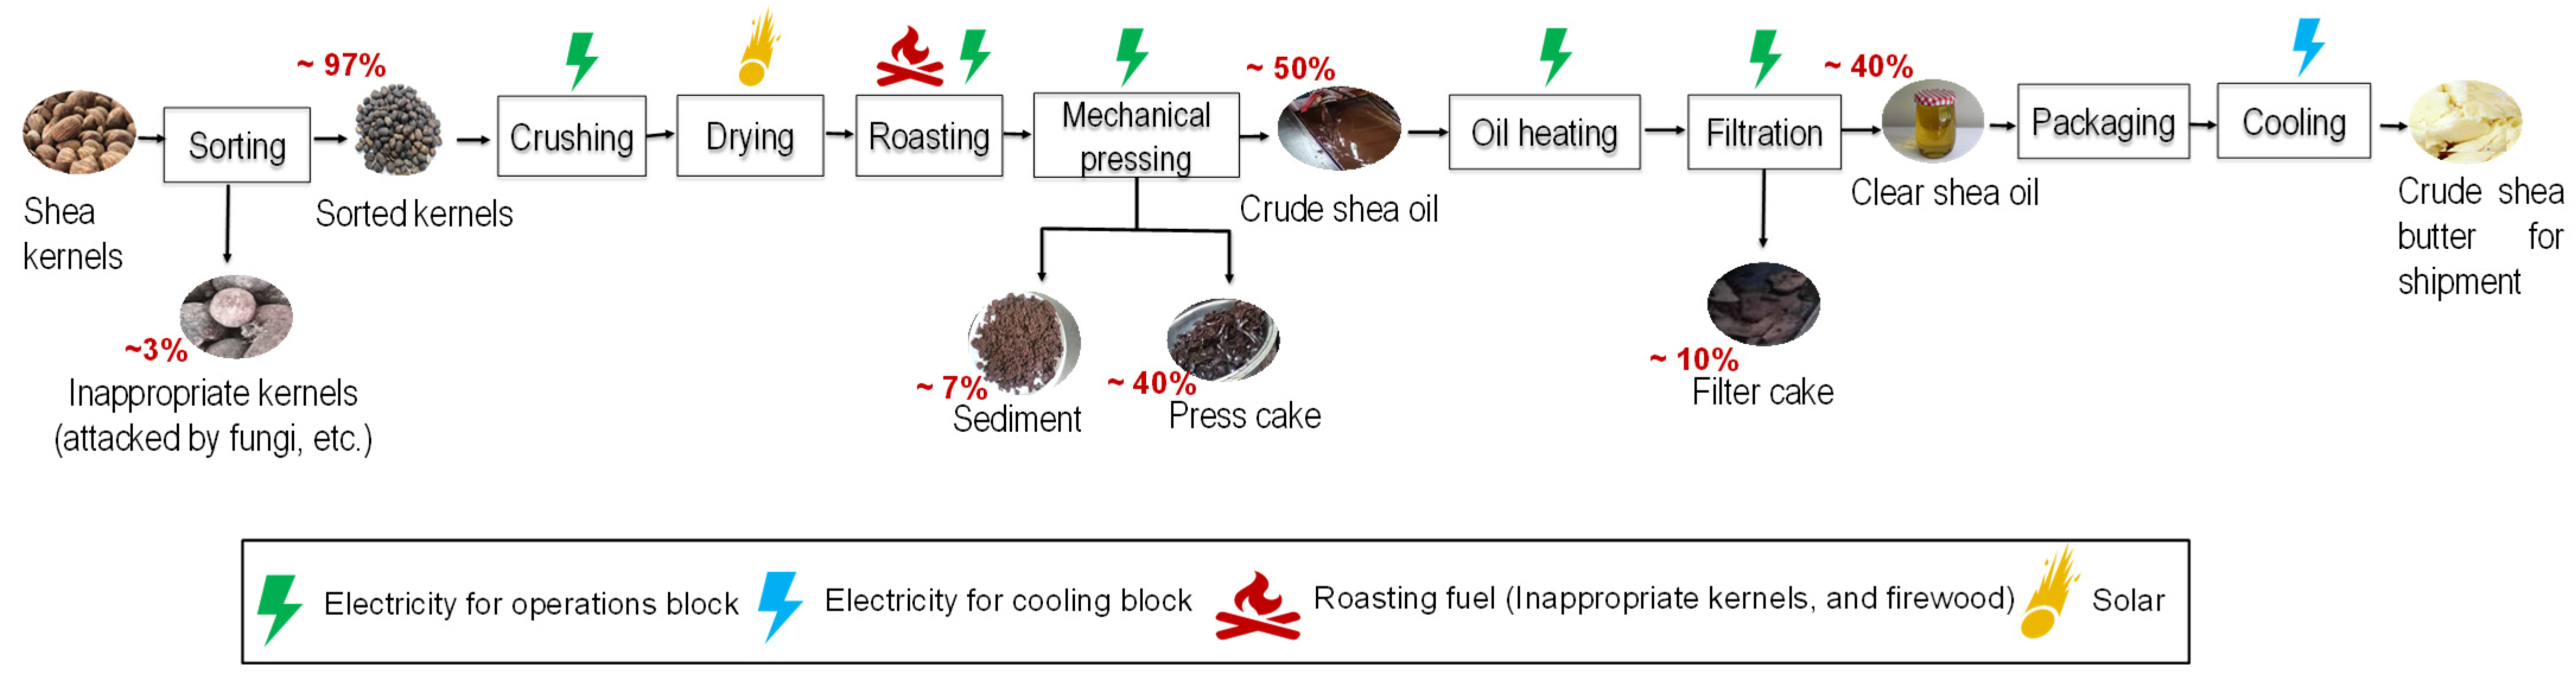
The company processes approximately 7 t of shea kernels daily, yielding 36–40% shea butter. Processing begins with manual sorting, followed by crushing and sun-drying if necessary. After sorting, about 2–3% of the inappropriate kernels for butter production are removed and used as cooking fuel. Good-quality kernels are crushed, roasted, and transported via electric conveyors to the screw presses, which extract crude shea oil—accounting for ~50% of the input mass—along with press cake (~40%) and sediment. The press cake is sold to partners, while the crude oil is collected in heated tanks to reach the required filtration temperature. The filtered, clear shea oil is stored at room temperature, packaged the following day, and kept at 18 °C until shipment. Shea oil solidifies around 20 °C to form butter. Figure 2 illustrates the shea butter processing at SOTOKACC.
The factory is supplied through the grid of the national electricity company of Burkina Faso (SONABEL). All processing operations are powered exclusively with electricity, except for roasting, which relies on biomass (firewood and discarded kernels) as a source of heat. The facility is equipped with two electric crushers, roasters, conveyors, screw presses, an electric heating system for crude oil, and a filter press. Together, these machines contribute directly to butter production and collectively constitute the “operations block”. The facility also features a “cooling block” comprising air-conditioned storage rooms, which ensures the solidification and preservation of the final butter product.
Basically, the processing plant operates at full capacity from November to February. During the full capacity period, the operations block runs from Monday at 06:00 to Saturday at 18:00, operating 24 h per day in three 8 h shifts, excluding official public holidays in accordance with Burkina Faso’s holiday calendar. The cooling block operates continuously during the entire processing period, including Sundays and official public holidays, to ensure optimal storage conditions. This study considers 2024 as the reference year to distinguish between working days and holidays.

2.3. Electrical Data Collection

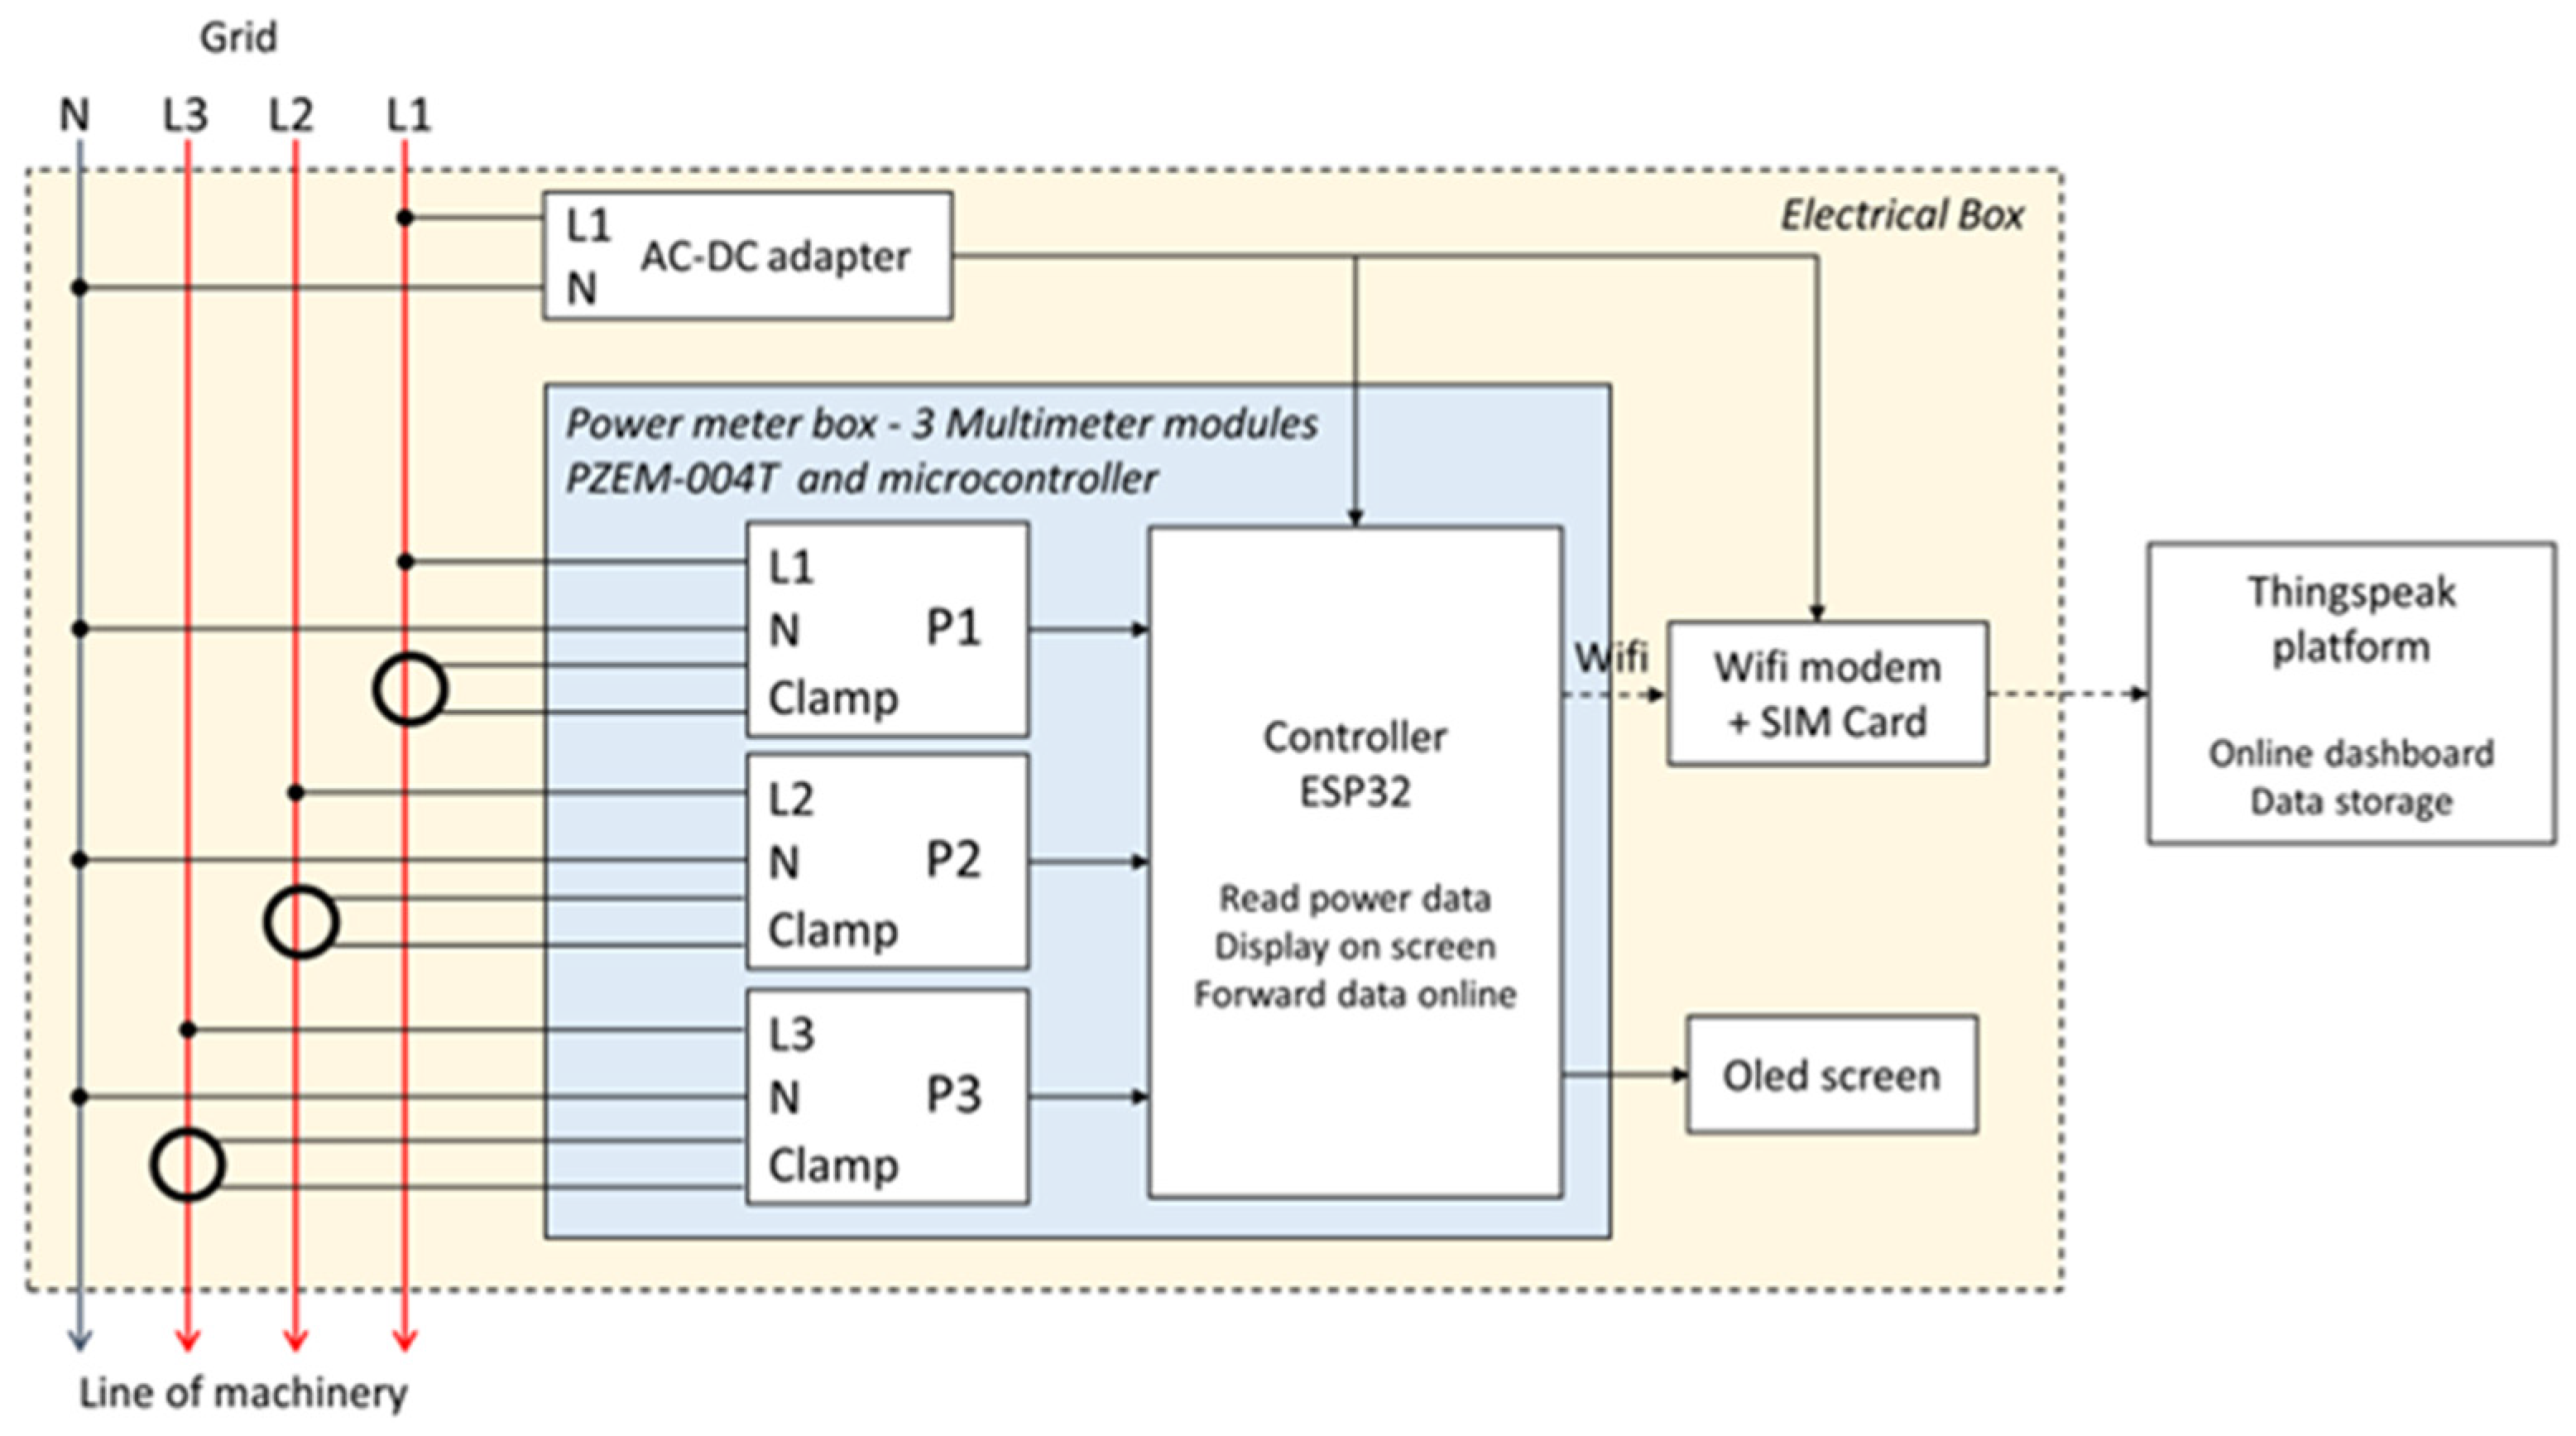
The electricity consumption of SOTOKACC’s shea butter processing plant was monitored using a remote power sensor designed by the Institute of Agricultural Engineering (University of Hohenheim, Stuttgart, Germany). The system of the sensor was composed of an Arduino-based power meter sensor and a WIFI modem assembled in a power box. The power meter was equipped with three multi-meters (PZEM-004T v.3.0, Peacefair Electronics®, Shenzhen, China), each dedicated to one phase (80 to 260 V, 0 to 100 A, 45 to 65 Hz, ±1.0% precision), monitoring voltage, current, frequency, and power factor on the three phases of the facility. The measured data were displayed on an OLED screen and forwarded to a designed dashboard on the ThingSpeak (MathWorks®, Natick, MA, USA; accessed March 2025) platform via a Wi-Fi connection. The installation scheme of the device and installation at the SOTOKACC electrical power supply are shown in Figure 3.
The remote power sensor was installed at the outlet of the electricity meter from December 2023 to February 2024.
The measurement periods were deliberately selected to capture distinct operational states of the plant. The 17–19 December and 30–31 January periods captured full processing operations, while 3–9 February was specifically chosen because processing had ceased, leaving only the cooling block active, enabling the isolation of the two load blocks via the difference method. The operations block runs Monday to Saturday, excluding official public holidays; the cooling block operates continuously seven days a week. This structured schedule ensures consistency across working days, supporting the representativeness of the derived profile.
The two measurement windows were cross-checked against each other to assess day-to-day variability, and the sensor-derived consumption was reconciled with SONABEL billing records for the overlapping production season as an independent validation of the reconstructed profile. Days affected by power outages or internal plant adjustments were excluded by selecting only continuous, uninterrupted measurement windows.
Daily energy consumption is calculated using Equation (1):
E d a y = i = 1 24 P i · t
where E d a y is the daily energy consumption (kWh); P i , the power at hour i (kW); t , the time interval.

2.4. Solar PV-Based Powering Systems Design and Sizing

2.4.1. Systems Configurations

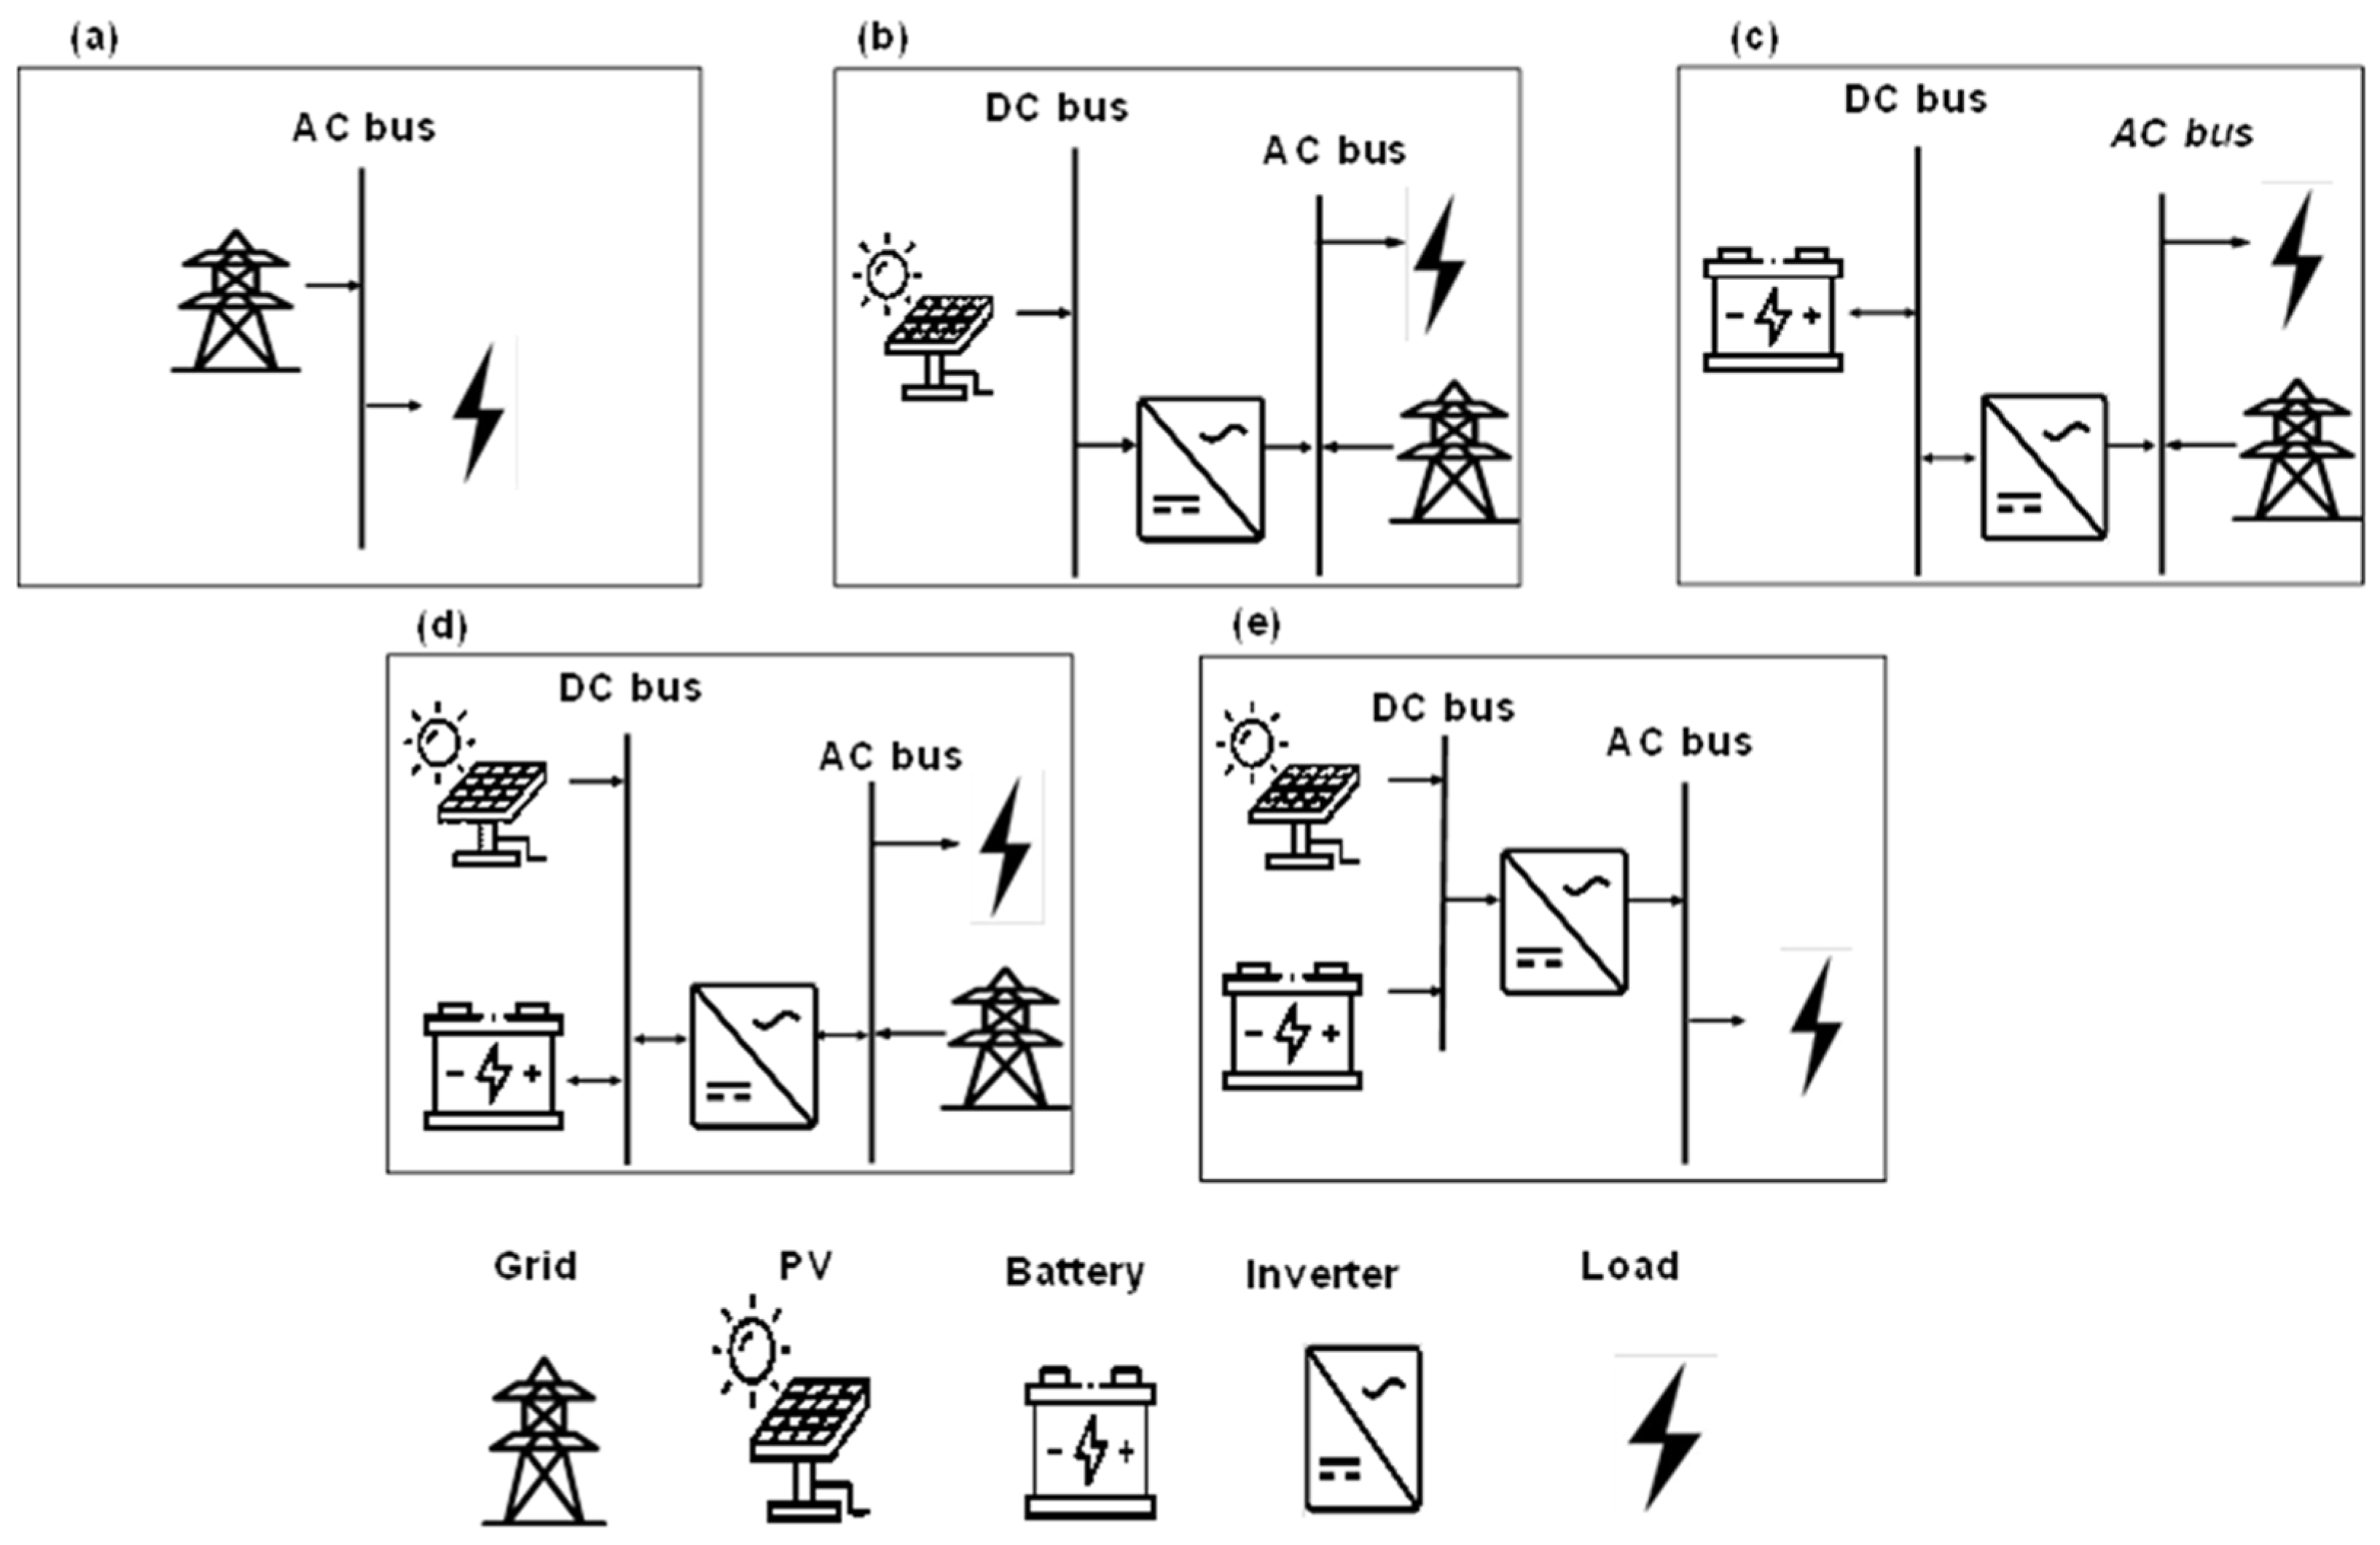
The power supply systems investigated for the shea butter processing plant focused on solar PV panels and the national grid as the only source for energy production. Electrical batteries served as an energy storage medium. Five electricity generation configurations were analyzed:
  • Configuration 1: the SME is supplied only through the grid. It represents the baseline energy access configuration. The electricity needs of the processing plant are exclusively covered using the grid.
  • Configuration 2: the SME is supplied with a grid/PV system. This configuration is a PV grid-connected system without storage. The energy produced by the PV system is injected into the local factory grid during daylight hours. The purpose of using such a configuration is to achieve a long-term reduction in electricity bills while minimizing the investment cost. When the processing plant does not operate or in case of a grid power outage, the electricity generated through the PV panels is lost.
  • Configuration 3: the SME is supplied with a grid/battery system. This power supply configuration is similar to the baseline. The only source of electricity production remains the grid. Nevertheless, the integrated battery bank serves as a backup during a power outage from the grid. It helps solve the grid unreliability. Electricity from the grid is stored and then released to power the processing plant when the grid is not available.
  • Configuration 4: the SME is supplied with a grid/PV/battery system. This configuration is built by adding storage to configuration 2. The purpose is to minimize energy losses during non-operating or power outage time. During daylight hours, when the processing plant is not operating, the energy generated by the PV is stored, and in case of a power outage, a grid-forming inverter connected to the batteries generates the necessary voltage and frequency signal, enabling the PV system to inject power and supply the SME. If the power outage occurs during night or cloudy time, the batteries alone supply the SME when the stored energy is sufficient. With this kind of configuration, the operator can prioritize battery charging with the PV system or with the grid.
  • Configuration 5: the SME is supplied with a standalone PV/battery system.
Figure 4 illustrates a schematic representation of each power supply configuration.

2.4.2. Sizing Tools and Parameters

Solar PV panel specifications were adjusted with HOMER Pro software (version 3.14.2) based on studies conducted on solar PV panel degradation in several African locations, including Northern Ghana, which has climatic conditions similar to those of Burkina Faso [20,21,22,23]. Quansah and Adaramola [20] found that mono-crystalline silicon PV panels exposed for 16 years in Northern Ghana degraded at an average annual rate of 1.5%, exceeding the standard maximum warranty rate of 0.8% per year. In this study, a 20-year lifespan was assumed for the PV panels. The 70% PV derating factor integrates fixed system losses—soiling and dust (3–5%), wiring (2–3%), mismatch (1–2%), and temperature (5–8%)—and a long-term degradation allowance of 12–17%, based on a 0.5–0.8%/year decline over the 20-year project lifetime. Applied as a fixed end-of-life average, this conservative composite value is standard practice in HOMER Pro feasibility assessments and ensures that LCOE and IRR estimates are bounded from below, making the economic conclusions more robust rather than less. Degradation was not modeled separately in HOMER Pro, so there is no double-counting of losses. The temperature coefficient of efficiency of the solar PV panels was −0.330%/°C, reflecting the specifications from datasheets of commonly available PV panels on the local market [24,25].
Lithium-ion (Li-ion) battery technology was selected for simulations. The battery bank is assumed to be installed in the shade, in an isolated and well-ventilated room with an average exposure temperature of 30 °C considered. Market assessments conducted in Ouagadougou, Burkina Faso, identified commonly sold Li-ion battery brands, with Huawei being among the most common. The datasheet indicates that under 30 °C, a capacity retention rate of 82% can be expected over 10 years, along with 3200 charge–discharge cycles at 90% depth of discharge, with a 10% minimum state of charge [26]. In the grid/PV/battery configuration, the cycle charging dispatch strategy was applied in HOMER Pro, under which the battery charges from surplus PV generation and, when the state of charge falls below the minimum threshold, and PV is insufficient, from the grid during low-load periods.
Solar inverters were sized considering 97.7% efficiency and the 10-year warranty period typically given by manufacturers as the lifespan.
System simulations allowed for a maximum of 10% annual capacity shortage, selected based on the plant’s operational characteristics: the crushing, filtration, and cooling blocks account for approximately 16–17% of total energy demand, and short interruptions to crushing and filtration are not significantly disruptive as these processes can be paused and resumed without material loss. This threshold is further grounded in the batch-mode nature of the mechanical screw press cycle, which operates on a scheduled daily rotation: a temporary shortfall in energy supply triggers a brief pause in processing but does not result in raw material loss, as shea kernels are thermally stable at ambient temperatures throughout the processing season. Moreover, in the context of rural agro-industrial operations in sub-Saharan Africa, a 10% annual energy shortfall is consistent with the grid reliability conditions that processing facilities already contend with under grid-only supply—as reflected in the SONABEL’s system average interruption frequency index (SAIFI) and system average interruption duration index (SAIDI) statistics used in this study—and therefore does not constitute a stricter constraint than the baseline operational environment. The 10% threshold is consequently interpreted not as an economic concession but as a realistic reflection of the operational resilience built into the plant’s production scheduling.
Simulations were conducted using a nominal discount rate of 9%, reflecting the maximum cost of debt prescribed for mini-grid tariff setting [27]. The inflation rate was set at 3.7% based on recent trends observed in the West African Economic and Monetary Union [28]. The study simulated the power supply configurations over a 20-year period.
Climatic inputs, including Global Horizontal Irradiation (GHI), the Clearness Index, and ambient temperature data specific to Toussiana, were compiled from the Global Solar Atlas (Energy Sector Management Assistance Program, the World Bank Group) over a 22-year period (January 2000–December 2022). Monthly average GHI in Toussiana ranges from 5.67 to 7.06 kWh/m2/d. The clearness index, which reflects the atmospheric transparency to solar radiation, varies between 0.63 and 0.66. Monthly average temperatures range from 24.10 °C in December to 31.17 °C in April.
In hybrid systems, the plant’s daily energy is supplied by both the grid and the PV array:
E d a y = E P V + E g r i d
where E P V and E g r i d in kWh/d represent the daily energy consumption covered by the solar PV system and the grid, respectively.
The required size of the solar PV array P P V   p e a k expressed in kWp, is calculated as:
P P V   p e a k = E P V · G S T C G H I · [ 1 + β T c T S T C ] · f d e r a t i n g
where GHI (kWh/m2/d) is the daily sum of global horizontal irradiation, GSTC the reference irradiance under standard test conditions (1000 W/m2), β (1/°C) the temperature coefficient which characterizes temperature-related efficiency losses in the PV modules, T c (°C) is the actual PV cells temperature, T S T C is the reference temperature (25 °C), and f d e r a t i n g (-) the overall system derating factor to account for actual local conditions.
The inverter rating ( P i n v e r t e r ) depends on the system’s peak load requirement ( P p e a k ) and the conversion efficiency of the inverter ( η i n v e r t e r ):
P i n v e r t e r = P p e a k η i n v e r t e r
The battery storage capacity ( E b a t t e r y ), expressed in kWh, is computed based on the plant’s daily energy requirement, the efficiency of the battery system ( η b a t t e r y ), and the usable state-of-charge (ΔSOC) window. The sizing expression is shown as:
E b a t t e r y = E d a y   S O C · η b a t t e r y
where SOCmax and SOCmin are the maximum and minimum state-of-charge, and   S O C = SOCmaxSOCmin
The economic parameters for the main components of the solar PV system, comprising PV panels, batteries, and inverters, were established based on a local market assessment. Capital and replacement costs were estimated at USD 700 for 1 kWp of PV panels, USD 483.33 for 1 kWh of Li-ion battery, and USD 416.66 for 1 kW inverter. These values include all expenses associated with the commissioning of each component, such as labor, civil works, electrical connections, and cabling. The annual O&M costs were set at USD 66.67 for PV panels, USD 8.33 for batteries, and USD 33.33 for inverters (equivalent to 40,000 XOF, 5000 XOF, and 20,000 XOF, respectively), based on local market consultations conducted during the field investigation.

2.5. Input Parameters for Sizing

2.5.1. Annual Load Profile

Data recorded by the remote power sensor served as the baseline for creating a dynamic yearly load profile aligning with the working calendar followed in the company.
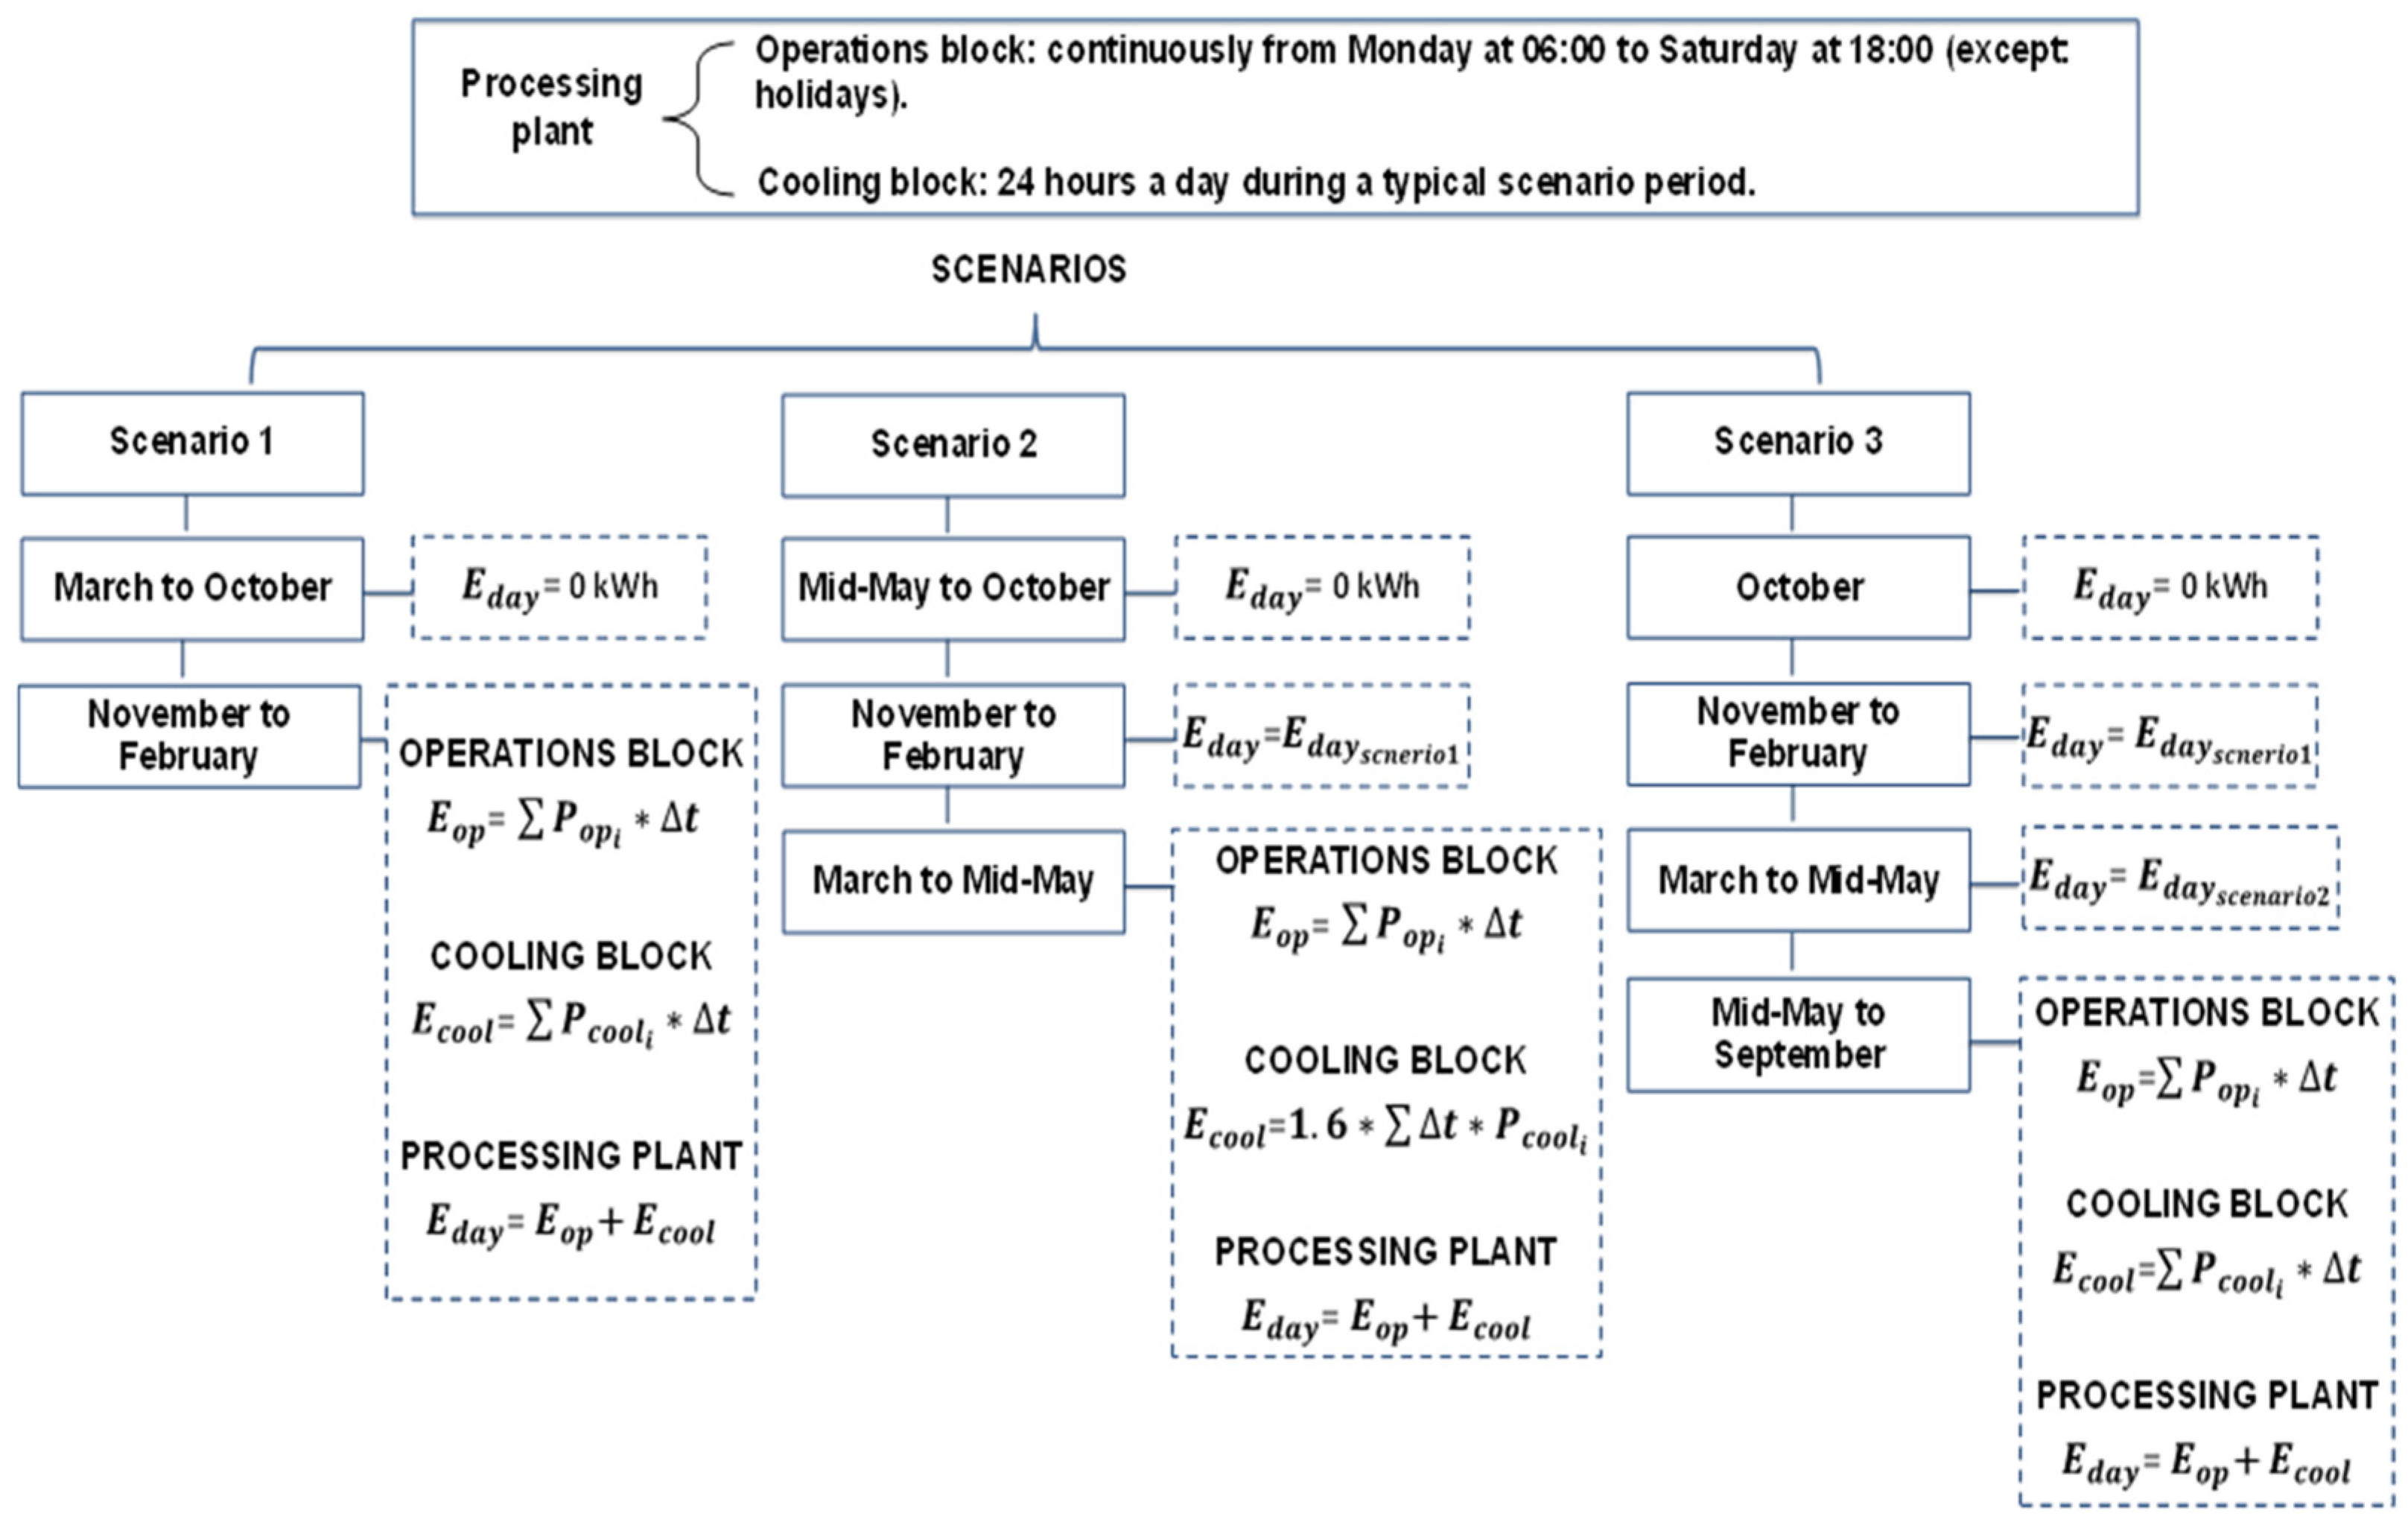
The analysis considered three scenarios:
  • Scenario 1: Business as Usual—As commonly observed, operations are restricted from November to February. The energy demand for the entire processing plant outside these months is assumed to be zero.
  • Scenario 2: Extension over the dry season—Processing activities are extended to cover the entire dry-hot period. The profile is therefore extended from November to mid-May; the energy demand outside this period is assumed to be zero.
  • Scenario 3: Extension over the year—Processing is conducted for eleven months, spanning both the dry and rainy seasons (November to September), with October designated for plant maintenance. Therefore, energy demand for October is assumed to be zero.
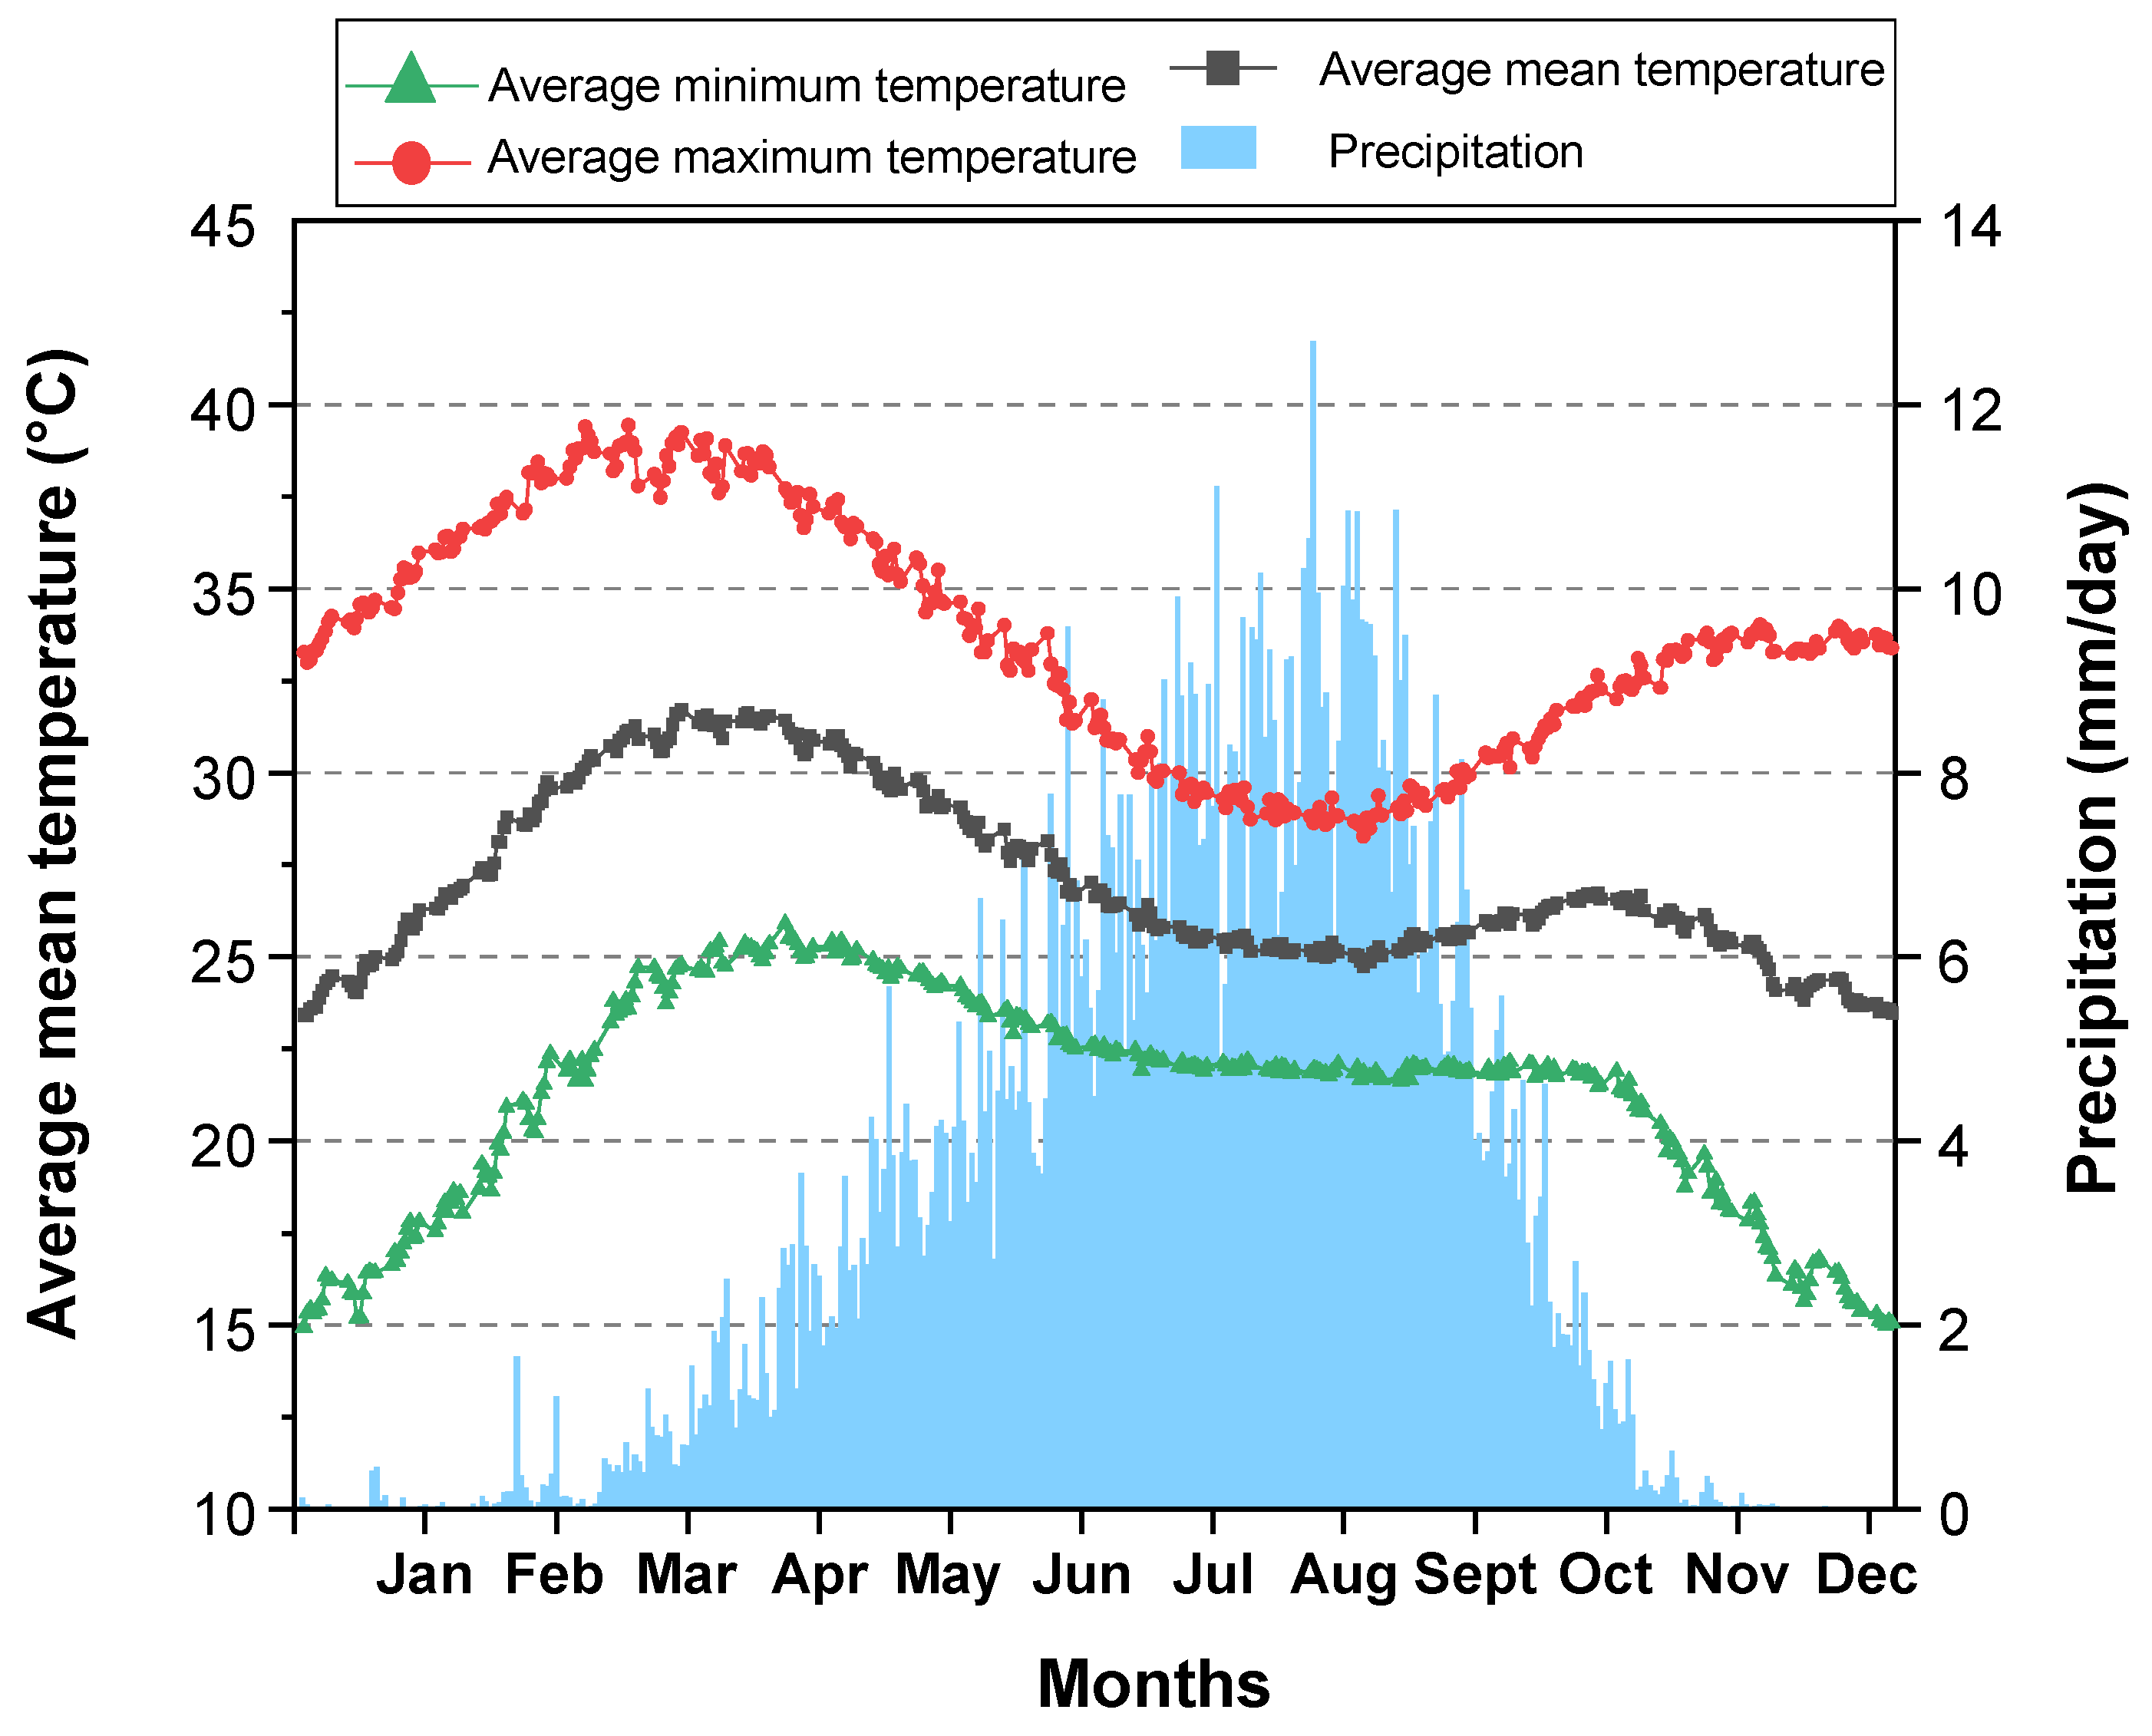
Energy consumption by the cooling block at SOTOKACC fluctuates throughout the year due to weather variations. The cooling block, consisting of air conditioners in a standard room, operates similarly to residential space cooling. Average daily temperatures in Toussiana rise from approximately 25 °C during November–February to 31 °C during March–early May, a delta of 6 °C (Figure 5).
Yao [30] reports that above 25 °C, each 1 °C increase raises electricity demand for cooling by more than 6.7% in the Sahel. Similar research conducted in Sahelian cities, including Ouagadougou, Niamey, Bamako, and Kano, reported a 6–10% increase in electricity demand for cooling per 1 °C rise in temperature above a threshold of 22 °C [31]. Applying this elasticity to the 6 °C delta yields a 60% increase (6 °C × 10%/°C = 60%), corresponding to a multiplier of 1.6, translating to an increase in cooling energy demand from 76.5 kWh/day to 122.4 kWh/day. The cited elasticities were derived from Sahelian settings sharing key characteristics with SOTOKACC (similar climate zone, ambient temperature range, and split-type air conditioning technology).
The different daily energy consumptions of the operating block ( E o p ), the cooling block ( E c o o l ) and the entire processing plant ( E d a y ) can be estimated through Equations (6), (7), and (8), respectively.
E o p = P o p i · t
E c o o l = P c o o l i · t         f r o m   N o v e m b e r   t o   F e b r u a r y       1.6 · P c o o l i · t                             f r o m   M a r c h   t o   m i d M a y
E d a y = E c o o l + E o p
where P o p i and P c o o l i are the hourly power for the operations and cooling blocks, respectively.
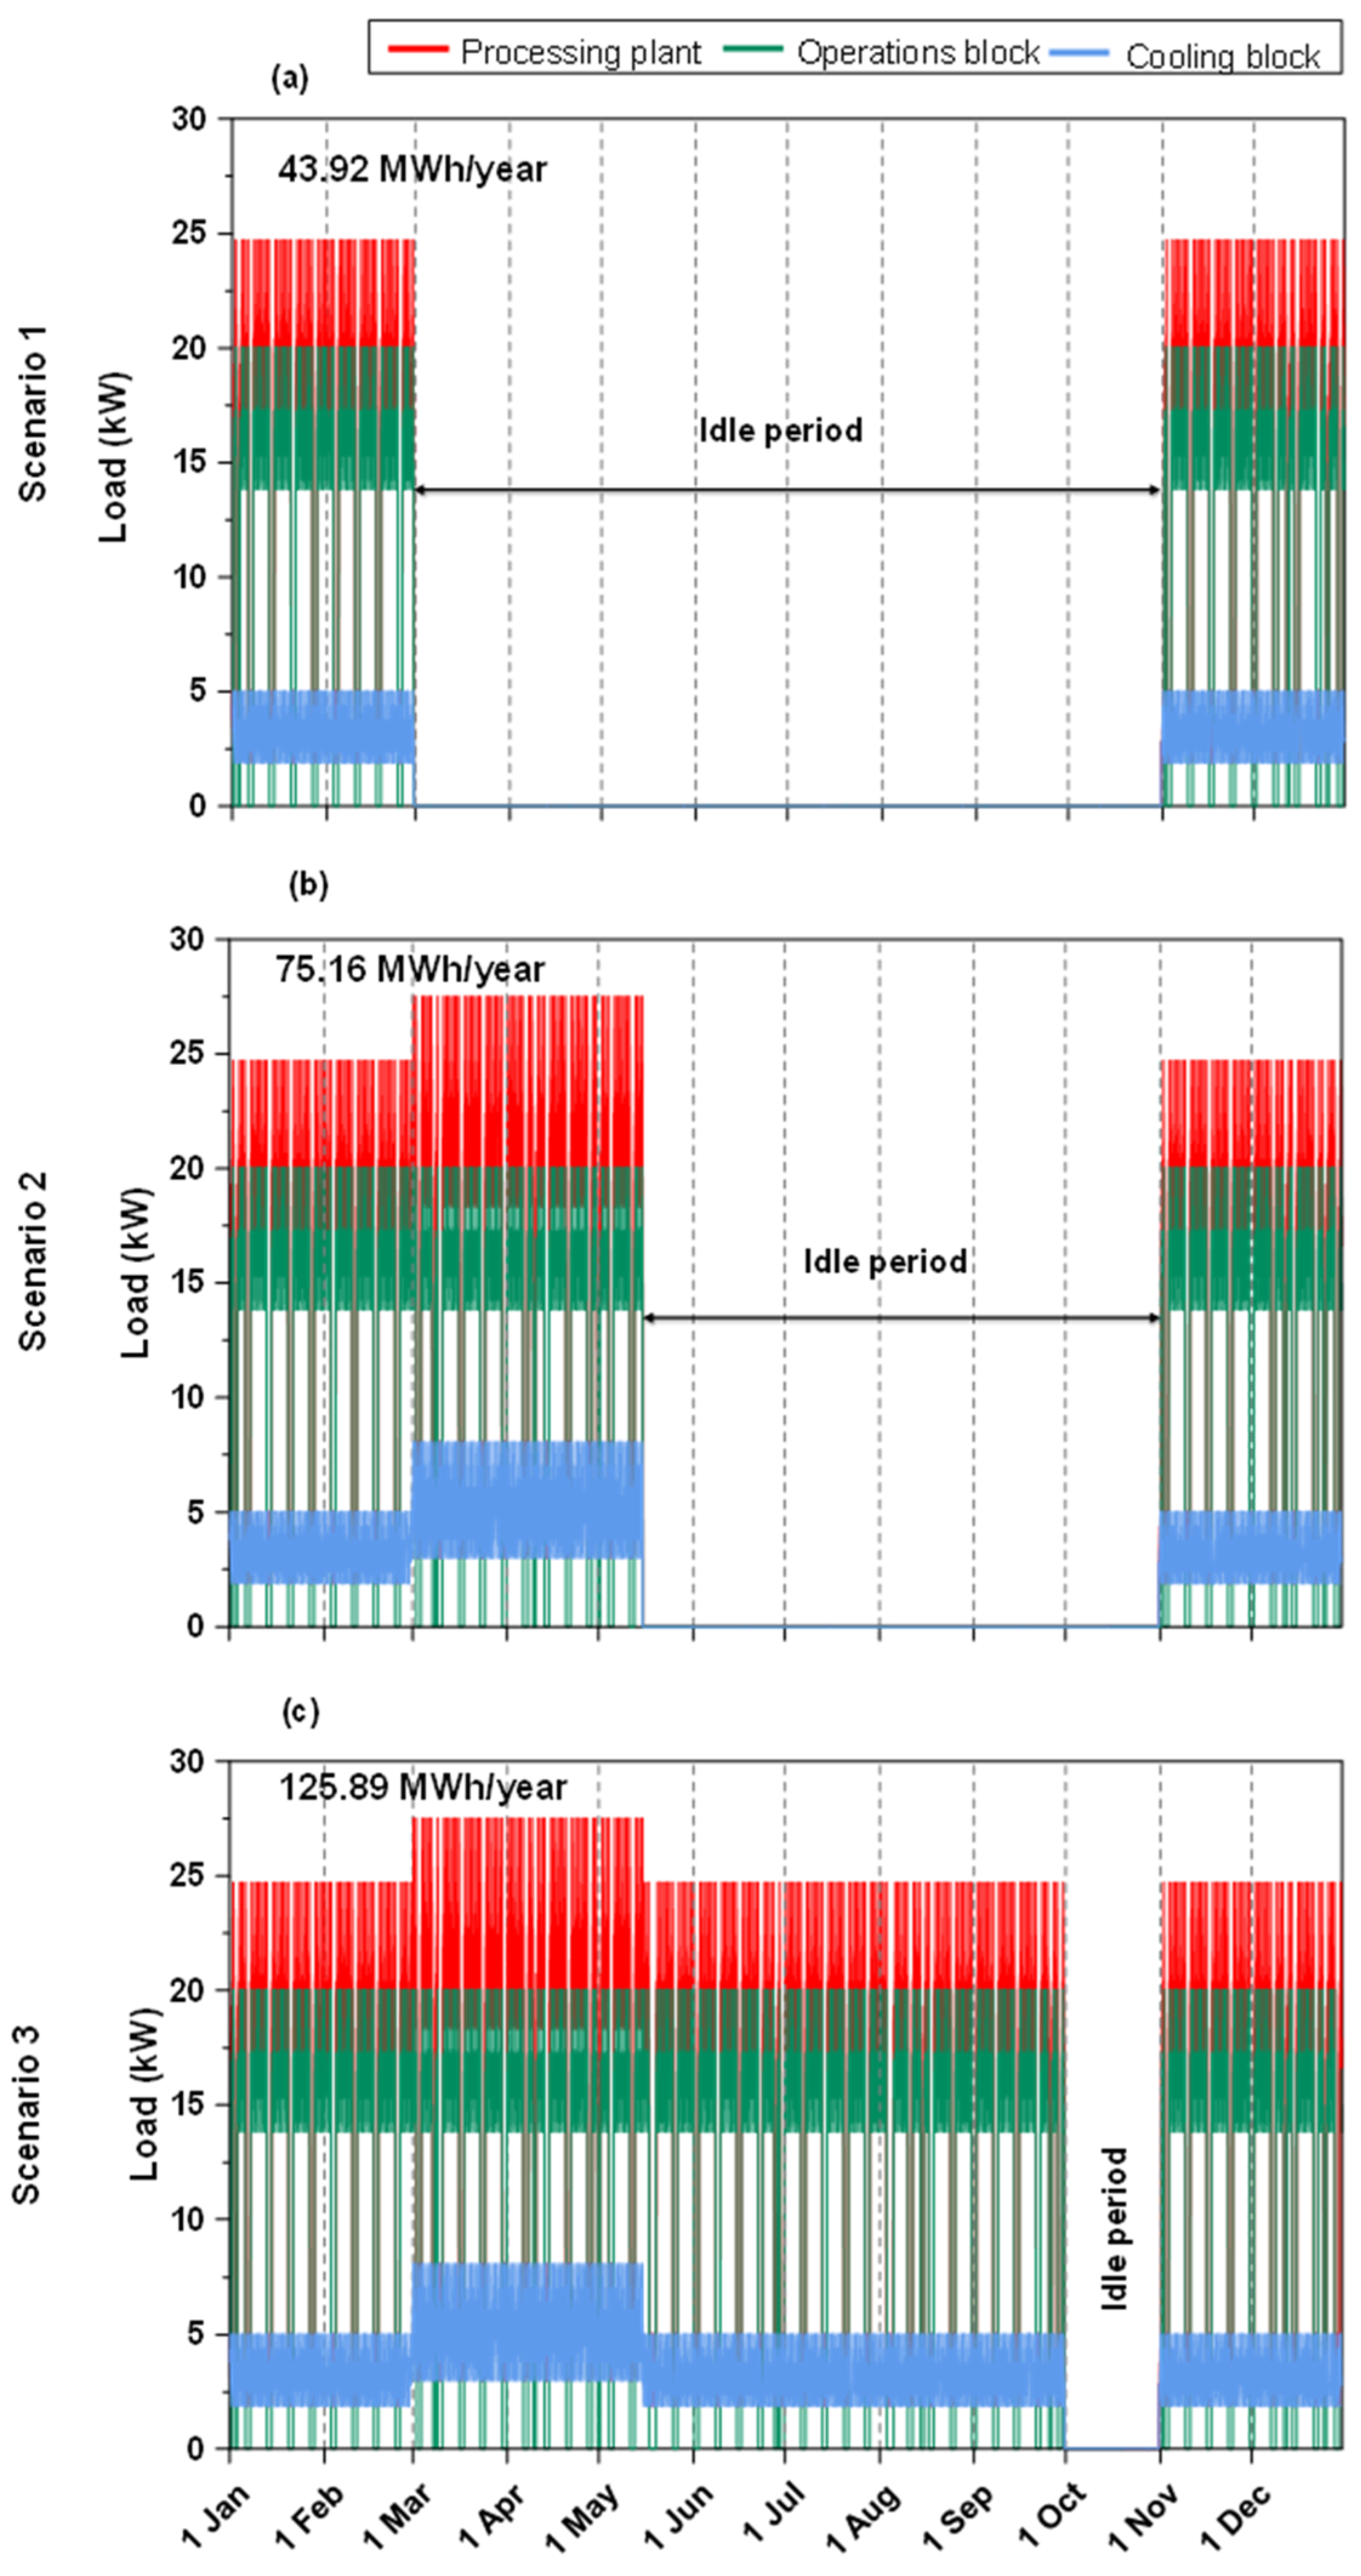
A detailed consideration of the yearly load profile, including the energy demand dynamics under each scenario, is presented in Figure 6.

2.5.2. National Grid’s Parameters

The electricity consumption patterns of the SOTOKACC processing plant have been simulated on HOMER Pro software for both comparison analysis and to assess suitable hybrid powering solutions. Simulation of the national electricity grid was carried out under the scheduled rates option of HOMER Pro. Information on grid reliability was based on the latest data on SAIFI and SAIDI published by SONABEL [32]. In 2022, Burkina Faso recorded an average SAIFI of 82 interruptions per customer and a SAIDI of 77 h. The mean repair time per interruption was derived from the ratio of SAIDI to SAIFI, resulting in an estimated duration of approximately 0.93 h per interruption.
Interconnection charges were considered as zero as the meter is an existing asset of the company, and no feed-in back to the grid was considered. To parameterize the electricity rate in HOMER Pro, monthly electricity bills of the processing plant over the production period from November 2021 to April 2022 were analyzed. SONABEL electricity bill includes the following components: cost of active energy during off-peak and peak hours, monthly fixed charge, penalties for exceeding subscribed power, rural electrification support tax (TDE), media activities development tax (TSDAAE), meter renting tax, maintenance tax, and VAT. The average grid tariff (tgrid) integrates all these components, calculated as the total monthly bill divided by total monthly consumption in kWh, averaged over the billing period. Although Loi n°014-2017/AN provides a legal basis for auto producers to inject surplus electricity into the national grid, subject to ministerial authorization, no operational net metering or feed-in tariff mechanism had been established for medium-voltage industrial consumers in Burkina Faso at the time of the study (2021–2023) [33,34]. Any surplus PV generation was therefore assumed to be curtailed with no associated revenue.
The average grid tariff ( t g r i d ) of electricity, integrating all components of the electricity bill, is given by Equation (9):
t g r i d = C e l E a
where C e l is the cost of a monthly electricity bill in USD, and E a is the total active energy consumed during a month in kWh.

2.6. Technical and Economic Performance Indicators

2.6.1. Levelized Cost of Energy (LCOE) and Net Present Cost (NPC)

The levelized cost of energy (LCOE) as computed on HOMER Pro expresses the cost per unit of energy effectively consumed. It accounts for the total annualized cost and the energy used by the entire processing plant. The total capital cost ( C c a p e x ) includes the acquisition and installation of the solar PV components. It does not account for costs associated with land purchase or lease, as it is assumed to be an existing asset of the processing company. The capital cost is annualized using the capital recovery factor (CRF). Operation and maintenance expenditures ( C o p e x ) cover every cost associated with the system’s operation. Equations (10)–(13) explain LCOE calculation procedures.
d r = 1 + d n 1 + i n 1
C R F = d r 1   +   d r ) N 1   +   d r ) N 1
A c o s t = ( C c a p e x · C R F ) + C o p e x
L C O E = A c o s t E c o n s
With d r and d n , the real and nominal discount rates, respectively, in the inflation rate. N, the project lifetime in years, A c o s t , the total annualized cost in USD, and E c o n s , the annual electrical energy consumption of the plant.
The net present cost (NPC) of a power supply system represents the total cost of installing and operating the system over its entire lifetime, expressed in present value terms. It accounts for all capital, replacement, operation, maintenance, and cost of purchasing electricity from the grid. These costs are then discounted to the present using the real discount rate:
N P C = A c o s t C R F

2.6.2. Load Factor and Excess Energy Generation

Each simulated scenario was sized to align with the specific energy demands and operational requirements of the shea butter processing plant. The performance of the resulting solar PV powering systems was evaluated by the load factor (Lf) and excess energy (Eexcess), which was produced.
The load factor L f reflects the proportion of the actual energy output to its maximum potential over a given period:
L f = 1 n P i · t P p e a k · t · n
where n is the total number of time steps within the year. In this research, load factor was computed with n = 8760, which is the number of hours in a year.
The excess energy E e x c e s s indicates the energy generated by the solar PV system beyond current simulated consumption needs, i.e., the energy which is not utilized by the processing plant:
E e x c e s s = E g e n E c o n s E u n m e t
where E g e n , E c o n s , and E u n m e t represent the generated energy from the entire powering system, the total energy consumed, and the unmet energy by the system, respectively.
Load factor and excess energy directly affect the LCOE, which is the key indicator of solar PV systems’ affordability and adoptability [35,36,37,38].

2.6.3. Discounted Payback Period (DPP) and Internal Rate of Return (IRR)

Economic performance of the powering configurations was evaluated using the discounted payback period (DPP) and the internal rate of return (IRR). The DPP indicates how long it will take to recover the initial investment associated with each scenario while factoring in the time value of money, and the IRR informs on profitability. In this analysis, the nominal discount rate is considered as the required return rate, against which the computed IRR is compared to assess the project’s financial viability.
HOMER Pro computes the economic performance of each proposed off-grid or hybrid system as compared to the national grid energy supply based on the logic expressed in Equations (17) and (18)
t = 0 D P P C t 1   +   d r ) t C c a p e x
t = 0 N C t 1   +   I R R ) t = 0
where C t stands for the net revenues acquired in response to the switch from the grid to other power configurations in year t.

3. Results

3.1. Shea Butter Processing Plant Power Profile

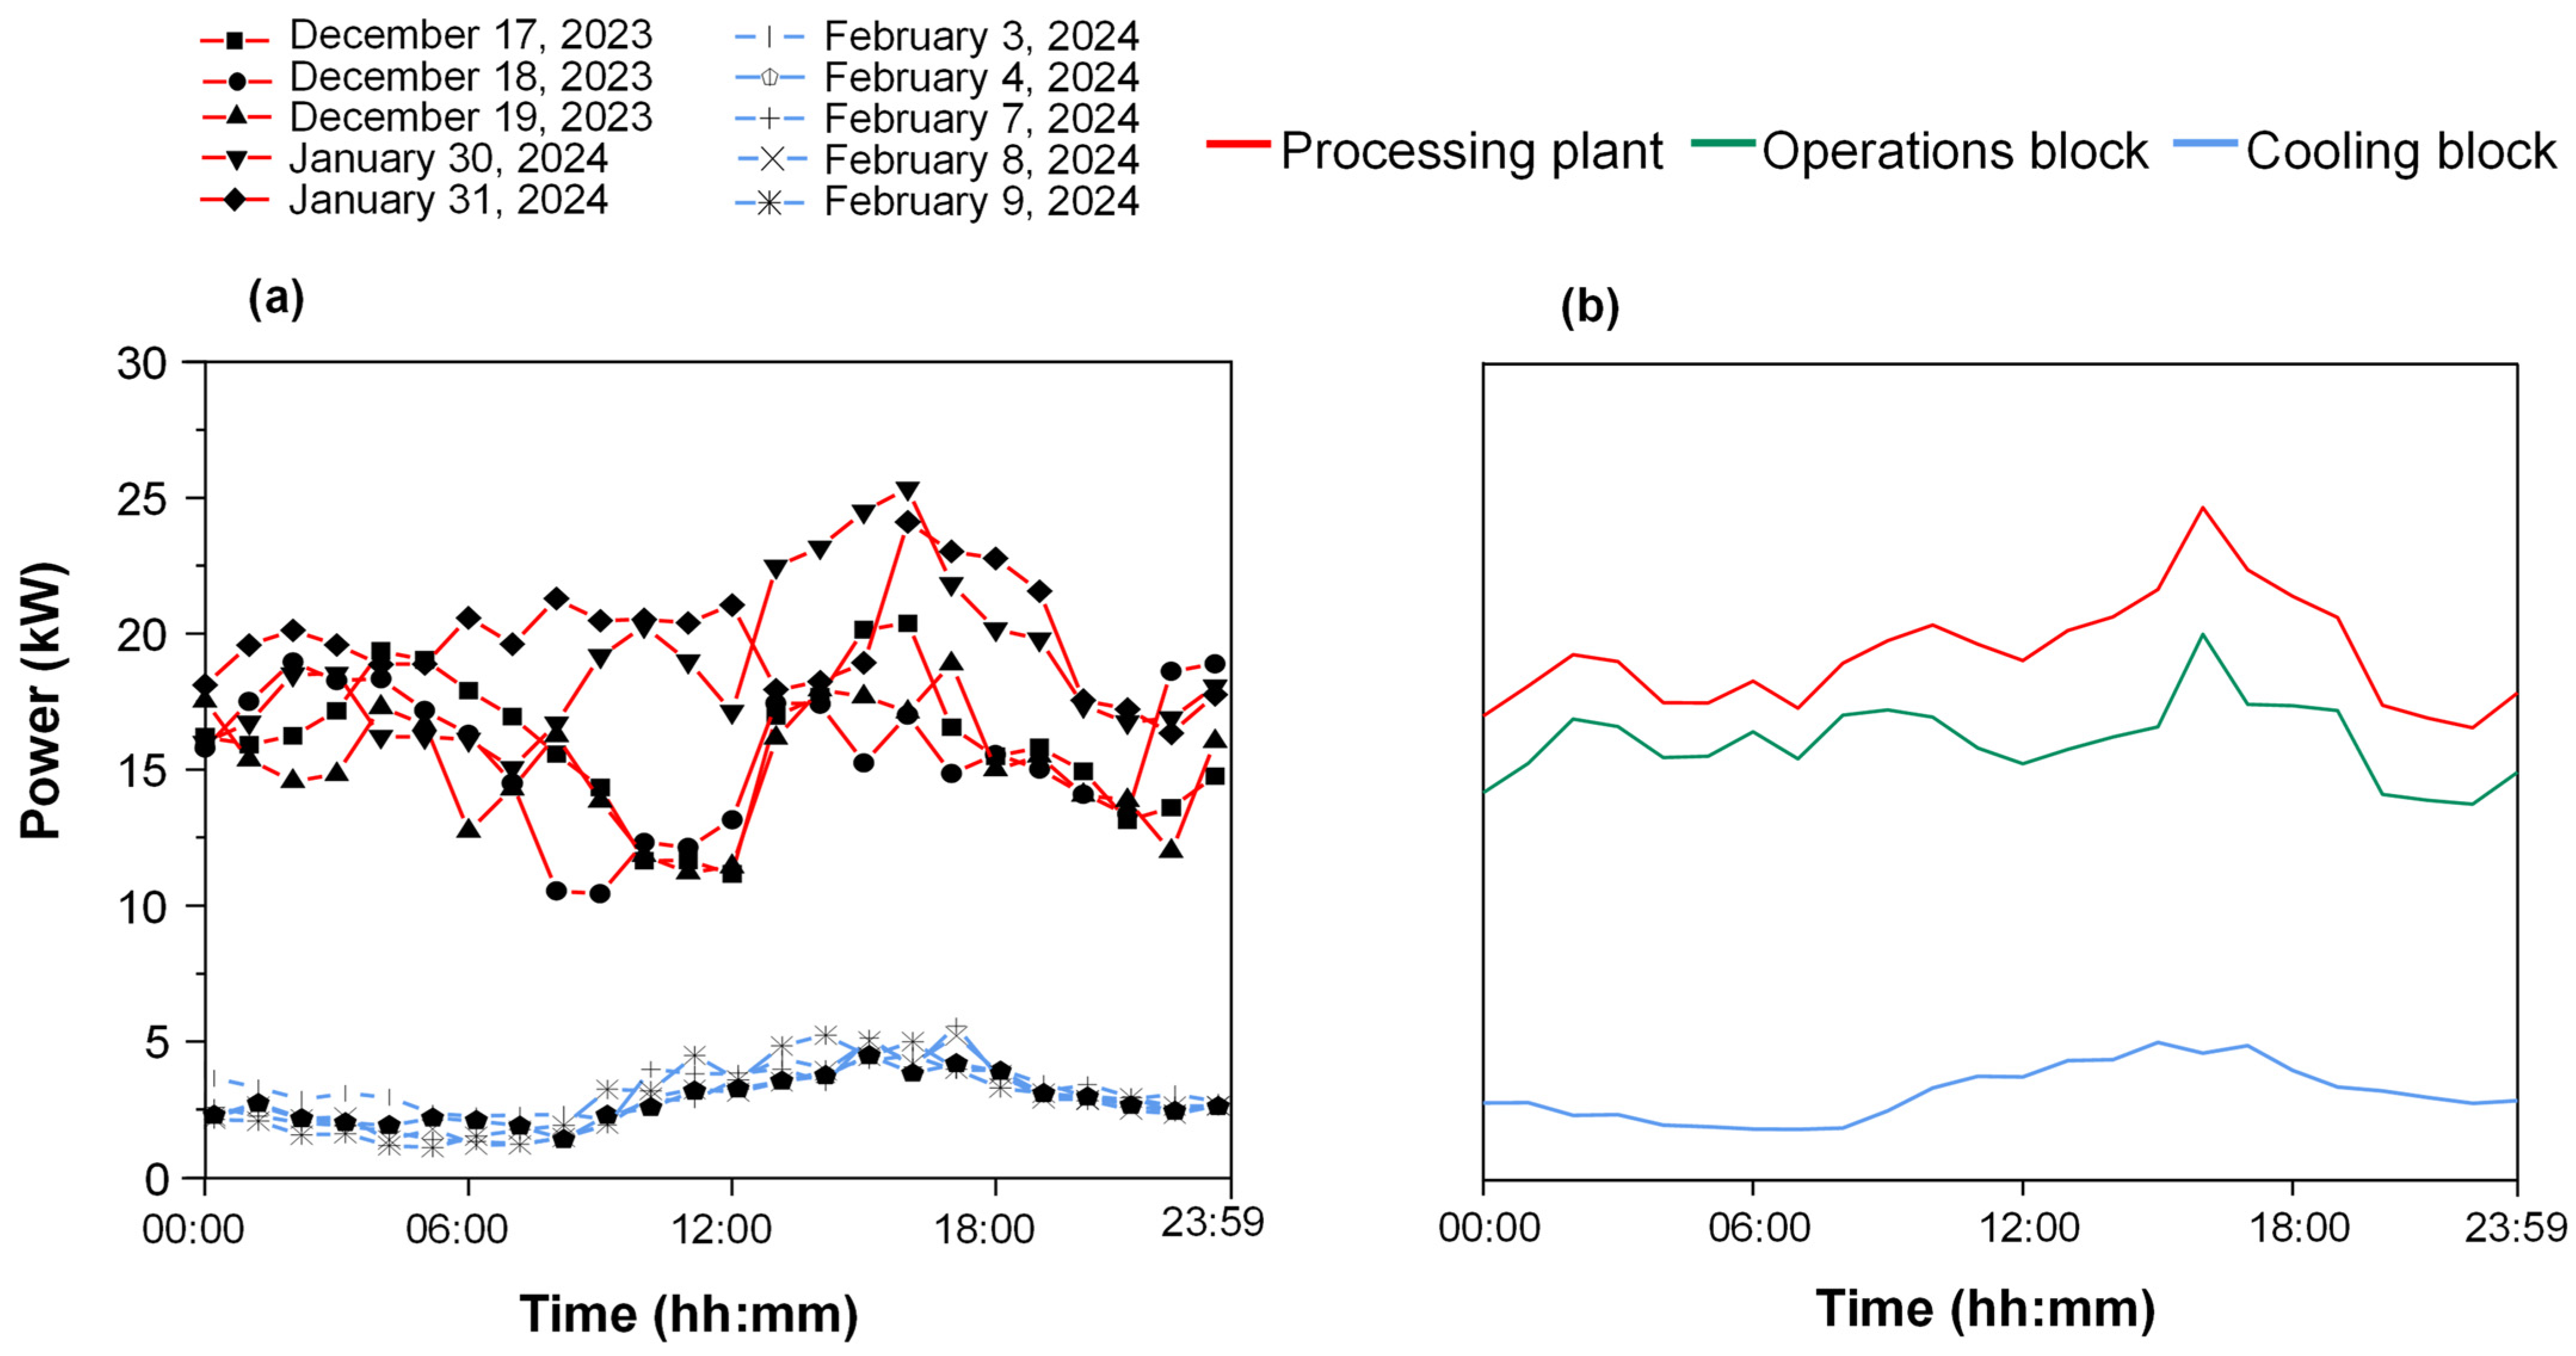
Figure 7a presents the power profiles from the day of continuous measurements with the remote power sensor, and Figure 7b illustrates the daily average energy consumption patterns across different blocks of the shea butter processing plant.
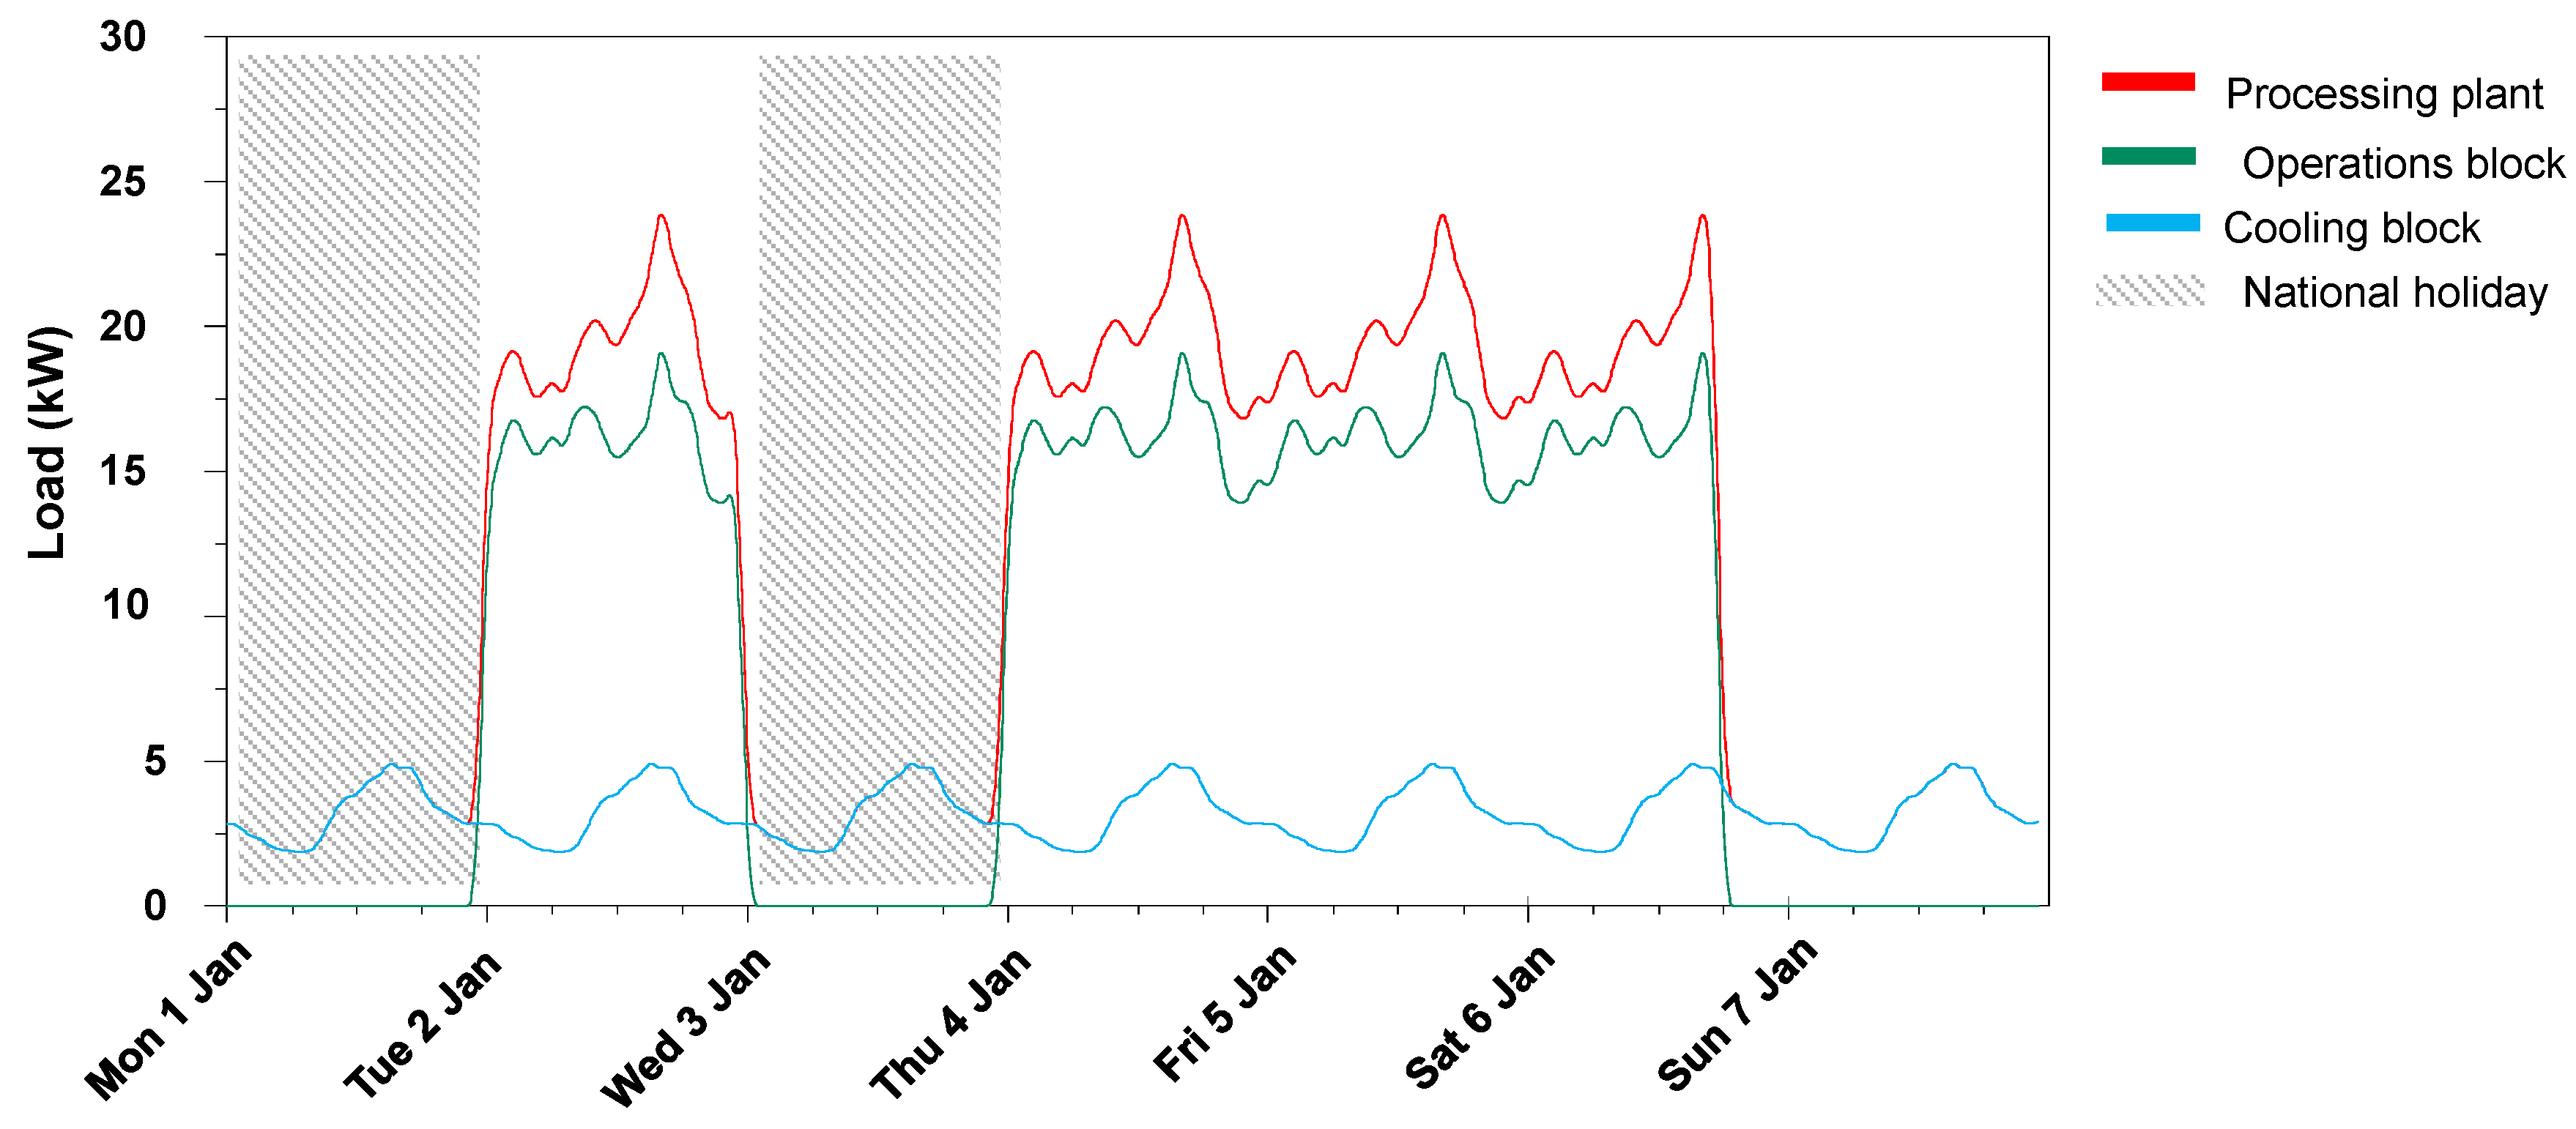
Based on the daily load profile, energy consumption during the first week of the year was established (Figure 8). The graph depicts the plant’s electrical consumption. Total daily energy consumption on processing days is 463.28 kWh. Day-to-day variability across the two measurement windows was low, with both yielding this consistent daily total. Cross-validation against SONABEL billing records for the 2021–2022 production season yielded a total billed consumption of 25,383 kWh for 166 tons of shea butter (152.91 kWh/ton), compared to the sensor-derived specific energy of 171.59 kWh/ton—a 12.2% difference. The monthly billing profile (Table 1) shows consumption peaking in January–February (6563–6676 kWh) and dropping to 198 kWh in April, consistent with the seasonality of shea kernel availability. At the plant’s processing capacity of 7 tons/day, a full-intensity day corresponds to approximately 1201 kWh, implying that partial-production days—including ramp-up, wind-down, weekends, and public holidays—account for the lower season-wide average relative to the sensor campaign, which was conducted exclusively during full-intensity operations. On January 1st and 3rd, designated national holidays (shaded areas), the energy consumption from the operations block is zero.
Figure 9 presents the power profile of the processing plant throughout the year under the 3 scenarios. From 1 March to 15 May, the cooling block’s power consumption increases by 60% compared to its baseline during harmattan. This results in an overall rise in daily processing plant consumption of 9.9%. The recorded peak power demand throughout the year accounts for 24.73 kW for scenario 1, 27.52 kW for scenario 2 and 3. Total energy demand is 43.92 MWh, 75.16 MWh, and 125.89 MWh when the plant is utilized under scenario 1, scenario 2, and scenario 3, respectively.

3.2. Sizing Results

The monthly electricity bills falling into for the processing period from November 2021 to April 2022 are presented in Table 1. The average electricity tariff is 0.319 USD/kWh.
In total, fifteen power supply systems (five systems per scenario) were independently sized. During the 2021–2022 production period, the company paid an average electricity tariff of 0.319 USD/kWh. Table 2 presents details on the design, technical performance, costs, and economic viability figures of each power supply system for the processing plant. The load factor exhibits a steady increase when transitioning from scenario 1 to scenario 2 and 3, achieving 20.2%, 31.17%, and 52.2%, respectively. This trend is attributed to the extension of processing activities, which translates into a longer active load period.
  • Scenario 1
Under Scenario 1, where shea butter production occurs from November to February, the grid-only configuration is the most technically and economically viable option, with the lowest NPC and LCOE among all configurations assessed. The grid/PV, grid/PV/battery, and grid/battery hybrid configurations do not yield a meaningful reduction in LCOE or improvement in reliability relative to the grid-only baseline. Electricity purchased from the grid in hybrid configurations remains close to the grid-only configuration, and the additional capital costs of PV panels and battery storage result in higher LCOE values and non-recoverable investments over a 20-year period.
The 100% renewable PV/battery system, consisting of a 95.1 kWp PV array and a 260 kWh battery bank, generates approximately 166.03 MWh annually to meet the plant’s estimated energy demand of 43.92 MWh. It is the least attractive configuration, recording the highest NPC and LCOE of all systems assessed under Scenario 1.
  • Scenario 2
When energy demand extends consistently until mid-May, the grid/PV system is the most cost-effective configuration, with renewable electricity contributing approximately 35% of total energy generation. Excess electricity generation reaches 30% due to idle processing periods. The LCOE of the grid/PV system is 10% lower than the grid-only supply.
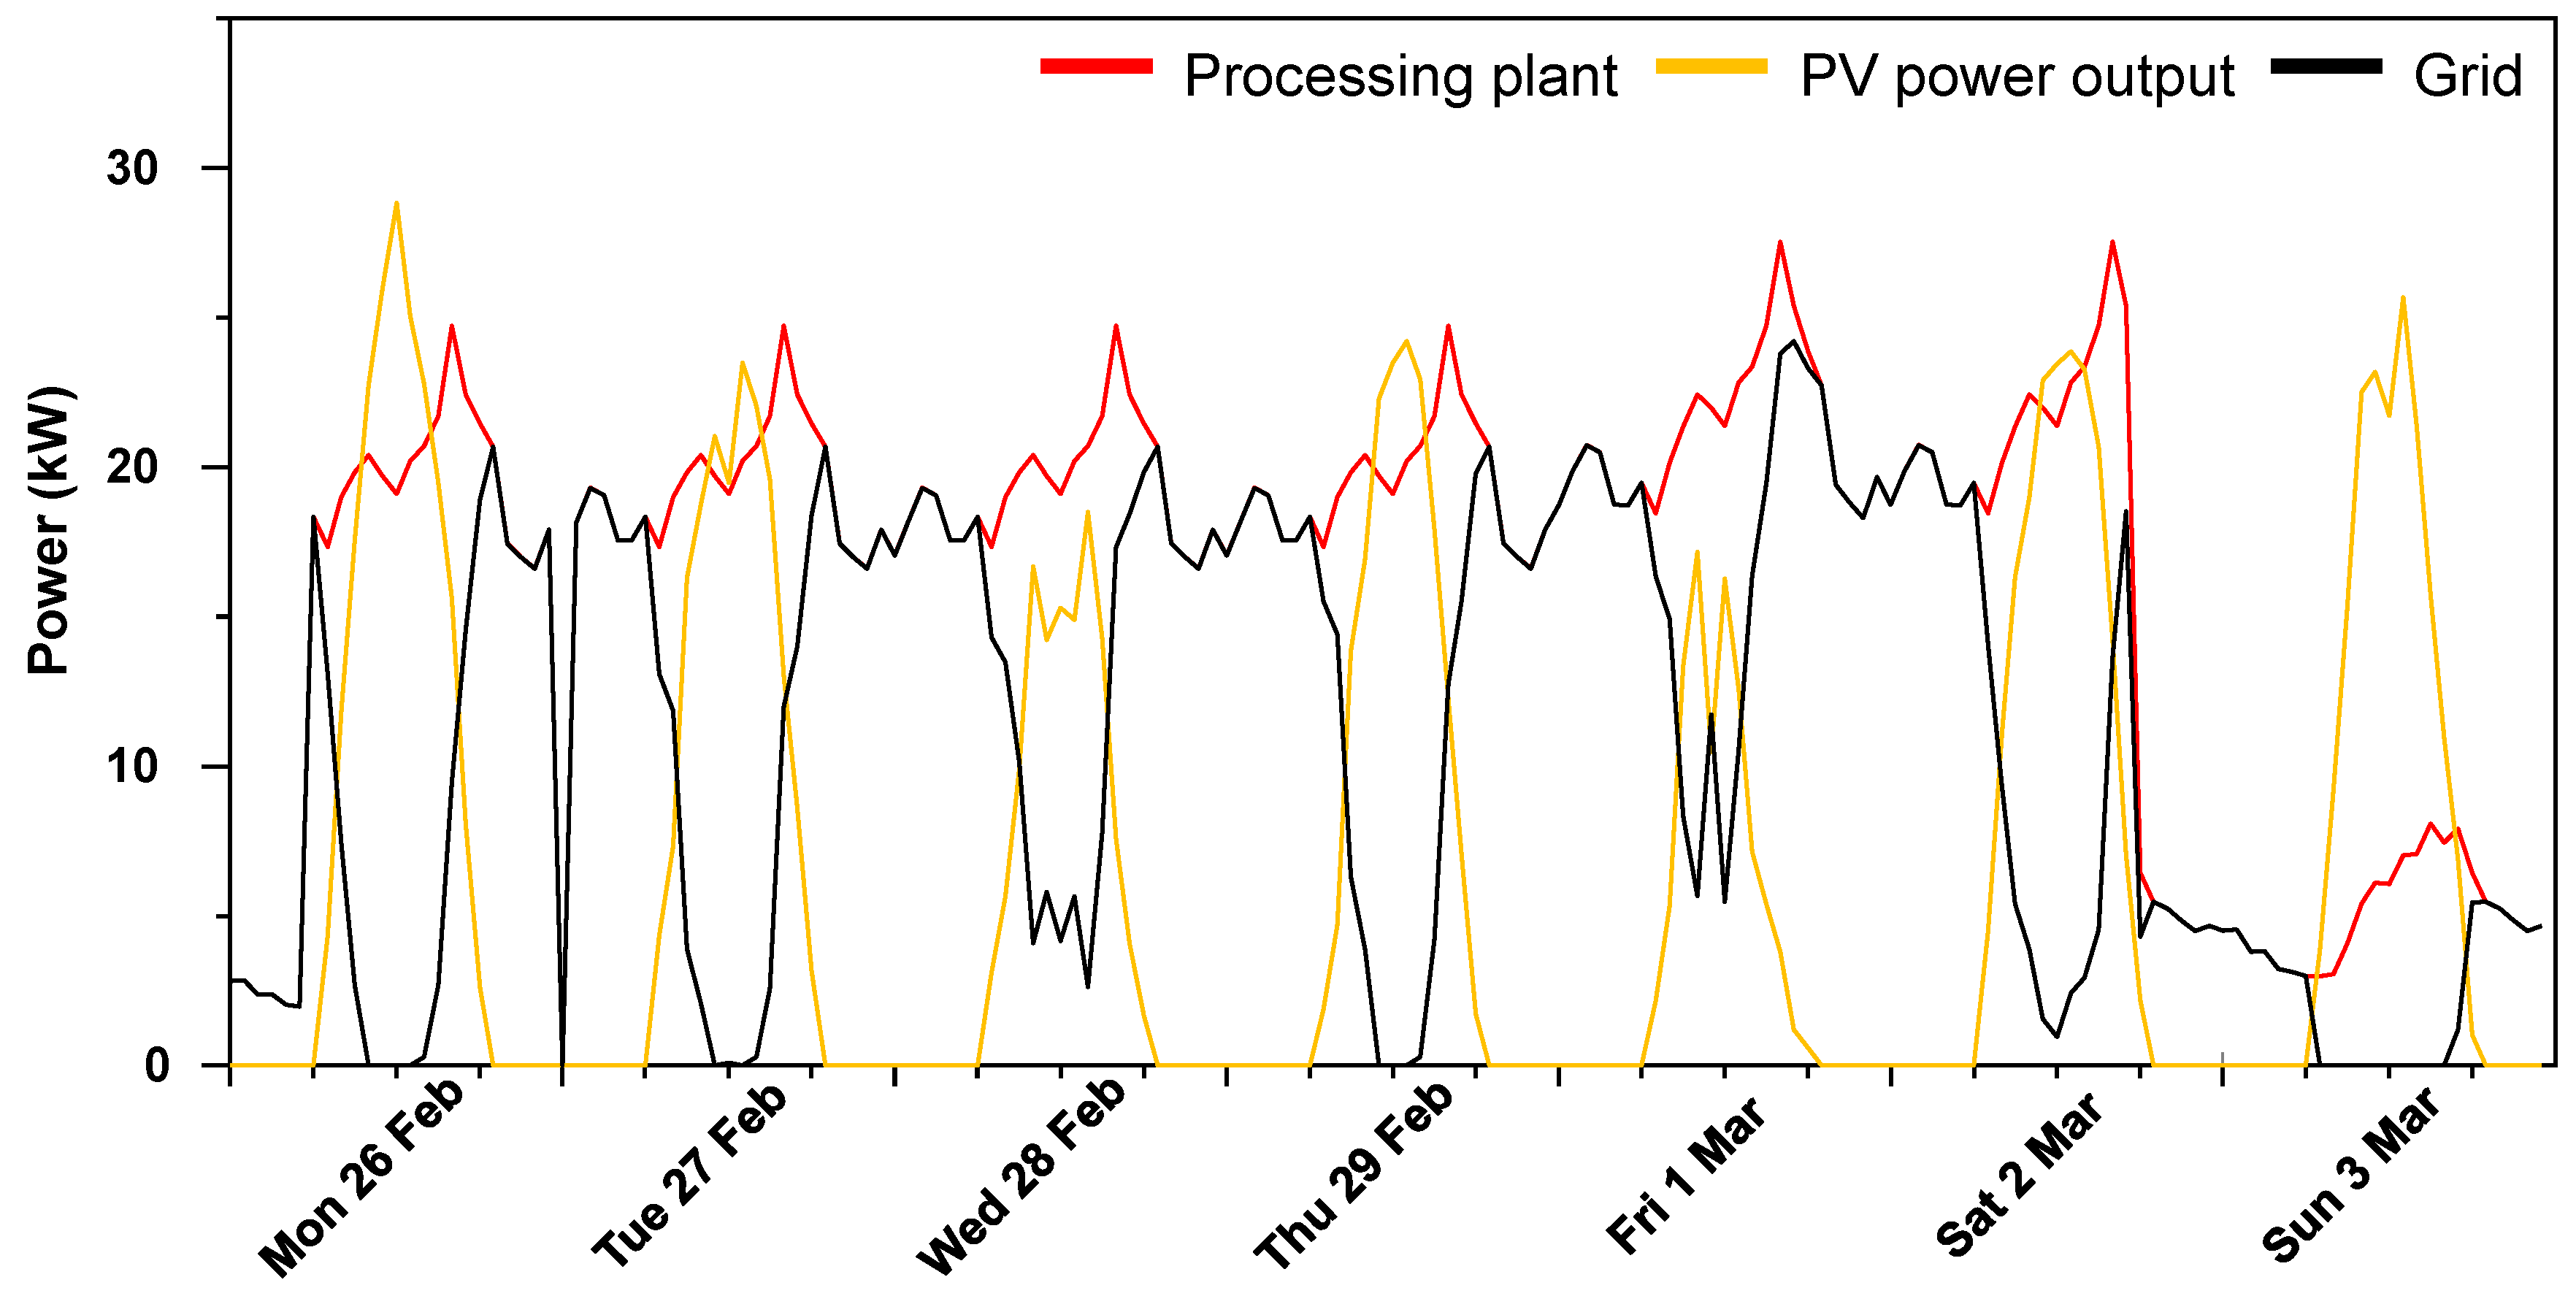
The grid/PV/battery configuration achieves 37% renewable energy integration and an LCOE only 0.12% higher than the grid/PV system. Both configurations achieve the same NPC of USD 263,333, compared to USD 290,000 for the grid-only option. IRR values range from 13.1% to 13.8%, with investment recovery periods of 7.73 years for the grid/PV system and 8.08 years for the grid/PV/battery system. Figure 10 presents the power profile from the grid/PV system for a typical working week under Scenario 2.
The 101 kWp/266 kWh PV/battery system produces 175.53 MWh/year, of which 58.39% is excess generation due to unused capacity. The system costs USD 423,333 and yields an LCOE of 0.504 USD/kWh, the highest among all configurations under Scenario 2.
  • Scenario 3
When processing activities are maintained for eleven months of the year, three configurations are economically viable alternatives to the grid-only baseline: the grid/PV, the grid/PV/battery, and the PV/battery.
The grid/PV configuration achieves the most competitive IRR and the shortest payback period, with an investment recovery time of 3.89 years.
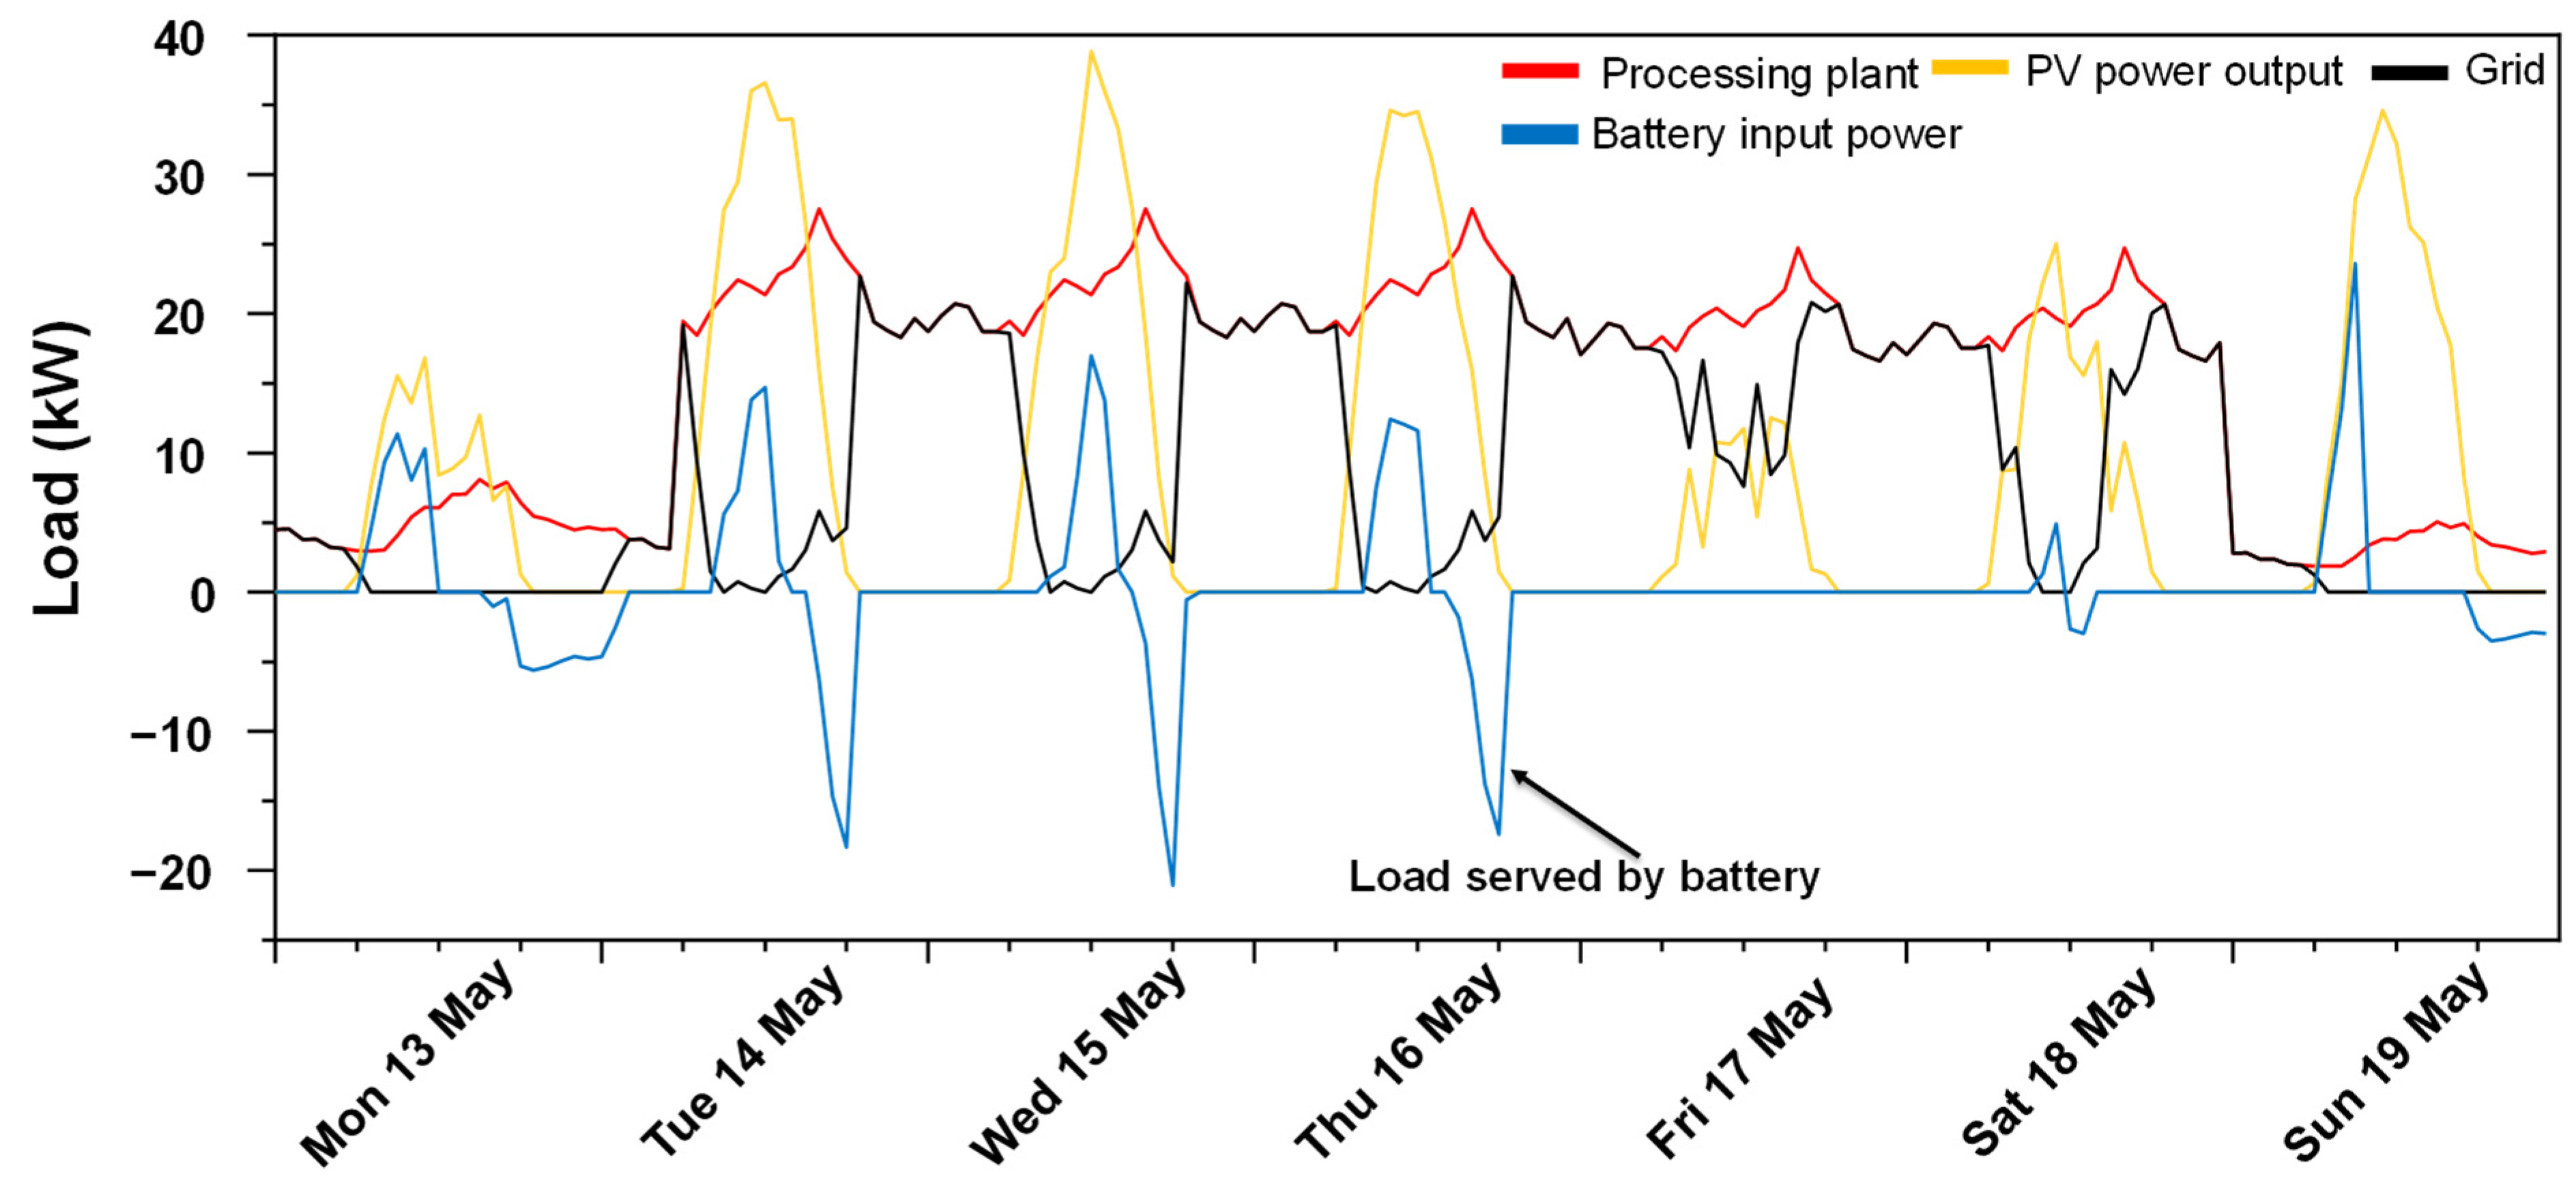
The grid/PV/battery configuration is the most technically and economically viable solution under Scenario 3, with over 45% renewable energy integration. Figure 11 illustrates the hierarchical energy allocation of this configuration on May 17th, 18th, and 19th—the days with the lowest solar PV generation—when the grid contributed to the load only after the battery had been fully discharged.
The grid/battery configuration is the most expensive and least viable option under Scenario 3.
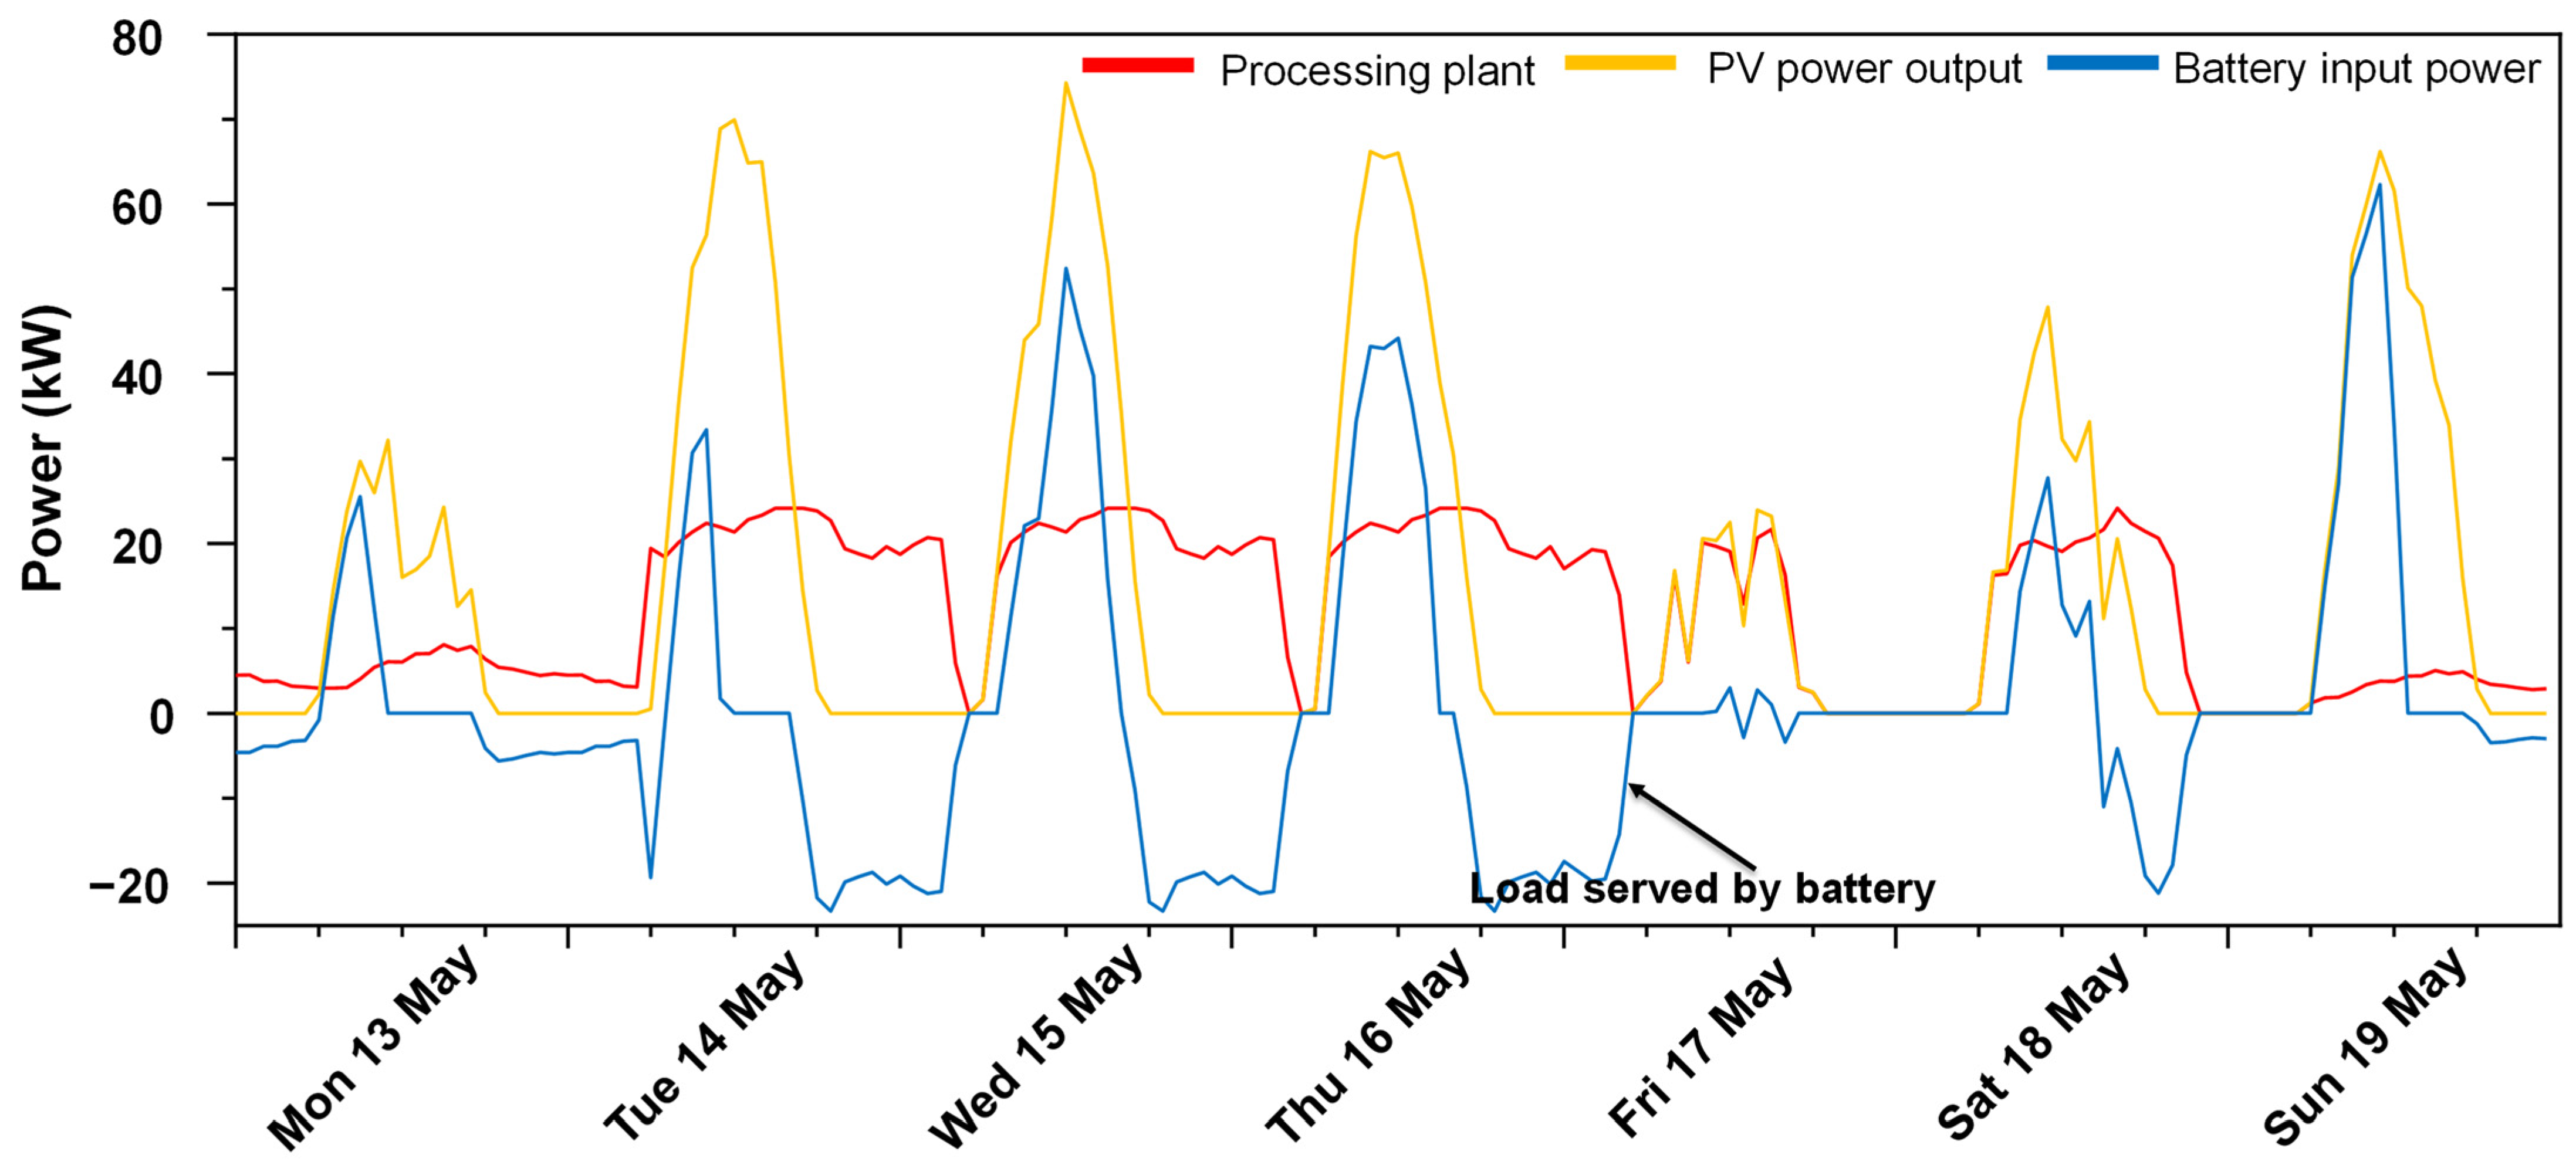
The PV/battery system (103 kWp/259 kWh) generates 180.5 MWh annually to meet the 125.89 MWh annual demand, with an investment recovery period of 9 years. Excess generation is predominantly observed in October, during scheduled plant maintenance, and on Sundays and national holidays when production is halted. Figure 12 shows the power allocation of the PV/battery system; the curve below zero on the battery input power indicates that the electrical load is served by the battery bank.
The grid/battery system is the most expensive and non-viable configuration. Storing energy from the grid to ensure power continuity during outages was found to be a non-cost-effective investment, considering the grid’s characteristics, the costs associated with battery acquisition and maintenance, and the overall performance of the resulting power system.
On the other hand, the PV/battery power supply system achieves favorable IRR values, making it a financially viable alternative, highlighting the feasibility in off-grid communities. The investment recovery is estimated in 9 years. The PV/battery 103 kWp/259 kWh system generates 180.5 MWh every year, to successfully meet the 125.89 MWh annual demand. The excess generation is predominantly observed in October, when the plant is non-operational due to scheduled maintenance activities. Additionally, Sundays and national holidays, when production activities are halted, contribute to the overall figures for excess generation. Figure 12 shows the power allocation of the PV/battery system. The curve below zero on the battery input power highlights that the electrical load is served by the battery bank.

3.3. LCOE Analysis

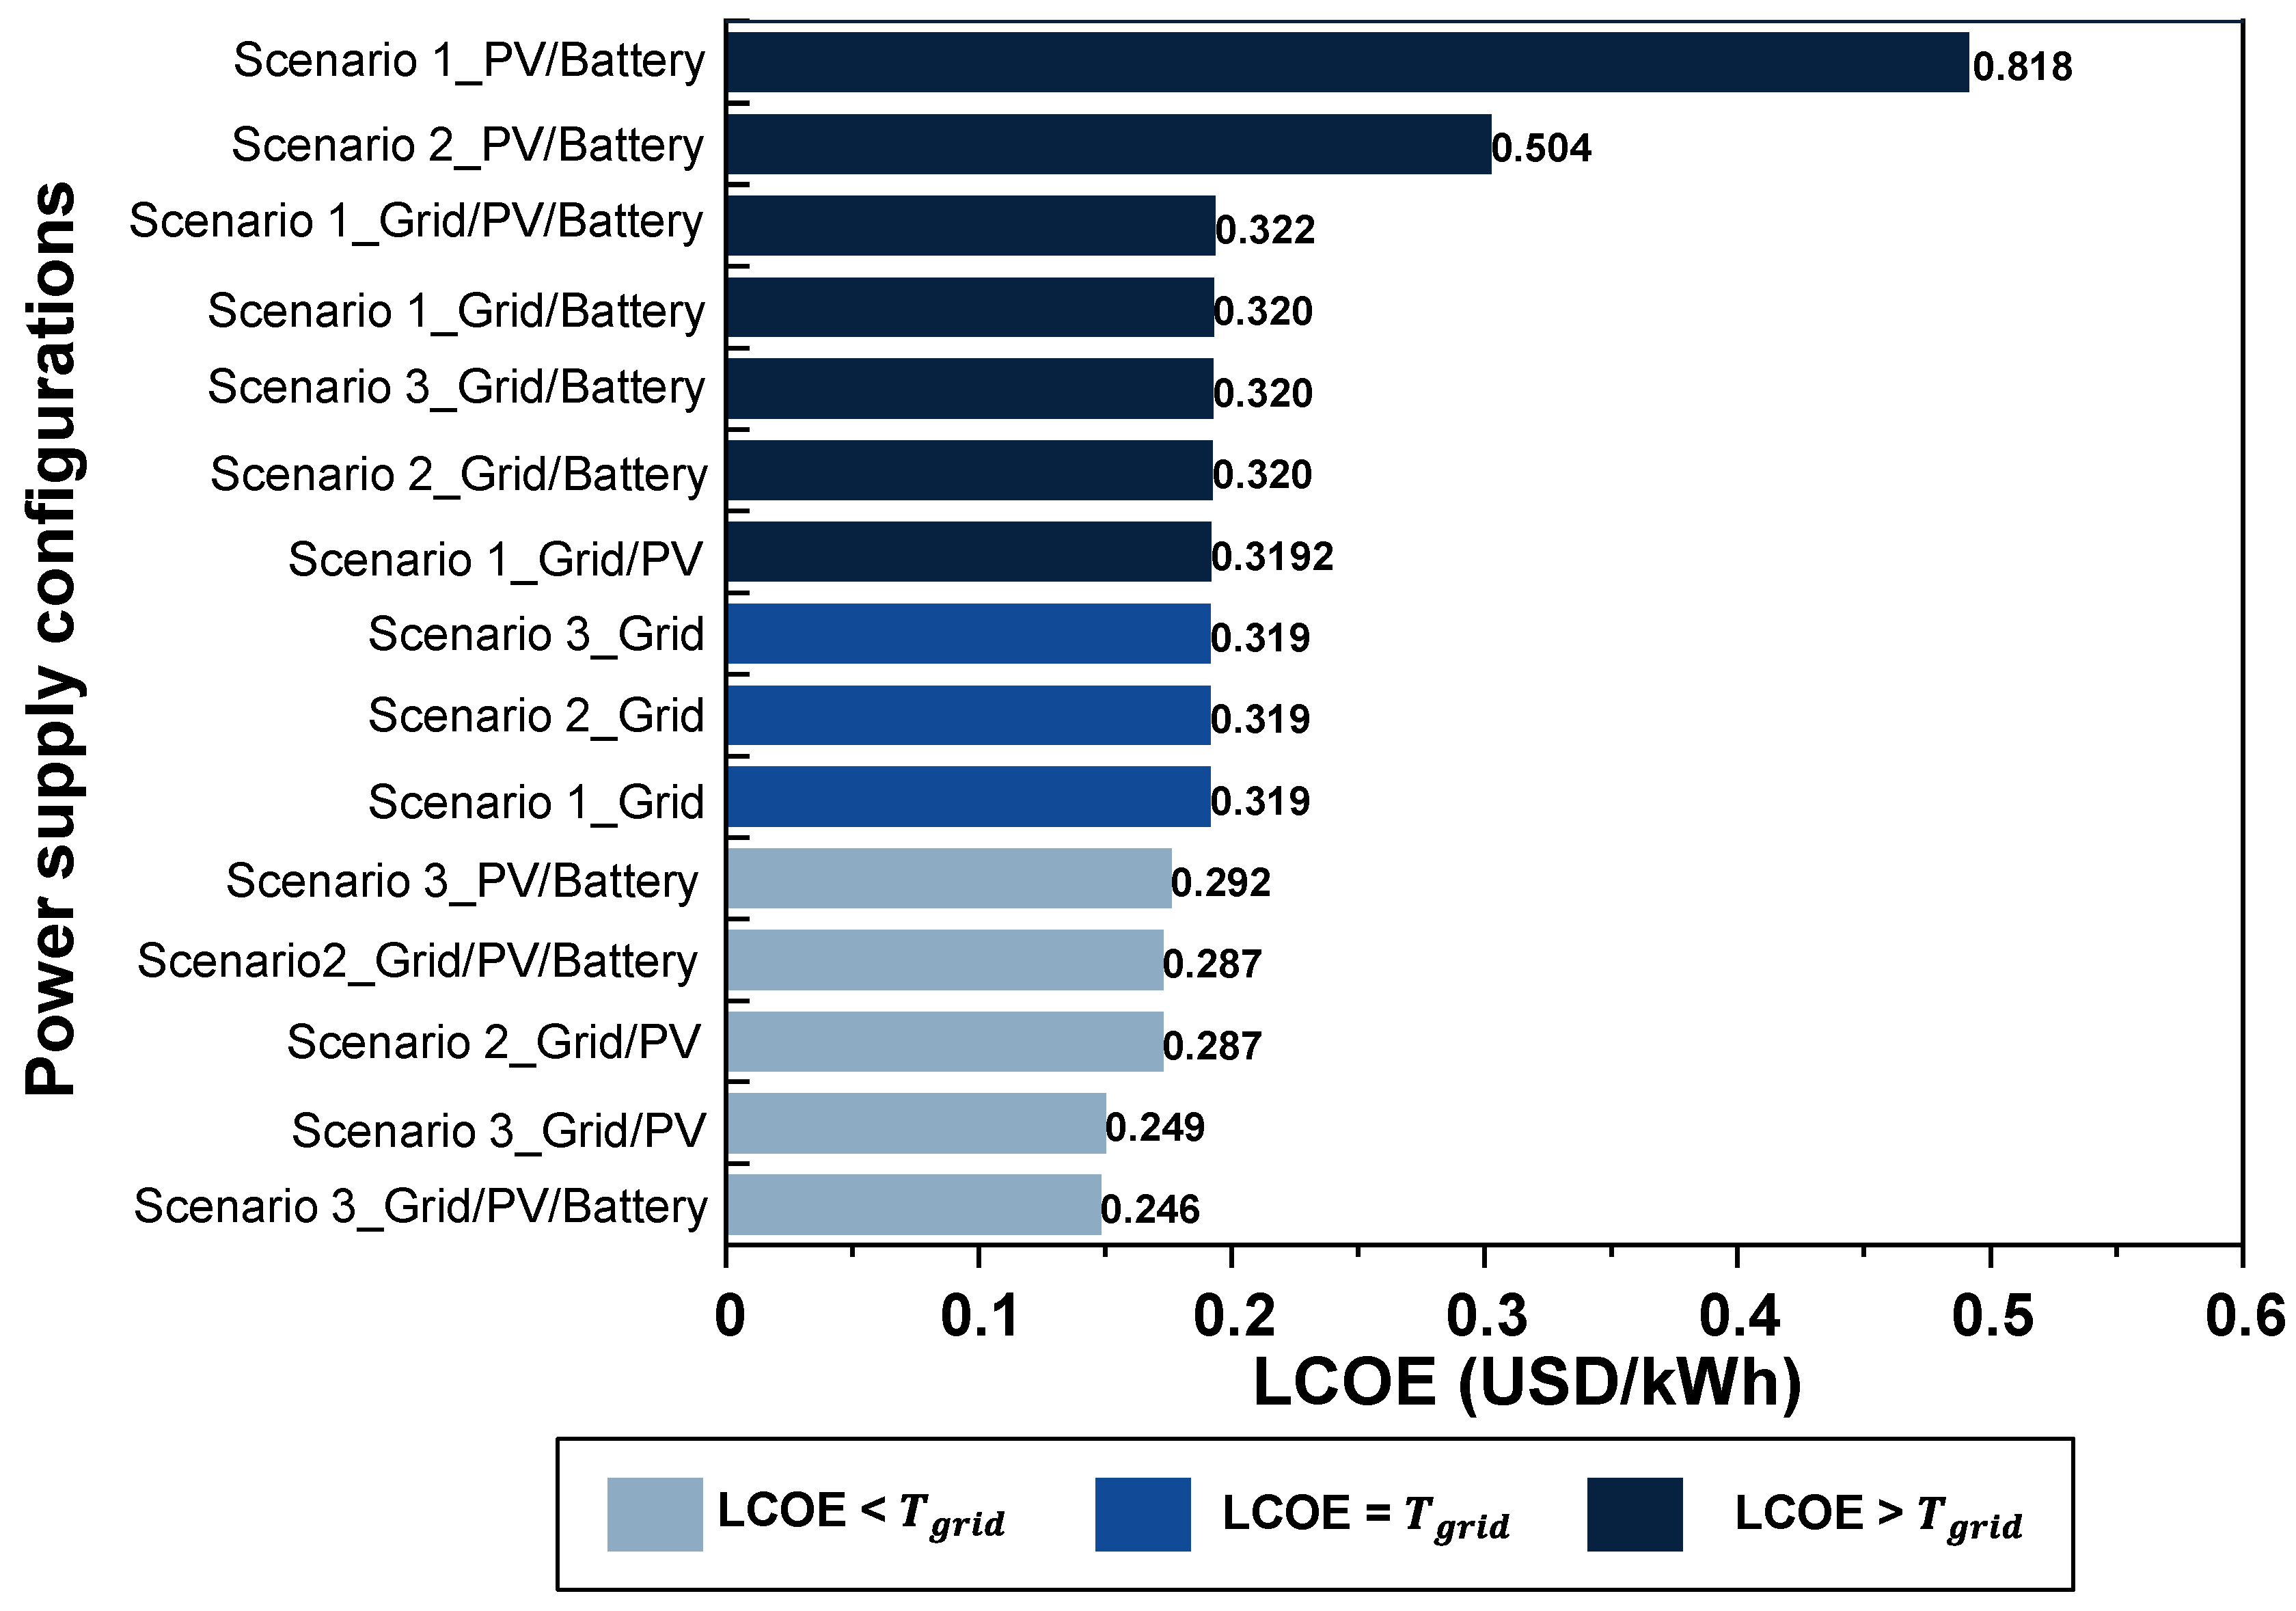
Figure 13 presents the LCOE of all assessed power supply system configurations across the three scenarios.
The LCOE decreases systematically as the annual utilization of the shea butter processing plant increases. The lowest LCOE values are recorded under Scenario 3 across all configurations. The LCOE of the 100% renewable PV/battery system under Scenario 3 is competitive with the average grid electricity tariff paid by SOTOKACC (0.319 USD/kWh). Computed LCOE values across the scenarios either fall within the range of LCOE values applied by existing commercial PV/battery-based mini-grids in Africa or are more cost-effective.

3.4. Sensitivity Analysis

A sensitivity analysis was conducted on four key uncertain input parameters: PV capital cost (CAPEX), battery capital cost, discount rate, and grid tariff escalation rate. The parameter ranges are summarized in Table 3. The lower bound for both PV and battery CAPEX was set at −25%, reflecting the sustained downward trend in global PV and battery prices, which have each declined by more than 90% over the past decade [39,40], while the +15% ceiling accounts for potential short-term supply chain disruptions or local market premiums.
Results confirm that the Grid/PV/Battery configuration under Scenario 3 (Table 4) is the most economically robust solution across all tested parameter combinations. PV and battery CAPEX variations produce modest LCOE changes of ±1–3 USD cents/kWh for the grid-connected hybrid configurations, reflecting their relatively small share of total NPC. Even under the most adverse CAPEX scenario (+15% on both PV and battery), the Grid/PV/Battery configuration maintains an LCOE of 0.250 USD/kWh—22% below the grid baseline of 0.319 USD/kWh—and an IRR of 19.0%, well above the 9% discount rate. The PV/Battery configuration is more sensitive to battery cost: under +15% battery CAPEX, the IRR falls to 7.6%, below the 9% threshold, indicating that this configuration’s viability is contingent on battery cost remaining at or below current market levels.
Discount rate variation (6–12%) influences both the LCOE of PV configurations and the IRR, while the grid baseline LCOE remains stable at 0.319 USD/kWh across all tested rates, as it carries no capital investment. As expected under standard LCOE formulation, a lower discount rate reduces the annualized capital cost of PV-intensive configurations, yielding a lower LCOE, while a higher discount rate increases it. At 6%, the Grid/PV/Battery LCOE falls to 0.234 USD/kWh and at 12% it rises to 0.255 USD/kWh—yet remains below the grid baseline at both extremes, confirming the robustness of the configuration’s economic advantage. The PV/Battery configuration similarly remains above its 9% IRR threshold at both 6% (IRR = 9.1%) and 12% (IRR = 9.3%), though its margin is narrow. The break-even discount rate for the Grid/PV/Battery configuration—at which its NPC equals the grid-only baseline—is approximately 38%, far above any realistic cost of capital in the Burkina Faso context.
Grid tariff escalation is the most impactful parameter. At 3%/year, the NPC savings of the Grid/PV/Battery configuration increase by 39% (from USD 105,000 to USD 146,400) and the IRR rises from 20.7% to approximately 32%. At 5%/year, the PV/Battery configuration becomes highly attractive, with an IRR of approximately 22% and NPC savings of USD 288,200—nearly four times the base case value. This finding underscores the long-term investment case for PV integration in contexts where grid tariffs are expected to rise, as has been the historical trend in Burkina Faso and the broader West African region.
For Scenarios 1 and 2, the sensitivity analysis confirms the directional robustness of the base case findings. In Scenario 1, all PV configurations remain non-attractive under every tested parameter combination: the Grid/PV configuration has a negligible PV component (0.2 kWp) optimized by HOMER Pro, rendering CAPEX variations inconsequential, while the PV/Battery configuration—despite benefiting from a −25% reduction in both PV and battery costs simultaneously—achieves an LCOE of approximately 0.570 USD/kWh, still 79% above the grid baseline. The four-month operating season is the binding constraint, not equipment costs. In Scenario 2, the Grid/PV and Grid/PV/Battery configurations remain attractive under all tested parameter combinations, including the most adverse (+15% PV CAPEX), under which both maintain an LCOE of 0.291 USD/kWh and an IRR above 11%. Grid tariff escalation has the most positive effect in this scenario, raising the IRR of the Grid/PV configuration from 13.8% to approximately 23–25% at 3–5%/year escalation. The PV/Battery configuration in Scenario 2 does not become economically competitive under any tested combination of parameters, confirming that a six-month operating season is insufficient to justify a standalone off-grid system.
The Grid/Battery configuration is excluded from the sensitivity analysis as it is non-attractive in all scenarios at base case, and no tested parameter variation brings its LCOE below the grid baseline.

4. Discussions

4.1. Influence of Plant Utilization on Power Supply Configuration Viability

The duration of the active load period is the primary factor determining the economic viability of a given power supply configuration. Grid-based configurations offer flexibility in bill payments without the financial burden of installing a generation plant, making them the optimal choice when power demand is seasonal or limited to a few months per year. However, the integration of a PV system unlocks economies of scale associated with longer production periods, progressively improving the competitiveness of renewable configurations as annual utilization increases.
Under Scenario 1, where production is confined to November–February, the grid-only configuration is the most viable option. The current tariff and reliability level of the national grid, combined with its ability to consistently meet demand without additional infrastructure investment, make it the preferred choice for short-season operations. Integrating PV panels, a battery bank, or a combination of both does not yield significant benefits: electricity purchased from the grid in hybrid configurations remains close to the grid-only baseline, indicating that these components do not provide a meaningful improvement in reliability under such limited utilization. The additional capital costs, installation complexity, and maintenance requirements of PV and battery components ultimately lead to higher LCOE values and non-recoverable investments over a 20-year period. The 100% renewable PV/battery system is the least attractive configuration under Scenario 1, primarily because the limited processing period results in significant excess energy generation—much of the PV-generated electricity remains unused throughout the year.
Under Scenario 2, extending operations to mid-May increases the load factor to 31.17% and creates sufficient annual energy demand to justify PV integration. The grid/PV system emerges as the most cost-effective configuration: PV-generated electricity is prioritized, significantly reducing reliance on the grid, while grid electricity serves as the primary backup during periods of low or no solar generation. Although excess electricity reaches 30% due to idle processing periods, the overall reduction in energy purchases from the grid offsets the capital costs of the PV system, yielding an LCOE 10% lower than the grid-only supply. The grid/PV/battery configuration offers a marginally higher LCOE (+0.12%) than the grid/PV system but provides the additional benefit of enhanced energy reliability through battery storage, without a significant cost penalty. The long idle period from the second half of May to October makes fully renewable configurations unattractive under Scenario 2, as the high proportion of excess generation (58.39% for the PV/battery system) substantially increases the cost per useful kilowatt-hour.
These findings are consistent with those of Bonzi et al. [12], who evaluated solar PV-based power supply systems for a peanut oil processing plant operating from October to May. In their study, the grid/PV and grid/PV/battery configurations achieved the lowest LCOE values (0.153 USD/kWh and 0.142 USD/kWh, respectively) and proved to be the most effective solutions, while the PV/battery configuration generated 82.5% excess energy, making it considerably less attractive.
Under Scenario 3, with eleven months of annual operation and a load factor of 52.2%, renewable energy integration becomes essential for cost-effective power supply. The grid/PV configuration offers the most competitive IRR and shortest payback period (3.89 years), making it the most attractive option for operators seeking a gradual transition toward renewable energy. The grid/PV/battery configuration; however, is the most technically and economically viable overall solution: with over 45% renewable energy integration, it ensures a high level of reliability by allowing the load to be served during grid outages. In this configuration, PV generation serves as the primary power source, supplemented first by the battery bank and then by the grid, which functions as a secondary backup only when both PV and battery are insufficient to meet demand. This hierarchical energy allocation is particularly valuable in the Burkina Faso context, where grid outages are frequent. The grid/battery configuration, by contrast, is the most expensive and least viable option: storing grid energy in batteries to ensure power continuity during outages is not cost-effective given the grid’s characteristics and the costs of battery acquisition and maintenance. The PV/battery system achieves favorable IRR values under Scenario 3, demonstrating its financial viability as a fully off-grid solution—a relevant finding for rural communities without grid access.

4.2. LCOE Benchmarking and Broader Implications

The systematic decrease in LCOE with increasing plant utilization confirms findings from the literature that higher load factors lead to lower LCOE values for power generation [37]. The load factor analysis further confirms that Scenario 3 achieves the highest utilization rates, driving the lowest LCOE values across all configurations.
The LCOE of the 100% renewable PV/battery system under Scenario 3 is competitive with the average grid electricity tariff paid by SOTOKACC (0.319 USD/kWh). Computed LCOE values across the scenarios either fall within the range of LCOE values applied by existing commercial PV/battery-based mini-grids in Africa or are more cost-effective. A comprehensive review of mini-grid tariffs in Africa reported an average LCOE of 0.38 USD/kWh; without subsidies, this cost can reach 0.9 USD/kWh but can drop to 0.30 USD/kWh for highly subsidized systems [36,37,38]. These values demonstrate that the energy demand of shea butter processing operations is sufficiently high to enable dedicated PV/battery systems to achieve cost-effectiveness comparable to mini grids designed to serve entire rural communities.
This observation is further supported by Booth et al. [41], who evaluated the productive use of energy in African microgrid contexts. In their study of a PV/battery-powered maize flour processing plant in Tanzania, the cost of energy was reduced by approximately 14% when the plant operated year-round at 50% loading (four hours per day). Conversely, when utilization was seasonal and limited to six months per year, the cost of energy increased by as much as 7%. This underscores the critical importance of maintaining high utilization rates to ensure the economic viability of off-grid renewable systems—a finding directly applicable to the shea butter processing context.

4.3. Feasibility of Year-Round Operation Under Scenario 3

Scenario 3 is the most economically favorable configuration from an energy perspective, but its practical realization depends on conditions beyond the scope of the energy model, particularly the availability of raw materials and market demand for shea butter.
The primary constraint on extended shea butter processing operations is the availability of shea kernels. SOTOKACC plant currently operates at full processing capacity only between November and February, with some activities extending to April, due to its current shea kernel securing capacity. The Hauts Bassins region, where SOTOKACC is located, has the potential to produce over 76,000 tons of shea kernels annually; however, extensive export of raw kernels reduces the supply available for local processing.
Several pathways exist to achieve the year-round operation assumed in Scenario 3. First, diversification into complementary oilseeds—such as groundnut, sesame, and soybean—whose harvesting seasons do not overlap with shea nuts, would allow for a steady processing load throughout the year without competing for the same raw material supply window. Second, cooperative production networks and community-based processing hubs in shea-rich rural communities can help create a more stable and distributed raw material supply. Third, the global demand for shea butter has been experiencing significant growth, driven by expanding applications in food, cosmetics, and pharmaceuticals, providing a strong market incentive for extended production. Scenario 3 should therefore be understood as a strategic scenario whose practical realization depends on complementary interventions in raw material sourcing and market development—interventions that are feasible and increasingly being pursued in the sector.

4.4. Policy Considerations and Limitations

Grid electricity sales were excluded from the analysis, reflecting the absence of a net metering or feed-in tariff policy for this consumer category in Burkina Faso under the current regulatory framework. If such a policy were introduced in the future—as is being explored in several West African countries—it would further improve the economics of grid-tied PV configurations.
The grid reliability parameters used in this study are based on SONABEL’s 2022 national-level data, which may not fully reflect local conditions at the Toussiana site, as outage frequency and duration in peri-urban areas may differ from national averages. However, ongoing grid infrastructure improvement works in Burkina Faso—including rural electrification investments under the national electrification strategy—are expected to progressively improve grid reliability over the 20-year project lifetime, which would further strengthen the economic case for grid-connected hybrid configurations. Obtaining site-specific grid reliability data for Toussiana is identified as a direction for future research. However, future studies should explicitly account for the cooling-load multiplier as a sensitivity parameter. While the aggregate annual energy contribution is modest, the seasonal concentration of the cooling demand in the March–May hot-dry period—which coincides with peak ambient temperatures and maximum solar irradiance—may influence hourly dispatch decisions, state-of-charge cycling patterns of the battery bank, and peak demand alignment with PV generation. These dynamics are not fully captured by annual energy totals and could meaningfully affect the sizing recommendations of the battery storage component under stricter capacity shortage thresholds. It is therefore strongly recommended that future techno-economic assessments of solar PV systems for agro-processing facilities in Sahelian climates: (i) install dedicated sub-meters on the cold storage and cooling subsystems to enable direct, season-resolved measurement of the cooling load; (ii) incorporate a parametric sensitivity range for the seasonal cooling multiplier (e.g., ×1.4 to ×1.8, reflecting a 4 °C to 8 °C temperature delta above the baseline threshold) into the HOMER Pro simulation framework; and (iii) report whether the resulting changes in peak load timing and battery dispatch alter the optimal configuration ranking. Such an analysis would provide more granular guidance to system designers operating in contexts where cold chain maintenance is a critical operational requirement.
The O&M cost estimates are based on local market consultations, and actual costs may vary. The sensitivity of the study’s conclusions to the cooling load scaling factor—which was derived from Sahel-specific literature elasticities and applied uniformly across the hot-dry season—was not included in the sensitivity analysis, as the hot-season cooling uplift represents approximately 2.7% of total annual energy demand in Scenario 3 (3443 kWh out of 125,890 kWh), a share too small to alter system sizing or the optimal configuration ranking; site-specific quantification of this parameter through sub-metering of the cooling block is nonetheless identified as a direction for future research. Finally, the analysis does not account for the potential impact of the October 2023 SONABEL tariff restructuring on the average effective tariff, which represents an additional direction for future research.

5. Conclusions

This study has assessed the feasibility and strategic considerations of solar PV technology to power an existing MSP-based shea butter processing plant. The load profile of the processing plant was defined under real-working conditions using a remote power sensor. The remote sensor successfully enables continuous monitoring of electricity consumption, providing a detailed load profile. It presents an efficient solution for on-site electricity data collection, particularly in rural and hard-to-reach regions where conventional monitoring infrastructure may be limited.
Three scenarios were analyzed, each representing different periods of active load throughout the year. The research looked at evaluating the relevance of either integrating solar PV technology to make hybrid systems with the grid or shifting to a 100% PV/battery power supply system to operate the shea butter processing plant. Findings suggest that solar PV integration is economically viable only if operations extend at least from November to mid-May. Extending the processing period improves the load factor and leads to a reduction in the LCOE for both hybrid and standalone PV systems. Specifically, for standalone PV/battery systems, increasing the operational period to eleven months reduces the LCOE by approximately 64.3% compared to a scenario with only three months of activity. In this extended use case, the PV/battery systems achieve superior economic performance compared to grid electricity with 9.2% IRR and a DPP of 9 years. These findings demonstrate that PV/battery systems can be a profitable solution for powering food processing activities, especially when operations are spread throughout the year. Ensuring consistent year-round energy demand is achievable through collaborative arrangements, such as shared multi-purpose processing facilities and cooperative production networks. A sensitivity analysis across key economic parameters—including PV and battery capital costs, discount rate, and grid tariff escalation—confirms that the Grid/PV/Battery configuration under Scenario 3 remains the most economically robust solution under all tested conditions, with its LCOE consistently below the grid baseline and its IRR well above the cost of capital. The PV/Battery configuration’s viability is more sensitive to battery cost but becomes strongly attractive under moderate grid tariff escalation scenarios, reinforcing the long-term investment case for standalone renewable systems in rural agro-processing contexts.
Beyond economic feasibility, this study highlights a new energy access model for rural communities: linking energy access initiatives with agro-industrial activities. This model provides energy intensive load to make PV/battery power supply system profitable. This could attract mini-grid developers who are often reluctant to invest in small rural regions due to low power demand.

Author Contributions

B.S.N.: Conceptualization, Methodology, Software, Validation, Data analysis, Formal analysis, Investigation, Writing—Original Draft, Visualization, Y.M.S.: Conceptualization, Methodology, Investigation, Writing—Review and Editing, Supervision, Project administration, Funding acquisition, W.J.B.: Conceptualization, Methodology, Software, Validation, Data analysis, Investigation, Writing—Review and Editing, Visualization, S.R.: Conceptualization, Methodology, Software, Validation, Investigation, Writing—Review and Editing, Visualization, K.M.: Writing—Review and Editing, Supervision, Funding acquisition, and J.M.: Conceptualization, Methodology, Writing—Review and Editing, Supervision, Project administration, Funding acquisition. All authors have read and agreed to the published version of the manuscript.

Funding

This research was funded by BioStar project “Bioenergy for SMEs in West Africa”: grant number “FOOD/2019/410-794” 794—funded by the European Union and Agence Française de Développement (AFD) as part of the DeSIRA program.

Data Availability Statement

The original contributions presented in this study are included in the article. Further inquiries can be directed to the corresponding author.

Acknowledgments

We would like to extend our sincere gratitude to SOTOKACC for their invaluable cooperation and for granting access to their facility, which made the research investigations possible. We also express our gratitude to Nitidae’s team, specifically to Arlette Akakpo, Hervé Abbo, and Magloire Sacla Aidé for conducting the field visits and their contributions as focal point with SOTOKACC.

Conflicts of Interest

The authors declare no conflicts of interest.

Abbreviations

The following abbreviations are used in this manuscript:
CRFCapital recovery factor
GHIGlobal Horizontal Irradiation
LCOELevelized cost of energy
NPCNet Present Cost
RERenewable energy
SSASub-Saharan Africa
SOCState of charge of the batteries
SONABELNational electricity company of Burkina Faso
TDERural Electrification support tax
TSDAAEMedia activities development tax
Symbols
A c o s t Total annualized cost (USD)
β Temperature coefficient (1/°C)
C c a p e x Capital cost (USD)
C e l Electricity bill paid to SONABEL (USD)
C o p e x Operation and maintenance cost (USD)
C t Net revenues acquired in specific year (USD)
d r Real discount rate (%)
d n Nominal discount rate (%)
E a Total active energy (kWh)
E c o n s Total energy consumed (kWh)
E g r i d Daily energy covers by the grid (kWh)
E c o o l Electrical energy consumed by the cooling block every day (kWh)
E d a y Electrical energy consumed by the entire plant every day (kWh)
E P V Daily energy covers by the solar PV system (kWh)
E e x c e s s Excess energy produced over the year (kWh)
E o p Electrical energy consumed by the operations blook every day (kWh)
E s p Specific energy (kWh/t)
E u n m e t Daily unmet energy due to allowed capacity shortage (kWh)
f d e r a t i n g Derating factor
G S T C Standard reference irradiance (kW/m2)
i n Nominal inflation rate (%)
L f Load factor (%)
NProject lifetime, years
η b a t t e r y Efficiency of the battery (%)
η i n v e r t e r Efficiency of the inverter (%)
P i Hourly electrical power (kW)
P i n v e r t e r Inverter’s power (kW)
P p e a k Peak power (kW)
P P V   p e a k Power of the PV system (kW)
T c Temperature of the PV cell (°C)
T g r i d Grid electricity tariff (USD/kWh)
T S T C Temperature of reference (°C)

References

  1. World Bank; IEA; IRENA; UNStats; WHO. Tracking SDG 7: The Energy Progress Report 2024; World Bank: Washington, DC, USA, 2024; Available online: https://trackingsdg7.esmap.org/downloads (accessed on 15 May 2025).
  2. Sarr, A.; Soro, Y.M.; Tossa, A.K.; Diop, L. Agrivoltaic, a Synergistic Co-Location of Agricultural and Energy Production in Perpetual Mutation: A Comprehensive Review. Processes 2023, 11, 948. [Google Scholar] [CrossRef]
  3. Favi, S.G.; Adamou, R.; Godjo, T.; Giri, N.C.; Kuleape, R.; Trommsdorff, M.; Trommsdorff, M. Agrivoltaic systems offer symbiotic benefits across the water-energy-food-environment nexus in West Africa: A systematic review. Energy Res. Soc. Sci. 2024, 117, 103737. [Google Scholar] [CrossRef]
  4. Global Shea Alliance. Global Shea Alliance Sustainability Program; Global Shea Alliance: Accra, Ghana, 2022; Available online: https://www.globalshea.com/gsamain/storage/img/marqueeupdater/2020.01.06.04.30sustainability-program-english.compressed501971-2.pdf (accessed on 15 May 2025).
  5. Nounagnon, B.S.; N’Tsoukpoe, K.E.; Kpegba, K.; Davou, L.; Soro, Y.M.; Yacouba, H. Sustainability challenges in conventional shea butter production in Africa: A review of energy consumption and resource efficiency. Environ. Syst. Decis. 2023, 44, 161–176. [Google Scholar] [CrossRef]
  6. Pouliot, M.; Elias, M. To process or not to process? Factors enabling and constraining shea butter production and income in Burkina Faso. Geoforum 2013, 50, 211–220. [Google Scholar] [CrossRef]
  7. Africa Solar Industry Association (AFSIA). Africa Solar Outlook 2025; AFSIA: Brussels, Belgium, 2025. [Google Scholar] [CrossRef]
  8. Tete, K.H.S.; Soro, Y.M.; Sidibé, S.S.; Jones, R.V. Assessing energy security within the electricity sector in the West African economic and monetary union: Inter-country performances and trends analysis with policy implications. Energy Policy 2023, 173, 113336. [Google Scholar] [CrossRef]
  9. African Development Bank (AfDB). Forging Ahead Inclusively with the Implementation of the Desert to Power Initiative: Annual Report 2023; AfDB: Abidjan, Côte d’Ivoire, 2023; Available online: https://www.afdb.org/sites/default/files/documents/publications/dtpannualreport_2023.pdf (accessed on 29 March 2026).
  10. Mo, J.P.T. Design of solar energy system in food manufacturing environment. Cogent Eng. 2016, 3, 1233613. [Google Scholar] [CrossRef]
  11. Dean, J.; Vogel, E.; Murphy, F. Modelling solar photovoltaic systems on dairy farms for cost savings and GHG emission reduction. Sci. Total Environ. 2024, 948, 174874. [Google Scholar] [CrossRef] [PubMed]
  12. Bonzi, W.J.; Romuli, S.; Diouf, D.; Piriou, B.; Meissner, K.; Müller, J. Computational sizing of solar powered peanut oil extraction in Senegal using a synthetic load profile. Energy Sustain. Dev. 2024, 79, 101391. [Google Scholar] [CrossRef]
  13. Tulashie, S.K.; Appiah, G.; Akpari, E.E.A.; Saabome, S.M. Design of shea nut rotary roasting machine used for shea butter production in Ghana. Int. J. Thermofluids 2020, 1–2, 100015. [Google Scholar] [CrossRef]
  14. Jasaw, G.S.; Osamu, S.; Kazuhiko, T. Material flow analysis of shea butter production systems: Implications for sustainability in semi-arid Ghana. In Strategies for Building Resilience Against Climate and Ecosystem Changes in Sub-Saharan Africa; Springer: Singapore, 2018; pp. 193–214. [Google Scholar] [CrossRef]
  15. Wills, S.; Rickard, D.; Cosgrove, A.; Margets, P. A PV system for remote power and shea nut processing in Burkina Faso. In Proceedings of the ISES Solar World Congress 2019 and IEA SHC International Conference on Solar Heating and Cooling for Buildings and Industry 2019; International Solar Energy Society: Freiburg im Breisgau, Germany, 2020; pp. 1660–1669. [Google Scholar] [CrossRef]
  16. Solar Milling. Solar Milling au Burkina Faso. Available online: https://solarmilling.com/solar-milling-au-burkina-faso/ (accessed on 4 April 2025).
  17. BioStar. SOTOKACC—Société Toussiana Karité Cosmétiques et Comestibles/Burkina Faso. BioStar—Des Bioénergies pour les PME d’Afrique de l’Ouest. Available online: https://www.biostar-afrique.org/pme-pilotes/burkina-faso/sotokacc-societe-toussiana-karite-cosmetiques-et-comestibles (accessed on 29 March 2026).
  18. SOTOKACC. Official Website. Available online: https://www.sotokacc.com/en/ (accessed on 29 March 2026).
  19. World Bank Group. Global Solar Atlas 2.0; Solargis: Bratislava, Slovakia, 2019; Available online: https://globalsolaratlas.info/download/burkina-faso (accessed on 16 May 2025).
  20. Quansah, D.A.; Adaramola, M.S. Ageing and degradation in solar photovoltaic modules installed in northern Ghana. Sol. Energy 2018, 173, 834–847. [Google Scholar] [CrossRef]
  21. Bouaichi, A.; Merrouni, A.A.; Hajjaj, C.; Messaoudi, C.; Ghennioui, A.; Benlarabi, A.; Ikken, B.; El Amrani, A.; Zitouni, H. In-situ evaluation of the early PV module degradation of various technologies under harsh climatic conditions: The case of Morocco. Renew. Energy 2019, 143, 1500–1518. [Google Scholar] [CrossRef]
  22. Takyi, G.; Laryea, O.G. Comparative study of the performance of solar photovoltaic module technologies installed in Kumasi, Ghana, in sub-Saharan Africa. Sci. Afr. 2021, 13, e00877. [Google Scholar] [CrossRef]
  23. Aboagye, B.; Gyamfi, S.; Ofosu, E.A.; Djordjevic, S. Degradation analysis of installed solar photovoltaic (PV) modules under outdoor conditions in Ghana. Energy Rep. 2021, 7, 6921–6931. [Google Scholar] [CrossRef]
  24. JA Solar. JAM72S10 390-410/MR Series—Product Datasheet; JA Solar: Shanghai, China, 2019; Available online: https://www.jasolar.com/uploadfile/2019/1031/20191031104111612.pdf (accessed on 17 May 2025).
  25. AEG Industrial Engineering. AS-M1322-H(M10) Photovoltaic Module Datasheet; AEG: Hanover, Germany, n.d.; Available online: https://aeg-solar.com/ (accessed on 17 May 2025).
  26. Huawei Technologies Co., Ltd. LUNA2000 Smart Li Series—Product Introduction; Huawei Digital Power: Shenzhen, China, 2021; Available online: https://digitalpower.huawei.com/attachments/data-center-facility/c240b9c3a4c5475d82343bd63d8c8cab.pdf (accessed on 3 March 2025).
  27. African Forum for Utility Regulators (AFUR); African Minigrid Developers Association (AMDA). Mainstreaming Mini-Grid Tariff Settlement Tools and Methodologies Across African Regulators; AFUR: Pretoria, South Africa, 2021; Available online: https://afurnet.org/wp-content/uploads/2024/05/AFUR-Mainstreaming-Mini-grid-Tariff-Settlement-Tools-and-Methodologies-Baseline-GAP-Analysis-Final-Report-English-Version.pdf (accessed on 15 May 2025).
  28. Banque Centrale des États de l’Afrique de l’Ouest (BCEAO). Rapport sur la Politique Monétaire dans l’UEMOA—Septembre 2024; BCEAO: Dakar, Senegal, 2024; Available online: https://www.bceao.int/sites/default/files/2024-09/RAPPORT-SUR-LA-POLITIQUE-MONETAIRE-DANS-L-UMOA-SEPTEMBRE-2024.pdf (accessed on 1 May 2025).
  29. NASA. POWER Data Access Viewer; NASA Langley Research Center: Hampton, VA, USA, 2025. Available online: https://power.larc.nasa.gov/data-access-viewer/ (accessed on 16 May 2025).
  30. Yao, J. Electricity Consumption and Temperature: Evidence from Satellite Data; IMF Working Paper 2021, WP/21/38; International Monetary Fund: Washington, DC, USA, 2021. [Google Scholar] [CrossRef]
  31. Kondi-Akara, G.; Hingray, B.; Francois, B.; Diedhiou, A. Recent trends in urban electricity consumption for cooling in West and Central African countries. Energy 2023, 276, 127597. [Google Scholar] [CrossRef]
  32. Société Nationale d’Électricité du Burkina Faso (SONABEL). Rapport d’Activité 2022; SONABEL: Ouagadougou, Burkina Faso, 2023; p. 22. Available online: https://www.sonabel.bf/wp-content/uploads/2024/02/Rapport-dActivites-2022-avec-compression.pdf (accessed on 15 May 2025).
  33. Gouvernement du Burkina Faso. Loi n°014-2017/AN du 20 Avril 2017 Portant Réglementation Générale du Secteur de l’Énergie au Burkina Faso; Assemblée Nationale: Ouagadougou, Burkina Faso, 2017. Available online: https://www.energie-mines.gov.bf/fileadmin/userupload/stockage/documents/Loisettextes/Energie/Loi014-2017ANreglementationgeneralesecteur_energie.pdf (accessed on 29 March 2026).
  34. International Renewable Energy Agency (IRENA). Renewables Readiness Assessment: Burkina Faso; IRENA: Abu Dhabi, United Arab Emirates, 2023. Available online: https://www.irena.org/-/media/Files/IRENA/Agency/Publication/2023/Dec/IRENA_RRA_Burkina_Faso_2023.pdf (accessed on 21 March 2026).
  35. Bukari, D.; Quansah, D.A.; Kemausuor, F.; Adaramola, M.S. Ex-post design, operations and financial cost-benefit analysis of mini-grids in Ghana: What can we learn? Energy Sustain. Dev. 2022, 68, 390–409. [Google Scholar] [CrossRef]
  36. Mini-Grids Partnership. State of the Global Mini-Grids Market Report 2024; Mini-Grids Partnership: Washington, DC, USA, 2024; Available online: https://minigrids.org/wp-content/uploads/2024/08/SOTM-Report-2024_EN_vFc.pdf (accessed on 13 January 2025).
  37. International Bank for Reconstruction and Development (IBRD). Mini-Grids for Half a Billion People: Market Outlook and Handbook for Decision Makers; World Bank: Washington, DC, USA, 2022; Available online: https://openknowledge.worldbank.org/server/api/core/bitstreams/32287154-1ccb-46ce-83af-08facf7a3b49/content (accessed on 16 January 2025).
  38. Sustainable Energy for All (SEforALL). Understanding Mini-Grid Tariffs in Sierra Leone: A Quantitative and Comparative Analysis of Price Drivers; SEforALL: Vienna, Austria, 2023; Available online: https://www.seforall.org/system/files/2023-11/sierra-leone-tariffs-report-web.pdf (accessed on 16 January 2025).
  39. International Renewable Energy Agency (IRENA). Renewable Power Generation Costs in 2023; IRENA: Abu Dhabi, United Arab Emirates, 2024. Available online: https://www.irena.org/Publications/2024/Sep/Renewable-Power-Generation-Costs-in-2023 (accessed on 21 March 2026).
  40. International Energy Agency (IEA). Batteries and Secure Energy Transitions; IEA: Paris, France, 2023. Available online: https://www.iea.org/reports/batteries-and-secure-energy-transitions (accessed on 21 March 2026).
  41. Booth, S.; Li, X.; Baring-Gould, I.; Kollanyi, D.; Bharadwaj, A.; Weston, P. Productive Use of Energy in African Micro-Grids: Technical and Business Considerations; NREL: Golden, CO, USA, 2018. [CrossRef]
Figure 1. Daily mean photovoltaic energy potential per installed kWp for Toussiana (Burkina Faso). Data from the Global Solar Atlas [19].
Energies 19 02163 g001
Figure 2. Shea butter process at SOTOKACC.
Energies 19 02163 g002
Figure 3. Remote power sensor installation scheme.
Energies 19 02163 g003
Figure 4. Power supply configurations: (a) Grid, (b) Grid/PV, (c) Grid/battery, (d) Grid/PV/battery, (e) PV/battery.
Energies 19 02163 g004
Figure 5. Overview of temperature and precipitation data in Burkina Faso throughout the year [29].
Energies 19 02163 g005
Figure 6. Assessed scenarios for yearly profile load.
Energies 19 02163 g006
Figure 7. Processing plant power profile (a) with power sensor measurements for 17–19 December 2023 and 30–31 January 2024; (b) Average daily data, operations block is calculated as the difference between the processing plant and cooling block.
Energies 19 02163 g007
Figure 8. Exemplary 1-week load profile in January 2024.
Energies 19 02163 g008
Figure 9. Annual load profile of the shea butter processing plant (a) Scenario 1; (b) Scenario 2; (c) Scenario 3.
Energies 19 02163 g009
Figure 10. Power allocation from the grid/PV system configuration to serve the load under scenario 2.
Energies 19 02163 g010
Figure 11. Power allocation in the grid/PV/battery system configuration to serve the load under scenario 3.
Energies 19 02163 g011
Figure 12. Power allocation in the PV/battery system configuration to serve the load under scenario 3.
Energies 19 02163 g012
Figure 13. Levelized cost of energy (LCOE) of different power supply configurations under three scenarios of operation.
Energies 19 02163 g013
Table 1. Monthly electricity consumption (November 2021–April 2022).
MonthNovember-2021December-2021January-2022February-2022March-2022April-2022
Cost of electricity bill (USD)1245.2421076.9871312.1601173.6981952.572268.765
Active energy consumed (kWh)35533967656366764426198
Table 2. Technical and economic performance of different system configurations under three scenarios of operation (Note: The Grid/PV entry in Scenario 1 shows a very small, optimized PV size (0.2 kWp) with an LCOE equal to the grid-only baseline, reflecting HOMER Pro’s optimization behavior under the low annual utilization of Scenario 1 (load factor: 20.2%), where PV capital costs cannot be sufficiently amortized over the short 4-month operating season to reduce LCOE meaningfully).
ScenariosConfigurations of Powering SystemsSize of ComponentsElectrical Performance of the SystemsCostsEconomic Performance
PV Panels (kWp)Batteries (kWh)Inverter (kW)Load Factor (%)Total Energy Produced (MWh/year)Excess Energy (MWh/year)RE Fraction (%)NPC (Thousands USD)LCOE
(USD/kWh)
IRR (%)DPP (years)Status:
Energies 19 02163 i001/Energies 19 02163 i002
1Grid---20.242.8800168.3330.319Baseline for comparison
Grid/PV0.2-0.143.140.2540.225168.3330.3192.2-Energies 19 02163 i002
Grid/battery-10.142.8800.0015170.0000.320--Energies 19 02163 i002
Grid/PV/battery0.810.144.151.250.44170.0000.322--Energies 19 02163 i002
PV/battery95.126025.6166.025123.36100401.6670.818--Energies 19 02163 i002
2Grid ---31.1773.5200290.0000.319Baseline for comparison
Grid/PV34.4-20.4107.8933.0535.6263.3330.28713.87.73Energies 19 02163 i001
Grid/battery-10.373.5200.001290.0000.320--Energies 19 02163 i002
Grid/PV/battery37.1120.6111.4536.5337.2263.3330.28713.18.08Energies 19 02163 i001
PV/battery 10126632.8175.535102.49100423.3330.504--Energies 19 02163 i002
3Grid ---52.21123.0700485.0000.319Baseline for comparison
Grid/PV46.3-21.7154.2328.6241383.3330.24928.303.89Energies 19 02163 i001
Grid/battery-20.3123.0700.001486.6670.320--Energies 19 02163 i002
Grid/PV/battery54.14621.7153.6225.9652.5380.0000.24620.705.14Energies 19 02163 i001
PV/battery 10325924.2180.558100411.6670.2929.29Energies 19 02163 i001
Caption: Energies 19 02163 i001 Attractive Energies 19 02163 i002 Non-attractive.
Table 3. Sensitivity analysis parameters and ranges.
ParameterBase CaseLowHigh
PV CAPEXBase value−25%+15%
Battery costBase value−25%+15%
Discount rate9%6%12%
Grid tariff escalation0%/year3%/year; 5%/year
Table 4. Sensitivity analysis of economic performance indicators for Scenario 3 configurations.
ParametersVariationGrid/PV
(LCOE/IRR)
Grid/PV/Battery
(LCOE/IRR)
PV/Battery
(LCOE/IRR)
Grid Baseline
(LCOE/IRR)
Base case0.249/28.30.246/20.70.292/9.20.319
PV CAPEX−25%0.244/35.30.240/24.30.279/10.50.319
+15%0.252/25.20.250/19.00.300/8.50.319
Battery CAPEX−25%n/a0.241/23.60.260/12.10.319
+15%n/a0.249/19.30.311/7.60.319
Discount rate6%0.246/27.20.234/180.260/9.10.319
12%0.256/29.30.255/27.70.327/9.30.319
Grid tariff escalation+3%/yr0.301/~420.294/~320.292/~170.395
+5%/yr0.347/~550.335/~430.292/~220.460
Disclaimer/Publisher’s Note: The statements, opinions and data contained in all publications are solely those of the individual author(s) and contributor(s) and not of MDPI and/or the editor(s). MDPI and/or the editor(s) disclaim responsibility for any injury to people or property resulting from any ideas, methods, instructions or products referred to in the content.