Article

Impact of Fault-Induced Tripping of Sink-Area Renewable Energy Sources on Power System Voltage Stability

Department of Advanced Power Grid Research, Korea Electrotechnology Research Institute, Uiwang-si 16029, Republic of Korea
*
Author to whom correspondence should be addressed.
Energies 2026, 19(9), 2082; https://doi.org/10.3390/en19092082
Submission received: 6 April 2026 / Revised: 15 April 2026 / Accepted: 23 April 2026 / Published: 25 April 2026
(This article belongs to the Section F1: Electrical Power System)

Abstract

Voltage stability assessment of a transmission interface is carried out by continuation power flow (CPF) using a fixed post-contingency operating condition. However, if legacy renewable energy sources (RESs) in the sink area are tripped during or following a fault, the actual post-fault operating point can differ from that assumed in the CPF study. This paper examines the effect of sink-area RES tripping on transmission interface voltage stability. The shift in the post-fault operating point caused by the loss of sink-area active power injection is explained using a two-bus equivalent, and the effect of reactive power support from connected RES on the transfer limit is also discussed. The proposed analysis is verified using a modified SAVNW test system in PSS/E. Two contingency scenarios were studied by applying a three-phase fault at the receiving-end bus and tripping one transmission interface line at fault clearing. The results show that sink-area RES tripping moves the post-fault operating point toward the nose point and reduces the voltage stability margin. The results also show that reactive power support from connected RES increases the transfer limit and leads to a larger margin. These effects should be considered in voltage stability assessment of transmission interfaces with legacy RES.

1. Introduction

Global power systems are undergoing a change in their generation mix. Renewable energy sources (RESs) are replacing conventional synchronous generators in response to decarbonization requirements. Because many RESs are connected to the grid through power electronic converters, their dynamic responses during disturbances are determined by converter control functions and protection settings. High RES penetration changes the operating characteristics of the power system and affects several forms of power system stability [1,2]. Related issues in low-inertia and inverter-dominated systems have also been discussed in [3,4].
The impact of RES on power system stability has been studied from various perspectives. Transient and frequency stability in RES-dominated systems are commonly evaluated using time-domain simulation [5,6]. The influence of momentary cessation mode on transient stability was analyzed in [7]. The capacity limit of inverter-based distributed generators under transient and frequency constraints was studied in [8]. The effect of recovery ramp rate after momentary cessation was examined in [9]. The impact of frequency ride-through capability of legacy inverters on frequency stability was investigated in [10]. These studies show that the dynamic response of RESs during disturbances can affect the post-fault system behavior in terms of transient and frequency stability.
In recent years, multiple disturbance events have shown that fault-induced RES tripping can result in a large loss of generation. In 2016, a transmission fault in Southern California caused a loss of 1200 MW of solar PV generation [11]. A similar event in 2017 resulted in the loss of 900 MW [12]. In 2018, two events in the same region led to the loss of over 1000 MW [13]. In 2021, a fault event in Texas caused a loss of approximately 1000 MW of inverter-based resources [14]. In these events, the RES loss was caused by inverter protection settings and momentary cessation behavior triggered by the voltage drop during the fault.
Following these events, NERC collected data from generator owners operating bulk electric system solar PV facilities and found that a considerable amount of solar PV capacity could not eliminate or change their momentary cessation settings [15]. Momentary cessation refers to a condition in which the RES temporarily stops injecting power into the grid during a voltage disturbance. If the abnormal voltage persists beyond a specified duration, the RES may be tripped. From the viewpoint of power system stability, the cessation of power injection can reduce the generation–load balance in the affected area and may affect the system stability.
The ride-through capability of RESs depends on the interconnection standard applied at the time of installation. Under IEEE 1547-2003 [16], no ride-through was required during voltage disturbances, and RESs were required to cease to energize within 0.16 s when the terminal voltage dropped below 0.5 pu. Although the standard has since been revised to require ride-through in IEEE 1547-2018 [17], some RESs that were installed under the earlier version cannot update their control parameters because of hardware or manufacturer limitations. These RESs, referred to as legacy RESs in this paper, still follow the original trip settings and can be tripped by voltage disturbances that would not cause tripping under the current requirements. In this paper, the RESs under consideration are inverter-based wind farms and solar photovoltaic plants connected through power electronic converters.
In power system voltage stability studies, the impact of RESs has been evaluated using static methods. Recent review papers have summarized research trends in voltage stability for RES-integrated systems [18,19,20]. Continuation power flow (CPF) has been widely used to evaluate the voltage stability margin of a critical transmission interface under contingencies [21,22,23], and this approach has also been applied to determine the flow limit of a transmission interface in large-scale systems [24]. The methods of static voltage stability assessment have been established in [25], and the effect of wind generation on steady-state voltage stability has been examined in [26]. Some investigations have analyzed voltage stability using a combination of static and dynamic approaches [27,28]. These studies show that static voltage stability assessment remains useful for evaluating transfer capability and voltage stability margin.
Despite these efforts, the effect of fault-induced RES tripping on voltage stability has not been addressed. A conventional CPF study evaluates the post-contingency condition with a fixed generation condition, assuming that all generators remain connected to the grid. If legacy RESs are tripped during the fault, the calculated voltage stability margin may not reflect the actual post-fault condition.
Most existing voltage stability margin studies for RES-integrated systems evaluate the post-contingency margin from a fixed post-fault operating point determined by the network contingency, while treating the post-fault generation condition as given [18,19,20,26,27,28]. This approach is appropriate when the RES units remain connected during the disturbance. However, it does not reflect the situation in which sink-area legacy RESs are tripped during the fault. In that case, the loss of sink-area active power injection increases the power imported through the transmission interface, shifts the post-fault operating point to the right on the P–V curve, and reduces the actual voltage stability margin. The present paper focuses on this effect and shows that it should be reflected in the post-fault operating condition used for continuation power flow analysis of transmission interfaces with legacy sink-area RESs.
When fault-induced RES tripping occurs in the sink area of a transmission interface, the effect on voltage stability can be adverse. The sink area is a load-dominant area that relies on power import through the transmission interface. If a local RES in the sink area is tripped by a fault, the system must import more power through the interface to maintain the load balance, and the operating point on the P–V curve can move toward the nose point. When a sink-area RES provides reactive power support before the fault, the effective reactive power demand at the receiving end is reduced, and the voltage stability margin is larger than that without the reactive power support.
In conventional transmission system studies, a line contingency is represented by applying a three-phase fault at the sending-end bus. However, if only the sending-end bus fault is considered, the RES tripping near the receiving end may not be identified. For this reason, faults at the receiving-end bus should also be examined. This paper examines the effect of fault-induced tripping of sink-area RESs on the voltage stability of a transmission interface. By applying a time-domain simulation for a fault at the receiving-end bus, the possibility and amount of sink-area RES tripping are identified. The tripping information is then reflected in the CPF analysis to evaluate the voltage stability margin under the post-fault generation condition. The approach is verified using a modified SAVNW test system.
The remainder of this paper is organized as follows. Section 2 describes the ride-through characteristics of legacy RESs during abnormal voltage conditions. Section 3 presents the voltage stability assessment method for a transmission interface using CPF. Section 4 examines how fault-induced tripping of sink-area RESs affects the voltage stability margin by analyzing the shift in the post-fault operating point on the P–V curve due to the loss of sink-area active power generation and the effect of reactive power support from sink-area RESs on the maximum transferable power. Section 5 presents the case study using a modified SAVNW test system, and Section 6 concludes the paper.

2. Response of Legacy RES to Abnormal Voltage Conditions

The ride-through capability of RESs during voltage disturbances is defined by the interconnection standard applied at the time of installation. Under IEEE 1547-2003, the response of distributed resources to abnormal voltages was specified. If the terminal voltage dropped below 50% of the base voltage, the RES was required to cease to energize within 0.16 s. For the voltage range between 50% and 88%, the clearing time was 2.0 s. Under this standard, no ride-through was required during voltage disturbances, and the RES was allowed to cease to energize at any voltage below 88% within the specified clearing time. These settings were established when the penetration of RESs was low, and the effect of RES tripping on the bulk power system was not a major concern. However, as RES penetration has increased, RESs installed under these settings can be tripped during transmission faults even when the fault is cleared within a few cycles.
The interconnection standard has since been revised to IEEE 1547-2018, which introduced mandatory ride-through requirements and defined performance categories with longer ride-through durations. However, not all RESs in service can comply with the current standard. According to data collected by NERC [15], approximately 9700 MW of solar PV capacity used momentary cessation when the voltage dropped below the continuous operating range of the inverter. Of this capacity, approximately 4500 MW could not eliminate momentary cessation, and approximately 3200 MW could not change their momentary cessation settings at all because of hardware or manufacturer limitations. These RESs remain in service with the settings that were configured at the time of installation.
In this paper, RESs that were installed under the earlier interconnection standard and cannot update their ride-through settings are referred to as legacy RESs. Because legacy RESs follow the response to abnormal voltages defined in IEEE 1547-2003 or use momentary cessation with limited configurability, they can be tripped by voltage disturbances that would not cause tripping under the current standard. As RES penetration continues to increase, legacy RESs and RESs that comply with the current standard coexist in the same power system. The amount of fault-induced RES tripping during a transmission fault therefore depends on the proportion of legacy RESs in the affected area. This paper focuses on the effect of fault-induced tripping of sink-area legacy RESs on the voltage stability of a transmission interface.

3. Voltage Stability Assessment of Transmission Interface

3.1. Two-Bus Equivalent Model

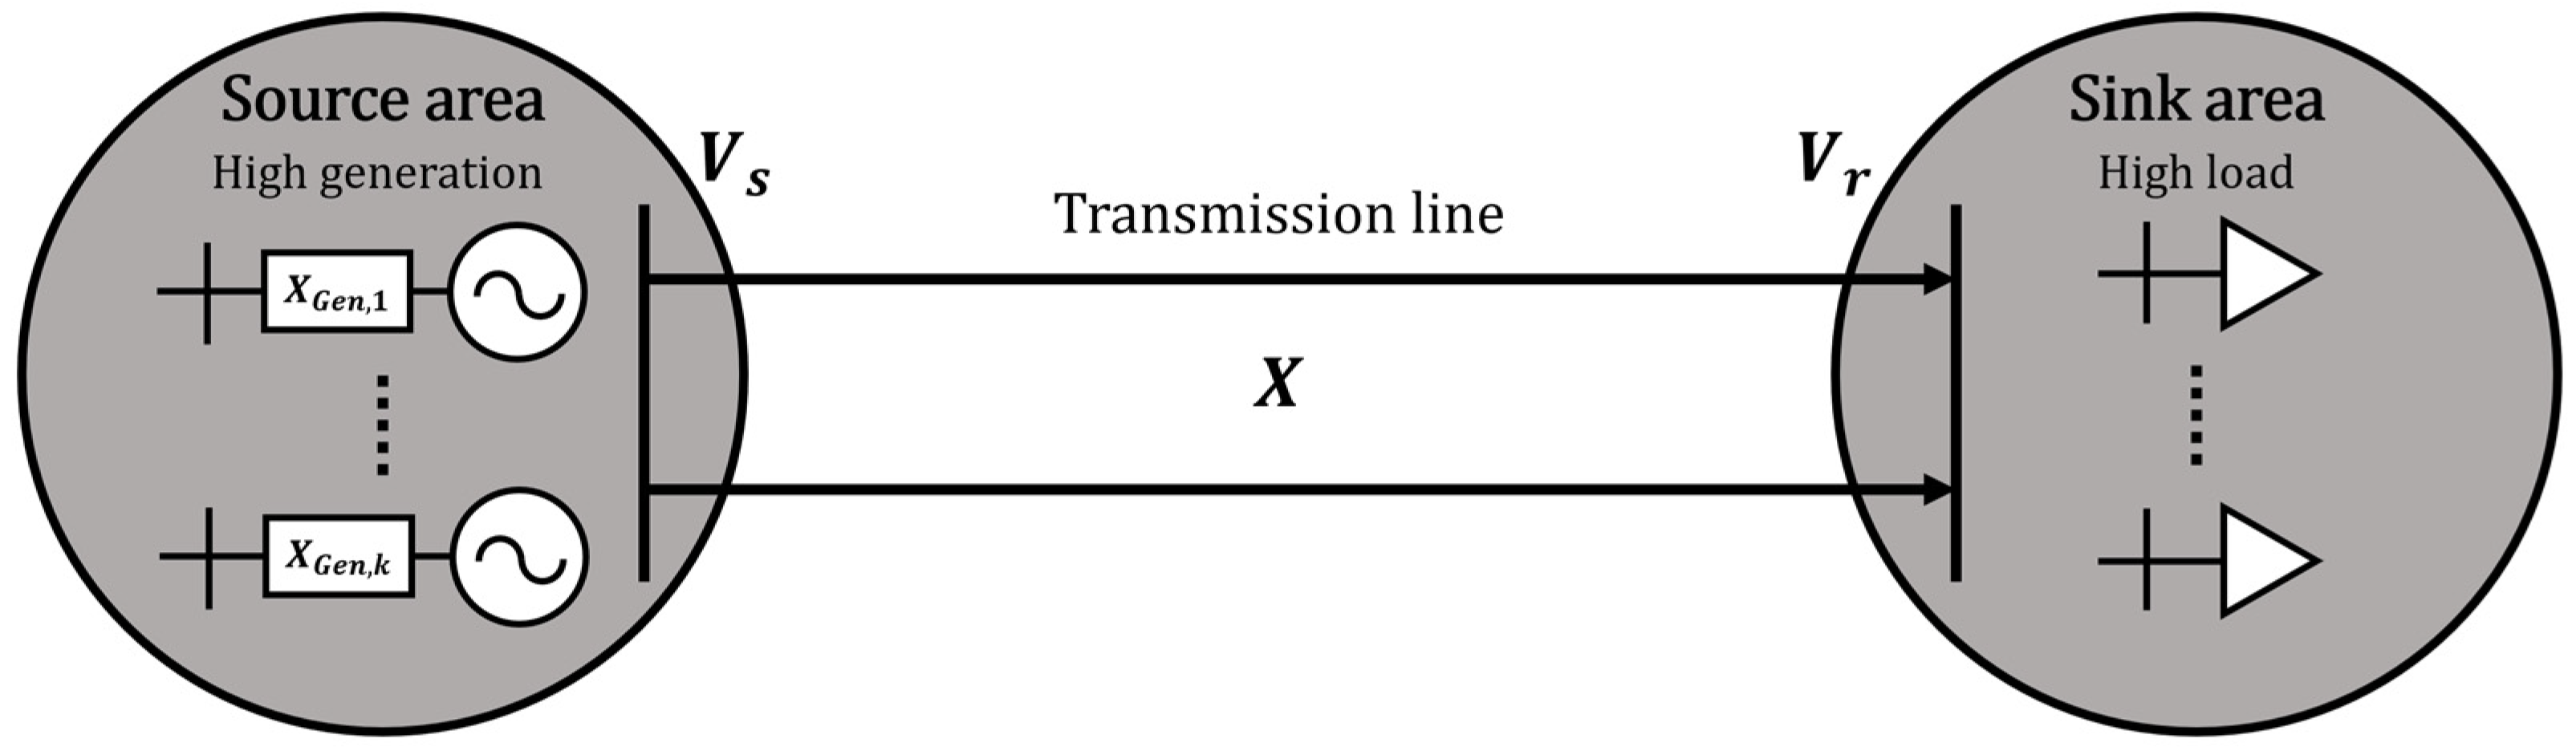
To examine the voltage stability of a bulk power system, a simplified two-bus equivalent is used. As shown in Figure 1, the source area denotes a generation-rich area and is modeled by a sending-end bus, whereas the sink area denotes a load-dominant area and is modeled by a receiving-end bus. The two buses are connected through an equivalent series reactance X. The active power transferred through the transmission interface determines the operating point of the system on the P–V curve.
For this system, the voltage magnitude at the receiving-end bus V r is expressed as
V r = V s 2 2 Q r X ± V s 4 4 X   V s 2 Q r X 2 P 2
where P is the active power transferred through the transmission interface, V s is the voltage magnitude at the sending-end bus, and Q r is the reactive power demand at the receiving-end bus.
The voltage collapse point is reached when the discriminant in (1) becomes zero. At this point, the maximum transferable active power is obtained as in the classical two-bus voltage stability formulation in [25].
P m a x = V s 4 4 X 2 V s 2 Q r X

3.2. Continuation Power Flow for Voltage Stability Margin

In a large-scale power system, the voltage stability margin of a transmission interface is evaluated using CPF [21,22,23]. The CPF traces the P–V curve by incrementally increasing the load at the sink area and the generation at the source area until the power flow solution reaches the voltage collapse point. The load and generation increase are parameterized by a loading factor λ. The active and reactive power loads at bus i are expressed as
P L i = P L i 0 + λ K L i S i cos φ i
Q L i = Q L i 0 + λ K L i S i sin φ i
where PLi and QLi are the base-case active and reactive power loads at bus i, respectively; ki is a multiplier that designates the rate of load change at bus i; Si is the apparent power at bus i; φi is the power factor angle at bus i; and λ is the loading parameter. Because the load increase is expressed in terms of PLi and QLi, the power factor at each bus is maintained constant as λ increases. In a general CPF formulation, the generation increase is assigned according to the assumed participation pattern. The CPF solves the power flow equations with the parameterized load in (3) and (4) using a predictor-corrector method. At each step, a predictor is used to estimate the next solution along the P–V curve, and a corrector is applied to find the exact solution. This process is repeated as λ increases until the power flow Jacobian matrix becomes singular. The singular point corresponds to the nose point of the P–V curve and defines the maximum power transfer limit.
The voltage stability margin M is defined as the difference between the active power transfer at the nose point and the active power transfer at the post-contingency operating point:
M = P m a x P 0
where P m a x is the active power transfer at the nose point and P 0 is the active power flowing through the transmission interface after the contingency.
In a conventional CPF study, the post-contingency operating condition is evaluated under a fixed generation condition. The target transmission line is tripped, and the load and generation are scaled from the post-contingency base case. Under this assumption, the operating point P 0 is determined from the predefined post-fault injections without accounting for any additional generation loss during the disturbance.
However, if fault-induced RES tripping occurs during the contingency, the post-fault generation condition used as the operating point of the CPF may not reflect the actual system state. In a conventional CPF study, the base case is constructed under the assumption that all generators remain connected after the transmission line trip. If RESs are disconnected during the fault, the actual transmission interface flow and the reactive power balance at the operating point differ from those assumed in the conventional base case. As a result, the voltage stability margin obtained from the CPF can be different from the actual post-fault margin.
In this study, the CPF loading direction was defined by increasing the sink-area load and the output of a designated conventional generator in the source area by the same amount. This simplified source-to-sink transfer scenario was intentionally adopted to isolate the effect of sink-area RES tripping on the post-fault operating point and the resulting voltage stability margin. The source-area RES was treated as a fixed injection and did not participate in the generation redispatch. Therefore, although wind and solar photovoltaic sources are intermittent generation sources, their outputs were treated as constant during the CPF sweep for a given post-fault operating snapshot, resulting in a continuous P–V curve. For each contingency, CPF was applied to the post-fault network with the tripped transmission interface line removed.
A brief application procedure is as follows. The sink-area RES tripping amount under the studied contingency is first checked, and the corresponding loss of sink-area active power injection is reflected in the post-fault operating point used as the starting point of the CPF analysis. In the post-fault power flow case, the initial power balance after sink-area RES tripping is satisfied by the slack bus generator, and the CPF sweep is then carried out using the same source-to-sink loading scenario. The voltage stability margin is obtained from the difference between the post-fault operating point and the maximum transferable power. The next section examines how fault-induced tripping of sink-area RESs changes the post-fault operating condition and the voltage stability margin on the P–V curve.

4. Impact of Sink-Area RES Tripping on Voltage Stability

4.1. Effect of Post-Fault Operating Point Due to Sink-Area RES Tripping

When a sink-area RES is disconnected during or following a fault, the actual post-fault operating condition can differ from that assumed in a conventional CPF study. In particular, the loss of active power injection in the sink area increases the power that must be imported through the transmission interface. Therefore, the post-fault operating point moves closer to the nose point on the P–V curve, and the voltage stability margin can be reduced.
Let the active power transferred through the transmission interface before the RES trip be P 0 , and let the active power of the disconnected sink-area RES be Δ P k . The post-fault active power transfer through the transmission interface can then be expressed as
P f l o w = P 0 + Δ P k
and the corresponding power system voltage stability margin can be reduced to
M k = P m a x ( P 0 + Δ P k )
This indicates that the voltage stability margin decreases by the amount of additional active power that must be supplied through the transmission interface after the sink-area RES trip.
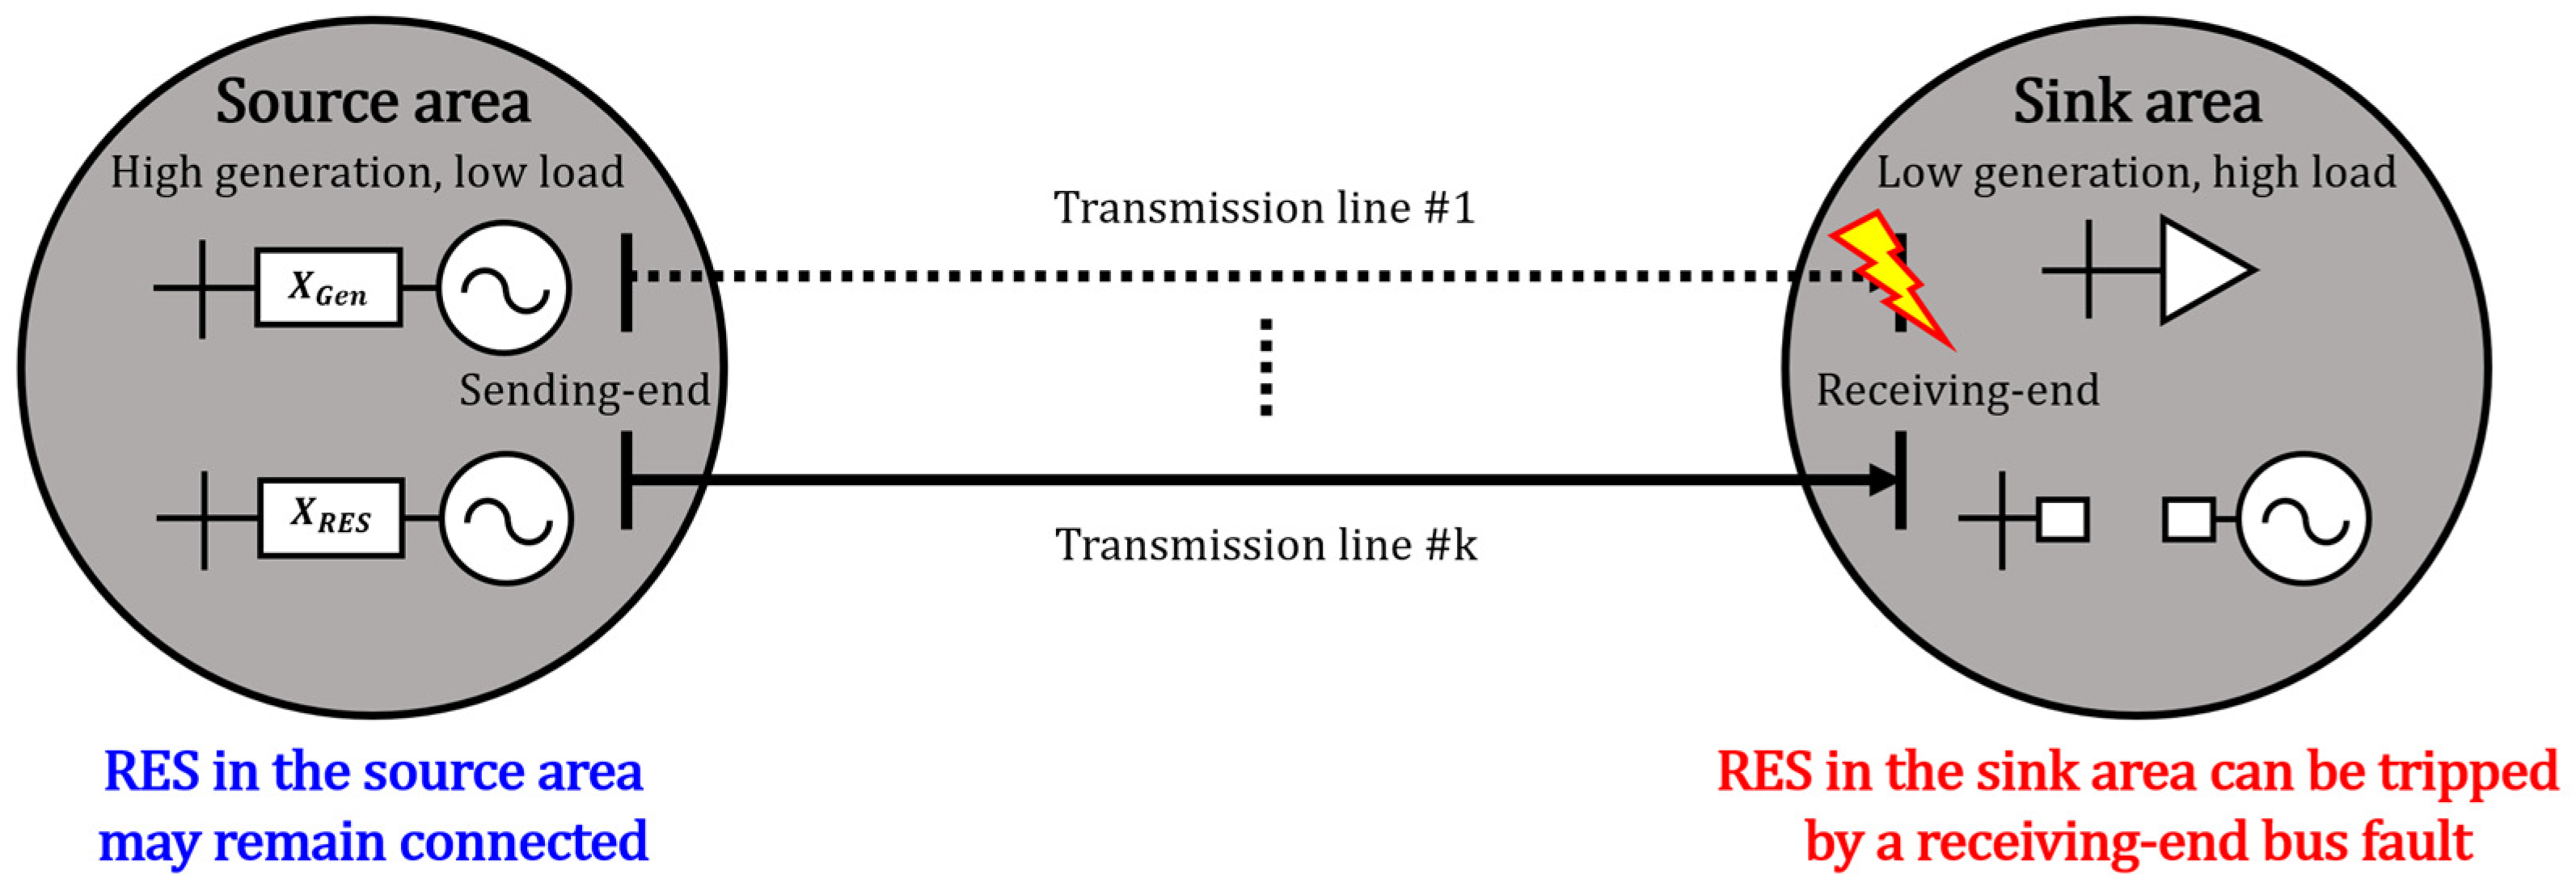
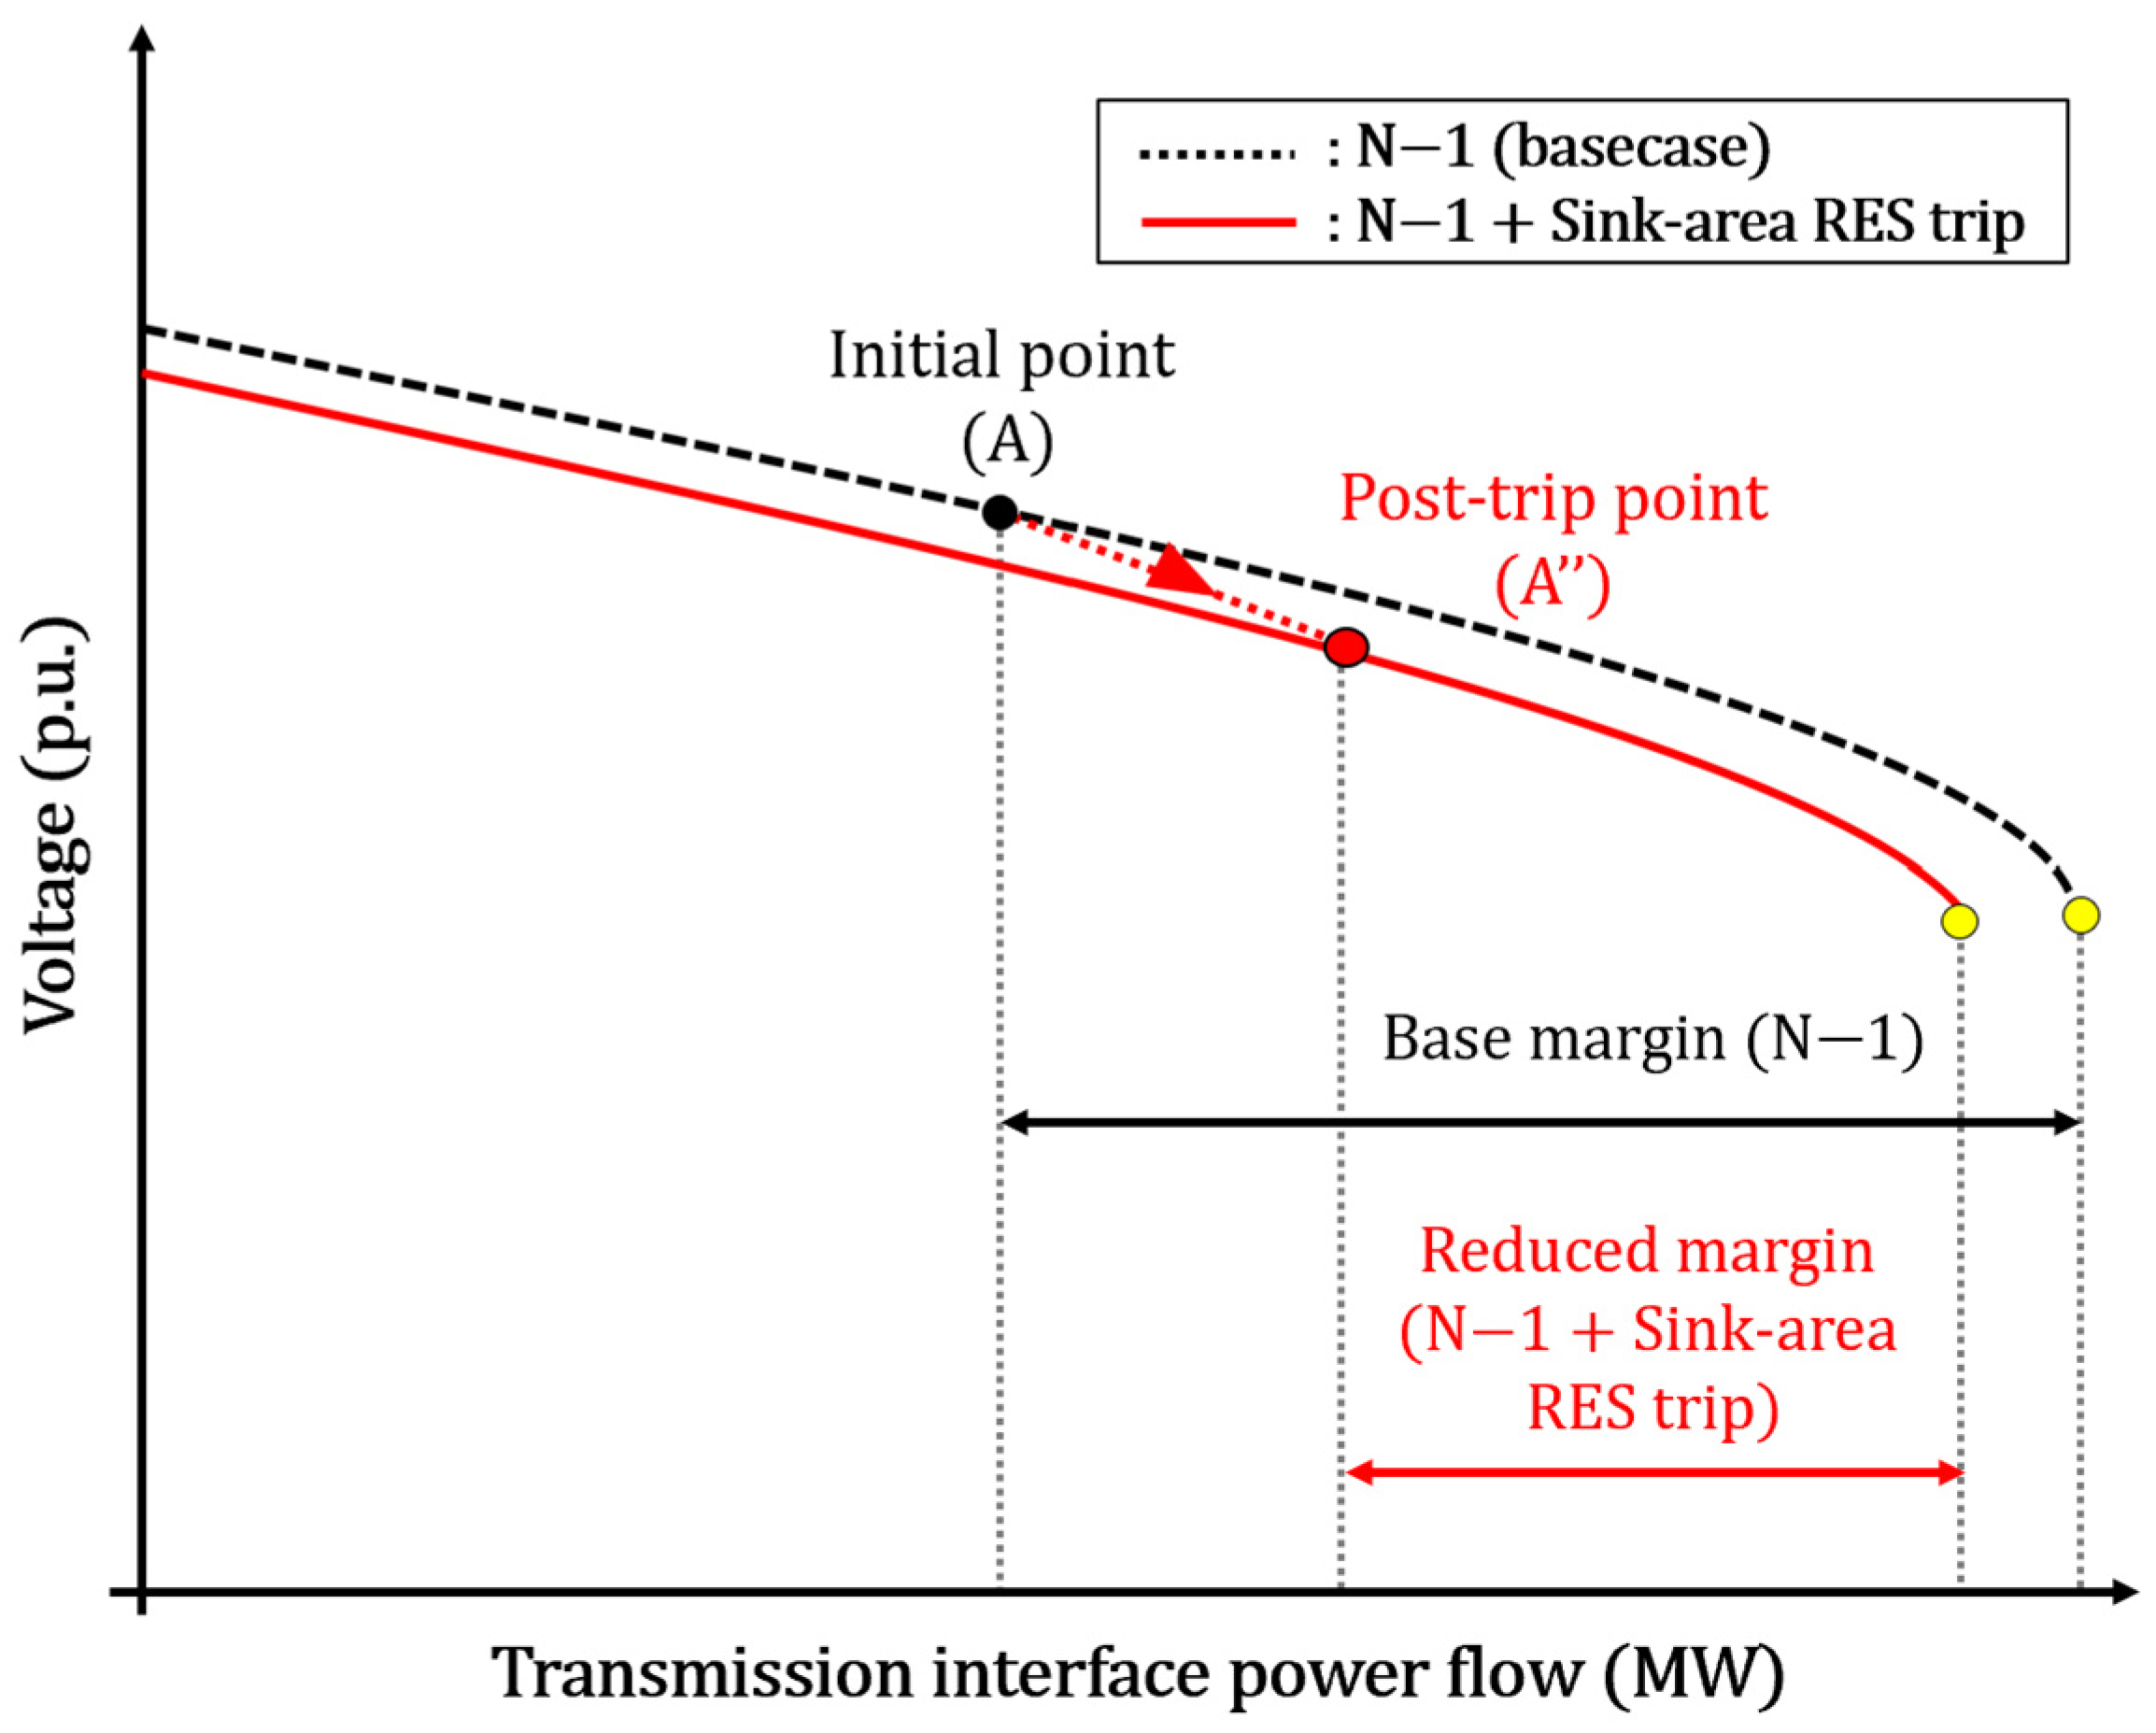
A receiving-end bus fault can lead to sink-area RES tripping if the terminal voltage remains below the ride-through threshold for a sufficient duration. When this occurs, the lost local generation must be replaced by increased import through the transmission interface. This scenario is conceptually illustrated in Figure 2. The corresponding shift in the operating point on the P–V curve is shown in Figure 3. Because the interface transfer increases after the trip, the operating point moves to the right, and the remaining voltage stability margin is reduced.
The reduction in voltage stability margin depends on the tripped sink-area RES capacity and the pre-fault loading level of the transmission interface. If the interface is operated near its transfer limit, even a moderate loss of sink-area RES generation can move the post-fault operating point close to the nose point. In such a case, a conventional CPF result based on a fixed post-contingency operating point may not reflect the actual post-fault margin. Therefore, sink-area RES tripping should be taken into account when the post-fault operating point is determined for voltage stability assessment.
In Figure 3, the reduced voltage stability margin is interpreted as the horizontal distance between the relevant post-fault operating point and the corresponding nose point on the P–V curve. The figure is intended to highlight that, after sink-area RES tripping, the post-fault operating point moves to the right from the viewpoint of the transmission interface and the available margin is reduced. The additional role of reactive power support is discussed separately in Section 4.2 and Figure 4.

4.2. Effect of RES Reactive Power Support on Transfer Limit

In addition to the post-fault operating point shift discussed in Section 4.1, the transfer limit of the transmission interface can also change depending on whether connected RESs provide reactive power support. When an RES supplies reactive power near the load area, the local voltage can be maintained at a higher level, and the maximum transferable power can increase.
For a simple explanation based on the two-bus equivalent in Section 3.1, let Q R E S denote the reactive power support from a connected RES. Under this assumption, the reactive power term at the receiving end can be reduced from Q r to Q r Q R E S . The maximum transferable power with reactive power support can then be written as
P m a x , Q = 1 X V s 4 4 X V s 2 ( Q r Q R E S )
Without reactive power support from the RES, the corresponding maximum transferable power becomes
P m a x , 0 = 1 X V s 4 4 X V s 2 Q r
These expressions are used to explain the effect of reactive power support on the transfer limit in a simple form. In an actual power system, voltage stability is affected by network conditions, bus voltage, converter control characteristics, and the operating condition of the RES. Therefore, (8) and (9) represent the general tendency rather than the exact value in the post-fault state.
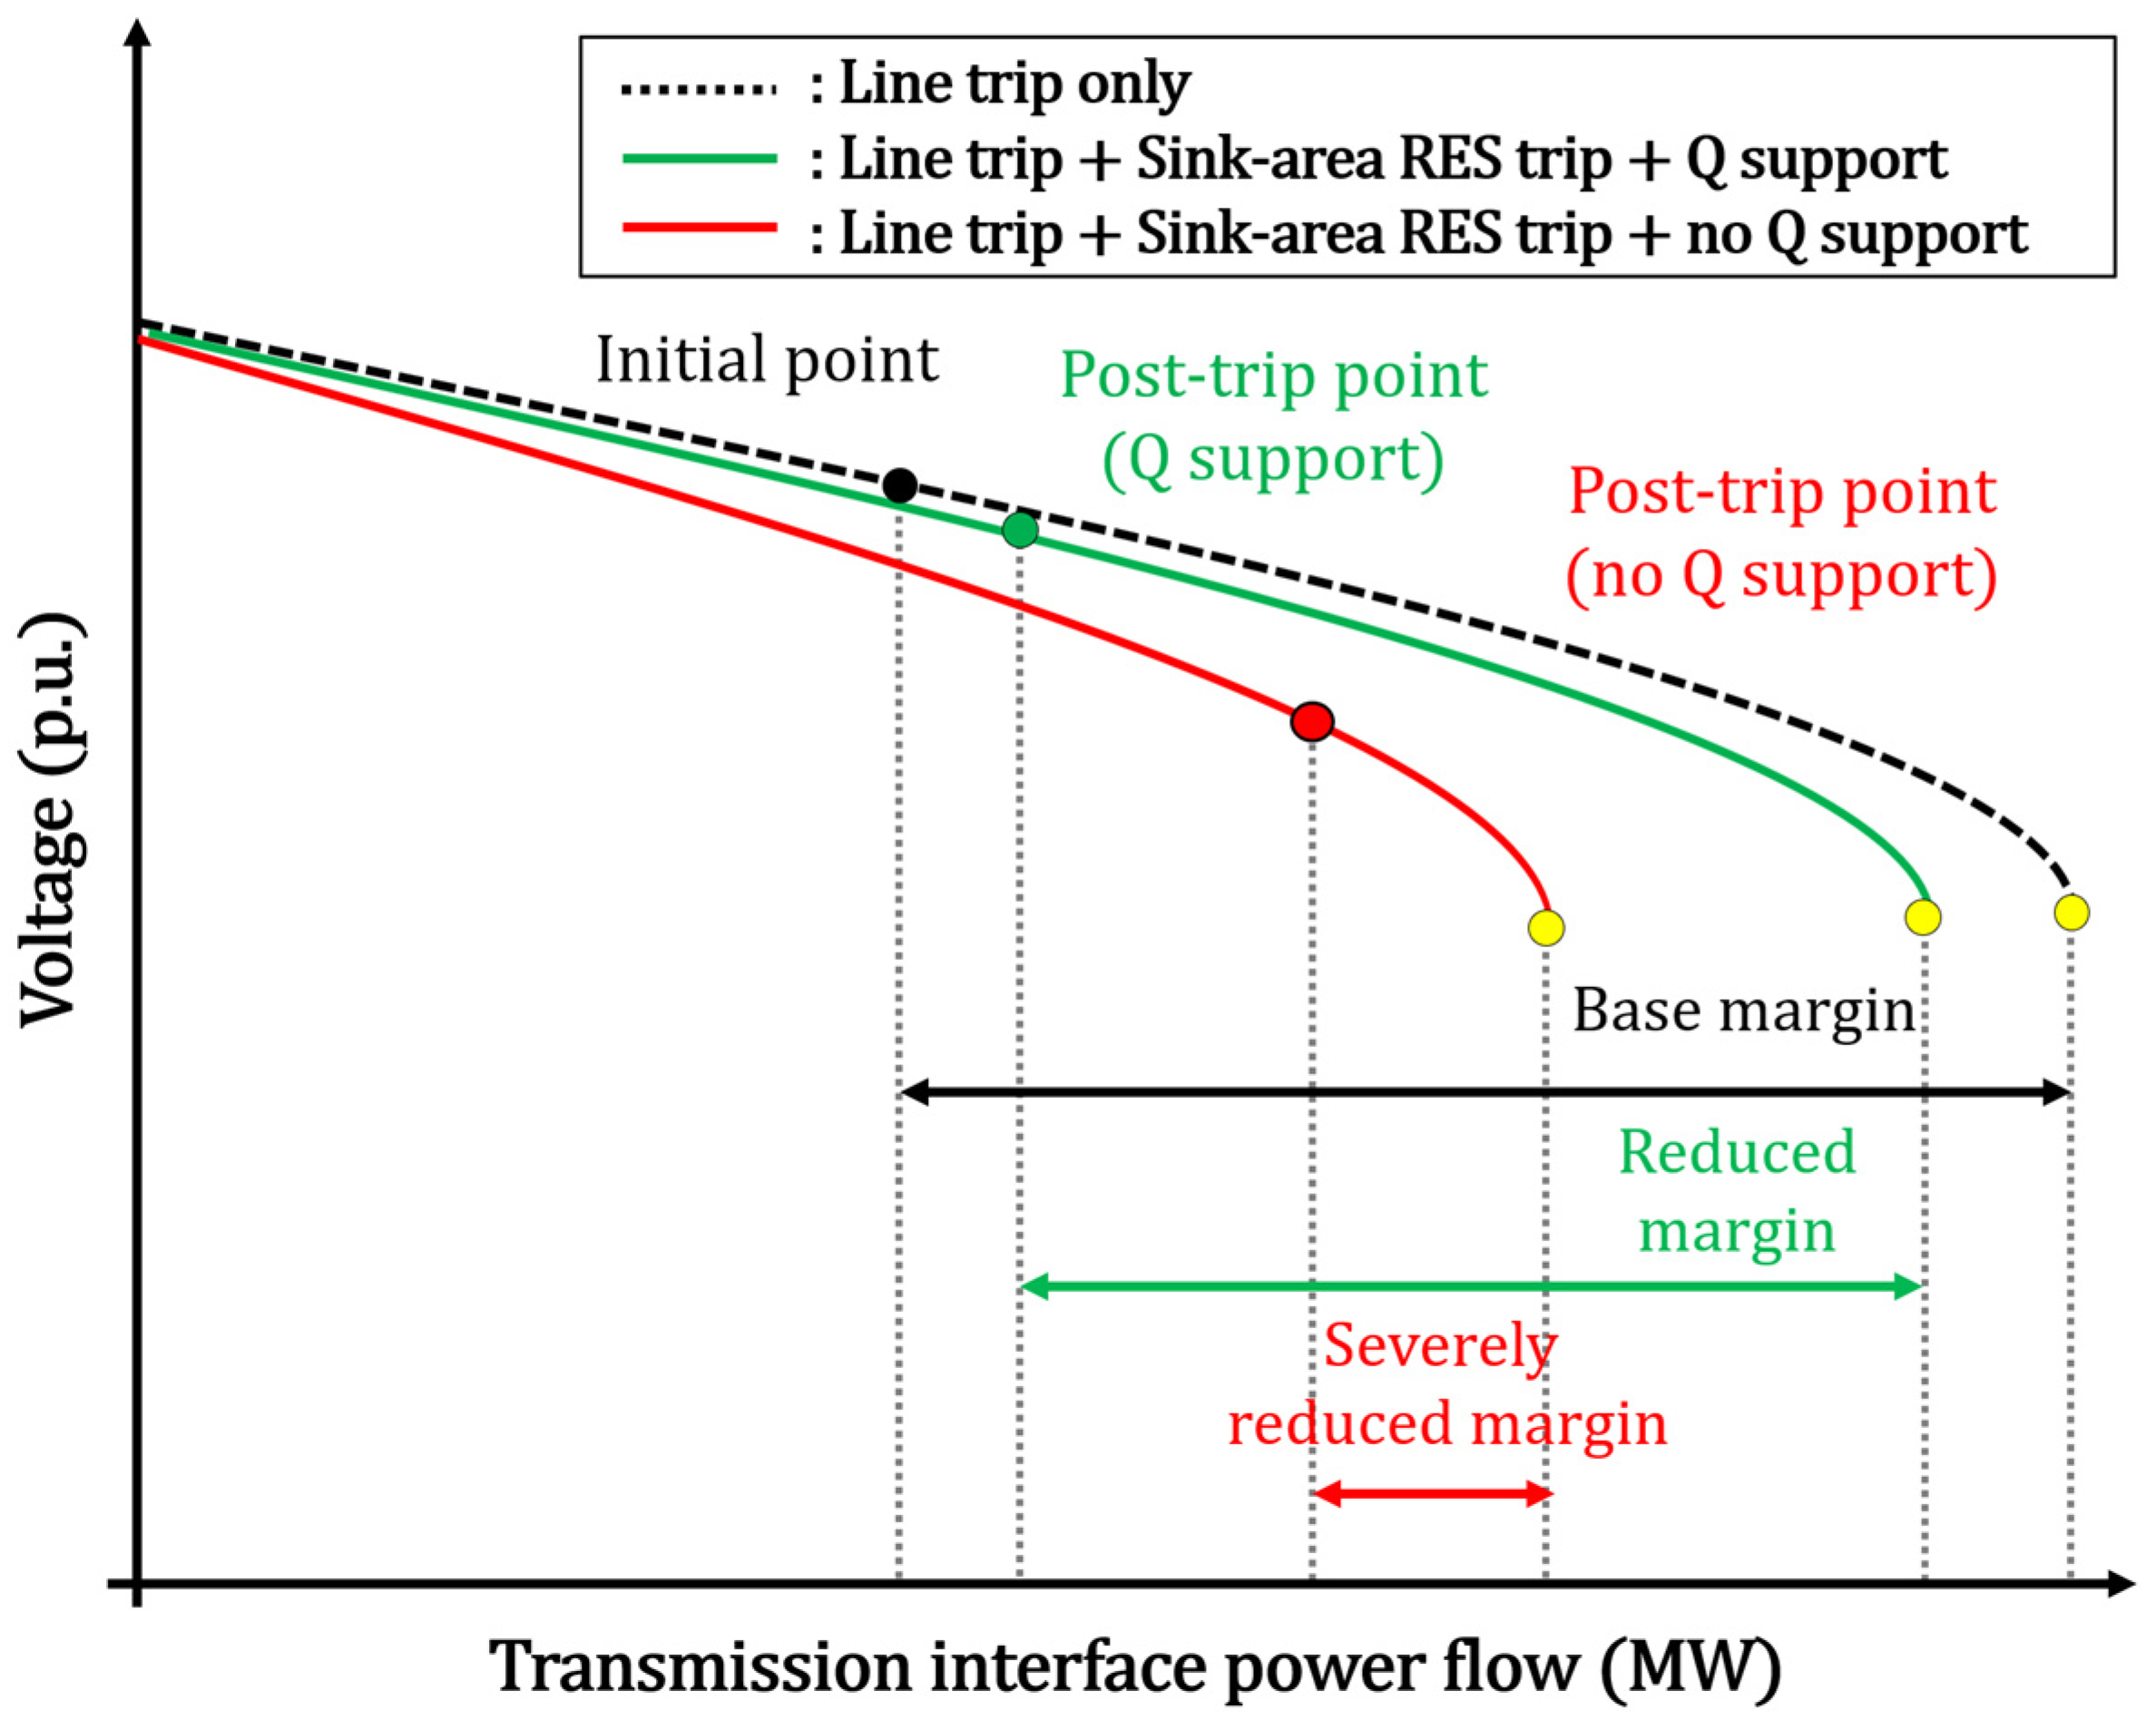
Figure 4 illustrates the effect of reactive power support from connected RES on the P–V curve. With reactive power support, the nose point is shifted to a higher transfer level than that in the case without reactive power support. As a result, the voltage stability margin is larger. In the simulation results, the post-fault difference is not determined only by the loss of reactive power support after sink-area RES tripping. Nevertheless, reactive power support from connected RES increases the transfer limit and results in a larger voltage stability margin.
If a sink-area RES absorbs reactive power, it acts as an additional reactive power demand at the receiving end and can further reduce the maximum transferable power and the voltage stability margin. This case was not observed in the present study because the sink-area RES operated at its upper reactive power limit under the given operating condition.

5. Case Study

5.1. Test System

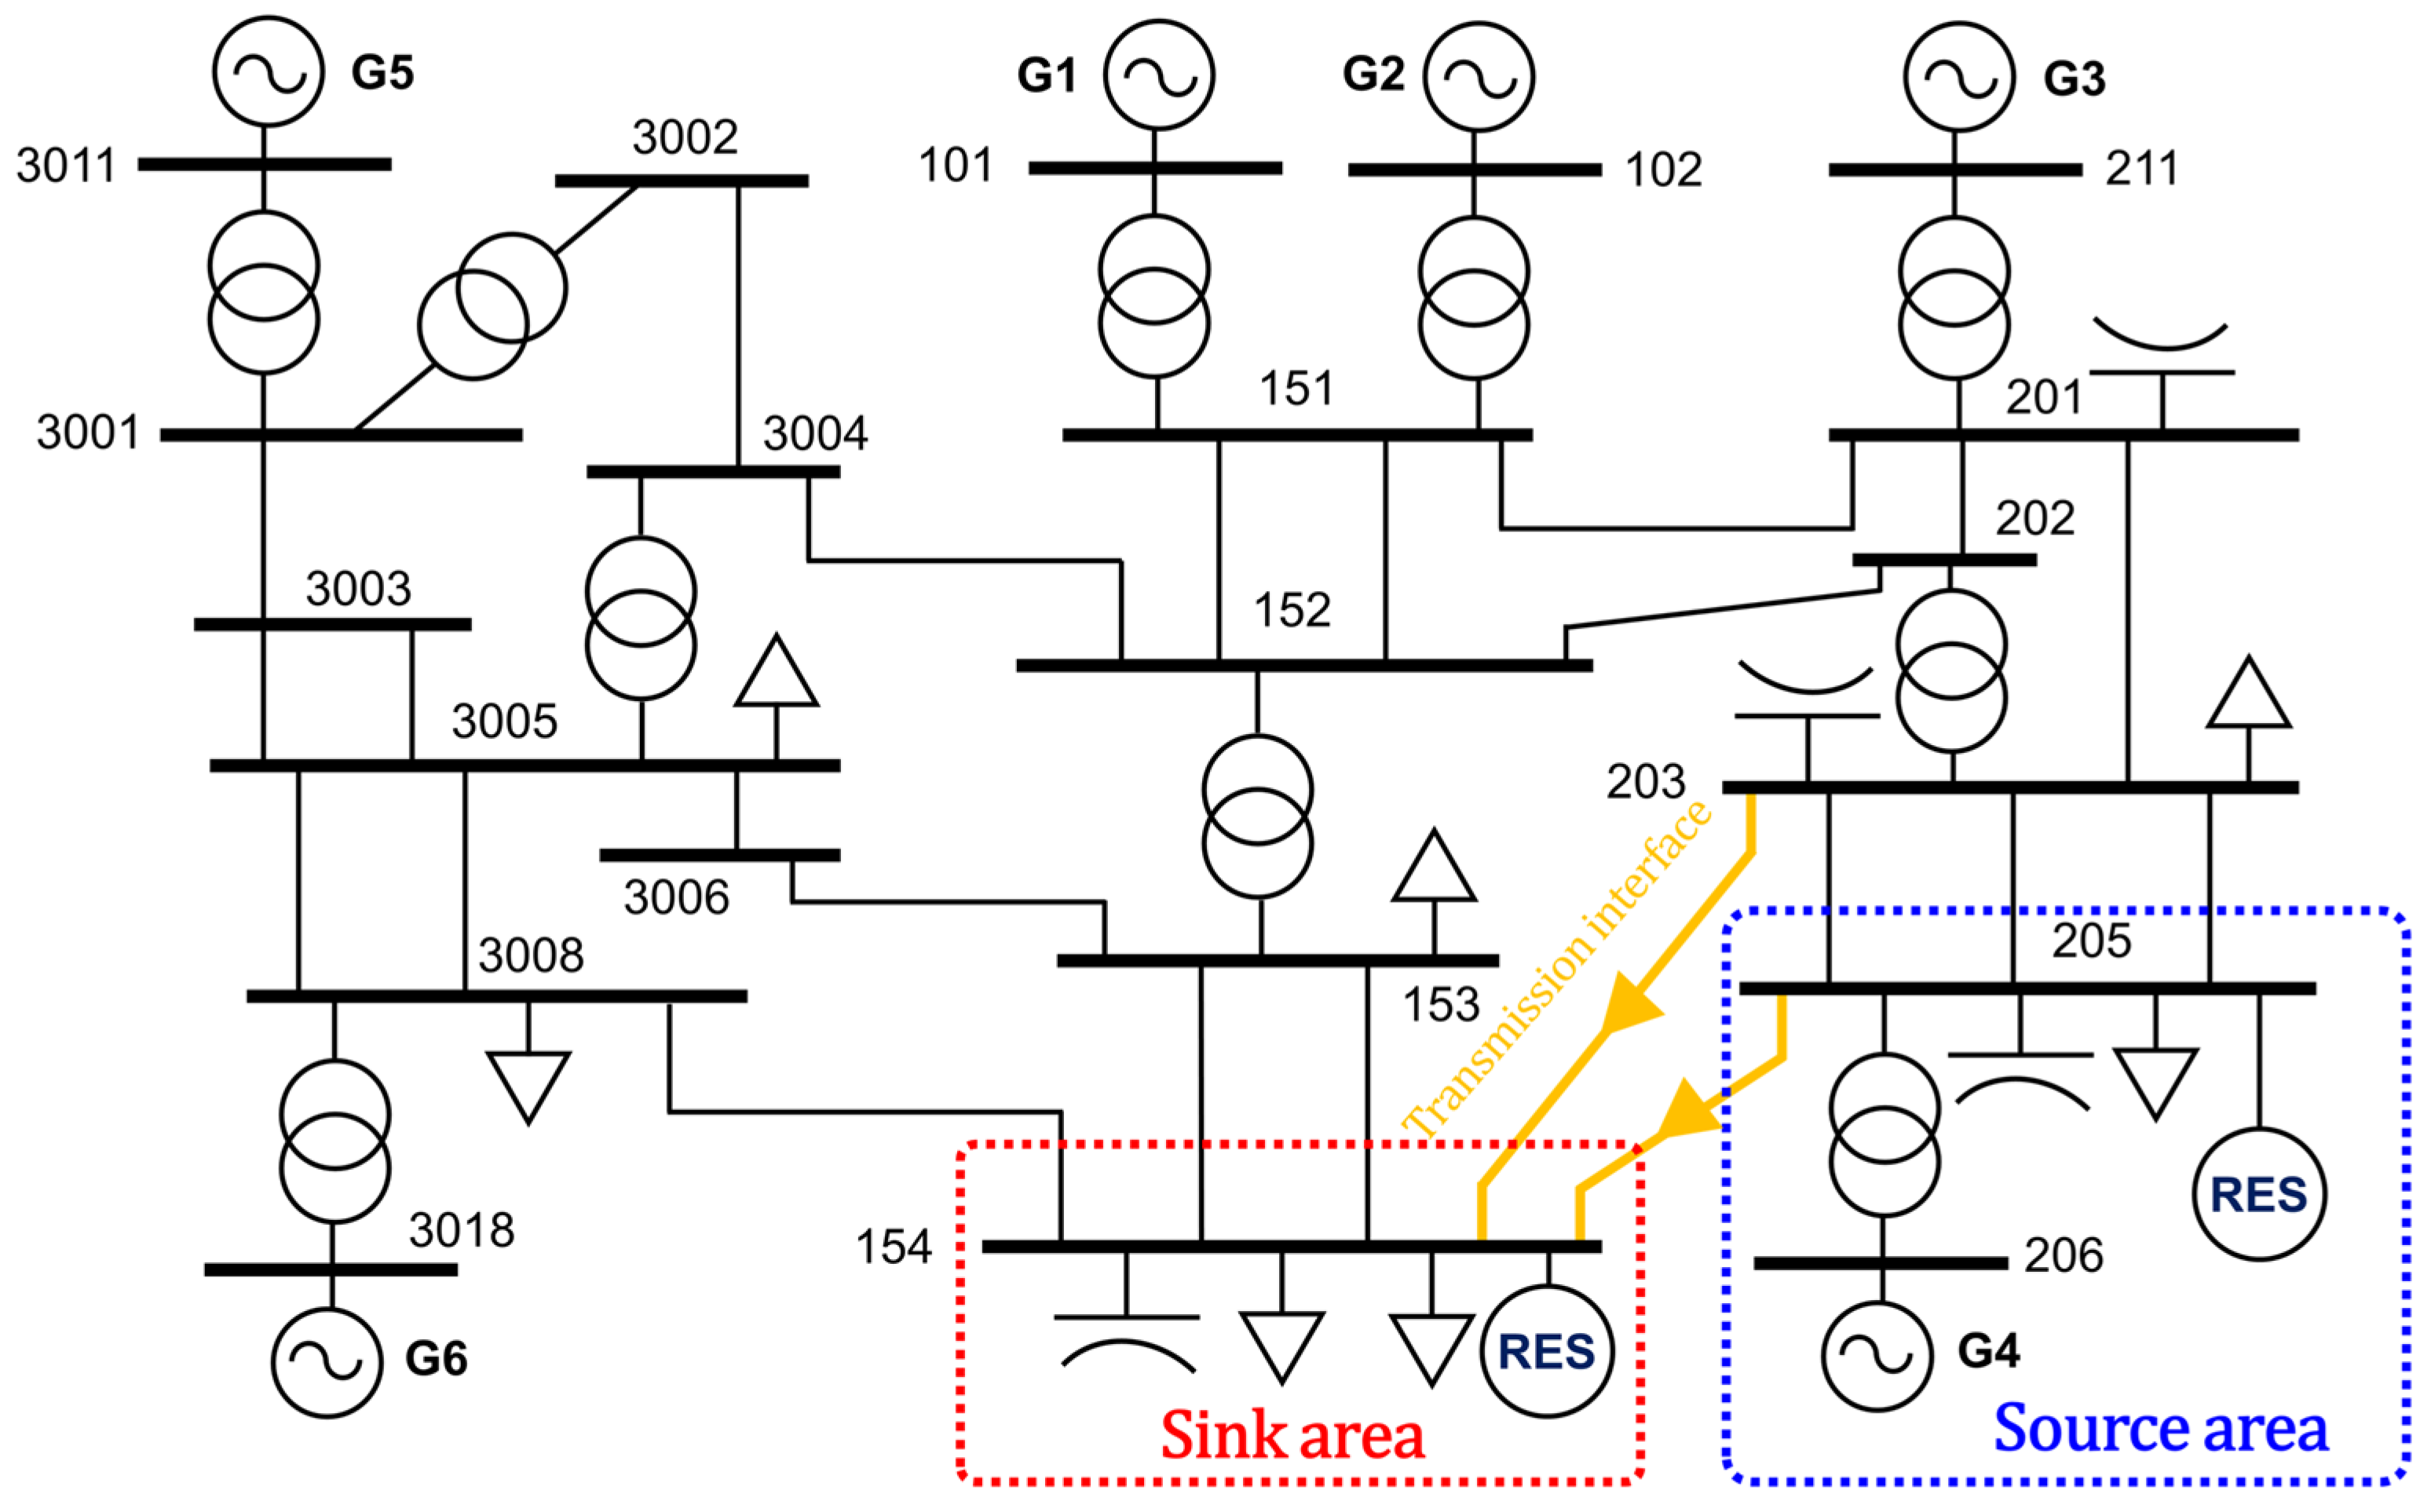
A modified version of the SAVNW test system provided in PSS/E 33 was used to examine the effect of sink-area RES tripping on the voltage stability of the transmission interface [29]. Simulations were performed in PSS/E 33.12.2. Figure 5 shows the one-line diagram of the modified system. The area around Bus 206, where the largest generator G4 (1000 MVA) is located, was defined as the source area. Bus 154 was defined as the sink area because it represents a load-dominant area without local conventional generation. The target transmission interface was defined by the 230-kV transmission lines between Bus 203 and Bus 154 and between Bus 205 and Bus 154. In this configuration, Bus 203 and Bus 205 are the sending-end buses, and Bus 154 is the receiving-end bus. To make the source-area and sink-area characteristics of the study system more distinct, the impedances of the lines between Bus 203 and Bus 205 and between Bus 154 and Bus 205 were increased by factors of 1.3 and 1.2, respectively. With this modification, the transfer characteristic through the transmission interface becomes more pronounced, and the effect of sink-area RES tripping on voltage stability can be examined more clearly. A 200-MVA RES was added at Bus 205 in the source area, and another 200-MVA RES was added at Bus 154 in the sink area. To maintain power balance after the RES integration, the load in the sink area was increased by an amount corresponding to the added RES capacity. As a result, the sink-area load level was increased, and the case was adjusted so that the analysis could focus on the voltage stability behavior of the study area and the transmission interface. The slack generator G5 is located at Bus 3011, which is electrically distant from the target transmission interface and has limited influence on the voltage stability characteristics of the study area. All RESs were modeled with the legacy ride-through characteristics described in Section 2. In the continuation power flow loading scenario of this case study, G4 was selected as the designated source-area generator.
In the static analysis, the RESs were modeled as inverter-based wind or solar photovoltaic plants represented by PV buses with reactive power limits determined from the ±0.95 power factor criterion. For the 200-MVA RES considered in this study, the corresponding reactive power limit at the 0.95 power factor boundary is approximately ±62.4 Mvar. Within these limits, the RES supplies or absorbs reactive power to maintain its terminal voltage. Under the operating condition considered in this paper, the sink-area RES at Bus 154 reached its upper reactive power limit, Q m a x . This is because the sink area was load-dominant and did not include a local voltage-controlled conventional generator.

5.2. Simulation Results

To examine the possibility of sink-area RES tripping and its effect on transmission interface voltage stability, two contingency scenarios were considered. In both scenarios, a three-phase fault was applied at the receiving-end bus, Bus 154, at 0.25 s and cleared at 0.35 s. At the fault clearing time, one of the two transmission interface lines was tripped. The voltage responses at Bus 154, Bus 203, and Bus 205 were first examined by time-domain simulation, and the voltage stability of the remaining transmission interface line was then evaluated by CPF. The voltage stability margins obtained from the two scenarios are summarized in Table 1.
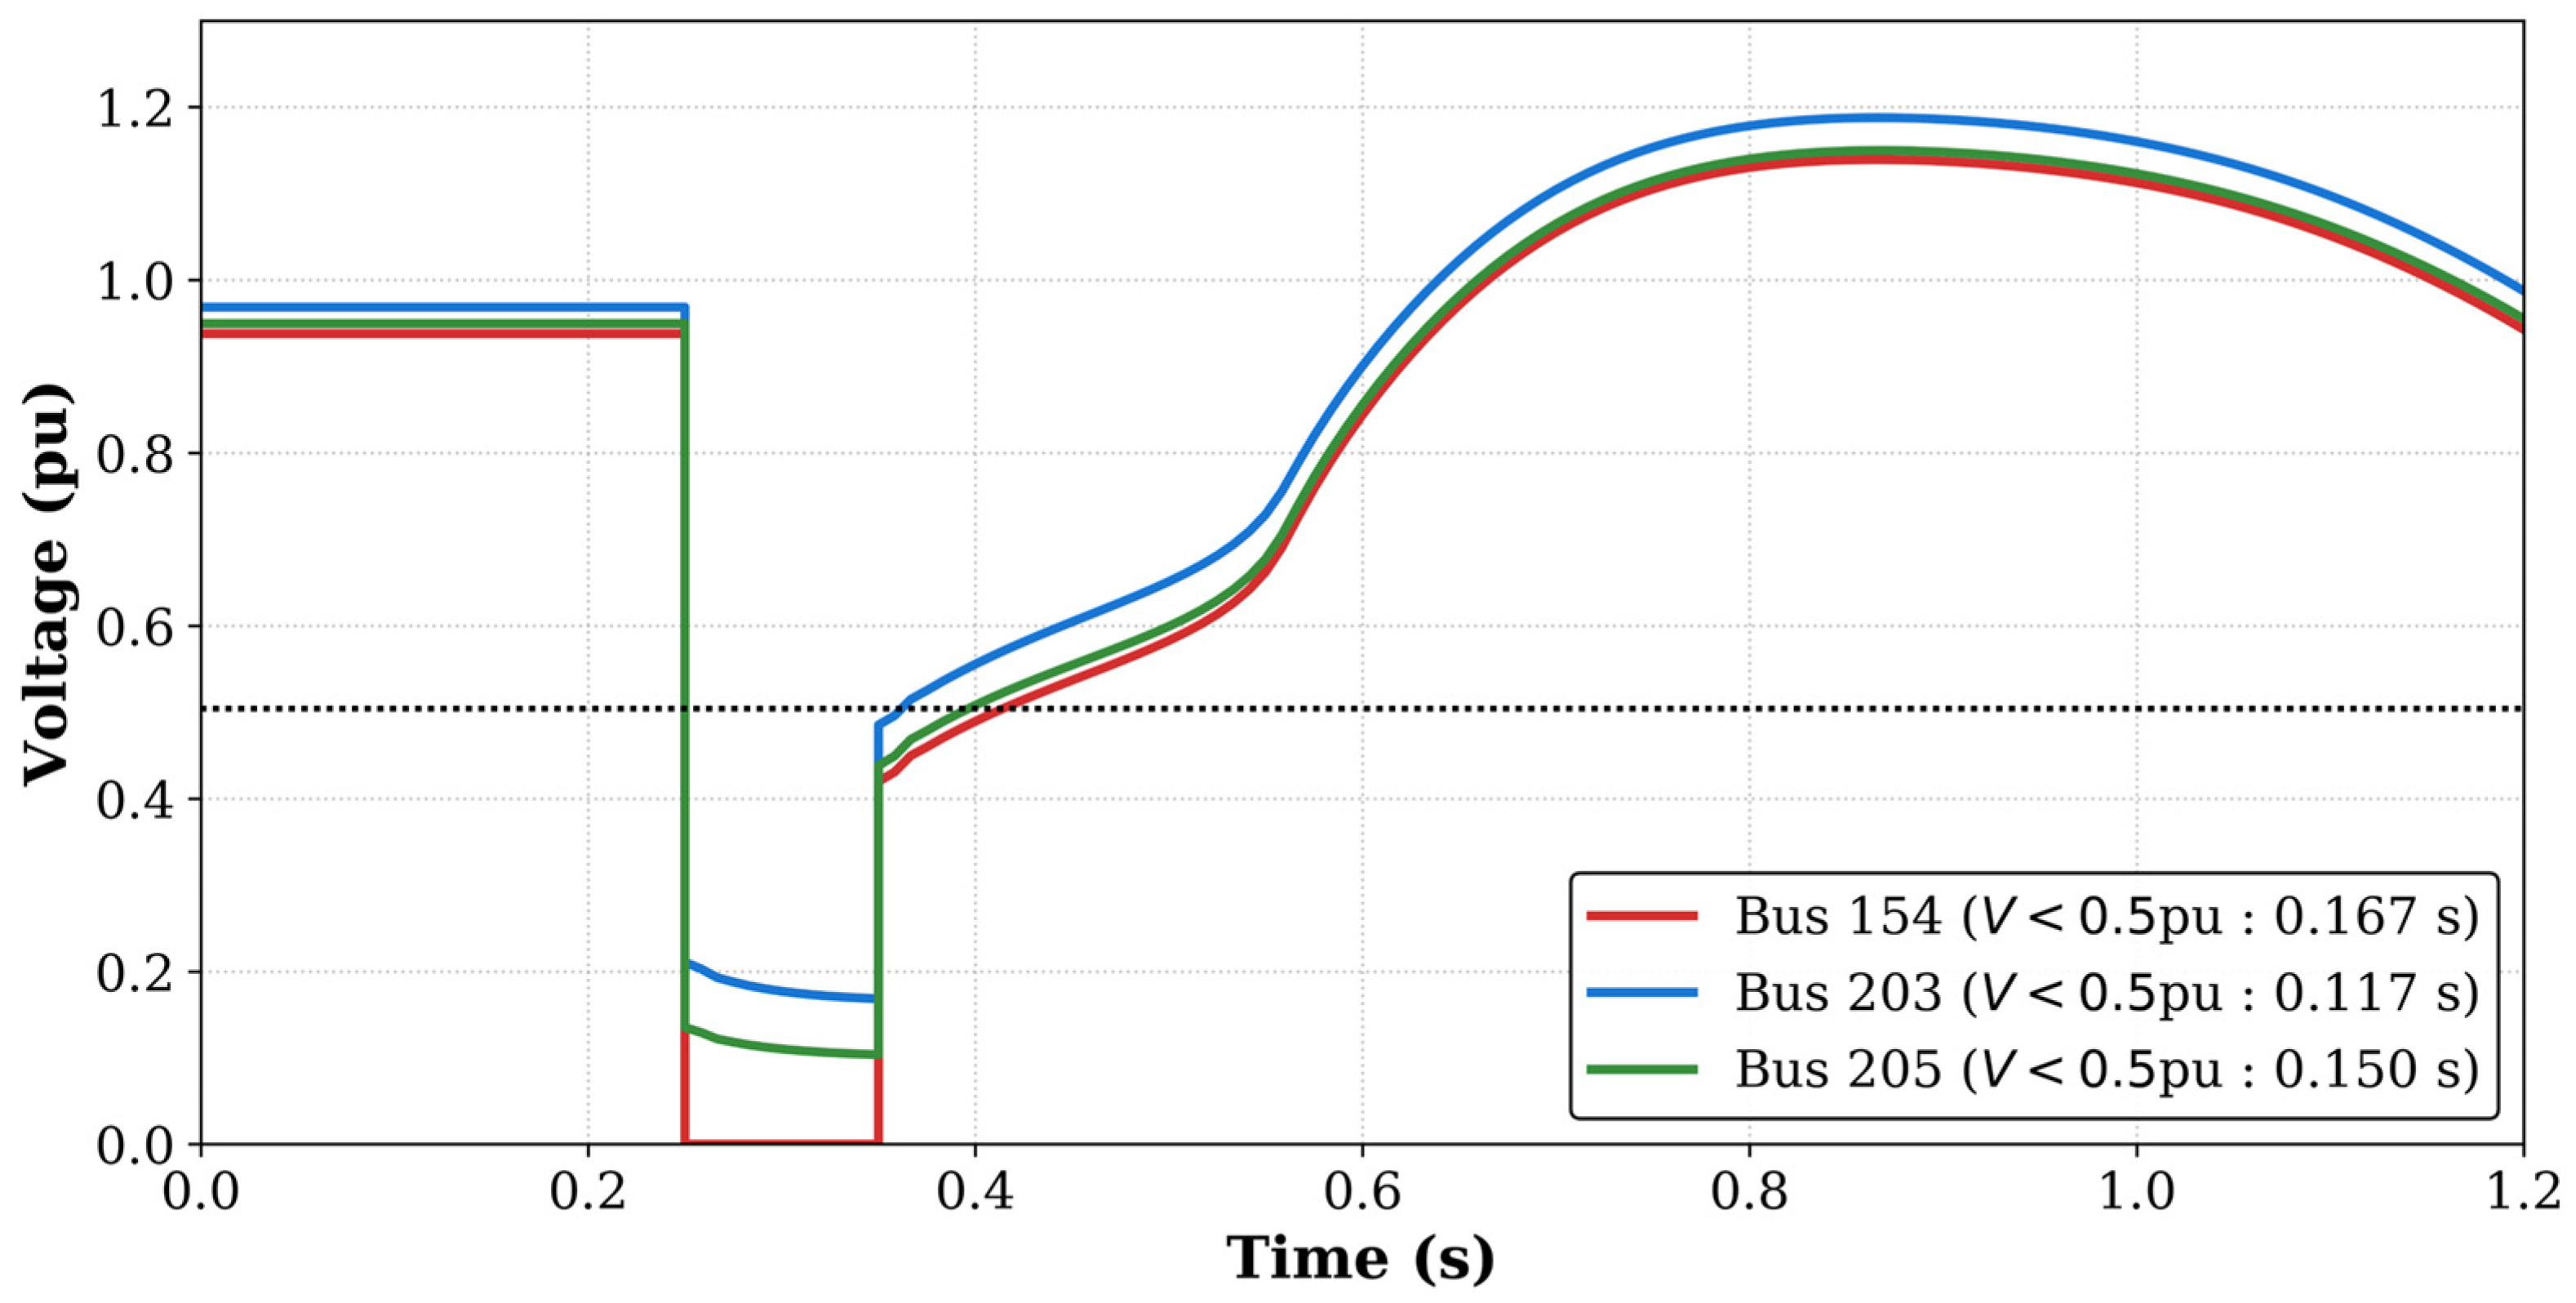
In the first scenario, a three-phase fault was applied at Bus 154 at 0.25 s and cleared at 0.35 s, and Line 154–203 was tripped at the fault clearing time. Figure 6 shows the corresponding voltage responses at Bus 154, Bus 203, and Bus 205. In this case, the voltage at Bus 154 remained below 0.5 pu for approximately 0.167 s, while the corresponding durations at Bus 203 and Bus 205 were approximately 0.117 s and 0.15 s, respectively. Since the voltage at Bus 154 remained below 0.5 pu for longer than 0.16 s, the sink-area RES connected at Bus 154 satisfies the legacy tripping condition described in Section 2. In contrast, the durations at Bus 203 and Bus 205 were shorter than the tripping threshold. Therefore, this scenario indicates that fault-induced tripping of the sink-area RES can occur when a fault at Bus 154 is followed by tripping of Line 154–203.
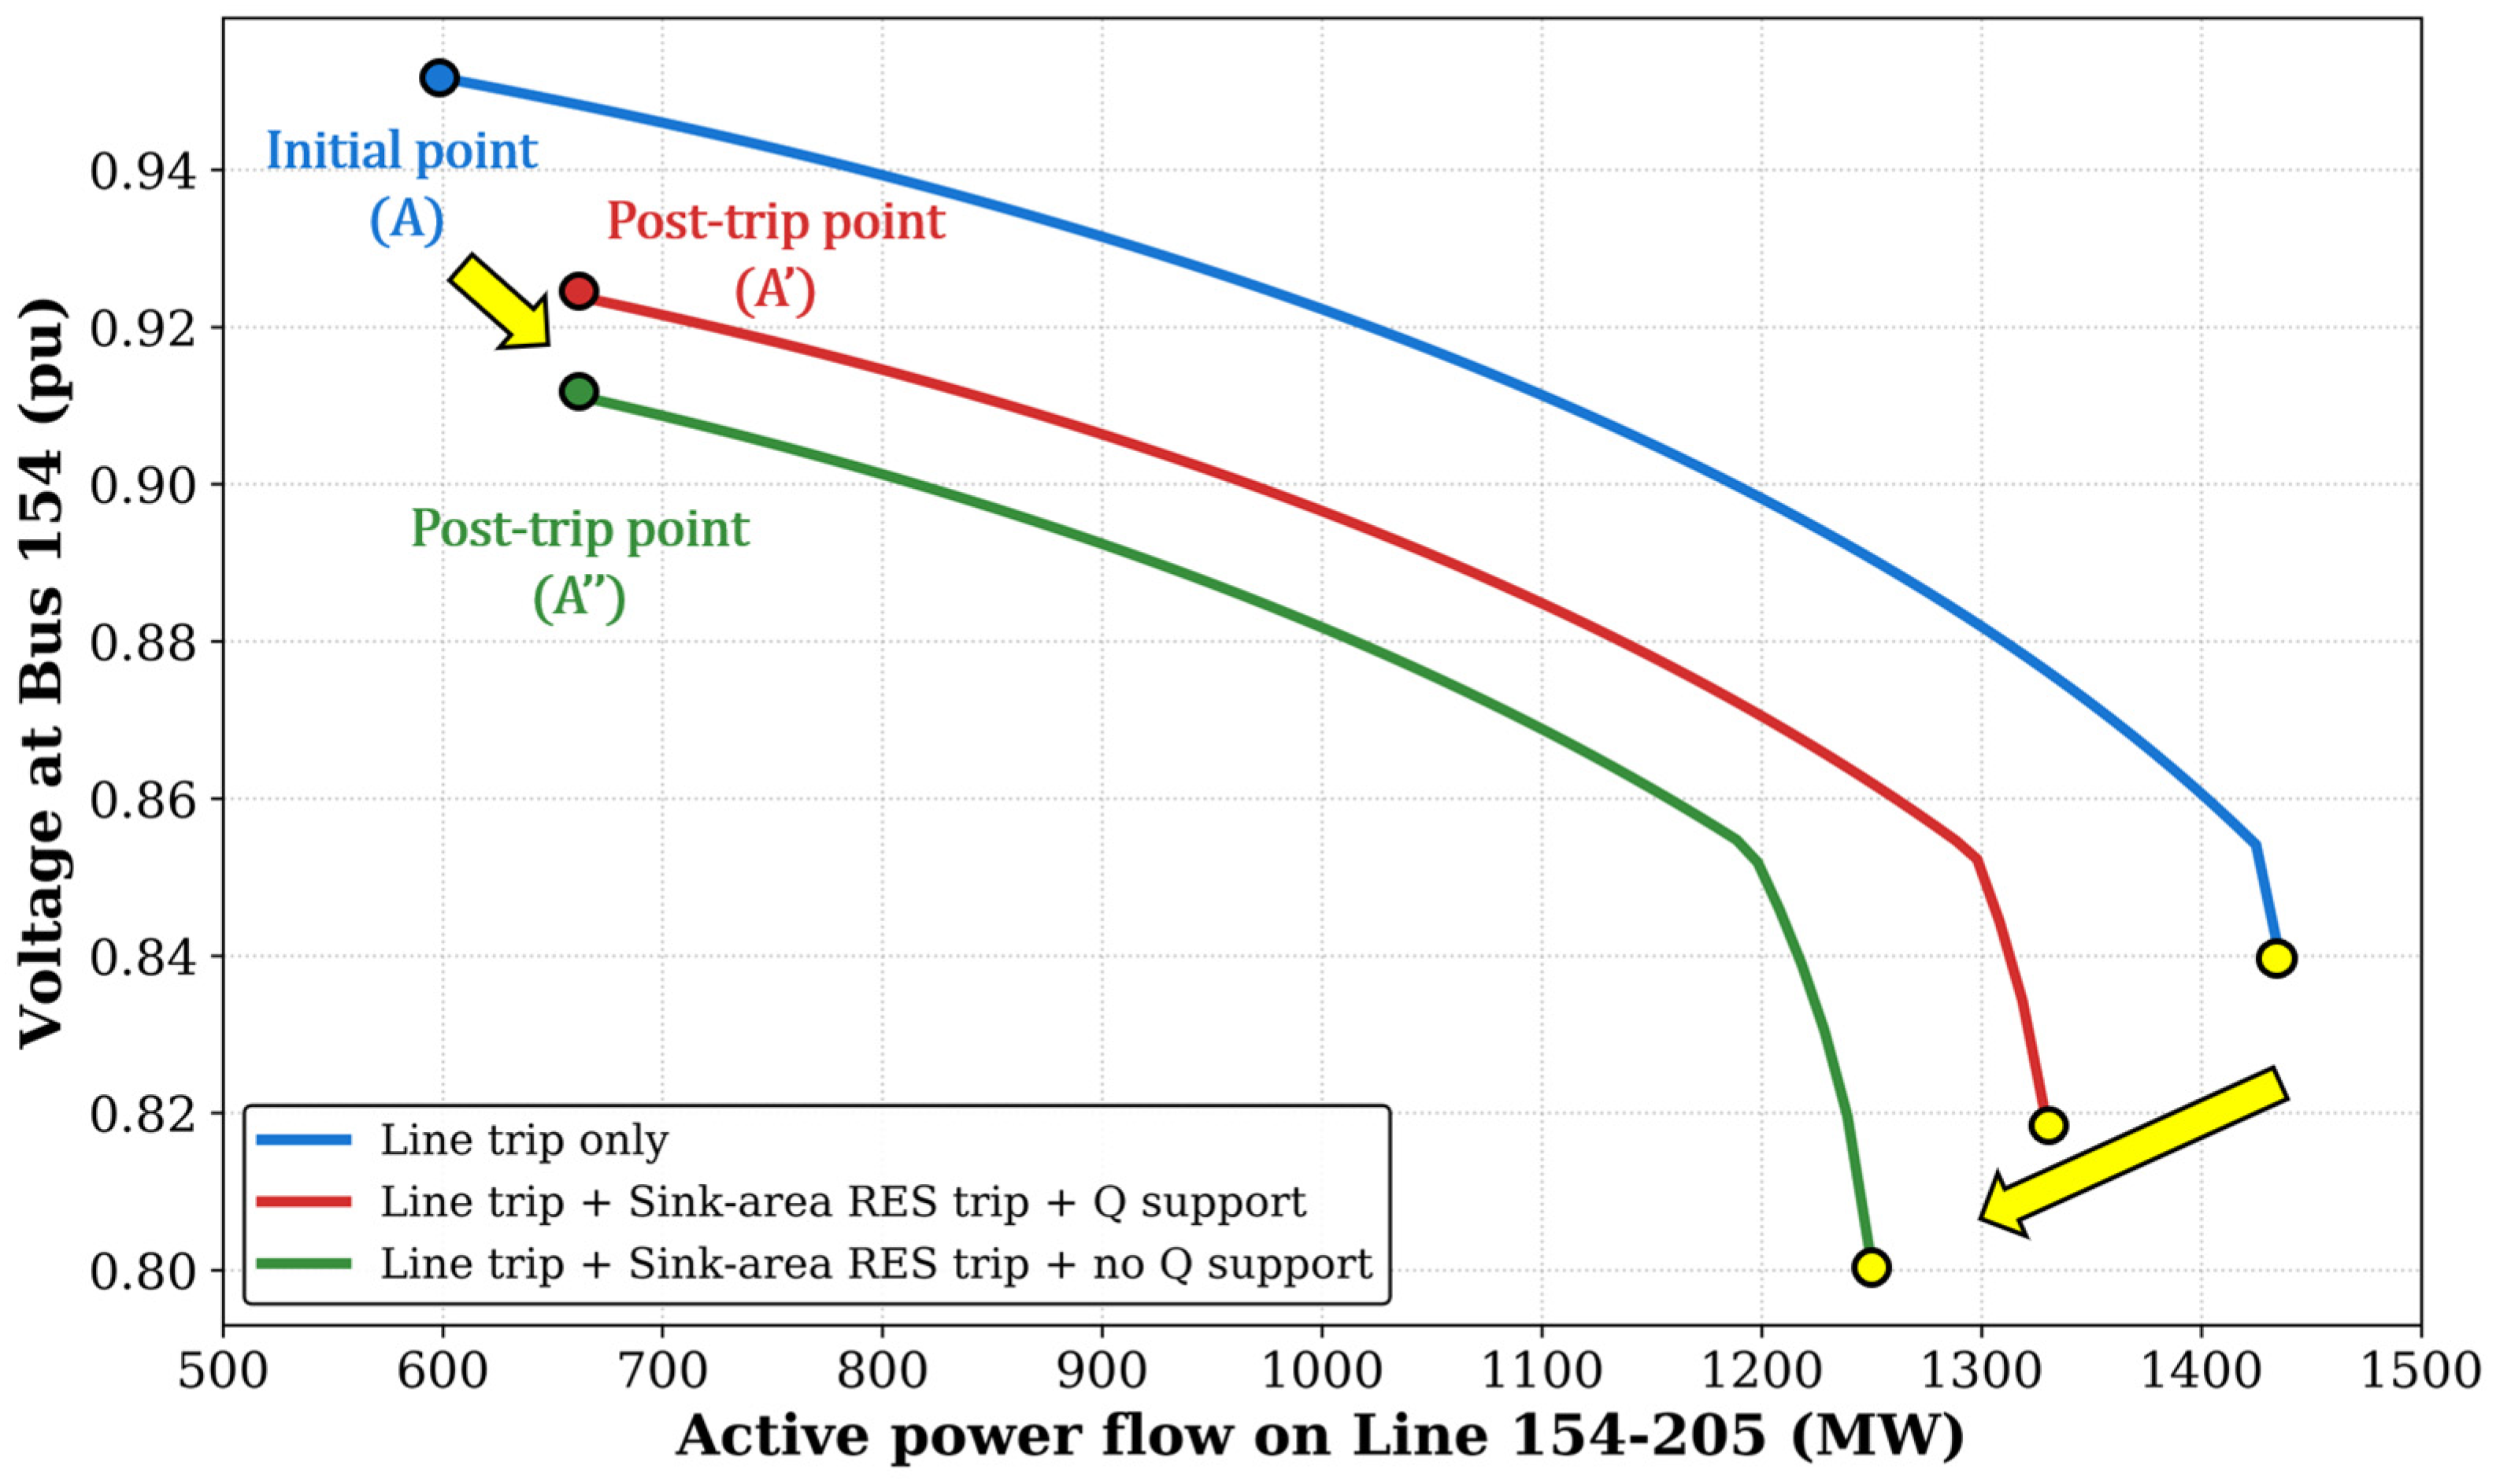
Based on this result, the voltage stability of the remaining transmission interface line, Line 154–205, was evaluated by CPF. Figure 7 shows the corresponding P–V curves for the line trip only case, the case with sink-area RES tripping and reactive power support, and the case with sink-area RES tripping without reactive power support. The results show that sink-area RES tripping shifts the post-fault operating point to the right. In addition, when reactive power support is not available, the nose point moves further to the left. As a result, the voltage stability margin is reduced from 837.901 MW in the line trip only case to 670.378 MW in the case with sink-area RES tripping and reactive power support, and is further reduced to 586.944 MW in the case with sink-area RES tripping without reactive power support.
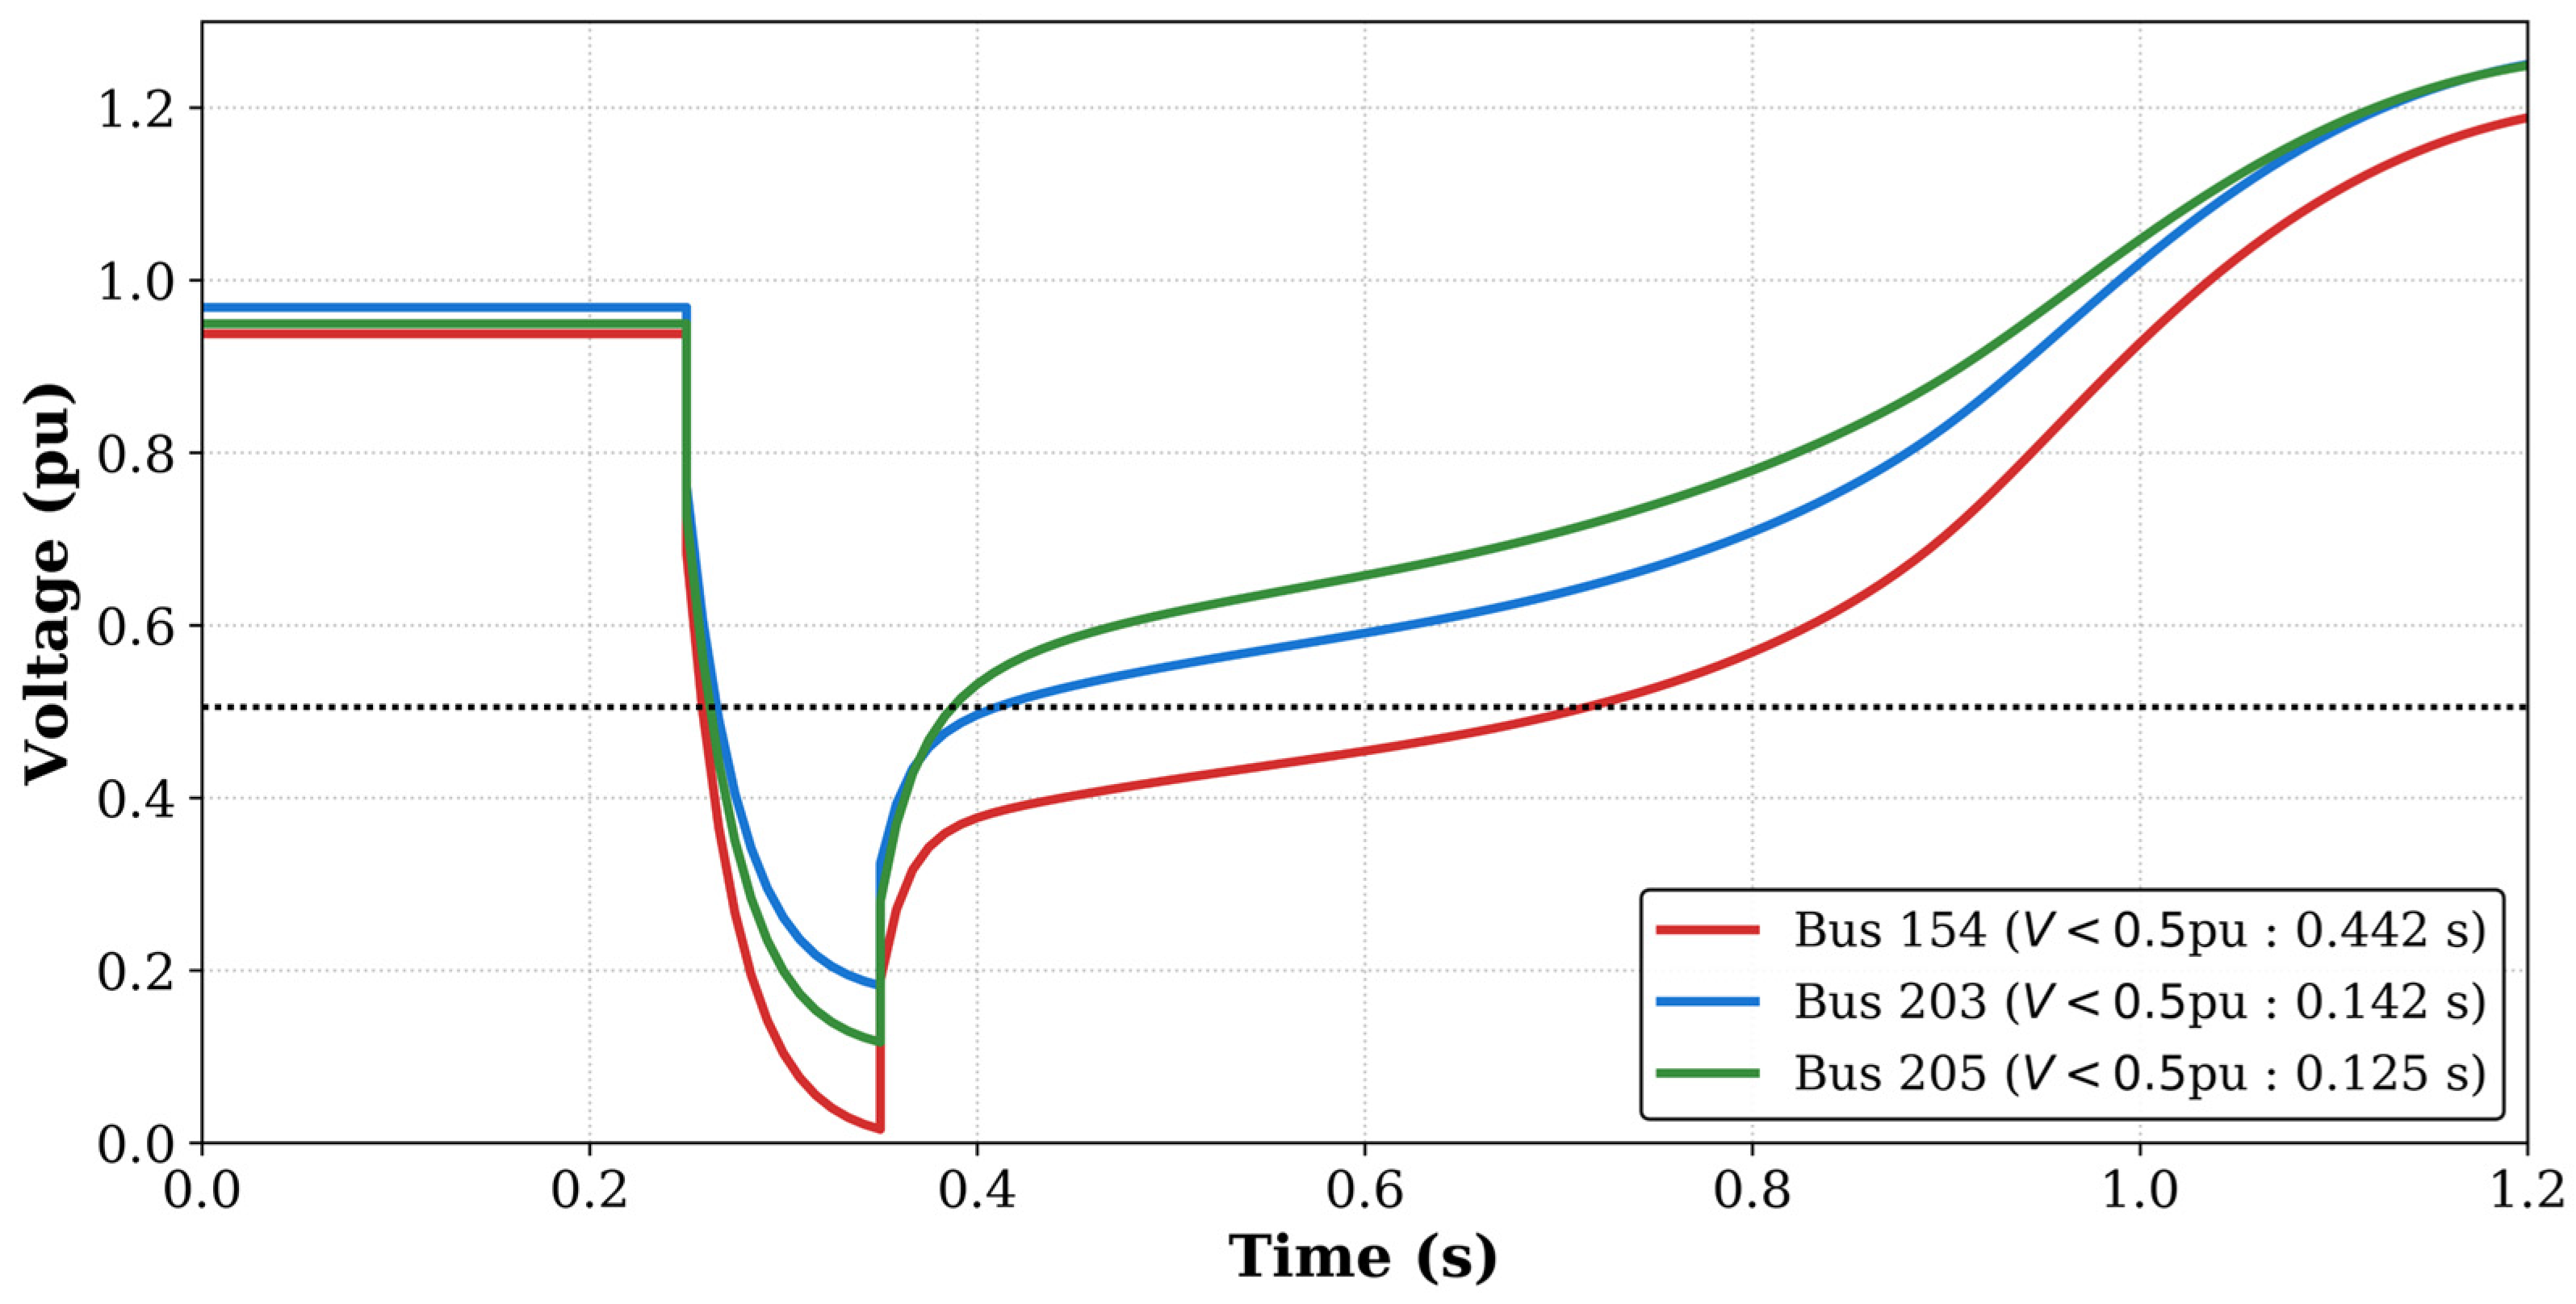
In the second scenario, a three-phase fault was again applied at Bus 154 at 0.25 s and cleared at 0.35 s, and Line 154–205 was tripped at the fault clearing time. Figure 8 shows the voltage responses for this case. The voltage at Bus 154 remained below 0.5 pu for approximately 0.442 s, whereas the corresponding durations at Bus 203 and Bus 205 were approximately 0.142 s and 0.125 s, respectively. Since the voltage at Bus 154 again remained below 0.5 pu for longer than 0.16 s, the sink-area RES connected at Bus 154 also satisfies the legacy tripping condition in this scenario. The voltages at Bus 203 and Bus 205 remained below the threshold for shorter durations than the legacy tripping criterion. This result indicates that sink-area RES tripping can also occur when the fault at Bus 154 is followed by tripping of Line 154–205.
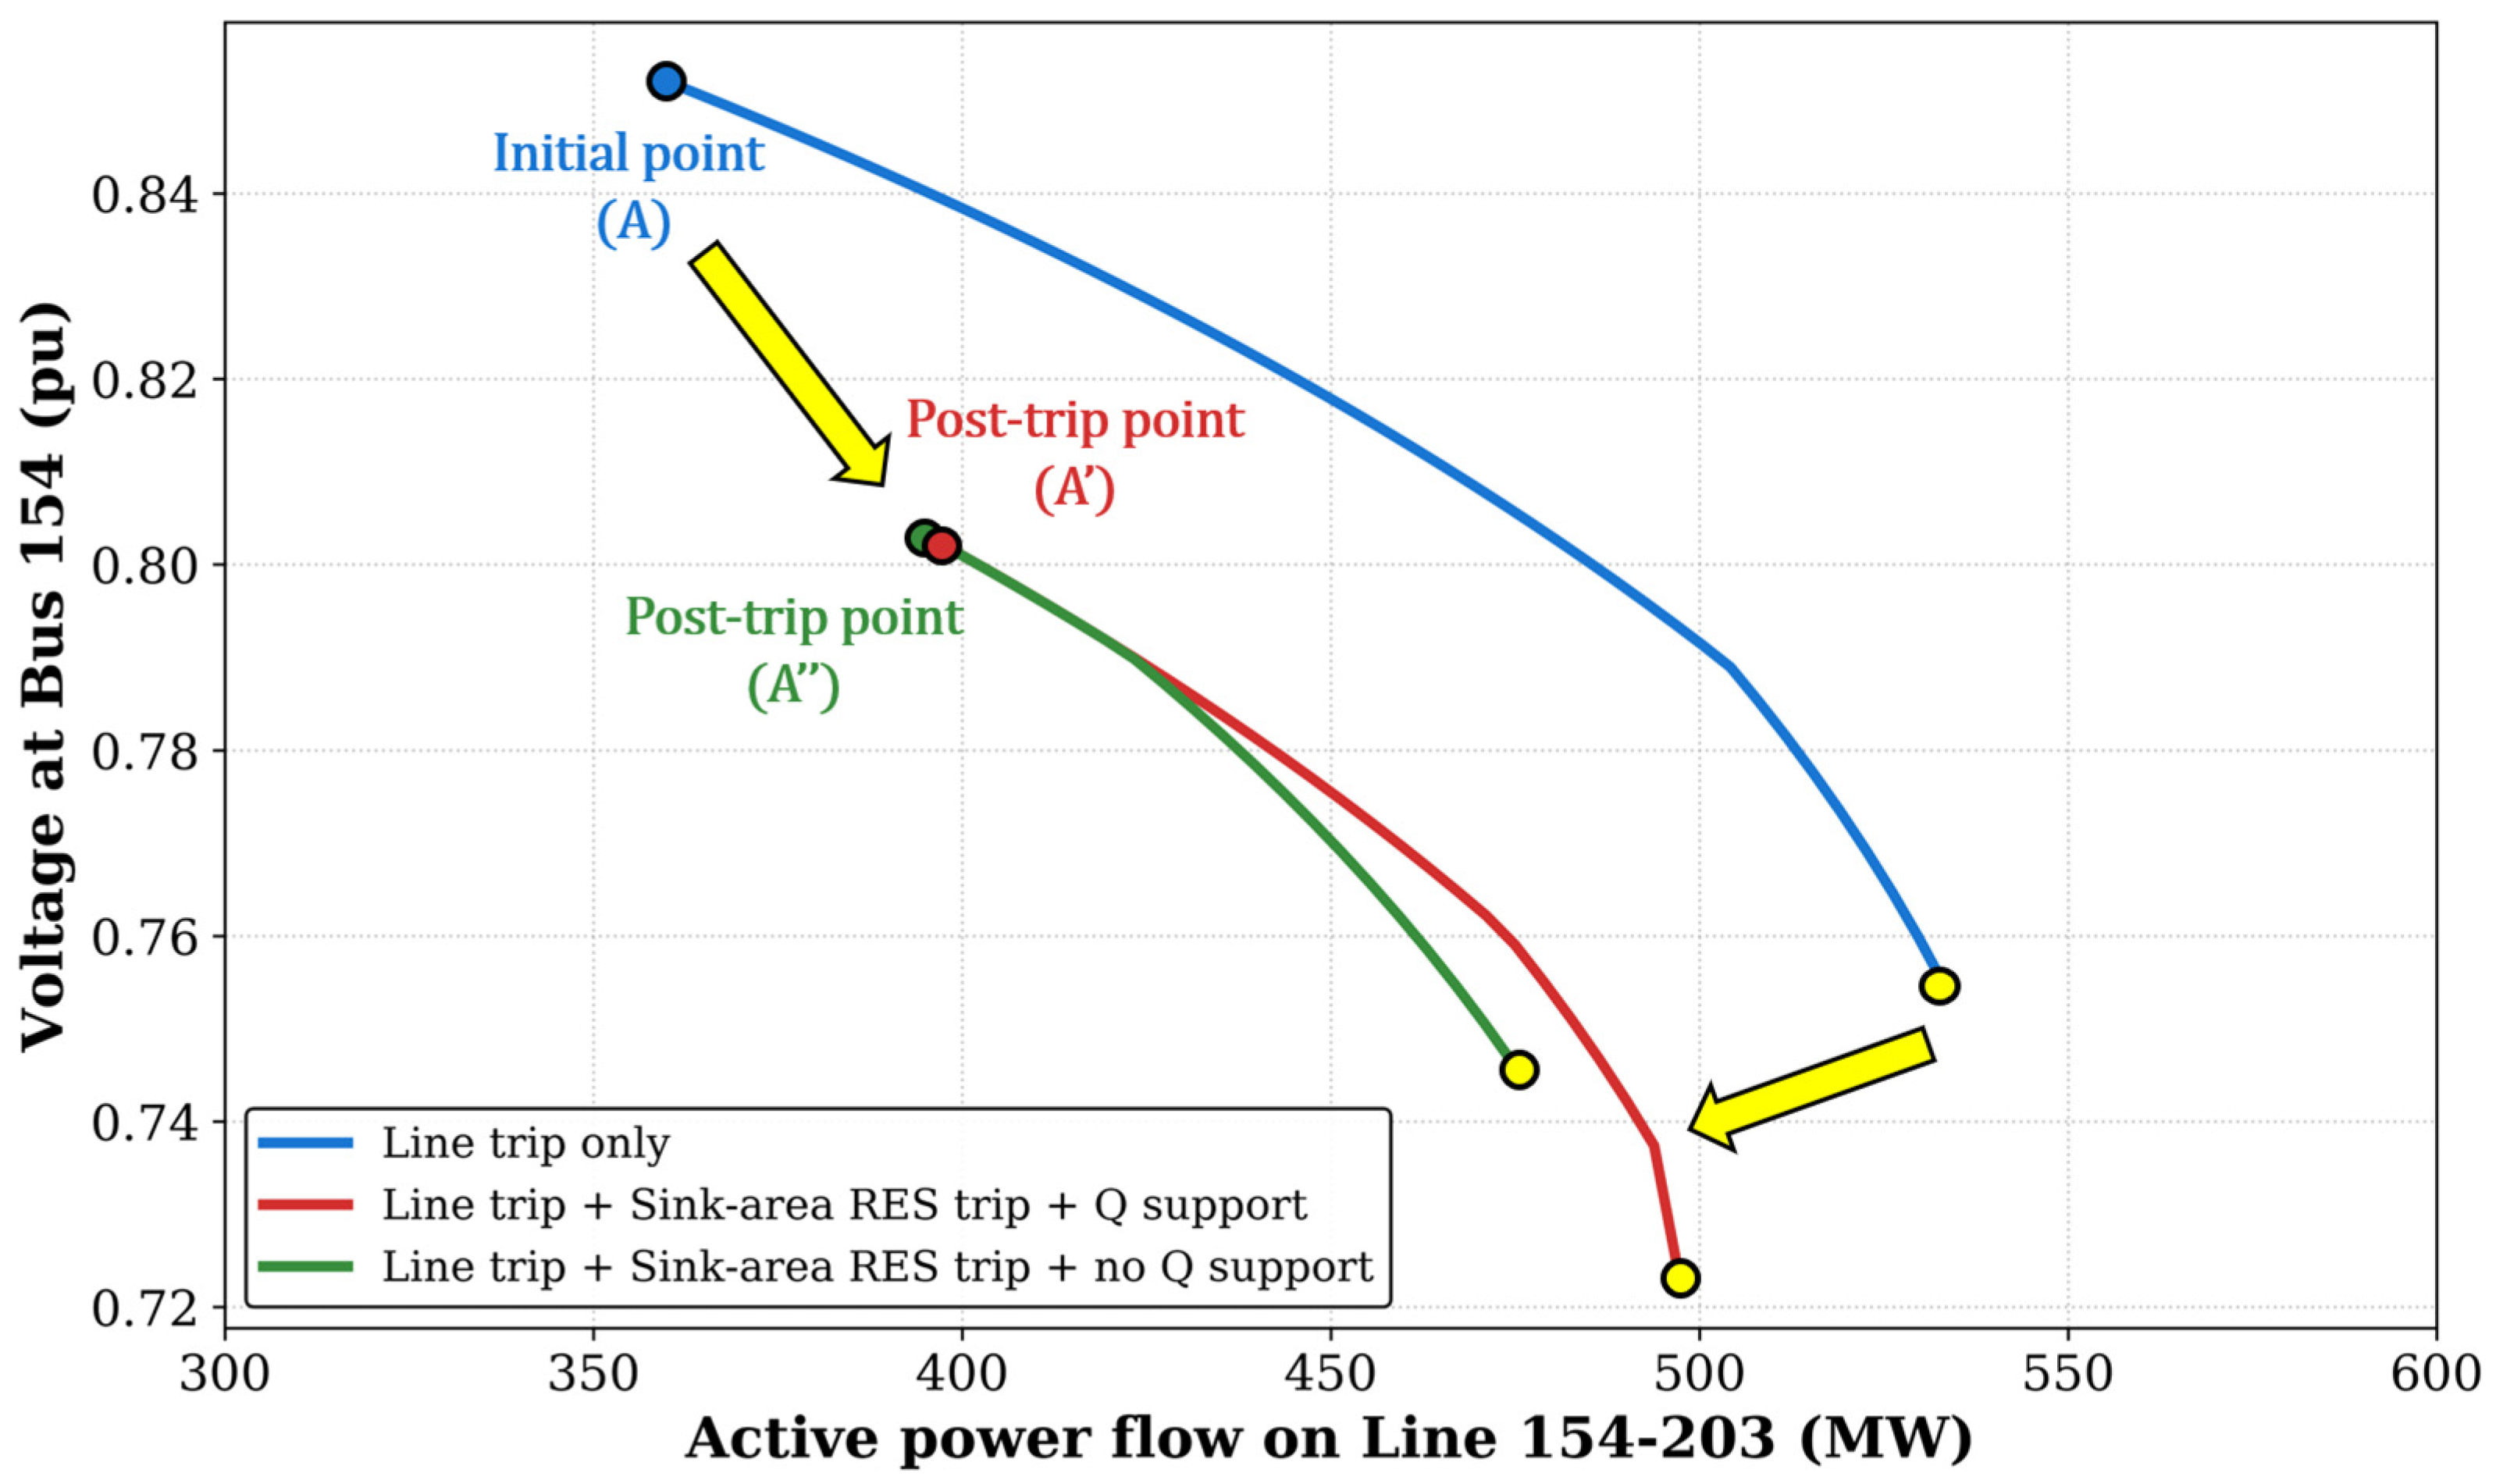
The voltage stability of the remaining transmission interface line, Line 154–203, was then evaluated by CPF, and the resulting P–V curves are shown in Figure 9. As in the first scenario, sink-area RES tripping moves the post-fault operating point toward the nose point. In addition, the case without reactive power support gives the smallest margin because the nose point is shifted further to the left. The voltage stability margin is 173.218 MW in the line trip only case, 102.074 MW in the case with sink-area RES tripping and reactive power support, and 79.643 MW in the case with sink-area RES tripping without reactive power support.
As summarized in Table 1, the voltage stability margin is reduced in both contingencies when sink-area RES tripping is considered, and the smallest margin is obtained when reactive power support is not available. The reduction is particularly large in the Line 154–205 trip scenario. This is because tripping Line 154–205 disconnects the transmission interface line connected to the source-area side where the largest generator, G4, is located. Under this condition, the power flow is rerouted through the remaining path, the transmission loss increases, and the voltage at the receiving-end bus, Bus 154, decreases further. For this reason, the margin determined for Line 154–203 in this scenario is much smaller than that obtained for Line 154–205 in the Line 154–203 trip scenario.
Overall, the case study shows that sink-area RES tripping changes the post-fault operating point of the transmission interface and reduces the voltage stability margin. The results also show that reactive power support from connected RES increases the transfer limit and leads to a larger voltage stability margin. Therefore, both sink-area RES tripping and reactive power support should be considered in the voltage stability assessment of the transmission interface.

6. Conclusions

This paper examined the effect of fault-induced tripping of sink-area RES on the voltage stability of a transmission interface. The effect of sink-area RES tripping was analyzed from two viewpoints. First, the loss of sink-area active power injection shifts the post-fault operating point toward the nose point on the P–V curve and reduces the voltage stability margin. Second, reactive power support from connected RES increases the transfer limit and results in a larger voltage stability margin.
The case study was carried out using a modified SAVNW test system. In both contingency scenarios, a three-phase fault at Bus 154 followed by tripping of Line 154–203 or Line 154–205 caused the voltage at Bus 154 to remain below 0.5 pu for longer than 0.16 s. This indicates that fault-induced tripping of the sink-area RES connected at Bus 154 can occur under the legacy ride-through criterion. The CPF results showed that the voltage stability margin was reduced in both scenarios when sink-area RES tripping was considered, and the smallest margin was obtained when reactive power support was not available. The reduction was more severe in the Line 154–205 trip scenario because the power flow was rerouted through the remaining path, which increased transmission loss and lowered the voltage at Bus 154.
These results show that sink-area RES tripping changes the post-fault operating condition of the transmission interface and can reduce the voltage stability margin. They also show that reactive power support from connected RES increases the transfer limit and improves the resulting margin. Therefore, both sink-area RES tripping and reactive power support should be considered in voltage stability assessment of transmission interfaces with legacy RES.
The present case study was intentionally limited to a simple modified SAVNW system and two representative receiving-end fault scenarios in order to isolate this mechanism clearly. Broader variations in RES composition, operating conditions, and fault locations may be examined in future work.

Author Contributions

Conceptualization, H.S.; methodology, H.S.; software, H.S.; validation, H.S., S.L. (Seungryul Lee), S.M. and S.L. (Sangho Lee); formal analysis, H.S.; investigation, H.S.; writing—original draft preparation, H.S.; writing—review and editing, H.S., S.L. (Seungryul Lee), S.M. and S.L. (Sangho Lee). All authors have read and agreed to the published version of the manuscript.

Funding

This research was supported by Korea Electrotechnology Research Institute (KERI) Primary research program through the National Research Council of Science & Technology (NST) funded by the Ministry of Science and ICT (MSIT) (No. 26A01069).

Data Availability Statement

Data are contained within the article.

Conflicts of Interest

The authors declare no conflicts of interest.

References

  1. Hatziargyriou, N.; Milanovic, J.; Rahmann, C.; Ajjarapu, V.; Canizares, C.; Erlich, I.; Hill, D.; Hiskens, I.; Kamwa, I.; Pal, B.; et al. Definition and Classification of Power System Stability—Revisited and Extended. IEEE Trans. Power Syst. 2021, 36, 3271–3281. [Google Scholar] [CrossRef] [Scilit]
  2. Kundur, P.; Paserba, J.; Ajjarapu, V.; Andersson, G.; Bose, A.; Canizares, C.; Hatziargyriou, N.; Hill, D.; Stankovic, A.; Taylor, C.; et al. Definition and Classification of Power System Stability—IEEE/CIGRE Joint Task Force on Stability Terms and Definitions. IEEE Trans. Power Syst. 2004, 19, 1387–1401. [Google Scholar] [CrossRef] [Scilit]
  3. Milano, F.; Dörfler, F.; Hug, G.; Hill, D.J.; Verbič, G. Foundations and Challenges of Low-Inertia Systems (Invited Paper). In Proceedings of the Power Systems Computation Conference (PSCC 2018), Dublin, Ireland, 11–15 June 2018; pp. 37–61. [Google Scholar] [CrossRef] [Scilit]
  4. Gu, Y.; Green, T.C. Power System Stability with a High Penetration of Inverter-Based Resources. Proc. IEEE 2023, 111, 832–853. [Google Scholar] [CrossRef] [Scilit]
  5. Machowski, J.; Lubosny, Z.; Bialek, J.W.; Bumby, J.R. Power System Dynamics: Stability and Control, 3rd ed.; John Wiley & Sons: Hoboken, NJ, USA, 2020. [Google Scholar]
  6. Sauer, P.W.; Pai, M.A.; Chow, J.H. Power System Dynamics and Stability: With Synchrophasor Measurement and Power System Toolbox, 2nd ed.; Wiley-IEEE Press: Hoboken, NJ, USA, 2017. [Google Scholar] [CrossRef] [Scilit]
  7. Shin, H.; Jung, J.; Oh, S.; Hur, K.; Iba, K.; Lee, B. Evaluating the Influence of Momentary Cessation Mode in Inverter-Based Distributed Generators on Power System Transient Stability. IEEE Trans. Power Syst. 2020, 35, 1618–1626. [Google Scholar] [CrossRef] [Scilit]
  8. Shin, H.; Jung, J.; Lee, B. Determining the Capacity Limit of Inverter-Based Distributed Generators in High-Generation Areas Considering Transient and Frequency Stability. IEEE Access 2020, 8, 34071–34079. [Google Scholar] [CrossRef] [Scilit]
  9. Kang, S.; Shin, H.; Jang, G.; Lee, B. Impact Analysis of Recovery Ramp Rate after Momentary Cessation in Inverter-Based Distributed Generators on Power System Transient Stability. IET Gener. Transm. Distrib. 2021, 15, 24–33. [Google Scholar] [CrossRef] [Scilit]
  10. Kang, S.; Shin, H.; Lee, B.; Lee, D.; Jang, G. Examination of Fast Frequency Response Capacity Requirements Considering Frequency Ride-Through Capabilities in Distributed Generators with Legacy Inverters. Energy Rep. 2023, 9, 370–379. [Google Scholar] [CrossRef] [Scilit]
  11. NERC; WECC. 1200 MW Fault Induced Solar Photovoltaic Resource Interruption Disturbance Report: Southern California 8/16/2016 Event; North American Electric Reliability Corporation: Atlanta, GA, USA, 2017. [Google Scholar]
  12. NERC; WECC. 900 MW Fault Induced Solar Photovoltaic Resource Interruption Disturbance Report: Southern California 10/9/2017 Event; North American Electric Reliability Corporation: Atlanta, GA, USA, 2018. [Google Scholar]
  13. NERC. April and May 2018 Fault Induced Solar Photovoltaic Resource Interruption Disturbances Report; North American Electric Reliability Corporation: Atlanta, GA, USA, 2019. [Google Scholar]
  14. NERC. Odessa Disturbance: Texas Events: June 26, 2021 and May 9, 2021; North American Electric Reliability Corporation: Atlanta, GA, USA, 2022. [Google Scholar]
  15. Quint, R.; Bauer, R.; Mardhekar, M.; Iversen, K.; Paull, E.; Ashbaker, S.; Merlo, J.; Cummings, R. Inventory of Bulk Electric System Inverter-Based Resource Performance in North America. In Proceedings of the 2019 IEEE PES GTD Grand International Conference and Exposition Asia (GTD Asia), Bangkok, Thailand, 19–23 March 2019; pp. 51–56. [Google Scholar] [CrossRef] [Scilit]
  16. IEEE Std 1547-2003; IEEE Standard for Interconnecting Distributed Resources with Electric Power Systems. IEEE: New York, NY, USA, 2003. [CrossRef] [Scilit]
  17. IEEE Std 1547-2018; IEEE Standard for Interconnection and Interoperability of Distributed Energy Resources with Associated Electric Power Systems Interfaces. IEEE: New York, NY, USA, 2018. [CrossRef] [Scilit]
  18. Hosseinzadeh, N.; Aziz, A.; Mahmud, A.; Gargoom, A.; Rabbani, M. Voltage Stability of Power Systems with Renewable-Energy Inverter-Based Generators: A Review. Electronics 2021, 10, 115. [Google Scholar] [CrossRef] [Scilit]
  19. Liang, X.; Chai, H.; Ravishankar, J. Analytical Methods of Voltage Stability in Renewable Dominated Power Systems: A Review. Electricity 2022, 3, 75–107. [Google Scholar] [CrossRef] [Scilit]
  20. Malik, F.H.; Khan, M.W.; Rahman, T.U.; Ehtisham, M.; Faheem, M.; Haider, Z.M.; Lehtonen, M. A Comprehensive Review on Voltage Stability in Wind-Integrated Power Systems. Energies 2024, 17, 644. [Google Scholar] [CrossRef] [Scilit]
  21. Ajjarapu, V.; Christy, C. The Continuation Power Flow: A Tool for Steady State Voltage Stability Analysis. IEEE Trans. Power Syst. 1992, 7, 416–423. [Google Scholar] [CrossRef] [Scilit]
  22. Chiang, H.D.; Flueck, A.J.; Shah, K.S.; Balu, N. CPFLOW: A Practical Tool for Tracing Power System Steady-State Stationary Behavior Due to Load and Generation Variations. IEEE Trans. Power Syst. 1995, 10, 623–634. [Google Scholar] [CrossRef] [Scilit]
  23. Canizares, C.A.; Alvarado, F.L. Point of Collapse and Continuation Methods for Large AC/DC Systems. IEEE Trans. Power Syst. 1993, 8, 1–8. [Google Scholar] [CrossRef] [Scilit]
  24. Lee, B.; Song, H.; Kwon, S.H.; Jang, G.; Kim, J.H.; Ajjarapu, V. A Study on Determination of Interface Flow Limits in the KEPCO System Using Modified Continuation Power Flow (MCPF). IEEE Trans. Power Syst. 2002, 17, 557–564. [Google Scholar] [CrossRef]
  25. Van Cutsem, T.; Vournas, C. Voltage Stability of Electric Power Systems; Springer: Boston, MA, USA, 1998. [Google Scholar] [CrossRef] [Scilit]
  26. Vittal, E.; O’Malley, M.; Keane, A. A Steady-State Voltage Stability Analysis of Power Systems with High Penetrations of Wind. IEEE Trans. Power Syst. 2010, 25, 433–442. [Google Scholar] [CrossRef] [Scilit]
  27. Morison, K.; Gao, B.; Kundur, P. Voltage Stability Analysis Using Static and Dynamic Approaches. IEEE Trans. Power Syst. 1993, 8, 1159–1171. [Google Scholar] [CrossRef] [Scilit]
  28. Van Cutsem, T.; Vournas, C. Voltage Stability Analysis in Transient and Mid-Term Time Scales. IEEE Trans. Power Syst. 1996, 11, 146–154. [Google Scholar] [CrossRef] [Scilit]
  29. Siemens Industry, Inc.; Siemens Power Technologies International. PSS®E 33.10 Program Application Guide; Siemens Industry, Inc.: Schenectady, NY, USA, 2017; Volume 1. [Google Scholar]
Figure 1. Simplified two-bus equivalent model of source and sink areas.
Energies 19 02082 g001
Figure 2. Conceptual illustration of sink-area RES tripping caused by a receiving-end bus fault.
Energies 19 02082 g002
Figure 3. Rightward shift in the post-fault operating point and reduction in the voltage stability margin after sink-area RES tripping.
Energies 19 02082 g003
Figure 4. Effect of reactive power support from connected RES on the P–V curve.
Energies 19 02082 g004
Figure 5. Modified SAVNW test system.
Energies 19 02082 g005
Figure 6. Voltage responses at the buses for a fault at Bus 154 followed by tripping of Line 154–203.
Energies 19 02082 g006
Figure 7. P–V curves of Line 154–205 for the three post-fault cases.
Energies 19 02082 g007
Figure 8. Voltage responses at the buses for a fault at Bus 154 followed by tripping of Line 154–205.
Energies 19 02082 g008
Figure 9. P–V curves of Line 154–203 for the three post-fault cases.
Energies 19 02082 g009
Table 1. Voltage stability margins under the two transmission interface contingency scenarios.
ContingencyMonitored LineScenarioMargin (MW)
Line 154–203 trip
+ Bus 154 fault
Line 154–205Line trip only837.901
Line trip + Sink-area RES trip + Q support670.378
Line trip + Sink-area RES trip + no Q support586.944
Line 154–205 trip
+ Bus 154 fault
Line 154–203Line trip only173.218
Line trip + Sink-area RES trip + Q support102.074
Line trip + Sink-area RES trip + no Q support79.643
Disclaimer/Publisher’s Note: The statements, opinions and data contained in all publications are solely those of the individual author(s) and contributor(s) and not of MDPI and/or the editor(s). MDPI and/or the editor(s) disclaim responsibility for any injury to people or property resulting from any ideas, methods, instructions or products referred to in the content.