Article

Effect of Isopropanol–Butanol–Ethanol (IBE) Direct Injection Strategy on Combustion and Emission Characteristics of a Gasoline Port Injection SI Dual-Fuel Engine

1
National Key Laboratory of Automotive Chassis Integration and Bionics, Jilin University, Changchun 130022, China
2
College of Automotive Engineering, Jilin University, Changchun 130022, China
*
Author to whom correspondence should be addressed.
Energies 2026, 19(9), 2081; https://doi.org/10.3390/en19092081
Submission received: 30 March 2026 / Revised: 21 April 2026 / Accepted: 22 April 2026 / Published: 25 April 2026

Abstract

Under the dual-carbon goals, adopting renewable alternative fuels in transportation is crucial. Alcohol-based fuels, produced via biomass fermentation or green electricity-powered CO2 hydrogenation, offer benefits like renewability, engine compatibility, and long driving range. Bio-butanol, with an energy density close to gasoline, can power SI engines directly, but its high production costs due to low fermentation efficiency limit its viability. In contrast, IBE (a butanol fermentation intermediate) avoids costly separation steps, making it more competitive than pure butanol. Existing research on IBE in spark ignition engines mainly focuses on fixed-ratio IBE-gasoline blends, restricting real-time fuel adjustment. Building on prior findings that IBE outperforms ABE and butanol, this study examines the combustion and emission characteristics of a gasoline port injection + IBE direct injection engine under varying direct injection timings, IBE ratios, and excess air ratios. Research indicates that early direct injection timings with pure IBE provide optimal performance at stoichiometric conditions. As the excess air ratio rises, an 80% IBE direct injection ratio becomes more advantageous. IBE shows great promise as an alternative fuel, enhancing combustion performance and reducing gaseous and particulate emissions.

1. Introduction

With the increasingly serious energy and environmental problems in the world, the internal combustion engine industry is constantly facing the challenge of energy conservation and emission control [1,2]. As an important power device in the field of transportation, internal combustion engines will continue to occupy an important position for a long time in the future due to their high power density, mature infrastructure, and extensive application foundation [3]. Electric and hybrid vehicles provide a partial solution to the global carbon neutrality goal [4]. According to data statistics, hybrid vehicles powered by gasoline engines and electric motors accounted for 5% of new car sales in Europe in 2019 [5]. And many countries around the world have gradually introduced policies to promote the popularization of hybrid vehicles [6]. However, gasoline, as the main fuel for power, still contributes significantly to carbon emissions and greenhouse gas emissions [7]. Therefore, using clean alternative energy sources is an important path for internal combustion engines to address numerous challenges. Renewable fuels, as a kind of clean energy, are conducive to reducing the emissions of internal combustion engines. Thus, they have become the focus of current research.
As an efficient and practical clean fuel, hydrogen can improve fuel efficiency and greatly reduce exhaust emissions and concentrations, which have good development potential [8]. However, the biggest problem restricting the development of hydrogen is its transportation and storage costs [9]. As a potential alternative to high-carbon fuel, bio alcohol is compatible with existing internal combustion engines and does not require much modification [10,11]. The production of bio alcohols can be achieved by fermenting crops, algal organisms and cellulose [12]. Biomethanol is easy to extract and the cost is low [13]. Furthermore, the high oxygen concentration in methanol can help enhance engine thermal efficiency [14]. Biomethanol can be obtained from a variety of biomass raw materials [15]. However, methanol is highly corrosive to the engine [16]. And it is easy to form unconventional pollutant emissions [17]. The energy density of bioethanol is greater than that of hydrogen, making it a good gasoline additive or substitute [18]. Bioethanol can be directly applied to existing gas stations at a low cost. However, due to the poor cold start performance of bioethanol and high temperature requirements, it is not suitable for winter and cold regions [19]. In addition, acetic acid is produced during the combustion of ethanol, which has a corrosive effect on the internal combustion engine and is not conducive to maintenance [20]. Alcohol fuels have the characteristic of easy corrosion. For ethanol gasoline blended fuels, E60 fuel (60% ethanol to 40% gasoline ratio) exhibits significant corrosiveness to metal materials [21]. Additives such as diethylenetriamine have shown certain potential in inhibiting the corrosion of alcohol fuels [22]. The addition of diethylenetriamine and triethylenediamine can inhibit the passivation of steel by ethanol–gasoline mixed fuel [23]. Therefore, ethanol and gasoline are still mixed as engine fuels [24,25]. Butanol has relatively higher boiling and flash points than other lower-carbon alcohols. It can also be regarded as an alternative fuel (with a calorific value higher than biomethane and bioethane) [26,27]. Butanol can be generated via either biological fermentation or chemical synthesis. Although the biological fermentation approach avoids fossil fuel dependency, the cost of butanol fuel limits the extent of its popularization [28,29].
In traditional butanol fermentation, the production technology of intermediate acetone–butanol–ethanol (ABE) has been widely examined. It usually contains acetone, ethanol, and butanol in a volume ratio of 3:6:1 [30]. Advances in ABE fermentation technology now enable accurate control over the volume percentages of these three components in the bio-based solvent [31]. Modern technology, including environmental condition control and strain modification, can accurately regulate the ratio of acetone to butanol within a wide range to meet different industrial needs. Li, YQ et al. [32] studied the characteristics of an ABE gasoline hybrid SI engine, and the results show that ABE(361)30 performs well in terms of braking thermal efficiency and emissions compared to pure gasoline. Han, K. et al. [33] mixed ABE and diesel in different ratios found that the addition of ABE can improve ignition delay and reduce soot emissions. The volume mixing ratio at 30% ABE content enables the highest level of engine explosive performance and overall combustion rate. X. B. Duan et al. [34] examined how ABE-diesel blends influence combustion characteristics. The study found that the timing of fuel injection had a significant impact on the combustion behavior of a diesel engine operating on ABE–diesel fuel. The blending of ABE fuel provides certain potential in the development of low-carbon and clean engines.
However, further application of ABE may be limited by the corrosiveness of acetone in the mixture. Fortunately, ABE fermentation can be converted into isopropanol–butanol–ethanol (IBE) [35]. By converting ABE to IBE, a more stable alternative fuel can be obtained, reducing the corrosiveness of acetone to engines [36]. As an intermediate product of the fermentation process, IBE consists of isopropanol, butanol and ethanol in the typical volumes of 3:6:1 [37]. Compared to ABE, IBE blends offer greater advantages for fuel use because isopropanol possesses superior properties relative to acetone, including reduced corrosiveness toward engine parts, higher energy density, and a greater octane rating [38]. Currently, several studies have explored the use of IBE in both compression ignition and spark ignition engines.
In the field of compression ignition engines, IBE is commonly used with diesel using dual-fuel mode. Hu et al. [39] investigated the available chemical reaction mechanism based on an engine fueled by an IBE/diesel blend. Validation was performed for ignition delay under relevant engine conditions. G. Li et al. [40] found that a dual injection strategy can reduce the detonation combustion and knock intensity of both IBE and diesel hybrid fuel engines. Double injection can improve engine performance and economy, resulting in better air–fuel mixing. G. Li et al. [41] studied the soot formation process of mixing IBE/diesel mixtures at different ratios. When IBE is directly mixed with diesel, it can reduce soot emissions. T. H. Lee et al. [42] found that the IBE–diesel blend was able to maintain similar characteristics to pure diesel while reducing soot. At lower temperature and oxygen concentration, the IBE–diesel mixture exhibited higher ignition delay. In addition, Meng et al. research results indicate that dilution strategies can effectively suppress the detonation intensity of high compression ratio IBE fuel ignition engines [43]. The adjustment of the injection strategy is equally important for the change in engine performance [44]. Ilçin et al. [45] found that blending IBE in diesel shows good effectiveness in reducing particulate matter emissions, but NOx emissions show a slight increase, while reducing the injection advance shows certain potential in lowering nitrogen oxide emissions. As for the application of IBE in the SI engine, IBE is commonly premixed with gasoline as the fuel. Y. Q. Li et al. [46] found that the braking thermal efficiency of the IBE10 is improved and the emissions of CO, UHC and NOx are reduced. This suggests that IBE may be more advantageous than ABE. Y. Q. Li et al. [47] found that compared with G100, IBE30 has higher potential for thermal efficiency and performance in reducing emissions. Thus, IBE may serve as a viable substitute for gasoline.
In fact, based on our earlier findings, using gasoline port injection along with alcohol direct injection offers advantages over the reverse configuration (alcohol port injection with gasoline direct injection), because this mode has high efficiency and low emissions according to our previous research. Therefore, our research group has studied the characteristics of gasoline port injection plus ABE, IBE or butanol direct injection [48]. The findings revealed that the gasoline/IBE configuration achieved a higher indicated mean effective pressure compared to the other two setups, with both ABE and IBE offering greater benefits than butanol. Accordingly, further investigation into the combustion and emission behavior of an IBE/gasoline dual-injection engine across various operating conditions is warranted.
In summary, IBE shows strong potential for SI engines. Nevertheless, research on its use in SI engines remains limited, and no study has yet investigated the combined injection mode of IBE and gasoline. This work examines the combustion and emission behavior of an SI engine operating with gasoline port injection and IBE direct injection, under varying IBE direct injection strategies and excess air ratios (λ), which can fill the gap in IBE/gasoline combined injection research.

2. Experimental System, Materials and Schemes

2.1. Engine and Test Equipment

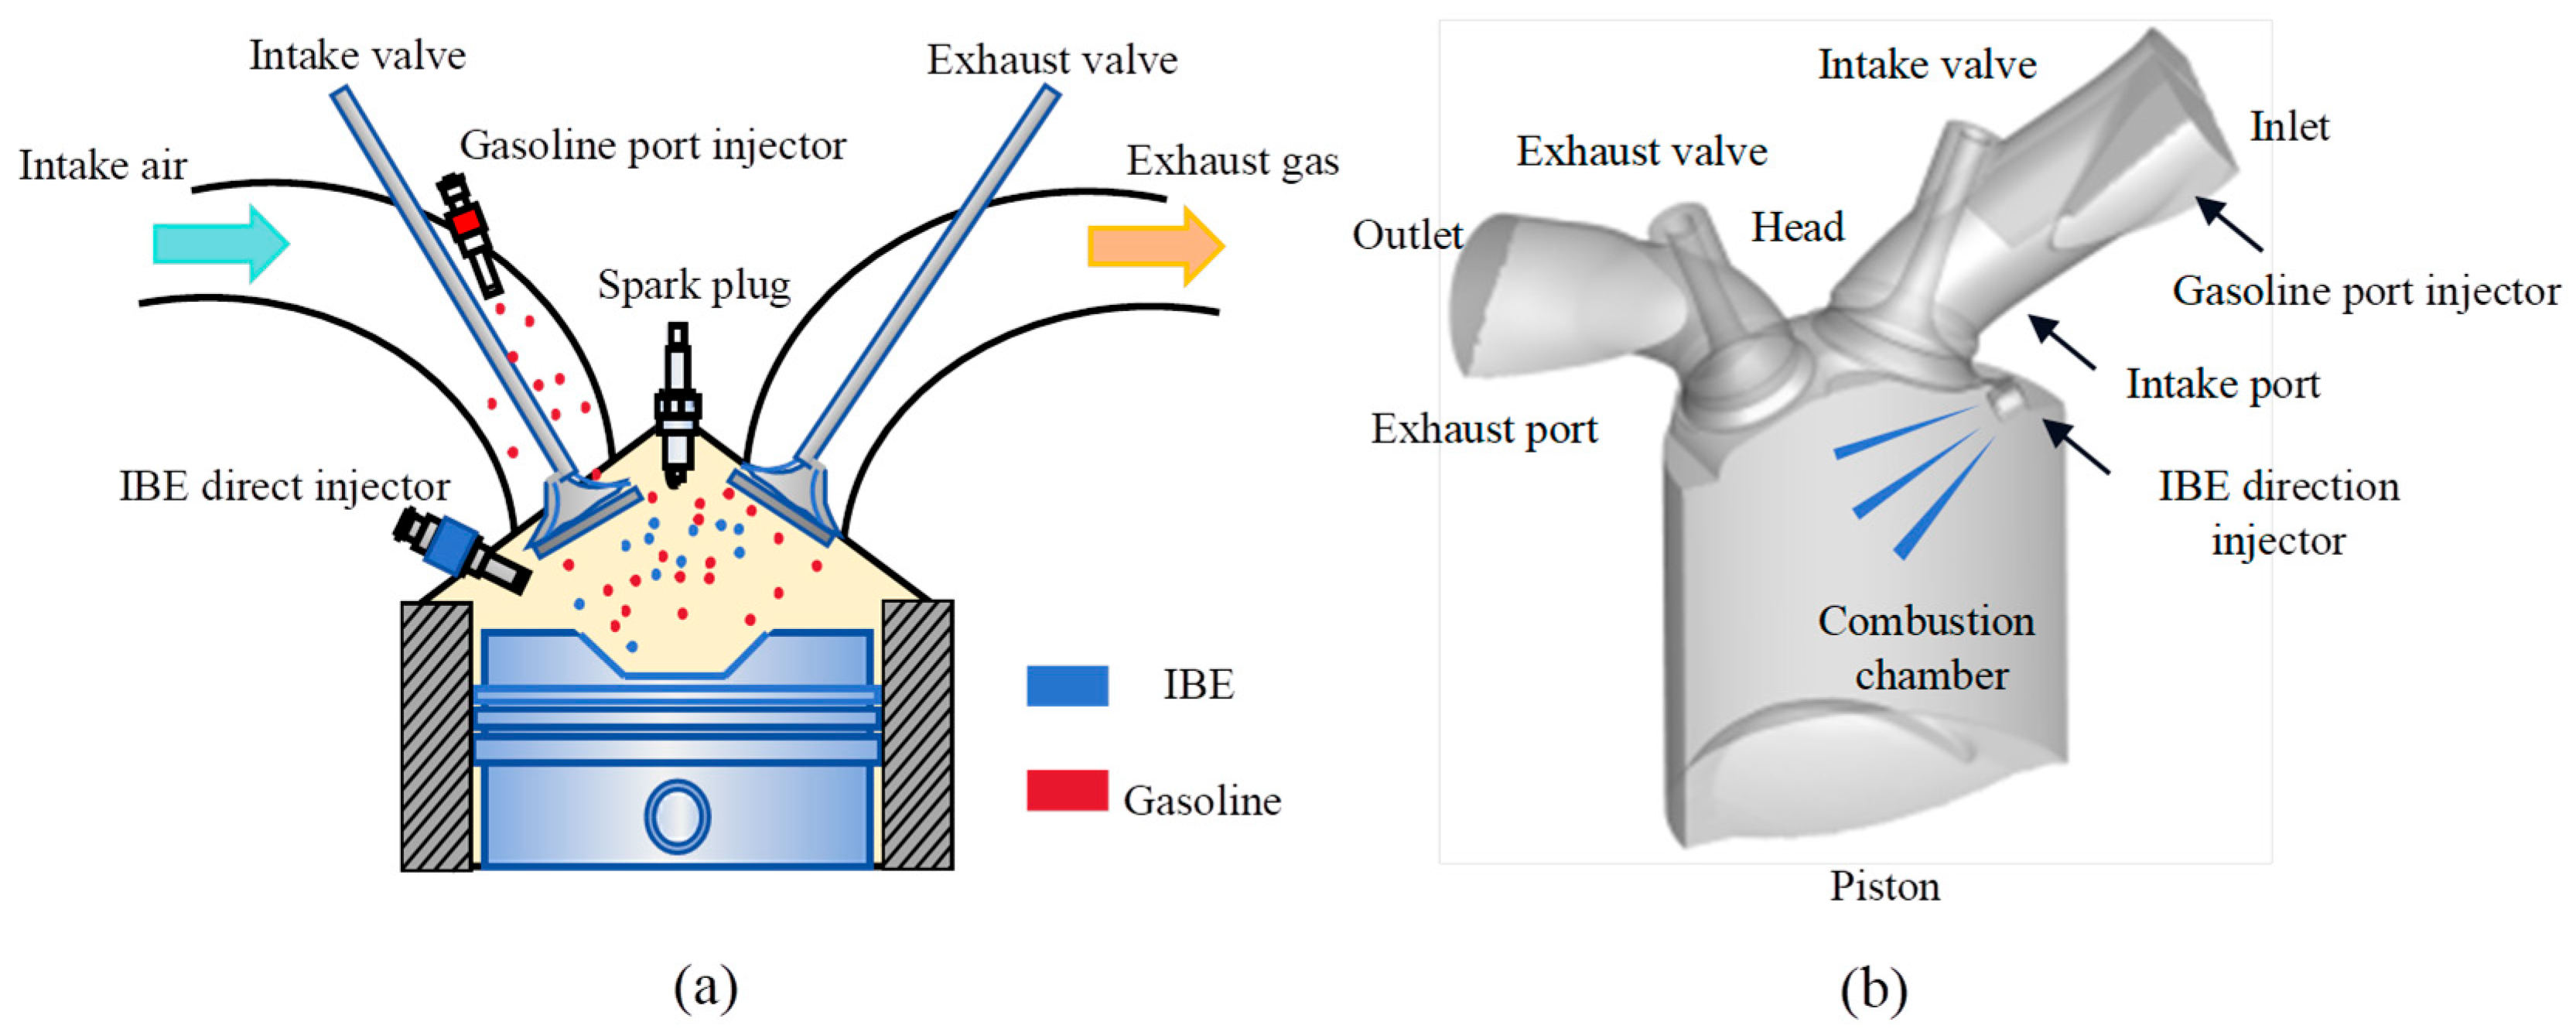
The original engine used in the experiment was a gasoline combined injection spark plug ignition form. This study is based on the improvement of the SI four-cylinder engine, achieving gasoline intake port injection (GPI) + IBE direct injection (IBEDI) mode. Firstly, the low-pressure gasoline injector is installed on the intake manifold to achieve the GPI function. This injector injects gasoline into the intake port during the intake stroke and mixes it with air before entering the cylinder. Secondly, the fuel supply of the original cylinder direct injection system has been switched from pure gasoline to IBE fuel. During the compression stroke phase, inject IBE fuel directly into the cylinder. The original parameters of the experimental engine are shown in Table 1.
Figure 1 illustrates the fuel injection system used in this experiment. Figure 1a shows the spatial arrangement of two injectors relative to the intake system. The gasoline intake injector is located upstream of the intake port and can deliver fuel to the intake during the intake stroke. This promotes the uniformity of the mixture before entering the cylinder. In contrast, the IBE direct injector is directly installed in the cylinder head, allowing the IBE to be injected directly into the combustion chamber at high pressure and precise timing. The pulse width of each injector can be independently controlled, facilitating flexible dual fuel ratio and injection timing strategies. Figure 1b provides a schematic cross-sectional view of the combustion chamber.
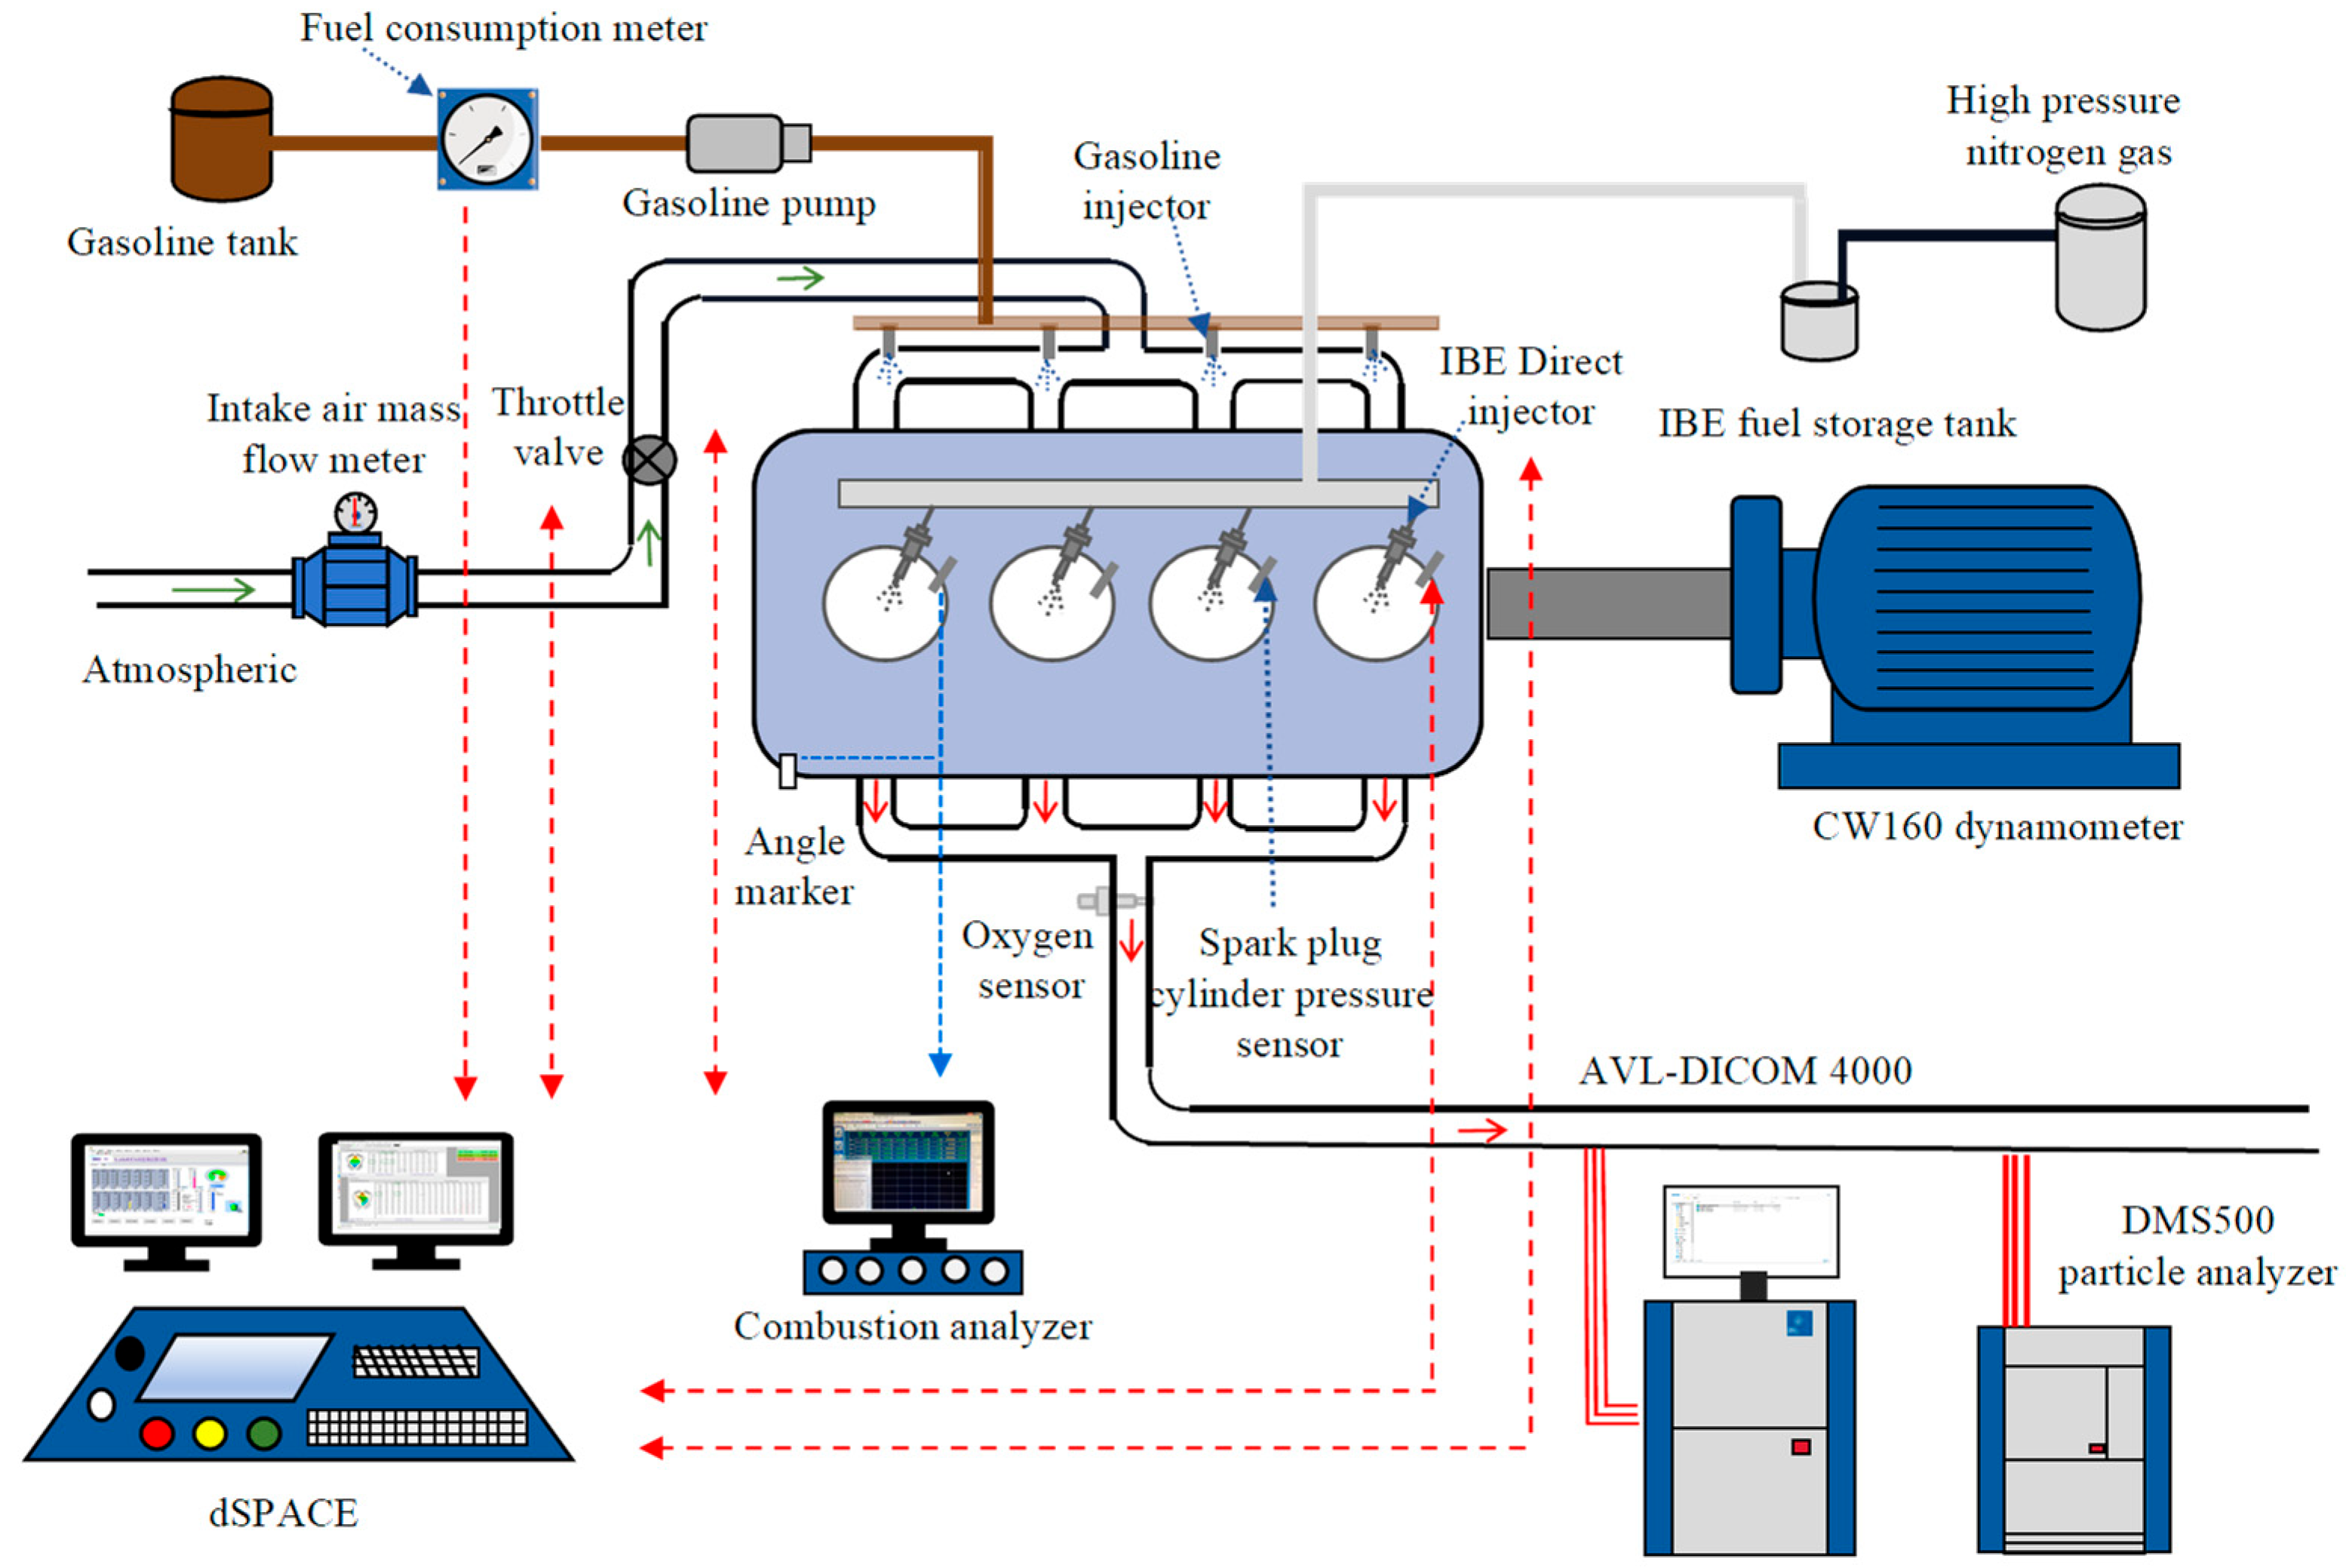
Figure 2 shows the layout of the engine and the supply and communication methods of its ancillary equipment. It includes two fuel supply paths, intake port fuel injection and direct injection. The low-pressure fuel circuit of the port fuel injection system draws fuel from the tank through a gasoline pump and injects gasoline into the engine intake port at an injection pressure of 0.3 MPa. The direct injection system’s fuel circuit uses high-pressure nitrogen from a hydraulic accumulator to pump IBE into the engine’s direct injection rail, providing a maximum injection pressure of 13 MPa. The test bench mainly includes a combustion analyzer, exhaust gas analyzer, dynamometer, particulate emission collection equipment, pressure sensors, oxygen sensors, electronic control system, direct injection fuel supply system and port fuel injection supply system. The dSPACE rapid control hardware simulation platform serves as the engine control system. Through the control software model built in MATLAB/Simulink (R2012b), this device can perform real-time adjustment of required engine parameters, such as ignition, injection, and throttle opening parameters. It enables independent control of both injection pulse width and injection timing for port fuel injection and direct injection, with fuel injection quantity determined according to specific test conditions.
Table 2 provides the accuracy and measurement ranges of the test equipment used in this experiment. During the experiment, in order to ensure that the experimental error was within the range applicable to engineering, 200 cycles of combustion data were collected for each experiment, and then the average values of in-cylinder pressure, CA90, and indicated mean effective pressure were calculated. Torque and emissions data were the averages of 3 groups collected by the emission device. Based on the recorded data under steady-state operating conditions, the overall uncertainty of the test system was analyzed. The calculation showed that the overall uncertainty of this study was 5.8%, which is within the acceptable range [49,50].
U x = ( u n c e r t a i n t y T o r q u e ) 2 + ( u n c e r t a i n t y C o V I M E P ) 2 + + ( u n c e r t a i n t y H C ) 2

2.2. Experimental Fuel and Characteristic Description

The gasoline fuel used in the tests is 95-octane gasoline, while the IBE fuel is prepared by blending isopropanol, butanol, and ethanol in a volumetric ratio of 3:6:1. The three alcohol fuels are proportionally mixed and stirred uniformly, then placed in a container and left to stand for 7 days to ensure homogeneous blending. Table 3 lists the physicochemical properties of gasoline, isopropanol, butanol, and ethanol.

2.3. Experimental Scheme and Parameter Definition

Table 4 presents the experimental scheme of this study. This study aims to further investigate the comprehensive characteristics of IBE/gasoline combined injection engines under different engine operating conditions. Both test phases adopt a combined injection mode of gasoline port injection plus IBE direct cylinder injection. In addition, changes in the excess air ratio of the engine have an extremely important impact on pollutant emissions. The first phase investigates the effects of the IBE direct injection ratio and timing on engine performance under λ = 1 and 1.2 conditions. The second phase fixes the IBE direct injection timing (DIT) at 300° CA BTDC to examine the influence of different IBE direct injection ratios (IBEDIr) under varying λ conditions on engine performance. To ensure interference from other parameters, the experiment maintains the principle of a single variable. The other parameters are fixed, including engine speed = 1500 rpm, DI pressure = 7 MPa, manifold absolute pressure = 50 kPa, opening timing of intake valve = 372° CA BTDC, closing timing of intake valve = 128° CA BTDC, opening timing of exhaust valve = 160° CA ATDC, closing time of exhaust valve = 373° CA ATDC, gasoline port injection timing = 300° CA BTDC, and ignition timing = MBT. The MBT is defined as the minimum advance for best torque.
In the experimental procedure, while varying the IBEDIr under constant conditions, the air intake amount was maintained at a fixed level across all IBEDIr settings. Assuming that the airflow amount is denoted as Q, and M represents the mass flow rate of pure gasoline during port injection under stoichiometric conditions (λ = 1). To achieve a specific IBEDIr, the port injection pulse width is first adjusted to set the gasoline mass flow rate to the desired value of Massgasoline as specified in Formula (1). Subsequently, the IBE injection pulse width is tuned to restore λ to 1. This same approach can be applied at different λ values to realize each target IBEDIr.
M a s s g a s o l i n e = M 1 I B E D I r
The CA0-90 is used to quantitatively evaluate the development process of overall combustion. Defined as the crankshaft angle experienced by the cumulative heat release from ignition timing to 90%. The combustion analyzer collects cylinder pressure signals and matches them with crankshaft angle signals, then calculates the heat release rate. Using a specific algorithm built into the combustion analyzer, it calculates the crankshaft angles at which the cumulative heat release reaches 90%, thus obtaining CA0-90.
The coefficient of variation indicated mean effective pressure (CoVIEMP) is used to evaluate the operational stability of this composite fuel ignition engine. The calculation formula is as follows:
C o V I M E P = σ x x ¯ × 100 %
x ¯ = i = 1 N x i N
σ x = i = 1 N ( x i x ¯ ) 2 N
Among them, x represents the average indicated pressure, xi represents the average indicated pressure of the i-th cycle of the engine, and N represents the number of sampling periods. In this study, we uniformly set the number of sampling periods to 200. The x ¯ represents the average indicated pressure over 200 sampling periods, σ x denotes the standard deviation of the average indicated pressure over 200 sampling periods.

3. Results and Discussion

The combustion characteristics, gaseous emission and particle emission of GPI + IBEDI mode under different injection strategies and λ are explored in the following section.

3.1. Combustion Characteristics

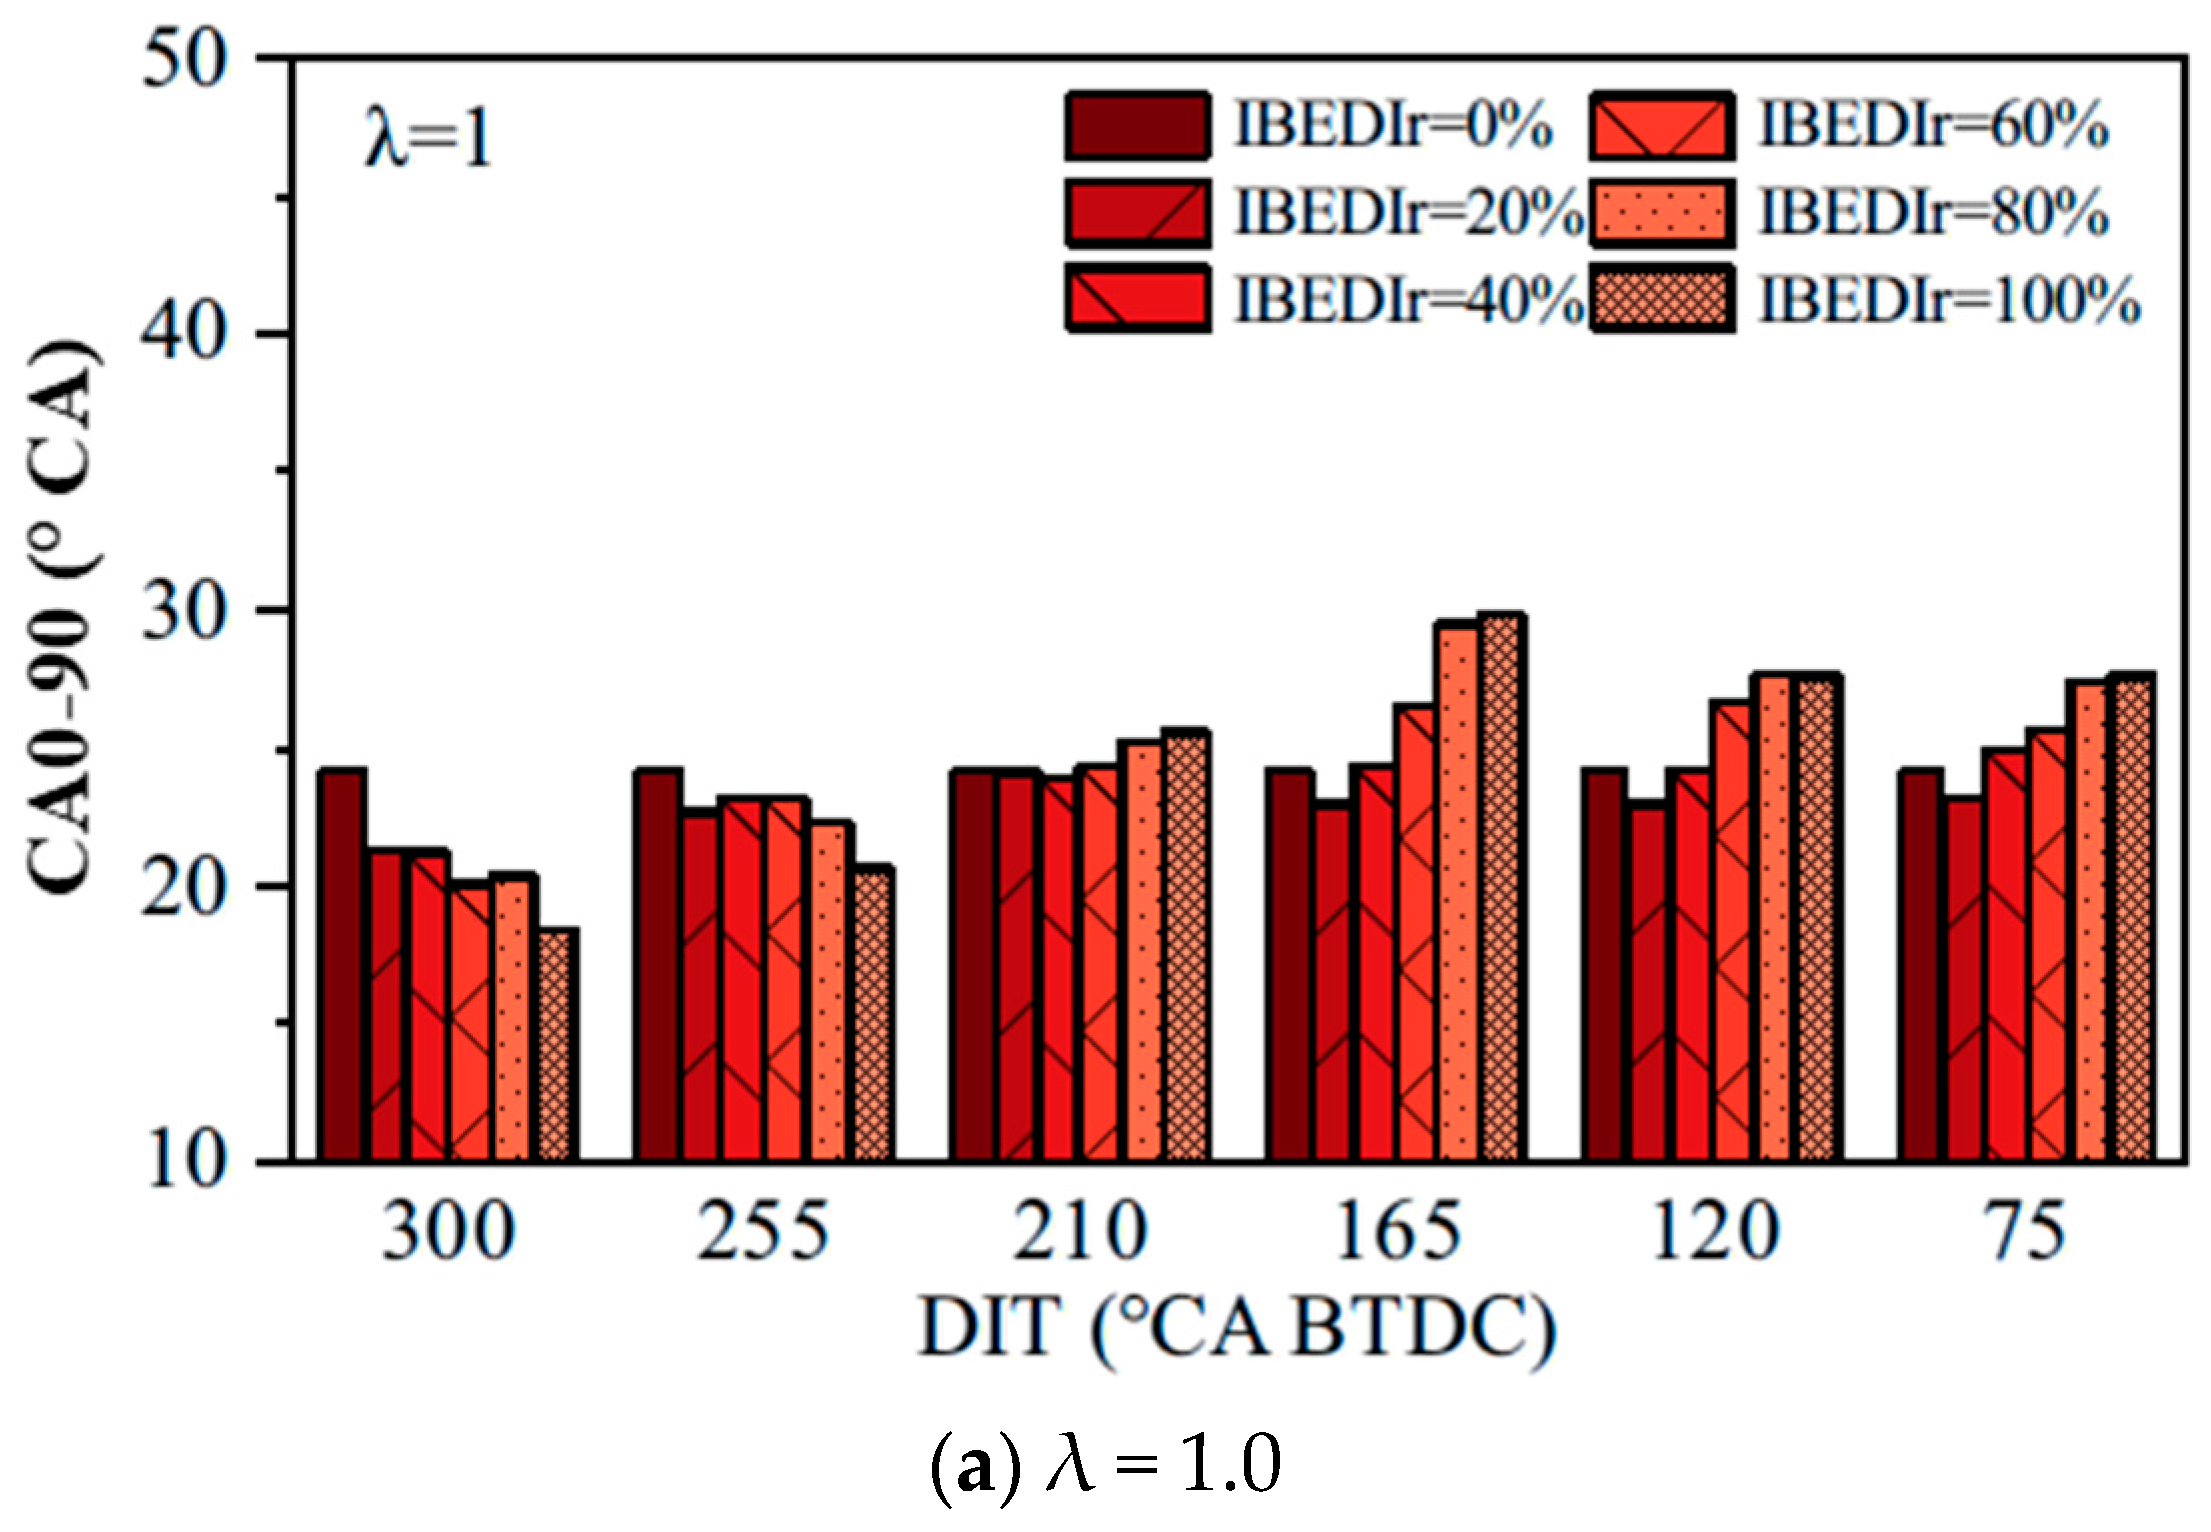
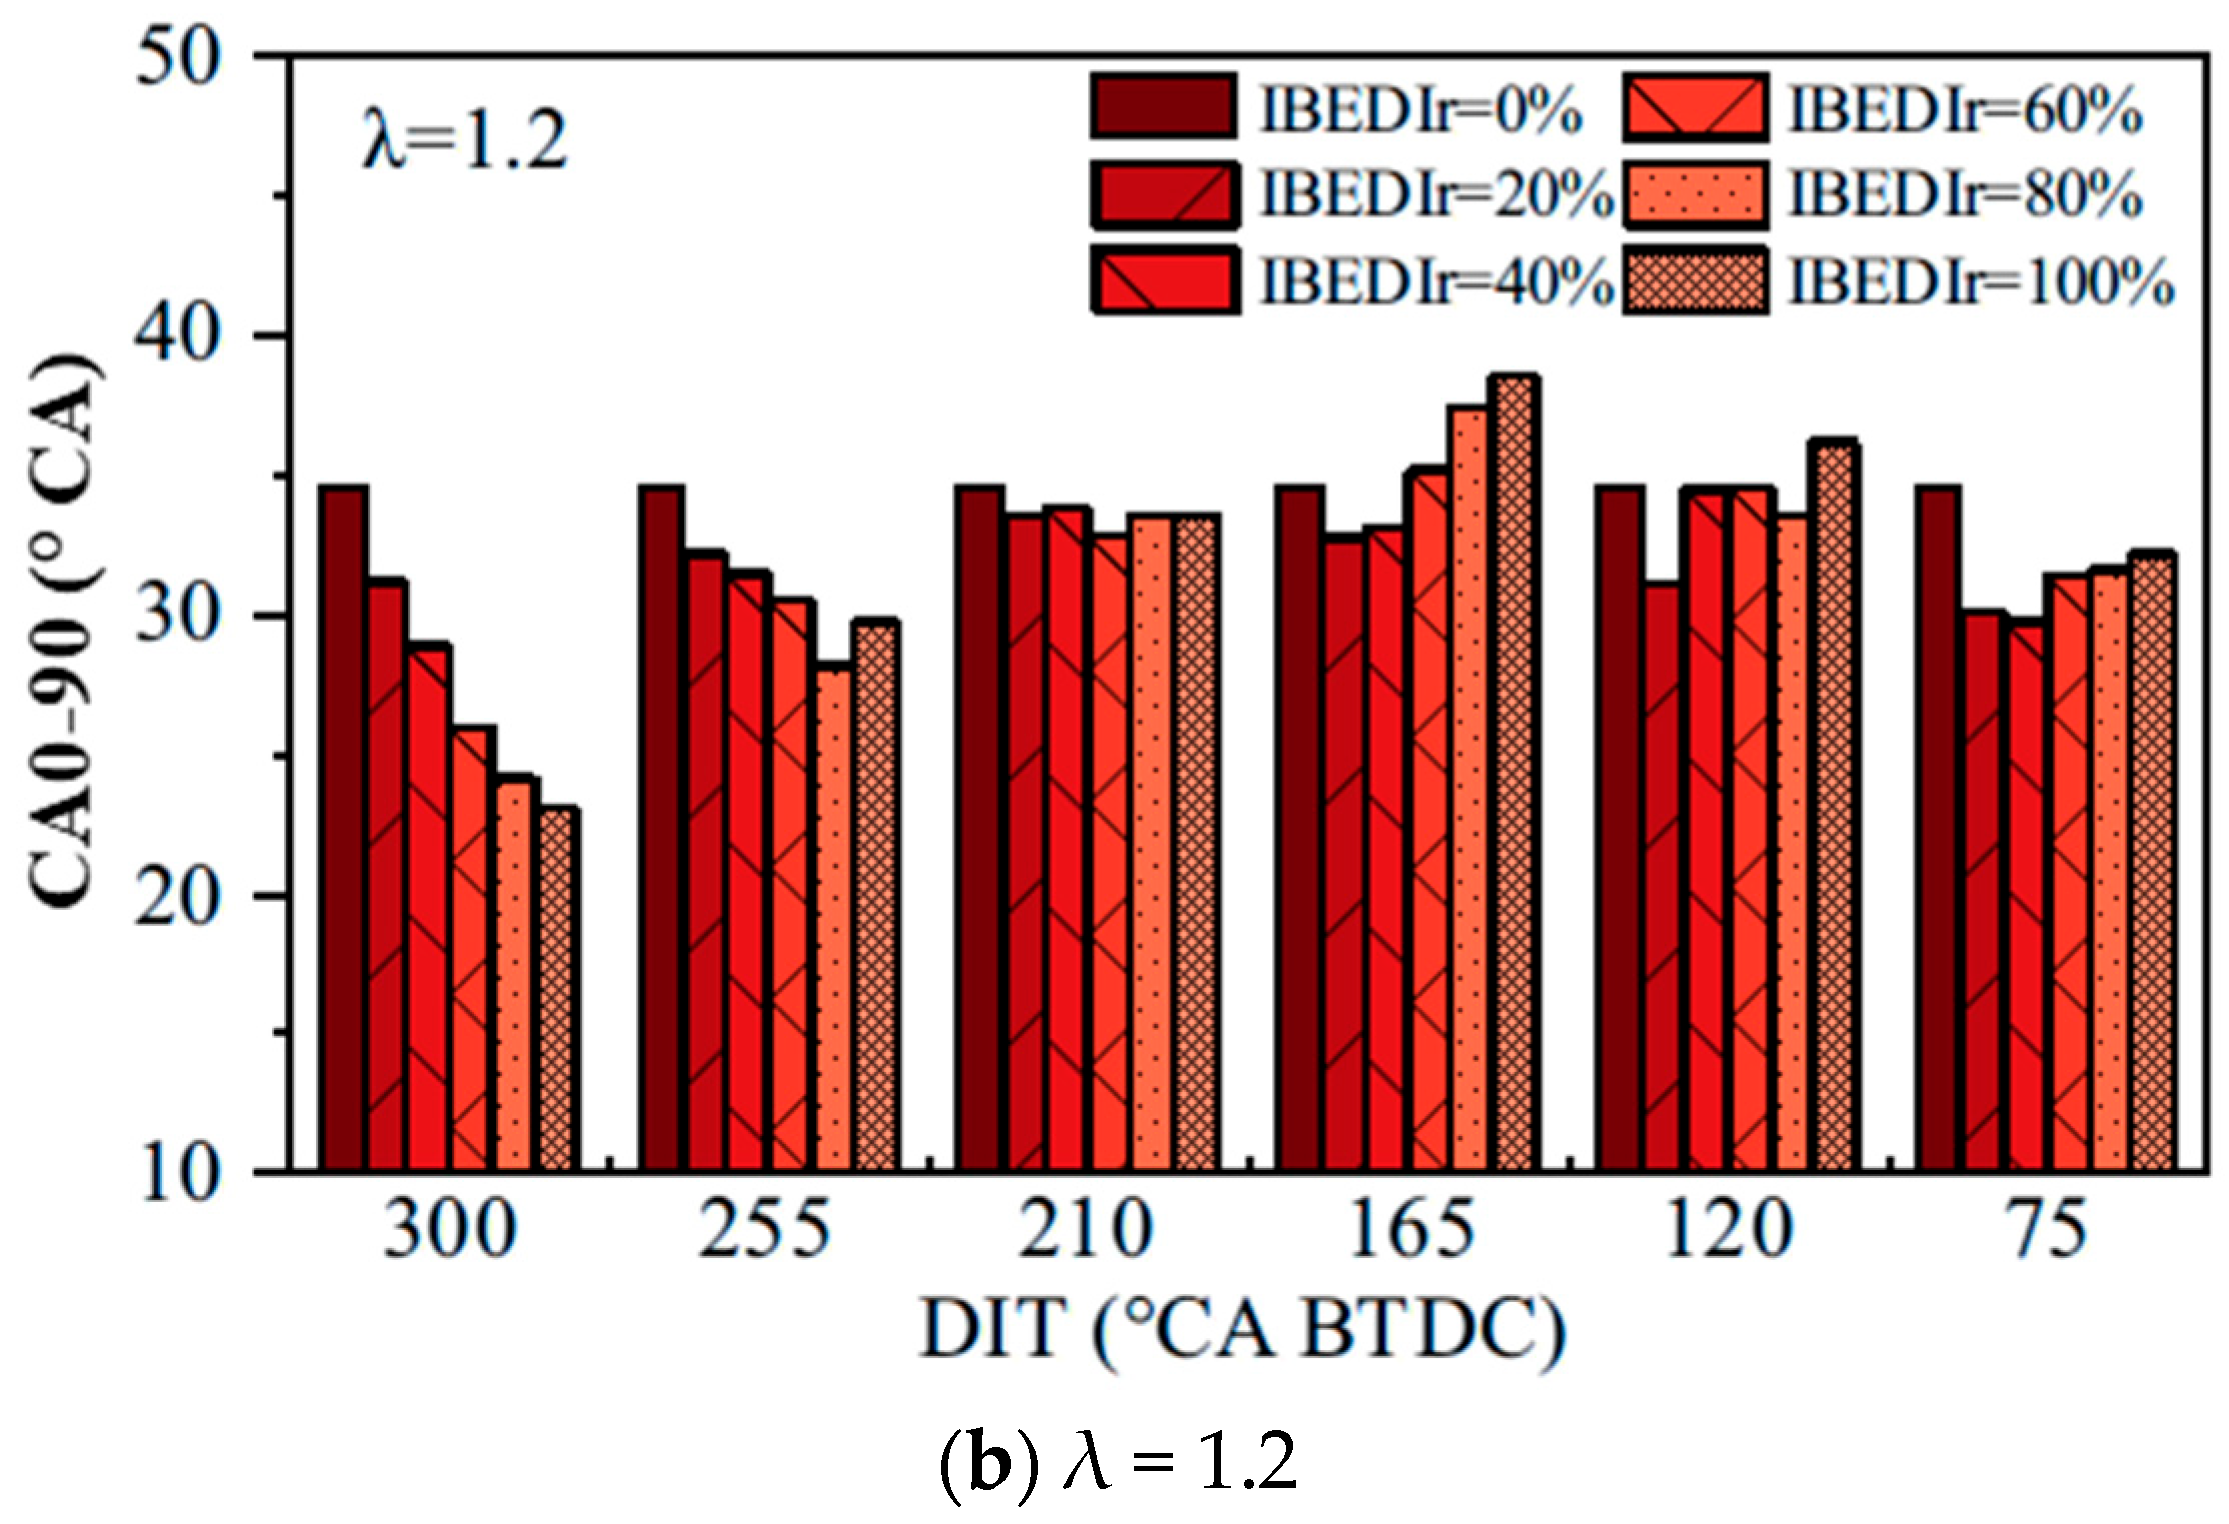
Figure 3 illustrates how CA0-90 varies with IBEDIr under different DIT settings at λ = 1 and 1.2. According to Figure 3a, at DIT of 300° and 255° CA BTDC, CA0-90 continuously declines as IBEDIr rises. In contrast, within the DIT range of 210–75° CA BTDC, CA0-90 first decreases and then increases with increasing IBEDIr. This behavior can be explained by the high LFS of IBE, which enhances flame propagation, leading to a reduction in CA0-90 when the DIT is set to 300° or 255° CA BTDC. While at 210–75° CA BTDC, the IBE is injected into the cylinder late, and the time of evaporation and mixing is also shortened accordingly, which will cause an inhomogeneous mixture and incomplete combustion. Furthermore, the high latent heat of vaporization and the high viscosity of IBE will worsen the evaporation, mixing and combustion processes. So CA0-90 tends to increase at high IBEDIr when the DIT is late. It is worth noting that IBEDIr, corresponding to the lowest CA0-90, is 100%, 100%, 40%, 20%, 20% and 20%, respectively, at DIT = 300–75° CA BTDC, which indicates that the best IBEDIr decreases with the postponement of DIT. This is because the delay of DIT will reduce the time of evaporation and mixing of IBE, and the large injection amount of IBE will aggravate the poor mixing of evaporation. Only by reducing the IBEDIr can one ensure a better and complete mixing and combustion. In addition, the CA0-90 of 300° CA BTDC is lowest at different DIT. This can be explained by the fact that early DIT can provide more time to evaporate and the high amount of direct injection just takes more time to evaporate at the stoichiometric condition.
At λ = 1.2, CA0-90 shows basically the same trend as λ = 1.0. The difference is that the IBEDIr corresponding to the lowest CA0-90 is 100%, 80%, 60%, 20%, 20% and 40% which means the best IBEDIr increases compared with that at λ = 1.0. This is because the injection amount will decrease with increasing λ since the air intake amount is constant. And IBE is more likely to evaporate completely even if DIT is later. So the more IBE is injected, the shorter the combustion duration due to the high LFS of IBE. It can be concluded that the high IBEDIr fuel is more competitive at lean conditions with late DIT.
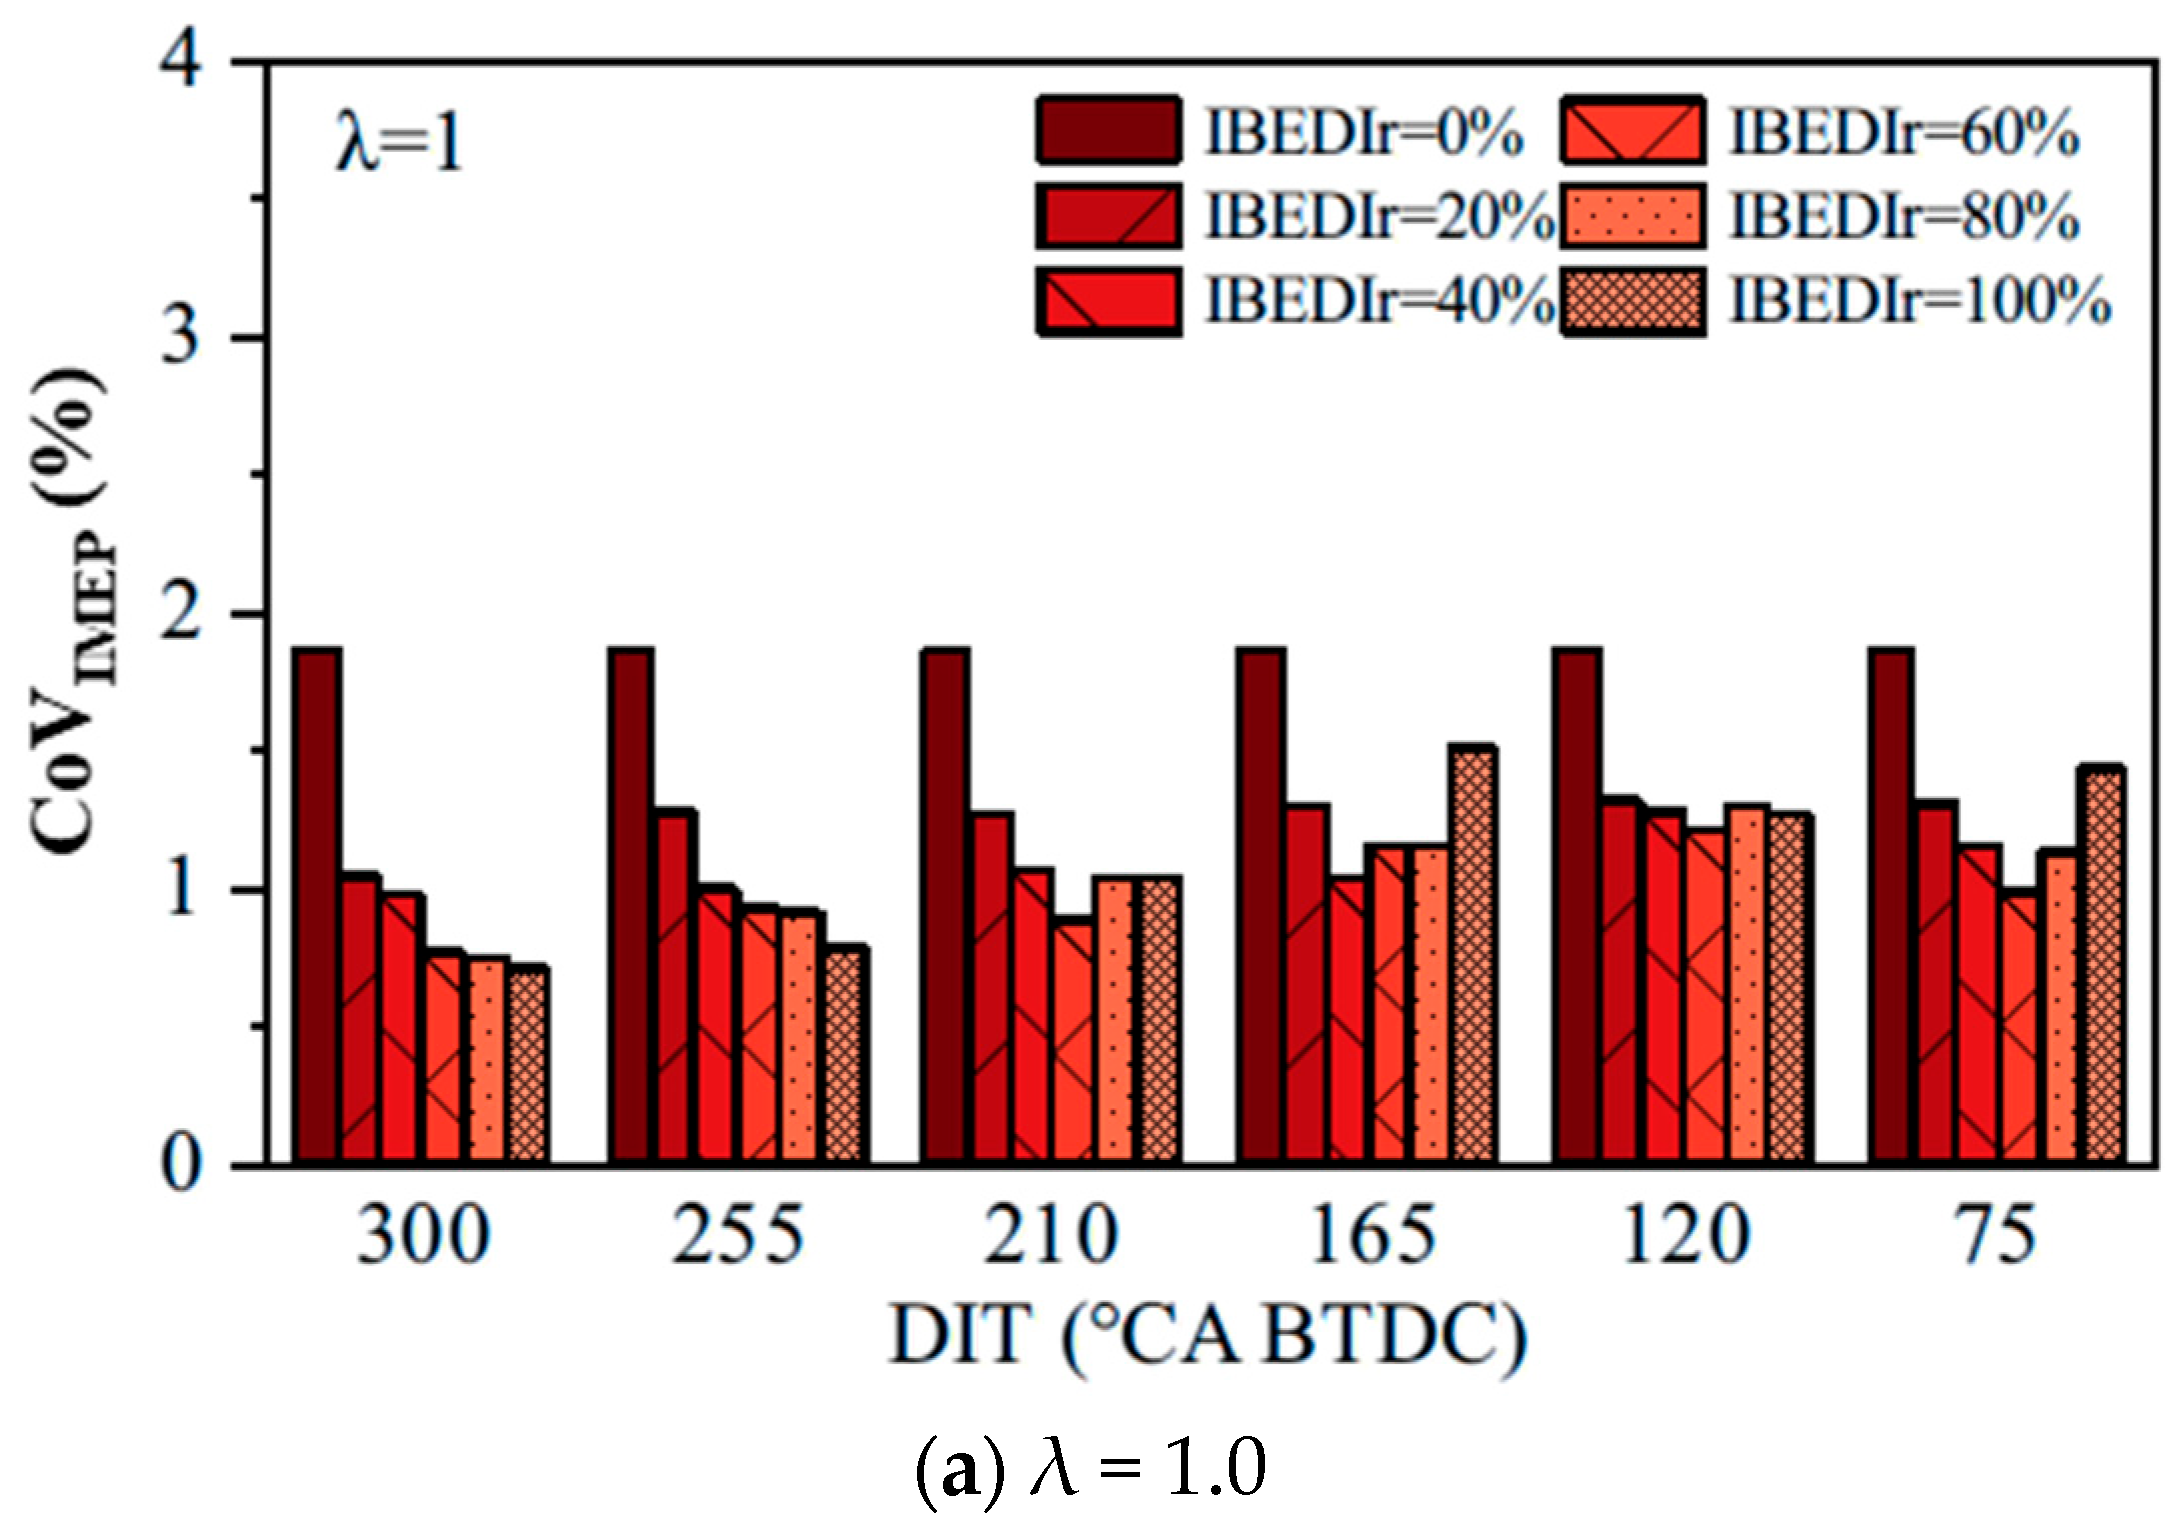
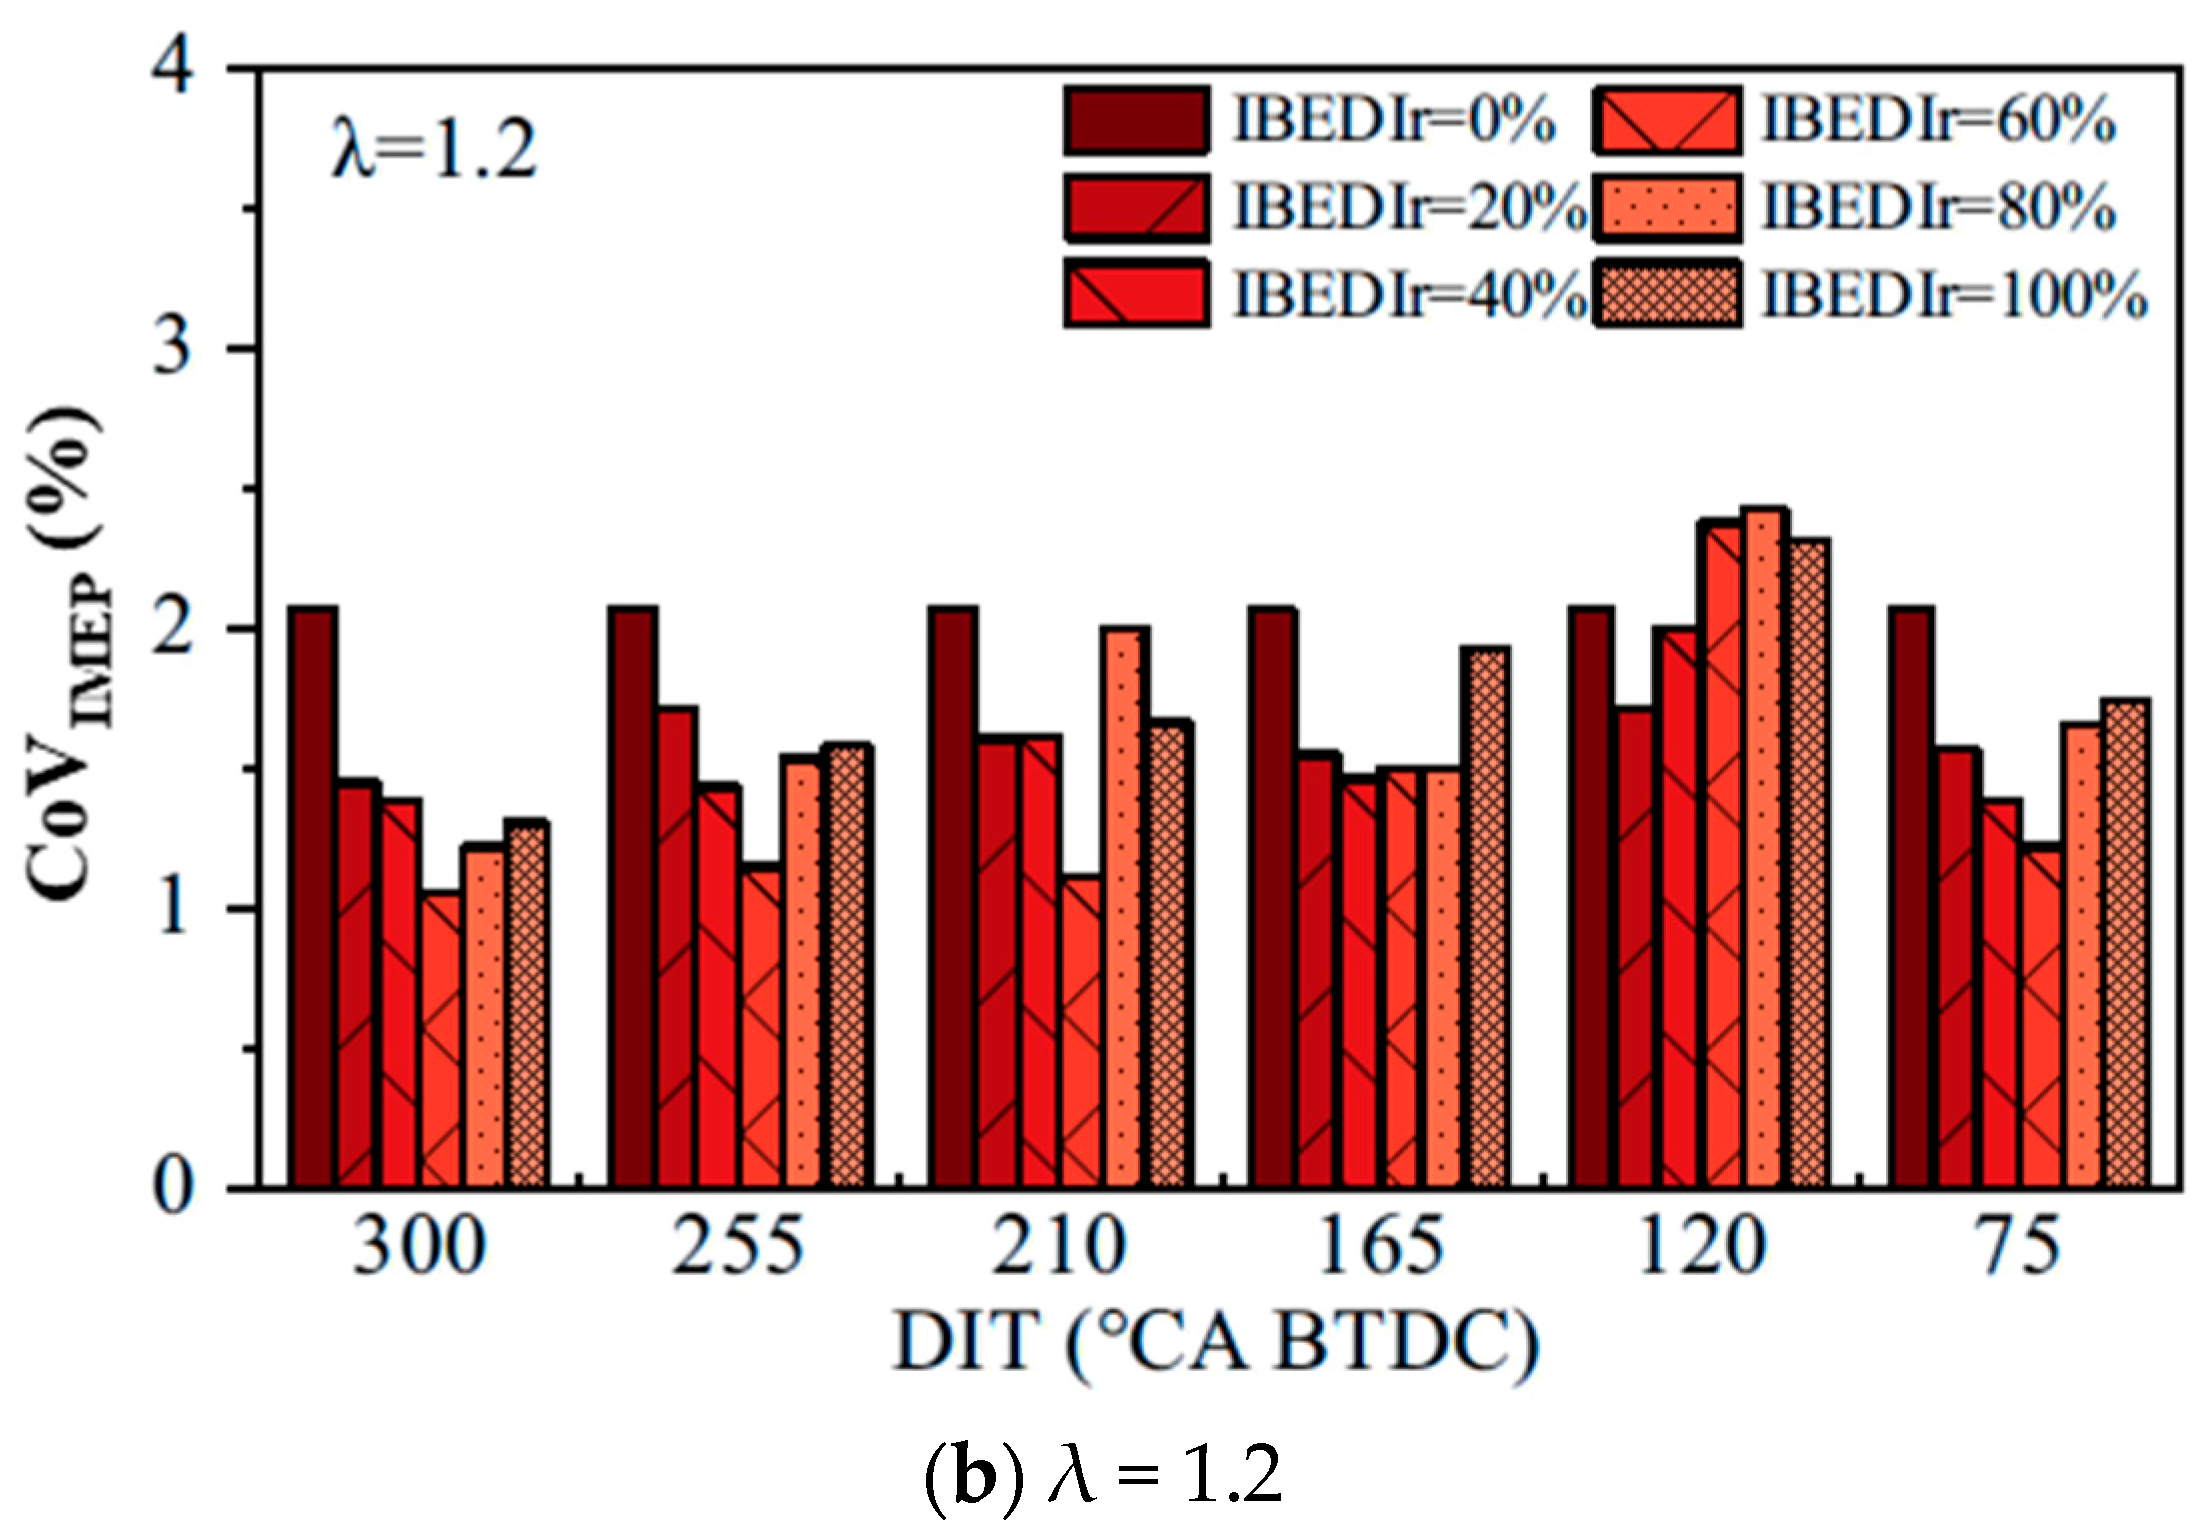
Figure 4 displays that CoVIMEP changes with IBEDIr for various DIT settings at λ = 1 and 1.2. At λ = 1, CoVIMEP continues to decrease at DIT = 300 and 255° CA BTDC, while decreasing at first, it increases at DIT = 210–75° CA BTDC. At early DIT, the sufficient evaporation and mixing time to make IBE tend to be homogeneous, thus reducing the cyclic variation in the mixture composition in the cylinder. On this basis, the characteristics such as the fast flame propagation speed of IBE promote the stable combustion, so the CoVIMEP decreases with increasing IBEDIr.
However, the CoVIMEP all decrease at first and then increase at λ = 1.2. This is because the combustion process tends to be unstable under lean burn conditions. At high IBEDIr, if the IBE does not evaporate and mix uniformly in the cylinder, it will result in local excess air ratios exceeding 1.2. Such overly lean mixtures can lead to combustion instability and increased cycle-to-cycle variations, which explains the rise in CoVIMEP at high IBEDIr. It can be seen that cyclic variations are smaller at either very early or very late DITs. This is because early injection promotes homogeneous mixture formation while late injection creates stratified mixtures-both conditions are conducive to stable combustion. However, at intermediate injection timings, the mixture exists in a transitional state between homogeneous and stratified, which restricts stable ignition and flame propagation. Therefore, intermediate injection timings (particularly around 120° CA BTDC) should be avoided under lean combustion conditions.
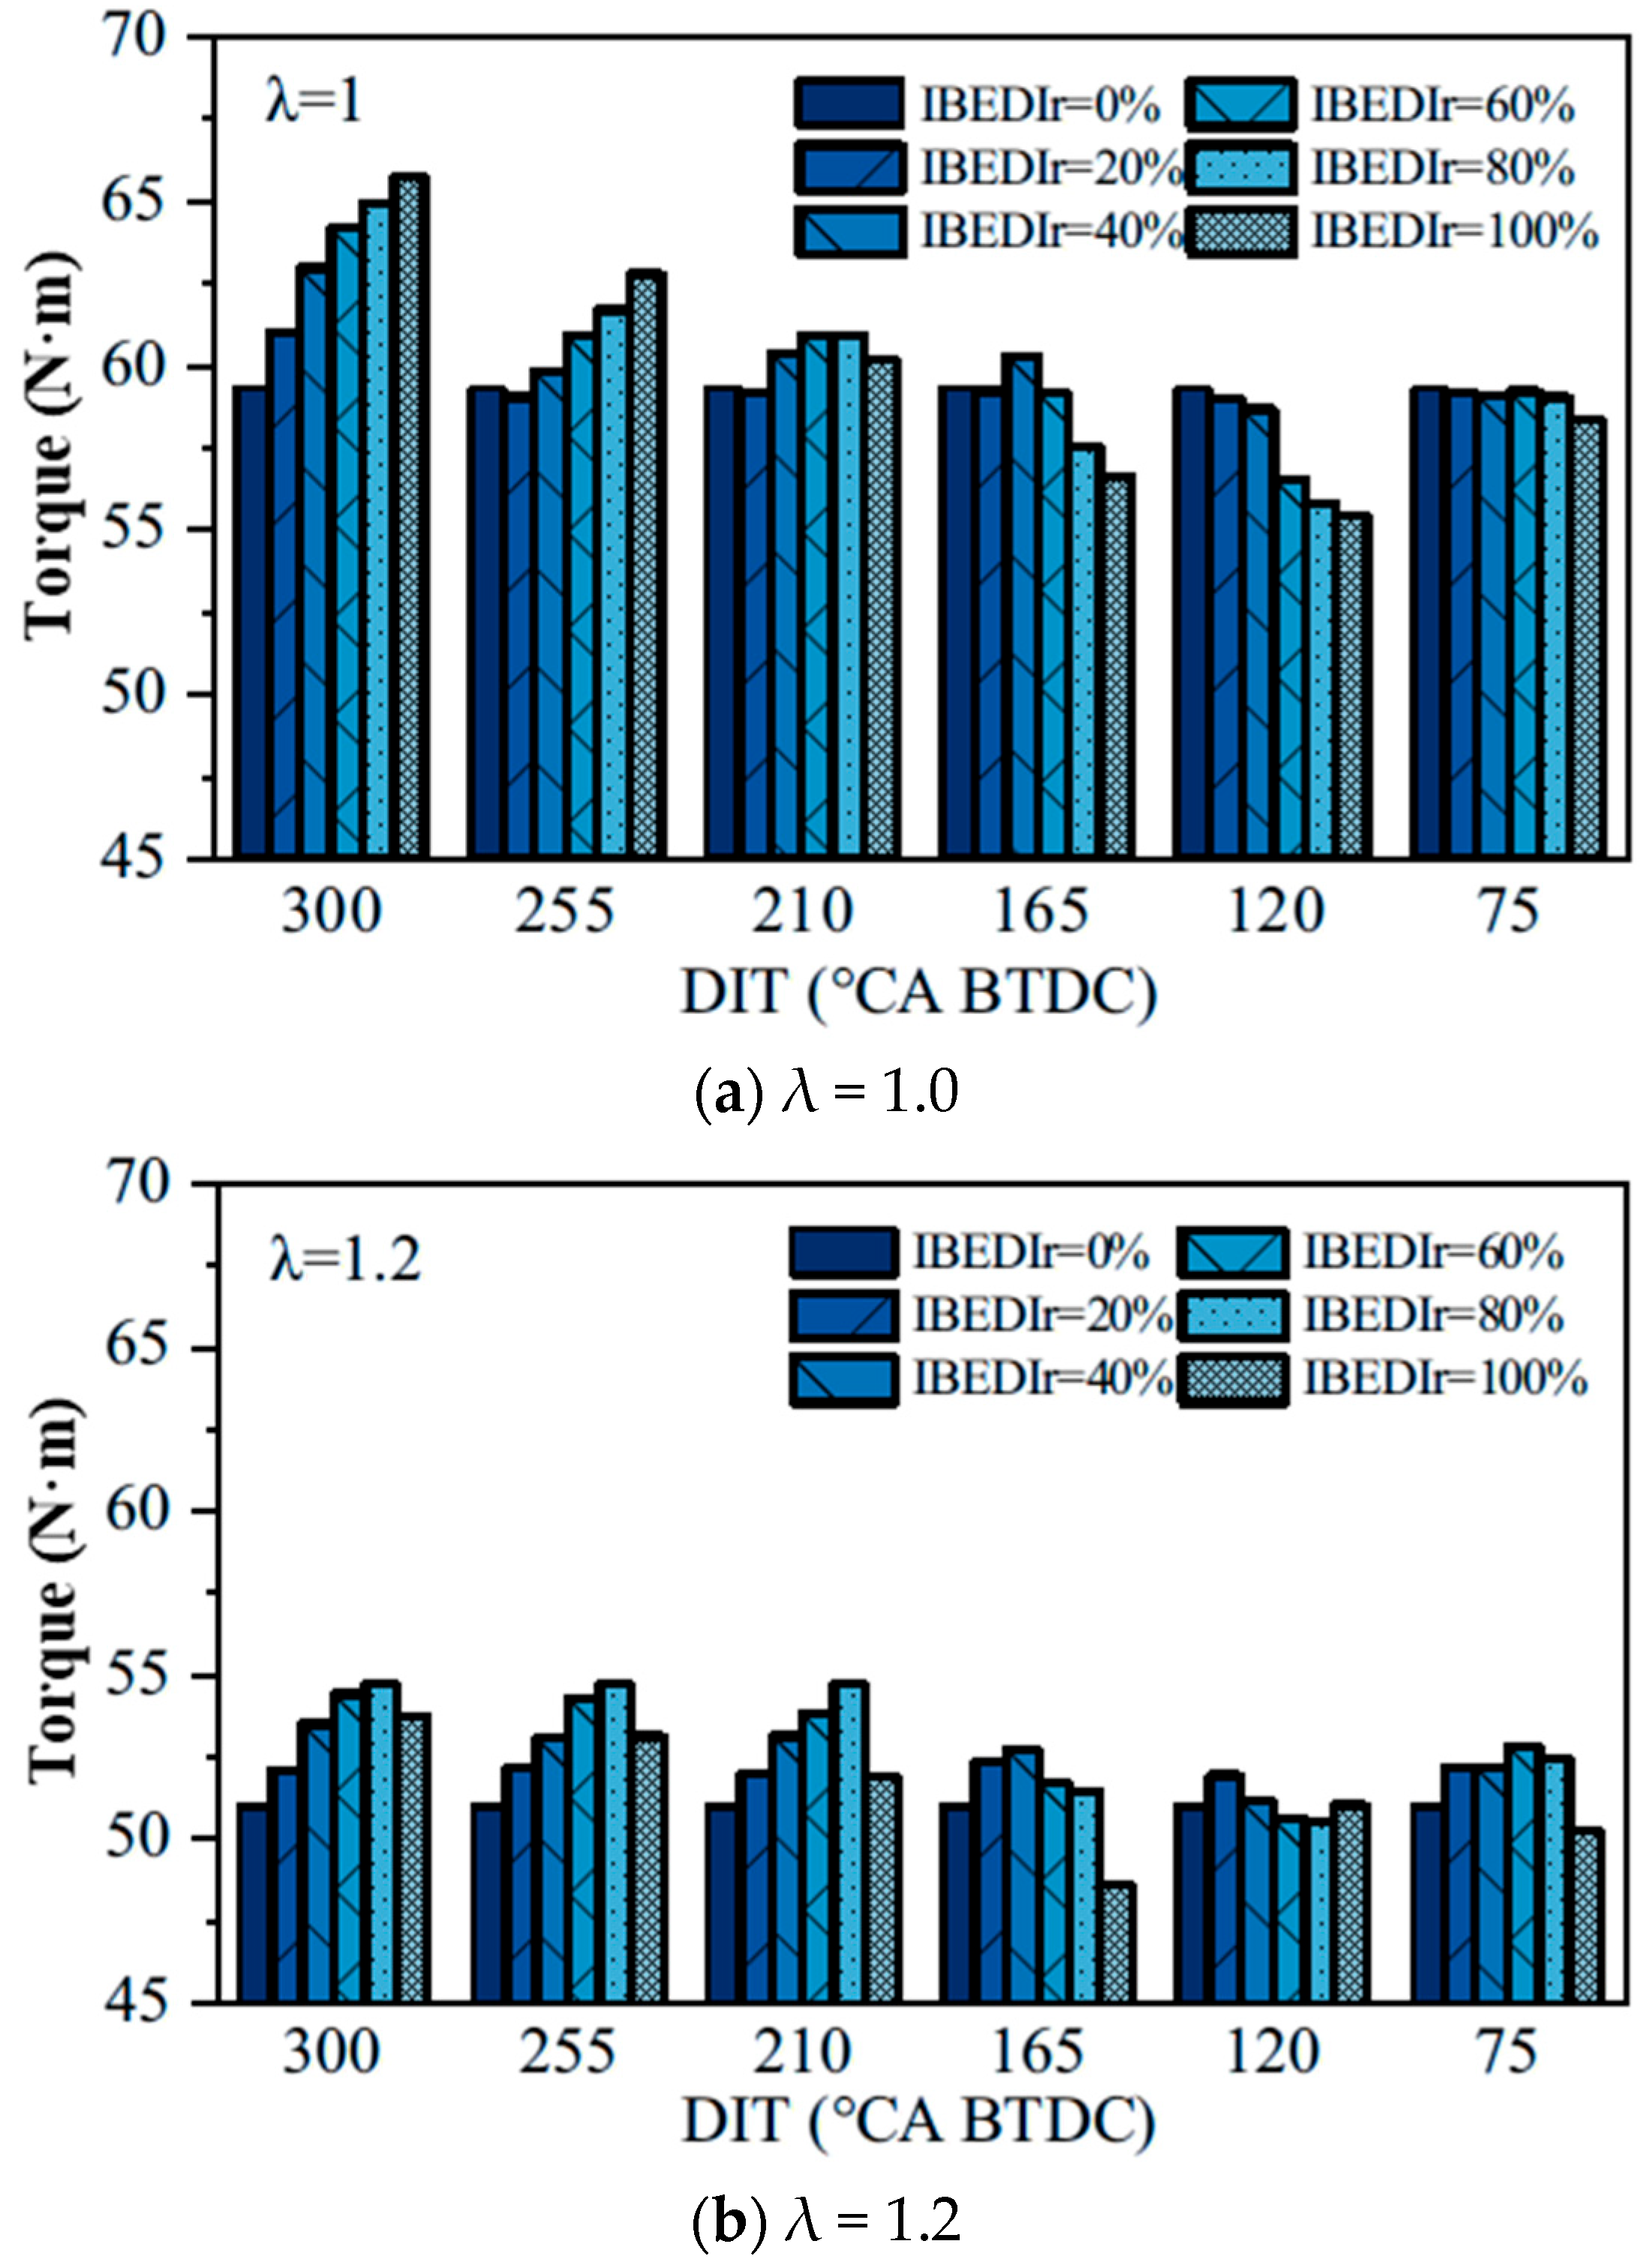
Figure 5 presents the relationship between torque versus DIT for different IBEDIr levels at λ = 1 and λ = 1.2. At λ = 1, with increasing IBEDIr, the torque continues to increase at DIT = 300 and 255° CA BTDC, and increases firstly and then decreases at DIT = 210 and 165° CA BTDC, while decreases continuously at DIT = 120 and 75° CA BTDC. When the DIT is advanced, IBE is introduced into the cylinder earlier, allowing additional time for evaporation and air–fuel mixing. This helps compensate for the drawbacks associated with IBE’s high latent heat of vaporization, as well as its elevated viscosity, thereby promoting the mixture formation. Under this premise, the fast flame propagation and oxygen content of IBE compared to gasoline show improvement in combustion with increasing IBEDIr. With the postponement of DIT, the time for IBE evaporation and mixing will be reduced, and a high injection amount of IBE will cause an inhomogeneous mixture, which will worsen the combustion process. Therefore, the torque changes decrease at high IBEDIr when DIT = 210 and 165° CA BTDC. At DIT = 120 and 75° CA BTDC, the torque continues to decrease with increasing IBEDIr. This is because the delay of DIT will cause incomplete evaporation, and the increase in IBE amount will cause anoxic combustion. As the injection timing is retarded, the torque generally shows a decreasing trend, but exhibits a slight recovery at 75° CA BTDC. Under stoichiometric conditions, the relatively large IBE injection quantity leads to insufficient mixing when the injection is delayed, resulting in torque reduction. However, at DIT = 75° CA BTDC, late injection may form a stratified mixture that helps stabilize combustion, thus causing a minor torque recovery. Nevertheless, the torque remains significantly lower than that achieved with the 300° CA BTDC injection timing.
At λ = 1.2, the torque first increases and then decreases with increasing IBEDIr at different DIT. This is because the IBE will absorb the in-cylinder heat for evaporation and it is not conducive to stable ignition, especially under lean conditions. Hence, 100% IBEDIr is unsuitable under lean conditions. It can be seen that the torque reaches the highest at IBEDIr of 80%, 80%, 80%, 40%, 20% and 60% from DIT = 300 to 75° CA BTDC. At DIT = 300–120° CA BTDC, with the delay of DIT, the IBE injection amount should be reduced to avoid an inhomogeneous mixture, so the best IBEDIr decreases from 80% to 20%. However, the best IBEDIr return increases to 60% at DIT of 75° CA BTDC. This is because the late injection of IBE can form a local enrichment mixture around the spark plug which can improve the combustion at the lean conditions. However, the torque at DIT =75° CA BTDC is quite lower than that of DIT = 300° CA BTDC.
All in all, under stoichiometric conditions or with early injection timing, higher IBEDIr demonstrates competitive advantages. However, as injection timing is retarded and the excess air ratio increases, the IBEDIr should be appropriately reduced.
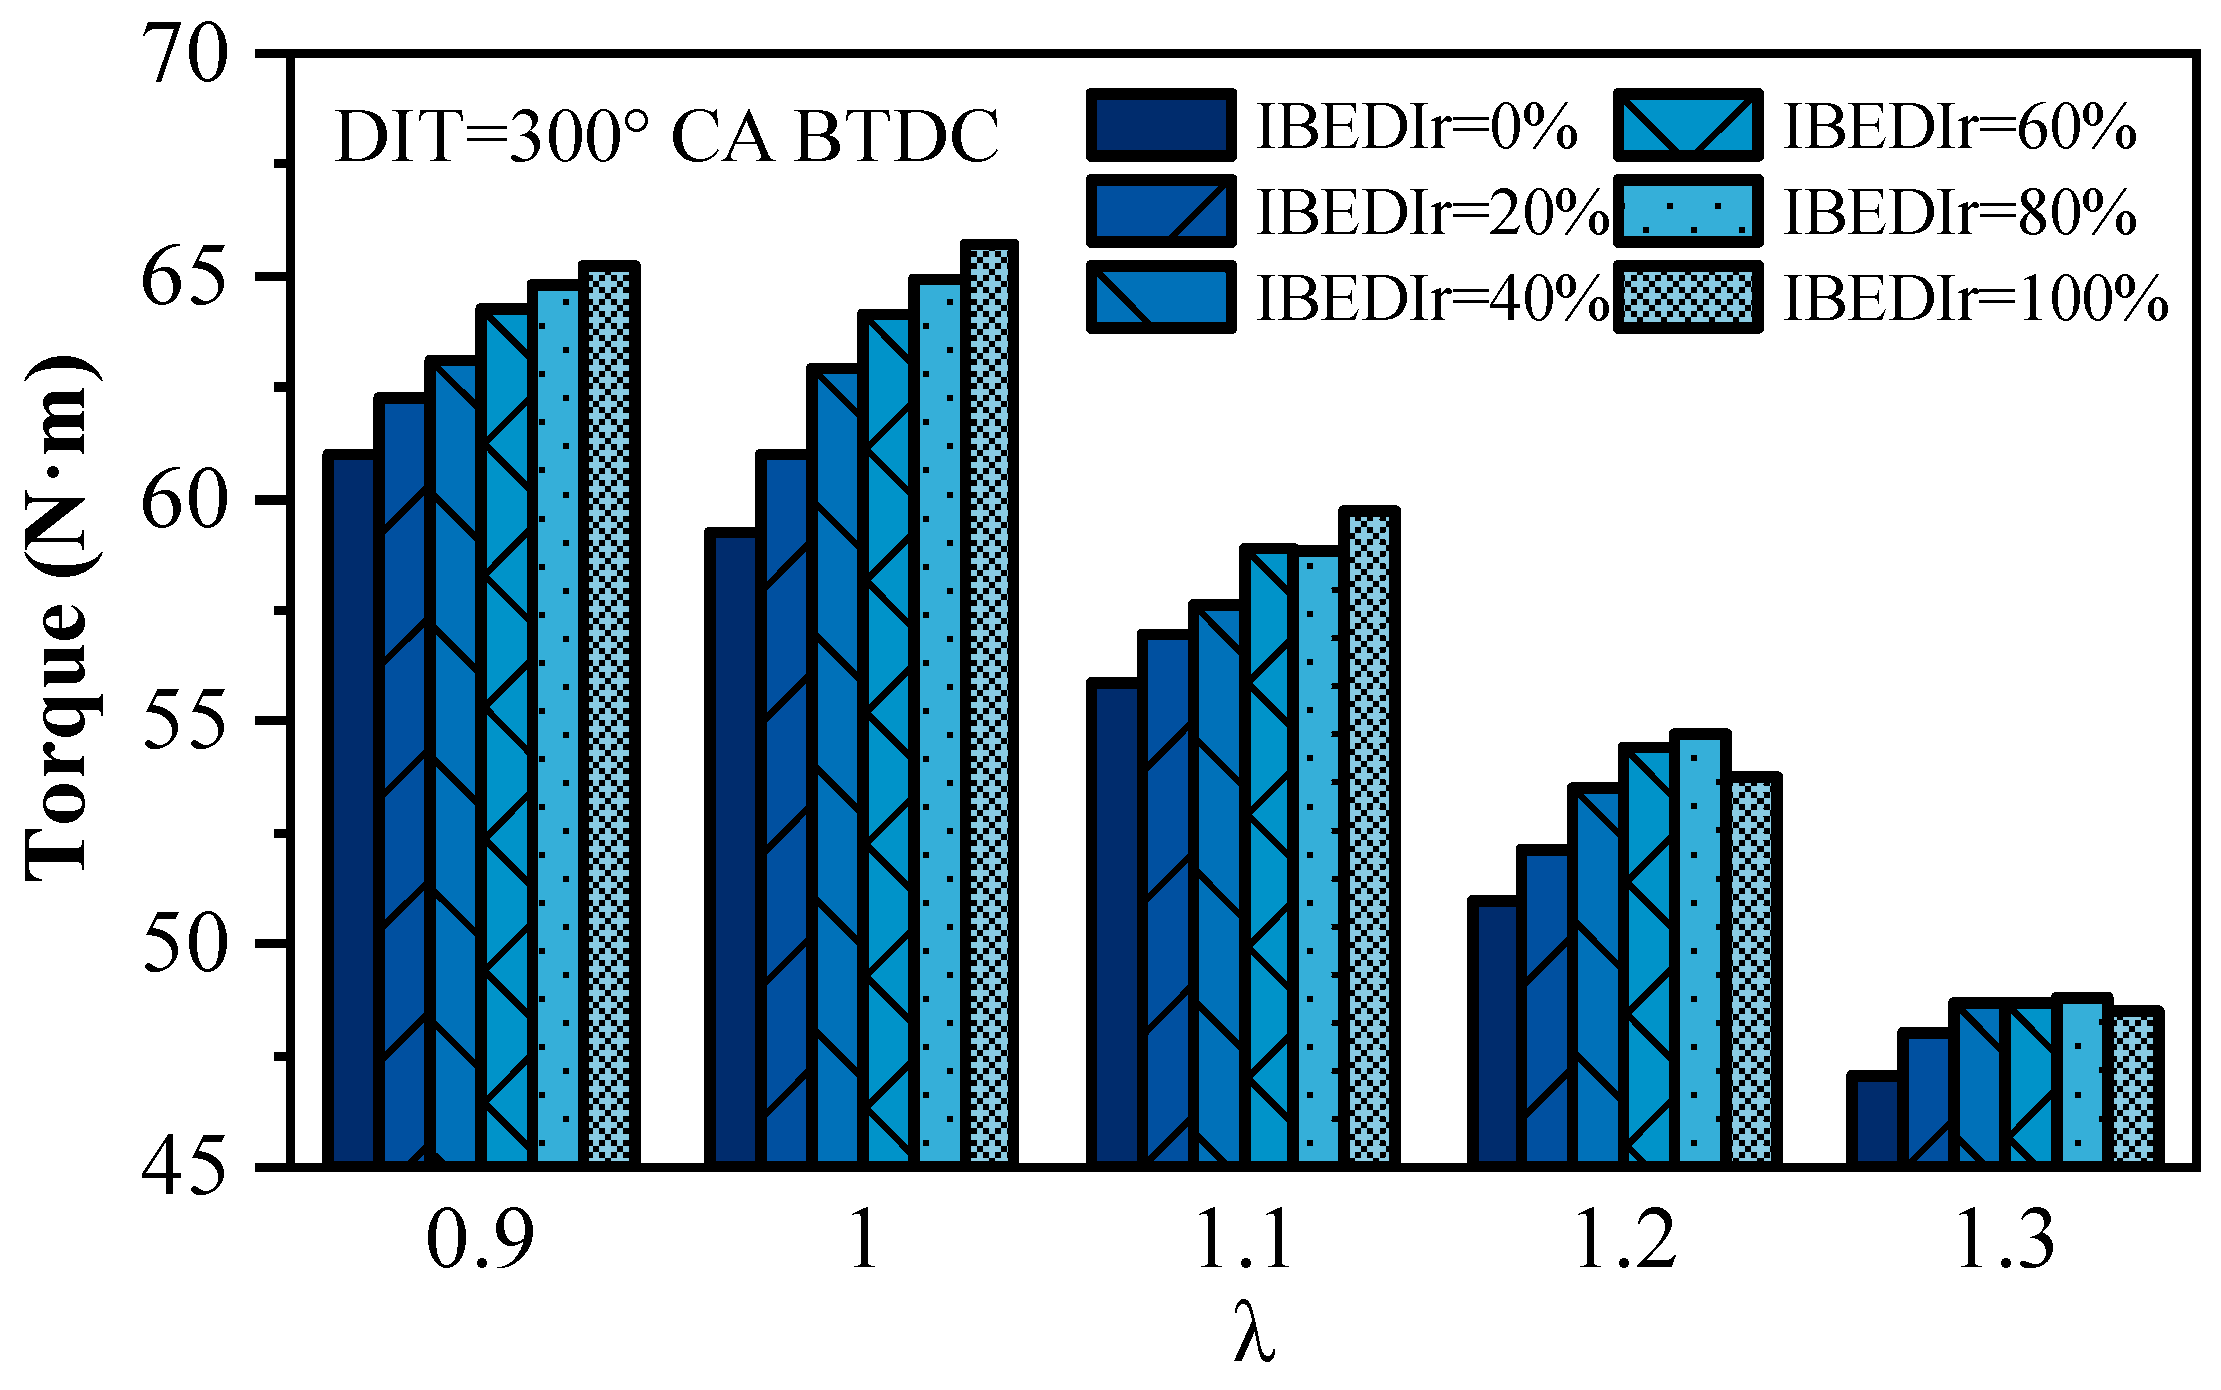
Figure 6 shows the torque at the injection timing of 300° CA BTDC under different λ and IBEDIr conditions. The torque continuously increases with increasing IBEDIr when λ = 0.9–1.1. However, when λ = 1.2–1.3, the torque first increases and then decreases with increasing IBEDIr, reaching its maximum at IBEDIr = 80%. Under lean burn conditions, if the fuel of IBEDIr = 100% cannot fully evaporate and mix uniformly, it will lead to locally leaner mixtures that are prone to misfire. Therefore, under lean burn conditions, the homogeneous mixture formed by a small amount of gasoline port injection can effectively ensure stable flame propagation, and the combustion-promoting effect of IBE can be further highlighted, resulting in maximum torque at IBEDIr = 80%. At λ = 0.9–1.1, since the mixture is richer, increasing the IBE injection quantity continuously promotes combustion, thus achieving maximum torque at IBEDIr = 100%. In summary, with early IBE injection, the IBE direct injection ratio should be appropriately reduced as the excess air ratio increases.

3.2. Gaseous Emissions

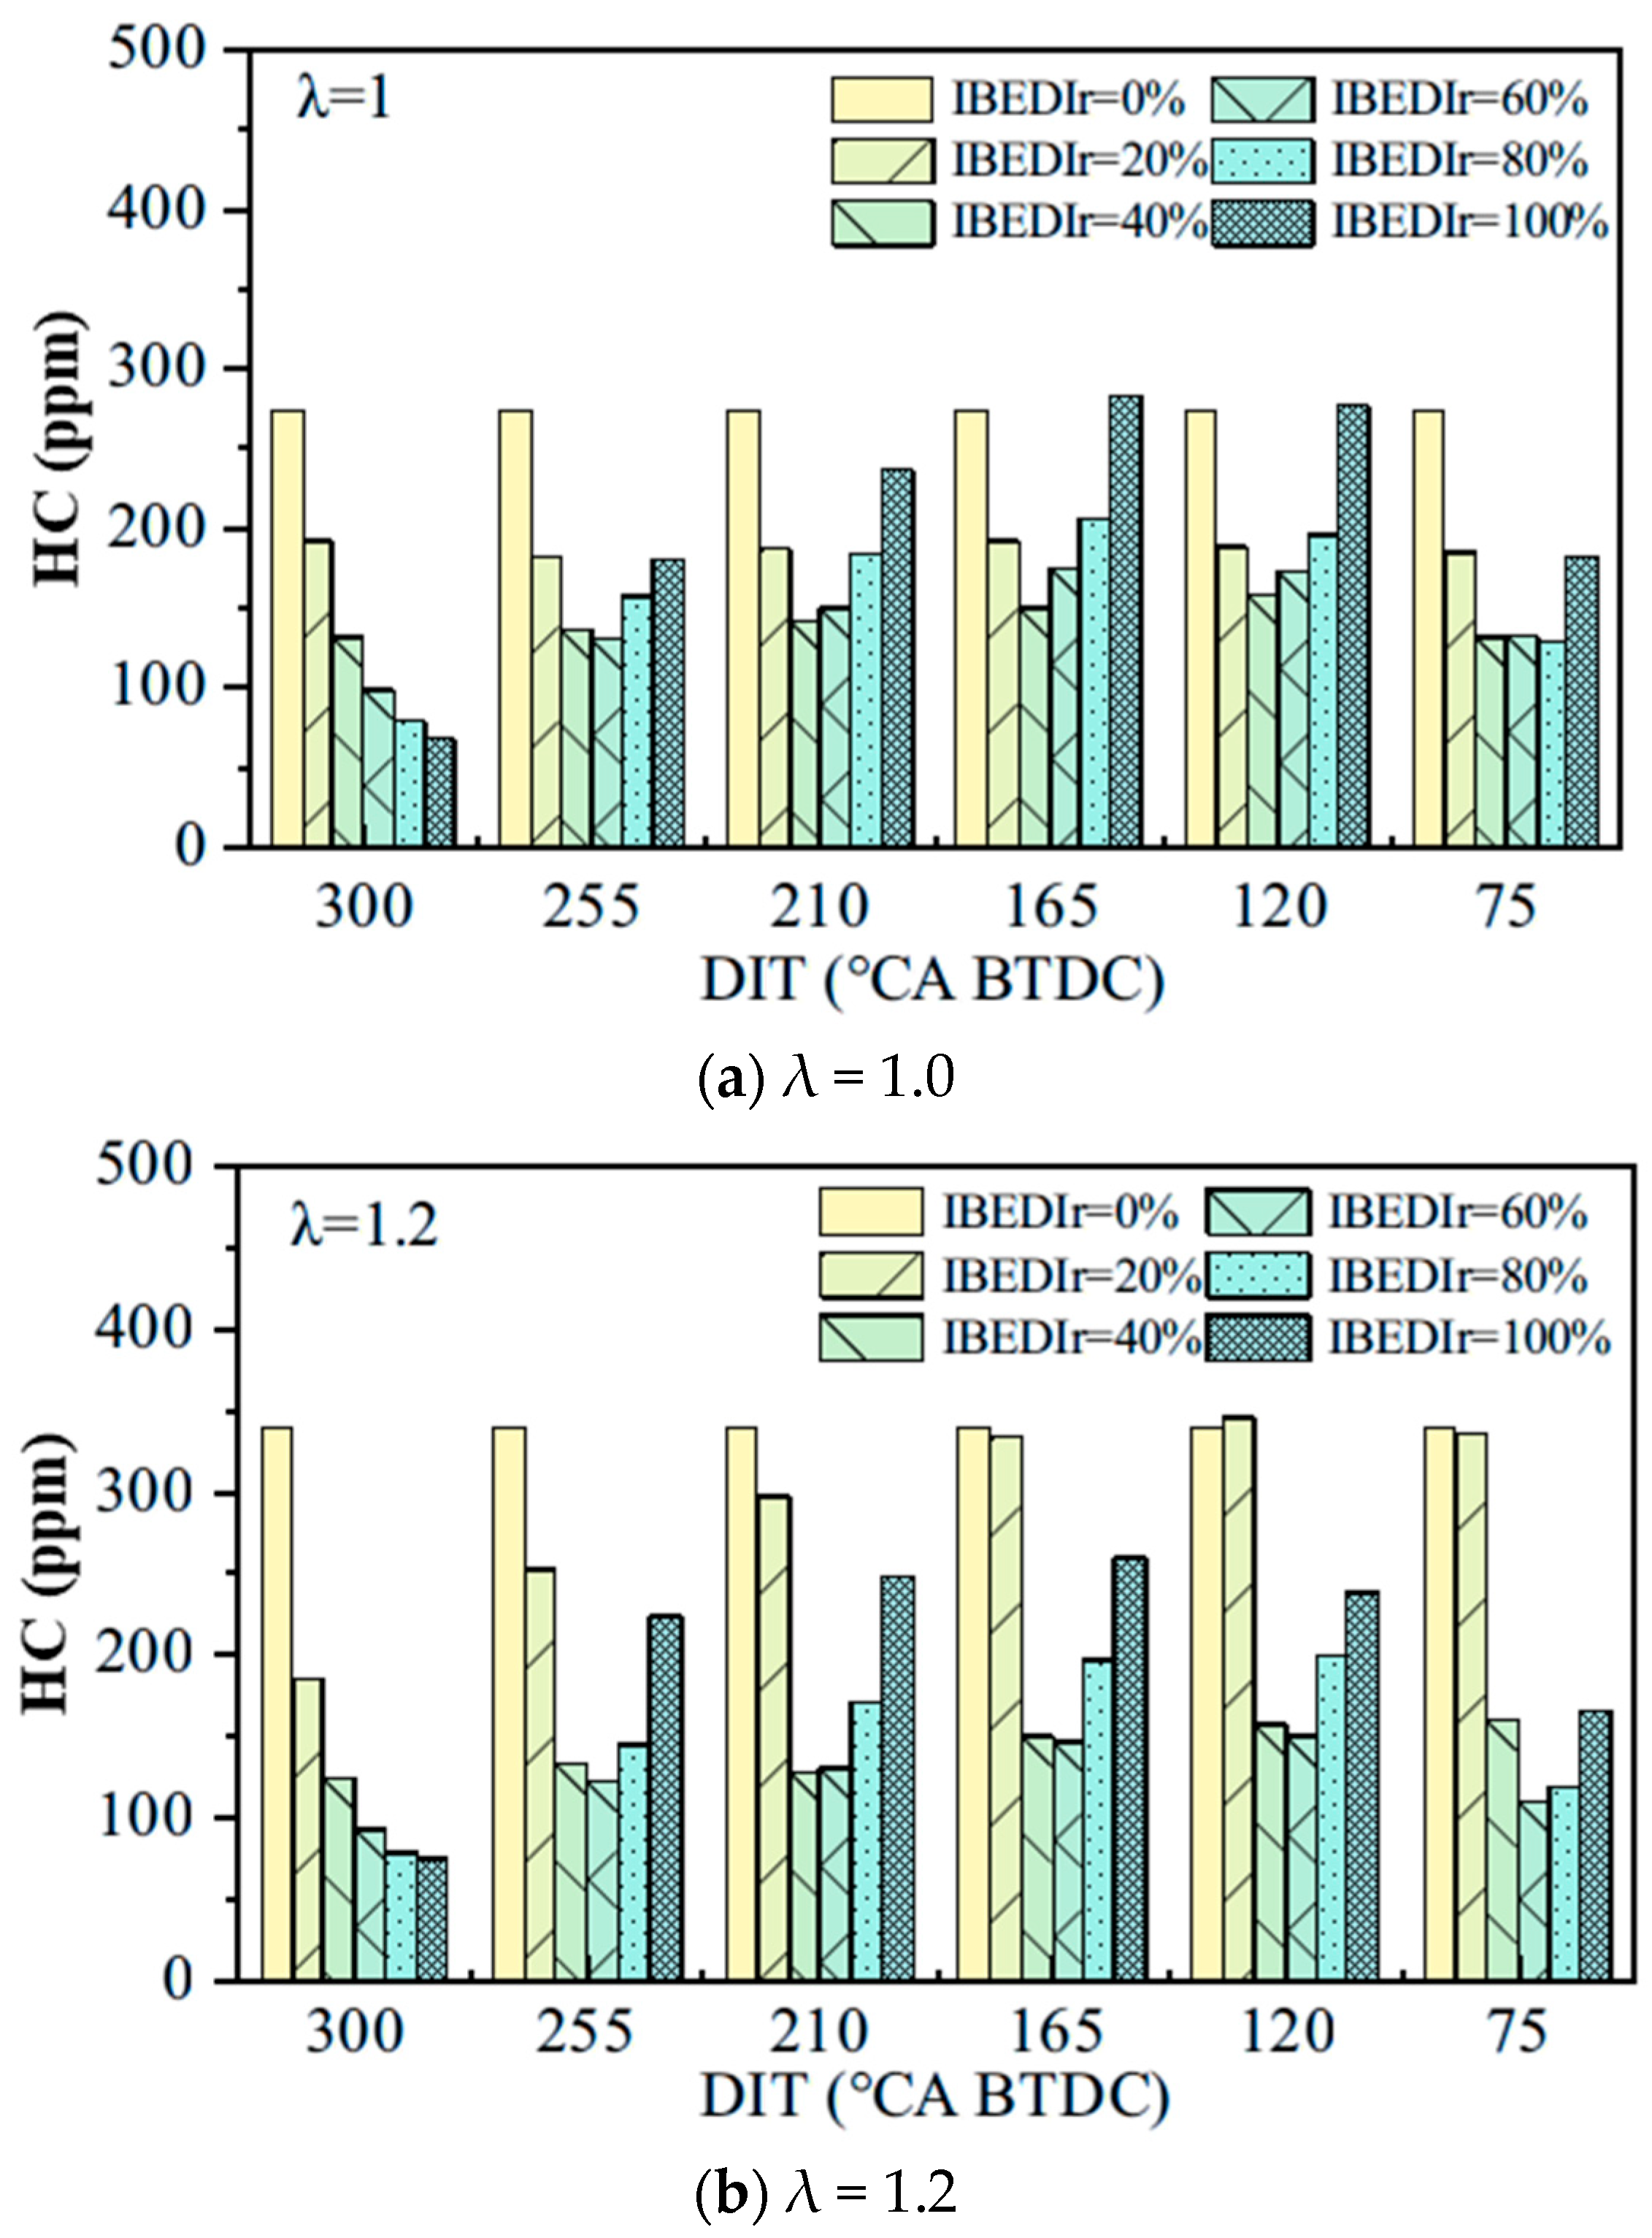
Figure 7 illustrates how HC emissions change with variations in DIT and IBEDIr under λ values of 1 and 1.2. At a DIT of 300° CA BTDC, HC emissions show a steady decline as IBEDIr increases. This trend occurs because an early direct injection timing allows sufficient time for IBE to evaporate and mix with the intake charge. The inherent properties of IBE, including its high oxygen content and fast flame propagation speed, facilitate more thorough combustion, reduce the flame quenching layer and accelerate HC oxidation; thus, HC emissions continue to decrease. Except for DIT = 300° CA BTDC, HC emissions first decrease and then increase with increasing IBEDIr, reaching minimum values at 40% or 60% IBEDIr. Because when DIT decreases, IBE is injected into the cylinder later, resulting in shorter evaporation and mixing time and a non-uniform mixture. Local fuel-rich regions tend to cause incomplete combustion, so HC emissions increase at high IBEDIr. At λ = 1, the minimum HC emissions generally correspond to 40% IBEDIr, while at λ = 1.2 they are concentrated at 60% IBEDIr. This is because, as the excess air ratio increases, the fuel injection quantity decreases, alleviating the mixture non-uniformity, so the IBEDIr corresponding to minimum HC emissions increases.
With retarded injection timing, HC emissions generally show a trend of first increasing and then slightly decreasing. This occurs because delayed injection timing shortens the evaporation and mixing time of IBE, thereby promoting incomplete combustion and increased HC emissions. However, when the direct injection timing is at 75° CA BTDC, HC emissions are slightly lower compared to 120° CA BTDC. This reduction is attributed to the severely stratified mixture caused by the short mixing time of IBE at 75° CA BTDC, where IBE begins combustion before fully diffusing throughout the cylinder and this condition reduces wall-quenching-induced HC emissions. In addition, the late injection timing will result in a delayed combustion phase, which will promote the post-oxidation of HC and reduce HC emissions. Nevertheless, HC emissions at 75° CA BTDC remain significantly higher than those observed at the 300° CA BTDC.
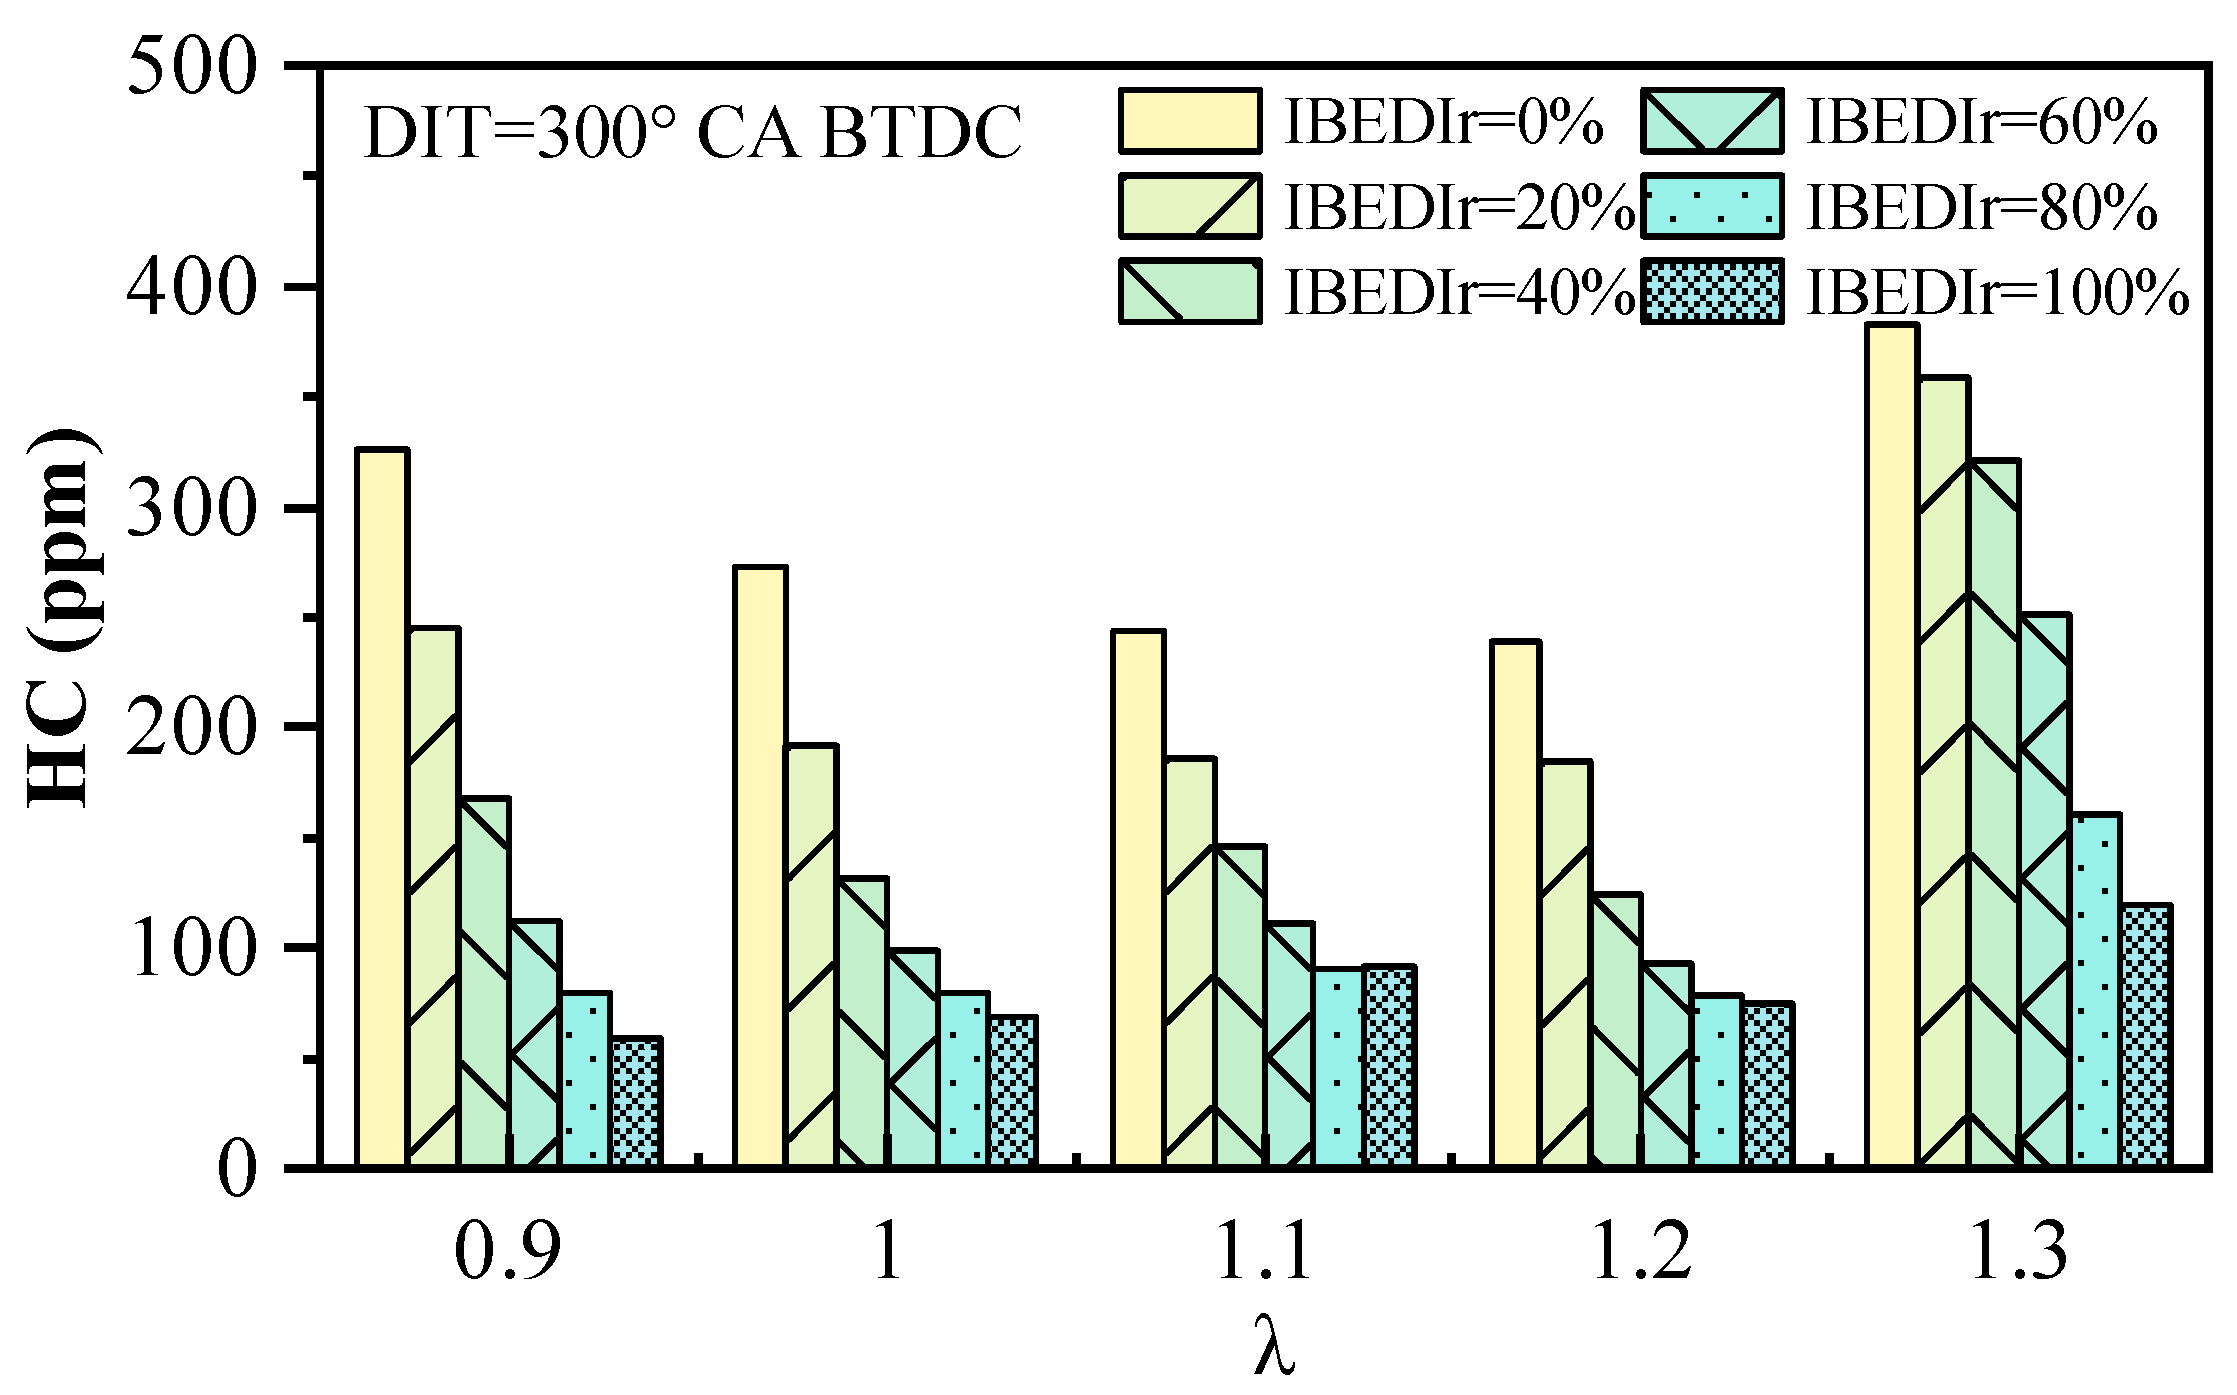
Since HC emissions were generally lower at DIT = 300° CA BTDC, Figure 8 further illustrates the variation in HC emissions with IBEDIr and λ at this injection timing. According to the figure, HC emissions consistently decrease with increasing IBEDIr across different λ values, indicating that under early injection conditions, IBE achieves more uniform evaporation and mixing, demonstrating the advantages of pure IBE. At 100% IBEDIr, HC emissions were reduced by 82%, 75%, 63%, 69%, and 69%, respectively, compared to pure gasoline under λ = 0.9–1.3. This indicates that IBE plays a greater role in lowering HC emissions when the engine operates under rich combustion conditions. With increasing λ, HC emissions first decrease and then increase, reaching their minimum at λ = 1.2. This is due to the relatively abundant oxygen at λ = 1.2, which promotes more complete fuel combustion and enhances post-oxidation of HC. However, when λ = 1.3, HC emissions increase significantly. This is attributed to the overly lean mixture at this condition, where flame quenching and misfire may lead to a substantial increase in unburned HC emissions.
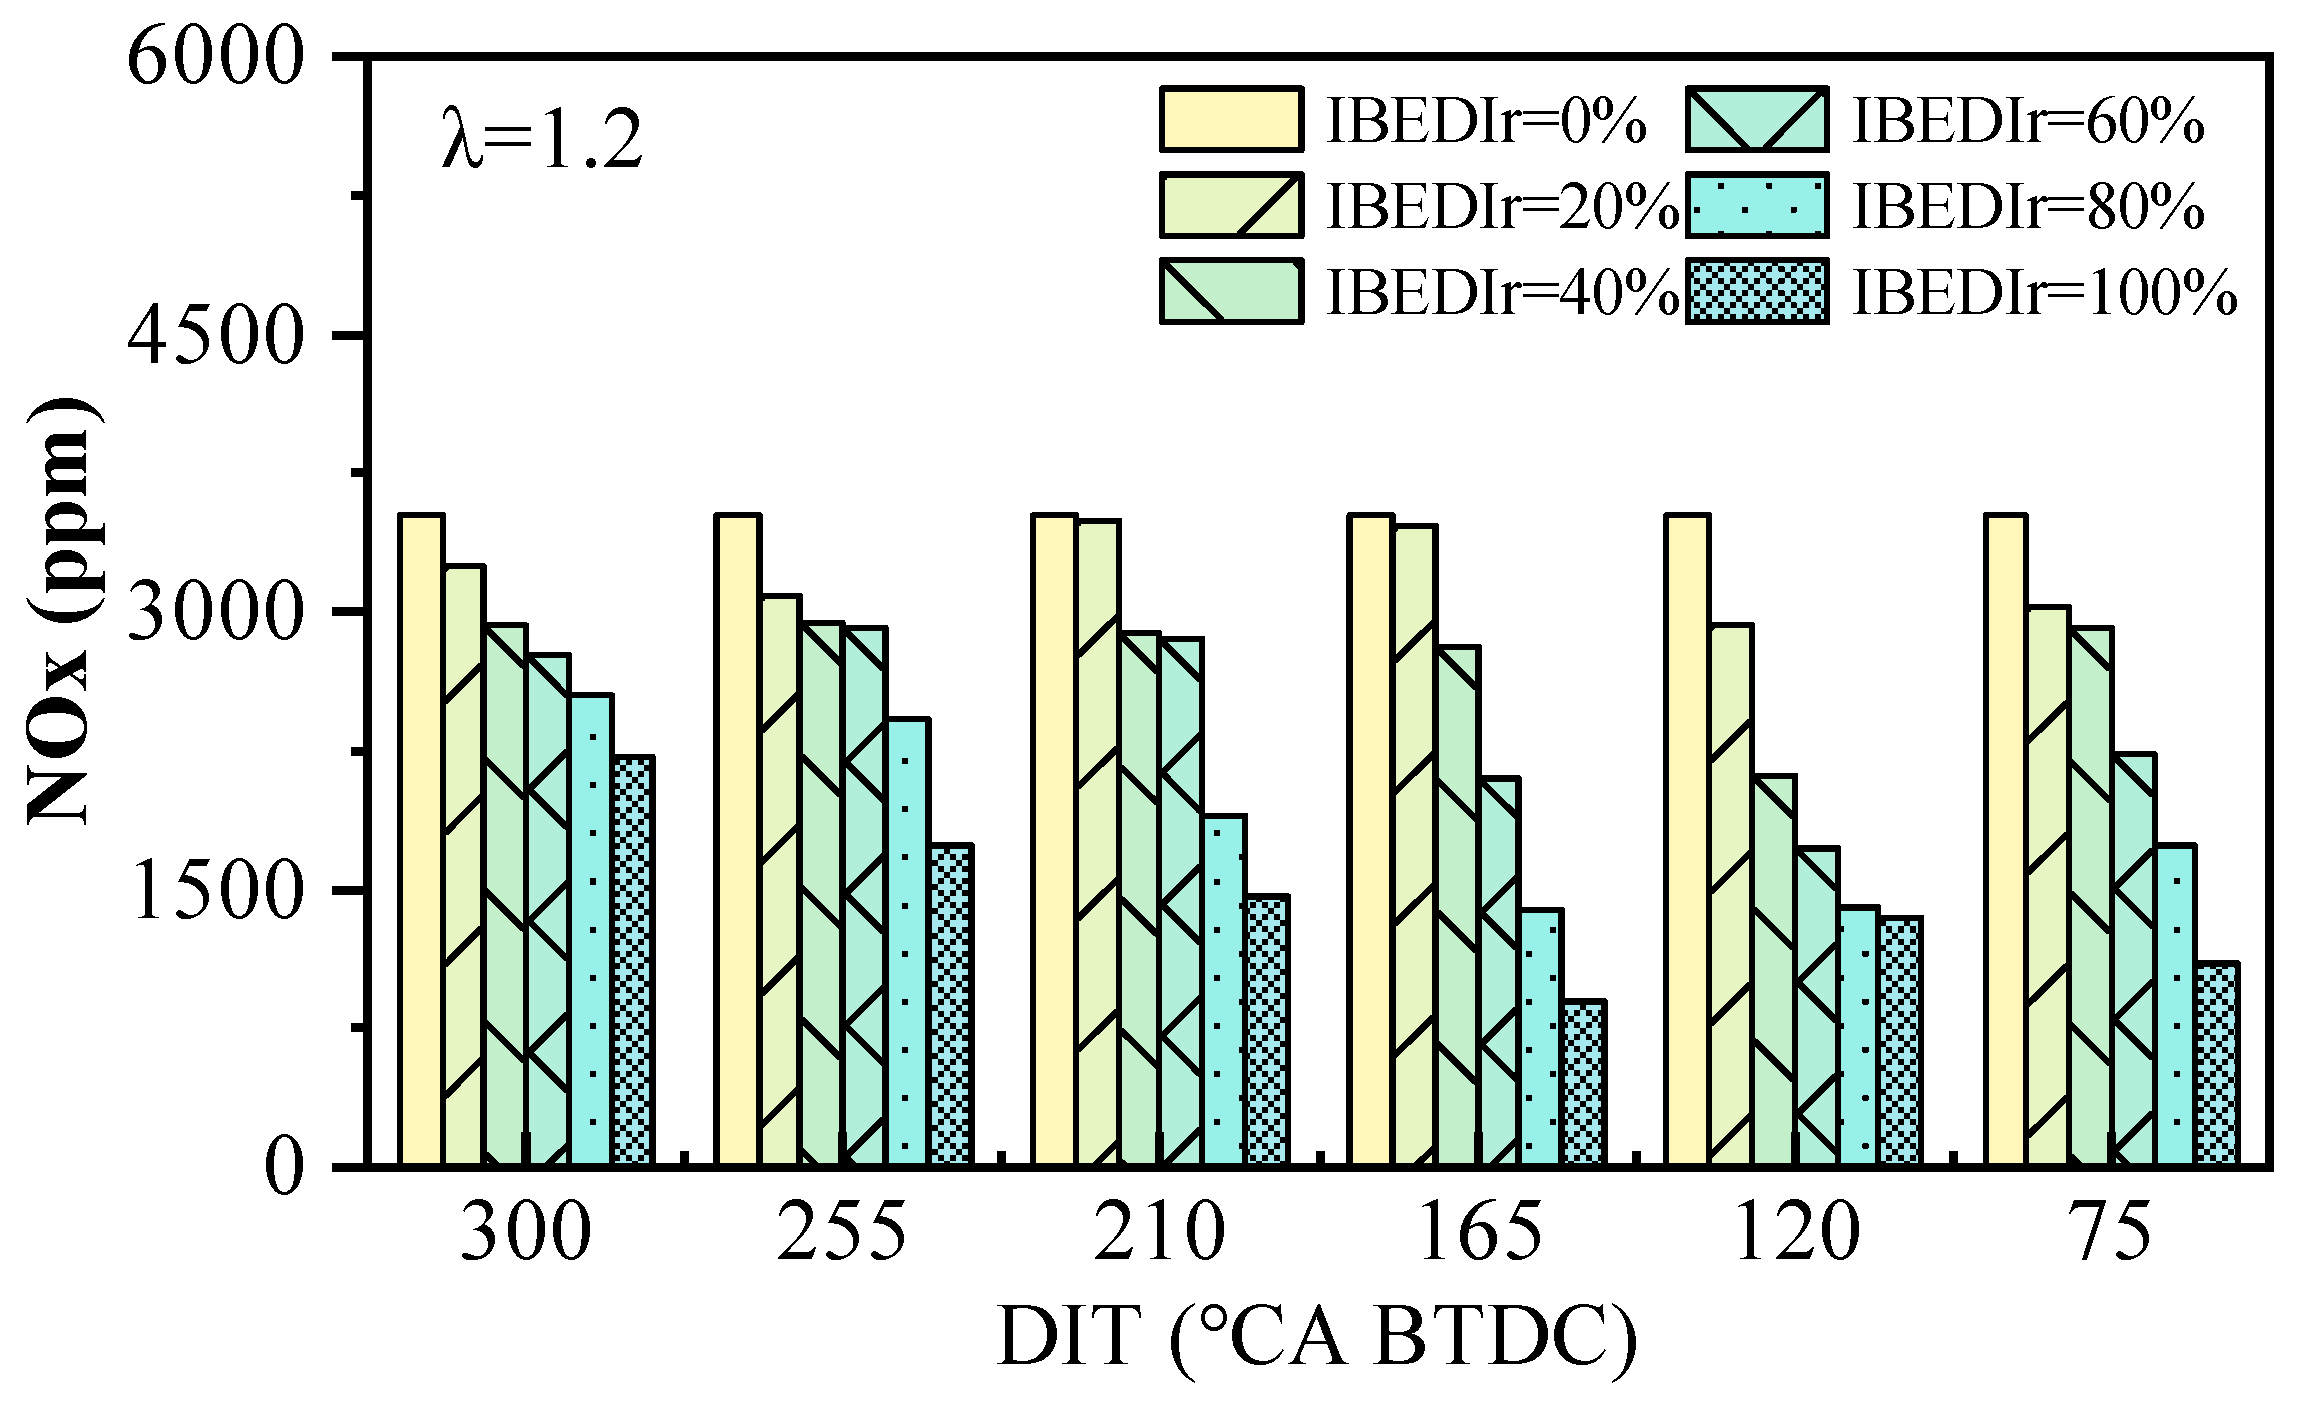
Figure 9 presents the NOx emissions under different DIT and IBEDIr conditions at λ = 1.2, where NOx emissions are relatively high under lean combustion. The results demonstrate that NOx emissions continuously decrease with increasing IBEDIr. This reduction trend is attributed to three key characteristics of IBE: (1) greater heat absorption during vaporization, and (2) a reduced adiabatic flame temperature relative to gasoline, and (3) higher specific heat capacity of combustion products, all of which contribute to lower in-cylinder temperatures and consequently reduced NOx formation. Notably, when IBEDIr exceeds 60%, the NOx reduction becomes more pronounced. This enhanced effect primarily results from two factors: (1) significant torque reduction beyond 60% IBEDIr means combustion deterioration, thus lower combustion temperatures, and (2) the substantial amount of directly injected IBE absorbs in-cylinder heat, causing a marked temperature drop that further suppresses NOx formation. Additionally, with retarded DIT, NOx emissions generally exhibit a trend of first decreasing and then increasing. This pattern occurs because moderately retarded injection timing can reduce in-cylinder temperature, but excessive retardation leads to incomplete combustion and localized high-temperature zones that promote NOx formation. The optimal DIT for NOx reduction appears to be in the intermediate range.
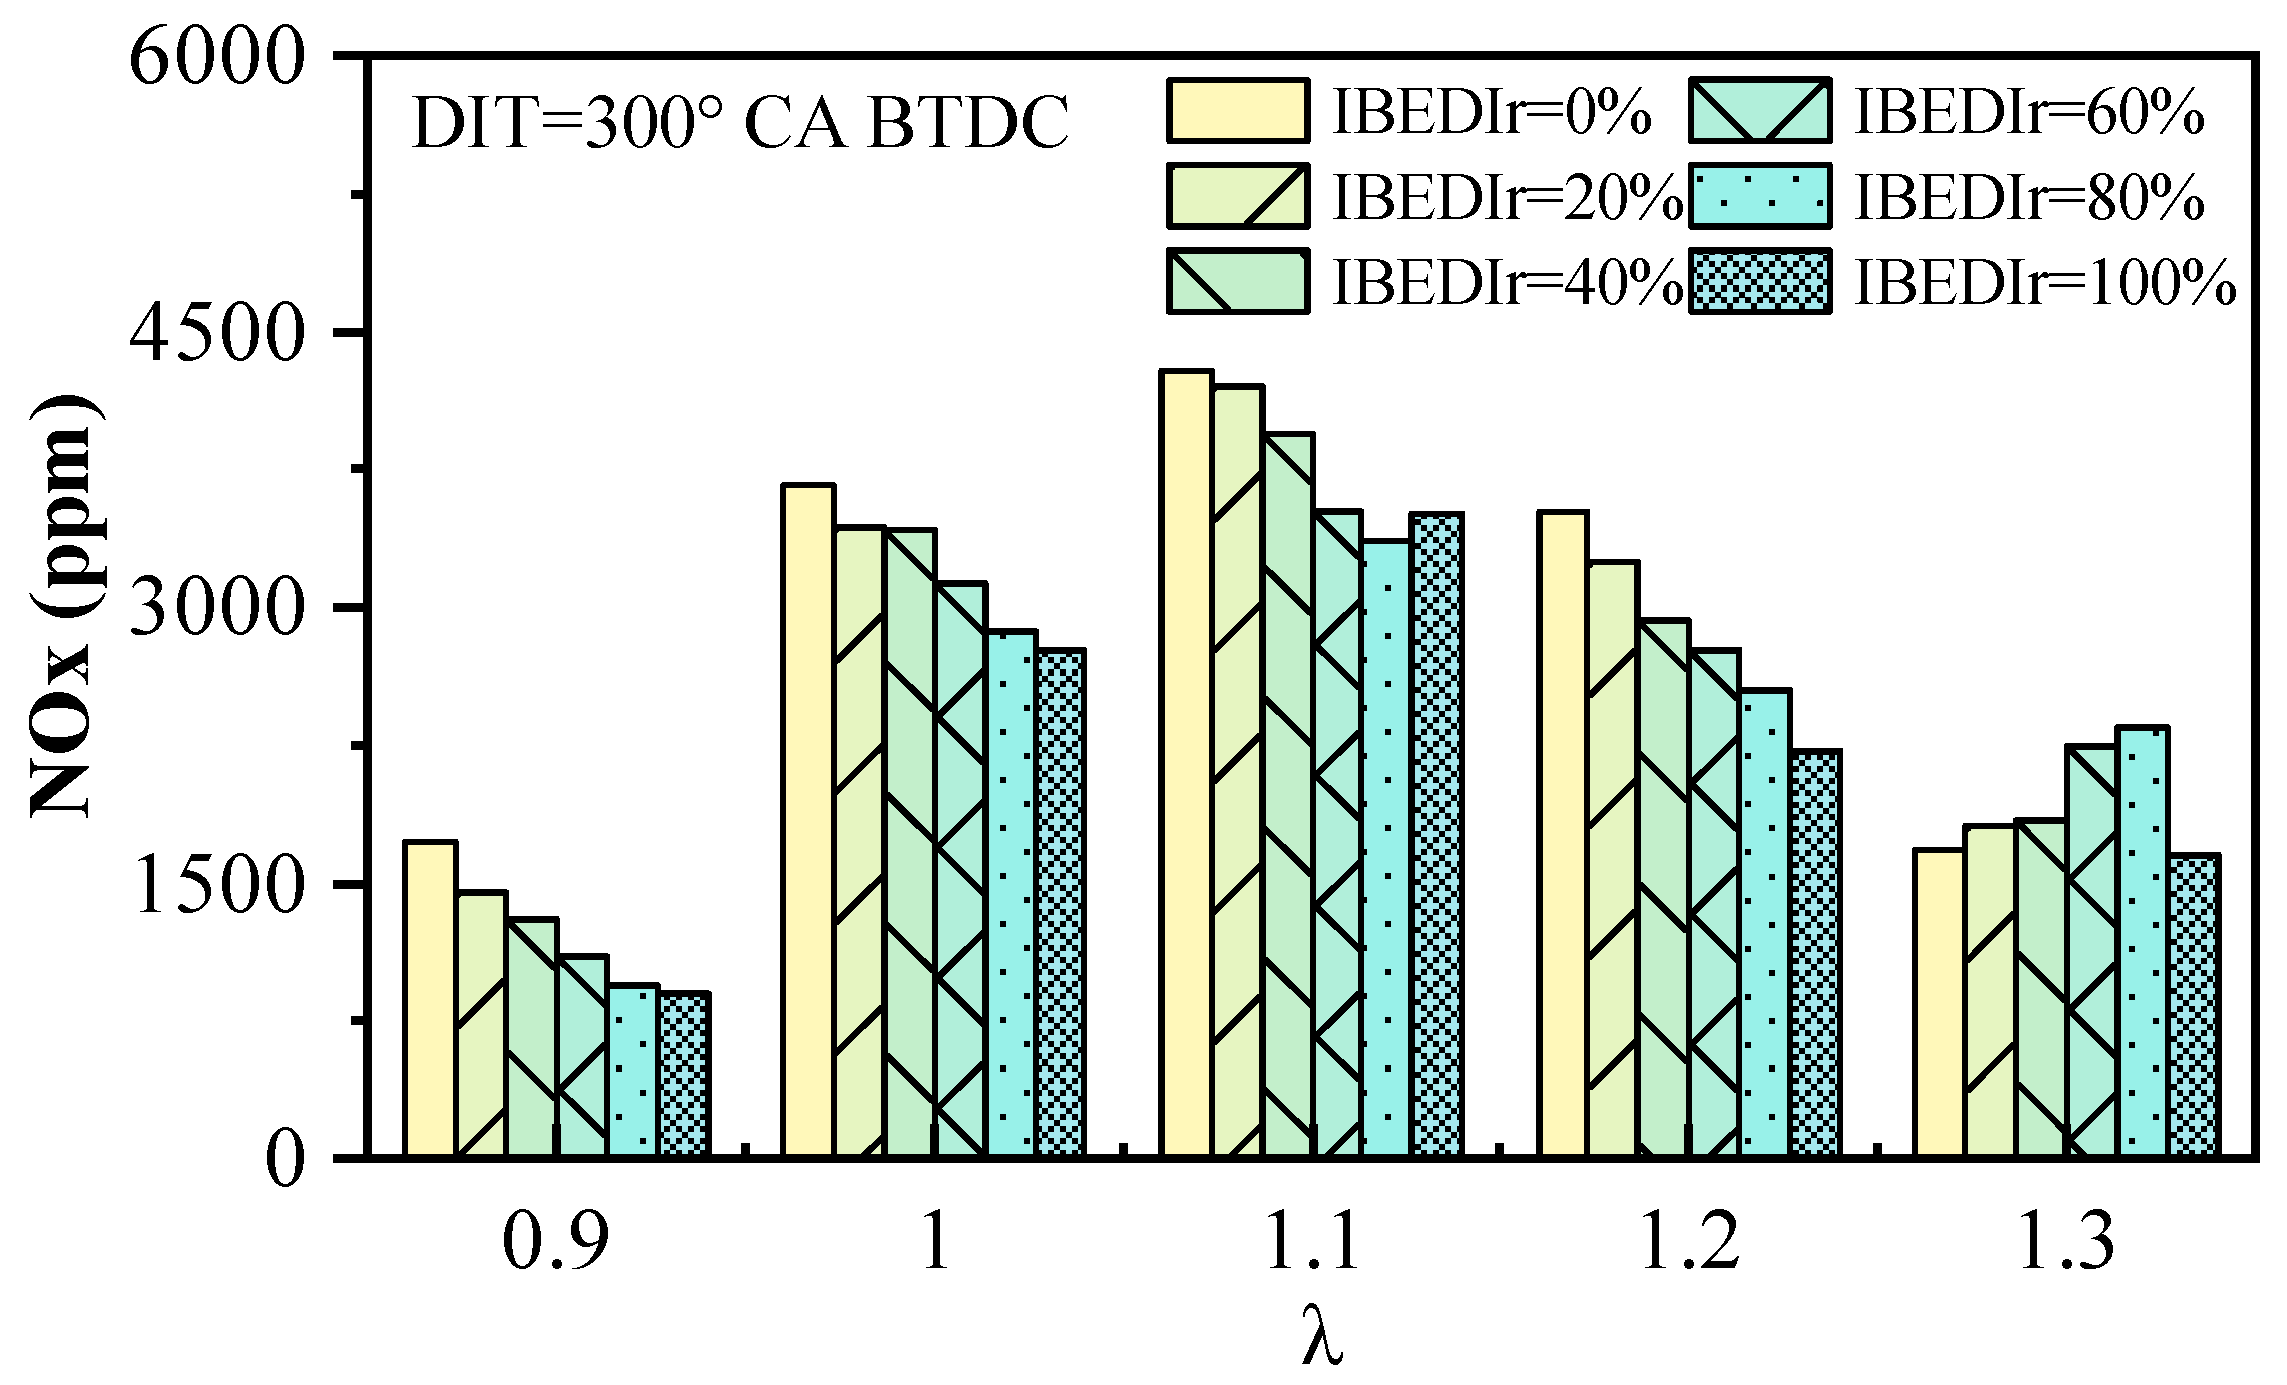
Figure 10 presents the NOx emission characteristics under different λ conditions at DIT = 300° CA BTDC. The NOx emissions exhibit a continuous decreasing trend with increasing IBEDIr when λ = 0.9–1.2. This reduction is attributed to three main factors: (1) The IBE directly injected into the cylinder extracts more heat from the charge because of its high latent heat of vaporization, resulting in a lower in-cylinder temperature. (2) Since IBE has a lower adiabatic flame temperature than gasoline, it reduces the combustion temperature, which in turn limits the generation of NOx emissions. (3) IBE’s lower stoichiometric excess air ratio causes the total dual-fuel mass to increase with IBEDIr, resulting in greater combustion product mass and higher specific heat capacity, which further reduces in-cylinder temperatures. The combined effect of these factors leads to decreasing NOx emissions with increasing IBEDIr. However, at λ = 1.3, NOx emissions initially increase and then decrease with IBEDIr, showing a similar trend to the torque characteristics in Figure 6. This behavior may be explained by the poor combustion stability under lean conditions, where higher torque indicates better combustion quality. In oxygen-rich environments, improved combustion corresponds to higher combustion temperatures, consequently generating more NOx emissions. The subsequent decrease in NOx at higher IBEDIr levels likely results from the cooling effects of IBE overcoming the temperature increase from improved combustion stability.
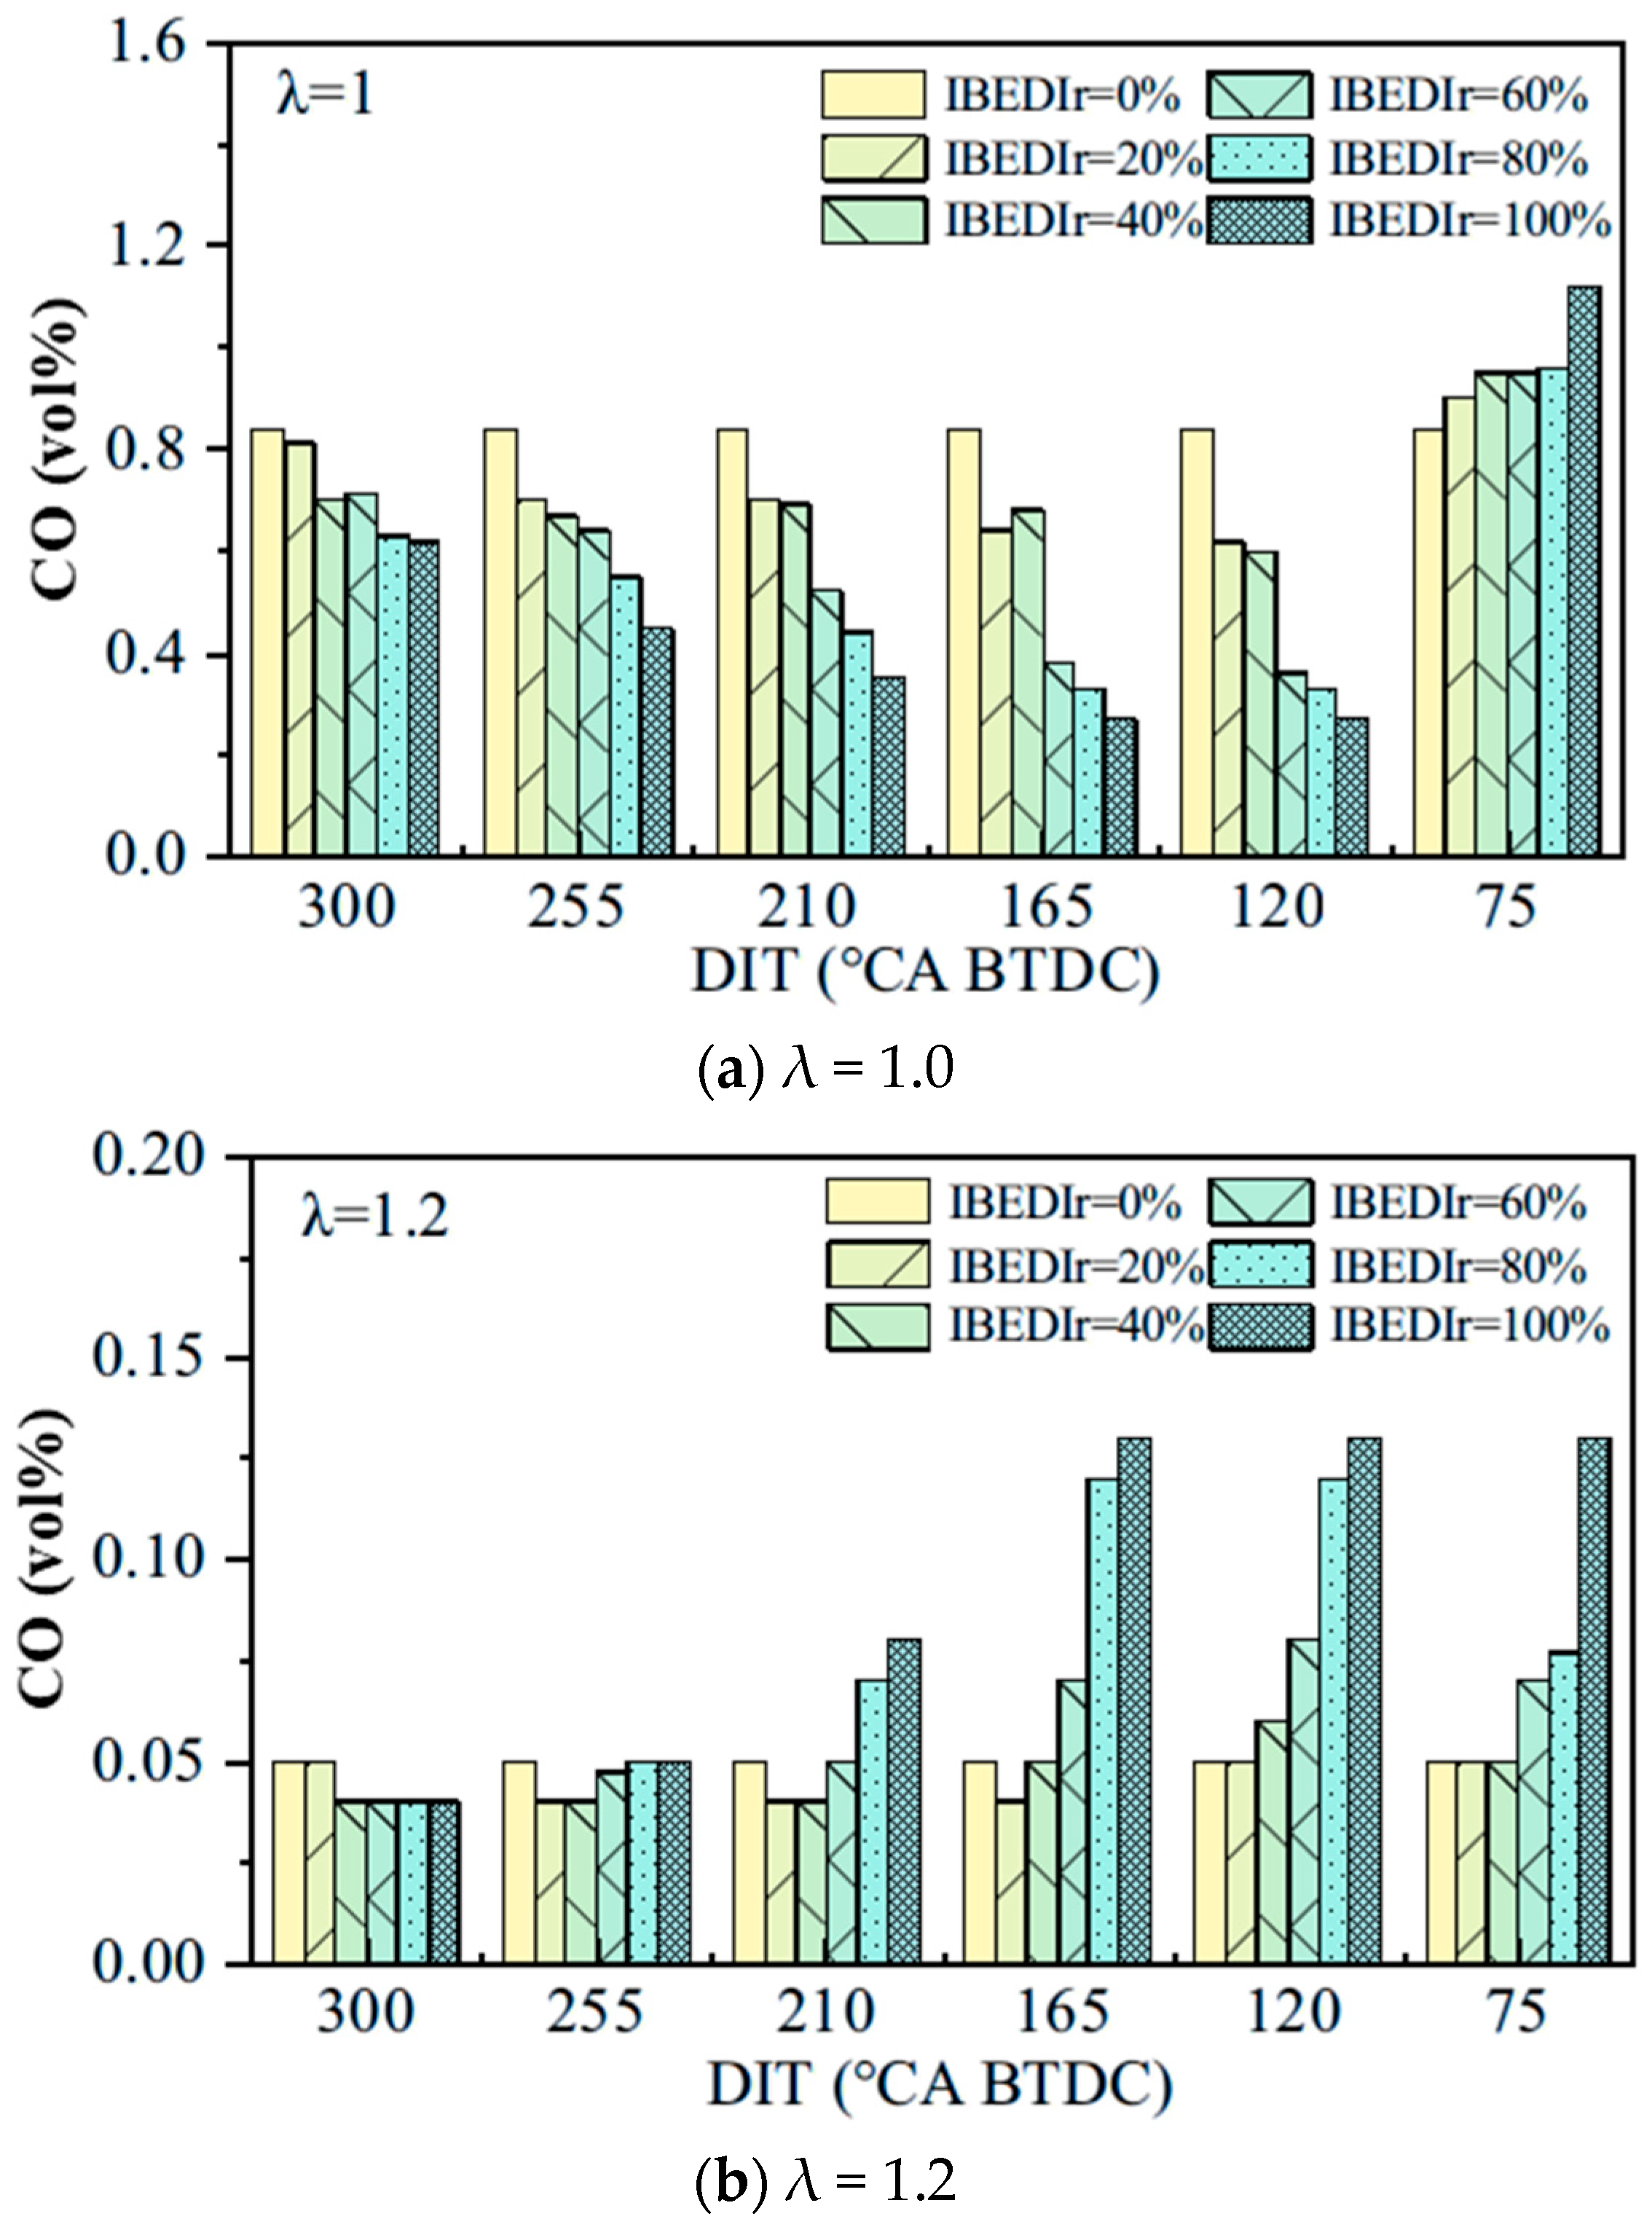
Figure 11a shows how CO emissions change with DIT and IBEDIr under stoichiometric conditions (λ = 1.0). It can be observed that when DIT = 300–120° CA BTDC, CO decreases with increasing IBEDIr. This is because oxygen is not sufficient under stoichiometric conditions, and the high oxygen content characteristic of IBE can suppress CO formation when IBEDIr increases. However, at DIT = 75° CA BTDC, the injection timing is excessively delayed, resulting in insufficient IBE mixing time and anoxic combustion, leading to a continuous increase in CO emissions with rising IBEDIr.
At higher λ values, CO emissions are lower due to the oxidation effect of ample oxygen. Thus, in Figure 11b, CO emissions under all conditions are below 0.15 vol%. It can be seen that at DIT = 300, CO decreases with increasing IBEDIr, while at DIT = 255–165° CA BTDC, CO emissions first decrease and then rise. When DIT = 120–75° CA BTDC, CO shows a continuous increasing trend. This indicates that increasing IBEDIr under early injection conditions can reduce CO emissions, attributed to its high oxygen content advantage. As the injection timing is delayed, CO emissions from high-IBEDIr fuels increase, primarily due to the inhomogeneous mixture caused by large amounts of IBE being injected into the cylinder at later DITs, resulting in localized oxygen-deficient combustion and increased CO. This phenomenon becomes more pronounced as the direct injection timing is further delayed. At DIT = 255, 210, and 165° CA BTDC, CO emissions for 100% IBEDIr increase by 0%, 60%, and 160%, respectively, compared to pure gasoline. When DIT is delayed to 120–75° CA BTDC, adding IBE no longer improves CO emissions, as the overly delayed direct injection timing leads to oxygen-deficient combustion in inhomogeneous mixtures, producing CO emissions. In summary, high-proportion IBE is suitable for early injection, and IBEDIr should be reduced as the direct injection timing is delayed.
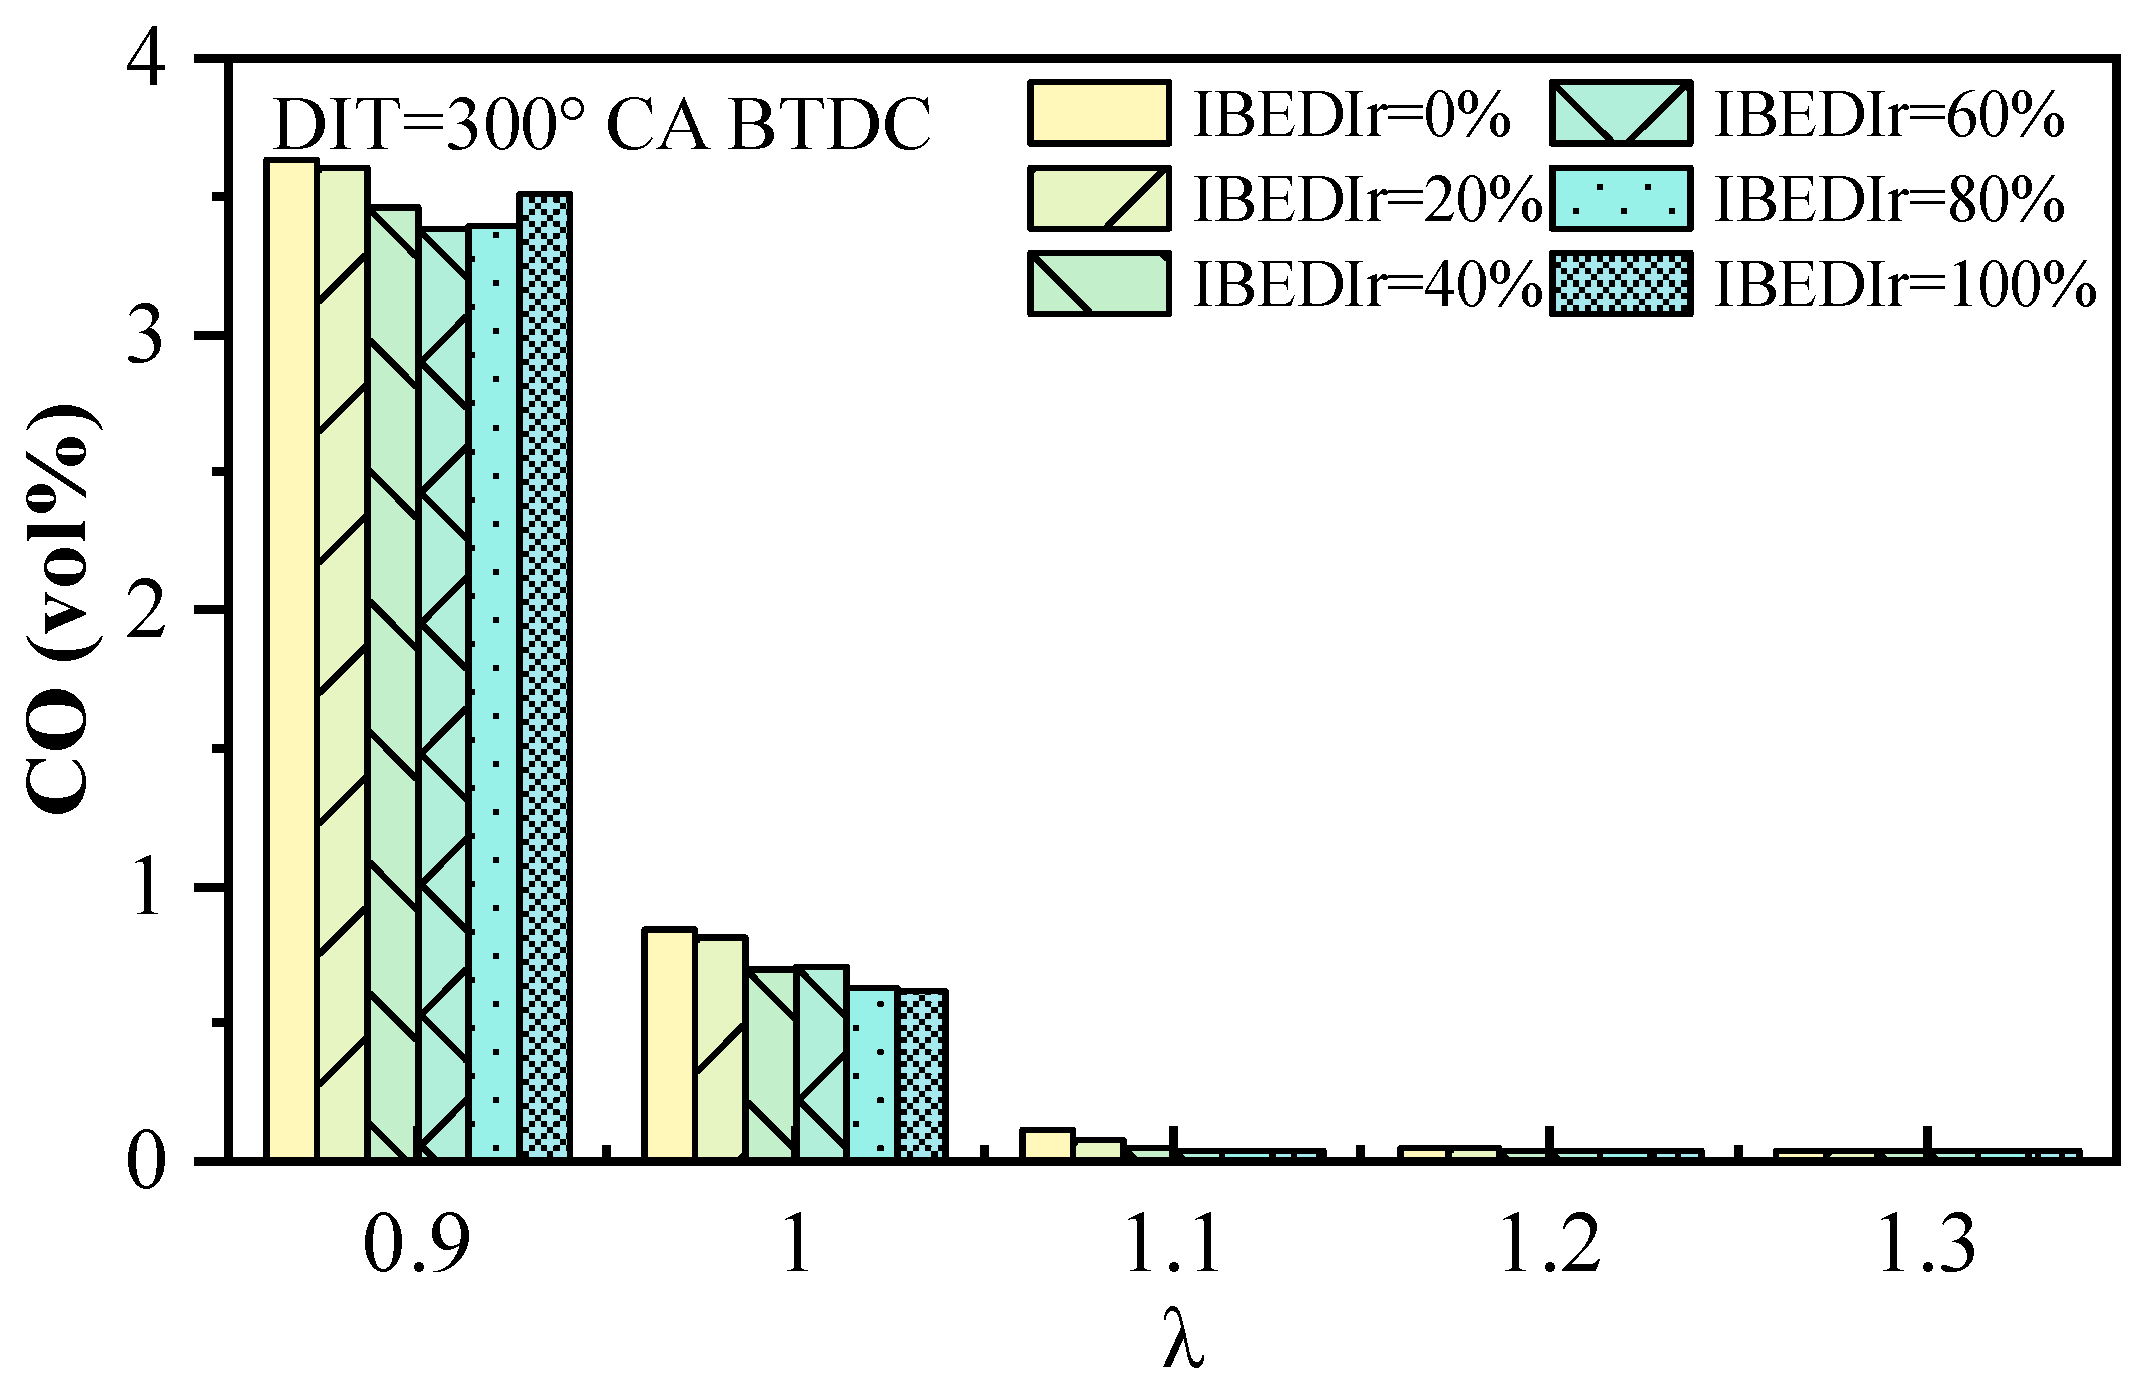
Figure 12 shows that when λ is between 1 and 1.3, CO almost decreases as IBEDIr increases. In addition, the CO emissions in this excess air coefficient range are extremely low. Because when the injection timing is earlier and the air–fuel mixture is not too rich, the mixture is relatively uniform. The oxygen-containing characteristics of IBE can reduce CO emissions after its addition. When λ is 0.9, CO emissions are relatively high. This is because in the rich mixture condition, the fuel injection amount is high and oxygen is insufficient, making it easy to form oxygen-deficient combustion in local fuel-enriched areas, thus causing CO generation. It can be observed that when λ > 1, CO emissions are very low. At λ = 0.9 and 1, CO emissions for IBE blends are lower than those for pure gasoline. Indicating that early injection of high proportions of IBE has advantages under stoichiometric and further expanded lean combustion conditions.

3.3. Particle Emissions

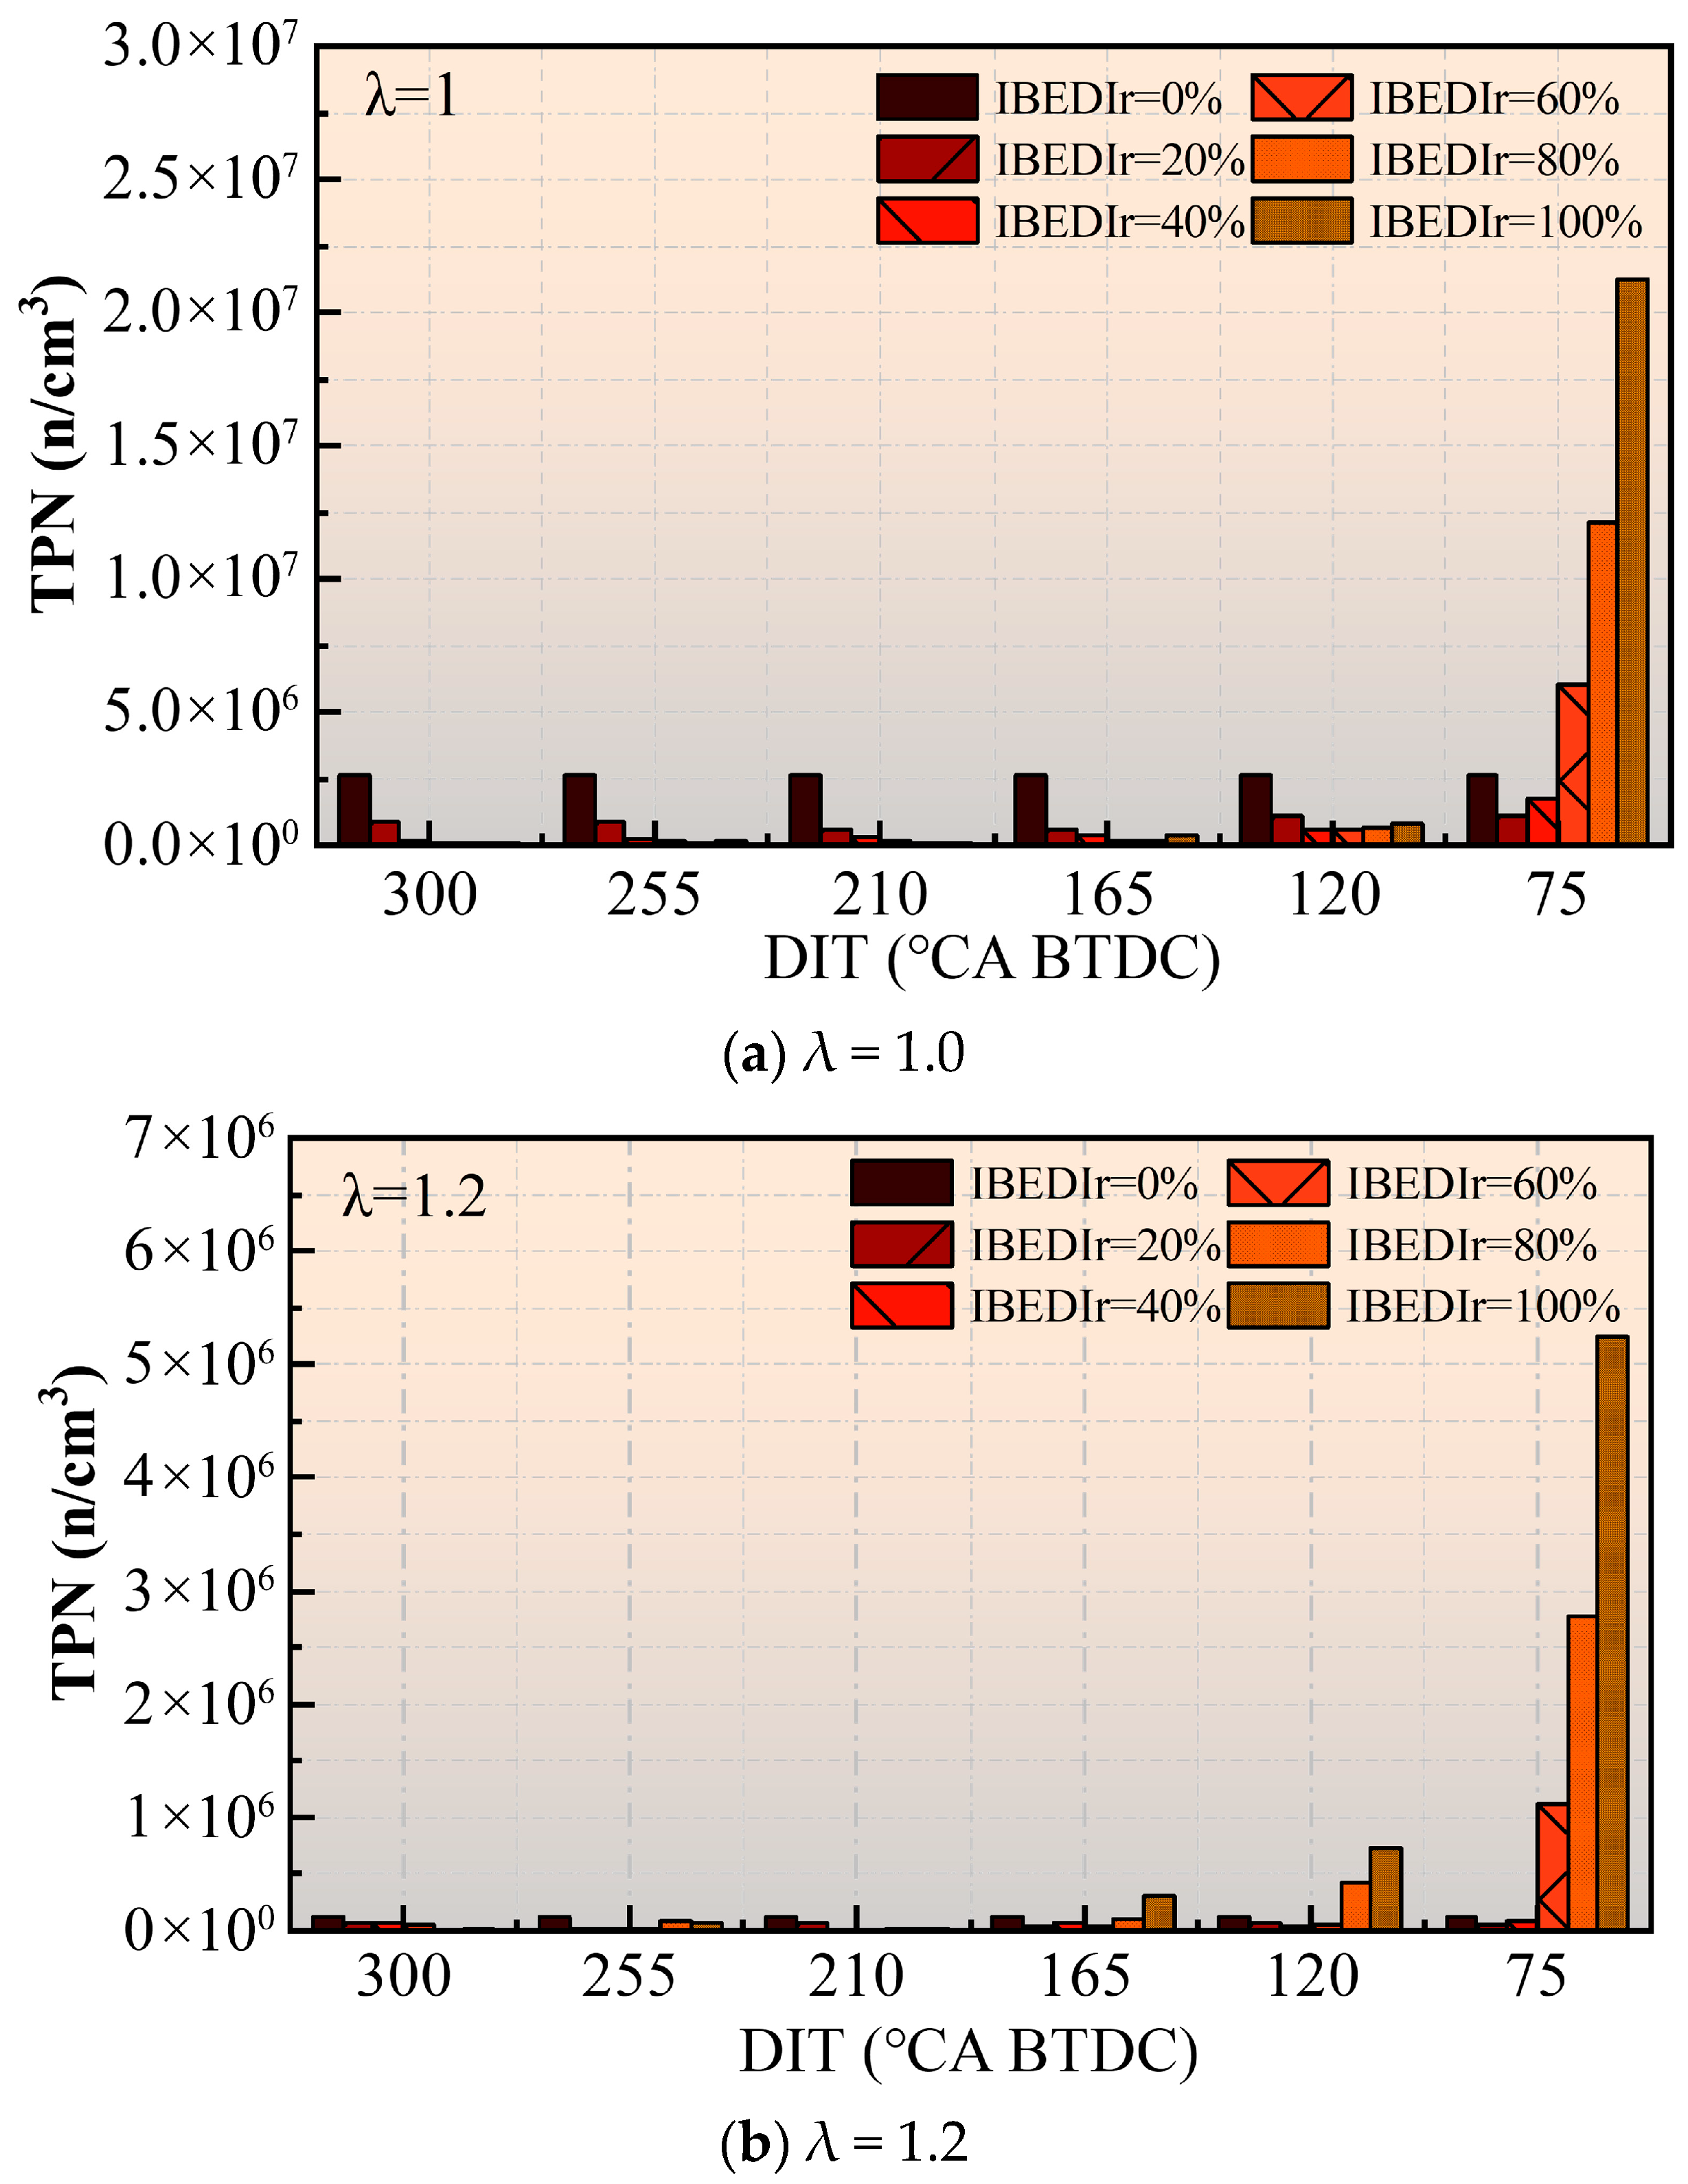
Figure 13 illustrates how PN changes with IBEDIr under various DIT conditions at λ = 1 and 1.2. As shown in Figure 13a, under the conditions of earlier DIT, the overall PN emissions are very low, and an increase in IBEDIr will also reduce PN emissions. When DIT is postponed to 120° CA BTDC and further postponed to 75° CA BTDC, PN emissions begin to increase significantly, especially at 75° CA BTDC, where the increase in IBEDIr leads to a sharp increase in PN emissions.
When DIT is earlier than 120° CA BTDC, the PN with IBE blending is lower than that of pure gasoline, and when DIT is earlier, the PN level is extremely low at high IBEDIr. This is because most particulates are formed in the high-temperature oxygen-deficient region of the flame front, and IBE can increase the oxygen content in the flame front, reducing the sooting tendency of reactants. At the same time, fuel with higher IBE content produces higher concentrations of active components such as OH during combustion, and the strong oxidation effect of OH radicals intensifies the oxidation of PAHs and soot. In addition, increasing IBEDIr means reducing the gasoline injection amount, which also inhibits PAH formation reactions. However, when IBEDIr is too high and DIT is too late, the non-uniform mixture leads to excessively high HC emissions, which causes a significant increase in particulate formation. Therefore, when IBEDIr exceeds 40% and DIT = 75° CA BTDC, PN increases sharply, even reaching ten times that of pure gasoline.
At λ = 1.2, the mixture is relatively lean; the PN of pure gasoline is already very low, but adding IBE under early injection conditions can still further reduce PN emissions. However, when DIT is 165° CA BTDC, the PN of pure IBE is higher than that of pure gasoline, and when DIT is 120° CA BTDC, the PN at 80% IBEDIr already exceeds that of pure gasoline. This indicates that under lean combustion conditions, high-IBEDIr fuel is less suitable for late injection. This may be because under lean conditions, the port fuel injection of gasoline forms a relatively uniform mixture, while increasing IBEDIr makes the direct-injected IBE prone to form non-uniform mixtures, thereby worsening particulate emissions. This phenomenon is particularly evident at DIT = 75° CA BTDC. Regardless of the excess air coefficient, increasing the IBE injection ratio under late DIT conditions will significantly increase particulate matter emissions. In response to the issue of particulate matter emissions and regulatory challenges, it is not recommended to continue increasing the proportion of IBE direct injection under late DIT conditions.
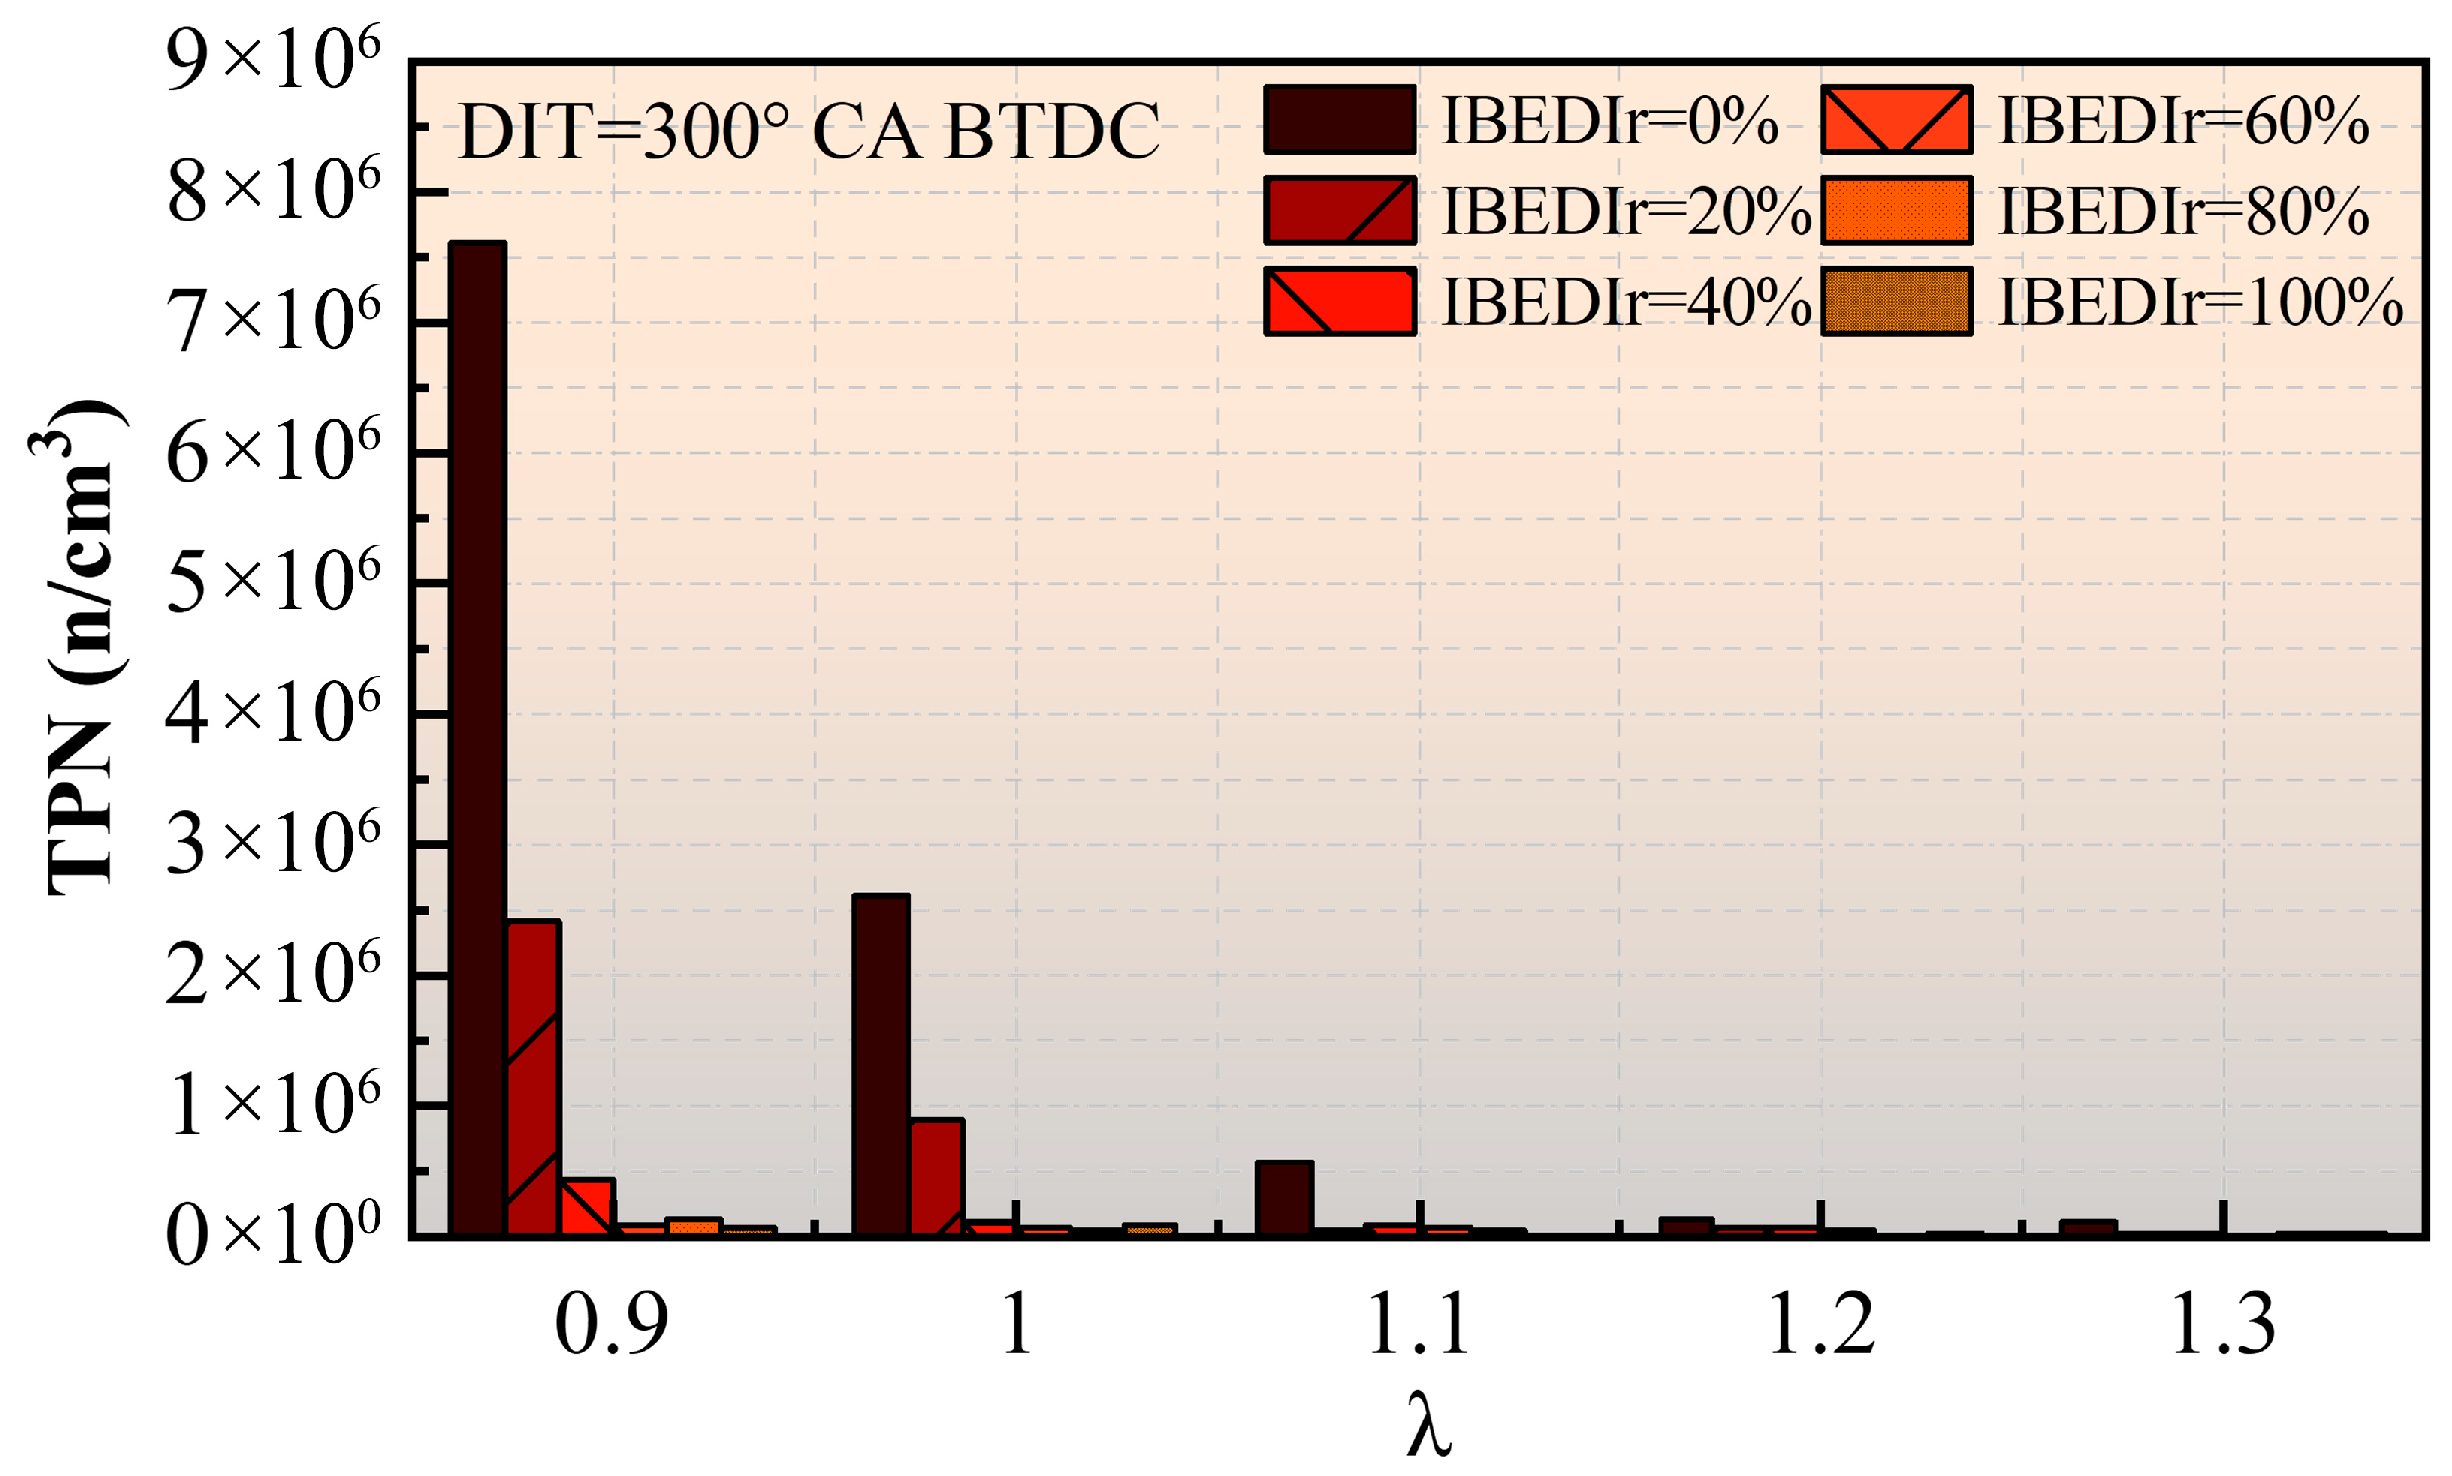
Figure 14 shows the variation in PN with IBEDIr under different λ conditions at DIT = 300° CA BTDC. As λ increases, PN continues to decrease, particularly at λ = 1.2 and 1.3, where PN emissions remain at extremely low levels. This demonstrates that lean combustion can significantly reduce PN emissions. When λ = 0.9 and 1, PN remains at very low levels only when IBEDIr exceeds 40%. In contrast, at λ = 1.2 and 1.3, even 20% IBE is sufficient to maintain PN at a low level. This indicates that under richer mixture conditions, increasing IBEDIr appropriately is necessary to achieve lower particulate emissions. In summary, with early injection timing (DIT = 300° CA BTDC), an IBEDIr above 40% is sufficient to maintain PN at a very low level at λ = 0.9–1.3.
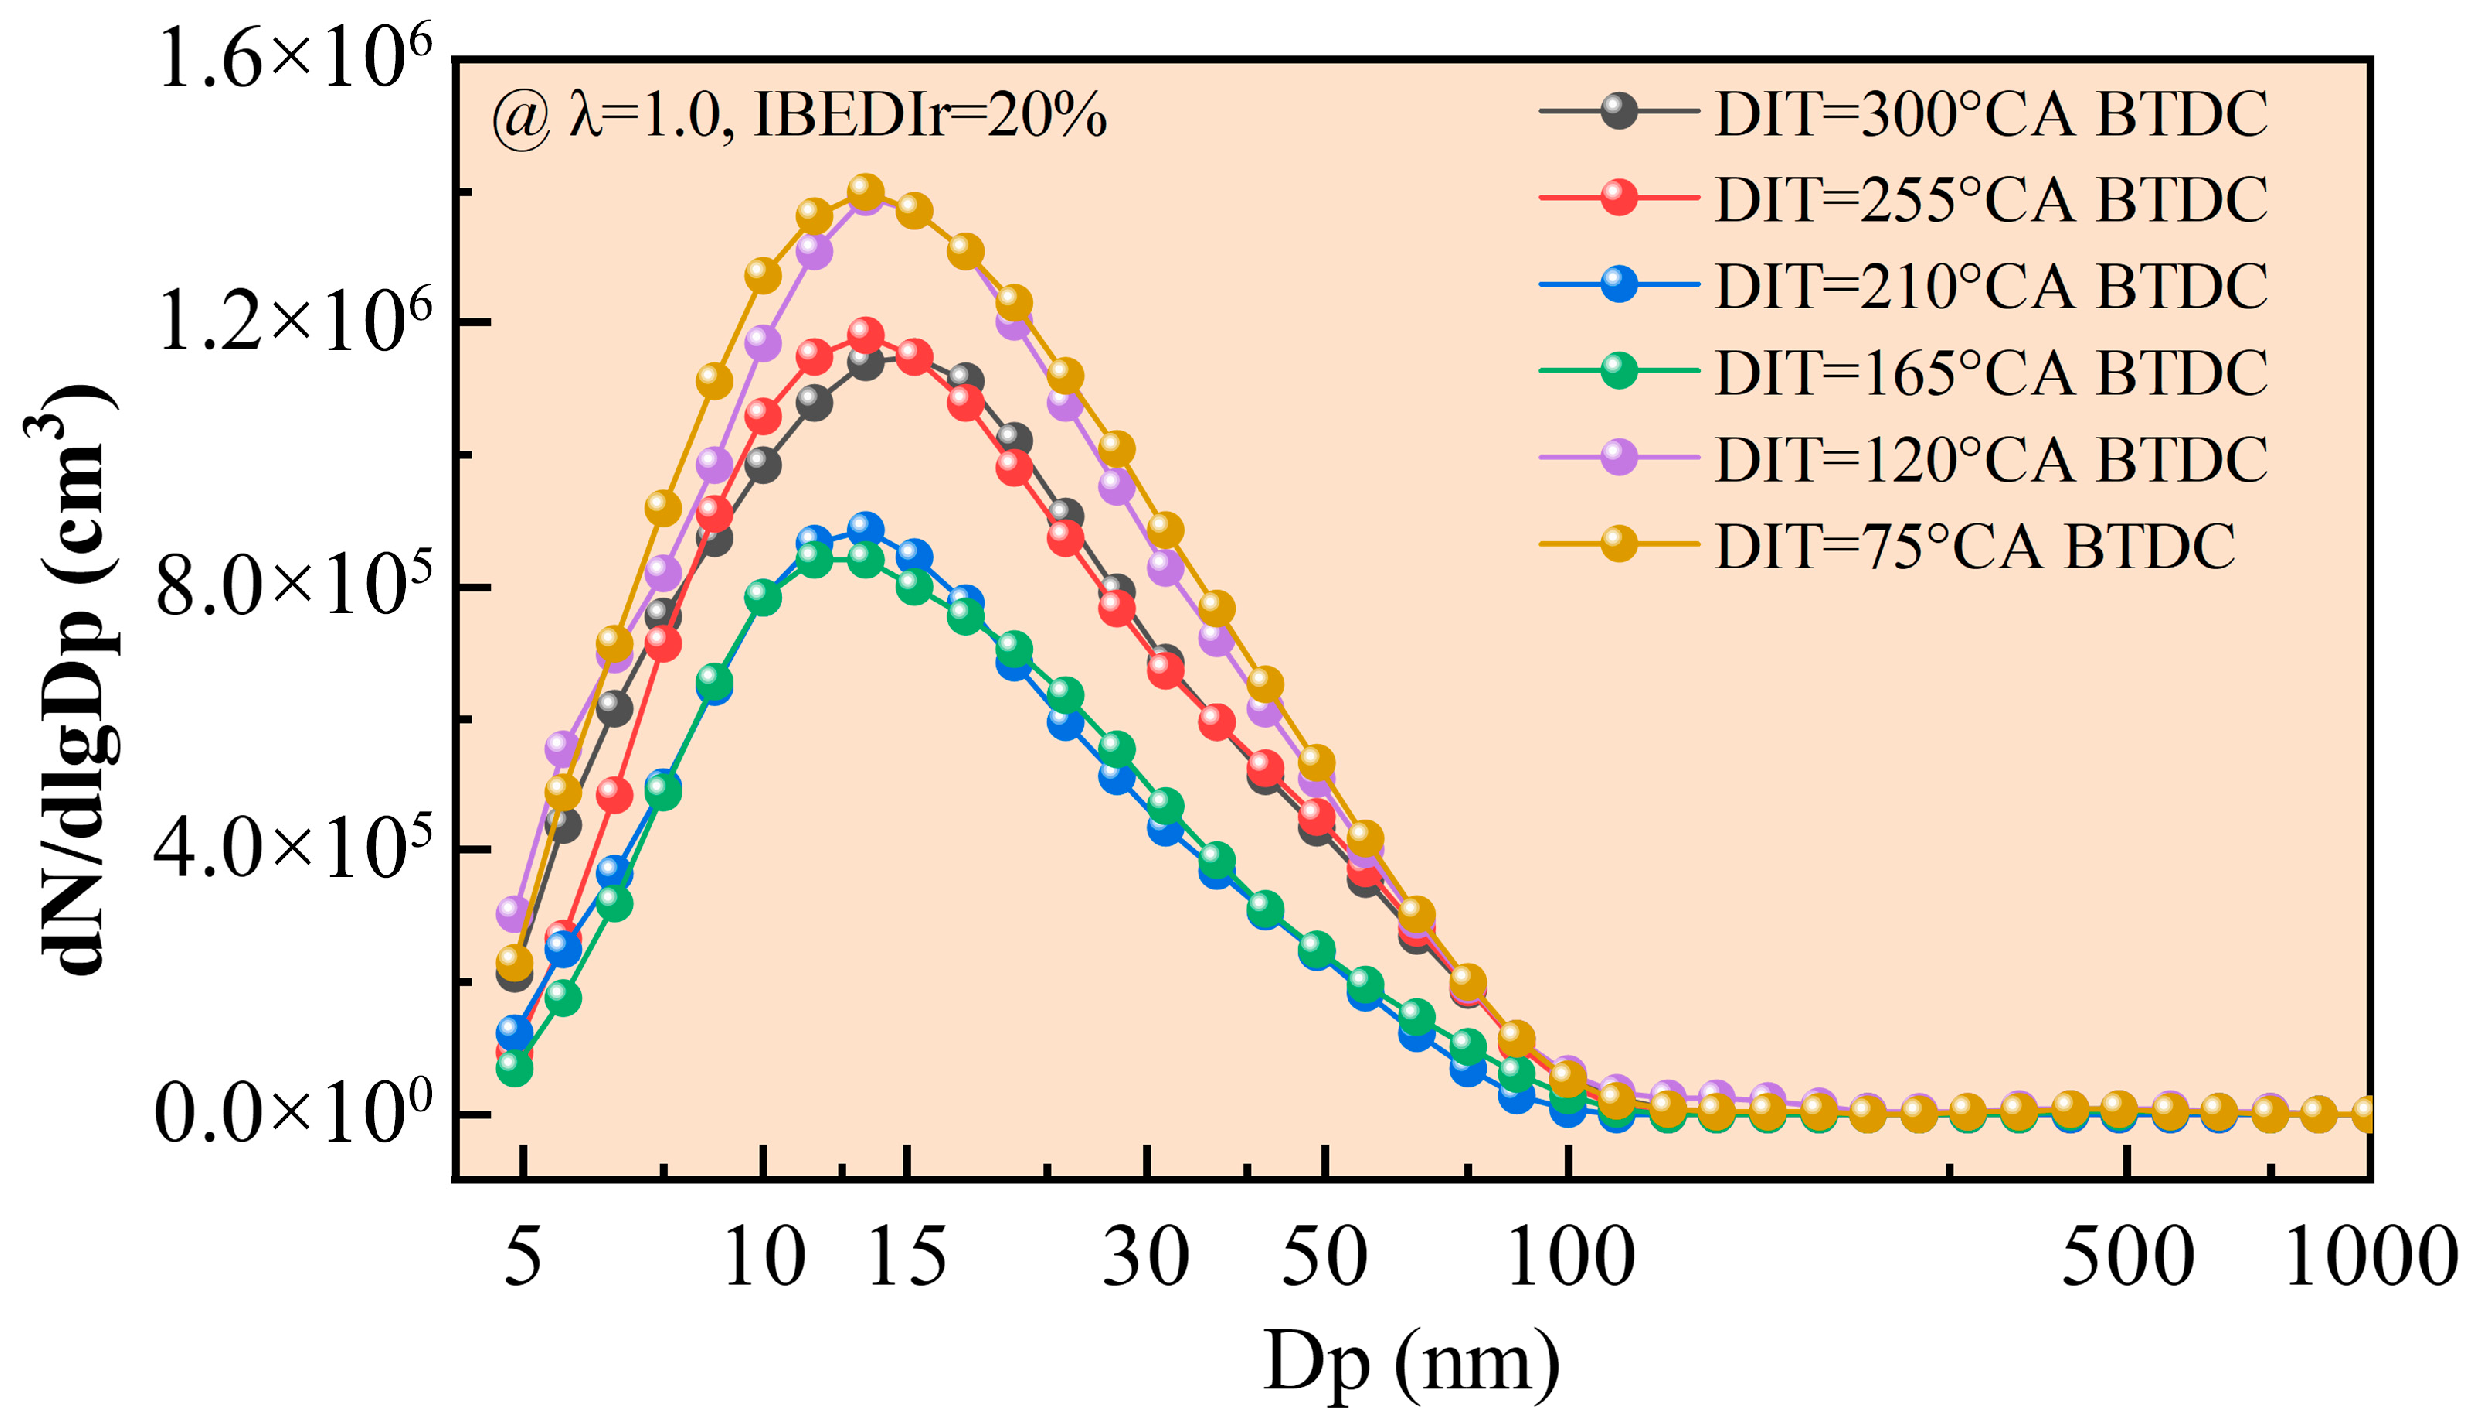
Since at λ = 1, although PN decreases with 20% IBE addition, it still remains at a certain level. Figure 15 presents the particle size distribution characteristics under different DIT conditions. It can be observed that under all DITs, the particles are concentrated in the nucleation mode and exhibit a single-peak distribution. The peak particle size is consistently around 12 nm. This occurs because, at IBEDIr = 20%, the in-cylinder direct injection quantity is relatively low, resulting in more homogeneous mixing. Additionally, since gasoline is injected through the intake port, the formed mixture is relatively uniform, leading to most particles being in the nucleation mode with peak sizes concentrated near 12 nm. This further indicates that at lower direct injection ratios, changing the direct injection timing mainly affects the particle number concentration, with minimal impact on the particle size distribution.
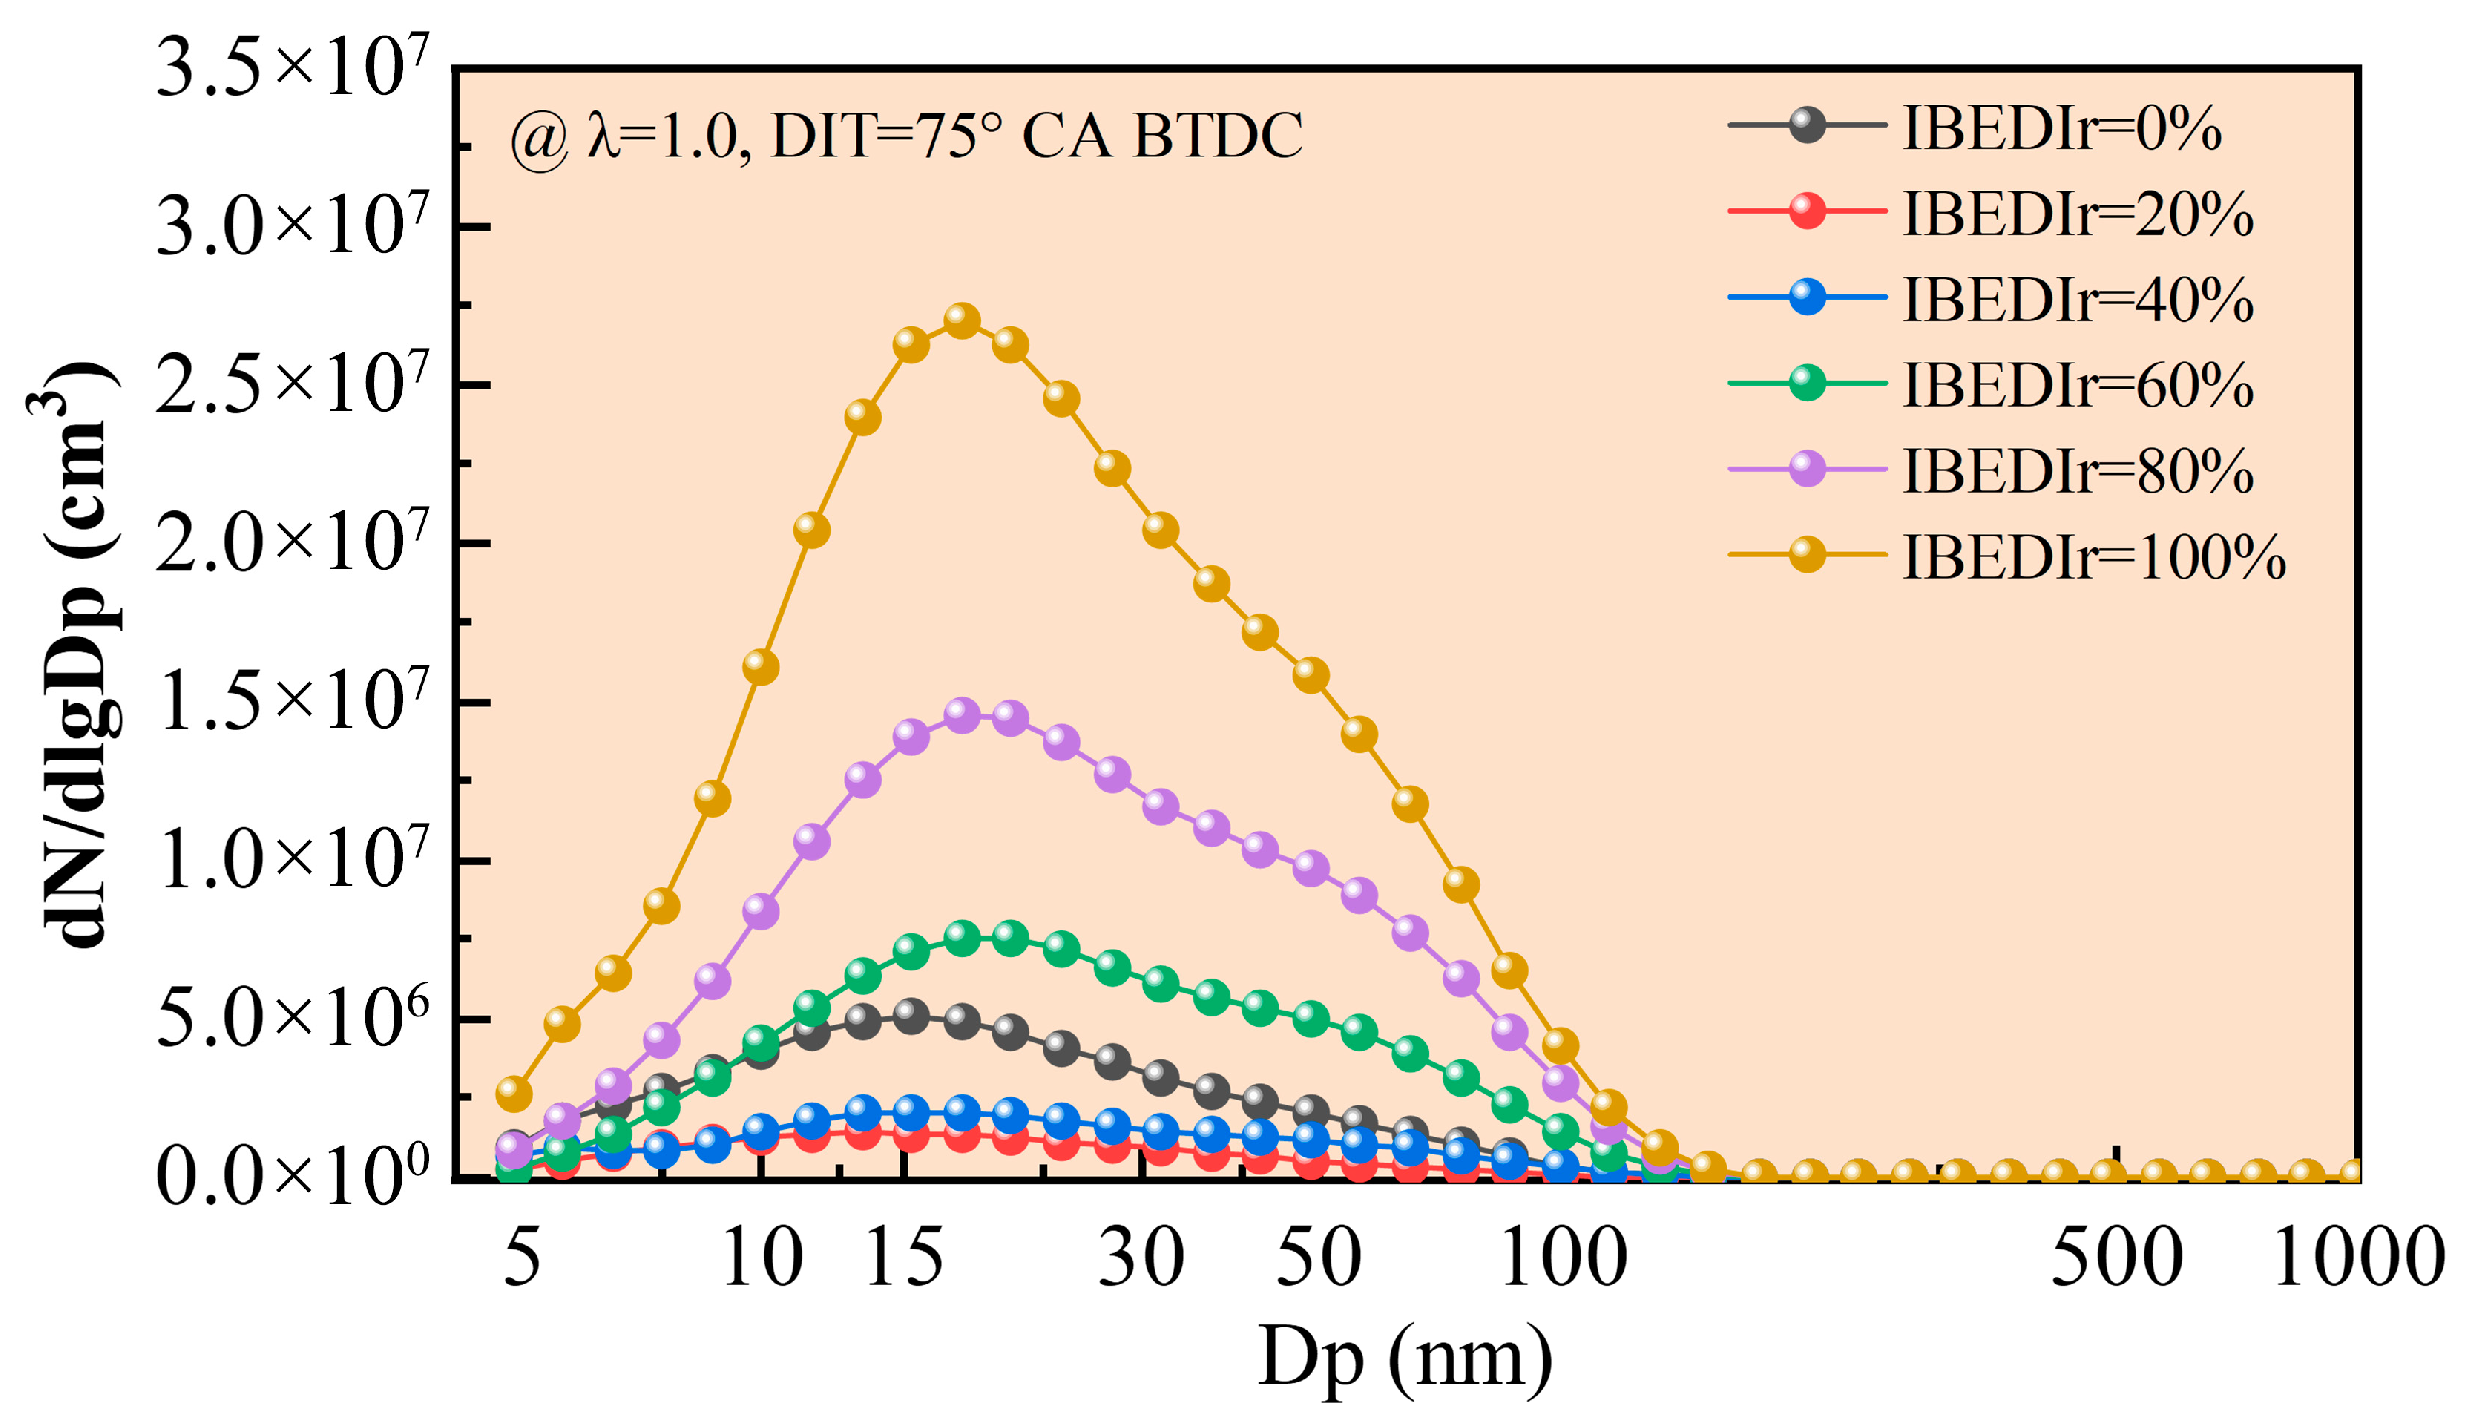
When λ = 1 and the DIT is set at 75° CA BTDC, higher PN emissions are observed across different IBEDIr conditions, with a sharp increase occurring when IBEDIr exceeds 60%. Figure 16 illustrates the particle size distribution under these operating conditions. The results show that when IBEDIr is below 40%, the particles exhibit a single-peak distribution primarily concentrated in the nucleation mode. At IBEDIr of 20% and 40%, while the PN values decrease slightly, the peak particle size is somewhat larger than that of pure gasoline. This phenomenon results from the late DIT, which reduces the available time for IBE evaporation and mixing, leading to inhomogeneous mixture formation. Since the IBE injection quantity remains relatively low in these cases, the particles remain predominantly in the nucleation mode, though the poorer mixture homogeneity causes a slight increase in peak particle size. When IBEDIr increases beyond 60%, accumulation mode particles become more prevalent, and the distribution gradually develops a bimodal characteristic. This transition occurs because excessive late injection of IBE leaves insufficient time for proper evaporation and mixing, creating localized fuel-rich zones that promote the formation of accumulation mode particles. Furthermore, higher IBEDIr values correspond to increased particle number concentrations. These findings demonstrate that although IBE generally shows significant potential for particulate reduction, excessive late direct injection timing combined with high direct injection quantities can still lead to substantial generation of larger-sized particles.

4. Conclusions

Building upon our previous findings that IBE demonstrates superior performance compared to ABE and butanol, this study investigates the combustion and emission characteristics of an SI engine operating under GPI + IBEDI dual-fuel combined injection mode. Through engine bench tests, the effects of IBEDIr, DIT, and λ were evaluated. Key conclusions are summarized as follows:
  • For combustion duration, high IBEDIr fuel is more competitive at lean conditions with late DIT. In order to obtain the lower CoVIMEP, intermediate injection timings (particularly around 120° CA BTDC) should be avoided under lean combustion conditions.
  • Whether under stoichiometric or lean-burn conditions, the torque output has the highest competitiveness when DIT = 300° CA BTDC, while CoVIEMP is below 2.1%. Additionally, the optimal IBEDIr exhibits a decreasing trend with the retardation of DIT, indicating that late injection should be suppressed. Allow for further increases in IBEDIr when DIT = 300° CA BTDC.
  • Except for λ = 1.3, NOx emissions exhibit a decreasing trend with increasing IBEDIr, whereas the intermediate injection timing corresponds to the minimum NOx emissions. IBE contributes to the reduction in CO emissions, and a high-proportion IBE is suitable for early injection. However, IBEDIr should be decreased as the direct injection timing is delayed and λ increases.
  • IBE demonstrates significant efficacy in reducing particulate number, particularly under early DIT conditions with elevated IBEDIr values. Under early direct injection timing (DIT = 300° CA BTDC), an IBEDIr exceeding 40% proves adequate to sustain negligibly low PN levels within the λ range of 0.9 to 1.3.
  • When IBEDIr is relatively low (IBEDIr20%, λ = 1), the particle size distribution exhibits a typical unimodal characteristic; this distribution feature remains stable even under the condition of relatively delayed DIT values. Although IBE has universal potential in reducing particles, excessively delayed direct injection timing combined with high direct injection quantity may still lead to a significant increase in particles of 10–50 nm.
  • Pure IBE is competitive at stoichiometric conditions with early DIT. While IBEDIr should be reduced when increasing λ or decreasing DIT. All in all, IBE can effectively improve engine combustion and emission performance under IBEDI + GPI mode with appropriate DIT and IBEDIr.
IBE, as a biomass-based green and clean fuel, has low carbon emissions and broad application prospects. However, due to the current situation and limitations of experimental conditions, the emissions of unregulated pollutants such as formaldehyde and acetaldehyde have not yet been taken into consideration in this study. In future work, further consideration will be given to unregulated emissions and the use of numerical simulation methods to reveal the combustion mechanism of IBE.

Author Contributions

Conceptualization, H.D. and Z.G.; methodology, H.D. and Z.G.; validation, Z.X.; formal analysis, G.L.; investigation, Y.W. and Q.C.; resources, Z.G.; data curation, G.L.; writing—original draft preparation, Z.G.; writing—review and editing, H.D.; visualization, Z.X.; supervision, H.D.; project administration, H.D.; funding acquisition, Z.G. All authors have read and agreed to the published version of the manuscript.

Funding

This work was supported by the National Natural Science Foundation of China (Grant No. 52306139), the Department of Science and Technology of Jilin Province (Grant No. 20240301005ZD) and the China Postdoctoral Science Foundation General Grant (No. 2025M780579).

Data Availability Statement

The original contributions presented in this study are included in the article. Further inquiries can be directed to the corresponding author.

Conflicts of Interest

The authors declare no conflicts of interest.

Abbreviations

SIspark ignition DIdirect injection
PFIport fuel injectionGPIgasoline port injection
ABEacetone–butanol–ethanolIBEDIIBE direct injection
IBEisopropanol–butanol–ethanolλexcess air ratio
ATDCafter compression top dead centerMBTminimum advance for best torque
BTDCbefore compression top dead centerDIrdirect injection ratio
DITdirect injection timingICEinternal combustion engine
IMEPindicated mean effective pressurePAHspolycyclic aromatic hydrocarbons
CAcrank angleHChydrocarbon
NOxnitrogen oxides LFSlaminar flame speed
COcarbon monoxideTPNtotal particle number
PNparticle number NPNnucleation mode particle number
APNaccumulation mode particle numberLHVlatent heat of vaporization

References

  1. Stepien, Z.; Urzedowska, W. Tłokowe silniki spalinowe zasilane wodorem–wyzwania. Nafta-Gaz 2021, 77, 830–840. [Google Scholar] [CrossRef] [Scilit]
  2. Drago, K.; Luka, S.; Goran, H. Biodiesel in environment protection. In Proceedings of the 20th International Congress on Energy and the Environment, Opatija, Croatia, 25–27 October 2006. [Google Scholar]
  3. Shekhar, S.; Agarwal, A.K. Particulate characteristics of methanol (M100) fuelled compression ignition engine. Fuel 2026, 418, 138700. [Google Scholar] [CrossRef] [Scilit]
  4. Pata, S.K.; Erdogan, S.; Pata, U.K.; Meo, M.S. Greening road transport: Comparison of technologies in conventional, hybrid, and electric vehicles. J. Environ. Manag. 2025, 380, 124908. [Google Scholar] [CrossRef] [Scilit] [PubMed]
  5. Farren, N.J.; Davison, J.; Rose, R.A.; Wagner, R.L.; Carslaw, D.C. Characterisation of ammonia emissions from gasoline and gasoline hybrid passenger cars. Atmos. Environ. X 2021, 11, 100117. [Google Scholar] [CrossRef] [Scilit]
  6. Yang, N.; Li, J.; He, C.; Wang, J.; Chen, Y.; Yao, Y. CO2 emission characteristics of China VI hybrid vehicles. Transp. Res. Part D Transp. Environ. 2024, 135, 104377. [Google Scholar] [CrossRef] [Scilit]
  7. Squalli, J. Greening the roads: Assessing the role of electric and hybrid vehicles in curbing CO2 emissions. J. Clean. Prod. 2024, 434, 139908. [Google Scholar] [CrossRef] [Scilit]
  8. Shadidi, B.; Najafi, G.; Yusaf, T. A review of hydrogen as a fuel in internal combustion engines. Energies 2021, 14, 6209. [Google Scholar] [CrossRef] [Scilit]
  9. Lin, H.J.; Lu, Y.S.; Zhang, L.T.; Liu, H.Z.; Edalati, K.; Revesz, A. Recent advances in metastable alloys for hydrogen storage: A review. Rare Met. 2022, 41, 1797–1817. [Google Scholar] [CrossRef] [Scilit]
  10. Jung, S.; Kim, H.; Tsang, Y.F.; Lin, K.Y.A.; Park, Y.K.; Kwon, E.E. A new biore finery platform for producing (C2-5) bioalcohols through the biological/chemical hybridization process. Bioresour. Technol. 2020, 311, 123568. [Google Scholar] [CrossRef] [Scilit]
  11. Voloshin, R.A.; Rodionova, M.V.; Zharmulzhamedou, S.K.; Veziroglu, T.N.; Allakhverdiev, S.I. Review: Biofuel production from plant and algal biomass. Int. J. Hydrogen Energy 2016, 41, 17257–17273. [Google Scholar] [CrossRef] [Scilit]
  12. Attaphong, C.; Singh, V.; Balakrishnan, A.; Do, L.D.; Arpornpong, N.; Parthasarathy, R.N.; Sabatini, D.A. Phase behaviors, fuel properties, and combustion characteristics of alcohol-vegetable oil-diesel microemulsion fuels. Int. J. Green Energy 2016, 13, 930–943. [Google Scholar] [CrossRef] [Scilit]
  13. Alptekin, E.; Sanli, H.; Canakci, M. Combustion and performance evaluation of a common rail DI diesel engine fueled with ethyl and methyl esters. Appl. Therm. Eng. 2019, 149, 180–191. [Google Scholar] [CrossRef] [Scilit]
  14. Budharaju, M.V.; Naradasu, R.K.; Guvvala, P. Effect of oxygenated fuels on performance, combustion, emission and vibration characteristics of a compression ignition engine. Biofuels 2019, 10, 453–461. [Google Scholar] [CrossRef] [Scilit]
  15. Demirbas, A. Biofuels sources, biofuel policy, biofuel economy and global biofuel projections. Energy Convers. Manag. 2008, 49, 2106–2116. [Google Scholar] [CrossRef] [Scilit]
  16. Marchuk, A.; Likhanov, V.A.; Lopatin, O.P. Alternative energy: Methanol, ethanol and alcohol esters of rapeseed oil as eco-friendly biofuel. Теoретическая и Прикладная Экoлoгия 2019, 80–86. [Google Scholar] [CrossRef] [Scilit]
  17. Vijayanand, G.; Augustine, A.; Ananda Natarajan, V.; Srinivasa Raman, V.; Mohanavel, V.; Christopher, D. Emission reduction technique on existing diesel engines using renewable fuels. Int. J. Ambient. Energy 2022, 43, 1187–1191. [Google Scholar] [CrossRef] [Scilit]
  18. Niţă, I.; Geacai, E.; Osman, S.; Iulian, O. Study of the influence of alcohols addition to gasoline on the distillation curve, and vapor pressure. Ovidius Univer. Ann. Chem. 2019, 30, 122–126. [Google Scholar] [CrossRef] [Scilit]
  19. Gainey, B.; Lawler, B. The role of alcohol biofuels in advanced combustion: An analysis. Fuel 2021, 283, 118915. [Google Scholar] [CrossRef] [Scilit]
  20. Tartakovsky, L.; Sheintuch, M. Fuel reforming in internal combustion engines. Prog. Energy Combust. Sci. 2018, 67, 88–114. [Google Scholar] [CrossRef] [Scilit]
  21. Matějovský, L.; Macák, J.; Pospíšil, M.; Baroš, P.; Staš, M.; Krausová, A. Study of corrosion of metallic materials in ethanol–gasoline blends: Application of electrochemical methods. Energy Fuels 2017, 31, 10880–10889. [Google Scholar] [CrossRef] [Scilit]
  22. Macák, J.; Matějovský, L.; Pleyer, O.; Růžičková, M.A.; Jelínek, L. Passivation of steel in ethanol–gasoline blends induced by diethylene triamine. Electrochim. Acta 2022, 434, 141263. [Google Scholar] [CrossRef] [Scilit]
  23. Matějovský, L.; Staš, M.; Li, K.; Baroš, P.; Kudrnová, M.; Macák, J. Mild Steel Corrosion in Gasoline Blends with Acetone–Butanol–Ethanol and Inhibition Efficiencies of Amines. Energy Fuels 2025, 39, 9487–9506. [Google Scholar] [CrossRef] [Scilit]
  24. Żółty, M.; Sacha, D. Influence of E85 ethanol fuel composition on engine oil properties. Nafta-Gaz 2018, 74, 308–318. [Google Scholar] [CrossRef] [Scilit]
  25. Da Silva, A.L.; Castañeda-Ayarza, J.A. Macro-environment analysis of the corn ethanol fuel development in Brazil. Renew. Sustain. Energy Rev. 2021, 135, 110387. [Google Scholar] [CrossRef] [Scilit]
  26. Lee, S.H.; Yun, E.J.; Kim, J.; Lee, S.J.; Um, Y.; Kim, K.H. Biomass, strain engineering, and fermentation processes for butanol production by solventogenic clostridia. Appl. Microbiol. Biotechnol. 2016, 100, 8255–8271. [Google Scholar] [CrossRef] [Scilit]
  27. Algayyim, S.J.M.; Wandel, A.P.; Yusaf, T. Mixtures of n-butanol and iso-butanol blended with diesel: Experimental investigation of combustion characteristics, engine performance and emission levels in a compression ignition engine. Biofuels 2021, 12, 439–448. [Google Scholar] [CrossRef] [Scilit]
  28. Quiroz-Ramires, J.J.; Sanchez-Ramirez, E.; Hernandez-Castro, S.; Segovia-Hernandez, J.G.; Ponce-Ortega, J.M. Optimal Planning of Feedstock for Butanol Production Considering Economic and Environmental Aspects. ACS Sustain. Chem. Eng. 2017, 5, 4018–4030. [Google Scholar] [CrossRef] [Scilit]
  29. Qureshi, N.; Saha, B.C.; Cotta, M.A.; Singh, V. An economic evaluation of biological conversion of wheat straw to butanol: A biofuel. Energy Convers. Manag. 2013, 65, 456–462. [Google Scholar] [CrossRef] [Scilit]
  30. Pinaeva, L.; Noskov, A. Potentials of bio-butanol conversion to valuable products. Rev. Chem. Eng. 2023, 39, 669–706. [Google Scholar] [CrossRef] [Scilit]
  31. Li, Y.; Tang, W.; Chen, Y.; Liu, J.; Lee, C.F.F. Potential of acetone-butanol-ethanol (ABE) as a biofuel. Fuel 2019, 242, 673–686. [Google Scholar] [CrossRef] [Scilit]
  32. Li, Y.; Meng, L.; Nithyanandan, K.; Lee, T.H.; Lin, Y.; Lee, C.F.F.; Liao, S. Experimental investigation of a spark ignition engine fueled with acetone-butanol-ethanol and gasoline blends. Energy 2017, 121, 43–54. [Google Scholar] [CrossRef] [Scilit]
  33. Han, K.; Pang, B.; Ma, X.; Chen, H.; Song, G.; Ni, Z. An experimental study of the burning characteristics of acetone–butanol–ethanol and diesel blend droplets. Energy 2017, 139, 853–861. [Google Scholar] [CrossRef] [Scilit]
  34. Duan, X.; Xu, Z.; Sun, X.; Deng, B.; Liu, J. Effects of injection timing and EGR on combustion and emissions characteristics of the diesel engine fuelled with acetone–butanol–ethanol/diesel blend fuels. Energy 2021, 231, 121069. [Google Scholar] [CrossRef] [Scilit]
  35. Kaymak, D.B. Design and control of an alternative process for biobutanol purification from ABE fermentation. Ind. Eng. Chem. Res. 2019, 58, 1957–1965. [Google Scholar] [CrossRef] [Scilit]
  36. Dusséaux, S.; Croux, C.; Soucaille, P.; Meynial-Salles, I. Metabolic engineering of Clostridium acetobutylicum ATCC 824 for the high-yield production of a biofuel composed of an isopropanol/butanol/ethanol mixture. Metab. Eng. 2013, 18, 1–8. [Google Scholar] [CrossRef] [Scilit]
  37. Dai, Z.; Dong, H.; Zhu, Y.; Zhang, Y.; Li, Y.; Ma, Y. Introducing a single secondary alcohol dehydrogenase into butanol-tolerant Clostridium acetobutylicum Rh8 switches ABE fermentation to high level IBE fermentation. Biotechnol. Biofuels 2012, 5, 44. [Google Scholar] [CrossRef] [Scilit]
  38. Wang, P.; Feng, J.; Guo, L.; Fasina, O.; Wang, Y. Engineering Clostridium saccharoperbutylacetonicum for high level Isopropanol-Butanol-Ethanol (IBE) production from acetic acid pretreated switchgrass using the CRISPR-Cas9 system. ACS Sustain. Chem. Eng. 2019, 7, 18153–18164. [Google Scholar] [CrossRef] [Scilit]
  39. Hu, J.; Abubakar, S.; Li, Y. A novel reduced i-propanol-n-butanol-ethanol (IBE)/diesel mechanism for engine combustion and emissions prediction. Fuel 2020, 278, 118291. [Google Scholar] [CrossRef] [Scilit]
  40. Li, G.; Lee, T.H.; Liu, Z.; Lee, C.F.; Zhang, C. Effects of injection strategies on combustion and emission characteristics of a common-rail diesel engine fueled with isopropanol-butanol-ethanol and diesel blends. Renew. Energy 2019, 130, 677–686. [Google Scholar] [CrossRef] [Scilit]
  41. Li, G.; Dai, J.Y.; Li, Y.Y.; Lee, T.H. Optical investigation on combustion and soot formation characteristics of isopropanol-butanol-ethanol (IBE)/diesel blends. Energy Sci. Eng. 2021, 9, 2311–2320. [Google Scholar] [CrossRef] [Scilit]
  42. Lee, T.H.; Hansen, A.C.; Li, G.; Lee, T. Effects of isopropanol-butanol-ethanol and diesel fuel blends on combustion characteristics in a constant volume chamber. Fuel 2019, 254, 115613. [Google Scholar] [CrossRef] [Scilit]
  43. Meng, X.L.; Xie, F.X.; Li, X.N. Study on the correlation characteristics of auto-ignition and knocking in high compression ratio spark ignition engine for isopropanol-butanol-ethanol (IBE) blends by dilution strategies. Energy 2025, 340, 139128. [Google Scholar] [CrossRef] [Scilit]
  44. Milojević, S.; Savić, S.; Marić, D.; Stopka, O.; Krstić, B.; Stojanović, B. Correlation between emission and combustion characteristics with the compression ratio and fuel injection timing in tribologically optimized diesel engine. Tehnički Vjesnik 2022, 29, 1210–1219. [Google Scholar]
  45. İlçin, K.; Fırat, M.; Altun, Ş.; Okcu, M. Effect of blending ratio and injection timing on combustion and emissions of a common-rail diesel engine fueled by iso-propanol-butanol-ethanol (IBE) and conventional diesel. Politeknik Dergisi 2023, 26, 1327–1339. [Google Scholar] [CrossRef] [Scilit]
  46. Li, Y.; Chen, Y.; Wu, G.; Lee, C.F.F.; Liu, J. Experimental comparison of acetone-n-butanol-ethanol (ABE) and isopropanol-n-butanol-ethanol (IBE) as fuel candidate in spark-ignition engine. Appl. Therm. Eng. 2018, 133, 179–187. [Google Scholar] [CrossRef] [Scilit]
  47. Li, Y.; Meng, L.; Nithyanandan, K.; Lee, T.H.; Lin, Y.; Lee, C.F.F.; Liao, S. Combustion, performance and emissions characteristics of a spark-ignition engine fueled with isopropanol-n-butanol-ethanol and gasoline blends. Fuel 2016, 184, 864–872. [Google Scholar] [CrossRef] [Scilit]
  48. Guo, Z.; Yu, X.; Du, Y.; Wang, T. Comparative study on combustion and emissions of SI engine with gasoline port injection plus acetone-butanol-ethanol (ABE), isopropanol-butanol-ethanol (IBE) or butanol direct injection. Fuel 2022, 316, 123363. [Google Scholar] [CrossRef] [Scilit]
  49. Shi, W.; Li, Z.; Sun, P.; Dong, W.; Yu, X.; Li, J.; Liu, M. Orthogonalization analysis of the effect of pre-combustion chamber hydrogen injection strategy on the combustion and emissions of a gasoline engine with active precombustion chamber under lean-burn condition. Energy 2025, 332, 137127. [Google Scholar] [CrossRef] [Scilit]
  50. Huang, F.; Wang, Y.; Wan, M.; Lei, J. Insights into the potential of EGR for reducing unregulated emissions and enhancing the performance of methanol-diesel RCCI engines at different altitudes. Int. J. Engine Res. 2025, 26, 1638–1653. [Google Scholar] [CrossRef] [Scilit]
  51. Jin, C.; Geng, Z.; Liu, X.; Ampah, J.D.; Ji, J.; Wang, G.; Liu, H. Effects of water content on the solubility between Isopropanol-Butanol-Ethanol (IBE) and diesel fuel under various ambient temperatures. Fuel 2021, 286, 119492. [Google Scholar] [CrossRef] [Scilit]
  52. Zhang, J.; Yu, X.; Guo, Z.; Li, Y.; Zhang, J.; Liu, D. Study on combustion and emissions of a spark ignition engine with gasoline port injection plus acetone–butanol–ethanol (ABE) direct injection under different speeds and loads. Energies 2022, 15, 7028. [Google Scholar] [CrossRef] [Scilit]
  53. Meng, X.; Xie, F.; Liu, Y.; Lai, K.; Jiang, X.; Jiang, B.; Dou, H. Effect of dilution strategies on the performance and knocking in a spark induced compression ignition (SICI) engine for isopropanol-butanol-ethanol (IBE) blends. Energy 2025, 319, 134941. [Google Scholar] [CrossRef] [Scilit]
Figure 1. Layout of the cylinder configuration and combustion chamber for the test engine. (a) cylinder configuration. (b) combustion chamber.
Energies 19 02081 g001
Figure 2. Layout of the experimental system.
Energies 19 02081 g002
Figure 3. The variation in CA0-90 with IBEDIr under different DIT at λ = 1 and 1.2.
Energies 19 02081 g003aEnergies 19 02081 g003b
Figure 4. The variation in CoVIMEP with IBEDIr under different DIT at λ = 1 and 1.2.
Energies 19 02081 g004aEnergies 19 02081 g004b
Figure 5. The variation in torque with IBEDIr under different DIT at λ = 1 and 1.2.
Energies 19 02081 g005
Figure 6. The variation in torque with IBEDIr under different λ at DIT = 300° CA BTDC.
Energies 19 02081 g006
Figure 7. The variation in HC with IBEDIr under different DIT at λ = 1 and 1.2.
Energies 19 02081 g007
Figure 8. The variation in HC with IBEDIr under different λ at DIT = 300° CA BTDC.
Energies 19 02081 g008
Figure 9. The variation in NOx with IBEDIr under different DIT at λ = 1.2.
Energies 19 02081 g009
Figure 10. The variation in NOx with IBEDIr under different λ at DIT = 300° CA BTDC.
Energies 19 02081 g010
Figure 11. The variation in CO with IBEDIr under different DIT at λ = 1 and 1.2.
Energies 19 02081 g011
Figure 12. The variation in CO with IBEDIr under different λ at DIT = 300° CA BTDC.
Energies 19 02081 g012
Figure 13. The variation in TPN with IBEDIr under different DIT at λ = 1 and 1.2.
Energies 19 02081 g013
Figure 14. The variation in TPN with IBEDIr under different λ at DIT = 300° CA BTDC.
Energies 19 02081 g014
Figure 15. The variation in particle distribution with DIT at λ = 1 and IBEDIr = 20%.
Energies 19 02081 g015
Figure 16. The variation in particle distribution with IBEDIr at λ = 1 and DIT = 75° CA BTDC.
Energies 19 02081 g016
Table 1. Test engine parameters.
Engine TypeSpark Ignition, Four Cylinder, Combined Injection
Compression ratio9.6:1
Displacement1.984 L
Bore × stroke82.5 × 92.8 mm × mm
Maximum power137 kW (@5000 rpm)
Maximum torque320 N·m (@1600–4000 rpm)
Table 2. Experimental testing equipment and precision for precise measurement.
ParametersTypeManufacturerPrecisionRangeUncertainty
TorqueCW160CAMA Electromechanic Co., Ltd. (Luoyang, China)≤±0.28 N·m0~600 N·m±2%
Speed≤±1 rpm0~6000 rpm±0.07%
Cylinder pressureAVL-GU13Z-24AVL List GmbH (Graz, Austria)≤±0.5%0~20 MPa±0.5%
Crank angleKistler-2614BKistler Group (Winterthur, Switzerland)≤±0.5°0~720° CA±0.07%
λLAMBDA LA4ETAS GmbH (Stuttgart, Germany)≤±0.10.700~32.767±1%
COAVL-DICOM 4000AVL List GmbH (Graz, Austria)≤±0.01%0~10% vol±3.5%
HC≤±1 ppm0~20,000 ppm vol±3.5%
NOx≤±1 ppm0~5000 ppm vol±2%
Particle number concentrationDMS 500Cambustion Ltd. (Cambridge, UK)≤±1.4 × 10⁴dN/dlogDp/cm30~1011 dN/dlogDp/cc±1%
Gasoline mass flow rateDF-2420Ono Sokki Co., Ltd. (Yokohama, Japan)≤±0.01 g/s0.2~82 kg/h±0.03%
Table 3. Experiment fuels [51,52,53].
ButanolEthanolIBE (3:6:1)Gasoline
Chemical formulaC4H9OHC2H5OHC3.5H9OC4–C12
Research octane number9610010388–99
C/H atom ratio0.400.330.390.44
Oxygen content (wt.%)21.634.824.4
Density at 288 K (kg/m3)813795803770
Lower heating value (MJ/kg)33.126.831.743.5
Latent heat of vaporization at 298 K (kJ/kg)582904666380–500
Stoichiometric air–fuel ratio11.29.010.814.7
Laminar flame speed (LFS) (cm/s)48B48B33–44A
Note: pA = 1 atm, T = 298–358 K, Φ = 1; pB = 1 atm, T = 343 K, Φ = 1.
Table 4. Main experimental scheme.
Variable ValuesFixed Variable Value
Part I
DIT = 300, 255, 210, 120, 75° CA BTDC
IBEDIr = 0, 20, 40, 60, 80, 100%
λ = 1.0 and 1.2
Part II
DIT = 300° CA BTDC
IBEDIr = 0, 20, 40, 60, 80, 100%
λ = 0.9 1.0 1.1 1.2 1.3
Engine speed = 1500 rpm
DI pressure = 7 MPa
Manifold absolute pressure = 50 kPa
Opening timing of intake valve = 372° CA BTDC
Closing timing of intake valve = 128° CA BTDC
Opening timing of exhaust valve = 160° CA ATDC
Closing time of exhaust valve = 373° CA ATDC
Gasoline port injection timing = 300° CA BTDC
Ignition timing = MBT
Injection mode = IBEDI + GPI
Disclaimer/Publisher’s Note: The statements, opinions and data contained in all publications are solely those of the individual author(s) and contributor(s) and not of MDPI and/or the editor(s). MDPI and/or the editor(s) disclaim responsibility for any injury to people or property resulting from any ideas, methods, instructions or products referred to in the content.