Article

Ignition of Vegetation Induced by Discharge from Abraded Medium-Voltage Insulated Overhead Lines


State Key Laboratory of Disaster Prevention & Reduction for Power Grid, Changsha University of Science & Technology, Changsha 410114, China
*
Authors to whom correspondence should be addressed.
Energies 2026, 19(8), 1990; https://doi.org/10.3390/en19081990
Submission received: 10 February 2026 / Revised: 24 March 2026 / Accepted: 9 April 2026 / Published: 20 April 2026

Abstract

Tree contact discharge is a key contributing factor to wildfires caused by medium-voltage insulated conductors. Prolonged abrasion of the insulation layer by branches gradually creates weak points in the insulation. When subjected to lightning strikes, these areas are prone to forming lightning-induced pinholes, which can subsequently trigger partial discharge and even ignition. This study systematically investigates the discharge-induced ignition mechanism for 10 kV overhead insulated conductors in tree contact scenarios by establishing an experimental platform integrated with high-speed imaging, ultraviolet detection, and simulation methods. Three types of typical defects were set up in the experiments: complete insulation abrasion, lightning puncture holes accompanied by localized abrasion, and lightning puncture holes without abrasion. The development process and characteristics of different discharge forms were observed and analyzed. The results indicate that the tree contact discharge ignition mechanism can be categorized into two types: thermal accumulation and direct arcing. The former occurs when insulation abrasion or composite defects exist, where sustained partial discharge or a high-resistance current leads to gradual heat accumulation, resulting in an ignition delay lasting tens of seconds. The latter occurs when only small defects such as lightning puncture holes exist in the insulation layer. A concentrated arc forms due to gap breakdown under high voltage, leading to a millisecond-level ignition process. The study found that different discharge forms produce significantly distinct ablation and carbonization patterns on both the insulation layer and the branch surface, reflecting differences in energy transfer pathways. Simulation analysis further indicated that the thickness of the insulation layer affects the electric field distribution in the tree contact gap, with the initial discharge field strength decreasing as the thickness increases. This study provides experimental evidence and classification guidance for tree contact fault monitoring, insulation condition assessment, and wildfire prevention and control in medium-voltage distribution networks.

1. Introduction

With regard to distribution network accidents, power outages caused by tree contact account for approximately 10% [1]. Scholars both domestically and internationally commonly refer to the electrical fault caused by single-phase contact between vegetation and a power line as a Tree-to-Wire Short Circuit Fault (TSF), abbreviated as a tree contact fault [2]. Such faults are characterized by low ground currents and indistinct electrical characteristics, and often fail to effectively trigger the operation of protective relays [3,4]. However, due to their prolonged duration, tree contact faults carry the risk of ignition, posing a severe threat to life and property safety. For instance, the 2018 Camp Fire in California, USA, resulted in economic losses as high as 16.5 billion US dollars [5]. The 2009 Black Saturday bushfires in Victoria, Australia, triggered by transmission line faults, also resulted in catastrophic devastation [6]. To mitigate such incidents, insulated conductors have been widely adopted in current distribution networks [7,8]. Nevertheless, insulated conductors remain susceptible to tree contact discharge and potential ignition. Therefore, systematically obtaining the typical electrical characteristics of tree contact faults on insulated conductors, conducting an in-depth analysis of their discharge forms, and thereby refining the understanding of the tree contact discharge ignition mechanism have become critical issues requiring urgent resolution.
Research on the tree contact discharge process of insulated conductors remains relatively limited. Scholars both domestically and internationally employ a combination of experimental and simulation methods to study the ignition mechanism induced by such discharges in insulated conductors. While experiments can reveal the actual ignition process, they are constrained by the power limitations of experimental equipment and face significant challenges in acquiring intermediate physical quantities, such as the electric field. Thus, simulation becomes an effective approach to address such issues. Reference [9] established an equivalent model for tree contact discharge faults through simulation experiments, decomposing the fault impedance into two components: the arc impedance between the line and the tree, and the tree’s own impedance. It also indicated that the more severe the fault, the lower the tree’s own impedance tends to be. Reference [10] conducted experiments related to power system-induced vegetation ignition. It systematically analyzed the factors influencing the development speed and severity of tree contact faults and constructed an ignition probability model. The study indicated that the formation and bridging of carbonization channels are critical factors leading to the eventual development of severe arcing in tree contact faults, with the risk of wildfire ignition increasing significantly after the appearance of these channels. However, in tree contact discharge experiments, research has primarily focused on the influence of factors such as moisture content, natural wind speed, and the conductor type on the ignition mechanism. The impact of long-term, repeated friction between vegetation and the insulation layer on the evolution of discharge forms and its subsequent effect on the ignition mechanism has often been overlooked. Reference [11] indicates that the existing research on THIF modeling can be broadly categorized into three types. The first comprises methods combining variable resistance with arc models, which fit tree impedance through experiments and incorporate arc models in series; some studies further refine this into a three-stage dynamic model comprising “approach–contact–separation” phases. The second involves modeling based on trees’ structural characteristics, considering the resistive and capacitive properties of tissues such as bark, phloem, and xylem to construct equivalent circuits and verify that current primarily flows through the bark and phloem. The third type utilizes models based on thermal input and thermal balance analysis, which couple impedance changes during the tree carbonization process with thermal effects to investigate the impact of carbonization pathway evolution on fault resistance. Additionally, some studies incorporate environmental factors (such as temperature and humidity) and finite element methods to establish correlation models between tree conductivity and remote sensing spectral data. Reference [12], based on theoretical analysis and field experiments, systematically classified the progression of early-stage tree line faults into three stages—“approach, contact, and separation”—for the first time. It also revealed the dynamic patterns of the “zero–rest–flat–shoulder” waveform in the resulting ground fault current, providing a key physical basis for identifying such faults. Reference [13] further advanced this research by using magnetohydrodynamic simulations to elucidate, at the microscopic level, the intrinsic relationship between arc morphology, temperature variations, and current waveform characteristics during the separation phase. The study also experimentally verified the influence of the polarity effect (higher arc temperature when the conductor acts as the anode) on the asymmetry of the zero-crossing duration. Reference [14] established an arc model for tree contact discharge based on the magnetohydrodynamics (MHD) model, investigating the influence of conductor type on arc temperature, morphology, and development characteristics. The study found that tree contact discharge on bare conductors leaves only transient black ablation marks, causing minimal damage, whereas on insulated conductor surfaces it induces severe ablation damage. Reference [15] approximated the fault resistance as being equal to the volume resistance of the branches and trunk. It derived the relationship between resistivity and temperature through empirical testing and experimentally demonstrated that the magnitude of the TSF ground fault current is primarily determined by the resistivity–temperature characteristics of the wood, the fractal dimension parameters of the fault tree, and the location of the contact point. Reference [16] indicates that the ignition of power lines primarily involves three mechanisms: ignition by external heat sources, ignition by overcurrent, and ignition by electric arcs. Fires caused by branches coming into contact with insulated power lines are mainly attributed to ignition by electric arcs. When a flashover occurs at the point of contact between a branch and a power line or on the surface of the line, it triggers an electric arc discharge. Simultaneously, conductive particles present in the high-temperature smoke generated by the combustion of branches and conductor insulation at high temperatures significantly accelerate the ionization of the gas, thereby intensifying the arc development. Furthermore, the high temperatures cause the insulation to undergo pyrolysis, leading to a decrease in its breakdown voltage and making this weakened area more susceptible to the formation and maintenance of arc combustion. Ultimately, this results in a fire caused by branches coming into contact with insulated conductors.
To this end, this study established a 10 kV overhead insulated conductor experimental platform, selected typical tree species found in mountainous regions as experimental samples, and utilized high-speed cameras and ultraviolet detectors to achieve the multimodal, synchronized observation and recording of the discharge process. The study focuses on the differences in discharge behavior of the insulation layer under various damage modes, such as long-term mechanical friction and lightning-induced defects. It systematically analyzes the development process of discharge forms—from partial discharge to complete breakdown—as well as the corresponding energy accumulation and release characteristics. Ultimately, by comparing key parameters such as discharge duration, UV intensity, and ablation morphology under different defect conditions, the study clarifies the classification criteria and physical characteristics of the ignition mechanism caused by tree-to-line discharges. Existing research has paid little attention to the fire hazards that insulated conductors may pose under specific conditions. Although insulated conductors theoretically possess a certain ability to prevent discharge-induced ignition, when the insulation layer is worn and overvoltage are present in the line, they may actually be more prone to inducing discharge-induced ignition—a potential hazard that has not yet been fully investigated. This study is the first to systematically reveal two distinct discharge ignition mechanisms in medium-voltage insulated conductors under tree line friction and wear conditions, depending on the type of insulation layer defect. It provides important experimental support and theoretical references for fault monitoring in medium-voltage distribution networks and wildfire early warning systems.

2. The Effects of Contact Wear Between the Shaft and the Line

2.1. Model and Parameter Settings

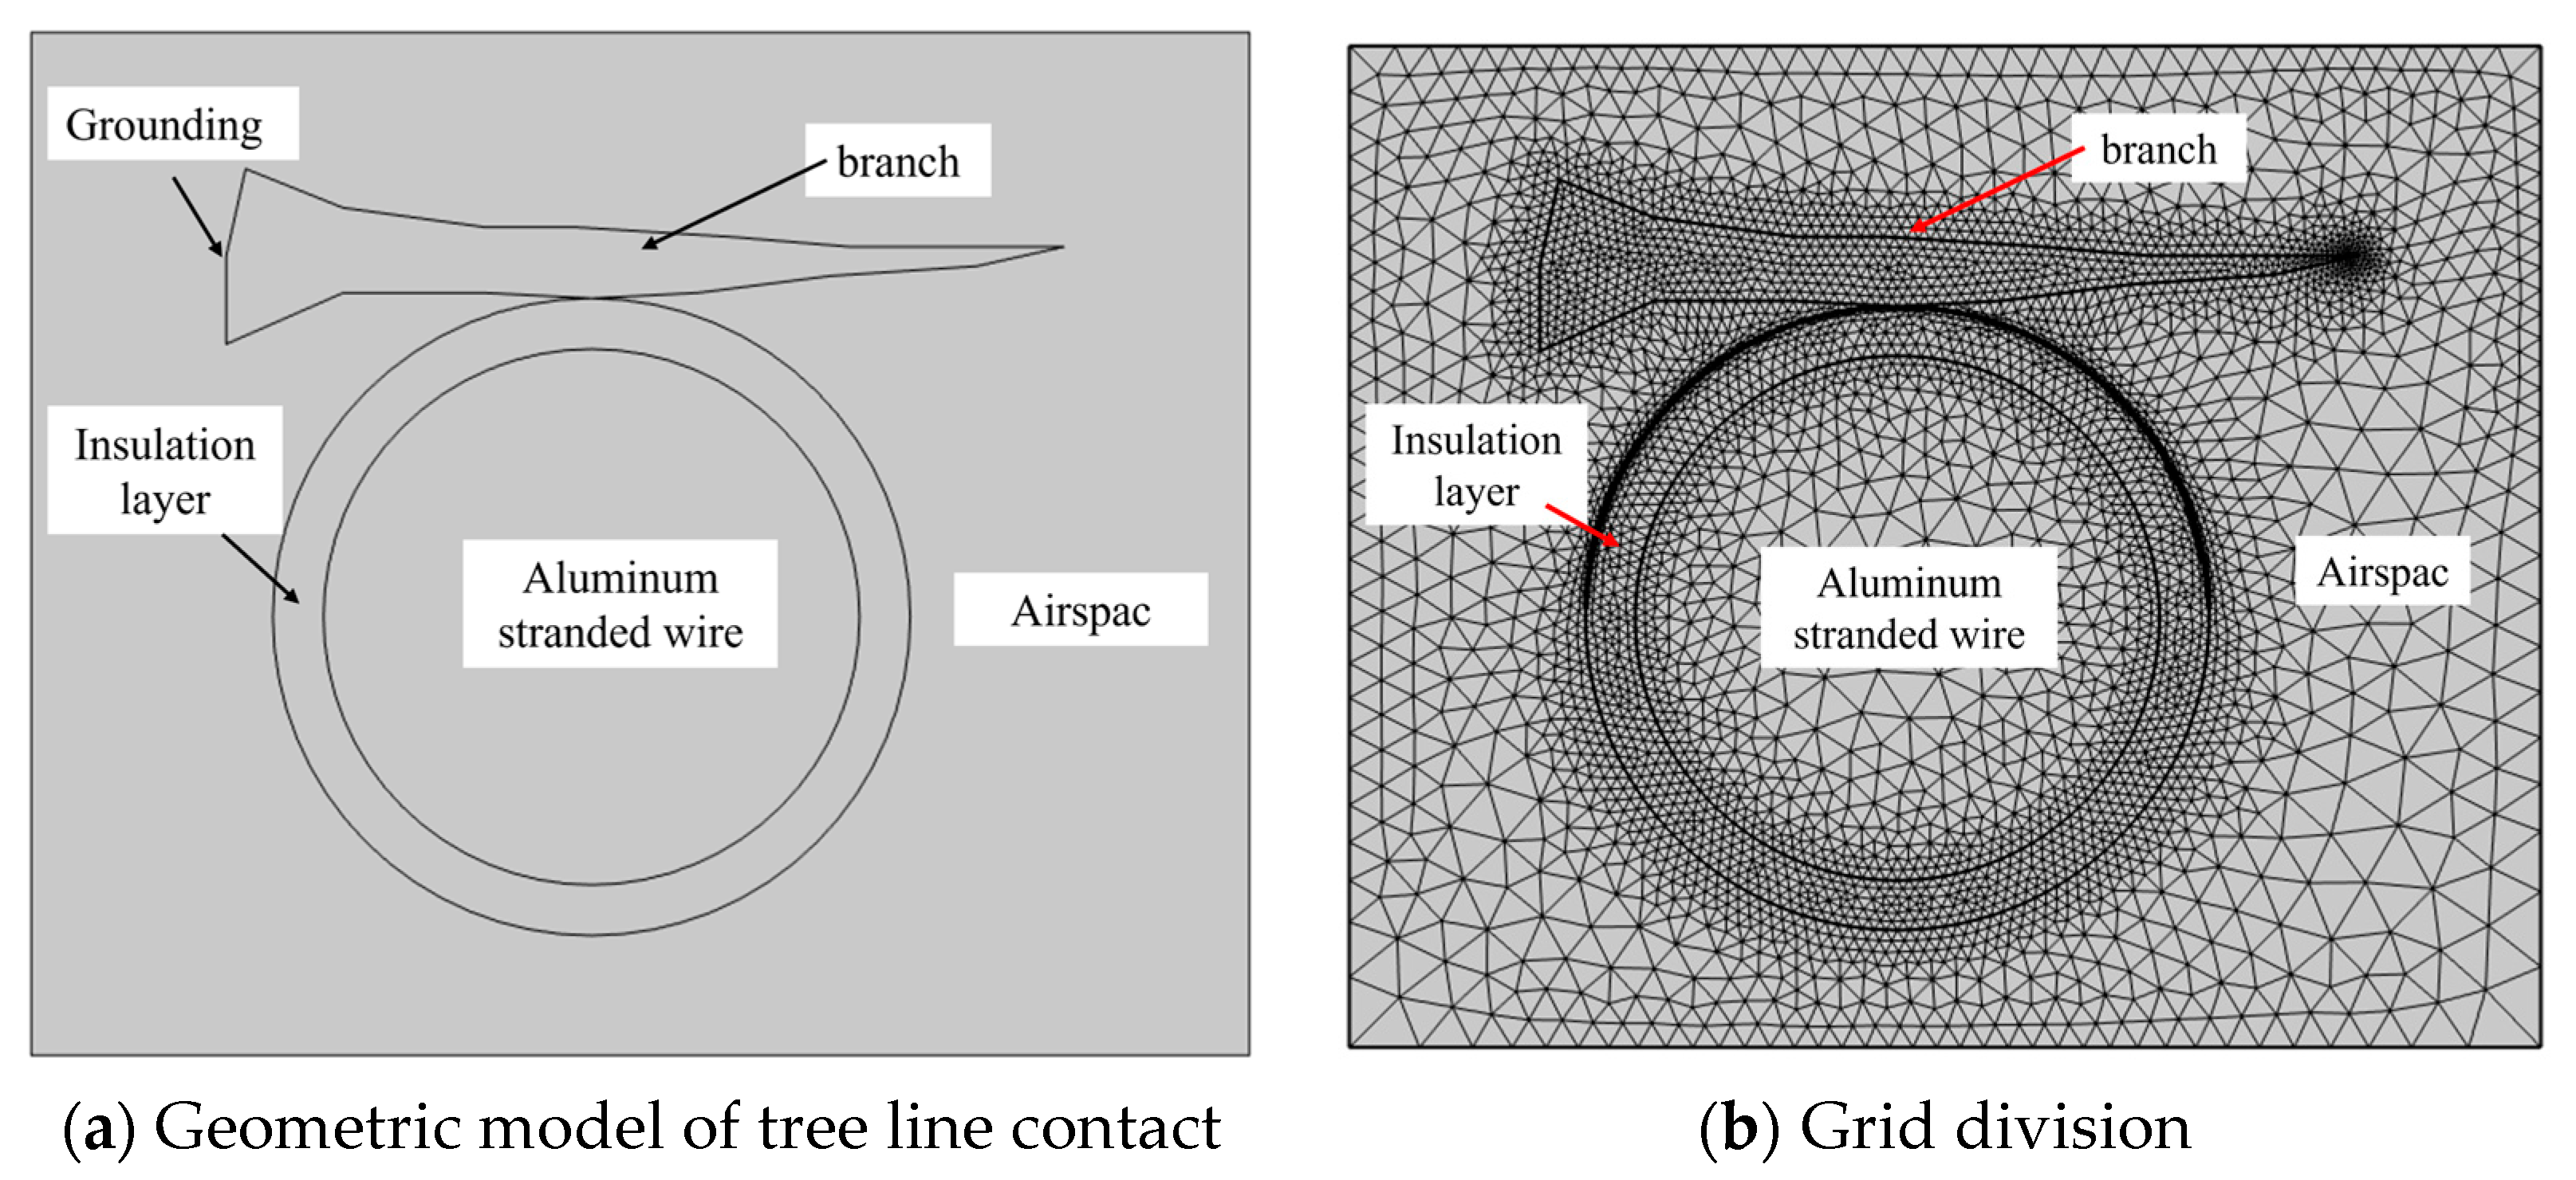
In this paper, a two-dimensional simulation model of tree–wire contact was established using COMSOL 6.3 for multiphysics coupling, as shown in Figure 1a. The conductor model selected is the JKLYJ-70 (Jinbiao Cable, Xingtai, China), a common conductor type used in 10 kV distribution lines, with a cross-sectional area of 70 mm2. Based on the cross-sectional diameters of the test branch samples, the cross-sectional diameter of the branches was set to 15 mm. Figure 1b shows the mesh configuration for the tree line discharge model. In regions with large temperature gradients and high curvature, boundary layer meshes were added to improve simulation accuracy. A free triangular mesh was used, with a minimum mesh size of 0.015 mm and a maximum mesh size of 1.64 mm.
The physical parameters involved in simulation calculations primarily include density, electrical conductivity, specific heat capacity, and thermal conductivity, as shown in Table 1.
Based on the principles of magnetohydrodynamics, this study employs a coupled solution approach using governing equations derived from the electromagnetic field equations, the mass conservation equation, the energy conservation equation, and the momentum conservation equation.
(1)
Electromagnetic Equations:
· ( σ φ ) = 0
E = φ
J = σ E
× × A = μ 0 J
B = × A
In the equation, σ represents electrical conductivity; φ represents potential; A represents magnetic flux density; E represents electric field strength; μ0 represents the magnetic permeability of free space; and J represents current density.
(2)
Mass Conservation Equation:
ρ t + · ( ρ v ) = 0
In the equation, ρ represents density; v represents flow velocity; and t represents time.
(3)
The Equation of Energy Conservation:
F = J × B
ρ v t + ρ ( v · ) v = · p I + μ v + ( v ) T + F
In the equation, I am the identity matrix; μ is the dynamic viscosity of the plasma; p is the pressure; J is the current density; and B is the magnetic field strength.
(4)
The Equation of Conservation of Momentum:
ρ c p T t + ρ c p v · T = · k T + Q
Q = t 5 k B T 2 q ( T · J ) + E · J + Q r a d
Q r a d = 4 π ε n
In the equation, cp is the specific heat at constant pressure; T is the temperature; k is the thermal conductivity; kB is the Boltzmann constant; q is the charge; and εn is the temperature-dependent net volume emissivity.
To ensure that the simulation model accurately reflects the actual operating conditions and that the solutions for the flow field, temperature field, and electromagnetic field converge, the following initial and boundary conditions are set to provide constraints. In the established arc plasma model, the wire is defined as the terminal, and the bottom of the branch is set as a grounded boundary with a potential of zero; the boundary of the air domain is set as an open boundary, with the air pressure set to one standard atmosphere and the temperature set to 293.15 K.

2.2. Causes of Partial Discharge

When the electric field strength reaches a certain level, leakage current will be generated on the surface of the insulation layer. Under the action of Joule heat caused by the leakage current, moisture on the surface of the insulating material gradually evaporates, forming non-uniform local dry zones or dry bands. If the electric field strength between the dry bands exceeds the breakdown field strength of air, arcing discharge will be initiated [17,18]. Considering that partial discharge is essentially a streamer-type discharge, the inception electric field strength, Einc (i.e., the minimum electric field required to initiate partial discharge), can be derived based on the critical streamer theory [19,20], with the expression as follows:
E inc = ( E / p ) cr P 1 + B ( p d cav ) n
(E/p)cr is the pressure-reduced critical electric field; p represents the pressure in air; B and n are constants; and dcav denotes the height of the medium in the direction of the applied electric field. For air as the medium, (E/p)cr = 25.2 V·Pa−1·m−1, B = 8.6, and n = 0.5.
Additionally, some researchers consider the inception voltage, Uinc, to be the breakdown value between two electrodes with a uniform electric field distribution [21]. According to Paschen’s Law, this expression is derived from the fitting of experimental data [22].
U inc = 24.41 ( ρ 0 d cav ) + 6.73 ρ 0 d cav
ρ 0 = p 1.013 × 10 5 · 293 T
ρ0 represents the relative air density with respect to standard conditions (p = 1.013 × 10⁵ Pa; T = 293 K); Uinc is the voltage across the gap when the inception electric field is reached, in kV; and dcav denotes the gap distance, in cm.
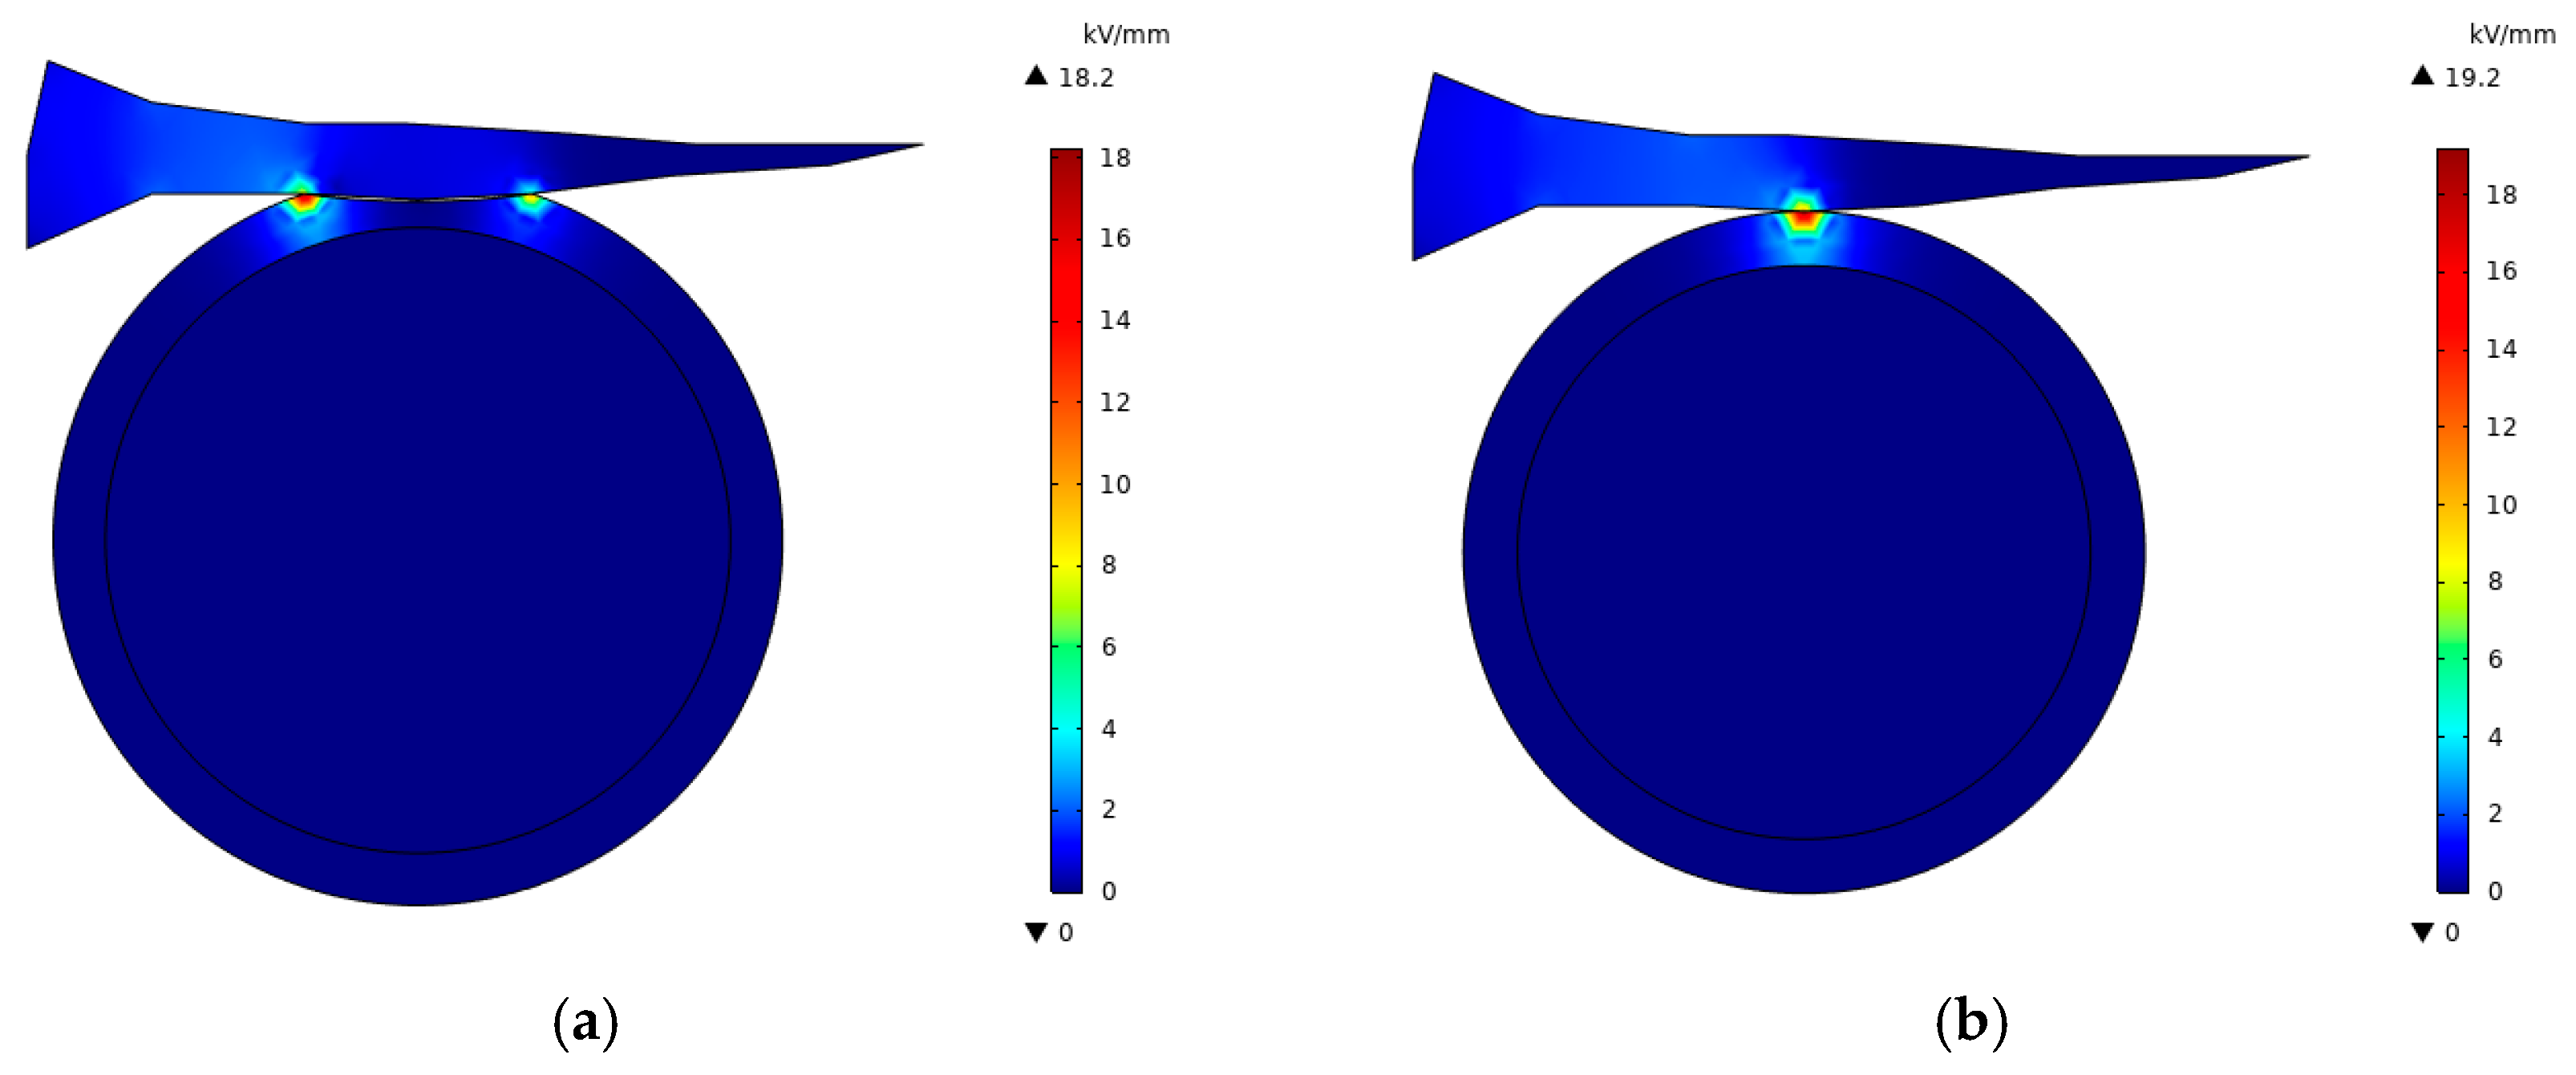
Figure 2a,b show the electric field distribution contour plots for Case 2 and Case 3, respectively. It can be observed that the electric field exhibits a pronounced concentration trend in the region where the vegetation contacts the conductor. In the areas without tree contact, the electric field strength is very low, approaching zero.
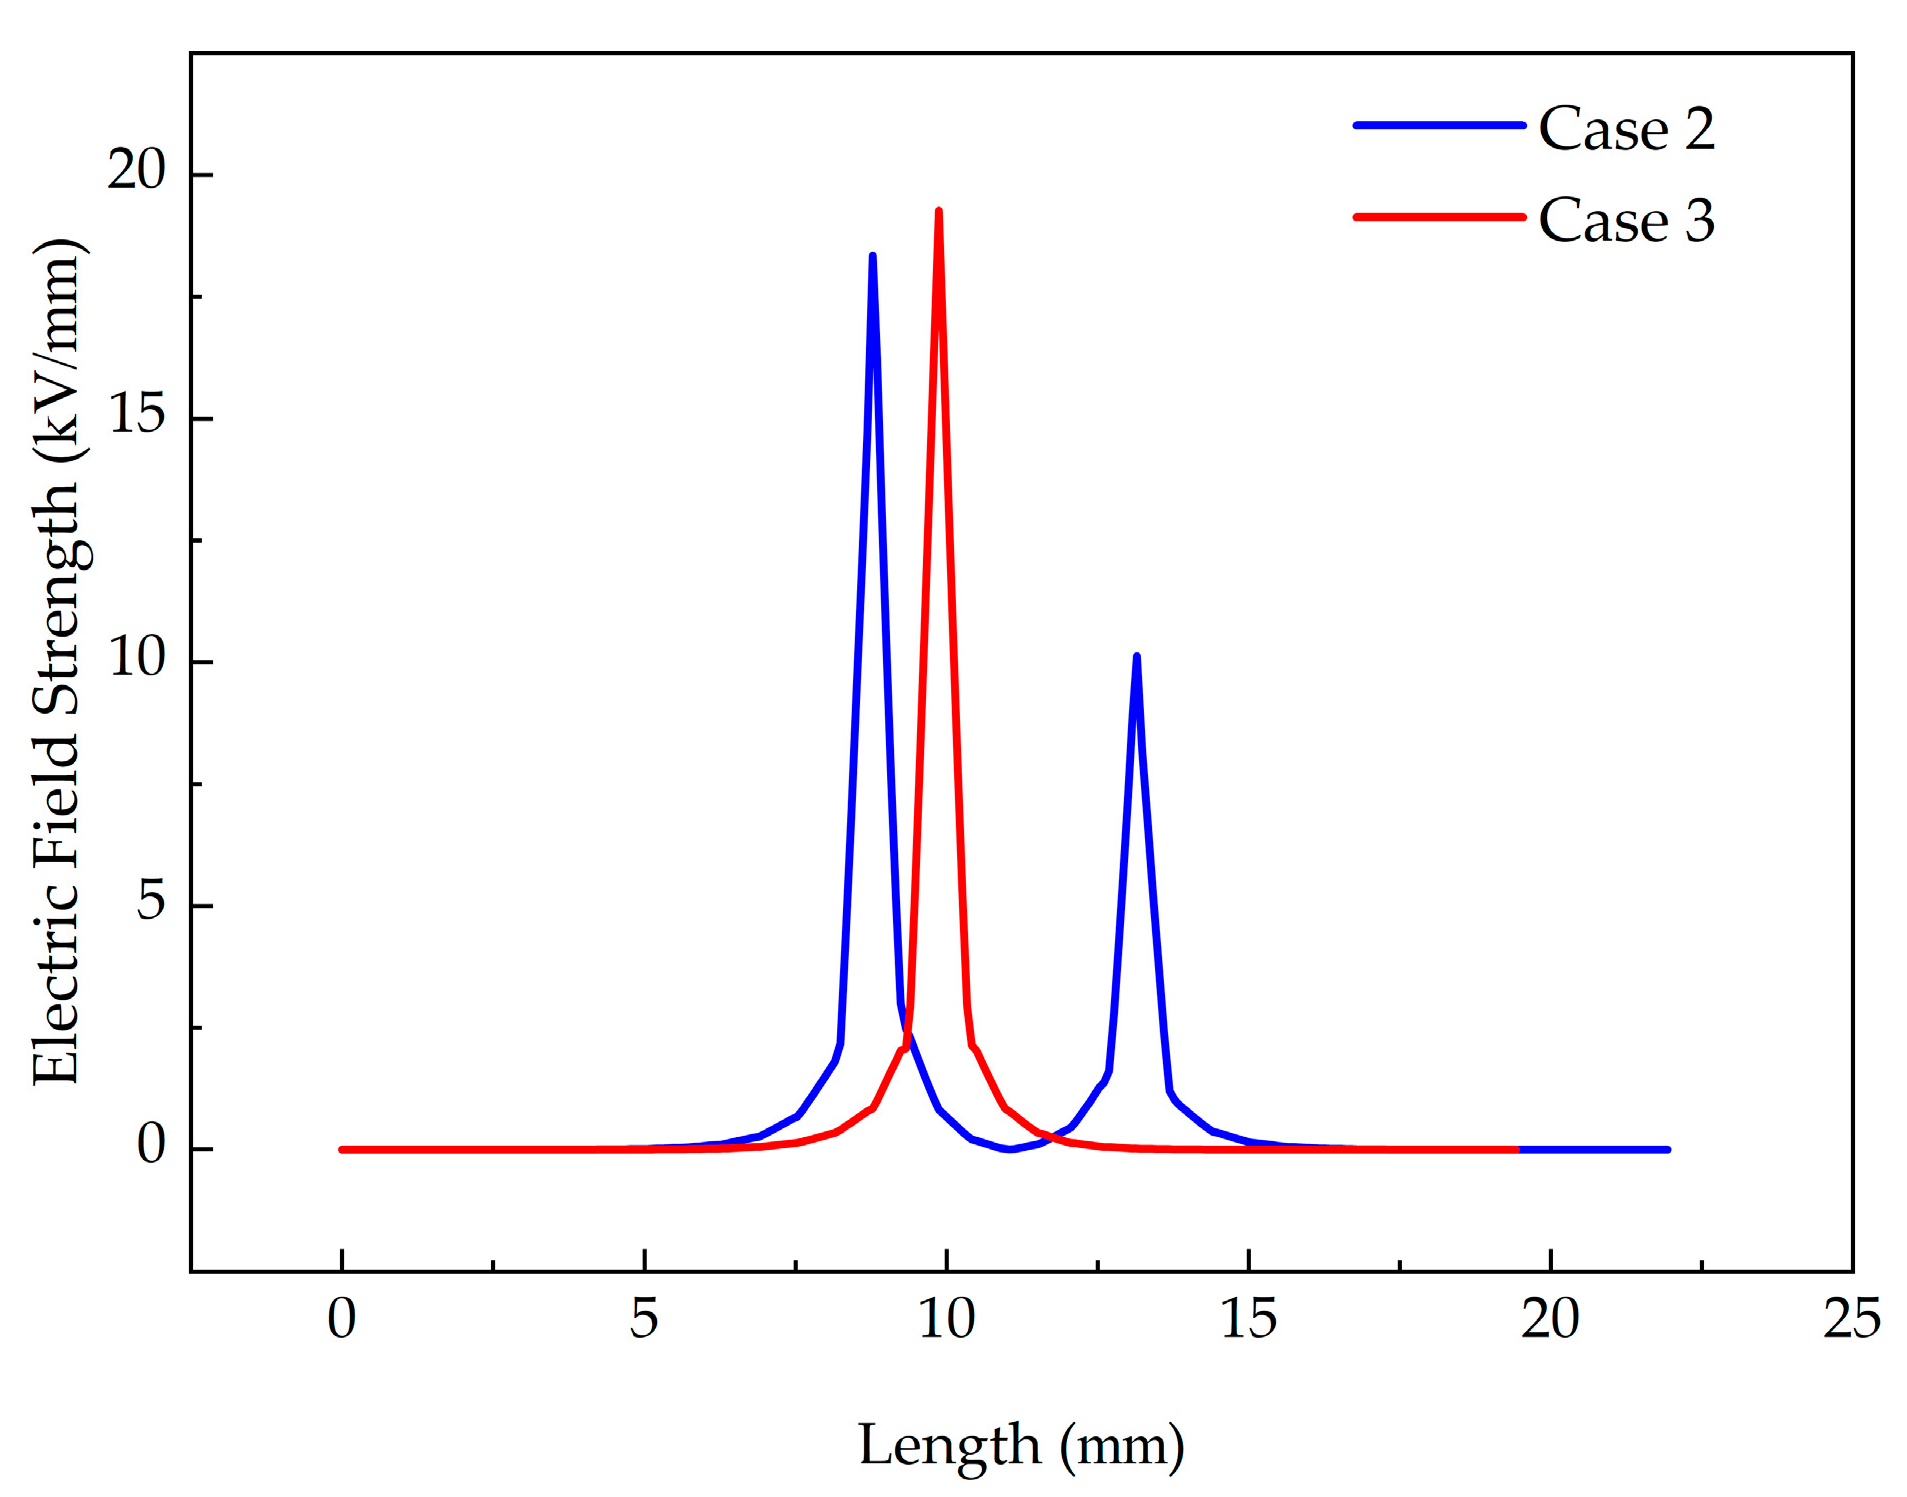
The electric field distribution along the critical path within the insulation layer was extracted, as shown in Figure 3. In Case 2, the electric field strength is highest at the contact point near the grounded side, reaching 18.2 kV/mm, while at the contact point away from the grounded side, the field strength is 10.1 kV/mm. In Case 3, the field strength at the contact point is 19.2 kV/mm, which is higher than the electric field value at any location in Case 2. Reference [23] indicates that when the electric field strength exceeds 7.97 kV/mm, free electrons can develop into partial discharge within a cylindrical cavity of 0.1 mm in height. The electric field strengths at all contact points in this simulation are significantly higher than this threshold, confirming that the partial discharge induced by tree contact faults on insulated conductors is primarily attributed to electric field distortion.

2.3. Temperature Distribution Within the Cross-Section of a Branch

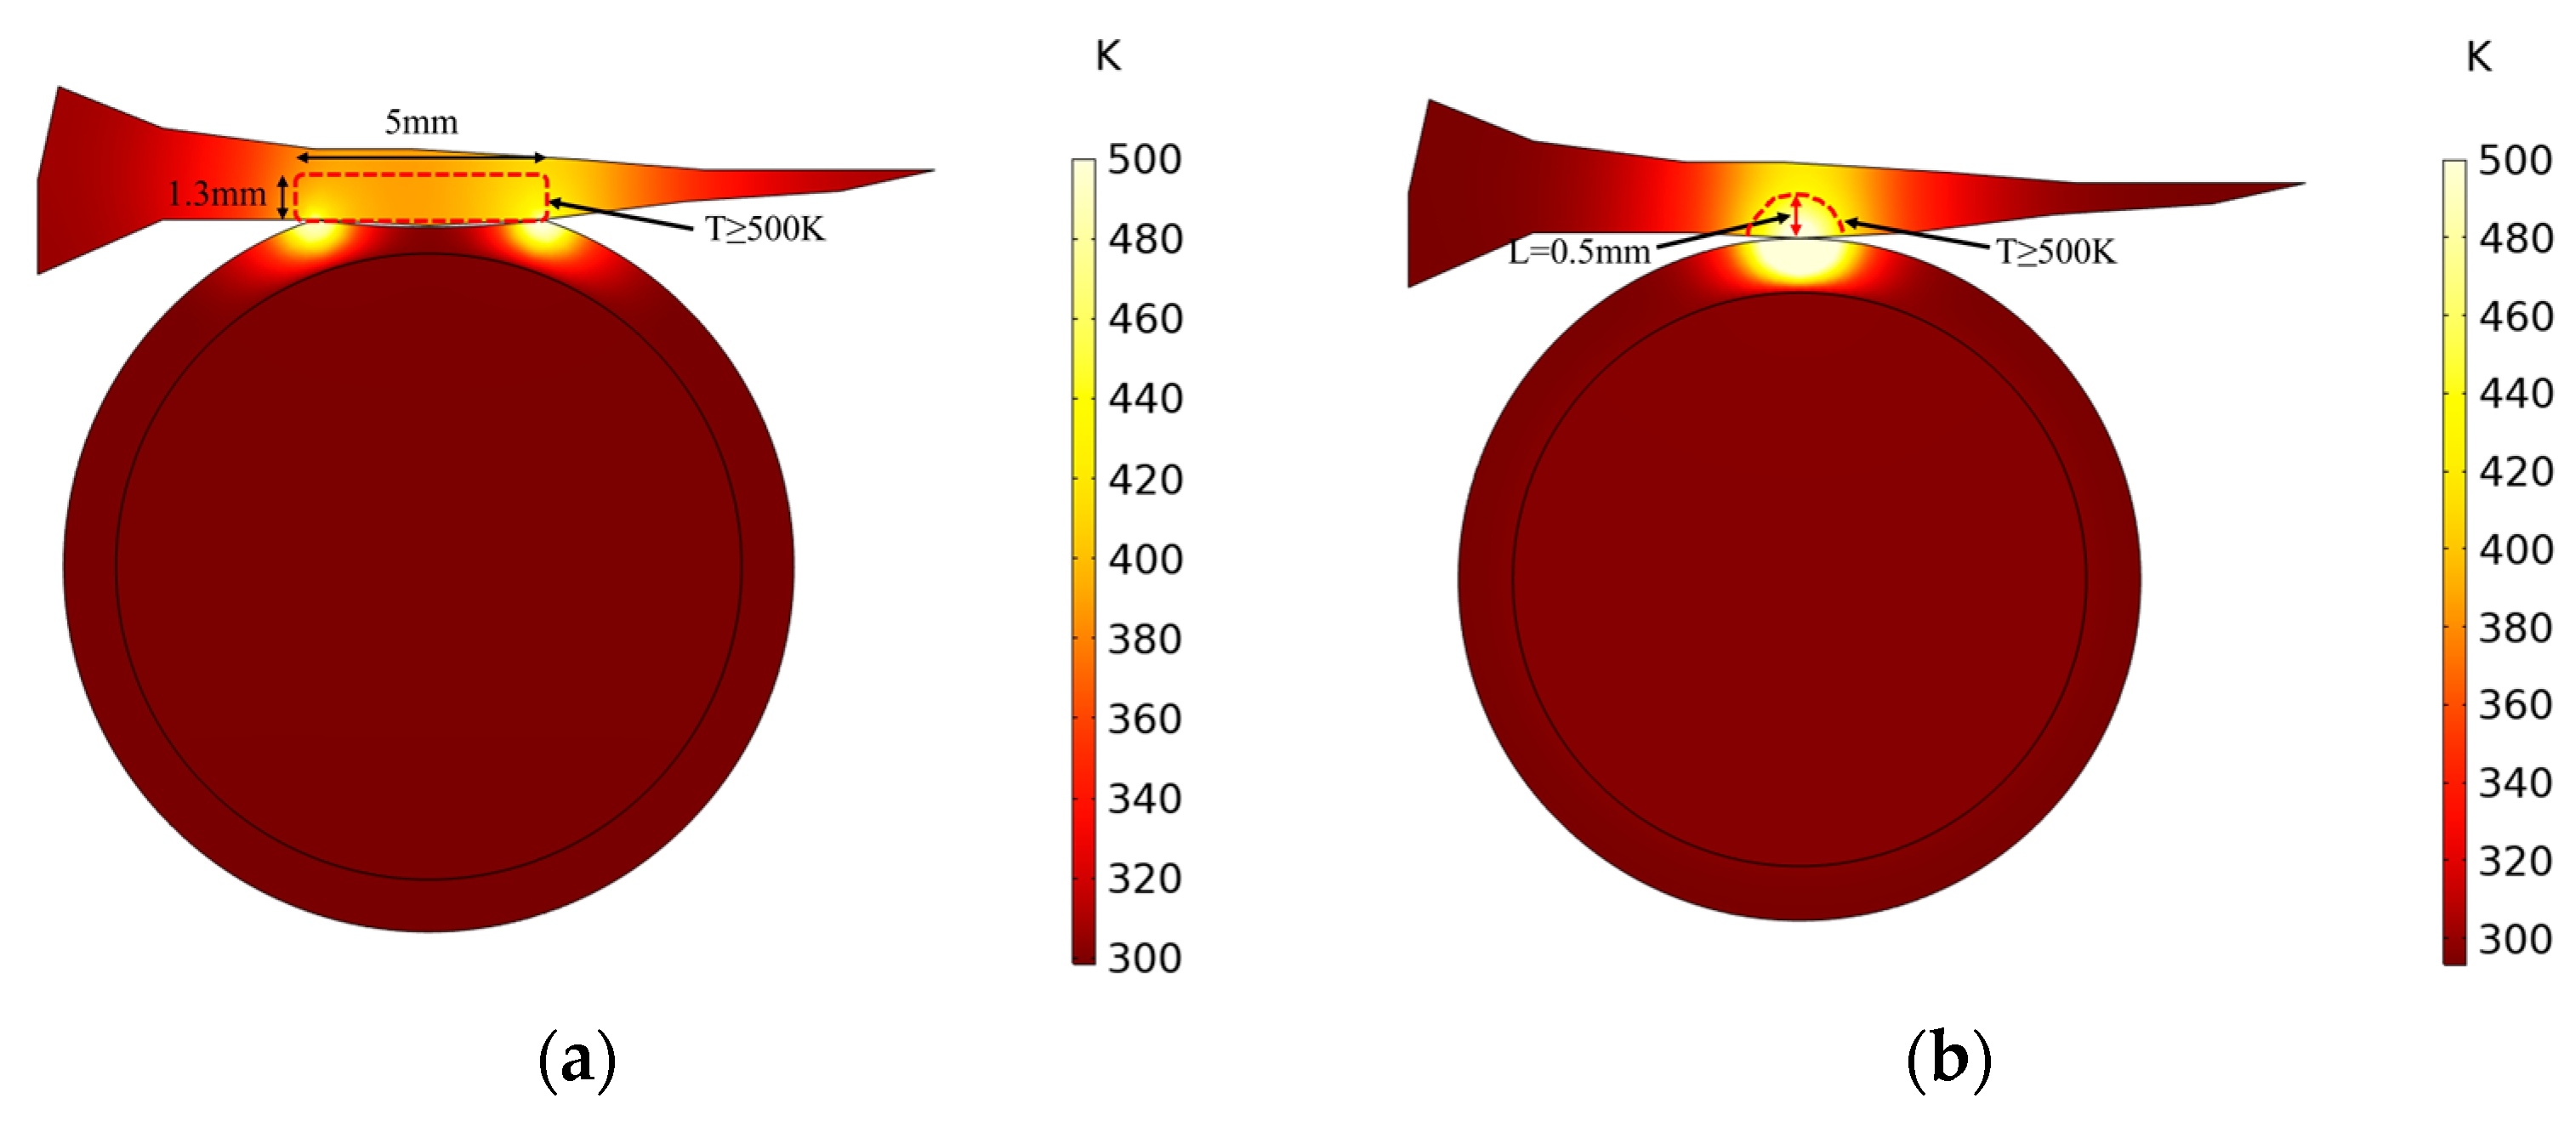
Tree-to-line ground faults are typical high-resistance ground faults. Due to the high ground resistance introduced by the tree, the fault transient process is extremely brief, and the system rapidly enters a steady state [24]. Therefore, this paper neglects the transient process and focuses on analyzing the steady-state phase of the fault. Through thermo-electrical coupling simulation, the temperature distribution within the cross-section of the branch at the point of contact with the power line was obtained, as shown in Figure 4. The ignition point of a typical fresh branch is approximately 500 K [25]. Based on this, the carbonization depth within the branch can be estimated. As shown in Figure 4a, the area within the red dashed box indicates regions where the temperature exceeds 500 K, i.e., the carbonized region of the branch. Accordingly, the carbonized area of the branch in Case 2 was calculated to be 6.5 mm2, while the carbonized region in Case 3 appears as a red semicircle with a carbonized area of 0.785 mm2.
Due to the uneven distribution of the electric field between the branches and the conductors, partial discharges are likely to occur at the points of contact, generating Joule heating that causes local temperature increases. Once the temperature exceeds the ignition point of fresh branches, carbonization begins. The electrical conductivity of the carbonized area is significantly higher than that of fresh wood, causing the current to concentrate further in the carbonized region, forming localized hot spots and promoting the continuous expansion of the carbonized area. The difference in charred area between Case 2 and Case 3 primarily stems from variations in contact geometry and current paths. In Case 2, the contact area between the branch and the power line is larger or there are more contact points, resulting in a more dispersed current distribution; consequently, the charred area is larger and irregular in shape. In contrast, in Case 3, the contact points are smaller, and the current is concentrated in a localized area, resulting in a semicircular charred area with a smaller surface area.

3. Experimental Samples and Platform Setup

This section systematically elaborates on the experimental platform employed, the selection of samples, and the design of three typical defect scenarios. The experimental platform comprises a combined impulse and power frequency voltage application system, a high-speed camera, an ultraviolet detection instrument, and other equipment, enabling the simulation of tree–conductor contact and the observation of the discharge process. Camphor branches were selected as the experimental samples. Three defect scenarios were designed: complete insulation abrasion, lightning puncture hole accompanied by localized abrasion, and lightning puncture hole without abrasion, to simulate tree–conductor contact conditions under different practical insulation damage states.

3.1. The Tree Contact Discharge Experimental Platform

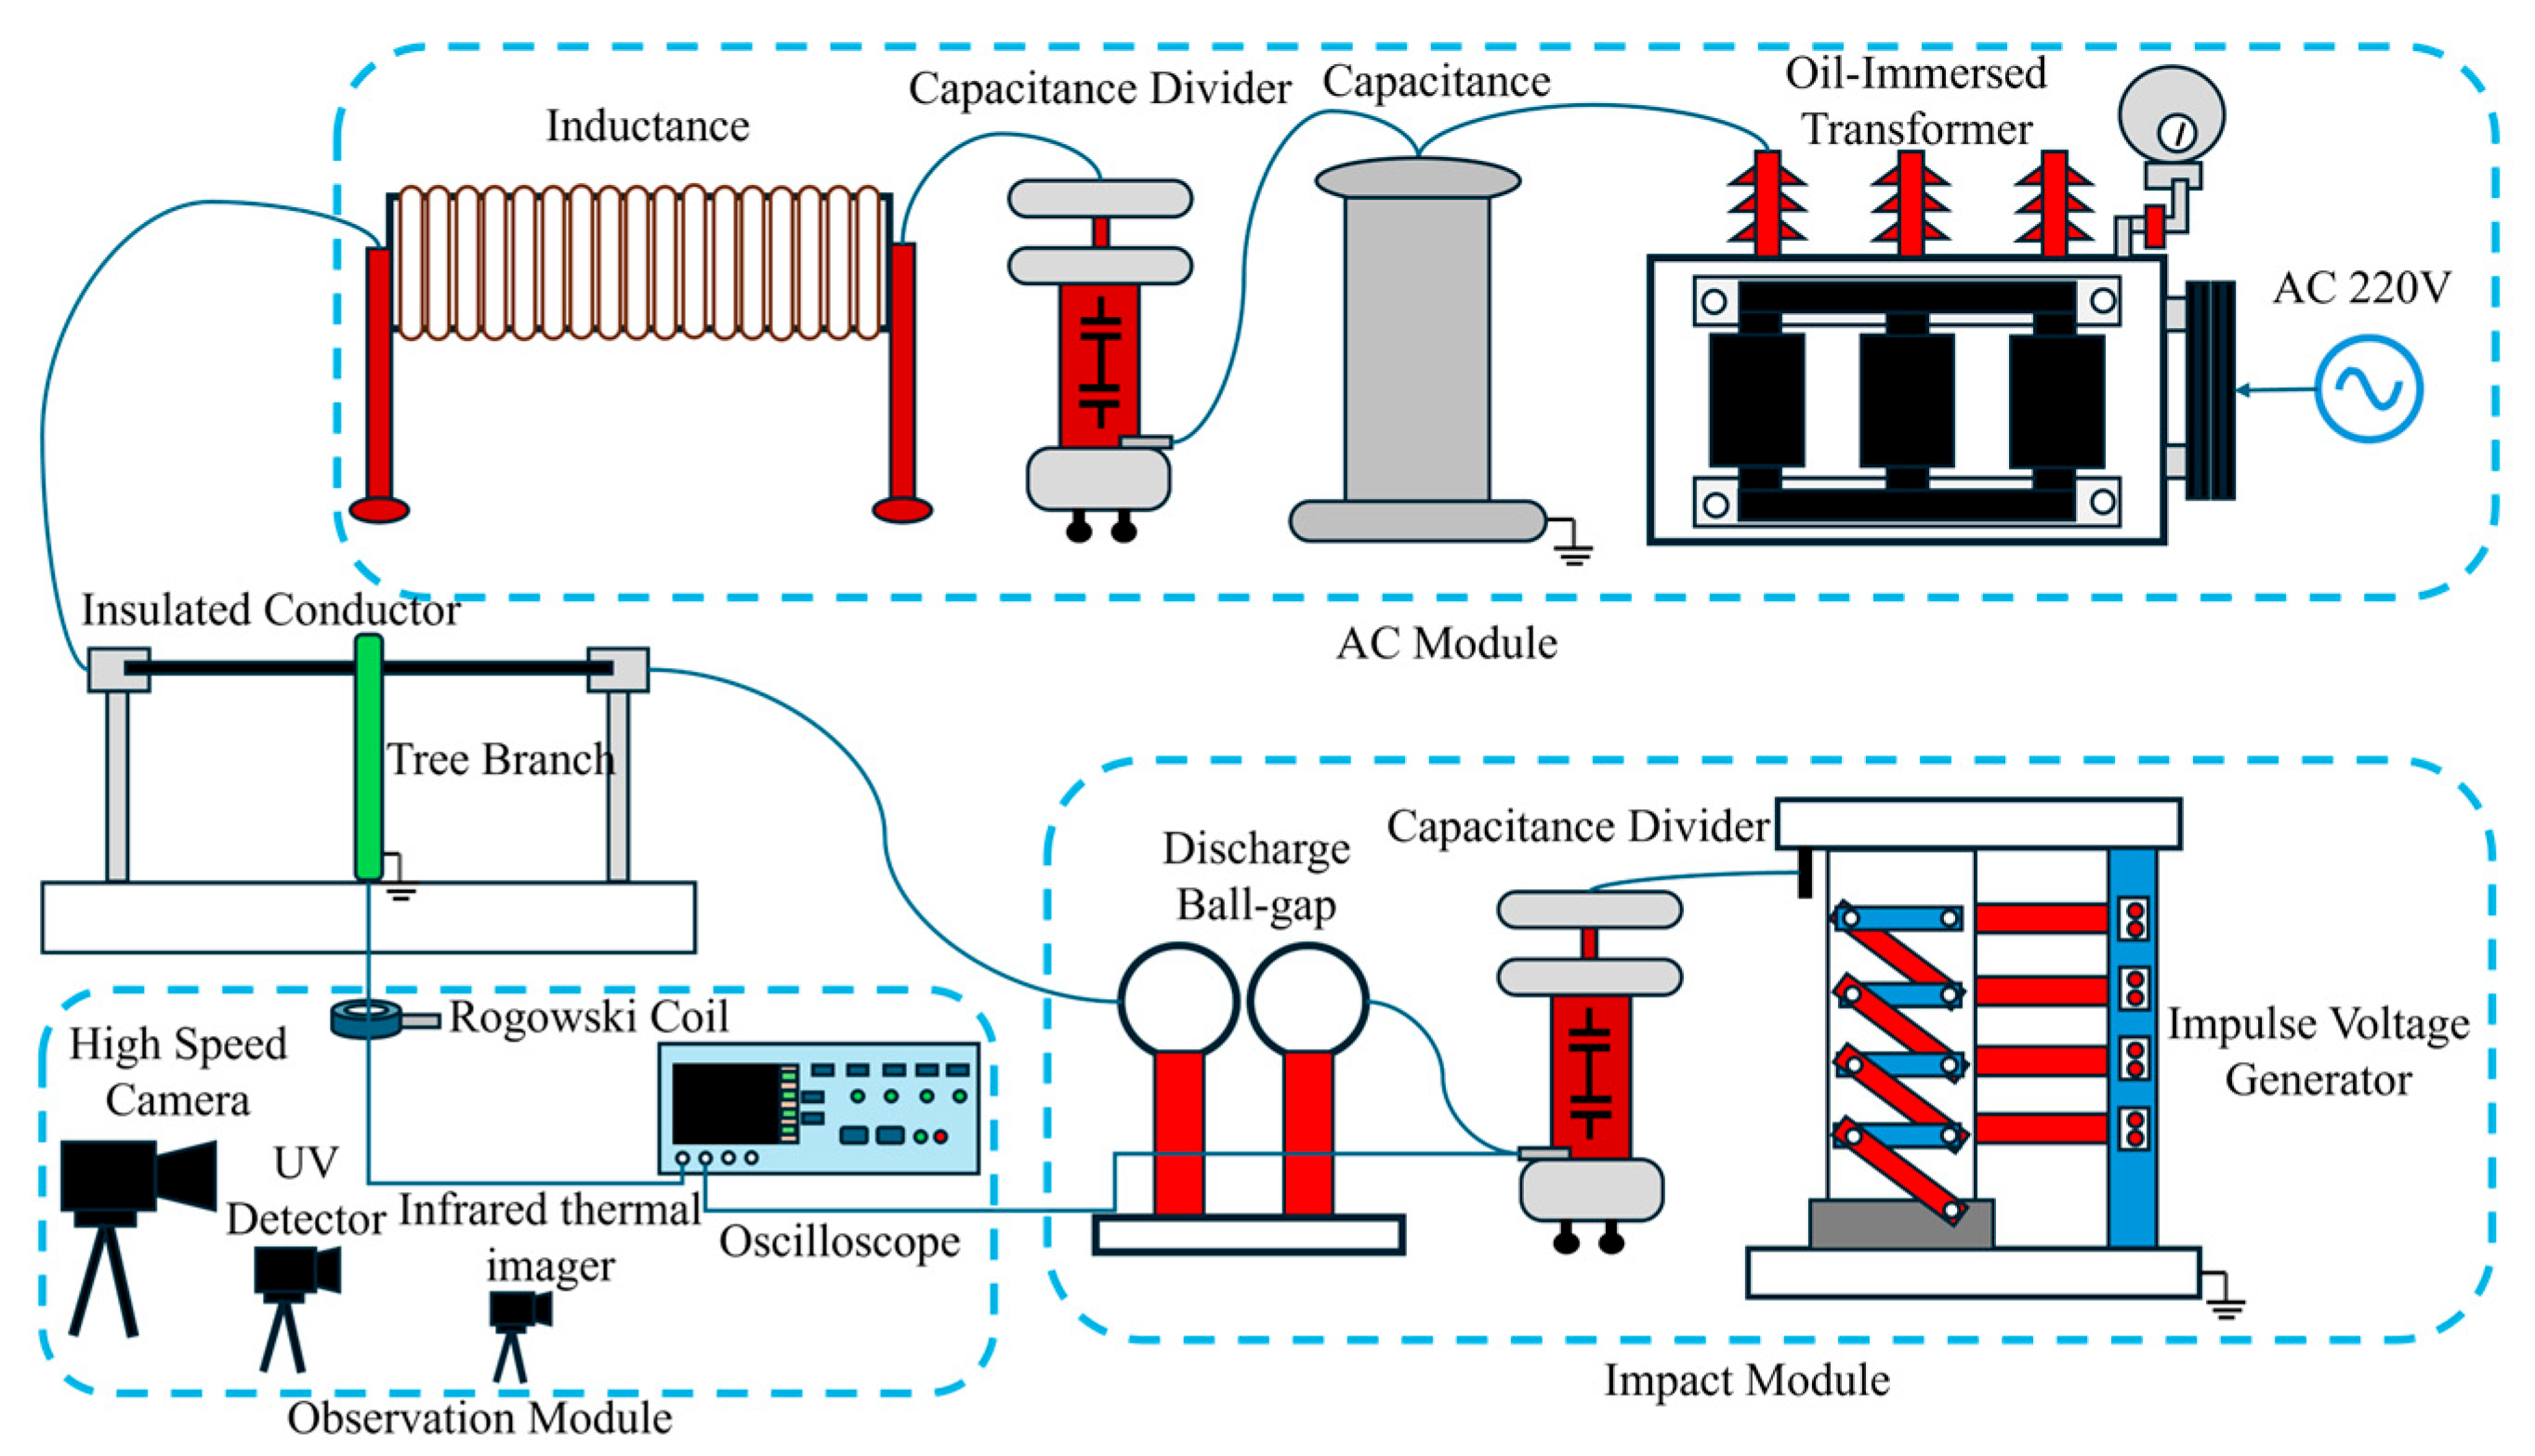
This paper establishes a joint voltage application test platform as shown in Figure 5. It consists of an impulse voltage generator module (CDY1, Beijing Hua tian Electromechanically Research Institute Co., Ltd., China Aerospace Science and Industry Corporation, Beijing, China), an AC power supply module (YD-120/24/0.6, Beijing Hua tian Electromechanical Research Institute Co., Ltd., Beijing, China), the test specimen (JKLYJ-70, Jinbiao Cable, Xingtai, China), a high-speed photography (VEO 440, Phantom, Wayne, NJ, USA), an infrared thermal imager (MAG14, Magnity technologies, Shanghai, China), a UV detection instrument (UV-260, OFIL, Migdal HaEmek, Israel) and an oscilloscope (SDS5000X, Siglent Technologies, Shenzhen, China). The impulse voltage generator can output a 400 kV standard lightning impulse overvoltage (1.2/50 μs), and a voltage divider is used to measure the output voltage waveform from the impulse generator. The power frequency voltage is supplied by a 120 kVA test transformer, allowing stepless regulation from 0 to 12 kV, and a capacitive voltage divider is used to measure the output voltage from the AC power supply. The power supply and oscilloscope used in this experiment can both be operated repeatedly [26]. To prevent mutual interference between the impulse generator and the power frequency supply, isolating sphere gaps and reactors were connected in series in front of the impulse voltage generator and the power frequency test transformer, respectively. The tree branch and conductor were arranged vertically with the end of the branch grounded. A Rogowski coil was installed below the branch to measure the short-circuit current generated by the discharge, connected to the oscilloscope. Simultaneously, the platform holding the test sample can be adjusted vertically to modify the gap distance. The high-speed camera was used for the optical observation of the discharge process, with a maximum capture rate of 3200 frames per second (fps) and an inter-frame time interval of 0.31 milliseconds. The UV detection instrument was employed to detect the intensity of partial discharge, operating within a spectral range of 240 to 280 nanometers. The infrared thermal imager has a frame rate of 30 fps and a temperature measurement range of 0–3200 °C. All the experiments were conducted in an indoor shielded laboratory under controlled environmental conditions as follows: temperature 33 °C ± 1 °C, relative humidity 50% ± 3%, and atmospheric pressure 101.3 kPa ± 0.5 kPa. Atmospheric pressure, temperature, and humidity were monitored in real time using an atmospheric pressure and temperature–humidity detector (AS509, SMART SENSOR, Guangzhou, China). During the experiments, all the environmental parameters were maintained within the specified ranges to ensure the repeatability and comparability of the experimental results.
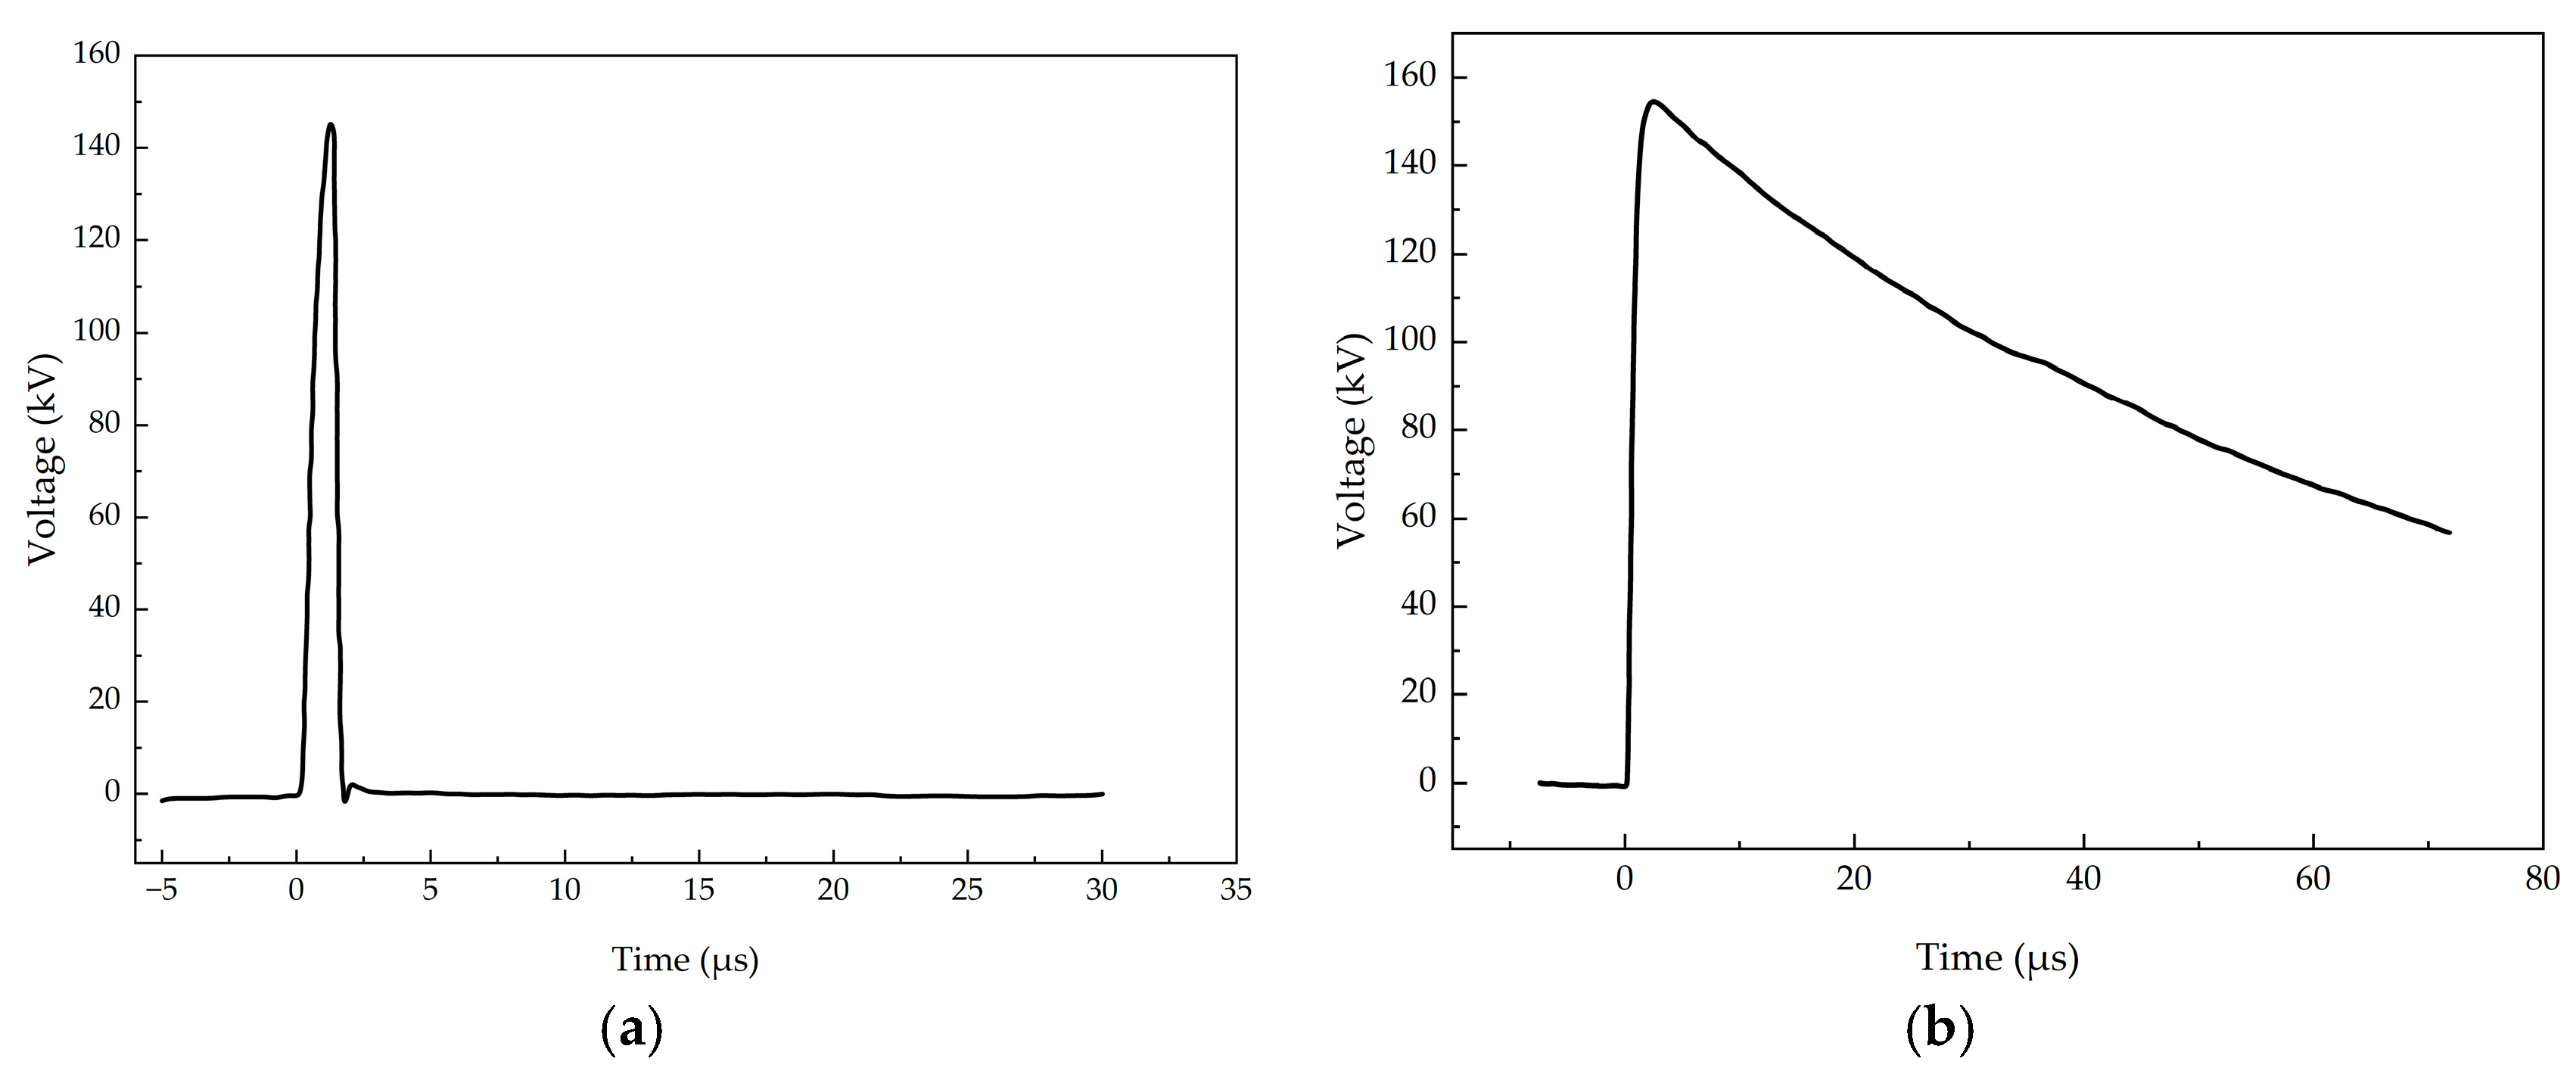
During the test, a standard lightning overvoltage (1.2/50 μs) output from the impulse generator was applied to a new insulated conductor. The up-and-down method was employed, where the standard lightning overvoltage was applied stepwise. Specifically, when an impulse voltage with an amplitude of U was applied and no breakdown occurred in the test sample, the voltage for the next application was increased by ΔU. This continued until the sample broke down, after which the applied voltage was decreased by ΔU. This process was repeated for approximately ten cycles. To accurately obtain the breakdown voltage, ΔU was set to 5 kV. Whether the tree–conductor gap experienced breakdown was determined by measuring the voltage waveform. A typical breakdown test waveform is shown in Figure 6. For the porous insulated conductor test sample, the power frequency voltage was increased to 1 kV with a step interval of 1 kV, resulting in a total of 12 groups. For each group of power frequency voltage, the tree–conductor breakdown voltage was obtained using the up-and-down method. During the lightning overvoltage discharge, the TTL signal output from the Aux out terminal of the oscilloscope collecting the lightning overvoltage waveform was converted via electro-optical conversion to trigger the high-speed camera, thereby enabling the observation of the entire discharge arc process. Simultaneously, ultraviolet detection was recorded throughout. The three tree line ignition experiments described in this paper were each conducted three times, with the placement of the branches adjusted each time to ensure experimental reproducibility and to eliminate non-critical variables.

3.2. Experimental Sample Selection and Preparation

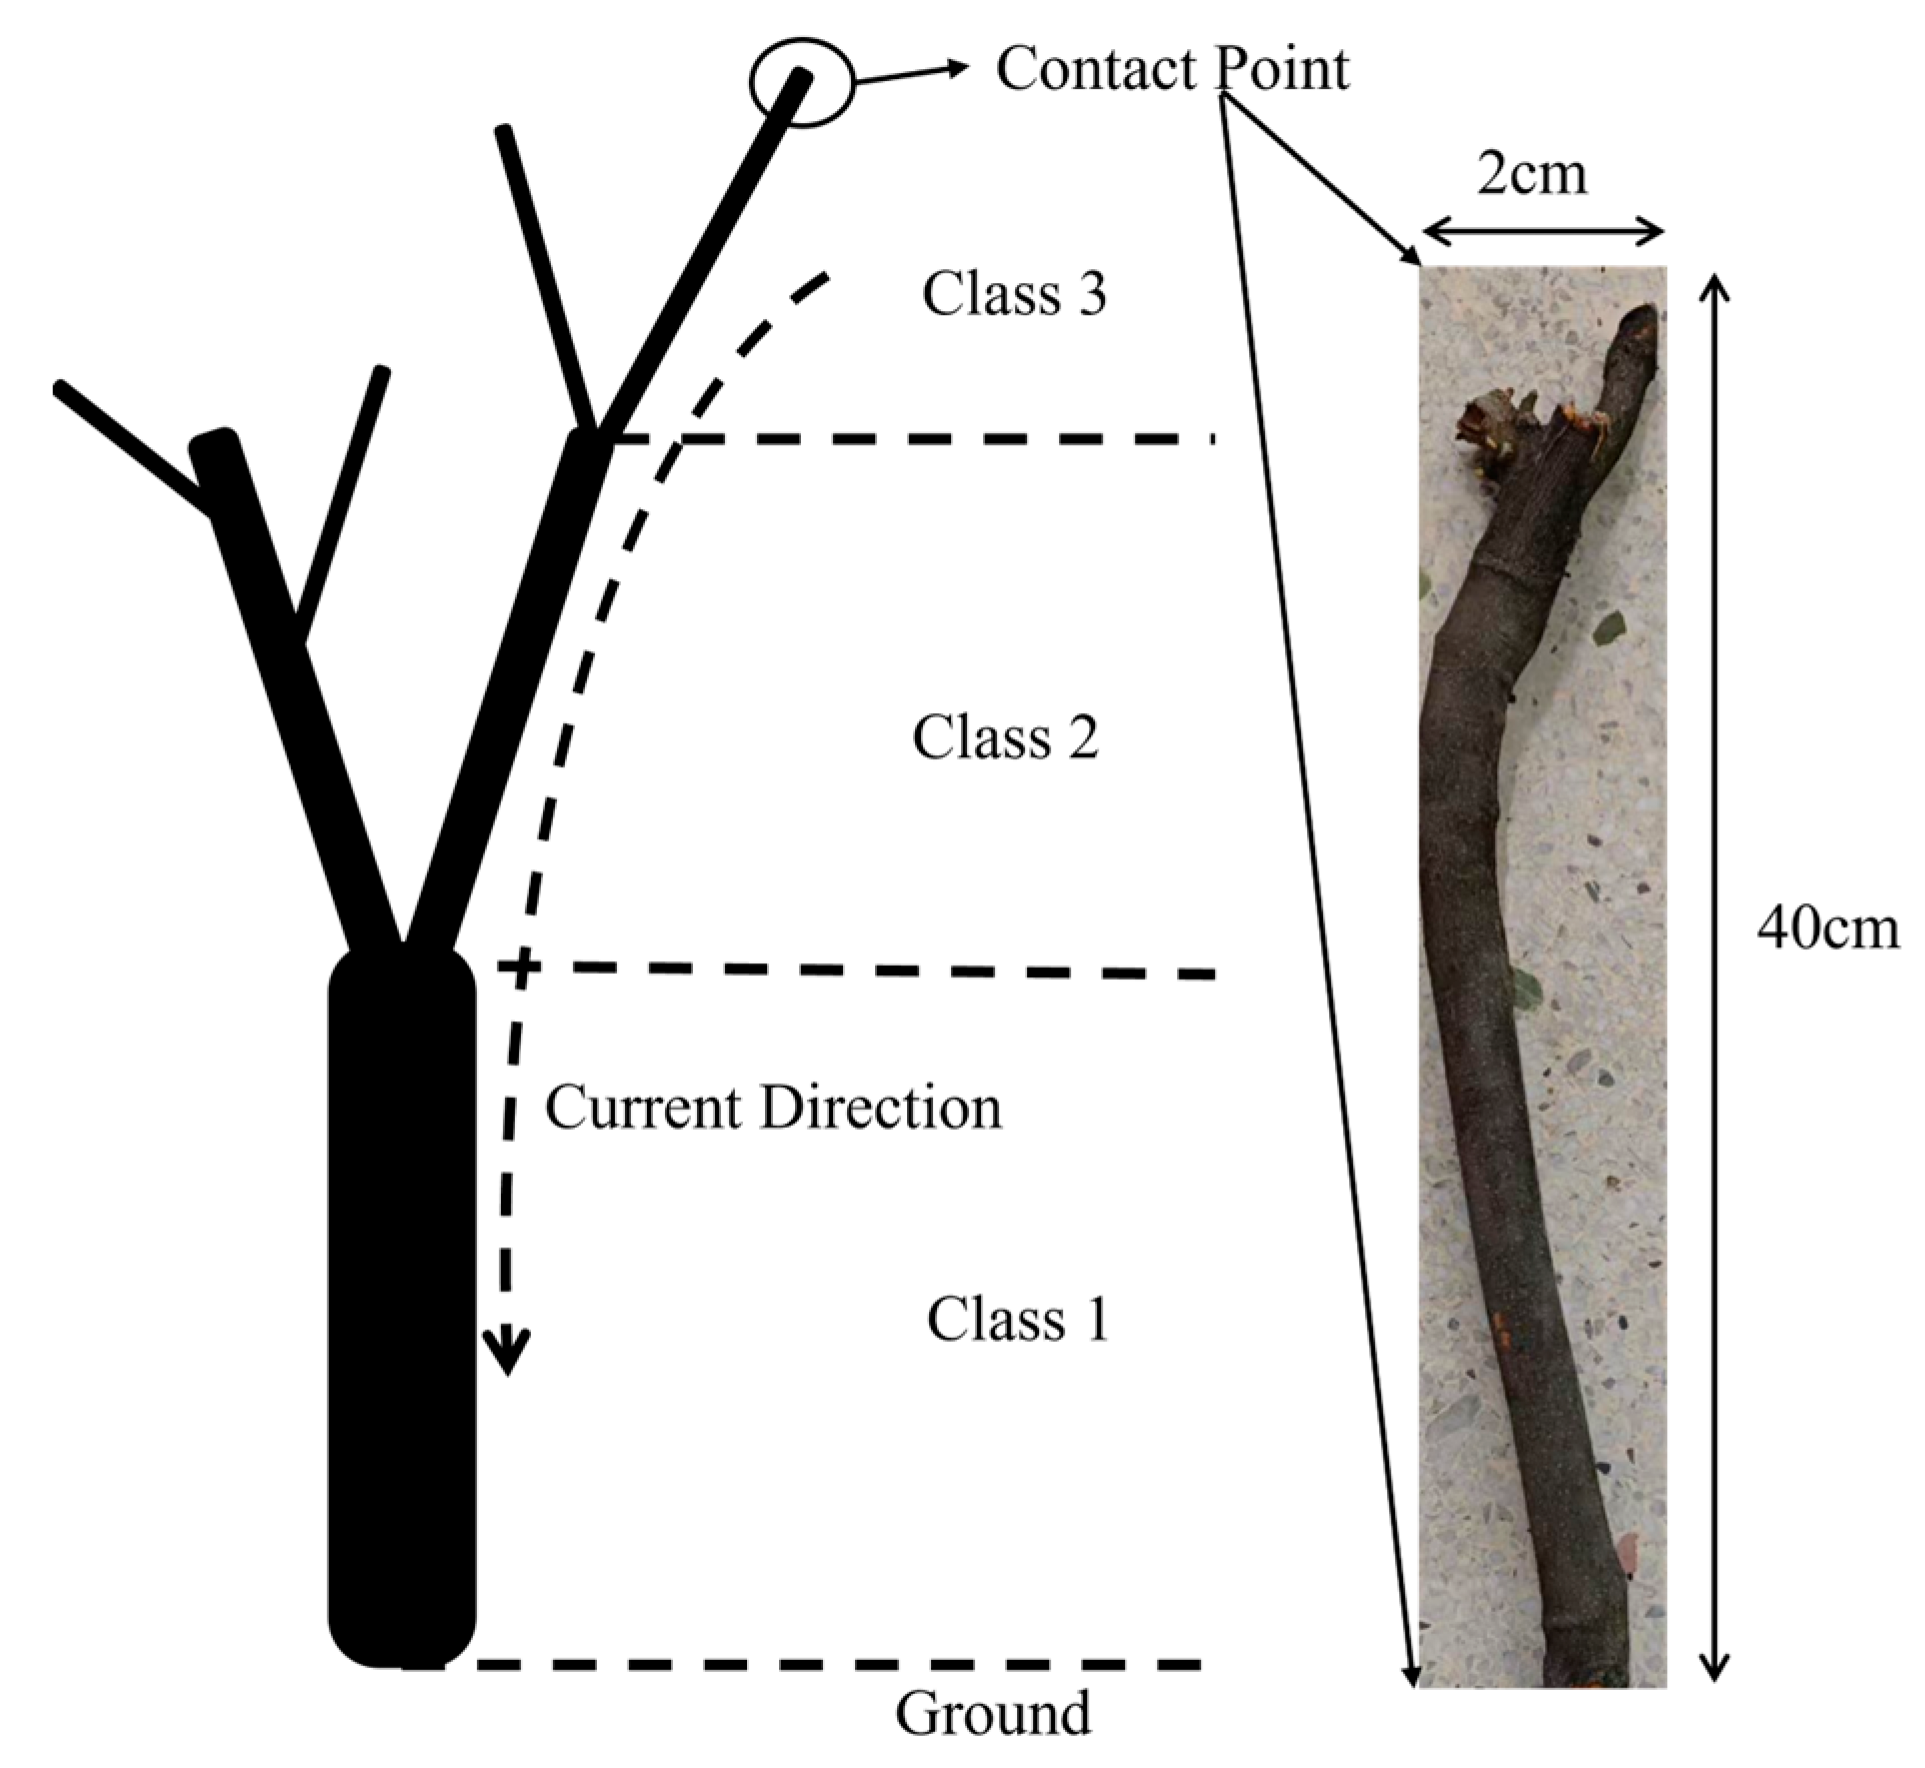
The vegetation near distribution line wildfire high-risk areas in central Hunan Province is predominantly composed of camphor trees and camellia trees. Vegetation exhibits significant variation due to differences in geographical locations, growth environments, and its own morphological structure. To enhance the reliability and repeatability of the experiments, camphor tree branches from the same batch, collected from a certain mountainous area, were selected as test samples. Prior to testing, their leaves and fine branches were removed, as shown in Figure 7, resulting in samples that were approximately 40 cm in length and 2 cm in diameter.
The branch samples used in this experiment were fresh eucalyptus branches (with a moisture content of 86.7%, a diameter of 0.02 m, and a length of 0.4 m). The equivalent resistance of the vegetation, measured with a multimeter, was 52.72 kΩ. When tree–conductor contact occurs, the tree can be considered as multiple resistors connected in series, and the simplified fault resistance can be expressed as
R V = R l v 1 + R l v 2 + R l v 3
where Rlv1, Rlv2, and Rlv3 are the volume resistance values of each respective level.
In typical scenarios, a TSF can be modeled as a series of several variable resistors, with Rv represented as follows:
R V = n = 1 N R l v n
where Rlvn is the volume resistance of the n-th-level branch, and N is the number of branch levels in the current path.
To simplify the analysis, the branches are modeled as uniform cylinders. The resistance of the n-th level branch is expressed as follows:
R l v n = ρ n b n π r n 2
where ρn, hn, and Rn are the resistivity, height, and radius of the n-th level branch, respectively.
The equivalent resistance of the branch at the point of conductor contacts accounts for approximately 80% of the tree’s overall equivalent resistance [10]. Therefore, the branches selected for testing can largely represent the discharge and ignition characteristics of the vegetation in actual faults.
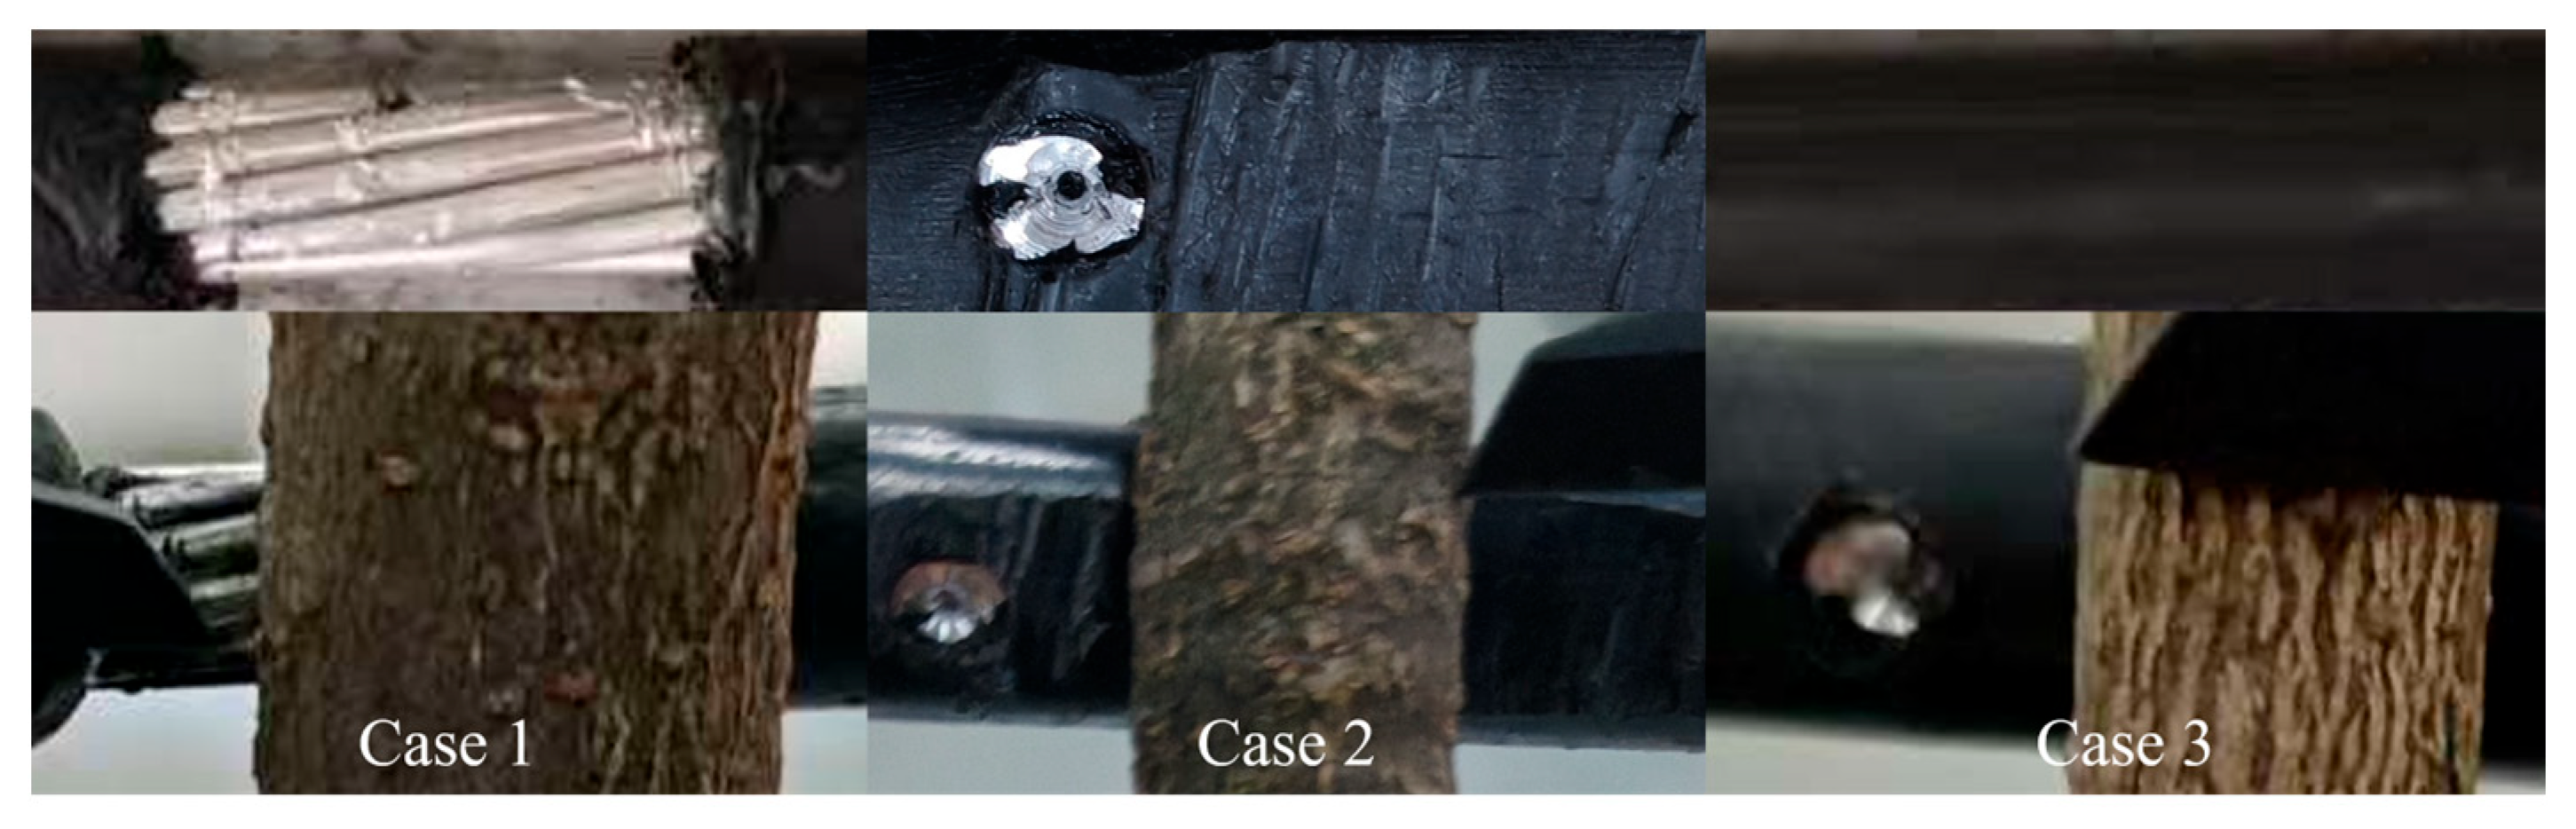
To investigate the discharge patterns from tree–conductor abrasion on insulated conductors, and considering that the insulation layer of medium-voltage insulated conductors can suffer varying degrees of damage in practice for various reasons, this experiment established three tree–conductor fault scenarios with different insulation conditions, as illustrated in Figure 8. The detailed configurations are provided in Table 2. The insulation layer of the 70 mm2 insulated conductor was abraded to half of its original thickness using a tree branch, while manual holes were drilled into the conductor to simulate lightning puncture holes or process-related defects such as bubbles or voids within the insulation layer.

4. Multi-Modal Integrated Observation and Analysis

Based on experimental data, this study comprehensively utilizes high-speed imaging and ultraviolet detection technologies to conduct a comparative analysis of the discharge development process, UV discharge intensity, and ablation trace characteristics across the three scenarios.

4.1. Dynamic Process of Tree Contact Discharge Based on High-Speed Imaging

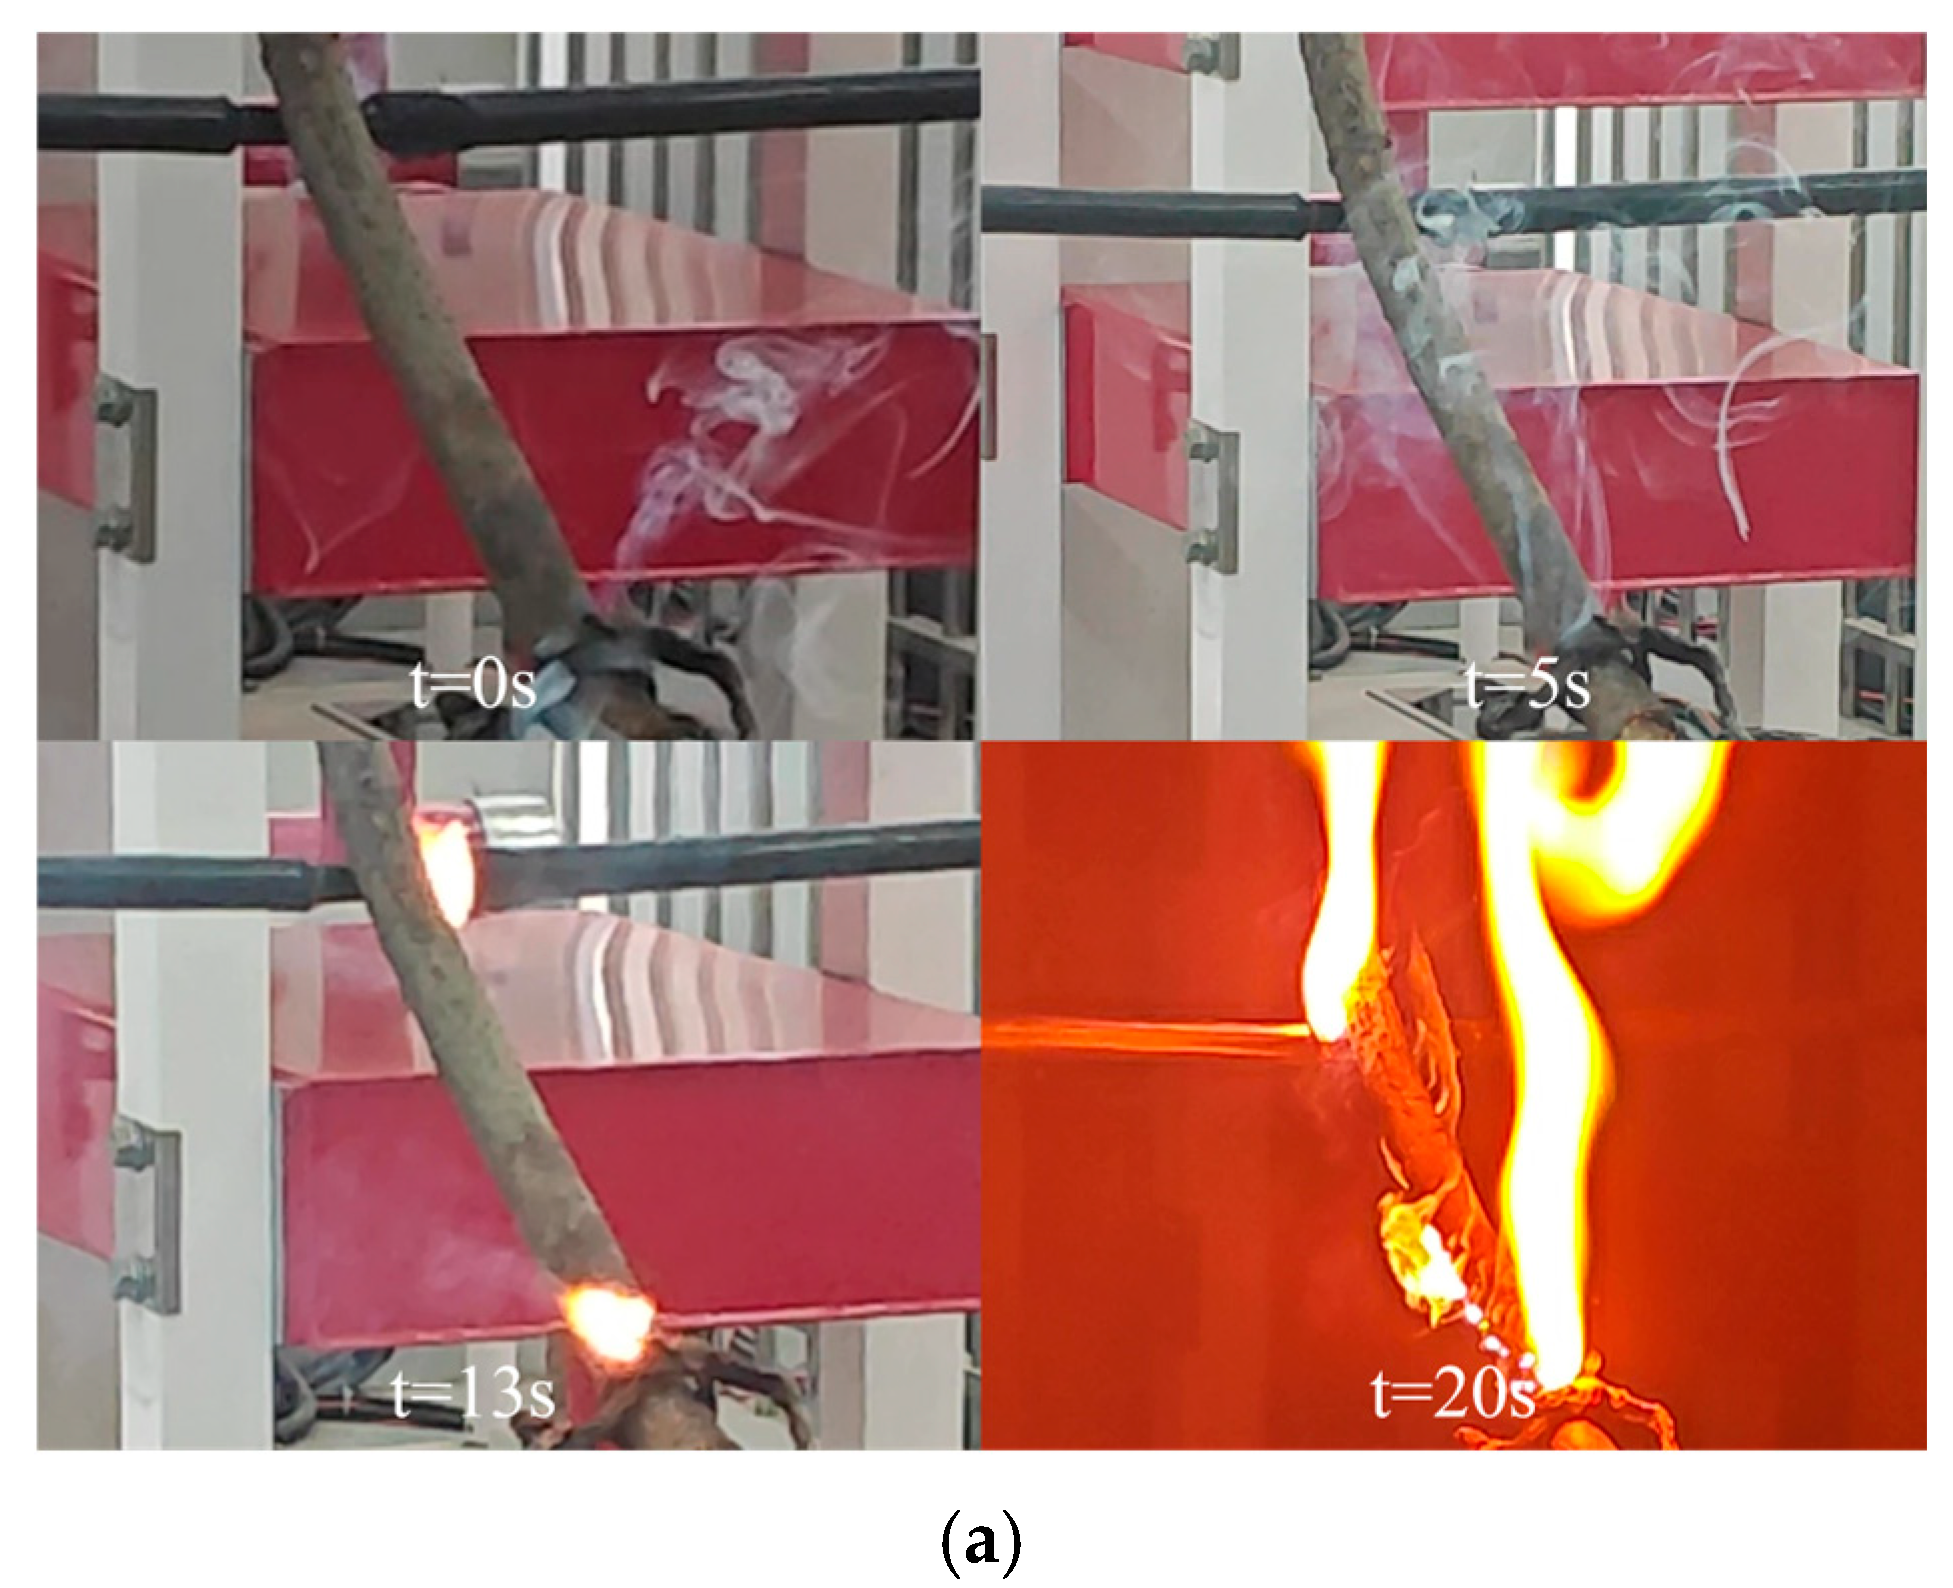
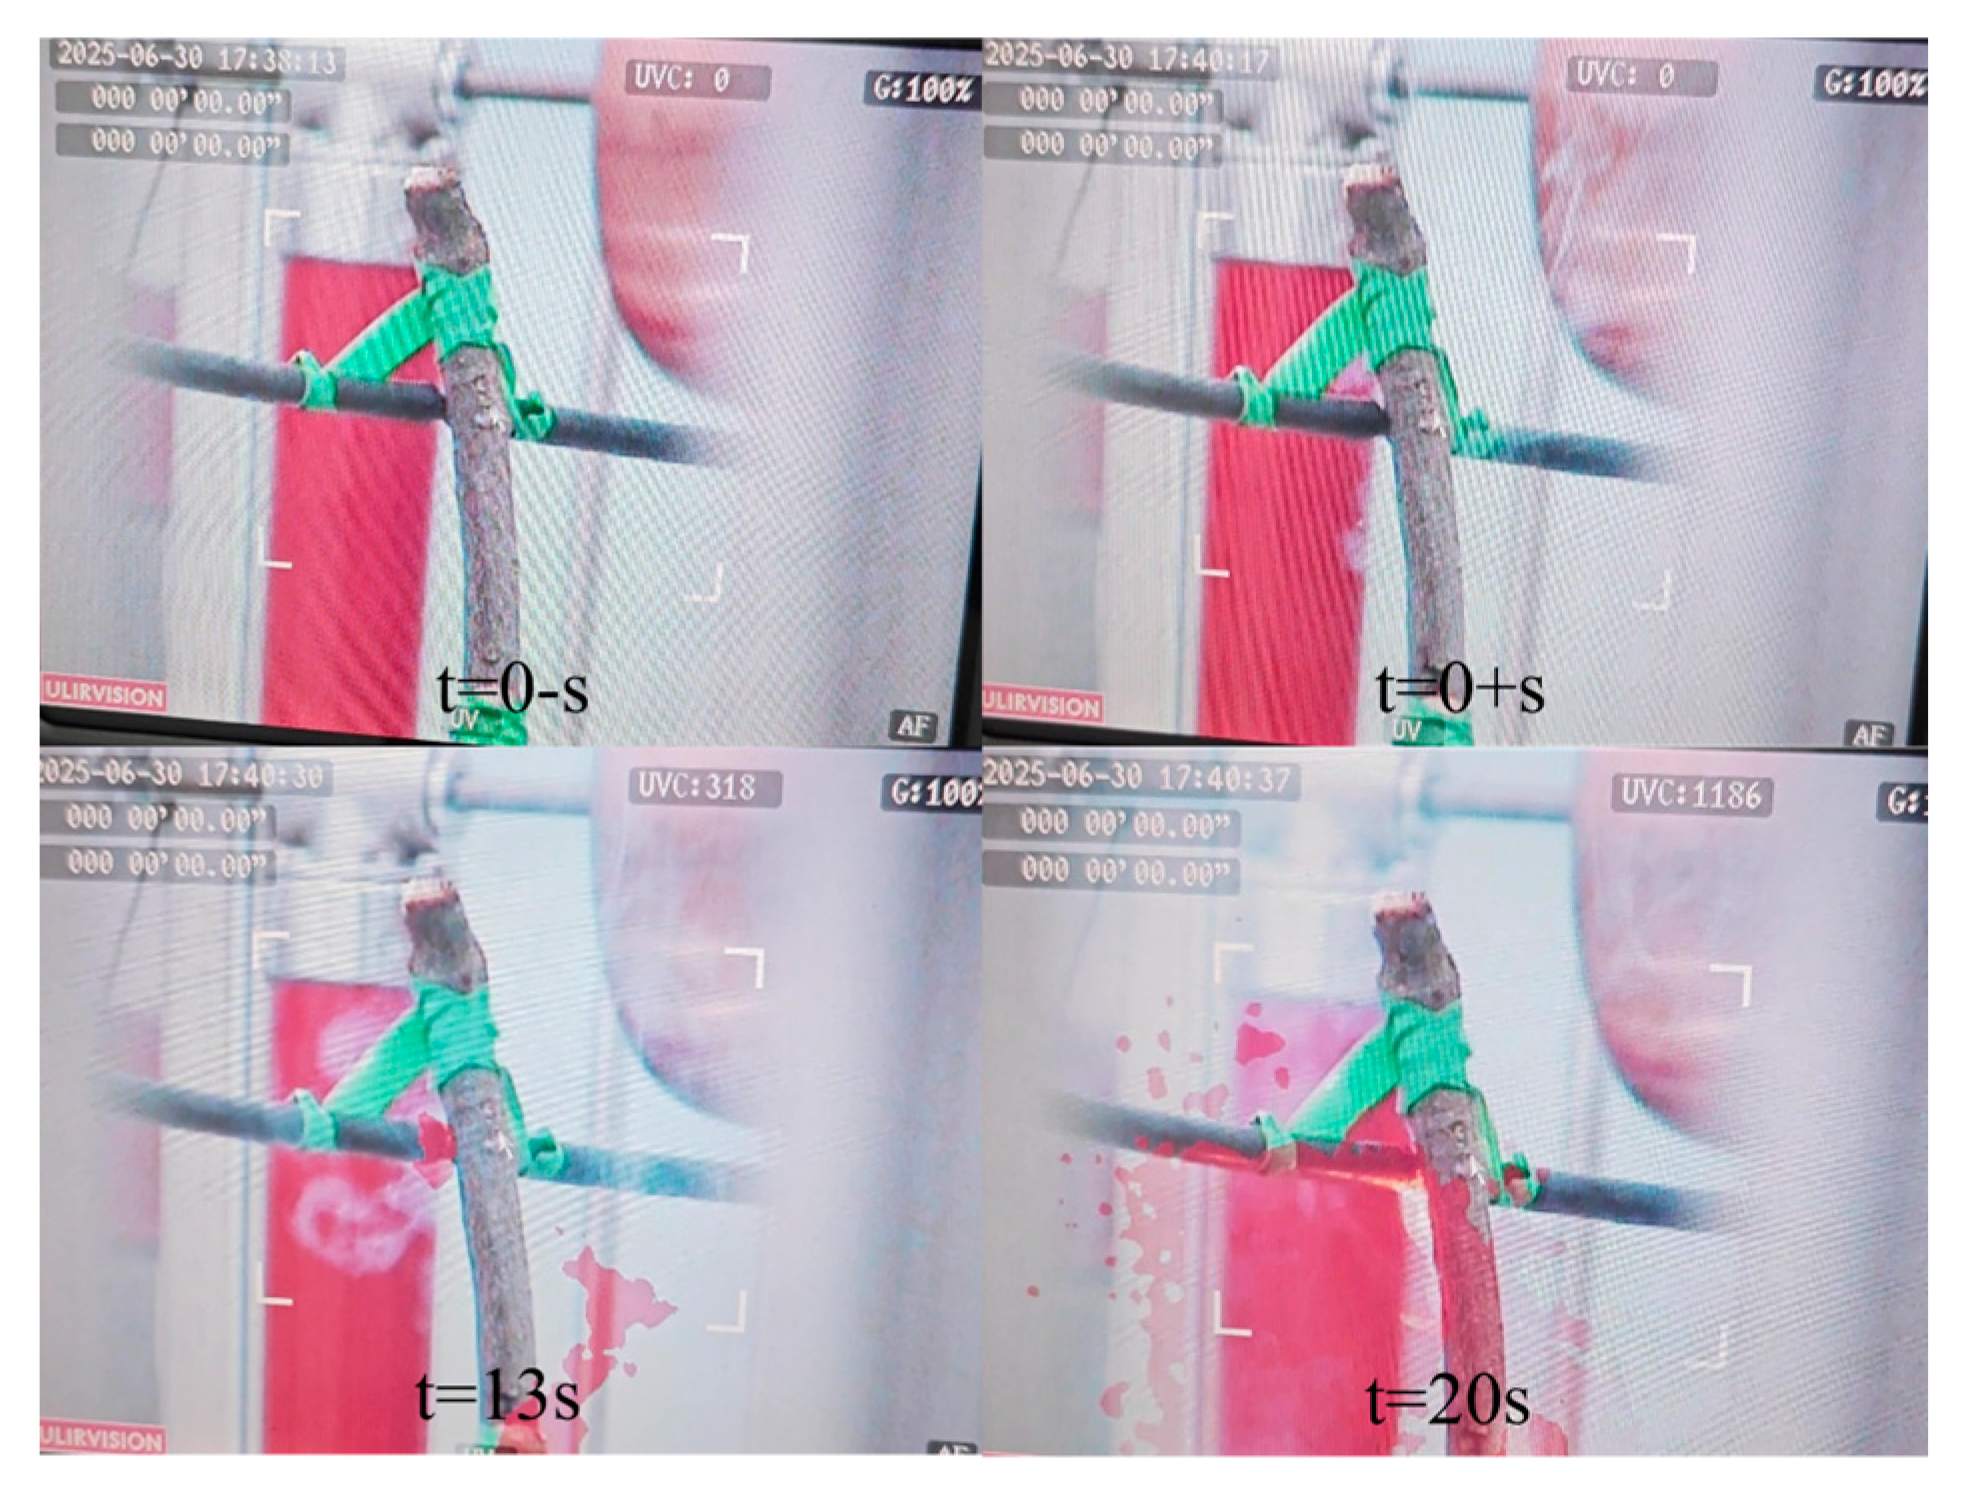
The discharge patterns of insulated conductors were observed using a high-speed camera. Figure 9a illustrates the discharge and ignition process for Case 1. This scenario represents a typical single-phase high-impedance grounding fault formed by direct tree–conductor contact. Under the influence of the current heating effect, the concentrated resistance at the contact point generates Joule heat, rapidly raising the internal moisture of the branch to its boiling point and causing substantial vaporization. Consequently, during the 0–13 s period, significant white smoke continuously evolved from both ends of the branch. As heat continued to accumulate, pyrolysis of organic matter began on the surface and inside the branch. Within the 13–20 s interval, open flames appeared at both the tree–conductor contact point and the grounded end as temperatures reached the ignition point. The flames subsequently spread from these points towards the center, ultimately completing the flame “bridging” at the 20 s mark.
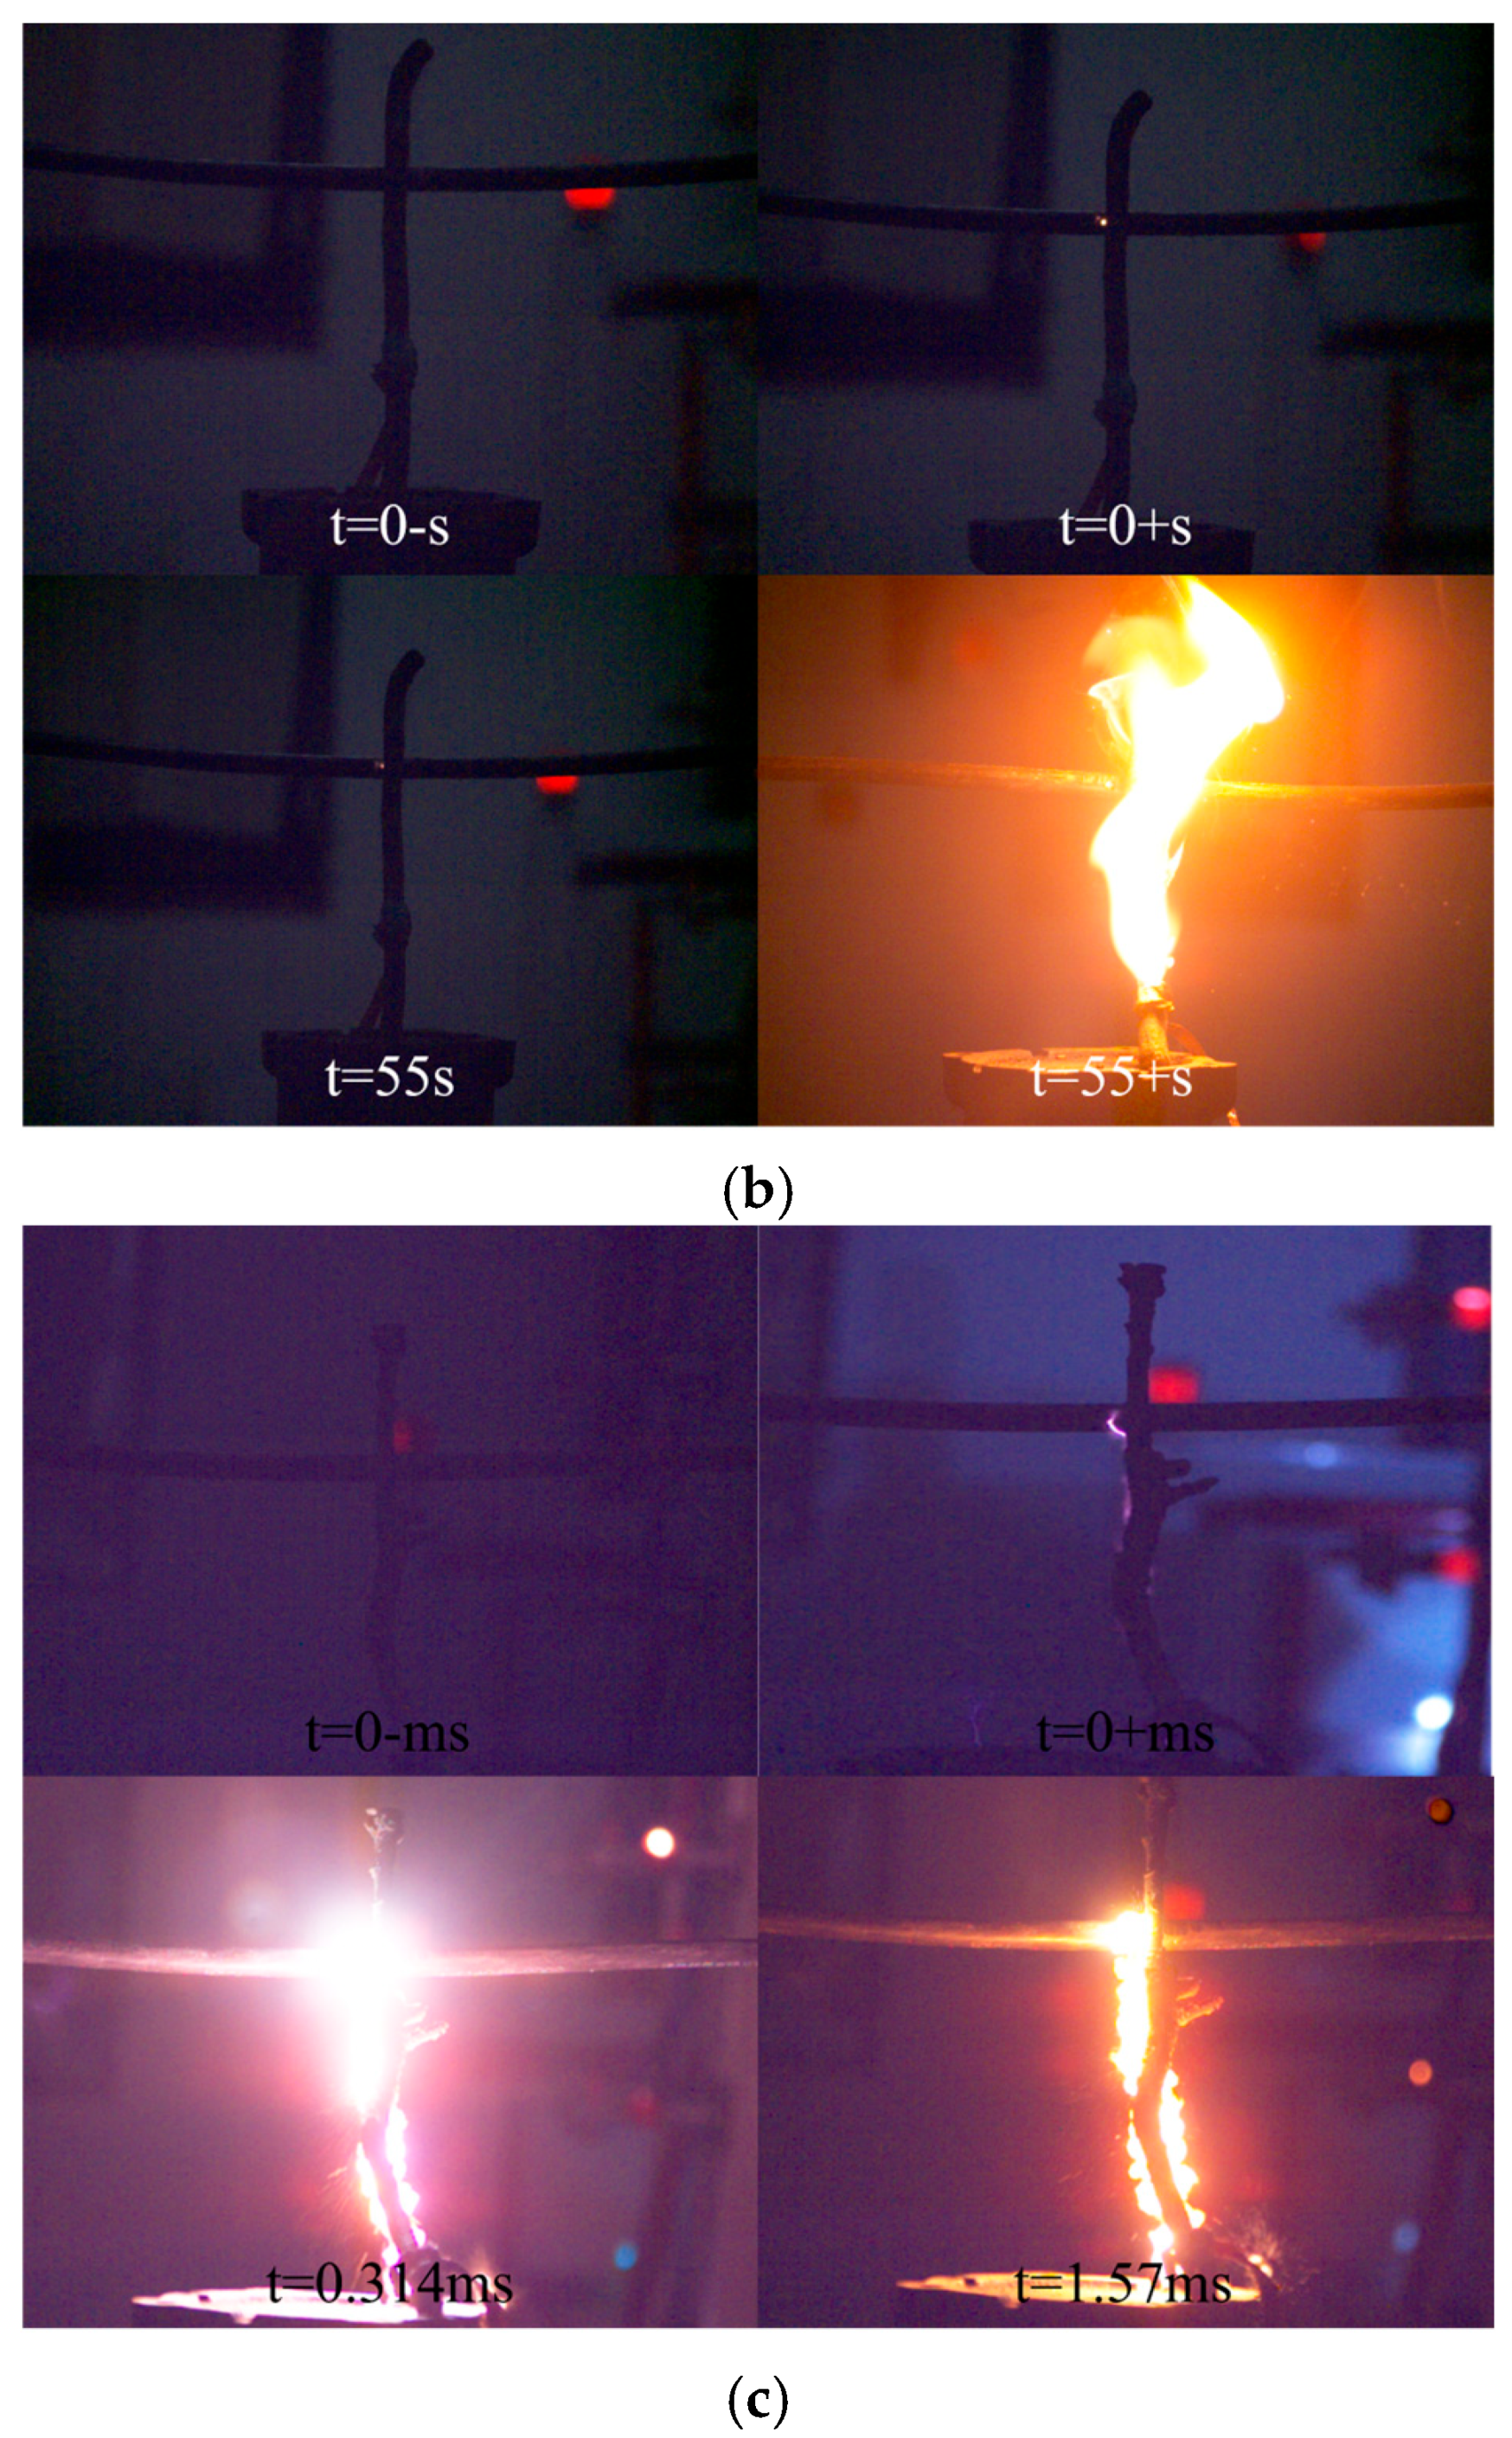
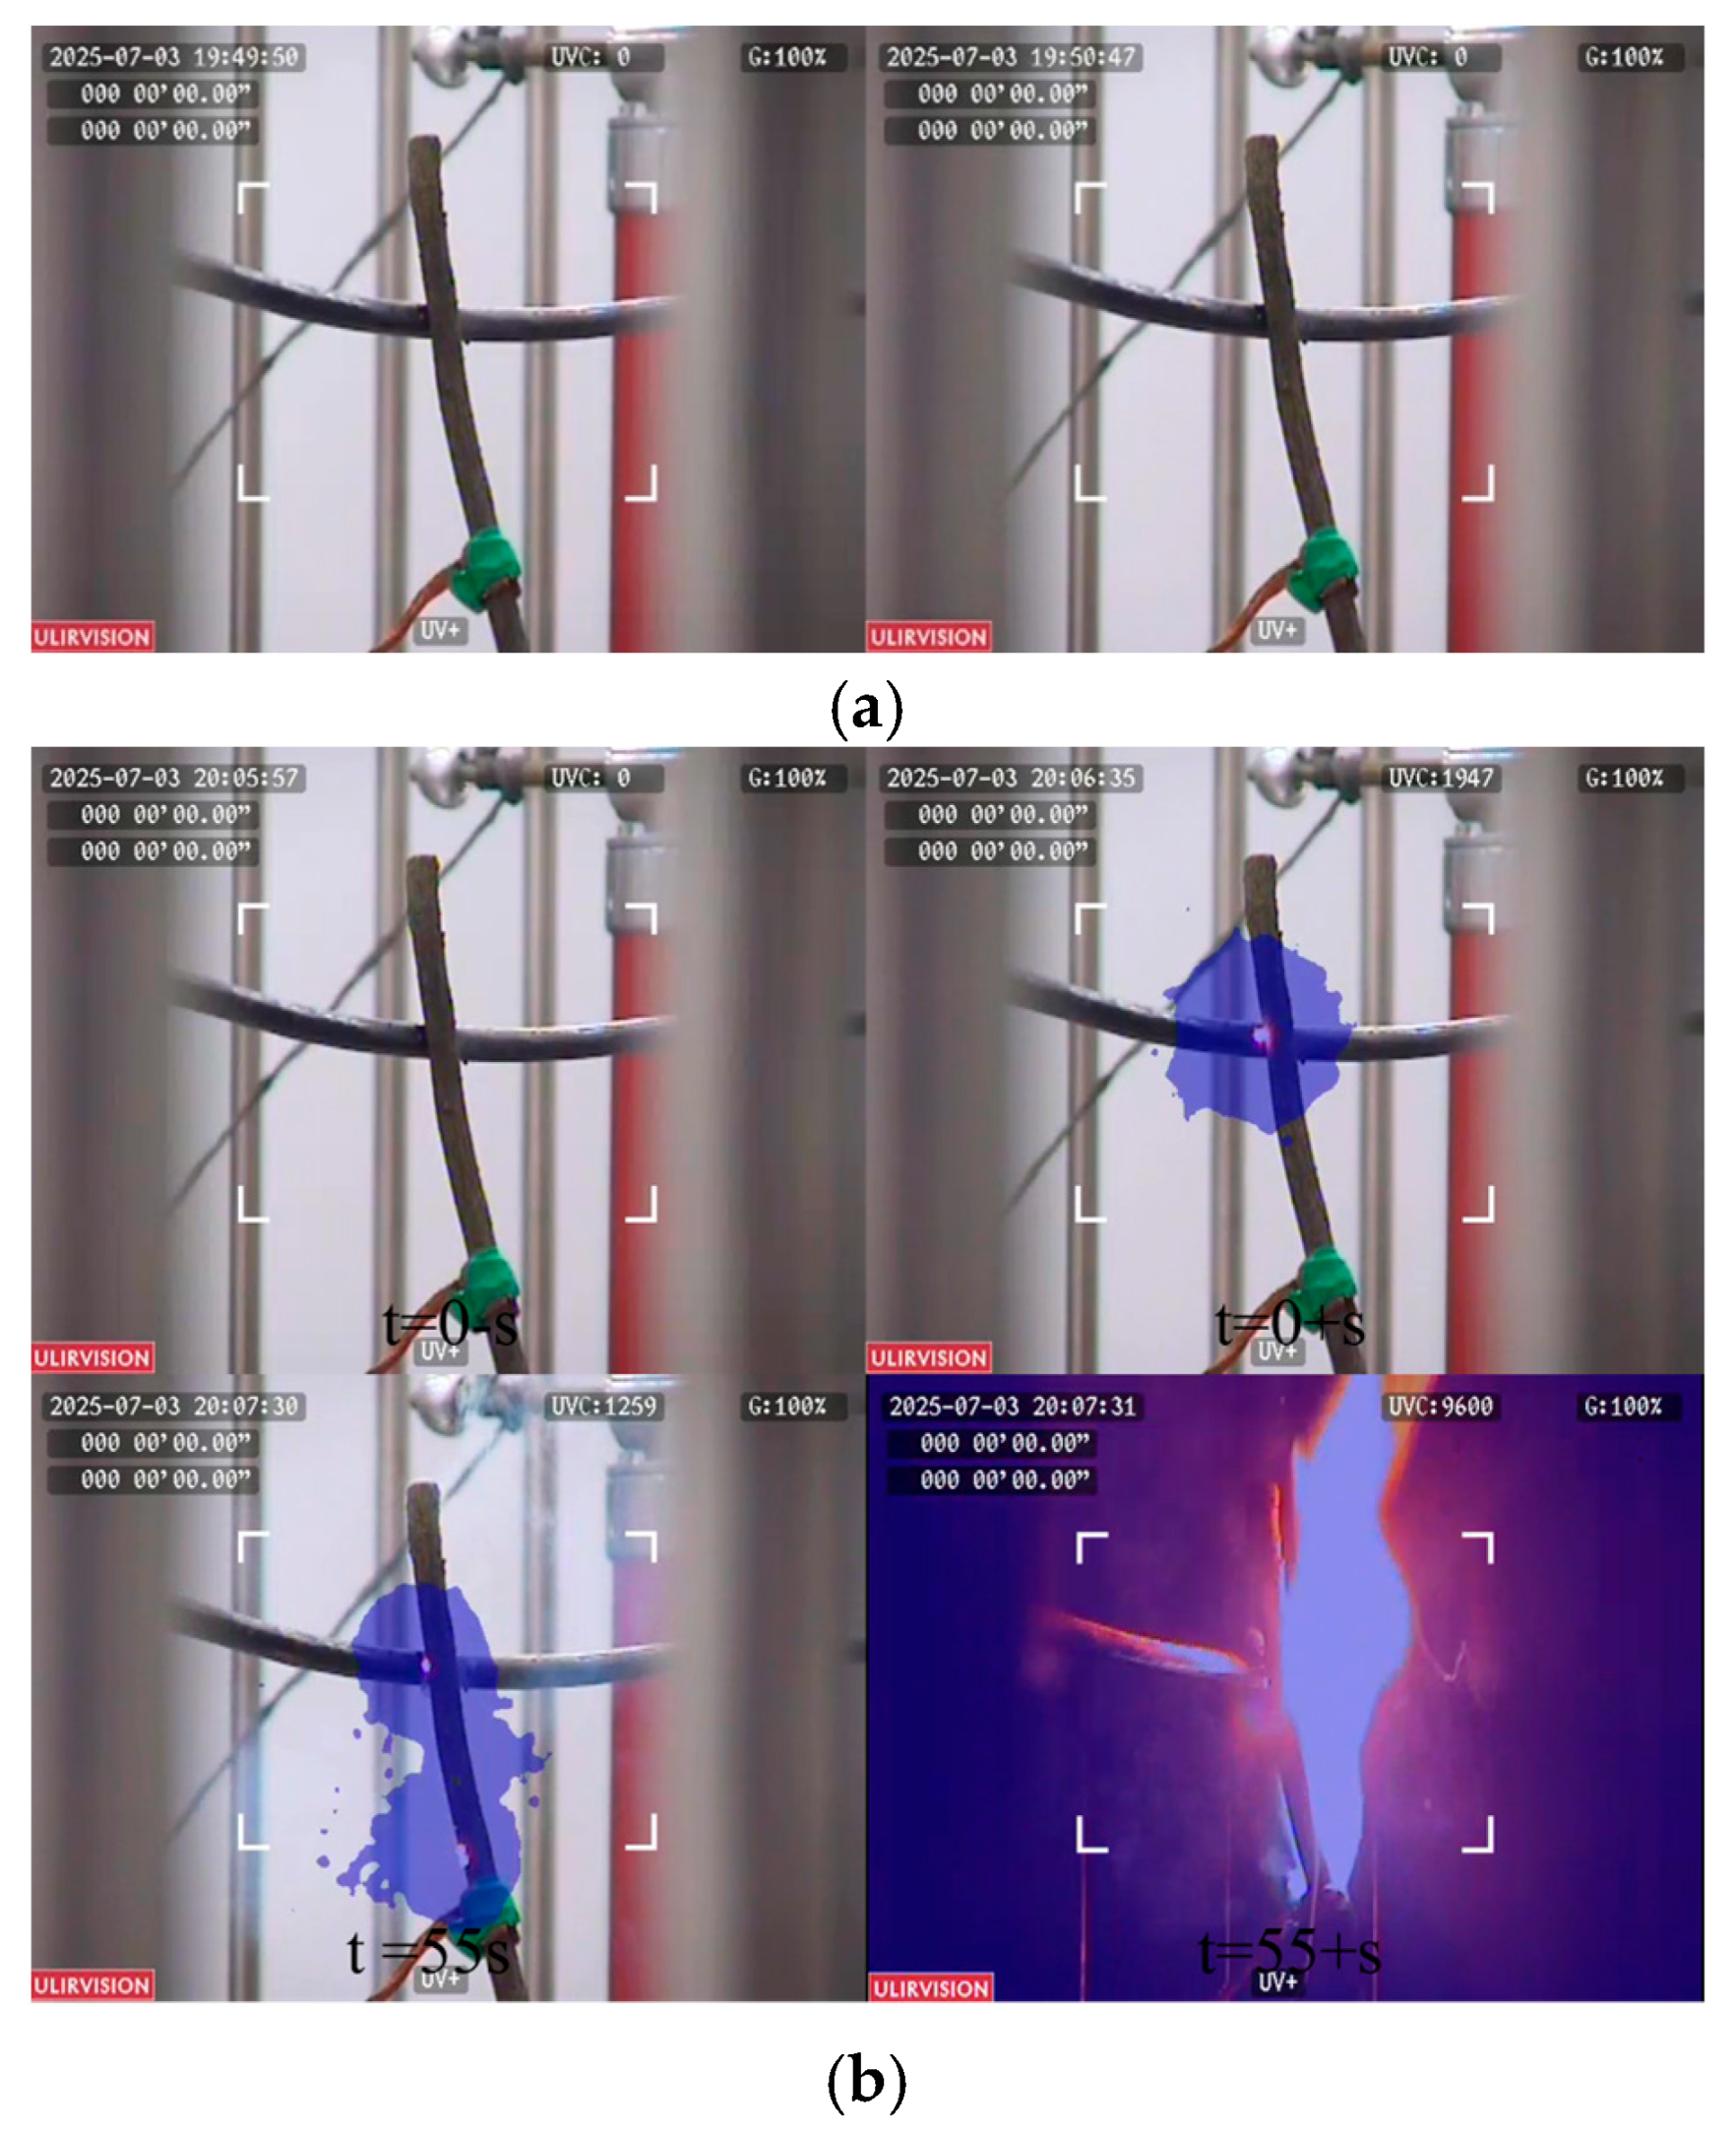
The discharge and ignition process for Case 2 is shown in Figure 9b. Before applying a 120 kV lightning overvoltage, no discharge phenomena were observed at the tree–conductor interface. After the overvoltage was applied, the electric field concentrated at the pinhole defect, initiating sustained partial discharge. This process was accompanied by repetitive micro-sparks and ionized channels, gradually accumulating heat within 55 s and igniting the surrounding material. Ultimately, a continuous flame path formed at the 55 s mark, completing the “bridging”.
The discharge and ignition process for Case 3, shown in Figure 9c, was analogous to that in Case 2, with no significant observable activity before the application of a 160 kV lightning overvoltage. After the overvoltage was applied, due to the higher voltage and extremely high electric field strength, the air gap between the pinhole and the branch was completely broken down, forming a bright arc column. The arc possessed extremely high energy density, enabling it to ignite the surrounding medium within a very short time (0.314 ms), thereby achieving rapid flame “bridging”.

4.2. Changes in Flame Temperature Under Different Conditions

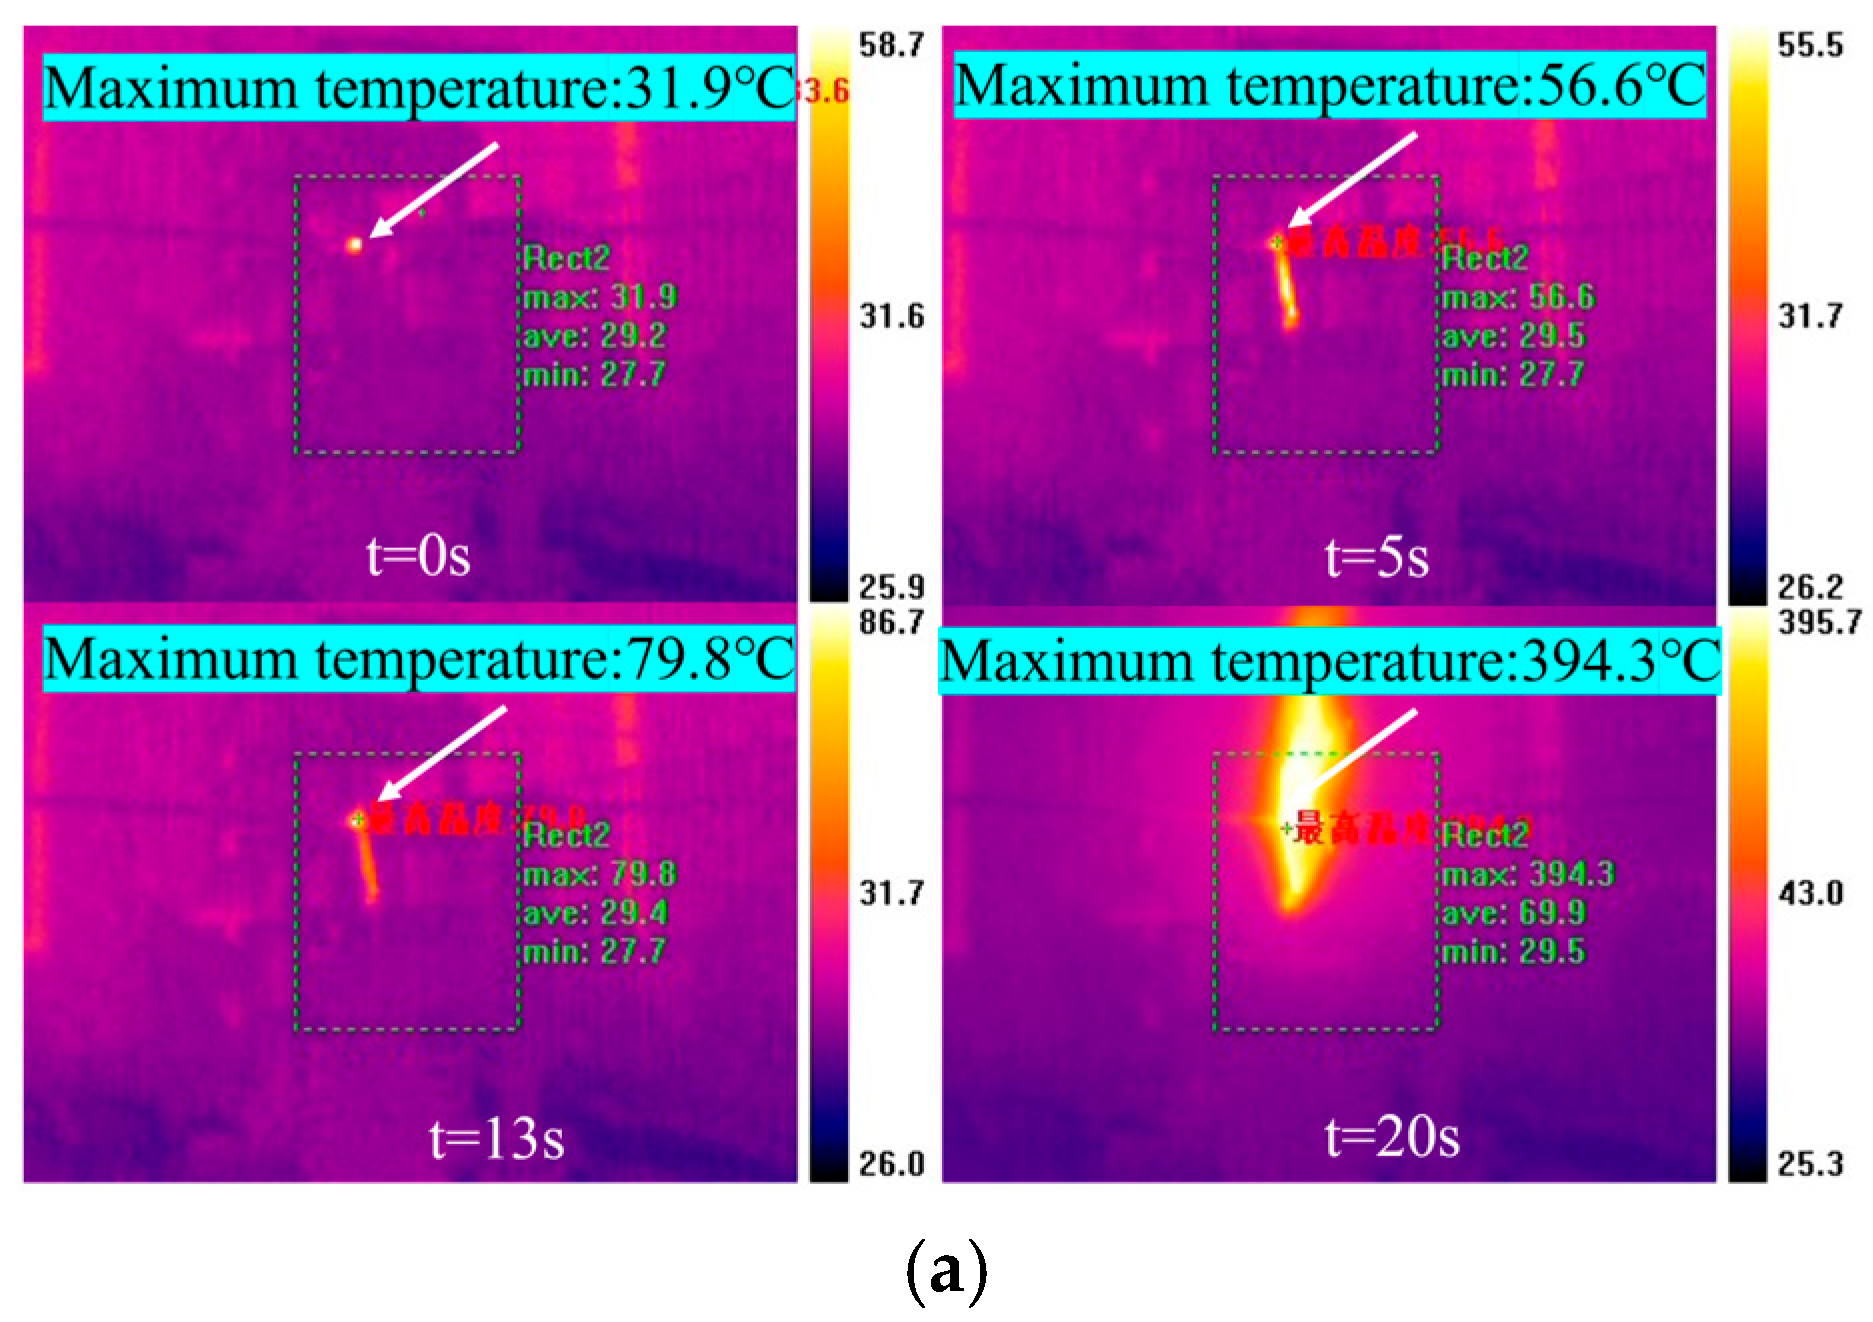
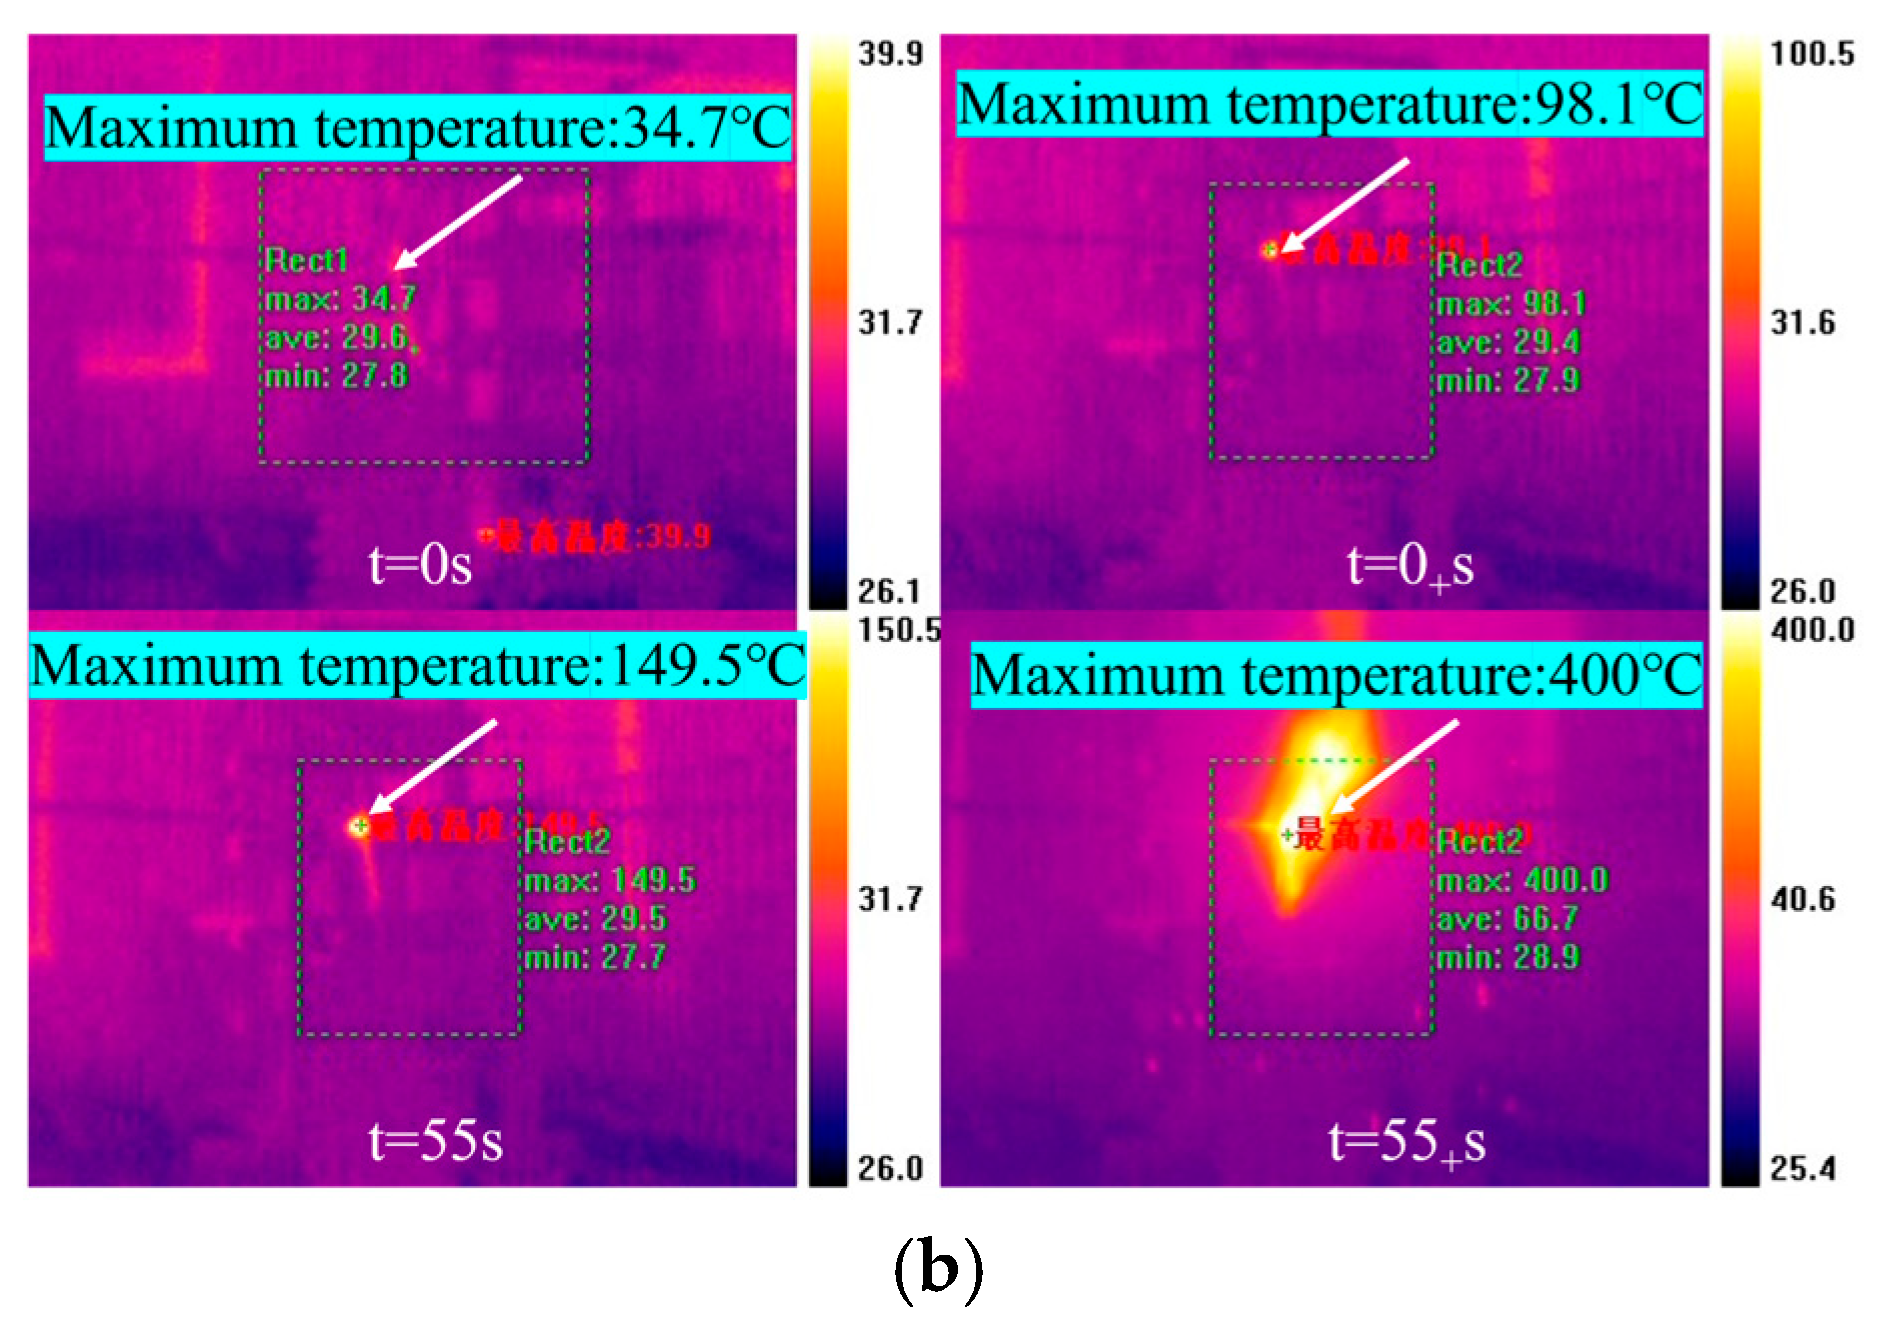
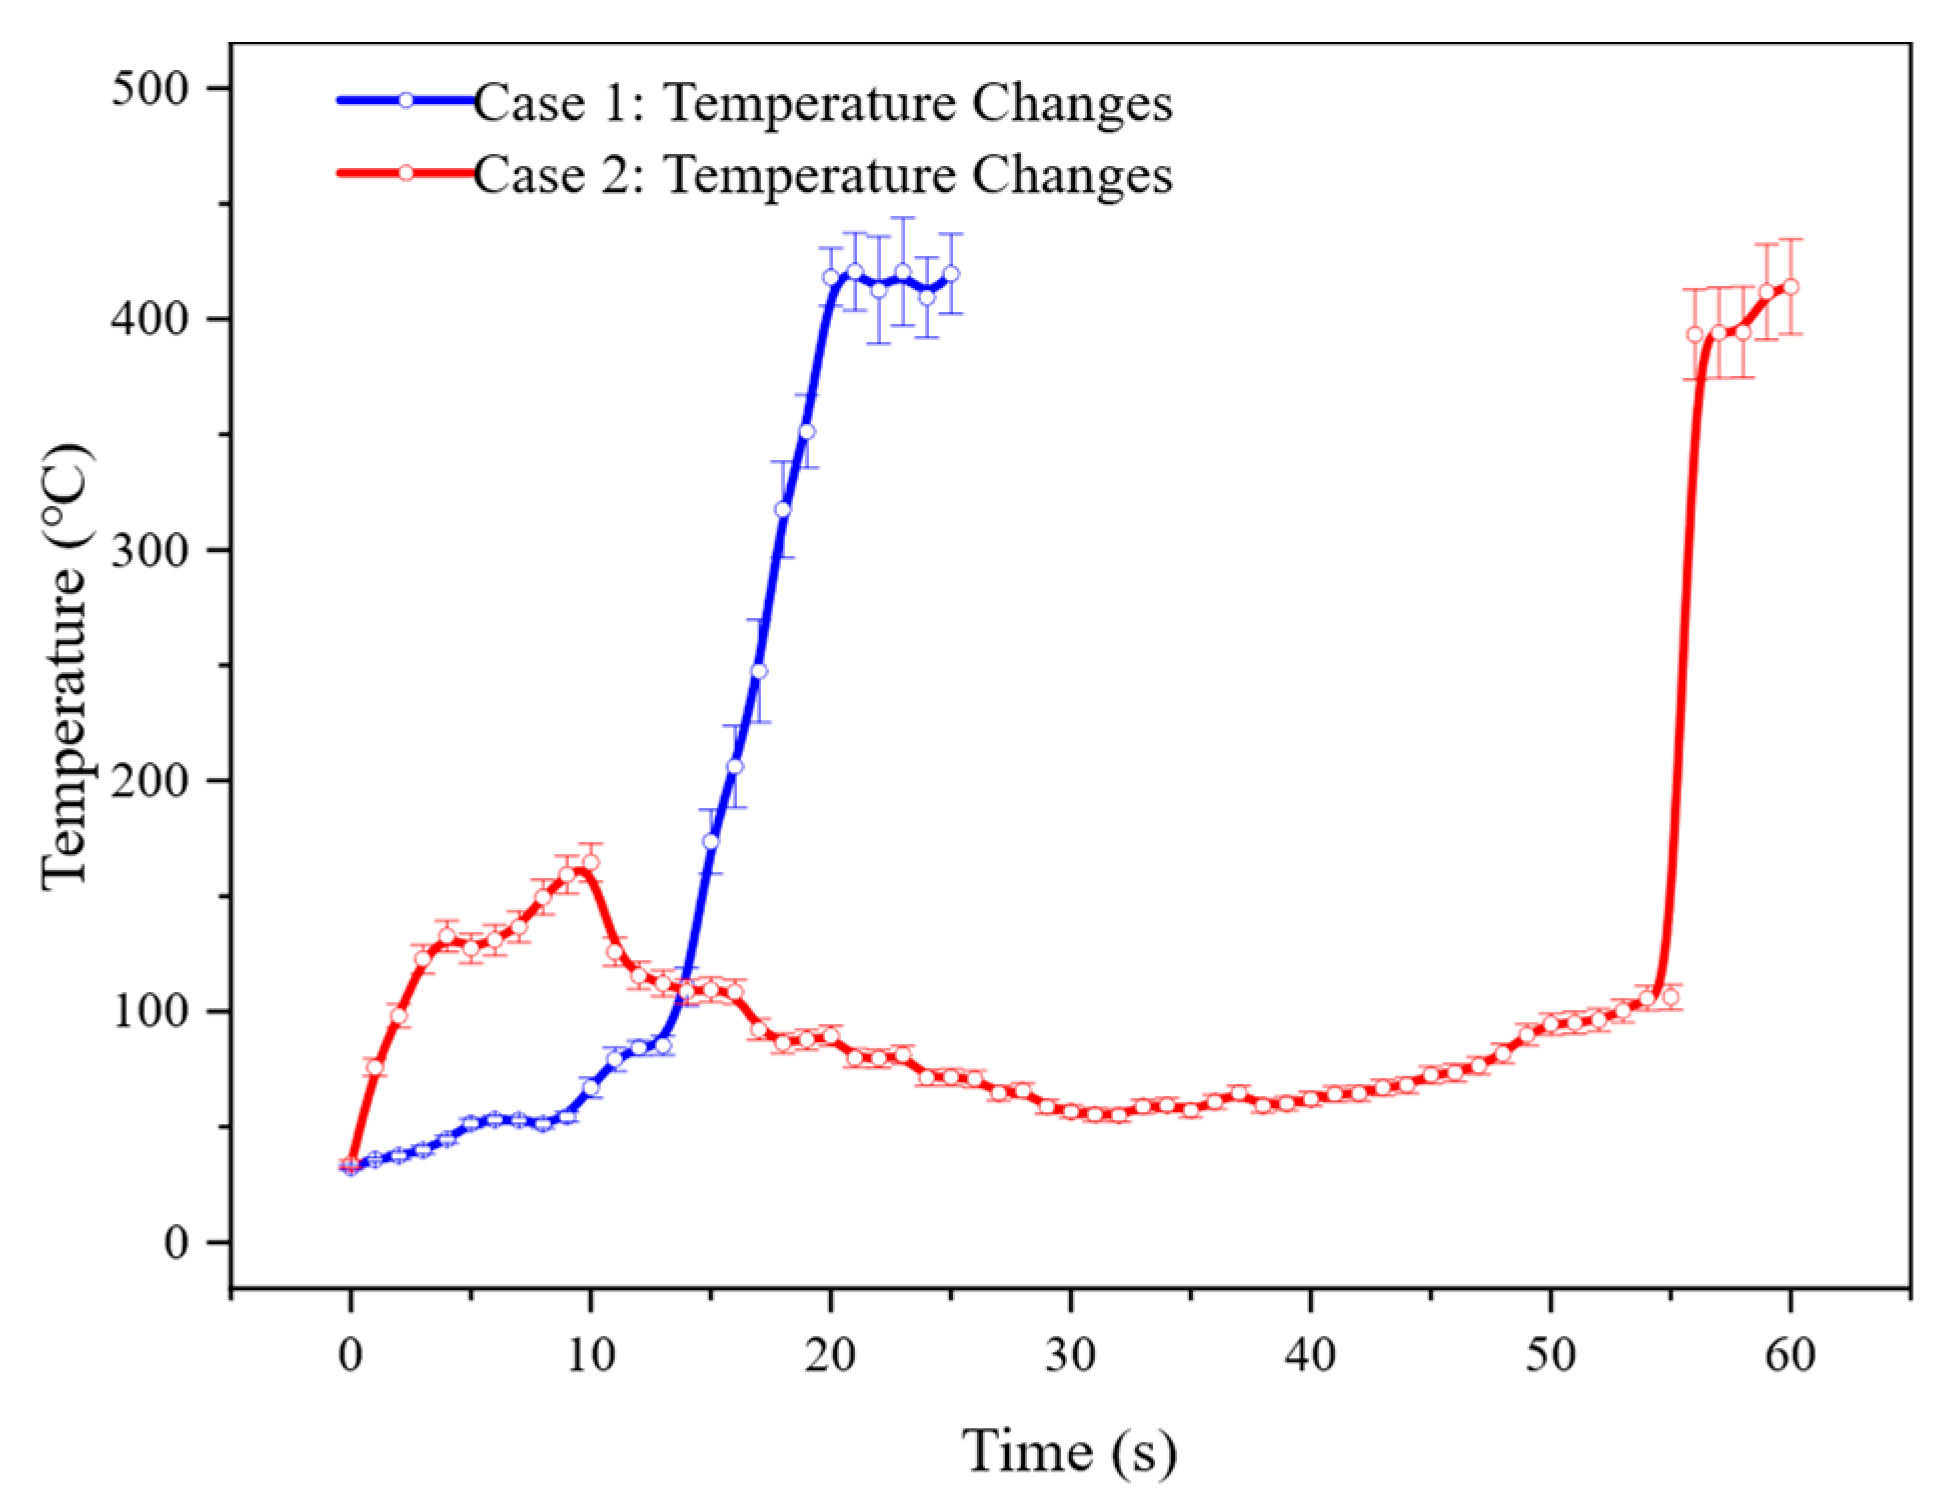
The flame temperatures for Case 1 and Case 2 are shown in Figure 10. The carbonization temperature of the twigs is approximately 150 °C, while the flame temperature at the completion of the “bridging” process reaches 400 °C. This corresponds to the simulation results presented in Section 2, thereby validating the accuracy of the simulation data.
The temperature-versus-time curves are shown in Figure 11. Case 1 and Case 2 exhibit similarities in relation to the progression of combustion and can both be divided into two stages: the moisture evaporation stage and the ignition stage. During the moisture evaporation stage, the average temperature is approximately 100 °C. The ignition stage is closely related to the duration of electrical current application, with the average temperature reaching up to 400 °C. The primary difference between the two lies in the rate of the temperature rise. Case 1 heats up more rapidly, whereas in Case 2, due to the presence of partial discharge, the moisture evaporation phase is prolonged by approximately 1 min compared to Case 1. For Case 3, because the arc discharge process is extremely rapid, and the frame rate of the infrared imager used in this experiment is only 30 fps, it was unable to effectively capture the temperature changes during this process.

4.3. Intensity of Partial Discharge Based on Ultraviolet Detection

Based on the ultraviolet discharge detection results, the discharge phenomena of varying intensities were observed under all three experimental scenarios. The ultraviolet discharge for Case 1 is presented in Figure 12. During the initial phase of moisture evaporation and direct tree–conductor contact, no discharge occurred. As small arcs developed at both ends of the branch, accompanied by the combustion process, partial discharge began to appear, indicated by the red marked area in Figure 12. Subsequently, after the flame completed “bridging”, the discharge activity intensified significantly, manifesting as widespread discharge phenomena.
To exclude the possibility of power frequency voltage triggering tree–conductor discharge in Case 2, a 10 kV power frequency voltage was applied initially, and ultraviolet discharge detection was conducted. The results are shown in Figure 13a, where no discharge was observed. On this basis, a 120 kV lightning overvoltage was further applied. At this point, sustained partial discharge lasting approximately 55 s appeared at the pinhole, as shown in Figure 13b. The partial discharge observed at the grounding location is related to the grounding copper strip used. Due to the presence of protrusions and gaps on both the copper strip and the branch surface, partial discharge can also occur at these junction points. Once the flame bridging was completed, the discharge phenomenon became identical to that in Case 1. In Case 3, the arcing discharge process is extremely rapid. The ultraviolet detection instrument employed in this study has a limited frame rate, and its minimum capture interval still exceeds the arc development duration. Consequently, no ultraviolet discharge images for Case 3 were captured.
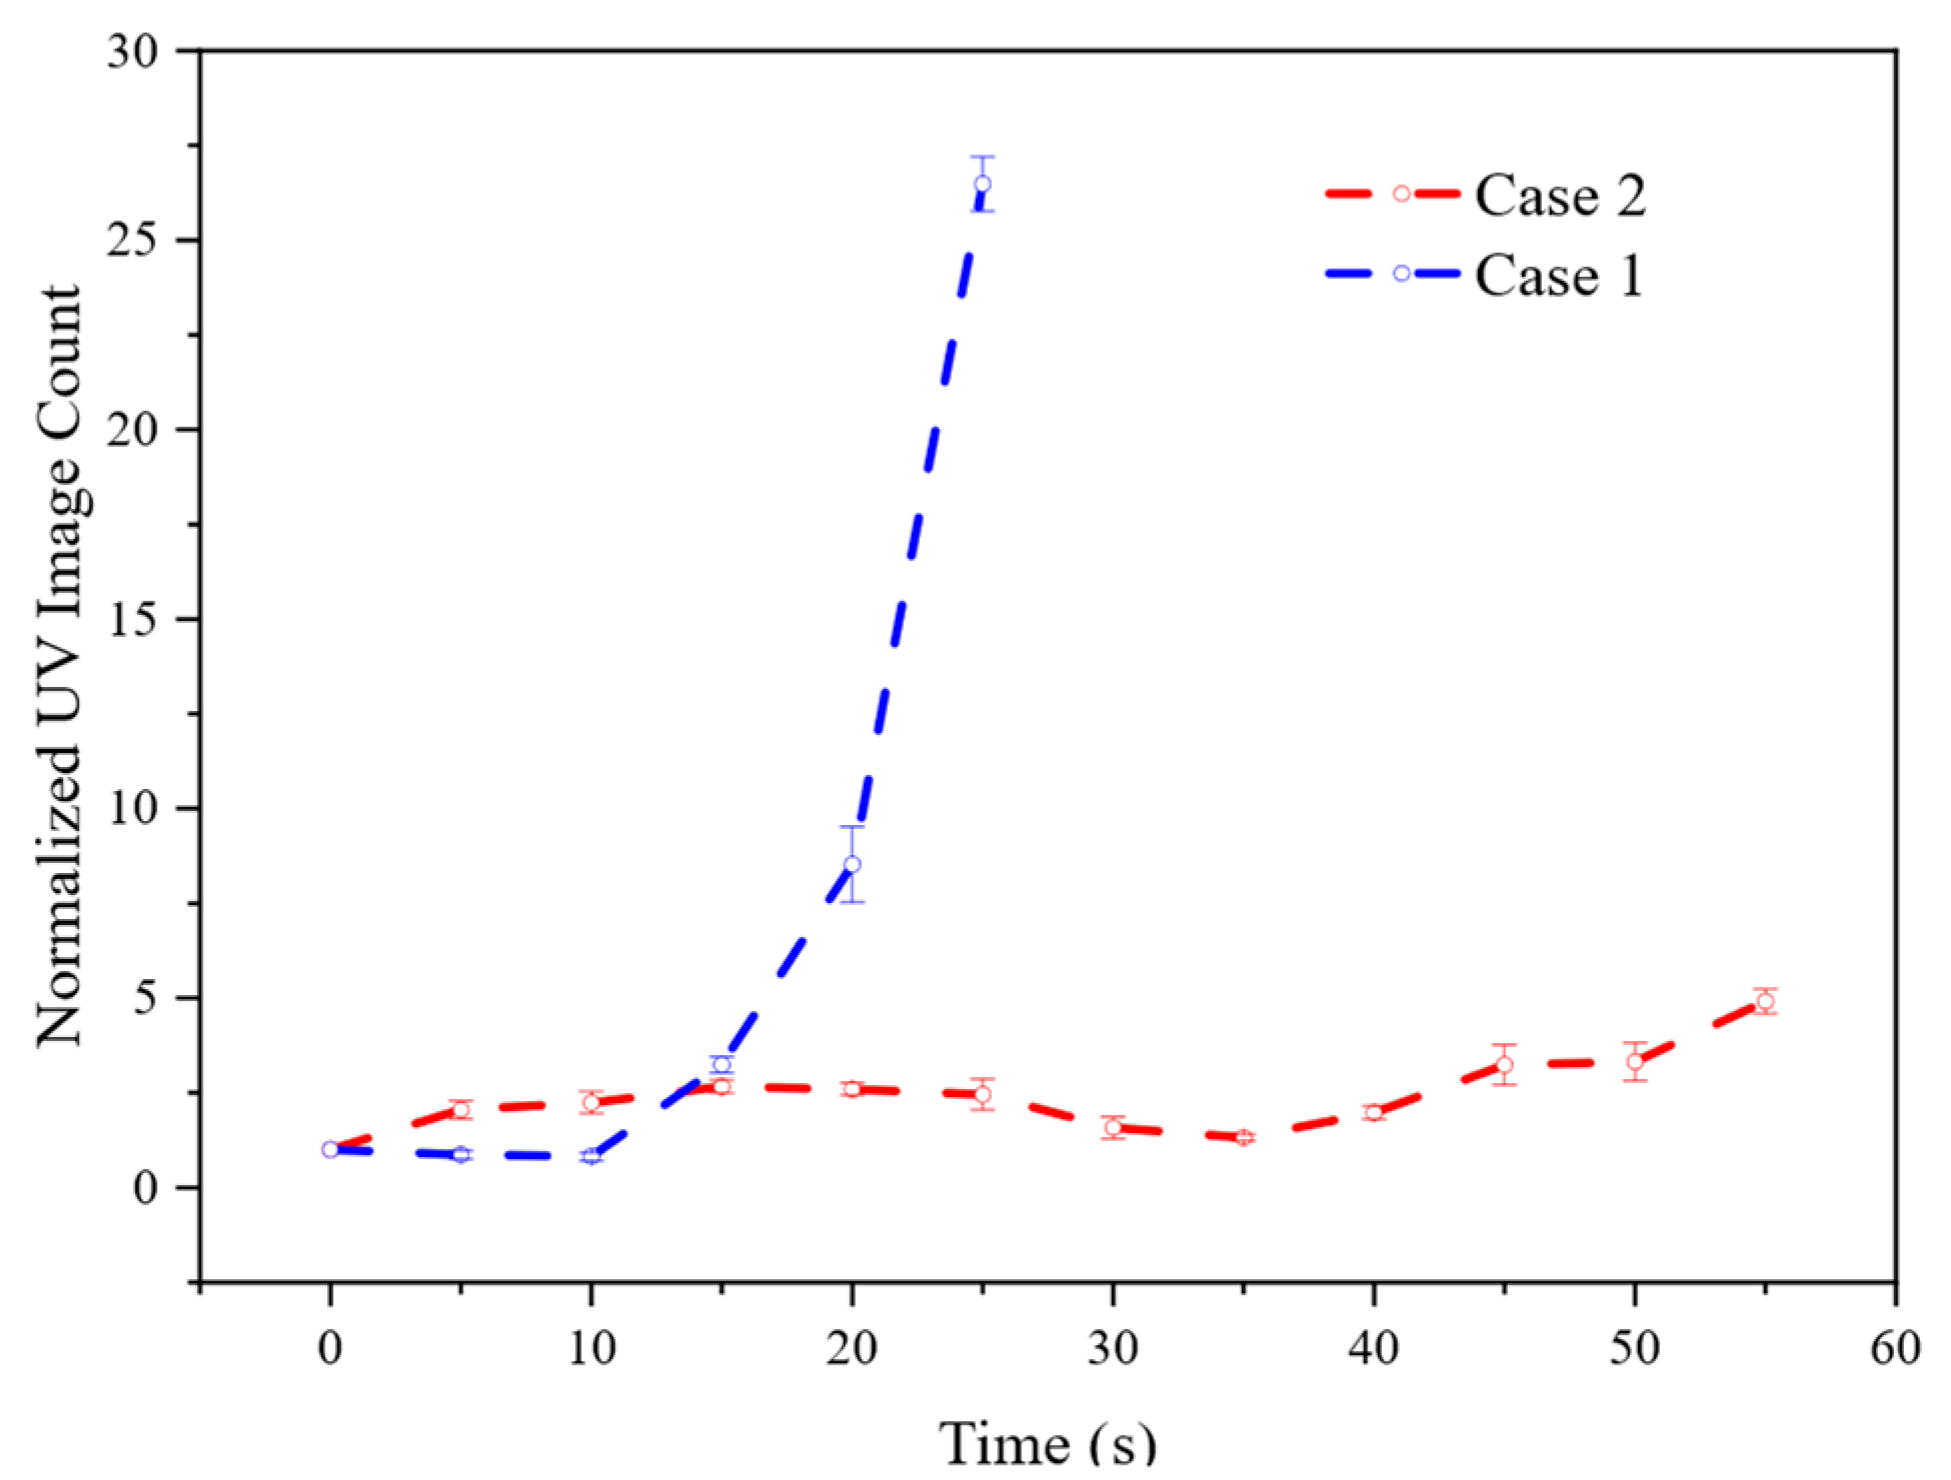
The initial UVC values detected by the UV detection instrument for partial discharge generated in Case 1 and 2 were recorded as UVCb1 = 362μW/cm2 and UVCb2 = 1947μW/cm2, respectively. Subsequently, the collected UVC values were normalized by calculating UVCi/UVCb. The results are shown in Figure 14, where the normalized UVC1 for Scenario 1 exhibited an exponential increase. The duration of partial discharge was relatively short, and after 20 s, the normalized UVC1 rose to eight, which was significantly higher than the normalized UVC2 for Case 2 at the same time, indicating that the discharge had reached an intense level under this scenario. The normalized UVC2 for Case 2 varied relatively gently, with an average value of 2.44, reflecting that the partial discharge under this condition was relatively mild.

4.4. Analysis of Ablation Marks

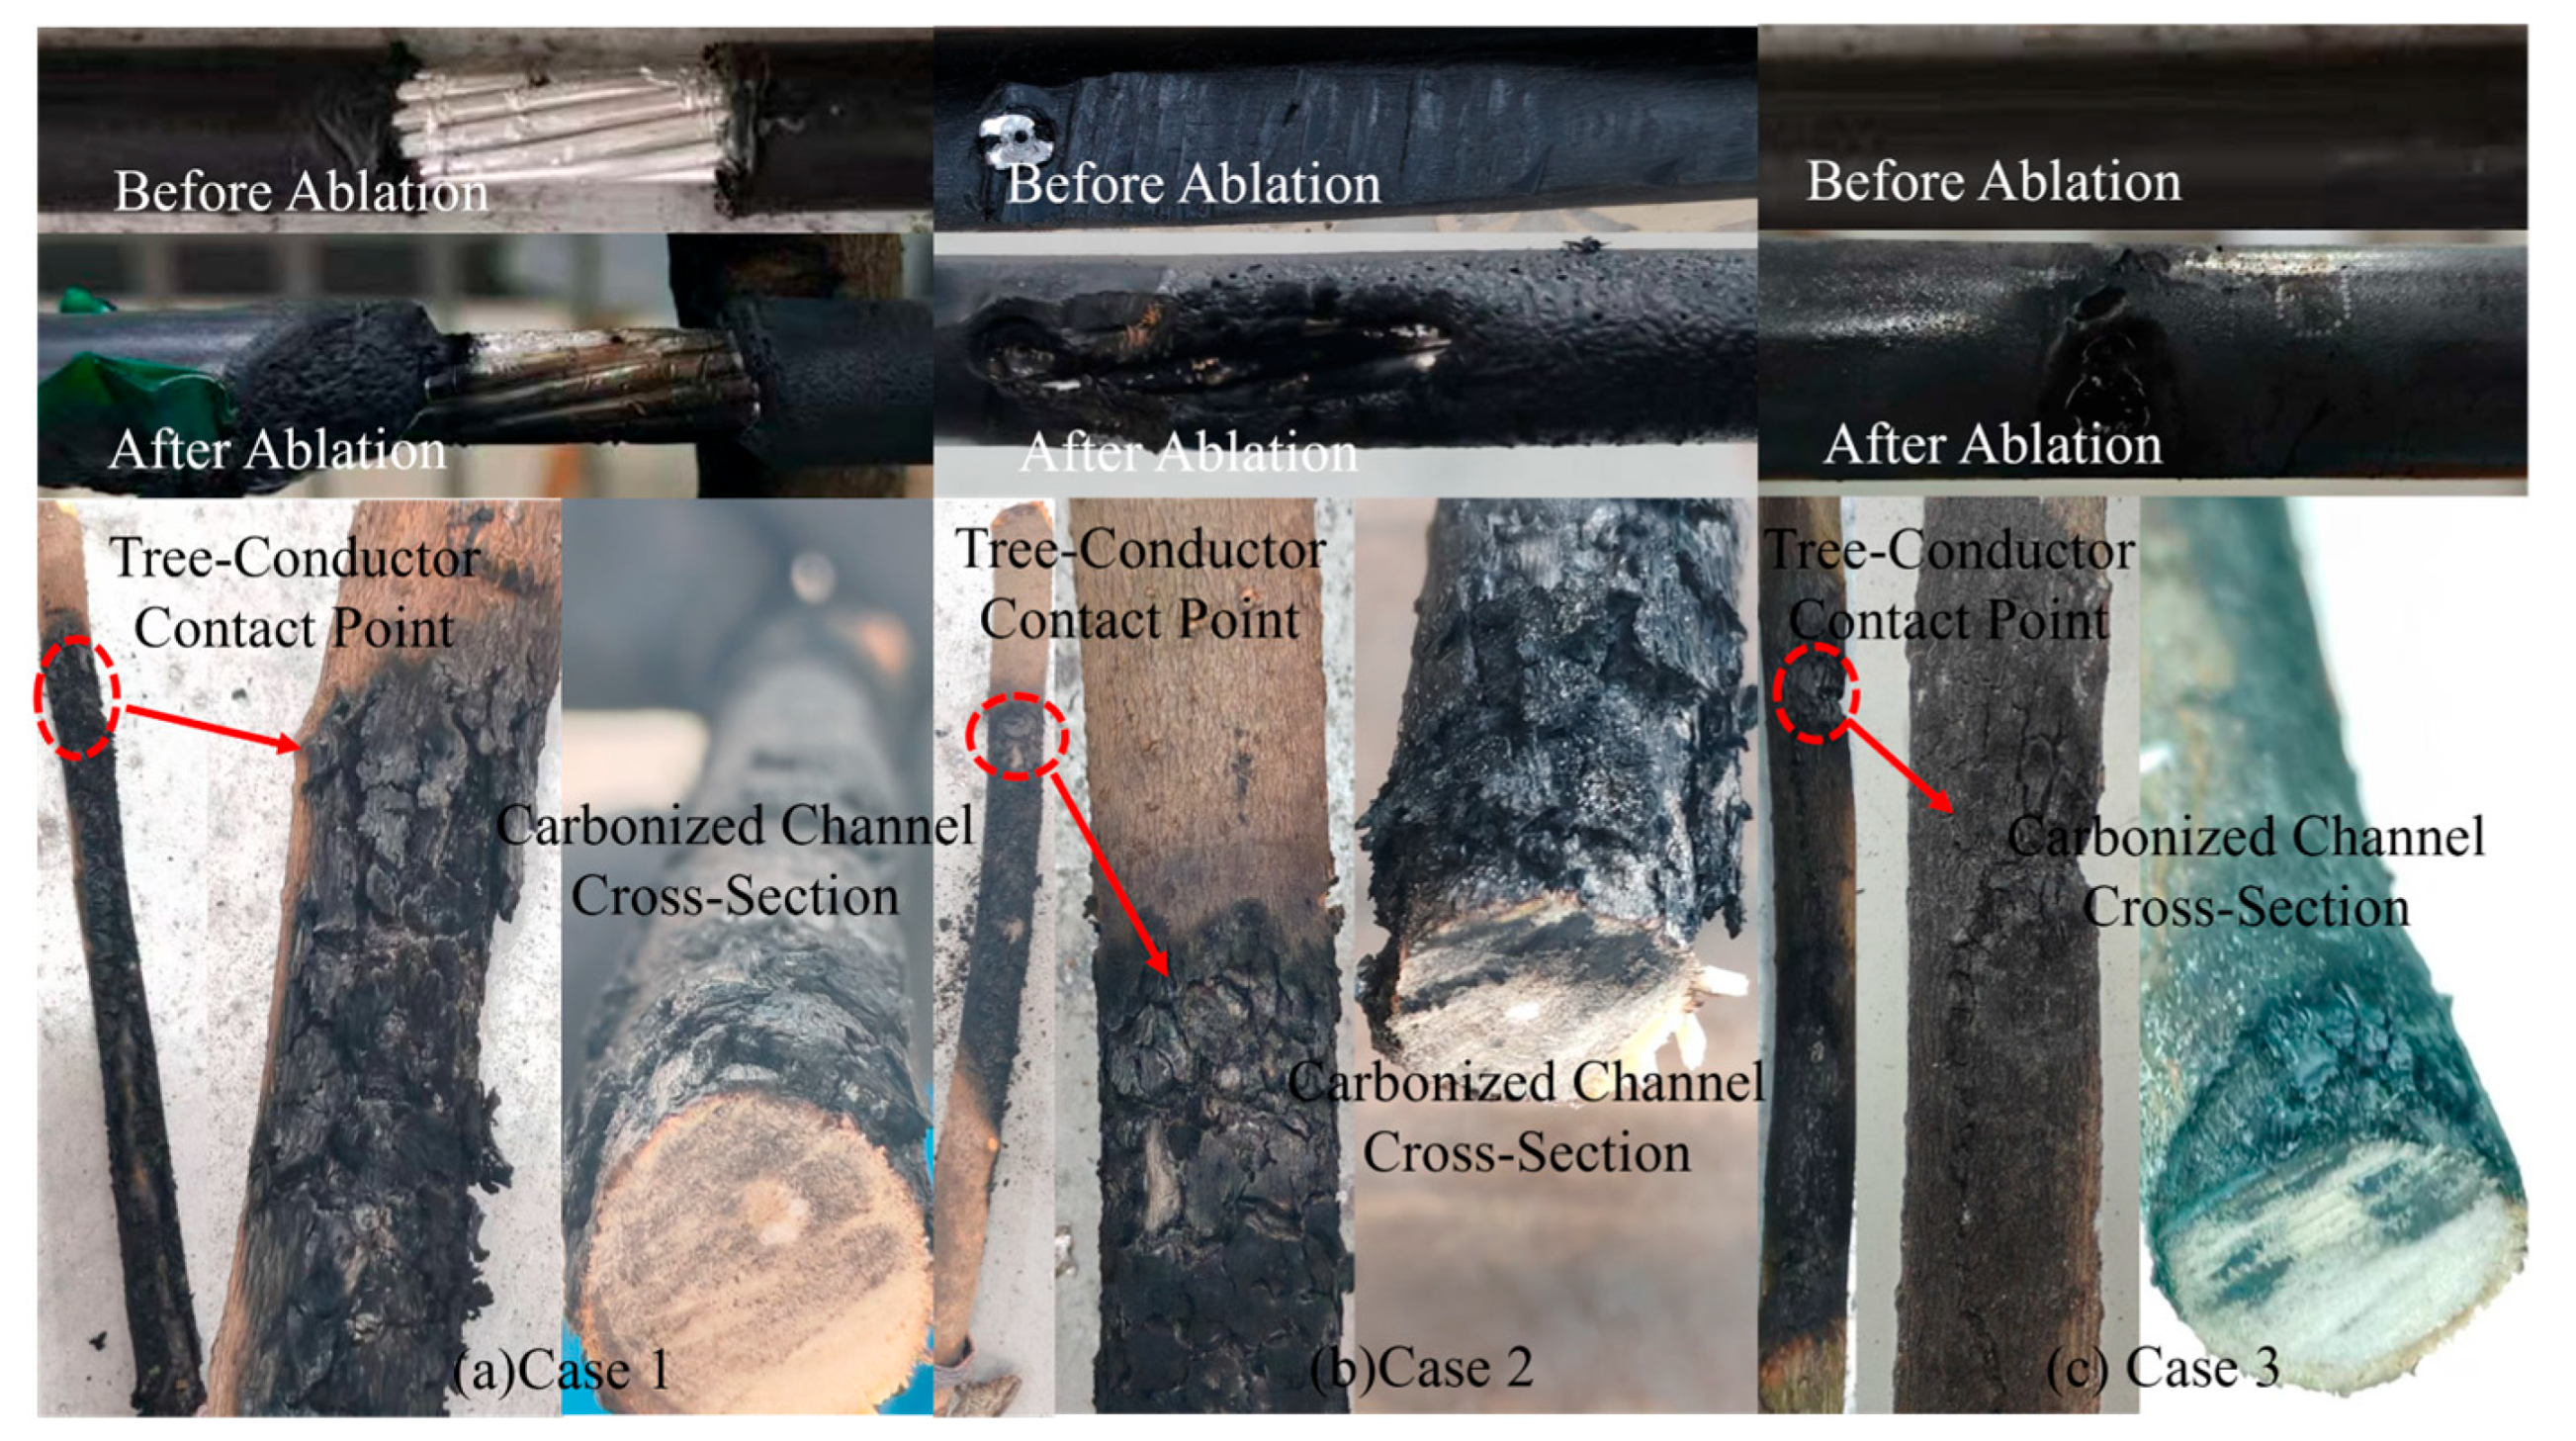
After the tests, a comprehensive observation and analysis of the ablation morphology on the insulated conductors and the damage characteristics of the branch samples were conducted, as shown in Figure 15. The results indicate that different discharge forms not only produced characteristically distinct ablation traces on the insulation layer, but also formed significantly different carbonization structures within the branches. Both of these reflect the differences in the discharge mechanisms and energy transfer pathways. Specifically, in Case 1, the aluminum conductor surface was minimally affected by flame ablation, whereas at the tree–conductor contact point, the bark was ablated and detached, revealing clear electrical treeing patterns and a complete carbonization path. In Case 2, the insulation layer near the pinhole was largely ablated away, exposing the internal aluminum conductor. The tree–conductor contact point was severely carbonized, and the bark was on the verge of detaching due to moisture evaporation. Its ablation characteristics were similar to those of Case 1, both exhibiting clear electrical treeing traces and a carbonization pathway. Case 3 exhibited only slight melting of the insulation layer at the pinhole; the aluminum conductor was not extensively exposed and retained its pinhole shape. The carbonized area at the tree–conductor contact point was smaller compared to the previous two cases, and the bark surrounding the carbonization channel remained intact and attached to the branch. From a cross-sectional observation, the carbonization channels in both Case 1 and Case 2 exhibited typical “Lichtenberg figures,” consistent with the experimental phenomena of tree contact discharge on bare conductors reported in Reference [27]. In contrast, the cross-sectional carbonization in Case 3 was relatively deep, gradually diminishing outward from the deepest area.
Through multimodal experimental observations, this study reveals differences in the ignition mechanisms of treeing discharges under three typical insulation layer defects: both complete wear (Case 1) and wear combined with lightning pinholes (Case 2) exhibit a thermal accumulation ignition mode, with the discharge process lasting tens of seconds and the temperature undergoing two stages—moisture evaporation (approximately 100 °C) and ignition (approximately 400 °C). UV discharge intensity exhibits exponential growth in Case 1 and a gradual change in Case 2, with ablation marks in both cases showing dendritic carbonization channels; whereas the case involving only a lightning-induced pinhole (Case 3) exhibits direct arc ignition, with the discharge completing within milliseconds, resulting in only slight melting of the insulation layer, a smaller dendritic carbonization area, and ablation characteristics that progress from the outside inward.

5. Discussion

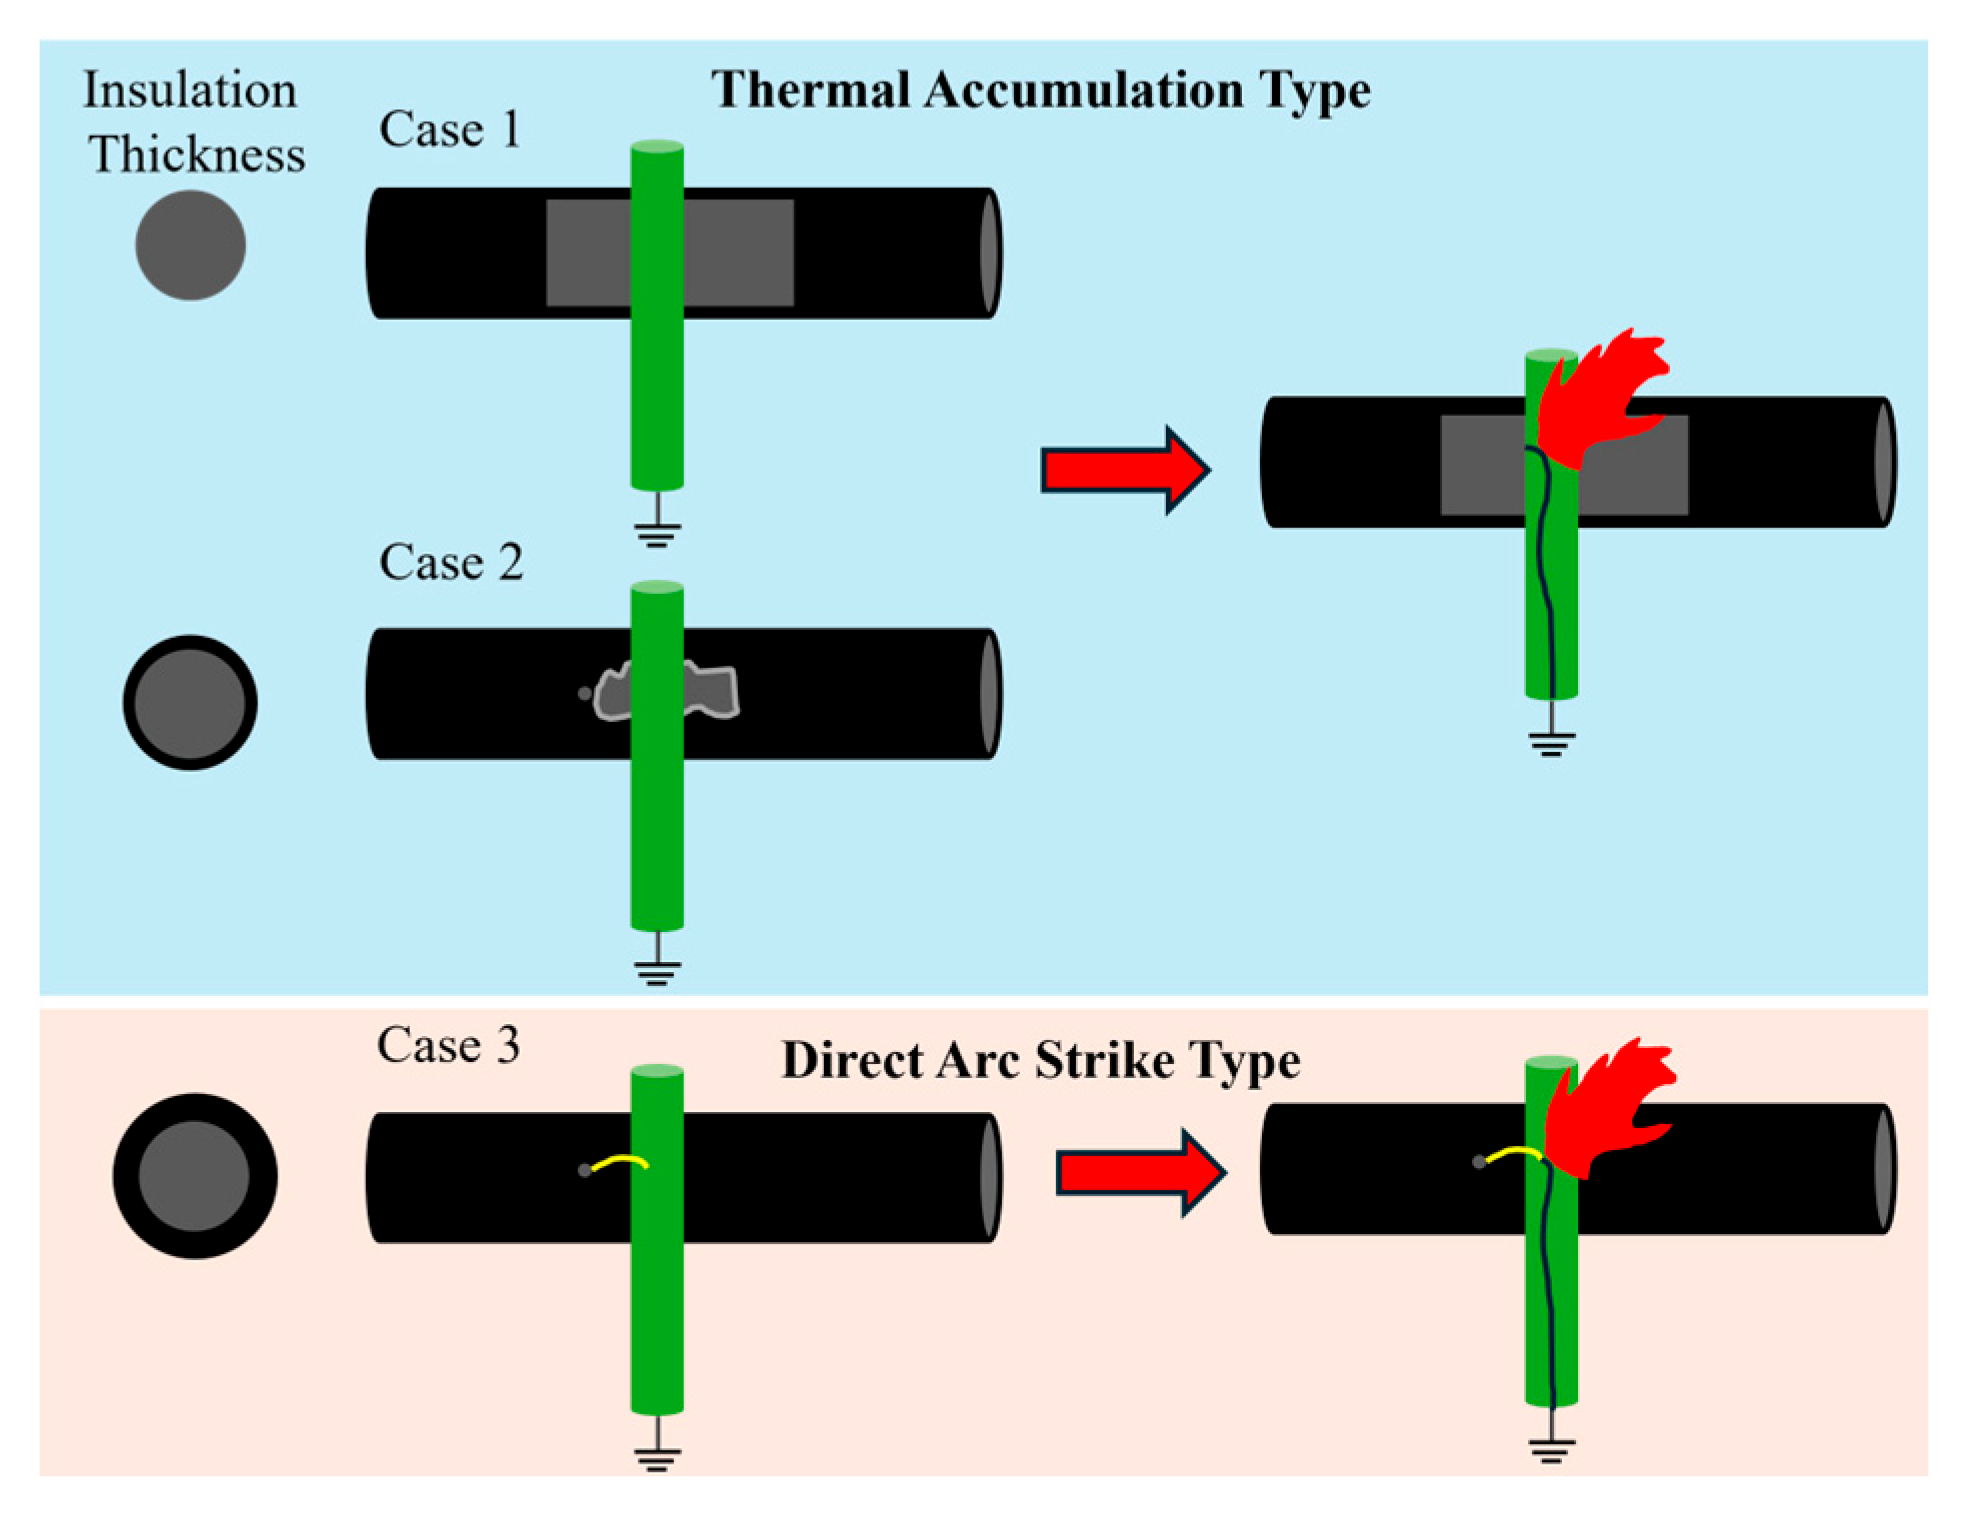
Based on experimental observations and analysis of three typical defects—complete insulation abrasion (Case 1), lightning puncture hole accompanied by abrasion (Case 2), and lightning puncture hole without abrasion (Case 3)—the ignition mechanisms of tree contact discharge on insulated conductors can be categorized into two archetypal modes: thermal accumulation and direct arcing, as illustrated in Figure 16. The Thermal Accumulation Mode primarily occurs when the insulation layer exhibits significant abrasion or composite defects (Case 1 and 2). The discharge process is characterized by a sustained high-resistance current heating effect or partial discharge action, with energy gradually accumulating over tens of seconds until ignition is ultimately achieved through flame “bridging”. The Direct Arcing Mode occurs when the insulation layer has only small-area defects such as lightning puncture holes (Case 3). Under high voltage, the tree–conductor gap is instantaneously broken down, forming a highly concentrated energy arc channel, and the ignition process is completed at the millisecond level. The two mechanisms exhibit significant differences in discharge time scales, energy transfer pathways, as well as the ablation and carbonization morphology formed on both the insulation layer and branch surfaces. This provides a clear physical basis and a classification framework for distinguishing fault types, reconstructing the discharge process, and guiding the monitoring of tree contact faults and wildfire prevention in distribution networks.
Although this study systematically revealed the discharge behavior of tree branches under various defect conditions using multimodal observation methods, several limitations remain. First, the experiments used only camphor tree branches as vegetation samples, failing to fully account for the influence of factors such as different tree species and moisture content on discharge behavior. The diversity of vegetation composition in real-world environments may lead to deviations in discharge characteristics. Second, the defect models constructed were artificially fabricated and cannot fully simulate the complex defect structures formed in the insulation layer due to long-term aging under field conditions, such as electrified branches and microcracks. Finally, due to limitations in laboratory equipment, the simultaneous monitoring of electrical and non-electrical parameters was not achievable, and the measurable electrical parameters were limited. Future research could introduce a more sophisticated experimental platform to further replicate real-world fault processes.

6. Conclusions

This study established a 10 kV overhead insulated conductor tree contact fault experimental platform. By integrating high-speed imaging, ultraviolet detection, ablation morphology analysis, and electric field simulation, the discharge evolution laws and ignition mechanisms of insulated conductors under tree–conductor abrasion conditions were systematically investigated. The main conclusions are as follows:
(1)
Based on the type of insulation defect, the tree contact discharge ignition mechanism can be categorized into two types: thermal accumulation (characterized by sustained partial discharge under abrasion or composite defects, with ignition occurring over tens of seconds) and direct arcing (characterized by gap breakdown under minor defects only, with ignition occurring within milliseconds).
(2)
Different discharge mechanisms produce distinctly characteristic damage morphologies on both the insulation layer and branch surfaces. Direct contact leads to large-area melting and the formation of carbonization channels within the branch. Partial discharge results in dendritic electrical erosion patterns. Direct arcing causes ablation from the outside inward of the branch. These morphologies can serve as a basis for fault identification.
(3)
For half-abraded insulated conductors, the discharge severity is milder and its duration is longer compared to bare conductors. This characteristic delays the onset of open flames, providing characteristic signals for monitoring and early warning in distribution network operation and maintenance.
(4)
The findings of this study hold multiple implications for future practical applications. First, regarding fault monitoring and early warning in distribution networks, the differences between the two discharge modes—thermal accumulation and direct arc strike—provide a physical basis for intelligent diagnostic algorithms based on discharge time characteristics and ultraviolet intensity. This aids in distinguishing fault types and enables early warning, particularly offering a valuable time window for early warning in semi-worn conditions. Second, regarding wildfire risk prevention and control, the ablation morphology features revealed by this study (such as Lichtenberg figures) can provide intuitive physical evidence for post-event fault tracing and liability determination, guiding the development of differentiated operation and maintenance strategies. Furthermore, the research findings offer guidance for optimizing the structure of insulated conductors and improving materials. For instance, by enhancing the abrasion resistance of the insulation layer or optimizing the electric field distribution, thermal accumulation-type discharges can be delayed or suppressed, thereby reducing the risk of wildfires caused by tree-to-line faults at the source and enhancing the safety and reliability of medium-voltage distribution networks.

Author Contributions

Methodology, T.T. and X.Y.; software, H.P. and J.L.; validation, H.P. and J.L. and S.F.; formal analysis, T.T.; investigation, T.T. and Y.H.; resources, H.P. and Y.H.; data curation, X.Y. and M.L.; writing—original draft preparation, T.T. and H.P.; writing—review and editing, T.T.; supervision, H.P.; and project administration, X.Y. and Y.H. All authors have read and agreed to the published version of the manuscript.

Funding

The National Natural Science Foundation of China (grant 52507023, grant 52177015 and grant 52507163), and for Project supported by the Natural Science Foundation of Hunan Province, China (grant 2026JJ60193), and for the support of The Natural Science Fund of Changsha (grant kq2502124), and for the support of Postgraduate Scientific Research Innovation Project of Changsha University of Science and Technology University grant CLKYCX25134). The authors would like to thank all authors for their contributions to this paper.

Data Availability Statement

The original contributions presented in this study are included in the article. Further inquiries can be directed to the corresponding authors.

Conflicts of Interest

The authors declare no conflict of interest.

Glossary

SymbolPhysical MeaningUnit
σElectrical conductivityS/m
φElectric potentialV
AMagnetic vector potentialWb/m
EElectric field strengthV/m
μ0Current densityA/m2
UincInception voltagekV
EincInception electric field strengthkV/mm
(E/p)crReduced critical electric fieldV·Pa−1·m−1
pAir pressurePa
dcavGap distancecm
ρ0Relative air density1
TTemperatureK/°C
cpSpecific heat capacity at constant pressureJ/(kg·K)
kThermal conductivityW/(m·K)
kBBoltzmann constantJ/K
qElectric chargeC
εnNet volumetric emissivityW/m3
ρDensitykg/m3
vFlow velocitym/s
μDynamic viscosityPa·s
IIdentity matrix/
BMagnetic flux densityT
RlvVolume resistance of branchΩ
Rlv1, Rlv2, Rlv3Branch resistance at each levelΩ
ρnResistivity of the n-th level branchΩ·m
hnHeight of the n-th level branchm
rnRadius of the n-th level branchm
NNumber of branch levels/
UVCUltraviolet discharge intensityμW/cm2
UVCbInitial ultraviolet discharge intensityμW/cm2
B, nStreamer theory constants/
ΔUVoltage step incrementkV
fpsFrame rateframes/s

References

  1. Warren, C.A.; Ammon, R.; Welch, G. A survey of distribution reliability measurement practices in the U.S. IEEE Trans. Power Deliv. 1999, 14, 250–257. [Google Scholar] [CrossRef] [Scilit]
  2. Liang, D.; Xu, B.; Tang, Y.; Wang, P.; Wang, W.; Sun, Z. Model and Detection Method for Tree-contact Single-phase-to-ground Faults on 10 kV Overhead Lines. Proc. CSEE 2021, 41, 5221–5232. [Google Scholar] [CrossRef]
  3. Soheili, A.; Sadeh, J. Evidential Reasoning Based Approach to High Impedance Fault Detection in Power Distribution Systems. IET Gener. Transm. Distrib. 2017, 11, 1325–1336. [Google Scholar] [CrossRef] [Scilit]
  4. Ghaderi, A.; Ginn, H.L.; Mohammadpour, H.A. High Impedance Fault Detection: A Review. Electr. Power Syst. Res. 2017, 143, 376–388. [Google Scholar] [CrossRef] [Scilit]
  5. Alejandra Reyes-Velarde California’s Camp Fire Was the Costliest Global Disaster Last Year, Insurance Report Shows. Available online: https://www.latimes.com/local/lanow/la-me-ln-camp-fire-insured-losses-20190111-story.html (accessed on 1 August 2025).
  6. Mitchell, J.W. Power Line Failures and Catastrophic Wildfires under Extreme Weather Conditions. Eng. Fail. Anal. 2013, 35, 726–735. [Google Scholar] [CrossRef] [Scilit]
  7. Xu, H.; Huang, X.; Yang, C.; Chen, T.; Yang, N.; Chen, L. Development Process and Characteristics Study of Tree Line Discharge in 10 KV Overhead Power Lines. Gongcheng Kexue Yu Jishu/Adv. Eng. Sci. 2025, 57, 278–289. [Google Scholar] [CrossRef]
  8. Qin, J.; Ning, X.; Fan, S.; Jia, Z. Discharge Ignition Mechanism of Tree-contacting Single-phase-to-groun Faults of Overhead Lines. Power Syst. Technol. 2023, 47, 1289–1299. [Google Scholar]
  9. Elkalashy, N.I.; Lehtonen, M.; Darwish, H.A.; Izzularab, M.A.; Taalab, A.I. Modeling and Experimental Verification of a High Impedance Arcing Fault in MV Networks. In Proceedings of the 2006 IEEE PES Power Systems Conference and Exposition, Atlanta, GA, USA, 29 October–1 November 2006; IEEE: Piscataway, NJ, USA, , 2006; Volume 14, pp. 1950–1956. [Google Scholar] [CrossRef] [Scilit]
  10. Marxsen, T. REFCL Technologies Test Program Final Report; Victorian Department of Economic Development, Jobs, Transport and Resources: Horsham, Australia, 2015. [Google Scholar]
  11. Yang, C.; Zhang, W.; Tang, R.; Xiao, X. Tree-Related High-Impedance Fault in Distribution Systems: Modeling, Detection, and Ignition Risk Assessment (Review). Energies 2025, 18, 548. [Google Scholar] [CrossRef] [Scilit]
  12. Cong, Z.; Liu, Y.; Yan, Y.; Wang, P.; Fang, J.; Wang, K.; Li, W.; Jiang, X. Study on the Mechanism and Electrical Characterization of the Tree-Contact Incipient Fault in the Non-Effectively Grounded System. IEEE Trans. Power Deliv. 2023, 38, 1709–1719. [Google Scholar] [CrossRef] [Scilit]
  13. Cong, Z.; Liu, Y.; Yan, Y.; Li, W.; Chen, H.; Jiang, X. Simulation and Experiment on Tree-Contact Incipient Fault Dynamic Characteristic in the Distribution Network. Gaodianya Jishu/High Volt. Eng. 2023, 49, 1224–1233. [Google Scholar] [CrossRef]
  14. Jiang, C.; Bi, M.; Zhang, S.; Li, K.; Lei, S.; Jiang, T. Study on Arc Characteristics and Combustion Feature of Tree-Wire Discharge Fault in Distribution Line. Electr. Power Syst. Res. 2024, 230, 110210. [Google Scholar] [CrossRef] [Scilit]
  15. Liang, D.; Xu, B.; Wang, P.; Wang, W. Comprehensive Study on Tree-Contact Single-Phase-to-Ground Faults: Modelling, Risk Analysis, and Detection Recommendations. High Volt. 2024, 9, 1280–1287. [Google Scholar] [CrossRef] [Scilit]
  16. Yu, F.; Wang, S.; Tang, K.; Lin, Y.; Wang, S.; Zhang, Y. Research Progress on the Fire Characteristics of Electric Cables and Wires. Fire 2024, 7, 186. [Google Scholar] [CrossRef] [Scilit]
  17. Qu, N.; Li, Z.; Zuo, J.; Chen, J. Fault Detection on Insulated Overhead Conductors Based on DWT-LSTM and Partial Discharge. IEEE Access 2020, 8, 87060–87070. [Google Scholar] [CrossRef] [Scilit]
  18. Boxue, D.; Hang, X. Tracking Failure Analysis of Insulating Materials at High Altitude. Insul. Mater. 2016, 49, 46–50. [Google Scholar]
  19. Pedersen, A.; McAllister, I.W.; Crichton, G.C.; Vibholm, S. Formulation of the streamer breakdown criterion and its application to strongly electronegative gases and gas mixtures. Archiv für Elektrotechnik 1984, 67, 395–402. [Google Scholar] [CrossRef] [Scilit]
  20. McAllister, I.W.; Pedersen, A. Corona-Onset Field-Strength Calculations and the Equivalent Radius Concept. Arch. Für Elektrotechnik 1981, 64, 43–48. [Google Scholar] [CrossRef] [Scilit]
  21. Pan, C.; Meng, Y.; Wu, K.; Han, Z.; Qin, K.; Cheng, Y. Simulation of Partial Discharge Sequences Using Fluid Equations. J. Phys. D Appl. Phys. 2011, 44, 255201. [Google Scholar] [CrossRef] [Scilit]
  22. Deeson, E. Electrical Breakdown in Gases. Phys. Bull. 1974, 25, 150. [Google Scholar] [CrossRef] [Scilit]
  23. Callender, G.; Tanmaneeprasert, T.; Lewin, L. Simulating partial discharge activity in a cylindrical void using a model of plasma dynamics. J. Phys. D Appl. Phys. 2018; in press. [CrossRef] [Scilit]
  24. Kai, B.; Weijiang, C.; Chengrong, L.I.; Haibin, S. Calculation of Lightning Induced Overvoltage on Overhead Distribution Lines. Proc. CSEE 2012, 32, 191–199+236. [Google Scholar] [CrossRef]
  25. Shao, Q.; Fan, S.; Fu, Z. Research on Arc Discharge Characteristics of 10 kV Distribution Line Tree Line. Eng 2026, 7, 7. [Google Scholar] [CrossRef] [Scilit]
  26. Ning, X.; Yu, R.; Liu, L.; Wang, J.; Zou, J.; Wang, H.; Tan, T.; Peng, H.; Yang, X. Establishment Mechanism of Power-Frequency Follow-Current Arc on Medium-Voltage Insulated Conductors Under Lightning Overvoltage. Inventions 2026, 11, 28. [Google Scholar] [CrossRef] [Scilit]
  27. Bilancia, L.F. Electrical Fire Patterns in Vegetation. In Proceedings of the 2020 IEEE Symposium on Product Compliance Engineering—(SPCE Portland), Portland, OR, USA, 16–17 November 2020. [Google Scholar] [CrossRef] [Scilit]
Figure 1. Settings for the two-dimensional simulation model of tree line contact: (a) geometric model of tree line contact; (b) grid division.
Energies 19 01990 g001
Figure 2. The electric field distribution under different scenarios: (a) electric field distribution for Case 2, and (b) electric field distribution for Case 3.
Energies 19 01990 g002
Figure 3. Electric field distribution at the insulation layer.
Energies 19 01990 g003
Figure 4. Temperature distribution and branch charring area under different scenarios: (a) temperature distribution and branch charring area for Case 2; (b) temperature distribution and branch charring area for Case 3.
Energies 19 01990 g004
Figure 5. Lightning impulse combined with power frequency voltage application test platform.
Energies 19 01990 g005
Figure 6. Typical breakdown and non-breakdown voltage waveforms: (a) breakdown voltage waveform; (b) non-breakdown voltage waveform.
Energies 19 01990 g006
Figure 7. Schematic of the test sample.
Energies 19 01990 g007
Figure 8. Insulated conductor and tree–conductor fault scenario configuration.
Energies 19 01990 g008
Figure 9. Discharge and ignition processes under different scenarios: (a) process for Case 1, (b) process for Case 2, and (c) process for Case 3.
Energies 19 01990 g009aEnergies 19 01990 g009b
Figure 10. Temperature changes in Case 1 and Case 2. (a) Temperature changes in Case 1; (b) temperature changes in Case 2.
Energies 19 01990 g010aEnergies 19 01990 g010b
Figure 11. Maximum temperature changes in Case 1 and Case 2.
Energies 19 01990 g011
Figure 12. Ultraviolet discharge under Case 1.
Energies 19 01990 g012
Figure 13. Ultraviolet discharge under Case 2: (a) 10 kV power frequency voltage; (b) 120 kV lightning overvoltage superimposed on 10 kV power frequency voltage.
Energies 19 01990 g013
Figure 14. Equivalent UVC under different case.
Energies 19 01990 g014
Figure 15. Carbonization channels and ablation of insulated conductors under different scenarios.
Energies 19 01990 g015
Figure 16. Ignition mechanisms of tree contact discharge on insulated conductors.
Energies 19 01990 g016
Table 1. Simulation parameters for insulated branch conductors.
ParametersBranchesInsulationConductors
Electrical conductivity (S/m)1 × 10−3~1 × 10−11 × 10−103.79 × 10⁷
Density (kg/m3)50012002700
Specific heat capacity (J/(kg·K))17252300908
Thermal conductivity (W/(m·K))0.220.3237
Relative permittivity52.38000
Table 2. Insulated conductor tree–conductor fault scenarios.
No.Sample Configuration
Case 1Localized complete wear of the insulation layer on the insulated conductor, resulting in extensive exposure of the conductor core, with the branch in direct contact with the core.
Case 2Localized lightning puncture hole in the insulation layer of the insulated conductor, resulting in small-area exposure of the conductor core. The remaining insulation is abraded, and an air gap exists between the branch and the puncture hole.
Case 3Localized lightning puncture hole in the insulation layer of the insulated conductor, resulting in small-area exposure of the conductor core. The remaining insulation is unabraded, and an air gap exists between the branch and the puncture hole.
Disclaimer/Publisher’s Note: The statements, opinions and data contained in all publications are solely those of the individual author(s) and contributor(s) and not of MDPI and/or the editor(s). MDPI and/or the editor(s) disclaim responsibility for any injury to people or property resulting from any ideas, methods, instructions or products referred to in the content.