4.1. Parametric Response Trend Analysis
This study investigated these modeled relationships by examining the parametric response trends in solar radiation (with summer solar radiation denoted as SRCM and winter solar radiation as SRHM), cooling energy consumption, and heating energy consumption under varying building spacings, staggered spacings, and orientations. As presented in
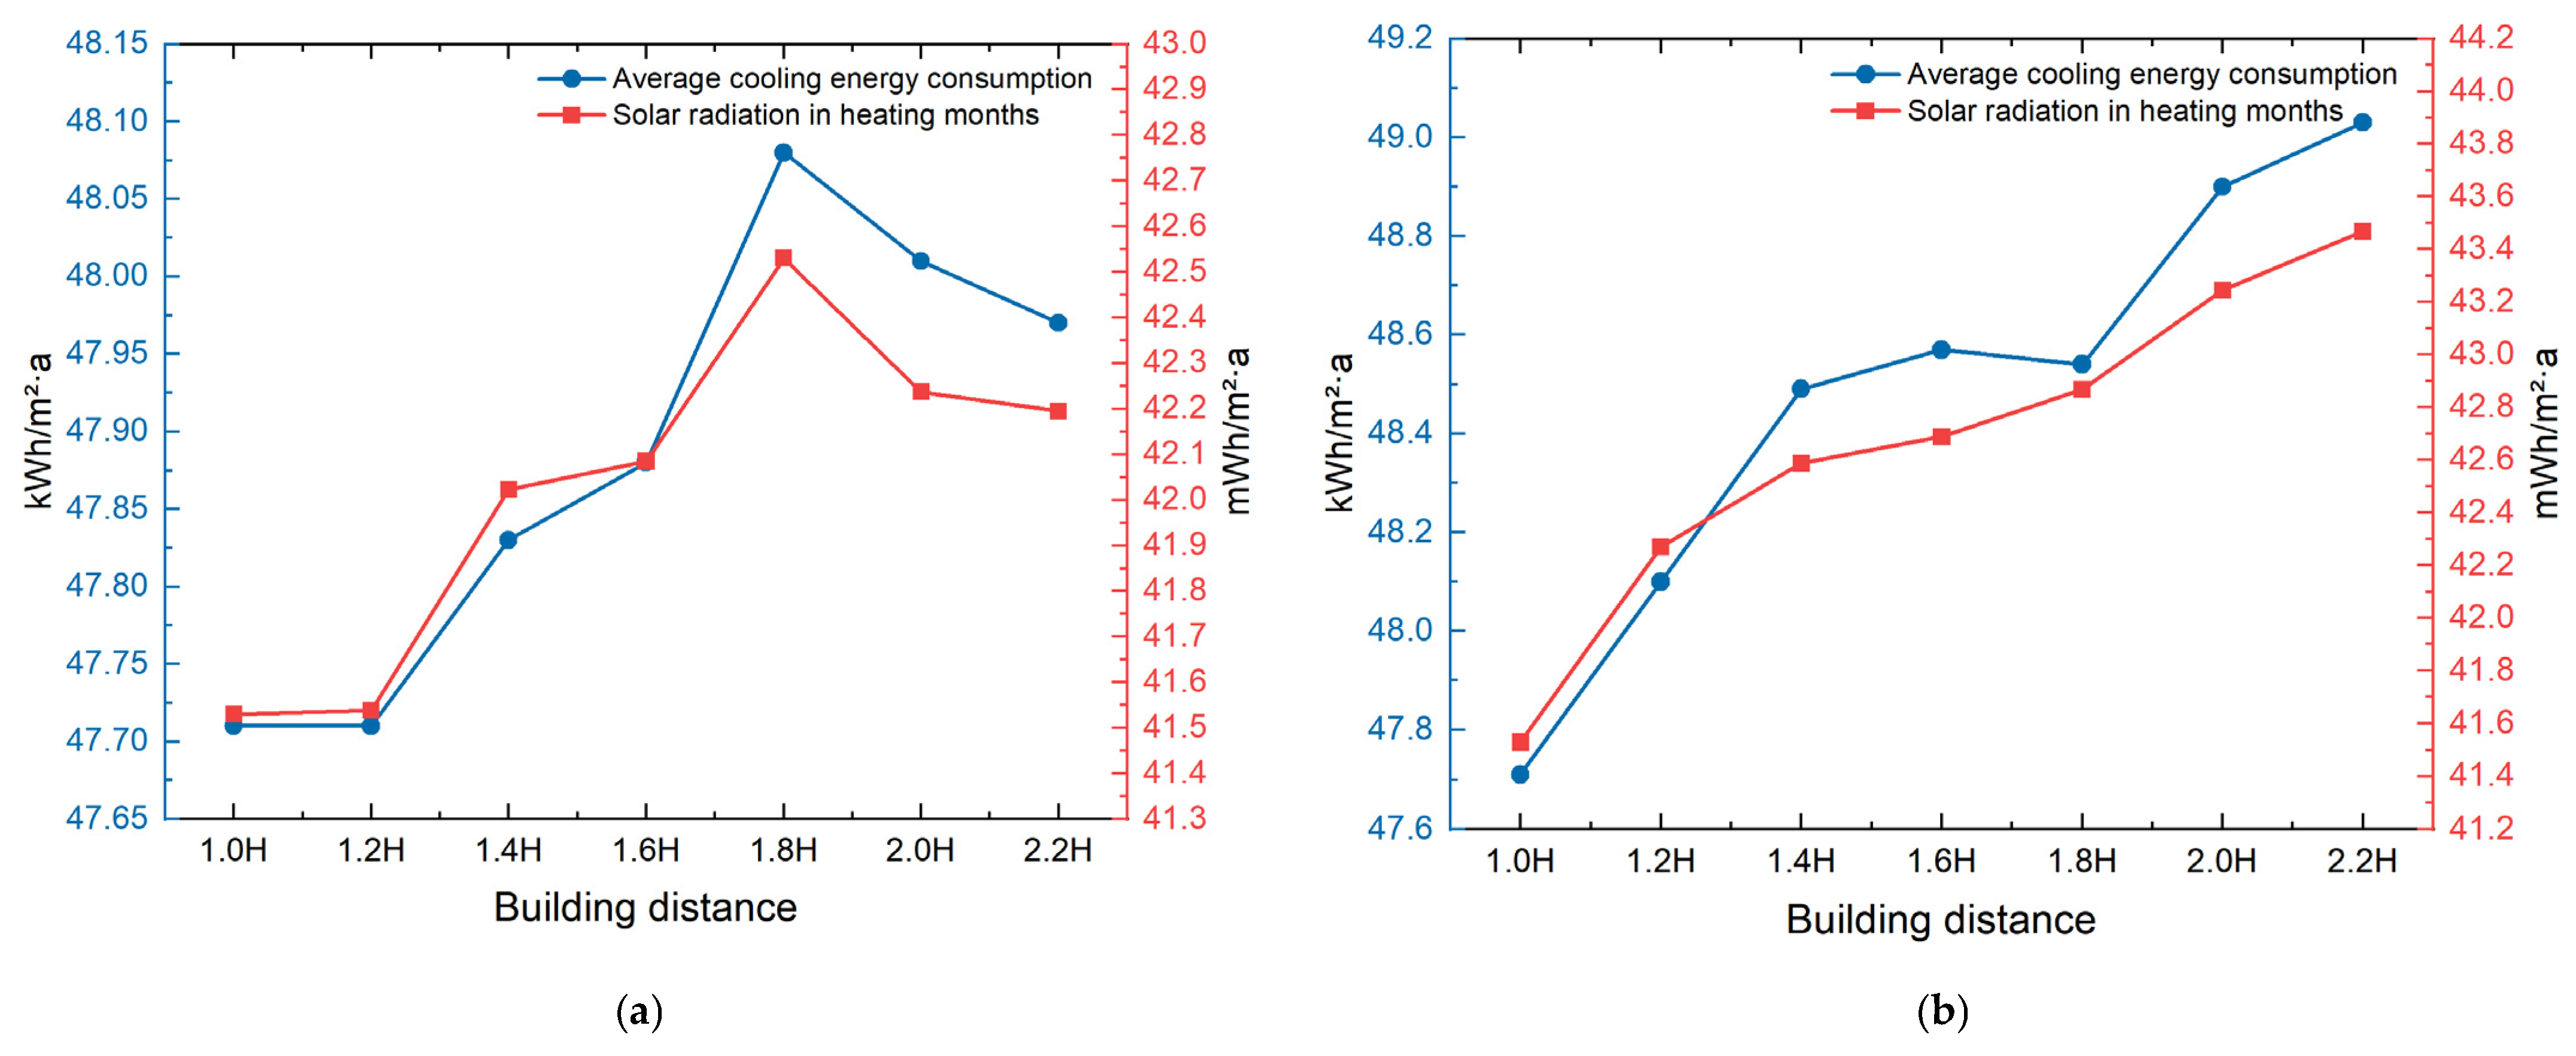
Table 15, there was a significant positive correlation between the amount of solar radiation received by buildings in summer and their spacing in both west–east and south–north orientations. As the building spacing increases, the mutual shading effect among structures is weakened, leading to a significant increase in solar radiation heat gain.
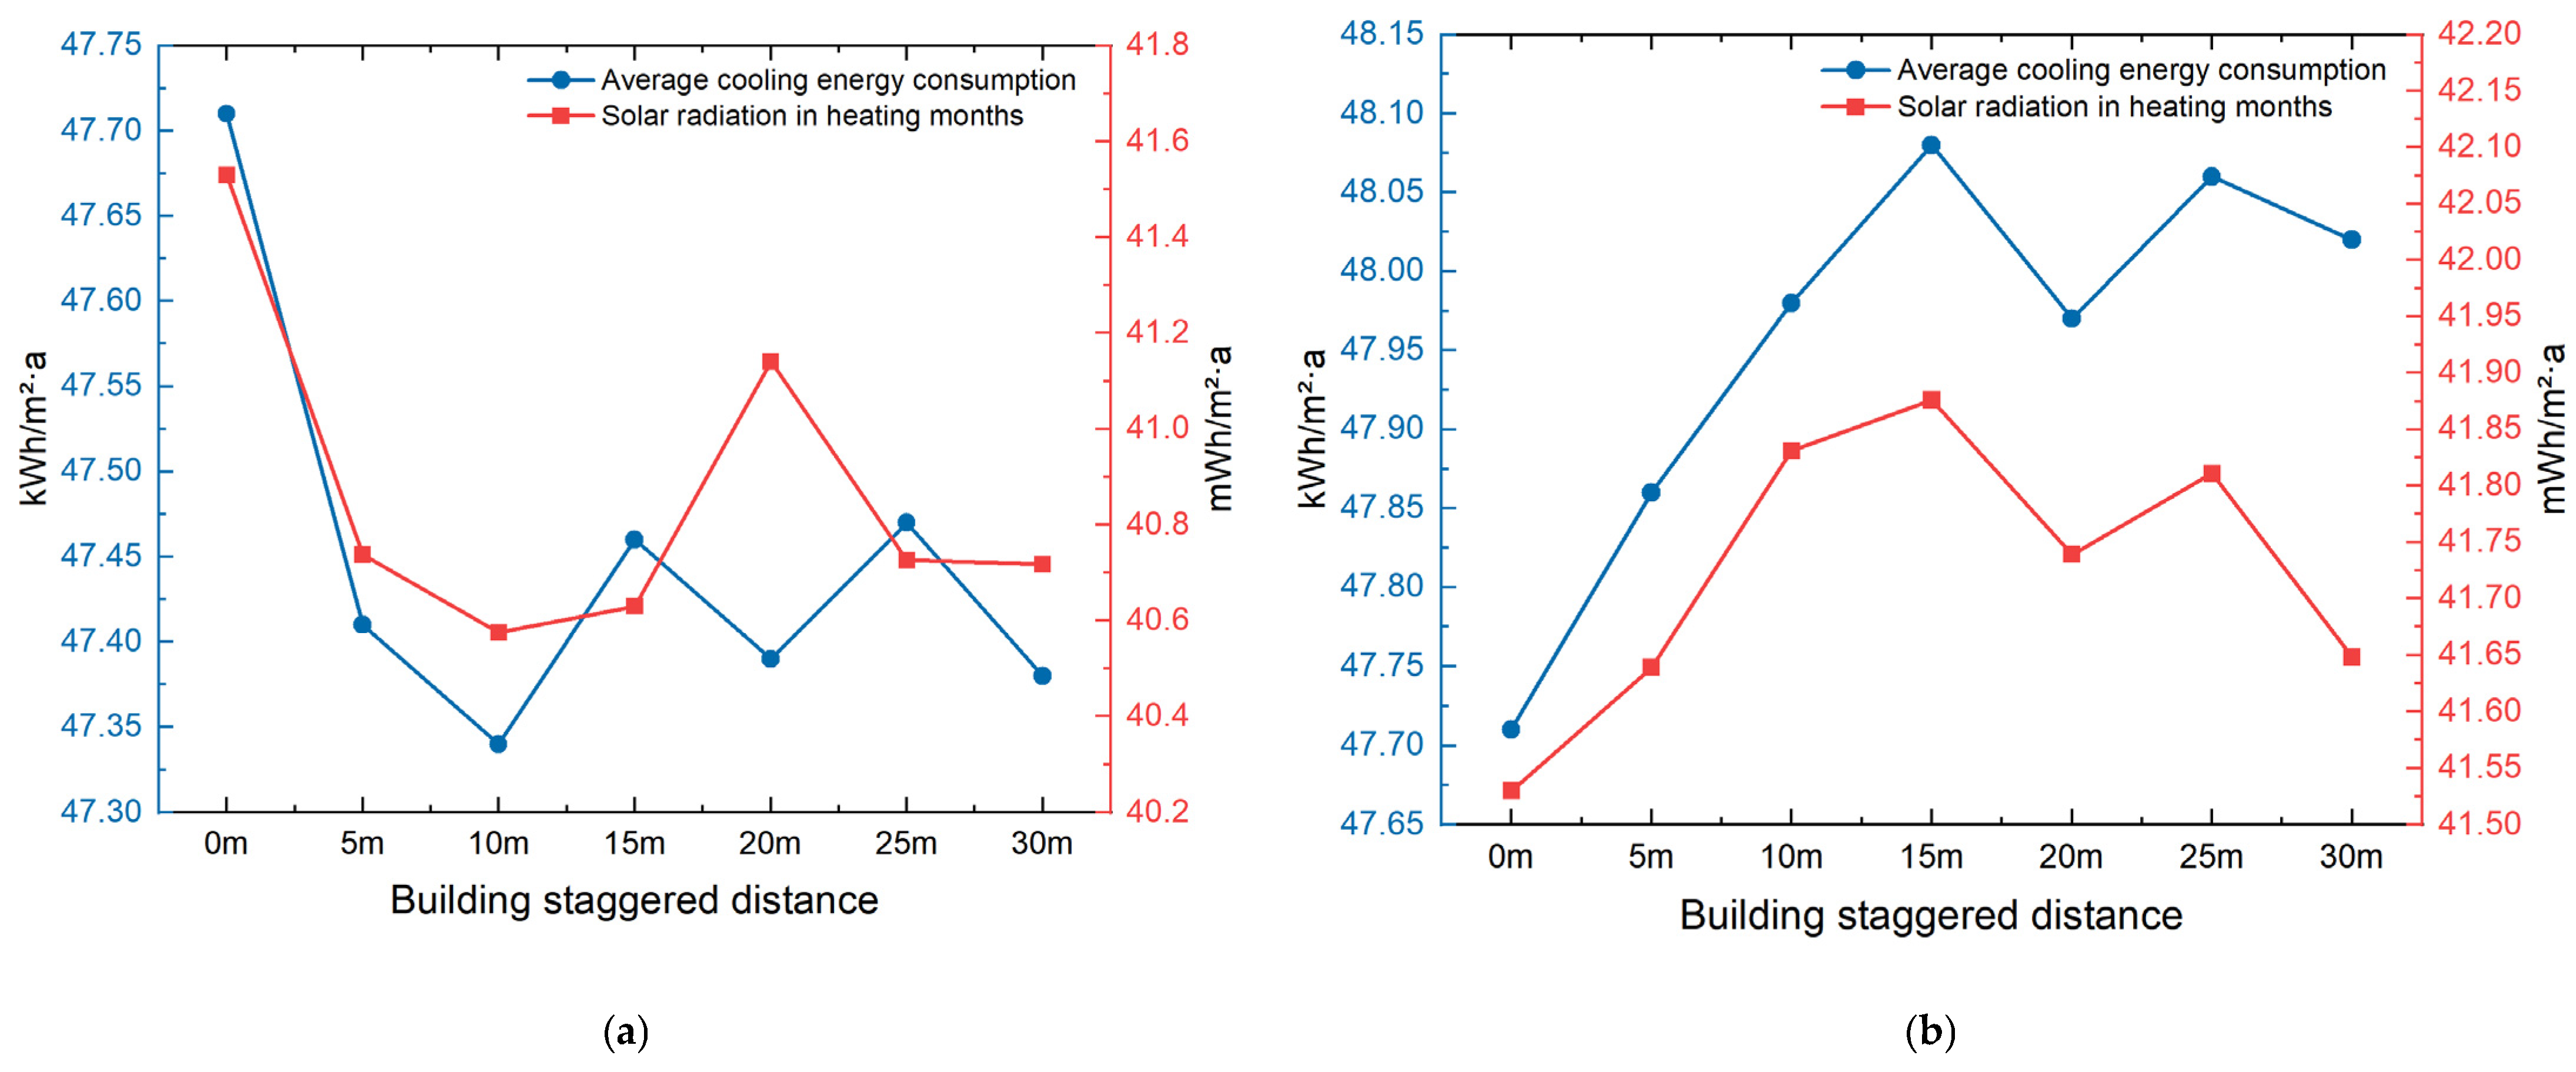
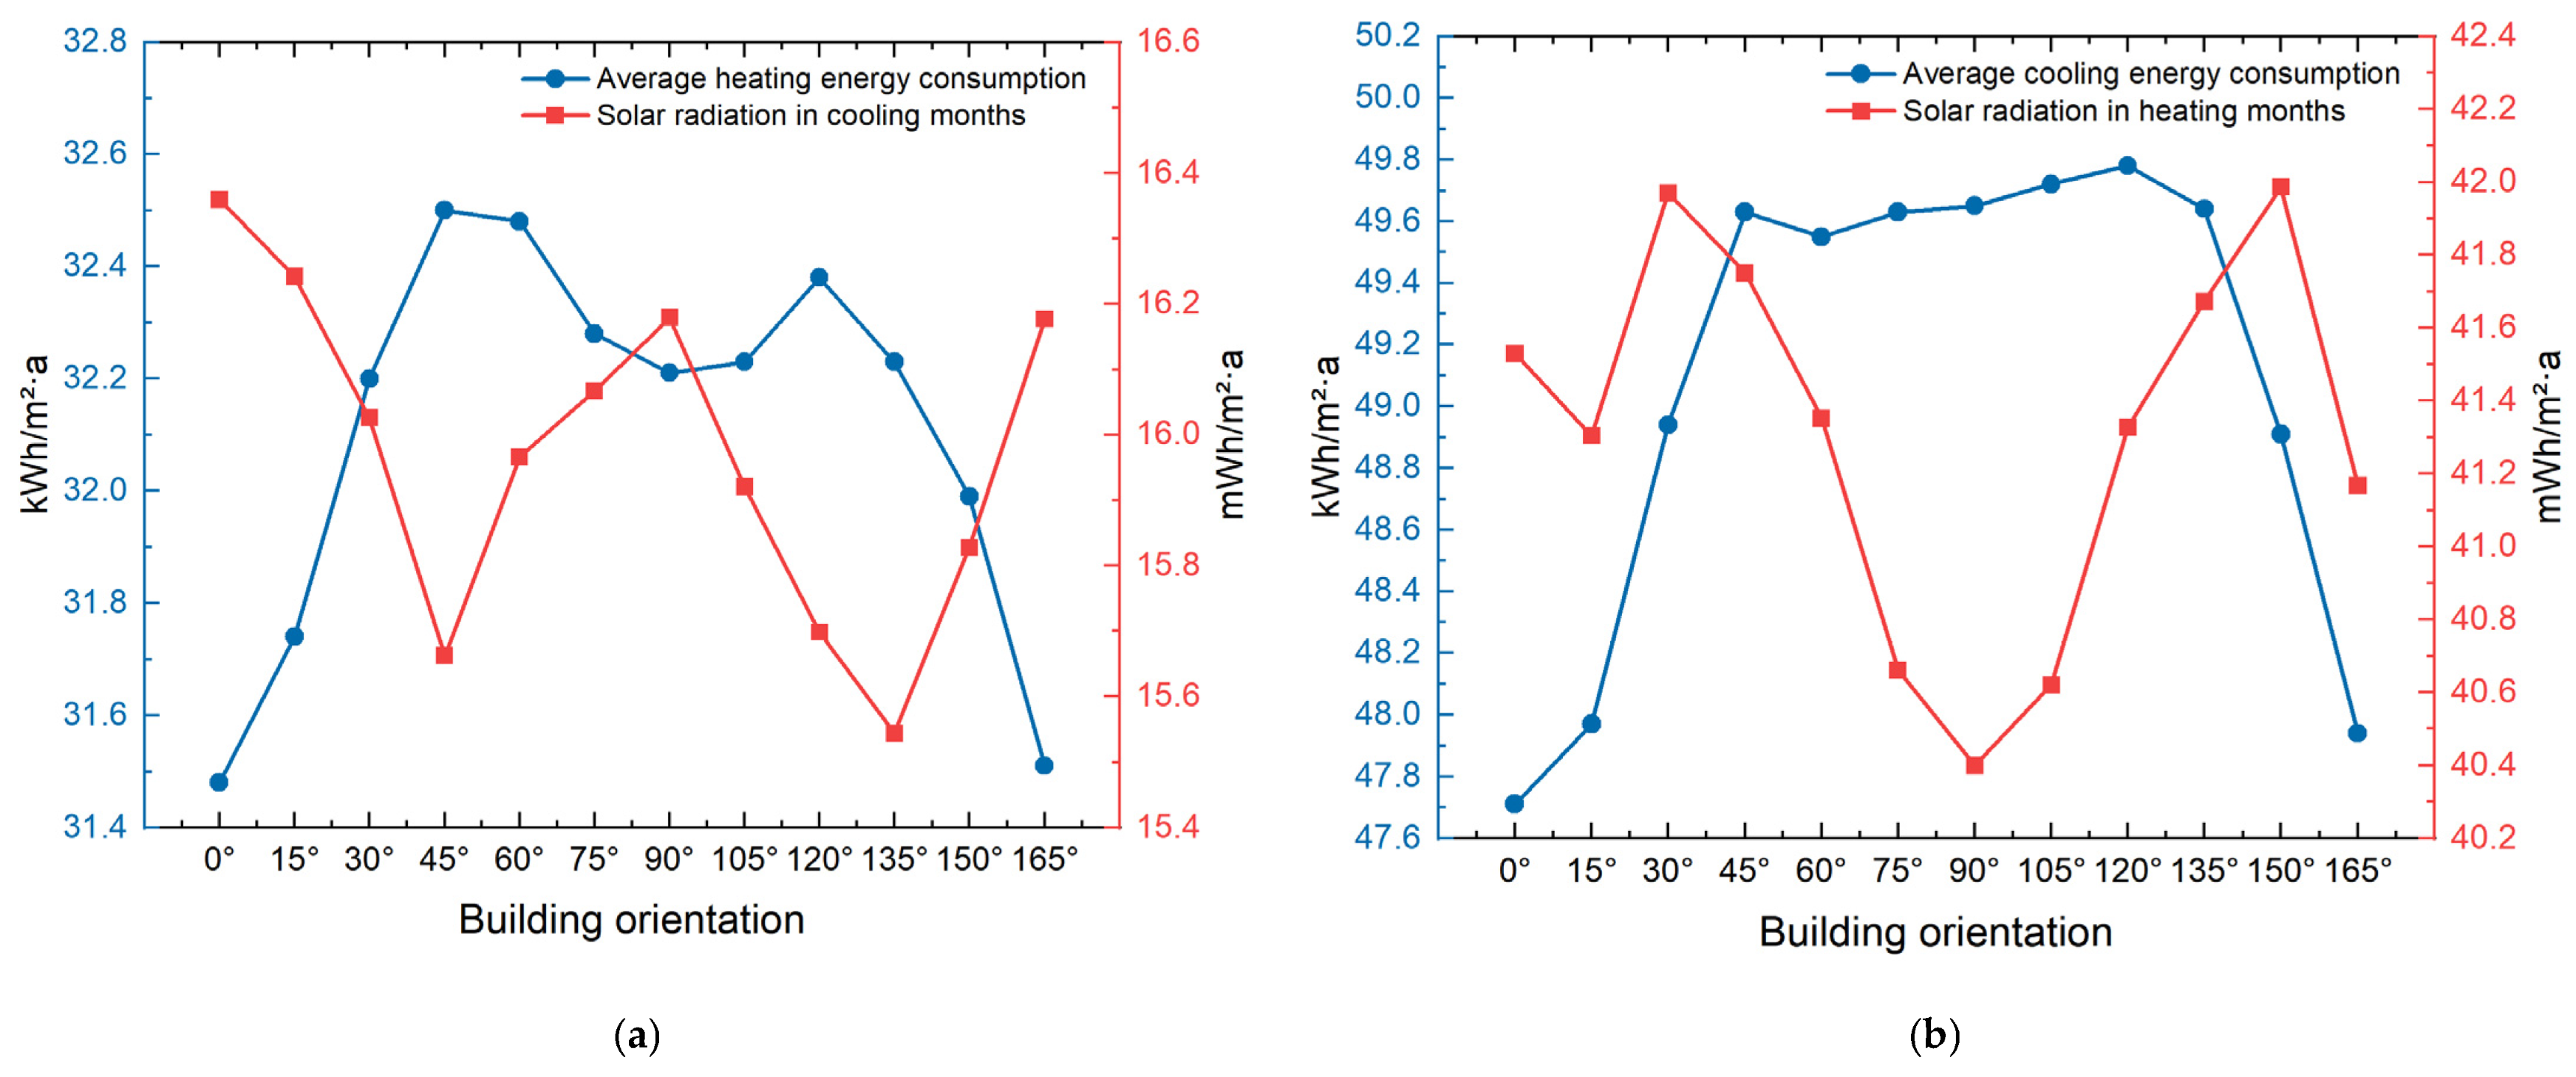
Furthermore, a significant positive correlation is discerned between the cooling energy intensity of the buildings and the acquired solar radiation. This suggests that heightened building spacing reduces shading effects and consequently amplifies the cooling energy intensity. For west–east staggered spacing, both solar radiation and cooling energy intensity exhibit negative correlations, though the results do not reach statistical significance (Sig > 0.05). Conversely, cooling energy consumption displays a substantial positive correlation with solar radiation, aligning with the requirement for correlation. Meanwhile, when examining south–north staggered column spacing, solar radiation and staggered column spacing exhibit no discernible correlation. Nonetheless, notable positive correlations exist between solar radiation and cooling energy consumption, as well as cooling energy consumption and south–north staggered column spacing distance. In the assessment of orientation factors, the amount of solar radiation received by the building does not exhibit significant correlations with either cooling energy consumption or building orientation.
Linear regression was carried out to help explain the results of the correlation analysis. As seen in
Table 16, the relationship between summer solar radiation and building spacing in the west–east orientation can be expressed as follows:
where Y
1 represents the summer solar radiation in the west–east direction, and X
1 represents W-E BD.
Similarly, the formula describing the relationship between cooling energy consumption and building spacing in the west–east orientation is
where Y
2 represents the cooling energy consumption in the west–east direction, and X
2 represents W-E BD.
The formula describing the relationship between summer solar radiation and building spacing in the south–north orientation is
where Y
3 represents the summer solar radiation in the south–north direction, and X
3 represents S-N BD.
The formula describing the relationship between cooling energy consumption and building spacing in the south–north orientation is
where Y
4 represents the cooling energy consumption in the south–north direction, and X
4 represents S-N BD.
The formula describing the relationship between cooling energy consumption and building staggered spacing in the south–north orientation is
where Y
5 represents the cooling energy consumption in the south–north direction, and X
5 represents S-N BSD.
Table 16.
Exploratory parametric trend analysis of cooling energy consumption and related factors.
Table 16.
Exploratory parametric trend analysis of cooling energy consumption and related factors.
| Type | Correlation Factors | R2 | Sig1 | Constant Term | Sig2 | Coefficient | Sig3 |
|---|
| W-E | SRCM-BD | 0.710 | 0.011 | 47.419 | <0.001 | 0.291 | 0.011 |
| CEC-BD | 0.759 | 0.011 | 46.811 | <0.001 | 0.310 | 0.011 |
| S-N | SRCM-BD | 0.921 | <0.001 | 40.368 | <0.001 | 1.436 | <0.001 |
| CEC-BD | 0.898 | <0.001 | 46.874 | <0.001 | 1.002 | <0.001 |
| CEC-BSD | 0.541 | 0.036 | 47.813 | <0.001 | 0.009 | 0.036 |
A correlation analysis was conducted to explore the relationships between building morphological elements, solar radiation, carbon emissions, and heating energy consumption. As shown in
Table 17 and
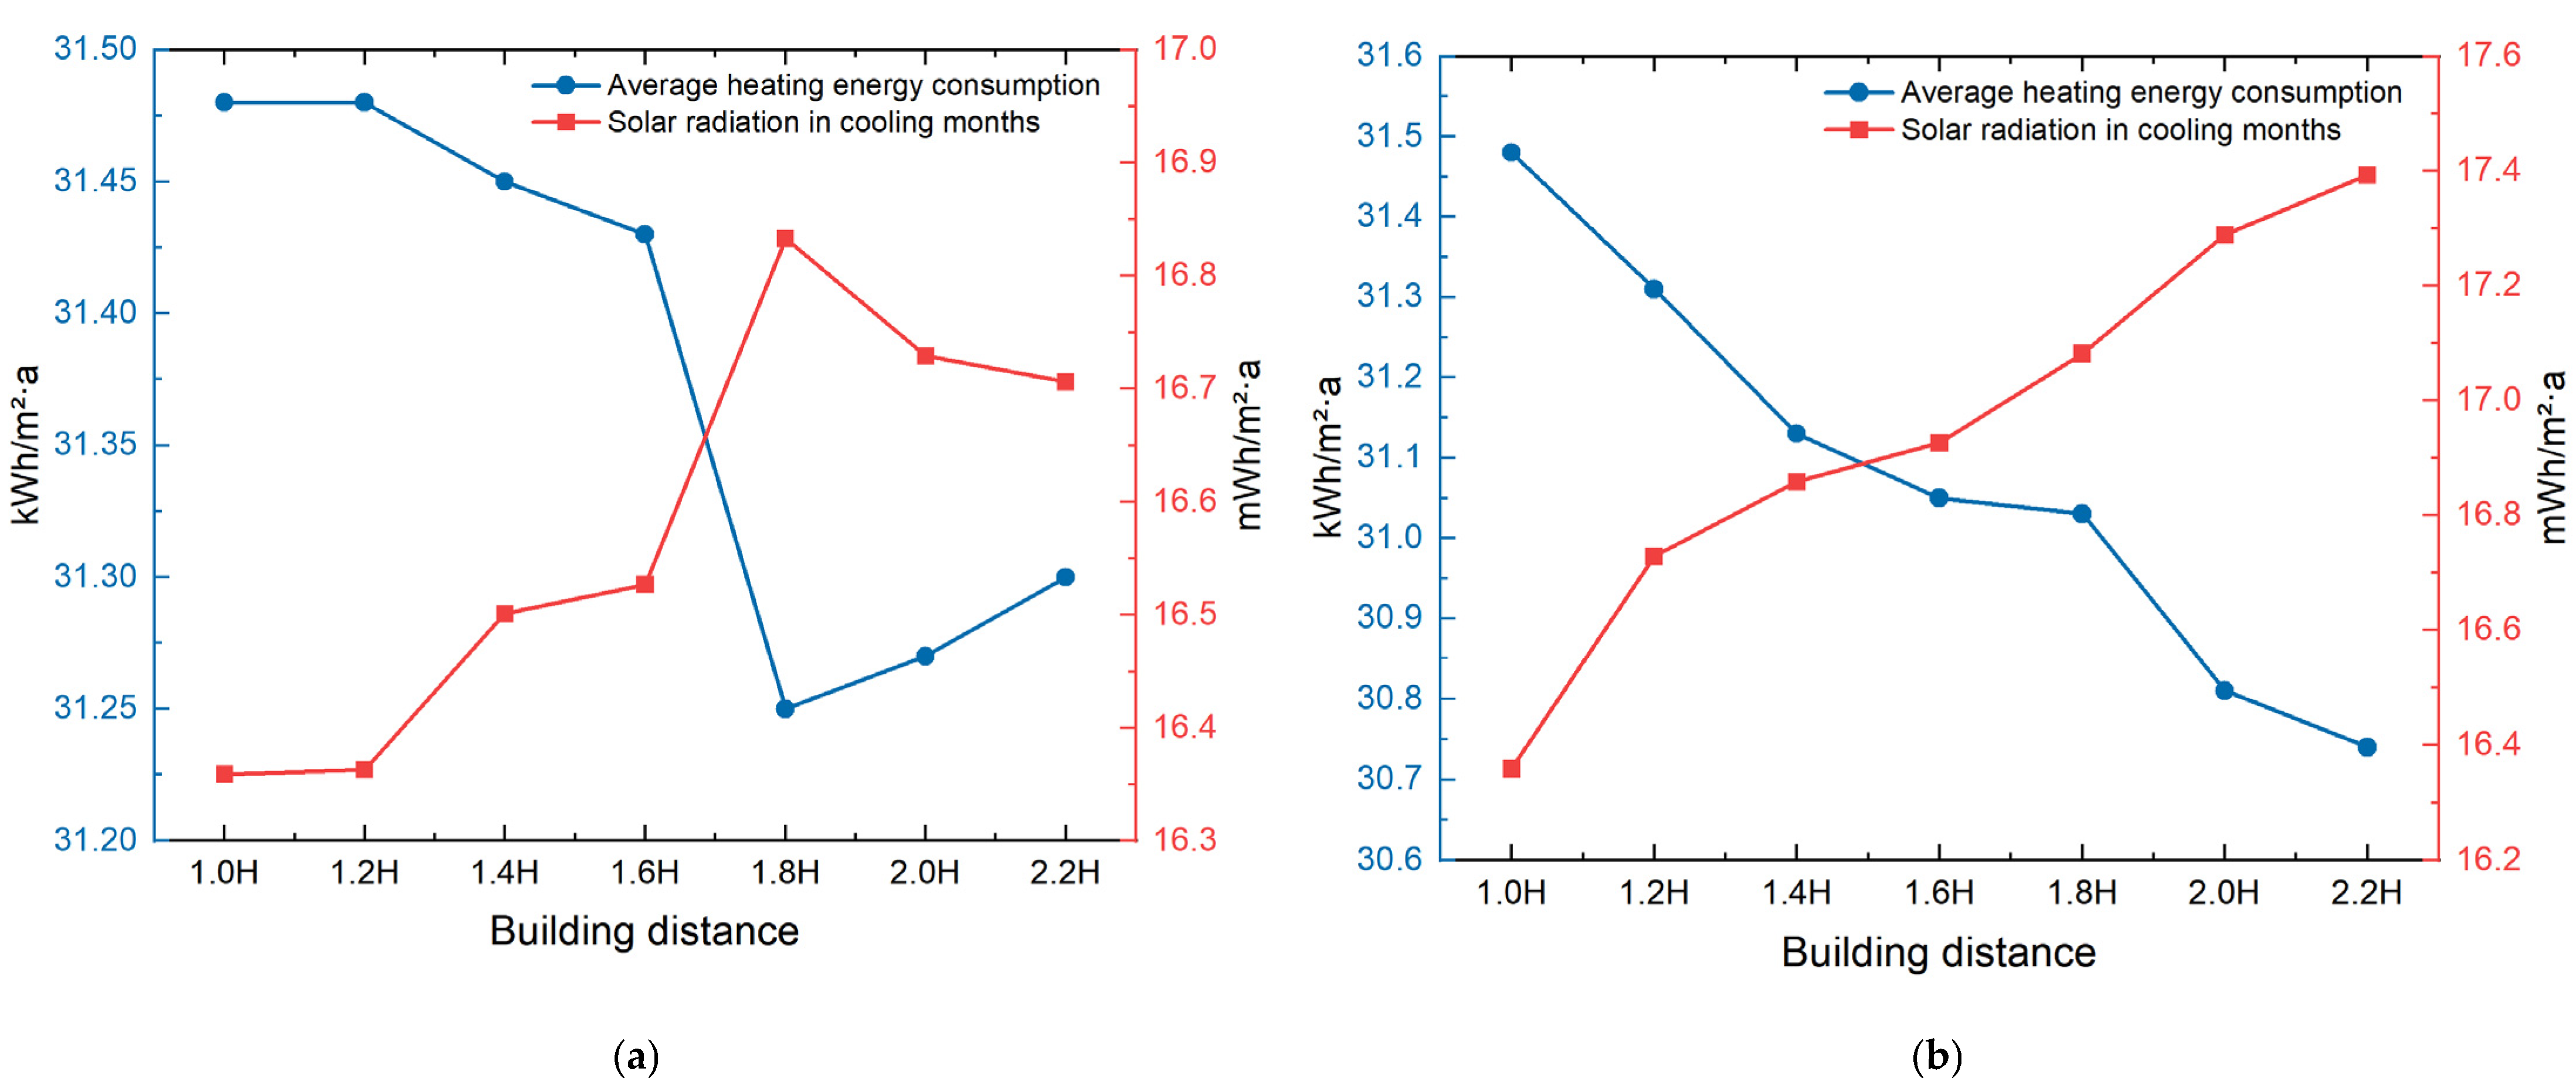
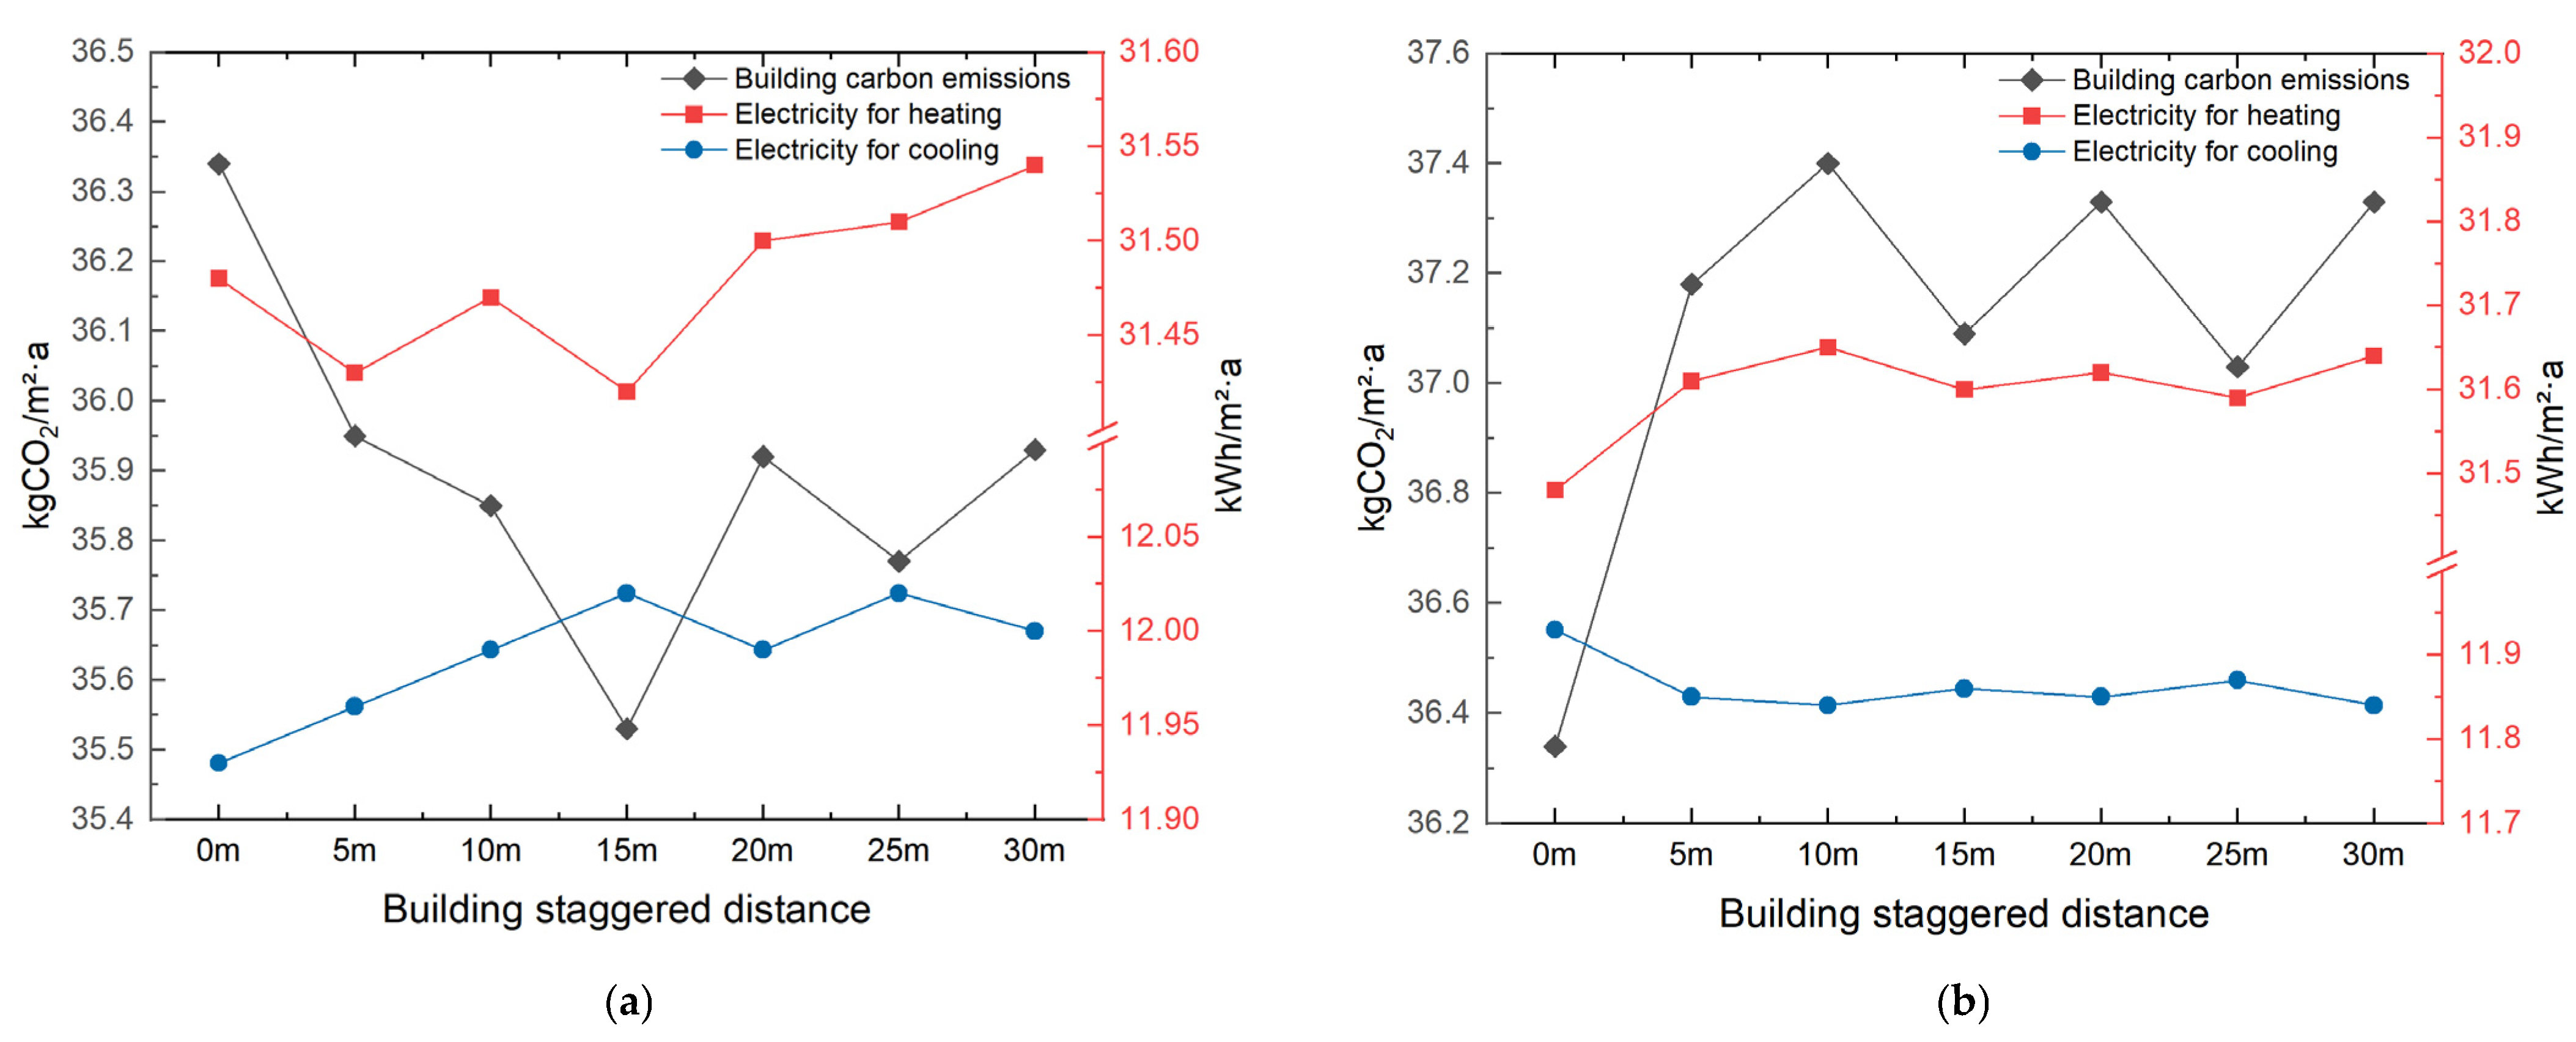
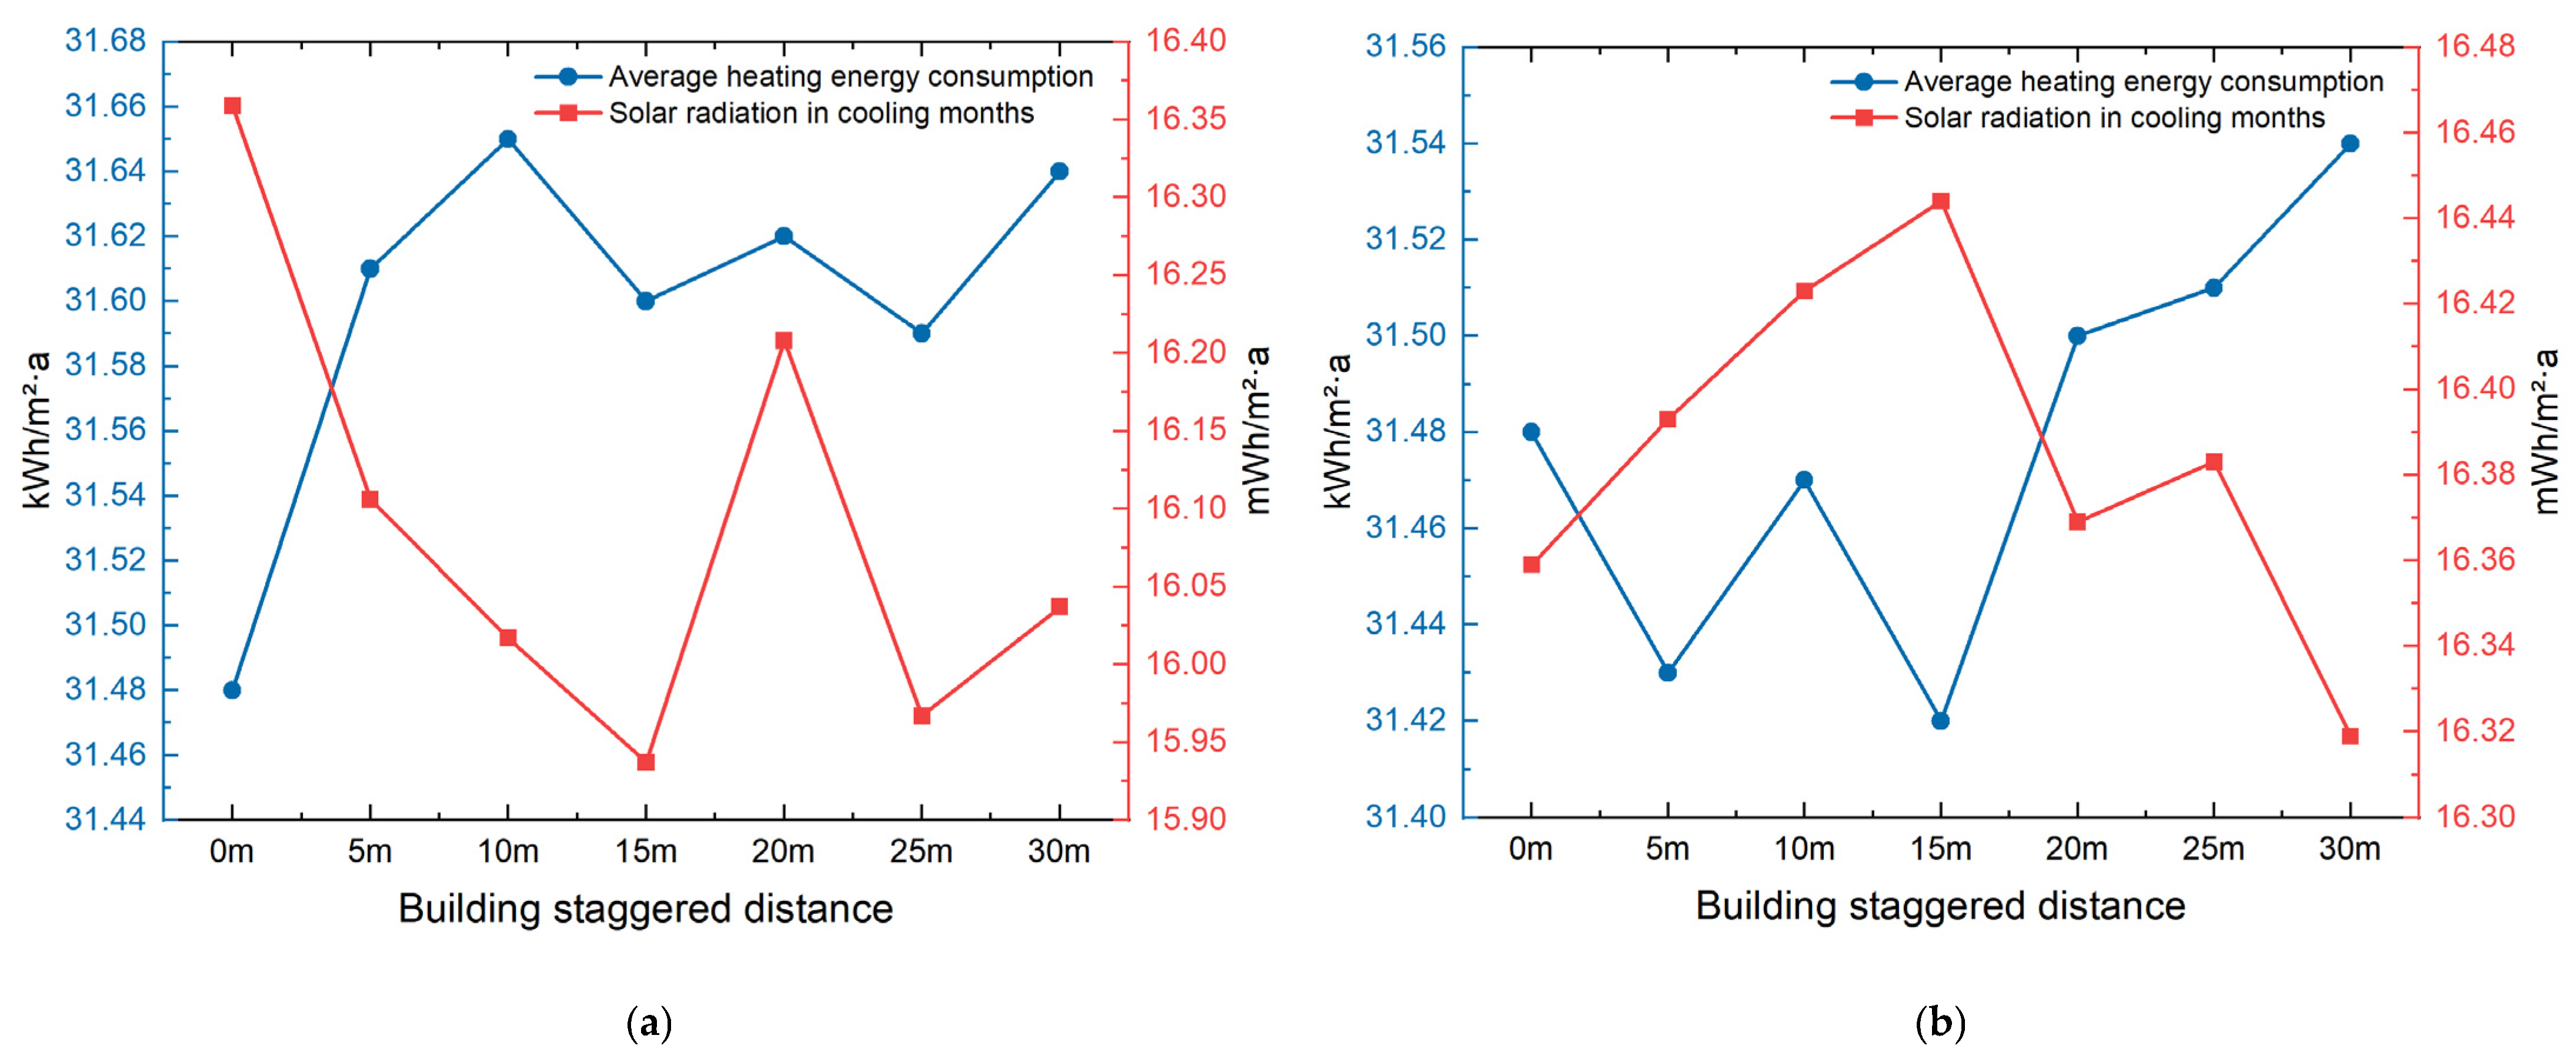
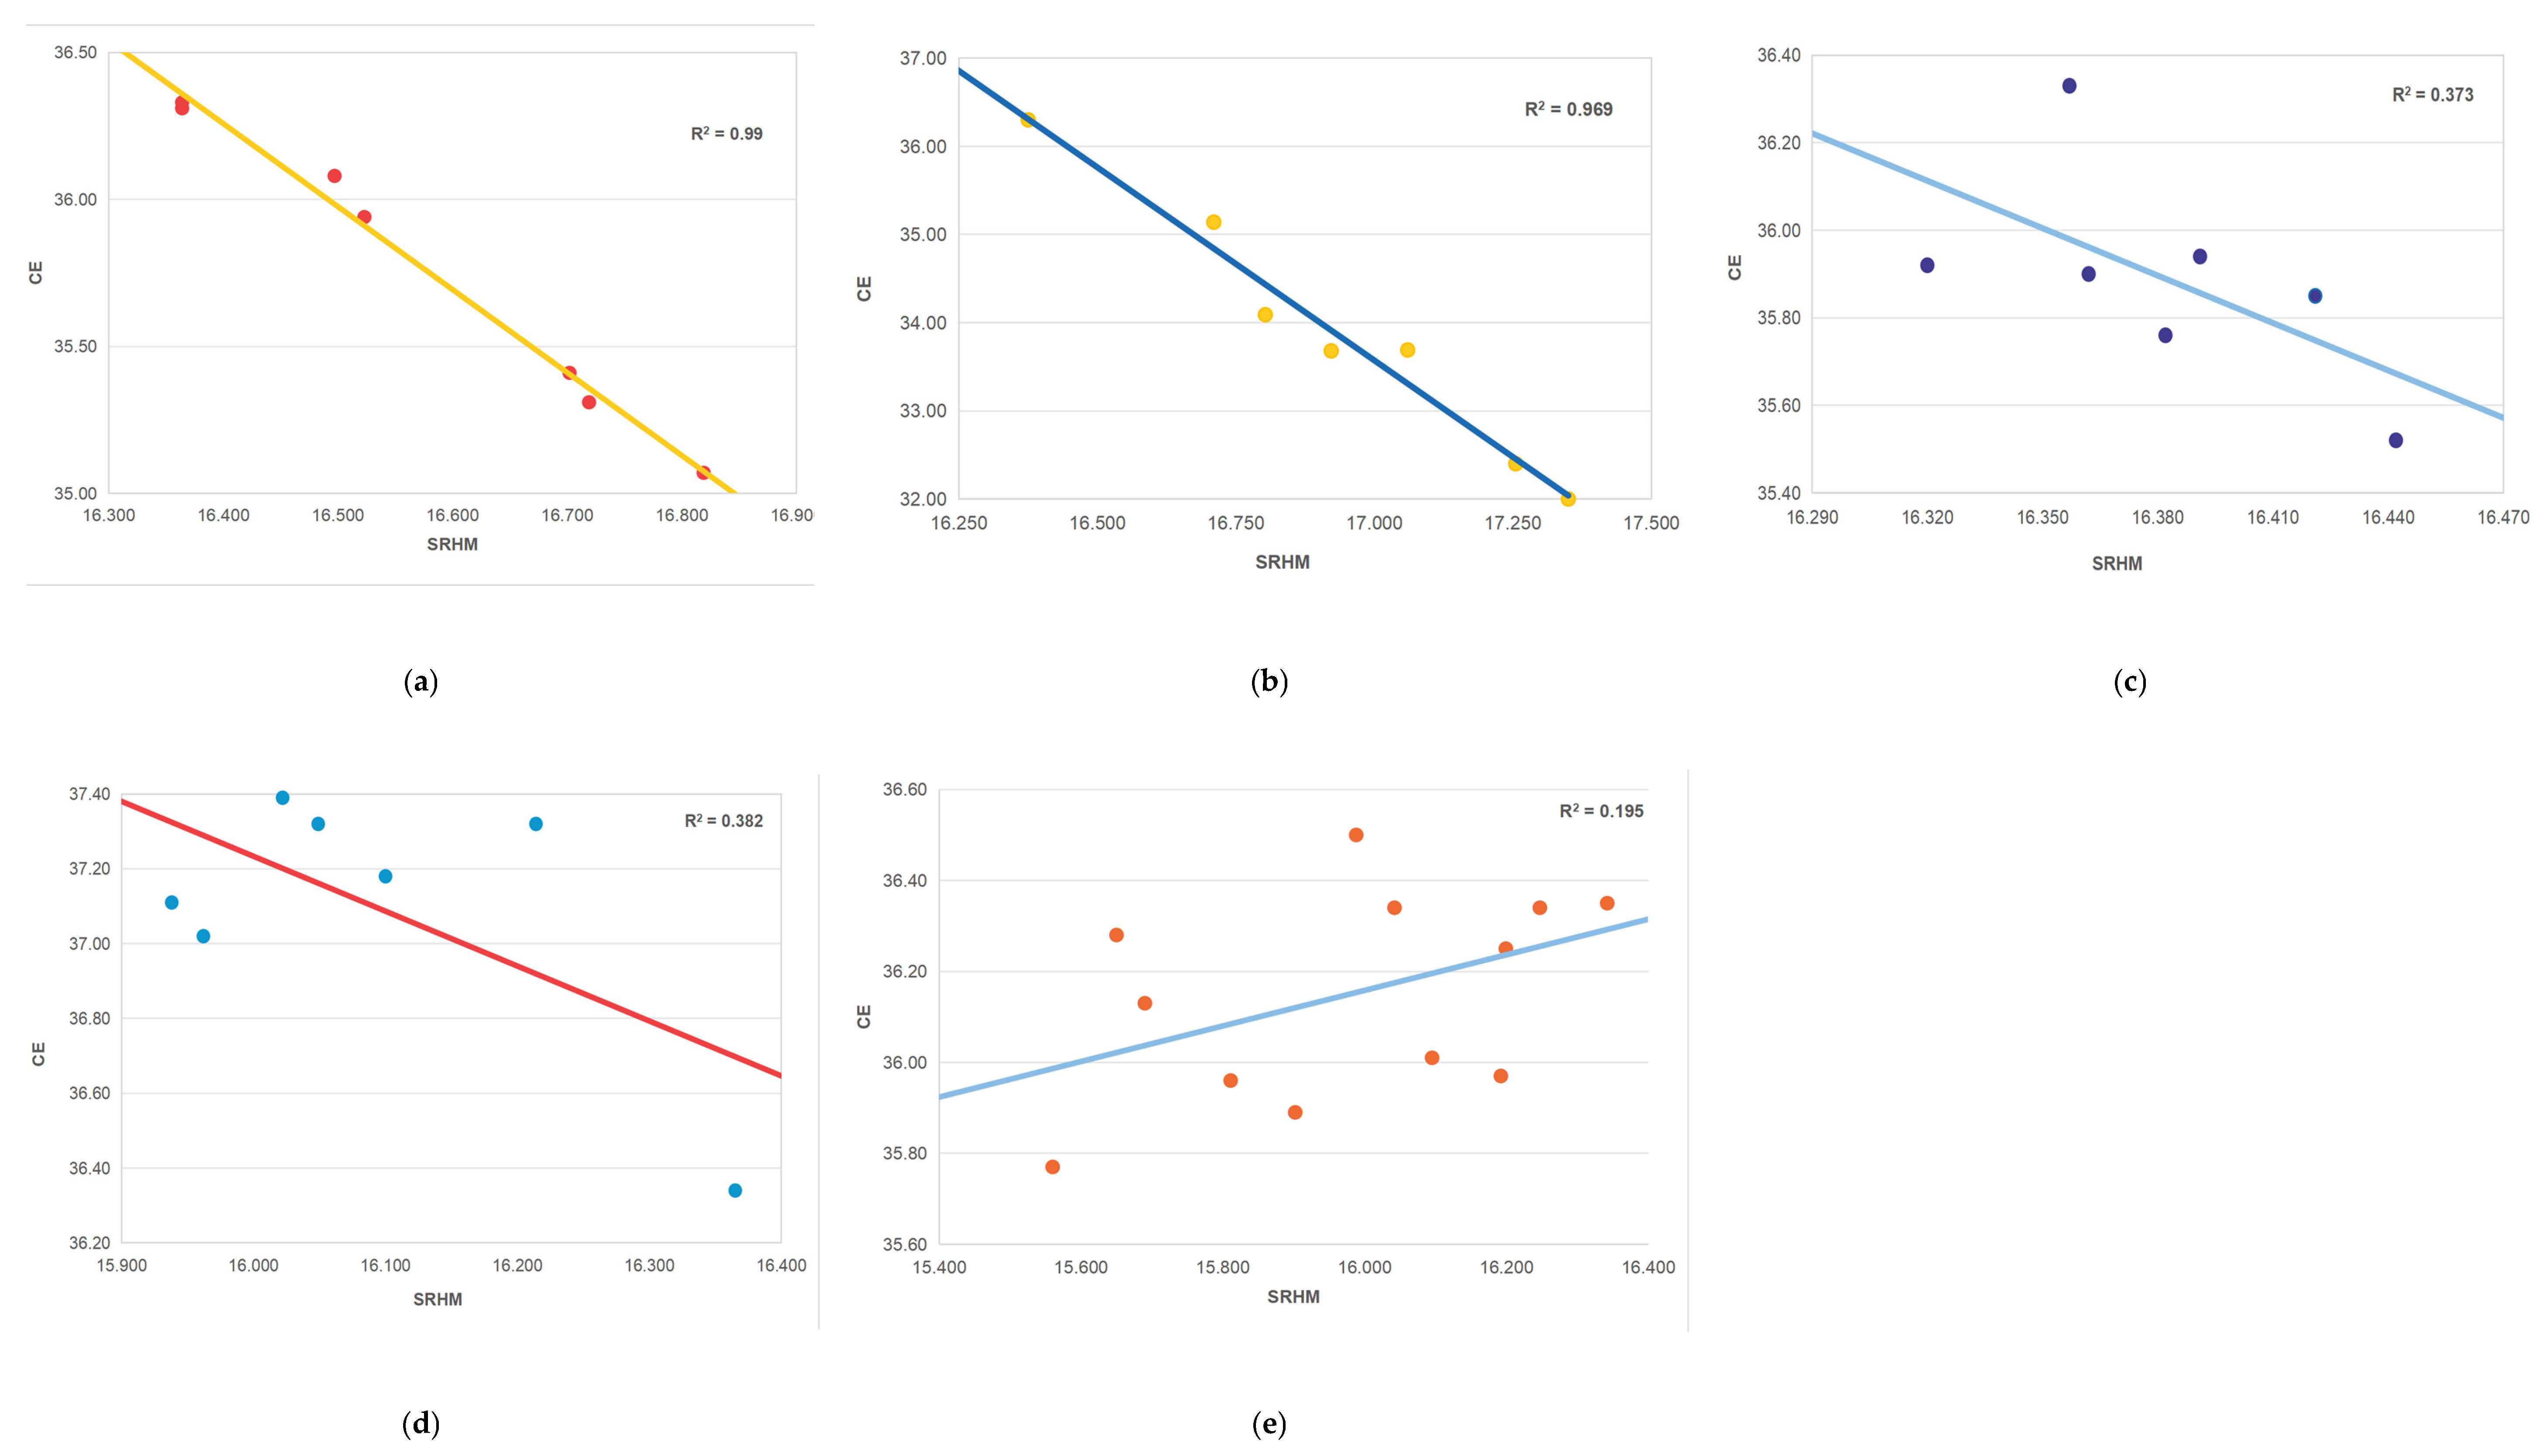
Figure 11, building spacing exhibits a positive correlation with solar radiation in both orientations, consistent with the expectation that increased spacing reduces mutual shading and enhances solar heat gain. Carbon emissions show a negative correlation with solar radiation (Sig. < 0.001), suggesting that greater solar heat gain may reduce heating demand and associated carbon emissions.
We found that the solar radiation received by buildings did not exhibit a statistically significant correlation with either staggered spacing or orientation, and no significant correlation was observed between the carbon emission intensity of buildings and the solar radiation they received. Based on these findings, a supplementary analysis was conducted to examine the parametric response trends, aiming to explore the influence of different building spacing configurations in the west–east and south–north directions on solar radiation levels, as well as the mechanism through which variations in solar radiation affect carbon emission intensity.
A supplementary parametric trend analysis was conducted to examine the influence of building spacing on solar radiation levels and the subsequent effect on carbon emission intensity. As shown in
Table 18 and
Figure 12, in the west–east direction, the regression between solar radiation and building spacing yields an R
2 of 76.5%, with a
p-value below 0.001. The resulting equation is as follows:
where Y
6 represents the winter solar radiation in the west–east direction, and X
6 represents the building spacing in the west–east direction.
For the relationship between solar radiation and building carbon emissions in the west–east direction, the R
2 is 0.990, with both the constant and coefficient terms significant at less than a 0.001 level. The corresponding equation is as follows:
where Y
7 denotes the winter building carbon emissions in the west–east direction, and X
7 denotes solar radiation in the west–east direction.
In the south–north direction, the regression between solar radiation and building spacing yields an R
2 of 0.960 (
p < 0.001), with both constant and coefficient terms significant. The corresponding equation is as follows:
where Y
8 denotes winter solar radiation in the south–north direction, and X
8 denotes building spacing in the south–north direction. The effect of building spacing on solar radiation is more pronounced in the south–north direction than in the west–east.
For the relationship between solar radiation and building carbon emissions in the south–north direction, the R
2 is 0.969 (
p < 0.001), with both constant and coefficient terms significant. The corresponding equation is as follows:
where Y
9 represents the winter building carbon emissions in the south–north direction, and X
9 represents solar radiation in the south–north direction. The negative coefficient in this equation indicates that a significant negative correlation also exists in the south–north direction, with a more pronounced carbon reduction effect than that observed in the west–east direction, suggesting that optimizing building spacing in the south–north orientation plays a more significant role in reducing carbon emissions.
Table 18.
Exploratory parametric trend analysis of heating energy consumption and related factors.
Table 18.
Exploratory parametric trend analysis of heating energy consumption and related factors.
| Type | Correlation Factors | R2 | Sig1 | Constant Term | Sig2 | Coefficient | Sig3 |
|---|
| W-E | SRHM-BD | 0.765 | 0.010 | 15.973 | <0.001 | 0.376 | 0.010 |
| CE-SRHM | 0.990 | <0.001 | 81.780 | <0.001 | −2.775 | <0.001 |
| S-N | SRHM-BD | 0.960 | <0.001 | 15.677 | <0.001 | 0.794 | <0.001 |
| CE-SRHM | 0.969 | <0.001 | 105.180 | <0.001 | −4.205 | <0.001 |
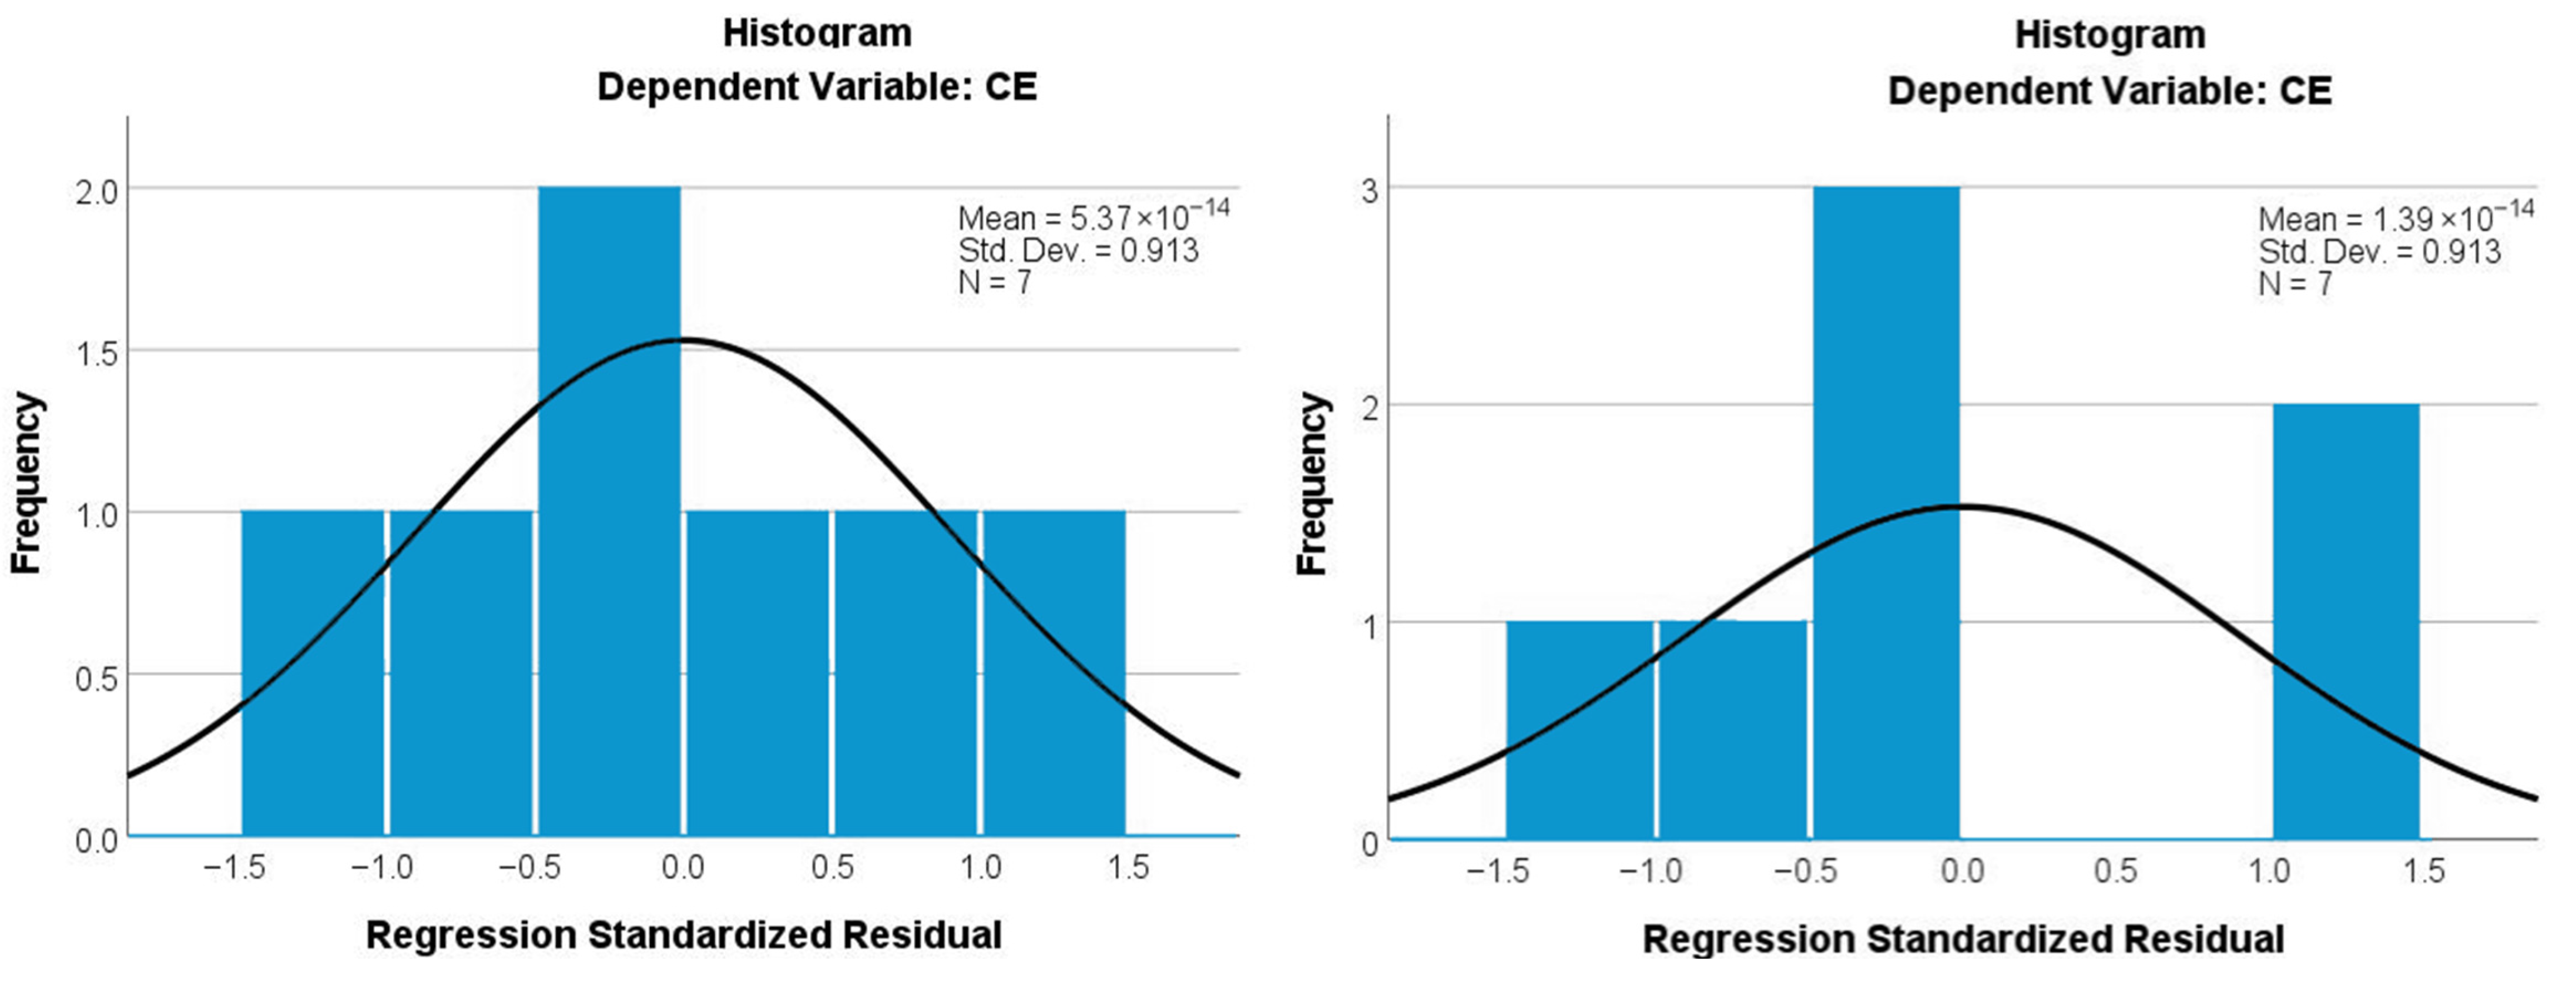
Figure 12.
Histogram of the model’s residual distribution.
Figure 12.
Histogram of the model’s residual distribution.
In summary, the parametric response trend analysis suggests a sequential relationship among building spacing, solar radiation, and carbon emissions: increased building spacing is associated with higher winter solar radiation, which in turn correlates with reduced carbon emissions. This relationship is particularly pronounced in the south–north direction, providing a reference for energy-efficient building design under the idealized simulation conditions of this study. However, it should be noted that all regression and correlation analyses in this study are exploratory in nature, and the potential nonlinear relationships between building spacing, solar radiation, energy consumption, and carbon emissions require further investigation.
4.2. Comparison with Prior Studies and Contribution
Unlike previous studies, which often included the open space ratio as a macro-level statistical indicator in regression models [
58], or focused on the independent effects of a single morphological parameter, this study incorporates four parameters—building spacing, staggered spacing, orientation, and open space layout—into a unified analytical framework to systematically examine the mechanisms by which the combination of multiple factors influences the energy consumption of building clusters. Our previous research [
10] focused on typological comparisons of layout forms; this study builds upon that foundation to advance to a quantitative analysis at the parameter level, examining the contribution weights of each design parameter. Furthermore, unlike traditional studies that directly establish a “form–energy consumption” correlation [
59], this study uses solar radiation gain as a key mediating indicator to construct an analytical framework for the “form–radiation–energy consumption” transmission mechanism, thereby overcoming the limitations of existing research in revealing intermediate transmission mechanisms.
Based on the aforementioned analytical framework, this study employs a combined approach of parametric simulation and parameter response trend analysis. By coupling two stages—solar radiation simulation and energy consumption simulation—we quantitatively analyzed the “form–radiation–energy consumption” transmission chain. Specifically, solar radiation simulation was used to quantify the spatiotemporal distribution of solar radiation received by building surfaces, which served as a key input for the energy consumption simulation. The parameter response trend analysis was used to isolate the independent effects of multiple morphological factors and identify the patterns of their influence on energy consumption. This method overcomes the limitations of traditional case studies, which struggle to separate multiple influencing factors and identify independent patterns of influence, thereby providing trend-based, mechanism-driven evidence for optimizing residential area morphology.
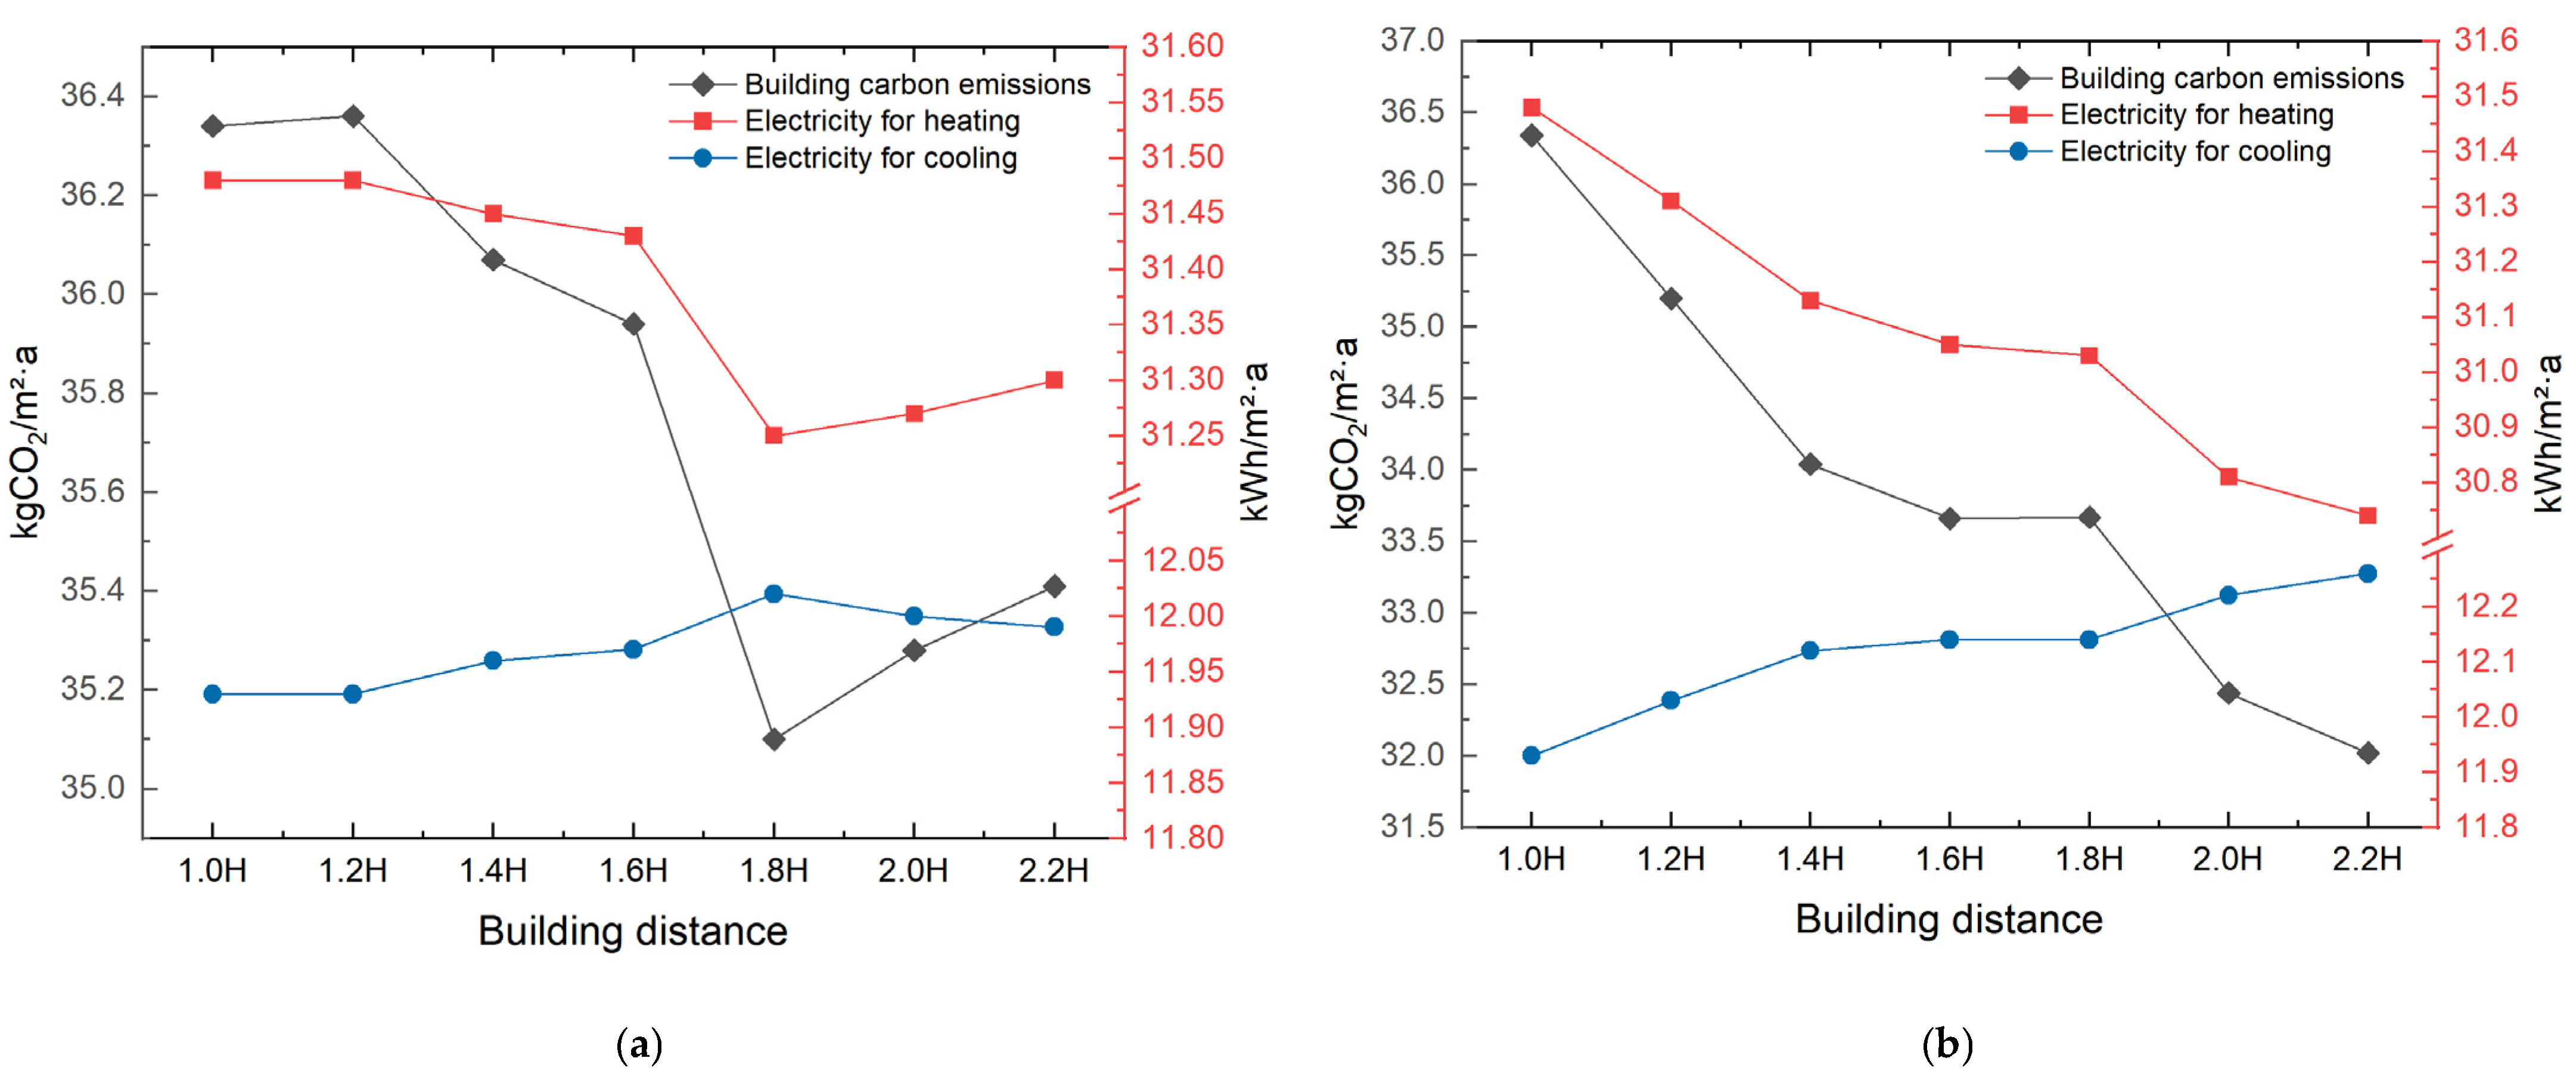
To further validate the robustness of the model, we benchmarked the simulation results against existing studies in regions with hot summers and cold winters. Regarding building spacing, this study found that the effect of east–west spacing on cooling energy consumption exhibits a non-monotonic relationship, peaking at 1.8H; increasing north–south spacing continues to drive up cooling energy consumption, while heating energy consumption decreases significantly with increasing north–south spacing. This is consistent with the spacing-energy relationship observed by Cui et al. in hot-summer, cold-winter climates [
60]. Regarding staggered spacing, existing research indicates that staggered layouts can significantly reduce building energy consumption [
61,
62]. This study further examined the influence of staggered orientation and found that east–west staggering reduces building cooling energy consumption, whereas north–south staggering actually increases it. Regarding building orientation, Zhou et al. found that north–south orientation maximizes community energy self-sufficiency [
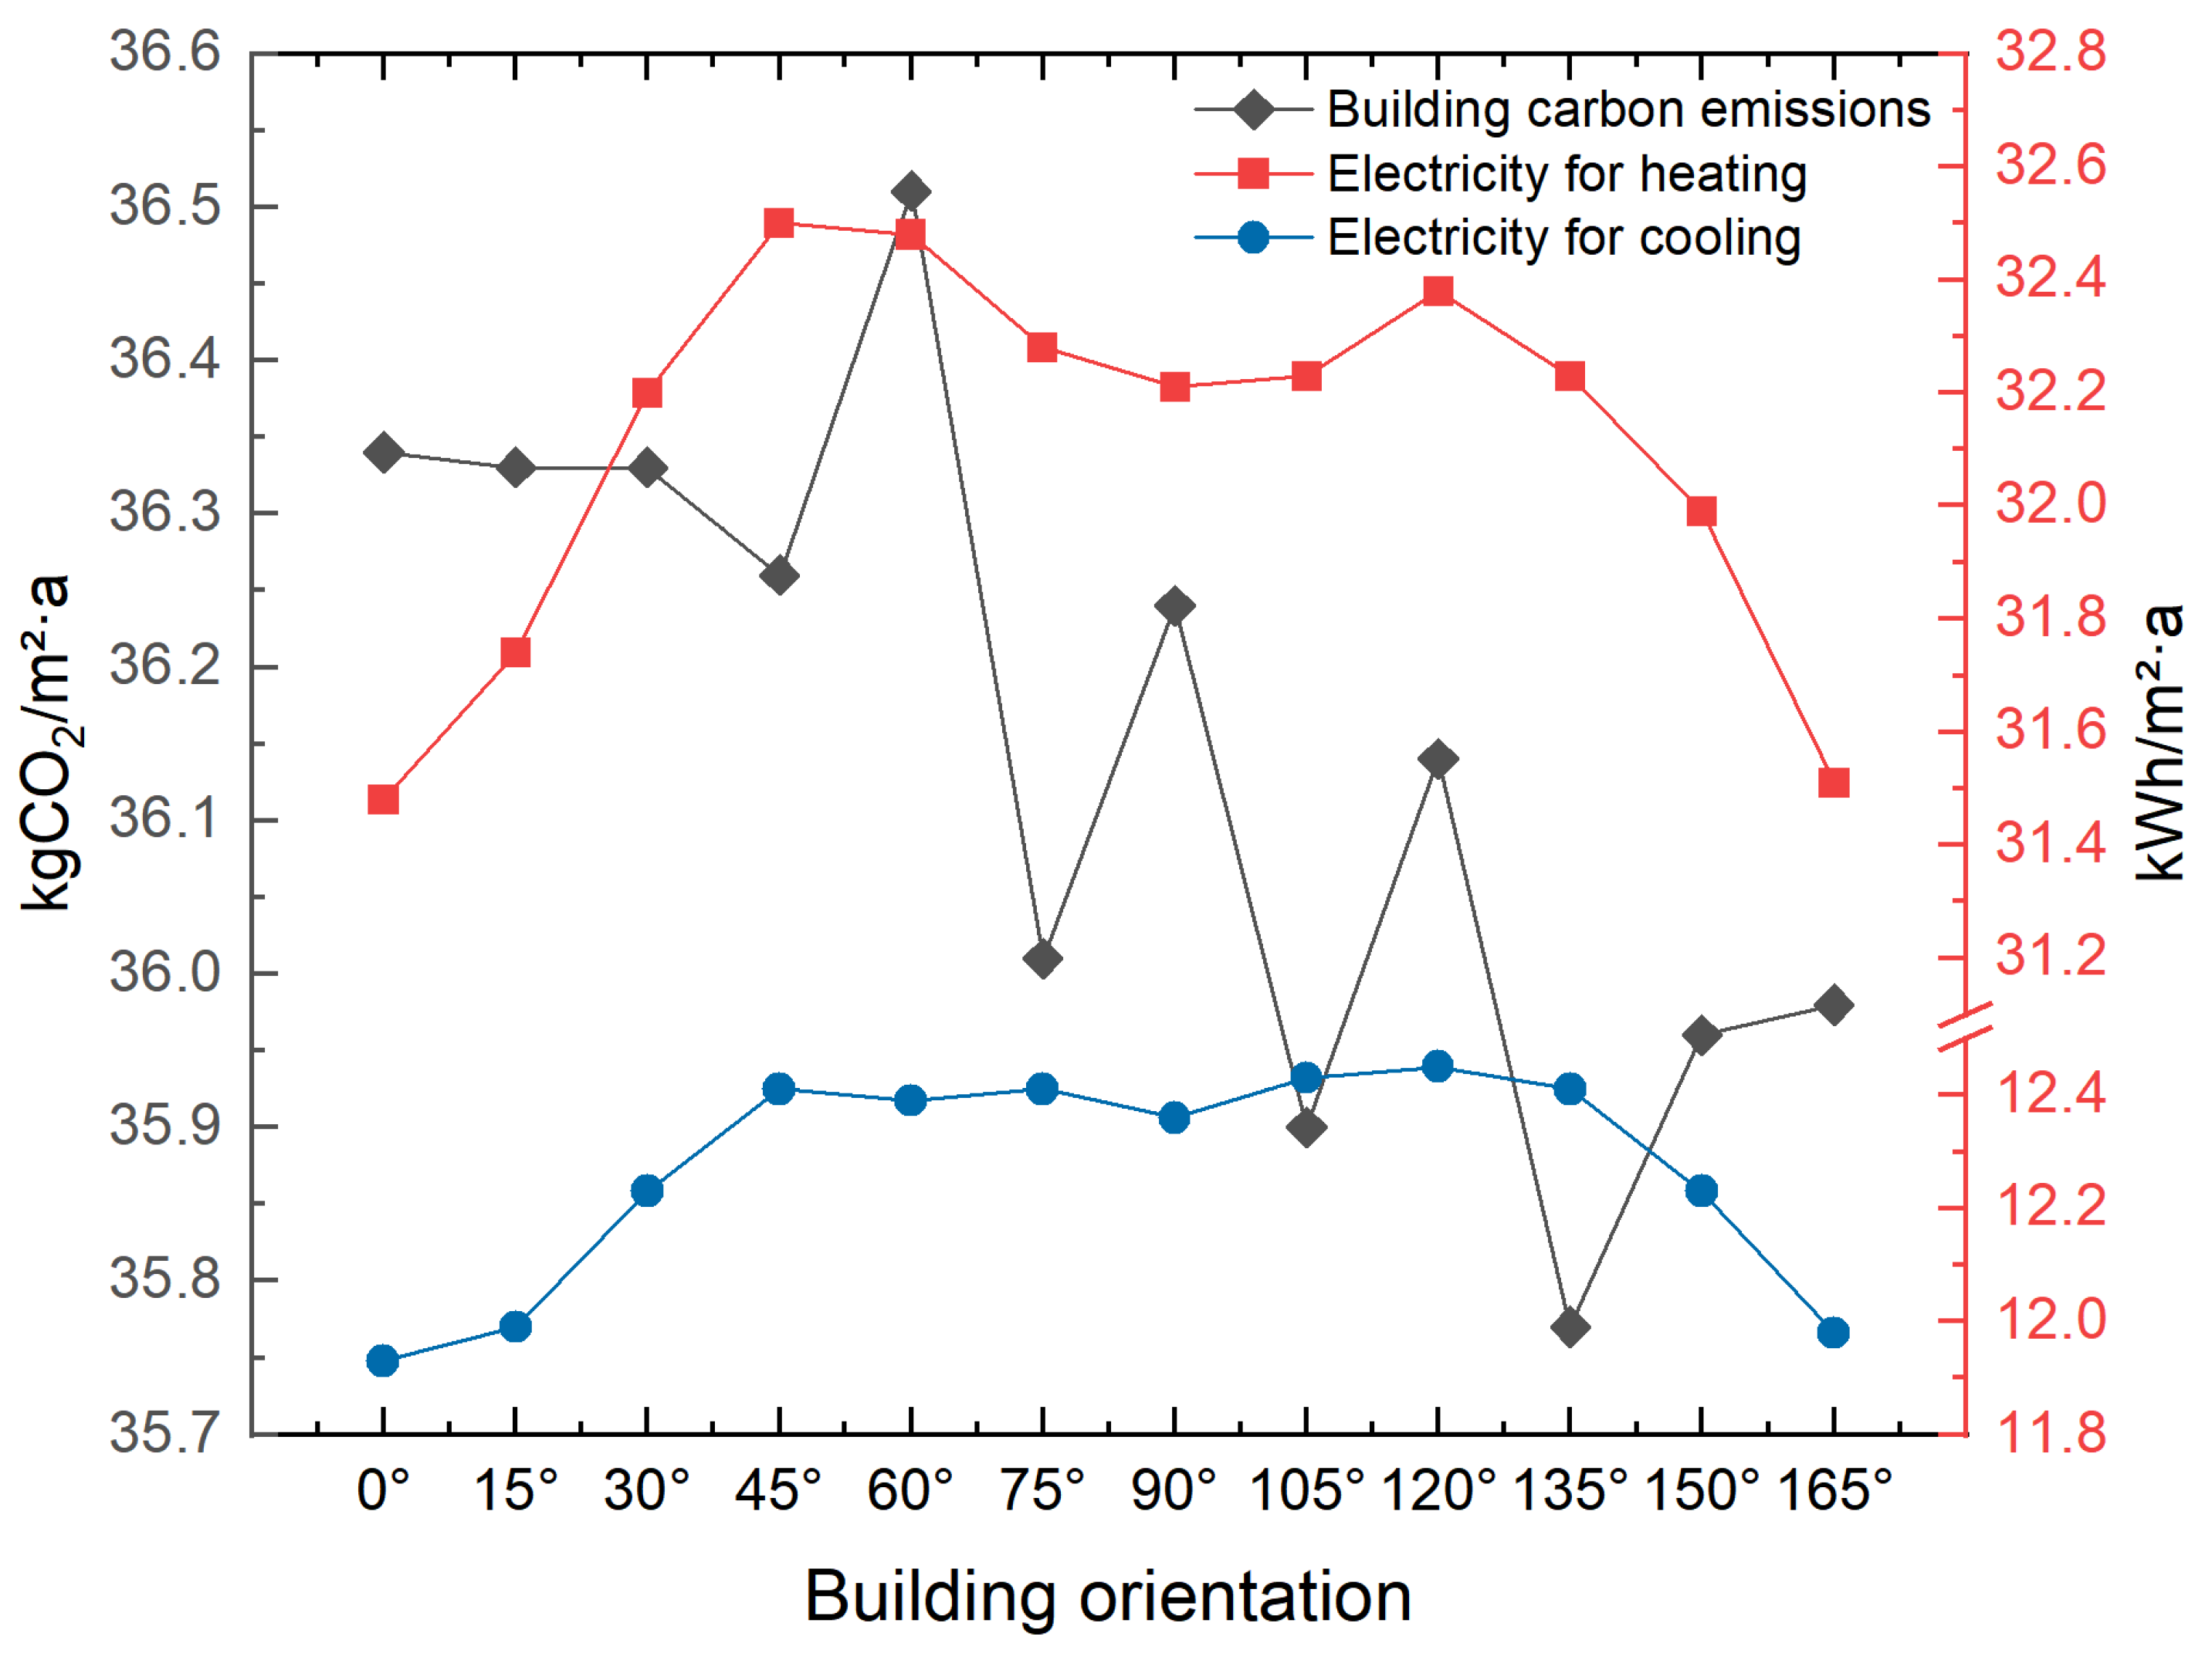
31]. This study further found that building energy consumption exhibits periodic fluctuations with orientation, with southeast orientation (approximately 135°) resulting in the lowest carbon emissions.
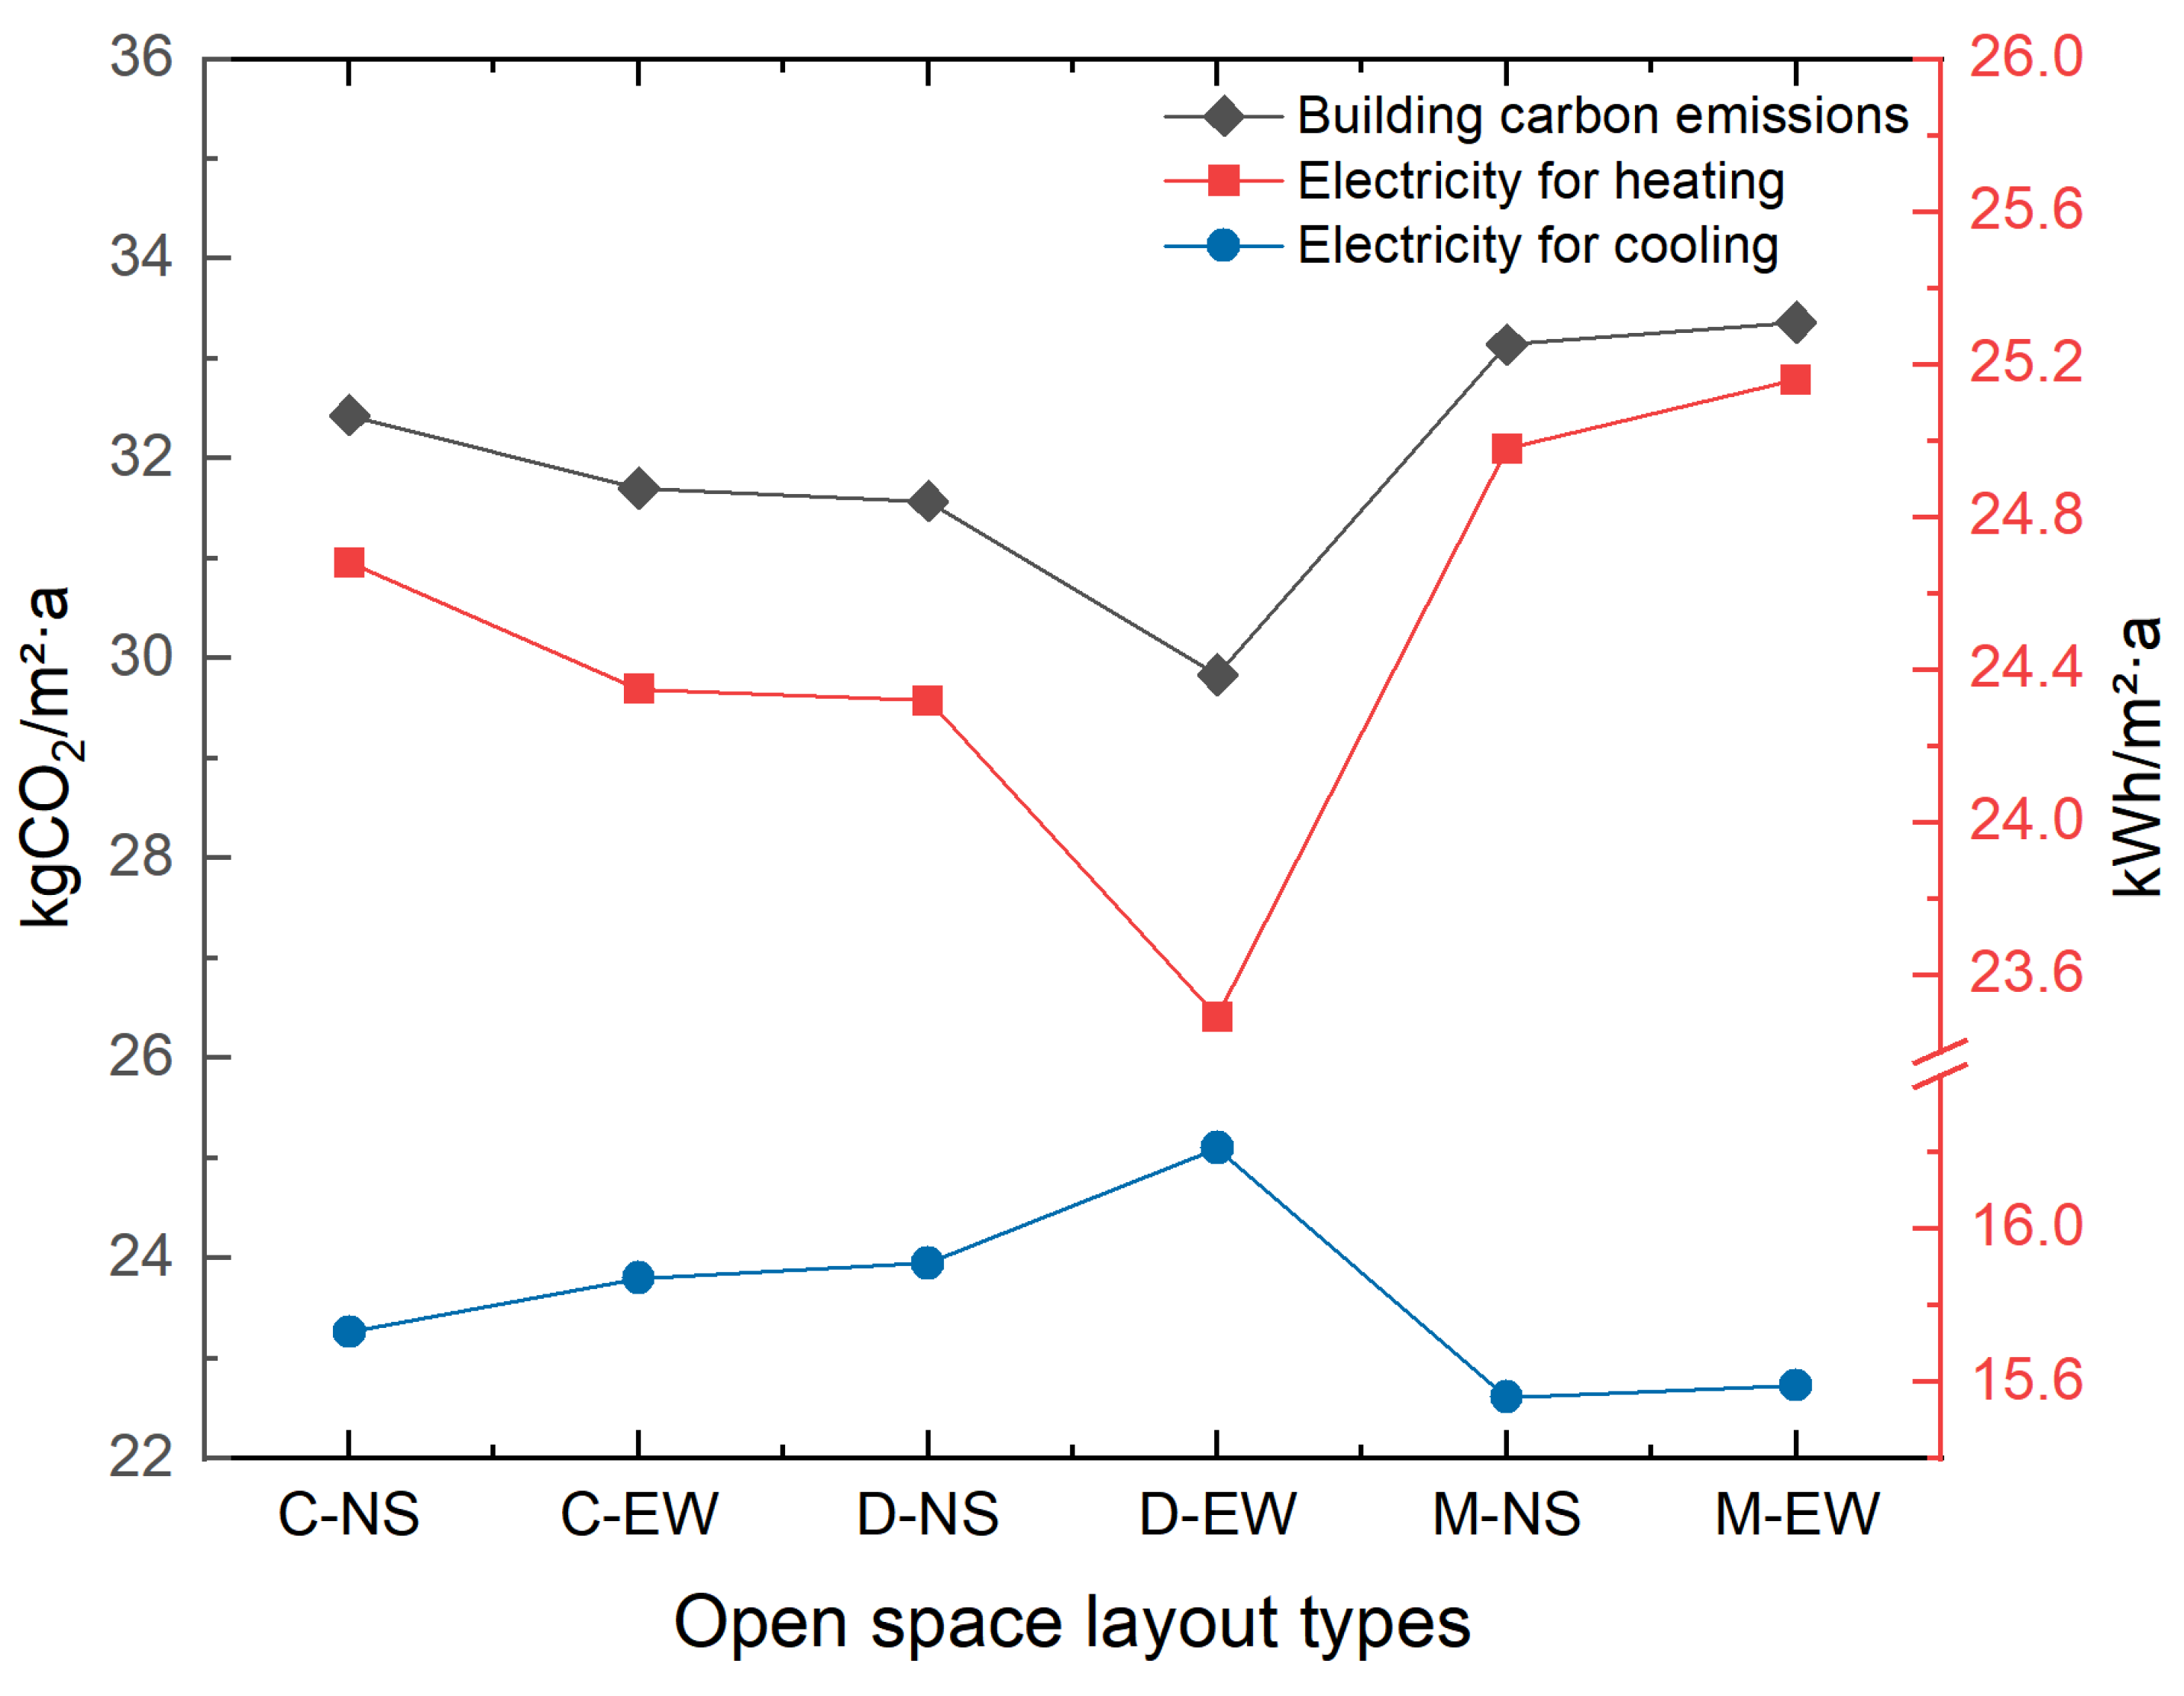
A notable trade-off emerges in decentralized east–west-oriented open spaces, where cooling energy consumption and carbon emissions exhibit a clear inverse relationship. Although this layout has the highest cooling energy consumption, it significantly reduces heating energy consumption through enhanced natural ventilation; the reduction in heating energy consumption exceeds the increase in cooling energy consumption, resulting in the lowest total annual energy consumption and the smallest carbon emissions. Based on an analysis of the “form–radiation–energy consumption” mechanism, we propose the following specific design guidelines: Regarding building spacing, east–west spacing should avoid the 1.8H peak range, while north–south spacing should not be excessive, as increasing it will continuously raise cooling energy consumption; regarding staggered spacing, east–west staggered layouts should be prioritized to reduce building cooling energy consumption, and north–south staggered layouts should be avoided; Regarding building orientation, a southeast orientation (approximately 135°) should be prioritized to minimize carbon emissions; regarding open space patterns, when carbon reduction is the primary objective, the D-EW layout should be prioritized; if fluctuations in cooling energy consumption also need to be considered, north–south dispersed or centralized layouts may be considered. By regulating solar heat gain and utilization efficiency, the above strategies offer valuable insights for optimizing the layout of high-density residential areas in Wuhan and other regions with hot summers and cold winters.
4.3. Limitations and Future Prospects
This study employs standardized parameters and idealized models to examine the influence of individual urban form parameters under controlled conditions. To this end, it uses a simplified block form to represent cubic buildings, focusing on core geometric variables such as length, width, and height, while simplifying real-world driving factors such as vegetation dynamics, paving materials, facade construction, land-use patterns, and natural ventilation behavior. While this approach enhances internal validity and comparability, it inevitably excludes site-specific factors such as topography, surrounding buildings, and non-standard forms, making it difficult for the model to capture the nonlinear responses resulting from the coupling of multiple factors in real communities. Therefore, the quantitative results of this study should be regarded as indicative trends, and their applicability should be limited to regions with climatic conditions similar to those simulated; they should not be directly extrapolated to areas with significantly different climates.
In terms of analytical methods, linear models are primarily used for exploratory analysis, aiming to identify the main effects and basic trends of key variables. Consequently, the interpretation of simulation results in this paper focuses on identifying trends in parameter responses rather than rigorous statistical inference. Future research could incorporate comparative analyses across more climate zones and introduce actual energy consumption monitoring data to calibrate simulation results, thereby enhancing the generalizability and accuracy of the research conclusions.