Article

Stable Thermal Regime in an Alkaline Water Electrolyser System


by
Eduardo Martínez-Zárate
1,
Alejandro Wintergerst-Felipe
1,
Irvin Daniel Rivas-Yreta
1,
Israel Trujillo-Olivares
2,
Rosa de Guadalupe González-Huerta
2,
Luis Armando Flores-Herrera
1,
Juan Manuel Sandoval-Pineda
1,* and
Raúl Rivera-Blas
1,*
1
Instituto Politécnico Nacional, Escuela Superior de Ingeniería Mecánica y Eléctrica, Unidad Azcapotzalco, Mexico City 02250, Mexico
2
Instituto Politécnico Nacional, Escuela Superior de Ingeniería Química e Industrias Extractivas, Laboratorio de Electroquímica, Unidad Profesional Adolfo López Mateos, Edificio 7, Mexico City 07738, Mexico
*
Authors to whom correspondence should be addressed.
Energies 2026, 19(8), 1894; https://doi.org/10.3390/en19081894
Submission received: 27 February 2026 / Revised: 3 April 2026 / Accepted: 8 April 2026 / Published: 14 April 2026
(This article belongs to the Section A5: Hydrogen Energy)

Abstract

Experimental alkaline water electrolysis (AWE) systems require precise thermal management to achieve stable electrochemical efficiency. Manual operation of laboratory-scale electrolysers often induces thermal fluctuations that lead to excessive overpotentials. In this work, a real-time data acquisition (DAQ) and automated temperature-control architecture were implemented in a 3 kW nominal alkaline electrolyser in order to observe the thermal stability regime. The system was evaluated using a stepped-current protocol derived from FCTESTNET standards. Current densities of 0.3 and 0.5 A·cm−2 were investigated, corresponding to operating currents of approximately 22.5 A and 40 A, respectively. Variations in manually controlled conditions raised temperature values to near 100 °C. With the implemented control system, two distinct thermal regimes were observed. At 0.3 A·cm−2, cyclic behaviour between 60 and 80 °C was recorded due to on–off cooling dynamics. At 0.5 A·cm−2, the system reached a stable thermal regime between 70 and 75 °C, maintaining steady-state fluctuations within ±1 °C after transient stabilisation. It was observed that the electronically controlled thermal system reduced temperature-induced overpotentials and improved voltage stability during long-duration tests. The results demonstrate that integrating automated thermal control enhances operational safety and enables reproducible electrolyser evaluation under controlled laboratory conditions.

1. Introduction

Alkaline water electrolysis (AWE) is one of the most established technologies for hydrogen production and remains economically competitive compared with alternative electrolysis technologies, particularly at medium and large scales [1,2,3]. In emerging hydrogen markets such as Mexico, the development of domestic electrolyser infrastructure is considered strategically relevant given the country’s renewable energy potential and growing interest in green hydrogen deployment [4]. Although current hydrogen production costs remain influenced by capital investment and operational electricity prices [5,6,7], continued technological refinement and system optimisations are expected to reduce overall costs and improve competitiveness. In this context, improving operational efficiency and stability at the system level is critical for both research and future industrial deployment [8]. Among the operational variables influencing AWE performance, temperature is an important physical parameter for determining electrolyte conductivity and activation overpotentials [9,10,11]. Proper thermal management enhances electrochemical efficiency by reducing activation losses, whereas uncontrolled temperature variations can induce voltage instability and accelerate electrode degradation. Consequently, thermal regulation is not only a matter of efficiency but also of operational safety and durability [12]. Recent studies have highlighted that temperature and current density are central operational variables governing electrochemical kinetics and hydrogen production rates in water electrolysis technologies [13,14]. These parameters strongly influence system efficiency, Faradaic performance and long-term durability, emphasising the need for careful thermal management to avoid performance degradation and material stress under practical operating conditions [15,16].
The dynamic behaviour of alkaline electrolysers has been widely investigated through modelling and simulation studies [17], where temperature is consistently identified as a key state variable. Advanced control strategies, including model predictive control and data-driven approaches, have been proposed to regulate system operation under variable loads [18,19,20,21]. These studies demonstrate that optimised thermal control can significantly enhance performance and mitigate operational stress. Much of the reported work focuses on simulation-based validation or industrial-scale implementations, while fewer studies describe the experimental integration of real-time data acquisition [22,23]. Dynamic modelling approaches have shown that alkaline electrolysers exhibit complex thermal behaviour due to the coupling between electrochemical reactions and heat transport processes, which can lead to delayed thermal responses, temperature overshoot and voltage oscillations under fluctuating operating conditions [24,25,26]. In experimental environments, manual operation frequently leads to uncontrolled thermal oscillations that compromise reproducibility during polarisation testing and long-duration performance evaluation. As described in established thermal models of alkaline electrolysers [27], heat generation is inherently coupled to current density and voltage behaviour, requiring appropriate regulation to avoid temperature-induced inefficiencies. Furthermore, several studies have demonstrated that appropriate thermal control strategies, including predictive and feed-forward control approaches, can significantly reduce temperature overshoot and improve the stability and efficiency of alkaline electrolysis systems operating under dynamic load conditions [28].
Even though it might sound ambiguous, the absence of automated monitoring and control in laboratory platforms limits the reliability and repeatability of electrochemical characterisation. Recent analyses of hydrogen production systems also emphasise that advanced monitoring, control and integration strategies are necessary to ensure reliable operation and system stability when electrolysers are deployed in dynamic energy systems or coupled with renewable power sources [28]. To address these limitations, the present study proposes the development and experimental validation of a real-time data acquisition (DAQ) and ON–OFF temperature-control architecture implemented on a 3 kW nominal alkaline electrolyser stack. The system was evaluated using a stepped-current protocol derived from FCTESTNET standards [29], enabling a controlled assessment of thermal response and voltage stability under both uncontrolled and regulated conditions.
The main contribution of this research is establishing a thermal stability regime, substantially improving voltage stability during long-duration tests [30], and enhancing operational safety. This approach facilitates a reproducible and standardised evaluation of the electrolyser in a controlled laboratory environment, overcoming internal inefficiencies and limitations of manual operation [31]. This work demonstrates that integrating thermal control into AWE test benches enhances operational stability by reducing temperature-induced overpotentials.

2. Materials and Methods

2.1. System Development

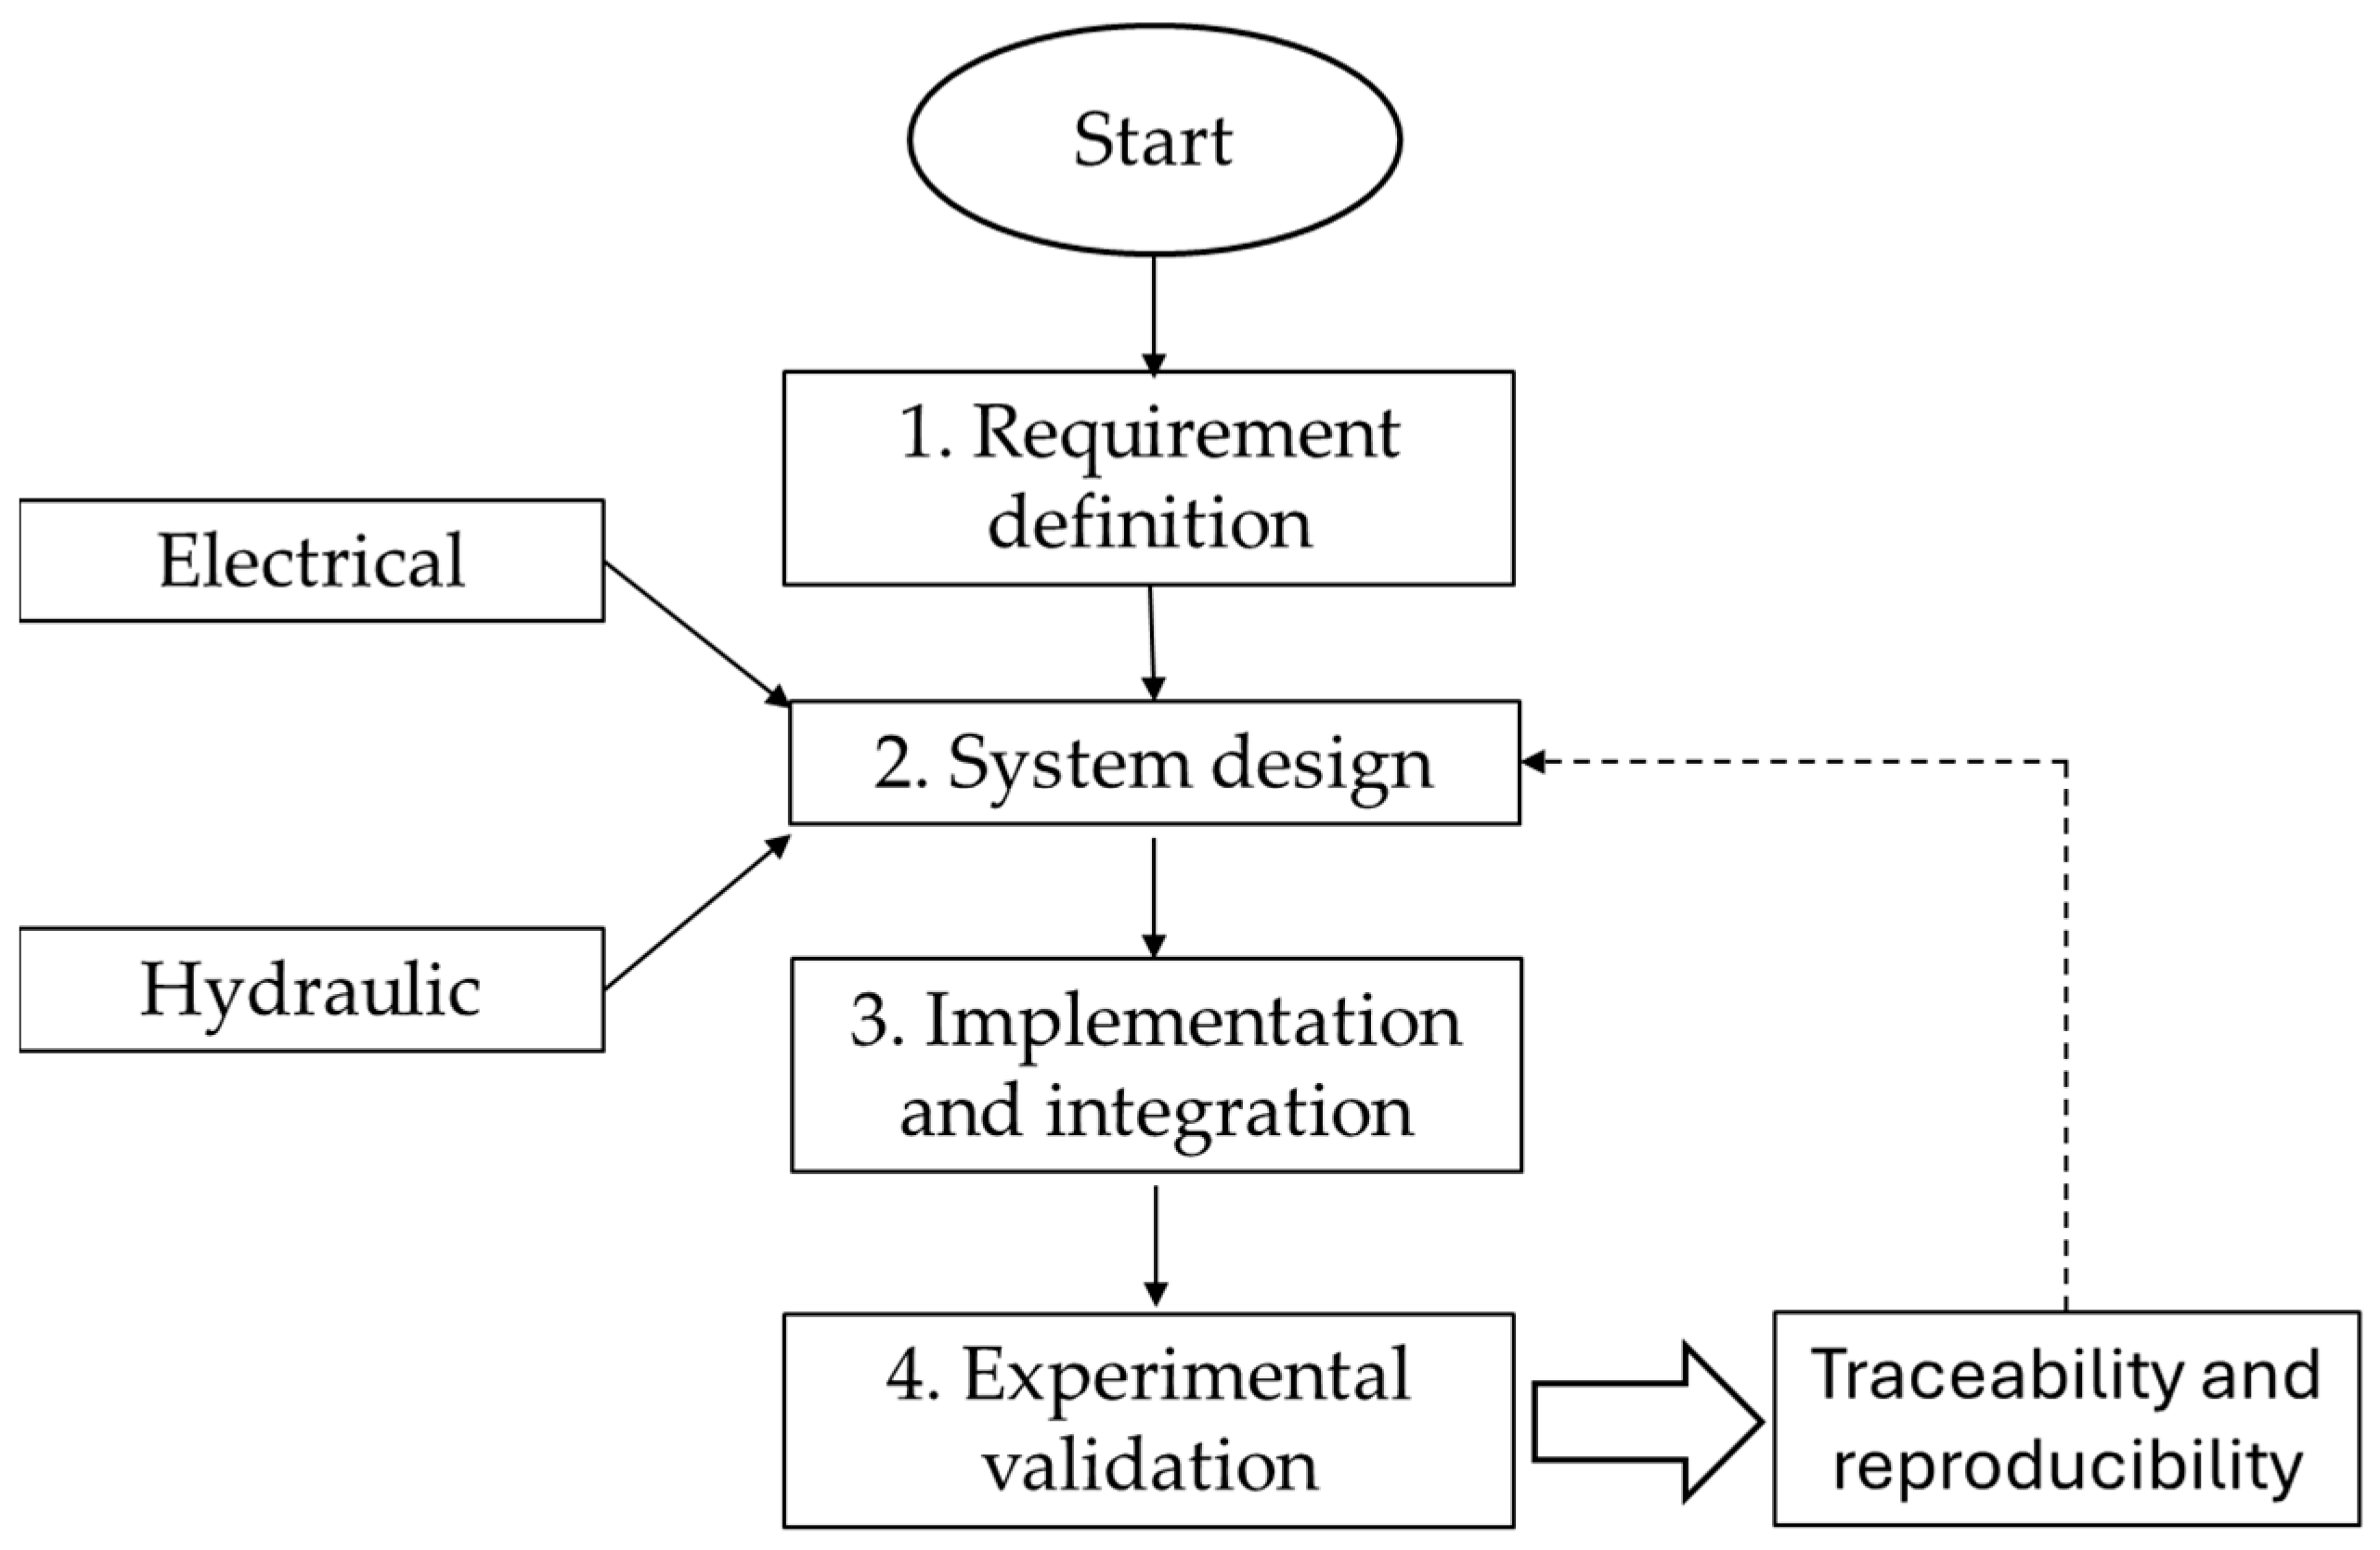
A structured development workflow based on a waterfall approach was adopted to ensure systematic implementation of the data acquisition (DAQ) and thermal control architecture. The objective was to maintain coherence between system design, hardware integration, and experimental validation, avoiding empirical modifications during testing. The development process comprised four sequential stages, illustrated in Figure 1:
  • Requirement definition: Identification of critical operating variables, including stack current, total voltage, electrolyte temperature, and gas flow rate. Safe operating limits were established to prevent overheating during extended tests.
  • System design: Definition of the DAQ architecture, sensor selection, hardware configuration, and ON/OFF thermal control logic. Electrical and hydraulic interconnections were specified.
  • Implementation and integration: Physical installation of sensors, configuration of acquisition modules, programming of the ON/OFF control algorithm, and integration of electrical and mechanical subsystems.
  • Experimental validation: Execution of stepped-current tests to evaluate thermal response and voltage stability under both uncontrolled and regulated operating conditions.
This structured methodology ensured traceability and reproducibility throughout system development and experimental evaluation. If traceability and reproducibility tests identify flaws or suggest improvements, the process should revert to the design stage to optimize parameters before re-implementation (dotted line).

2.2. Alkaline Electrolyser Stack and Test Bench Configuration

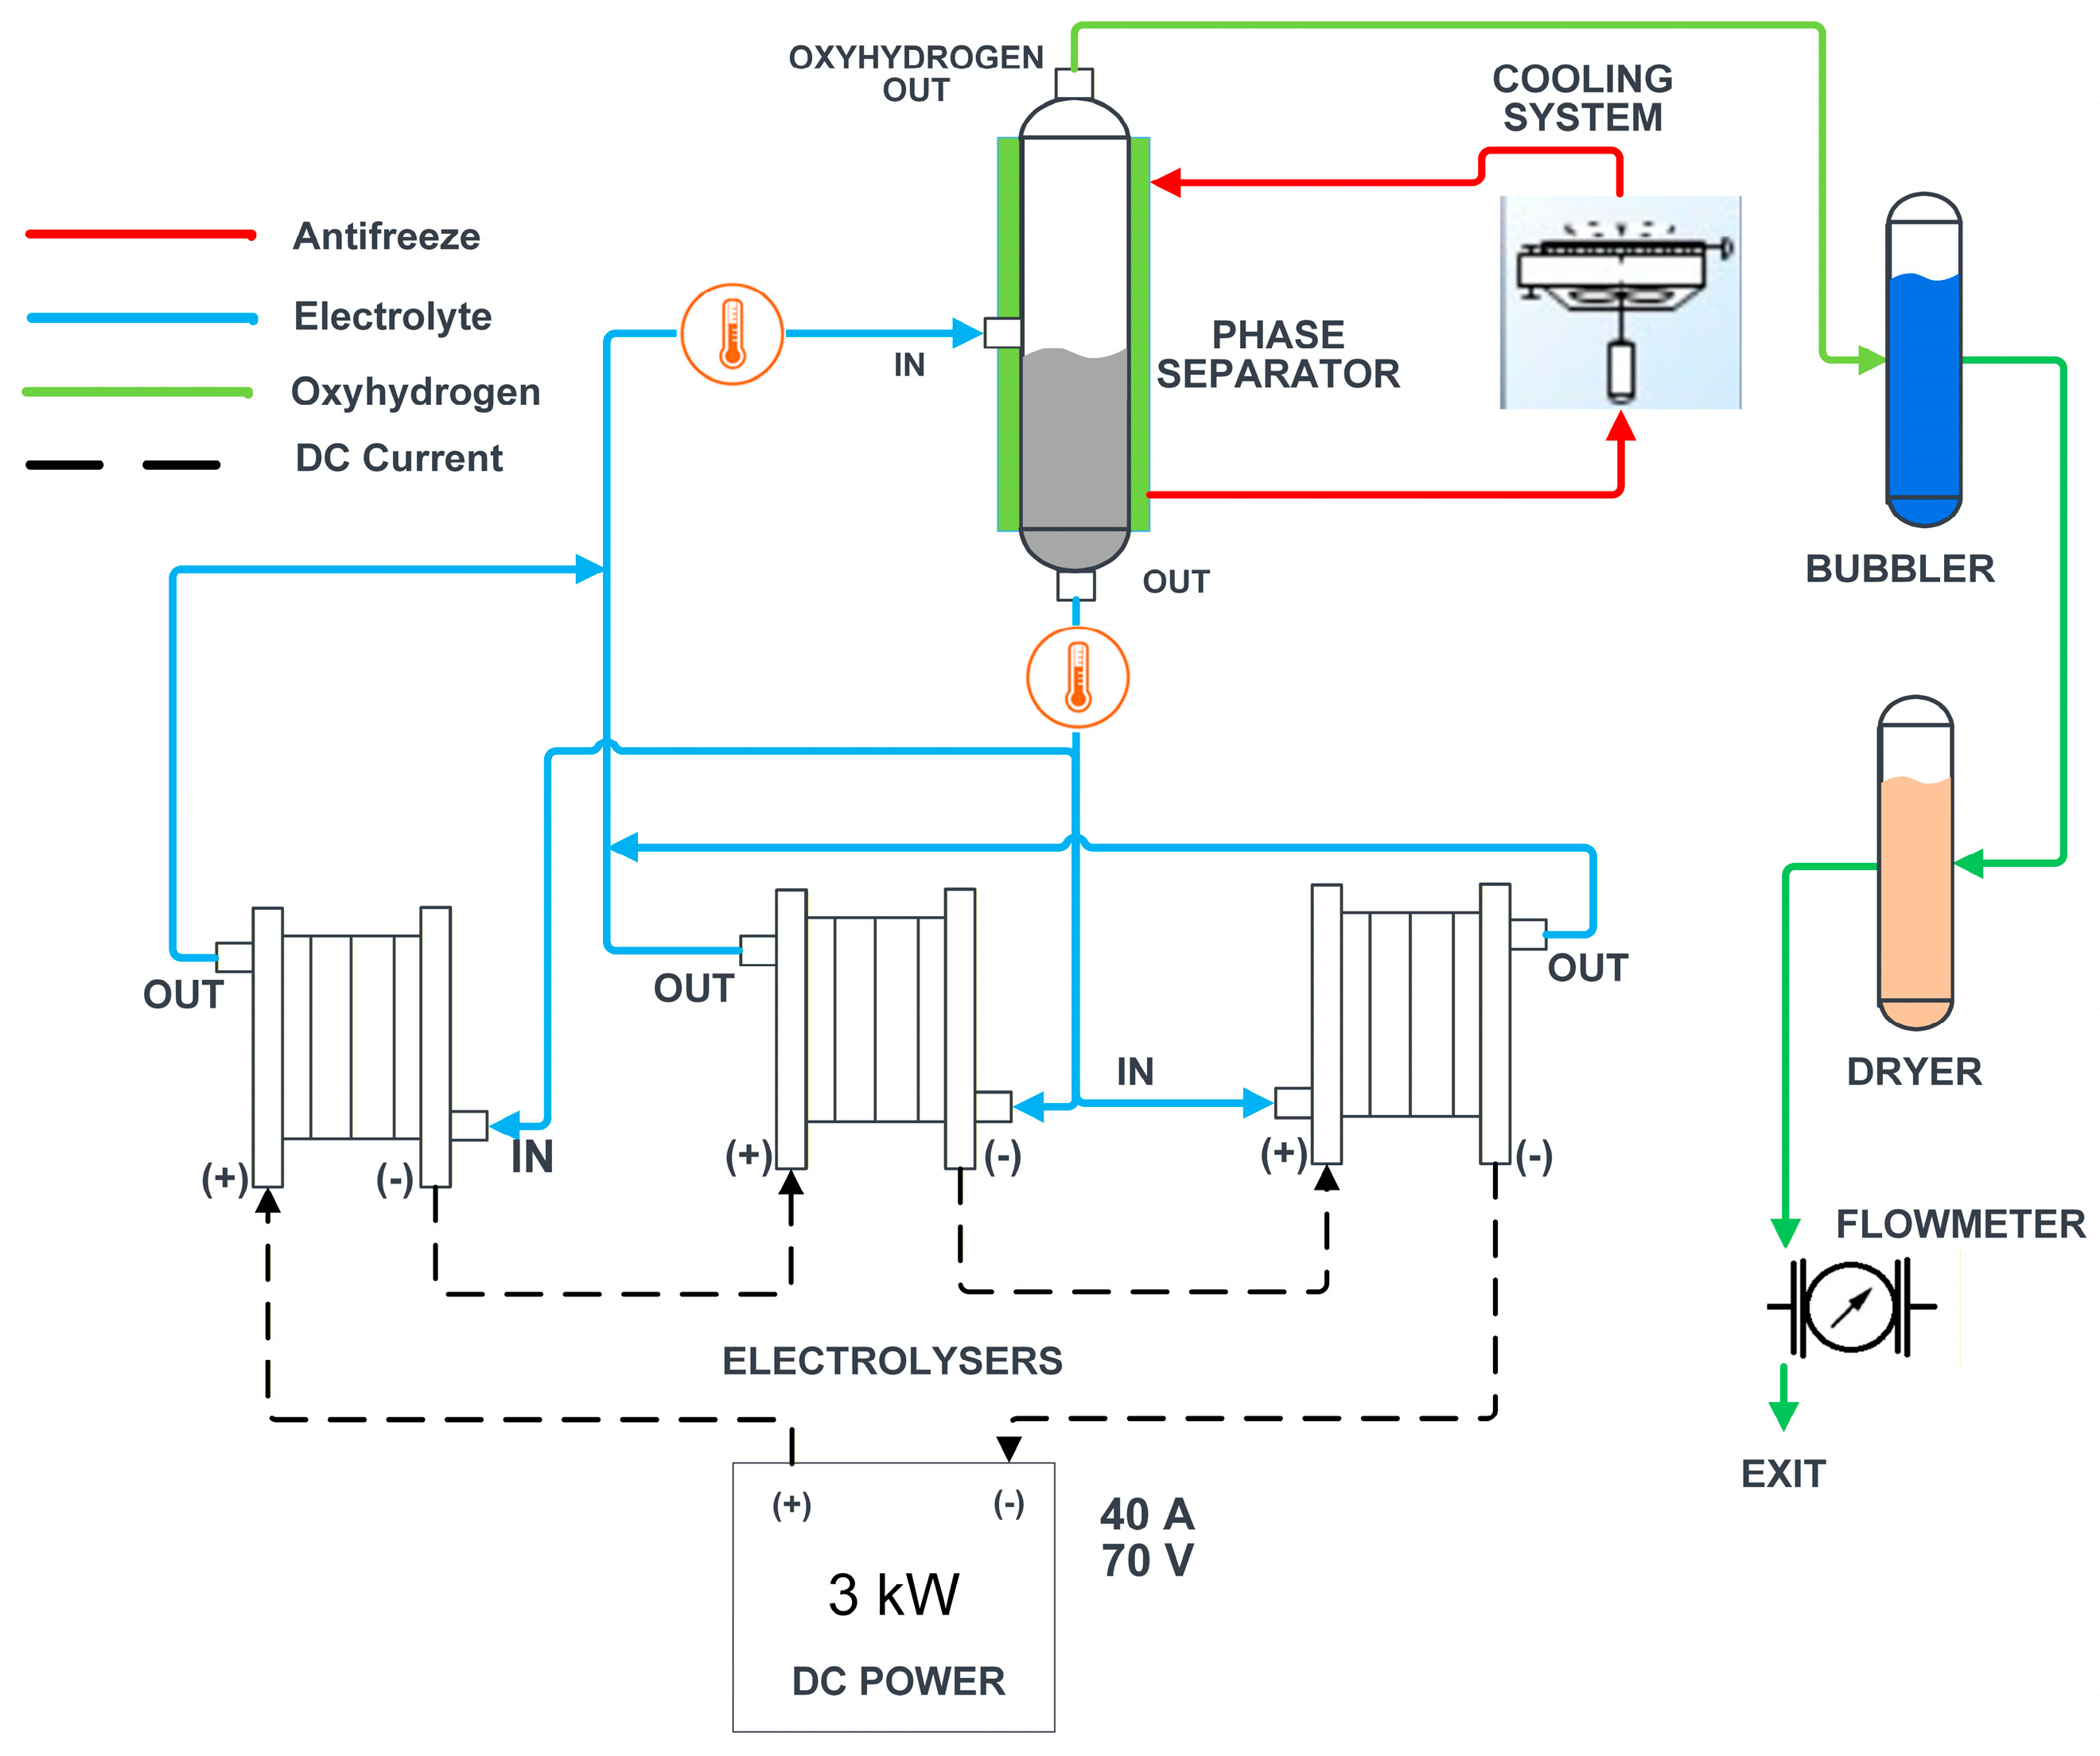
The alkaline electrolyser system was integrated into a laboratory-scale test bench designed to enable controlled electrical supply, electrolyte circulation, thermal regulation, and real-time monitoring. As illustrated in Figure 2, the system consisted of three electrolyser modules electrically connected in series to reach the nominal stack voltage ( ~ 70   V ). Each electrolyser module consisted of 12 individual cells, for a total of 36 cells electrically connected in series. However, from a hydraulic standpoint, the electrolyte circulation was configured in parallel. Each electrolyser module was independently connected to a common phase separator, allowing uniform electrolyte distribution and avoiding serial hydraulic dependency between modules.
  • Power Supply: A regulated DC power source supplied the series-connected electrolyser modules. Current and voltage were continuously monitored to determine electrical input power and specific energy consumption.
  • Electrolyte Circulation and Phase Separation: The electrolyte was circulated from the phase separator to each electrolyser module through parallel branches. The gas–liquid mixture produced in each module returned independently to the separator, where gravitational phase separation occurred. This parallel hydraulic configuration ensured uniform electrolyte feeding conditions across modules and prevented the propagation of temperature or pressure gradients between units. Electrolyte inlet and outlet temperatures were measured to monitor thermal behaviour and detect potential overheating.
  • Cooling System: Thermal regulation was achieved using an external cooling circuit circulating a 50   v o l % ethylene glycol/water mixture (antifreeze) through a thermal jacket surrounding the phase separator. No direct cooling was applied at the individual-cell level; instead, temperature regulation was achieved indirectly via heat exchange at the phase separator. Since all electrolyte streams converged in the separator, indirect thermal control of the entire system was accomplished by regulating the separator temperature. The coolant was circulated by a magnetic drive pump (model MP-20RM) with a nominal flow rate of 17   L · m i n 1 . The heat removal capacity was estimated at approximately 2.0   k W under nominal operating conditions, based on the coolant flow rate and a typical temperature difference of 2   ° C across the thermal jacket. The cooling circuit was regulated by a 1 / 2 i n c h ( 12.7   m m ) electrically actuated on/off valve with a response time of approximately 2 s. These cooling system parameters remained constant across all operating regimes. Consequently, the observed differences in temperature oscillation amplitude are attributed to the interplay between heat generation—determined by the operating current and the corresponding voltage response—and the fixed heat dissipation capacity of the cooling system.
  • Purification Gas System: The generated oxyhydrogen exited from the top of the phase separator and was directed to a conditioning line. First, the gas passed through a bubbler that acted as a droplet trap, retaining entrained K O H electrolyte microdroplets. Subsequently, the effluent gas was dehydrated using a drying unit packed with AMBERLITE IR120 hydrogen form ion-exchange resin (DuPont, Wilmington, DE, USA) to remove residual moisture and ionic impurities, ensuring that only dry gas reaches the flow meter. The gas reaches ambient temperature before entering the flow meter, so the drying procedure does not affect the volumetric flow measurement. The standard volumetric flow rate was measured using a mass flow meter (Alicat Scientific, Tucson, AZ, USA) with a full-scale range of 20 SLPM and an accuracy of ± 1.0 % of reading.
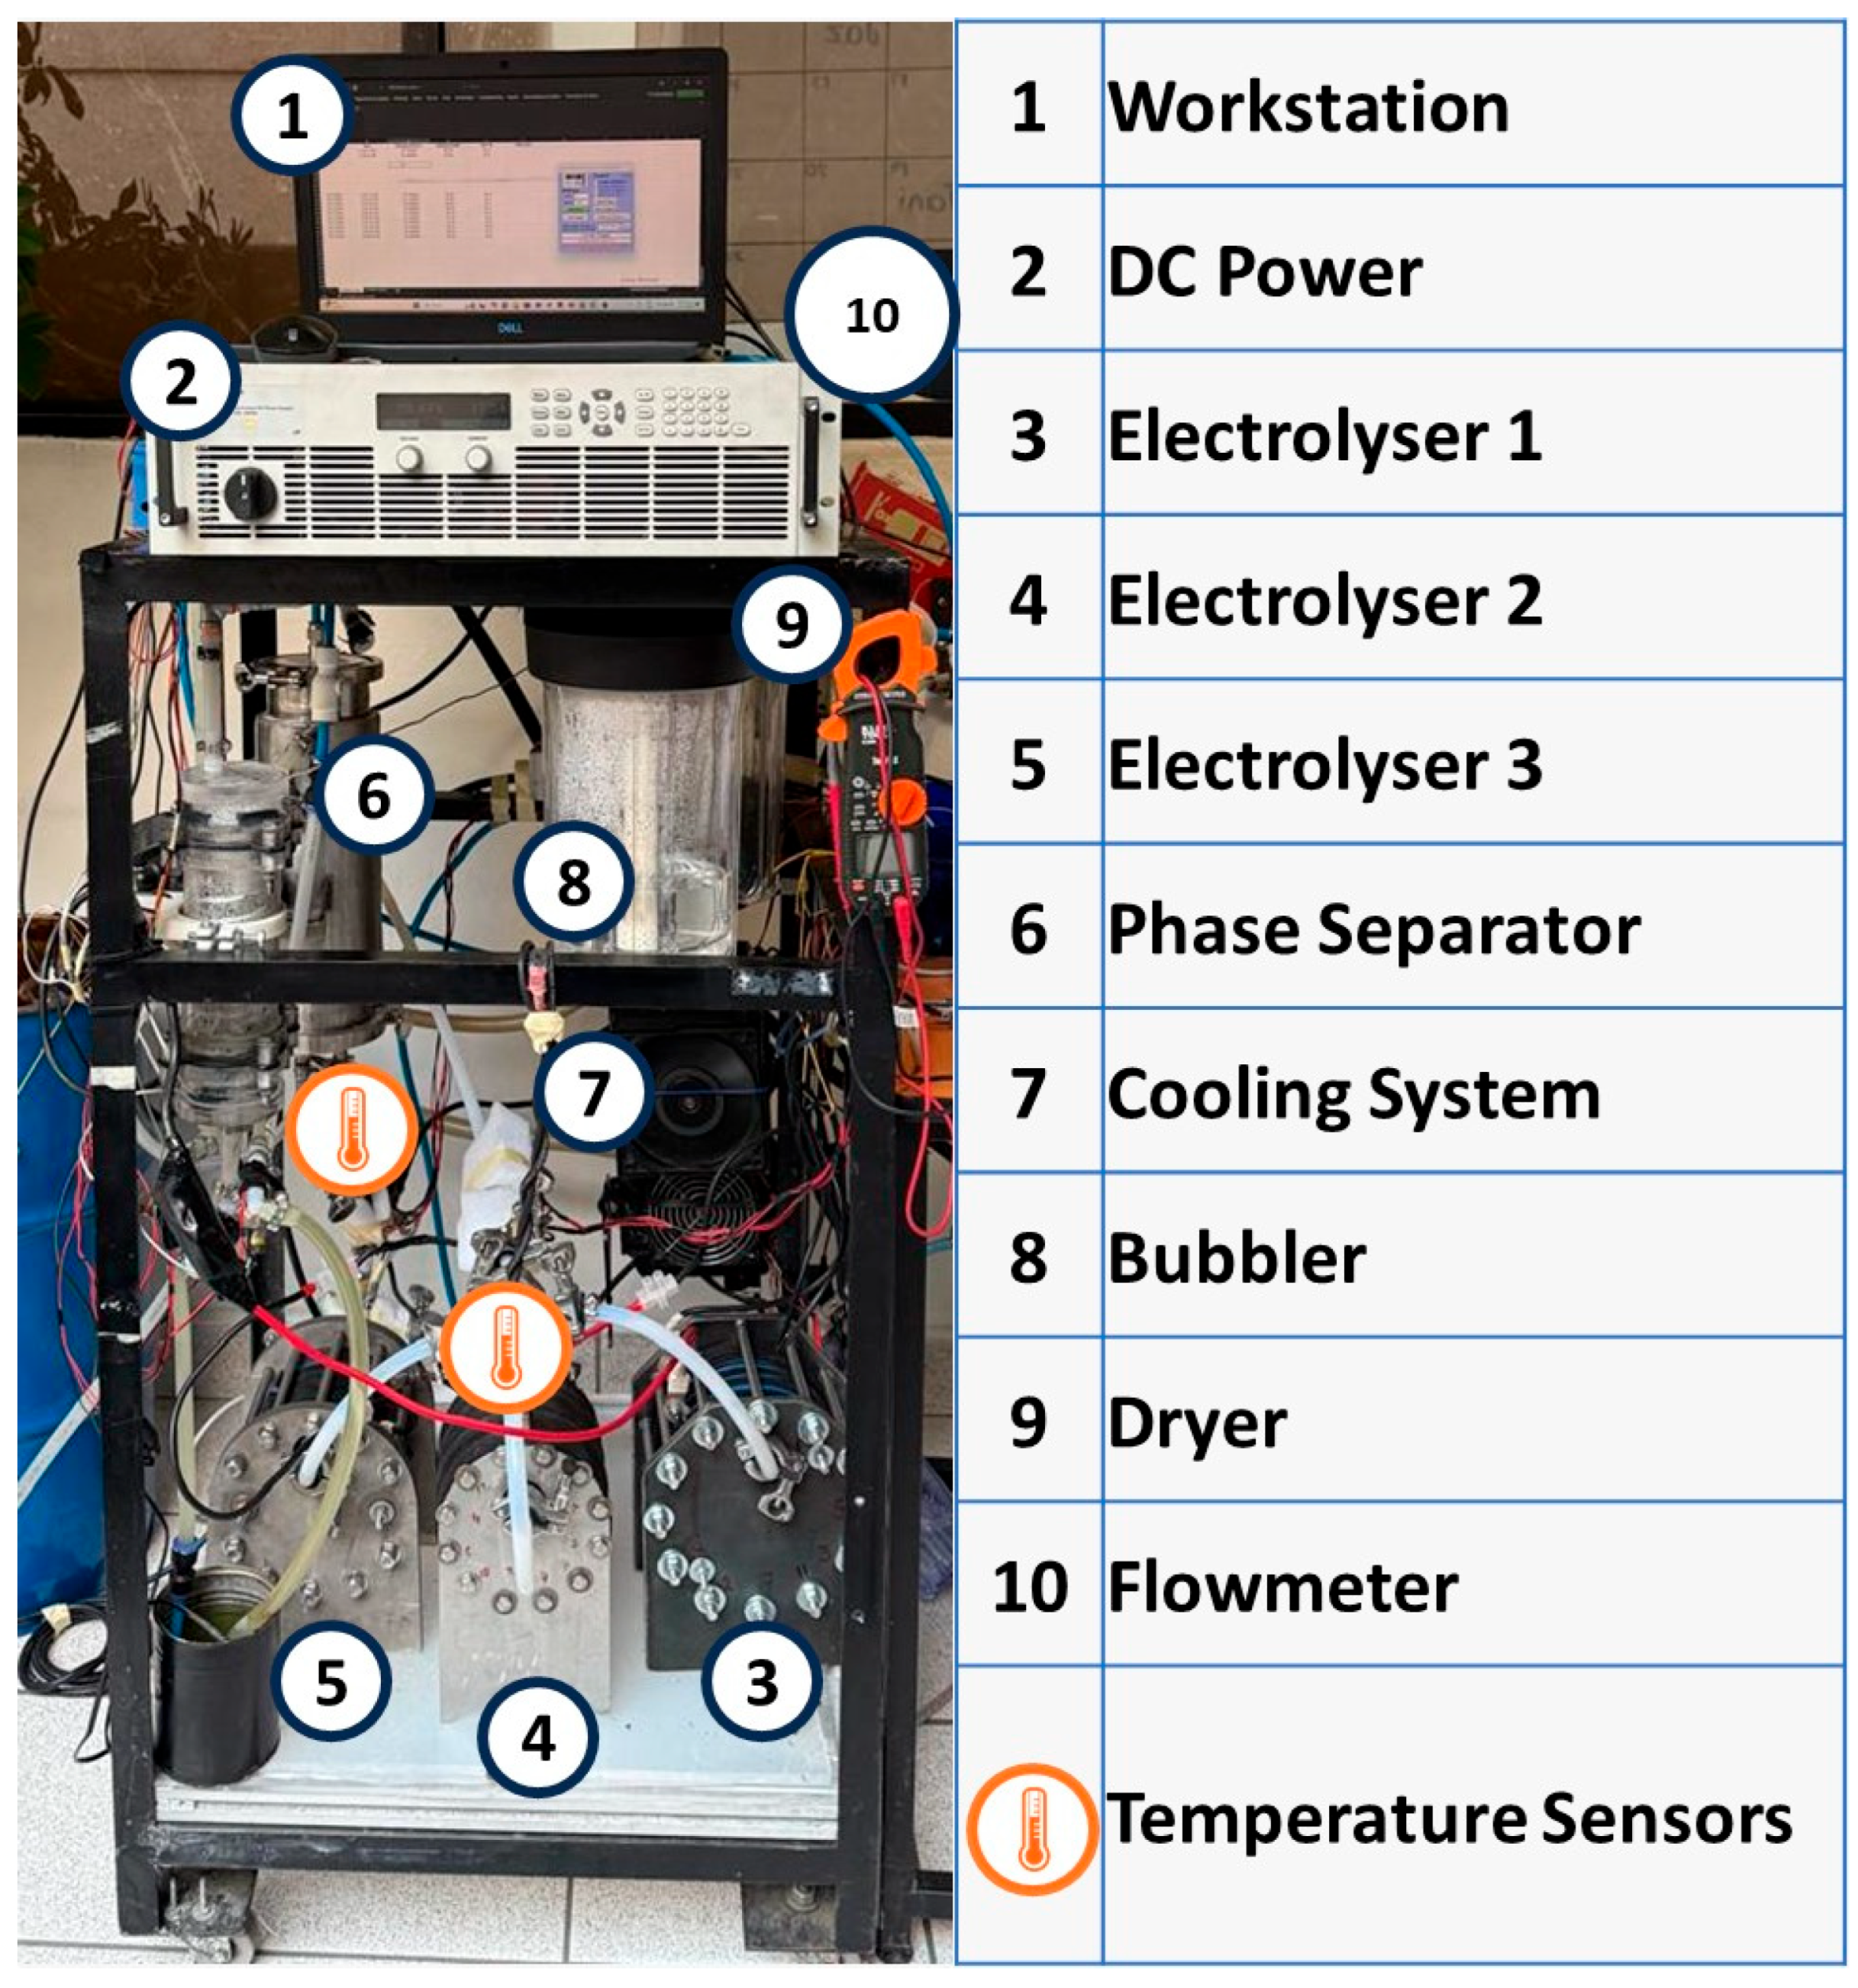
In addition to the schematic representation, a labelled photograph of the experimental setup is provided in Figure 3, while the main technical specifications of the test bench are summarised in Table 1.

2.3. Electrochemical Framework and Performance Metrics

Alkaline water electrolysis proceeds through the following reactions:
Cathode   ( reduction ) :   4 H 2 O   +   4   e     2 H 2 + 4 O H
Anode   ( oxidation ) :   4 O H O 2 +   2 H 2 O + 4 e
Overall   reaction :   2 H 2 O ( l )   2 H 2 ( g ) + O 2 ( g )
The operating cell voltage can be expressed as:
V Cell = E r e v + η a + η c + iR
where E r e v is the reversible potential, η a and η c are anodic and cathodic overpotentials, respectively, and i R represents ohmic losses associated with electrolyte resistance and electrical connections.
Temperature directly influences these terms. Moderate increases in temperature reduce activation overpotentials and improve electrolyte conductivity, whereas uncontrolled thermal excursions may induce excessive ohmic losses, voltage instability, and accelerated degradation. Consequently, thermal regulation is essential for maintaining electrochemical stability.

2.4. Faradaic Efficiency

Faradaic efficiency ( η F ) is defined as:
η F = n ˙ H 2 , r e a l n ˙ H 2 , t h e o r e t i c a l
where theoretical hydrogen production is calculated using Faraday’s law:
n ˙ H 2 , t h e o r e t i c a l = I n F
With n = 2 electrons per mole of hydrogen and F the Faraday constant.

2.5. Energy Efficiency

Since gas production was measured as standard volumetric flow (SLPM), energy performance was evaluated on a volumetric basis to ensure consistency with the experimental measurements [32]. The specific energy consumption was defined as:
E s p e c = V c e l l I V ˙ H 2
where V ˙ H 2 is the standard volumetric hydrogen production rate expressed in N m 3 h 1 .
Energy efficiency was then calculated using the volumetric higher heating value (HHV) of hydrogen:
η e n e r g y = H H V v o l E s p e c
where H H V v o l represents the higher heating value of hydrogen expressed in k W h N m 3 ; at normal conditions, H H V v o l 3.54   k W h N m 3 . During steady-state operation at 40   A and 70   V , the measured total oxyhydrogen production was 6 SLPM. Considering the stoichiometric volumetric ratio of 2:1 ( H 2 : O 2 ), the corresponding hydrogen production rate was 4 SLPM, equivalent to 240   L h 1 ( 0.240   N m 3 h 1 ). Under these conditions, the electrical energy supplied per hour was 2.8   k W h , resulting in:
The electrical power input is calculated as:
P = V I = 70 × 40 = 2800   W = 2.8   kW
Considering the hydrogen production rate of 0.240   N m 3 h 1 , the specific energy consumption is obtained as:
E s p e c = 2.8   k W 0.240   N m 3 h 1 = 11.67   k W h N m 3
This value is reported as a baseline reference for repeatable benchmarking under controlled thermal conditions [33]. The present work focuses on operational stability and thermal regulation rather than stack efficiency optimisation.
Aqueous KOH solutions are commonly used as electrolytes in alkaline water electrolysis because they have higher ionic conductivity than aqueous NaOH solutions. The conductivity of the electrolyte strongly depends on both temperature and concentration, reaching a maximum at approximately 30   w t %   K O H . This property directly influences ohmic losses within the electrolyte (iR term in Equation (4)) and therefore affects heat generation and the thermal behaviour of the system. Consequently, the selection of electrolyte composition is a key parameter in determining overall electrochemical performance and thermal stability. Moreover, temperature variations further modulate electrolyte conductivity and activation overpotentials, meaning that even small thermal fluctuations can translate into measurable changes in cell voltage and specific energy consumption [34].

2.6. Safety Considerations for Oxyhydrogen Handling

The production of oxyhydrogen ( H 2 / O 2 mixture) involves inherent safety risks due to its wide flammability range, low ignition energy, and high flame propagation velocity. In this work, the generated gas is not stored but continuously discharged, which reduces the risk of accumulation within the system. The electrolyser operates at atmospheric pressure with minimal gas holdup, and all experiments were conducted in a well-ventilated environment to ensure safe gas dispersion. The system configuration minimises gas residence time and avoids confinement of the reactive mixture.
Thermal safety was also a critical aspect during operation. Under conditions without active cooling, the electrolyte temperature increased progressively, approaching 100 °C. At this point, the experiments were intentionally terminated to prevent excessive thermal stress on system components and to avoid unstable operating conditions associated with high-temperature regimes. The implementation of an ON/OFF cooling strategy allowed operation within a controlled temperature range, significantly reducing thermal fluctuations and associated risks. These measures ensured safe operation during all experimental tests while maintaining reliable and reproducible system performance [35].

2.7. Data Acquisition Architecture and Instrumentation

The DAQ system was designed to enable continuous real-time monitoring of critical operating variables, including:
(a)
Stack current.
(b)
Total stack voltage.
(c)
Electrolyte temperature (inlet and outlet).
(d)
Standard volumetric gas flow rate.
Temperature was measured using thermocouples installed at strategic locations within the electrolyte circulation loop to capture thermal gradients. Electrical measurements were obtained using acquisition modules compatible with the stack’s operating voltage and current ranges. Signals were digitised and processed in real time using a programmable acquisition platform. The sampling frequency was selected to capture the system’s thermal dynamics while avoiding unnecessary data redundancy. The implemented architecture enabled automatic data logging, ensuring traceability, repeatability, and post-processing analysis of all experimental runs.

2.8. Thermal Control Strategy

An ON/OFF thermal control strategy was implemented to regulate electrolyte temperature via an external cooling system. The controller activated the cooling mechanism when the measured temperature exceeded a predefined threshold and deactivated it once the temperature returned to the desired operating range. At a current density of 0.3   A · c m 2 , cyclic thermal behaviour between 60   ° C and 80   ° C was observed due to intermittent activation of the cooling system. At 0.5   A · c m 2 , the stack reached a more stable thermal regime between 70   ° C and 75   ° C following the initial transient period. Under steady-state controlled operation, temperature fluctuations were maintained within ± 1   ° C . The controlled thermal environment reduced temperature-induced overpotentials and improved voltage stability during long-duration operation, contributing to reproducible electrochemical characterisation. The selected current densities ( 0.3 and 0.55   A · c m 2 ) are within the typical operating ranges reported for laboratory-scale alkaline electrolysers (0.2–0.6 A · c m 2 ), where a proper balance is maintained between efficiency, thermal stability, and durability [36,37,38]. 0.3   A · c m 2 corresponds to a stable regime with moderate thermal loads, while 0.5   A · c m 2 represents a more demanding condition, close to operational limits where thermal effects are more significant. Although the evaluated range is limited, it allows validation of the performance of the data acquisition and thermal control system under representative conditions.

2.9. Experimental Protocol

Testing was conducted using a stepped current profile derived from FCTESTNET standards. The procedure included:
(a)
Initial warm-up phase.
(b)
Progressive stepped current application.
(c)
Constant-current operation.
(d)
Temporary increase to peak current ( 60   A ).
(e)
Controlled current reduction.
Two operating scenarios were evaluated:
(a)
Operation without thermal control, and.
(b)
Operation with automated thermal regulation.
Without control, electrolyte temperature reached ~ 100   ° C in less than one hour, requiring test termination for safety reasons. With the implemented controller, stable and continuous operation was achieved within predefined thermal limits.

3. Results

3.1. Validation of the DAQ Architecture

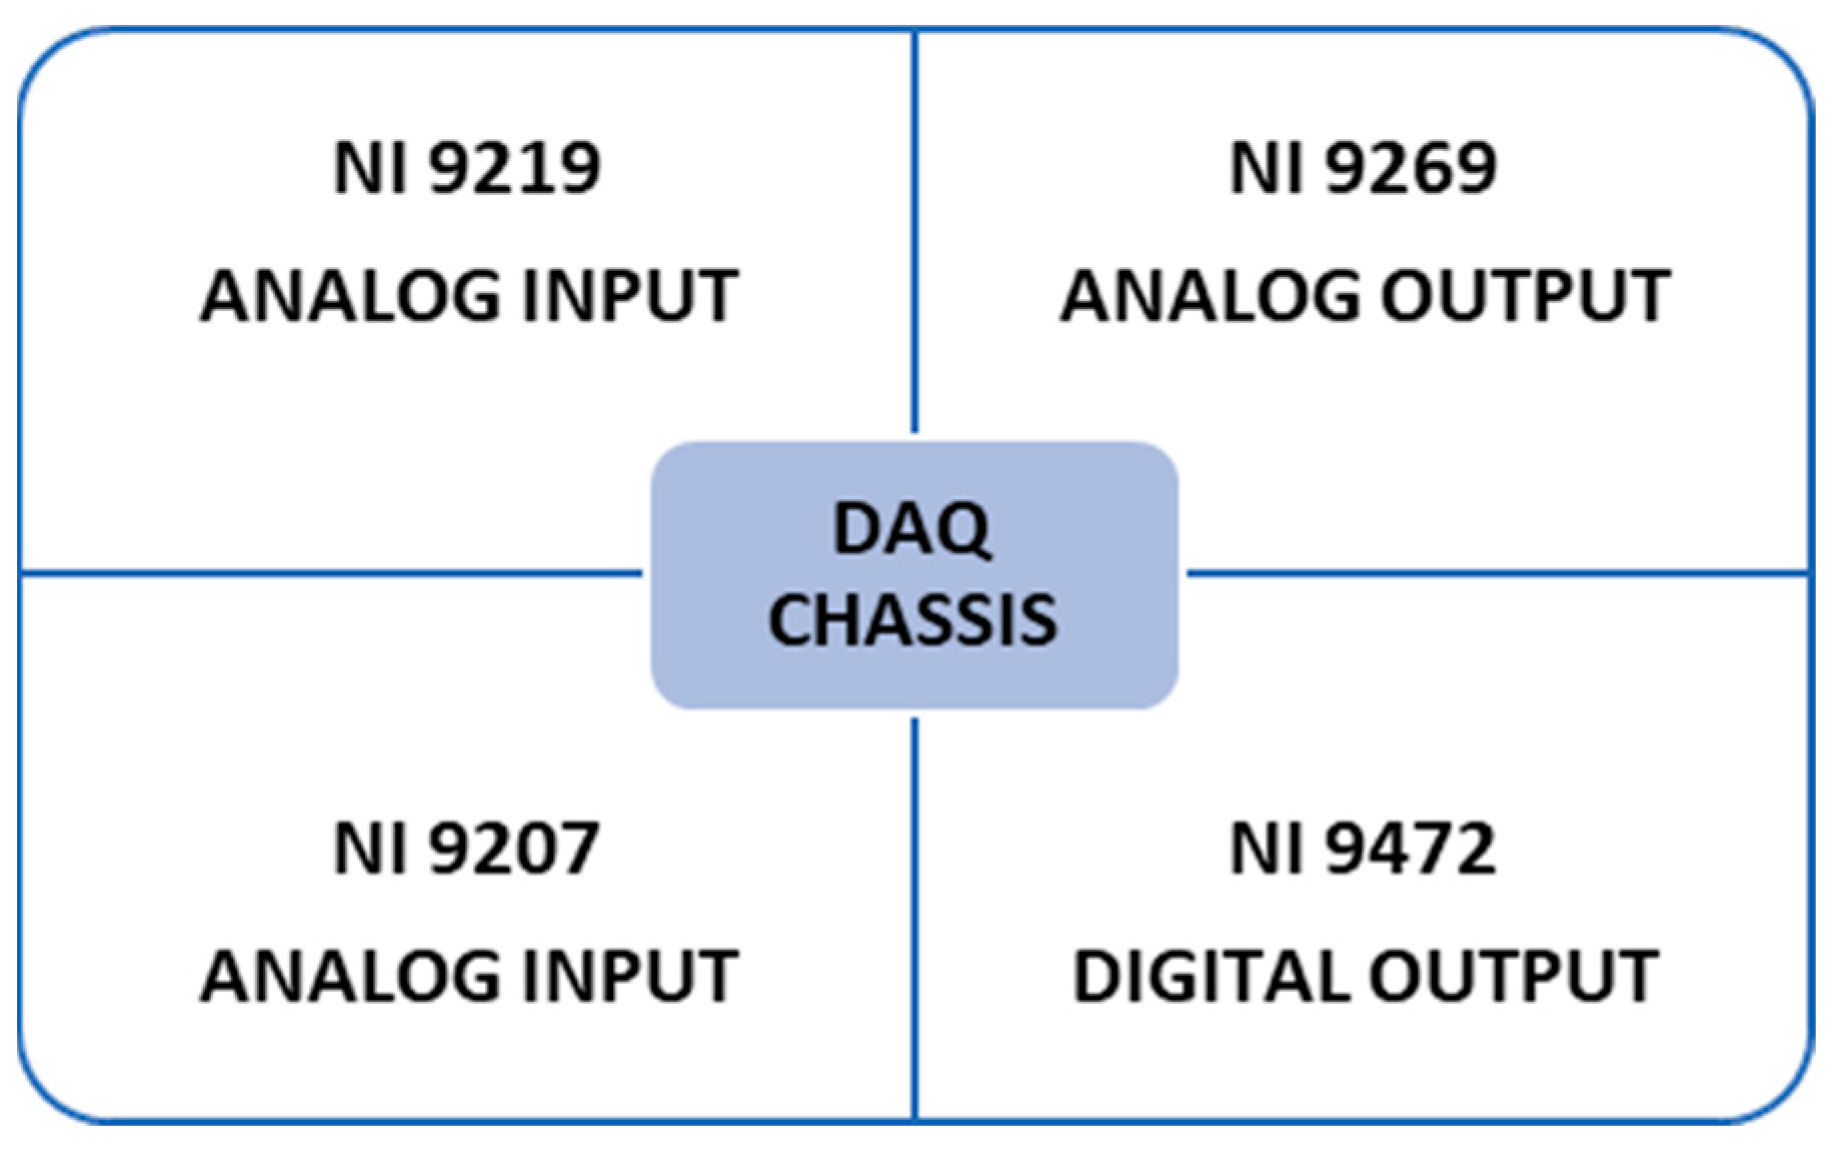
The test bench was developed for the operation and characterisation of alkaline electrolysers in the nominal range of 3   k W . The data acquisition (DAQ) system was implemented in Python, selected for its portability and open-source licencing. Communication with the acquisition hardware was performed using the NI-DAQmx library, enabling management of the NI 9178 CompactDAQ chassis (National Instruments, Austin, TX, USA), which provided the necessary synchronisation and timing for the simultaneous monitoring of thermal and electrical parameters, as depicted in Figure 4.
The system integrated specialised modules:
  • Analog input modules (NI 9219 and NI 9207) for acquiring temperature (thermocouples), voltage, pressure, and conductivity signals.
  • Output modules (NI 9472 DO and NI 9269 AO) for digital and analogue control of actuators, including the antifreeze circulation motor and control valves.
To ensure the reliability and traceability of the thermal data, a high-precision measurement chain was implemented by using the TSM201 temperature sensor with high-precision platinum resistance thermometer Pt1000 (ifm electronic, Essen, Germany) Class A calibrated according to the DIN EN 60751 [39]. These sensors were installed at critical points of the system: the electrolyser inlet (T1) and the phase separator inlet (T2). The resistance signals from the Pt1000 sensors were converted into analogue current signals (4–20 m A ) using TP3231 temperature transmitters (ifm electronic, Essen, Germany), which guarantee high immunity to environmental electromagnetic noise. Finally, the analog signal acquisition was performed using an NI 9207 analog input module (National Instruments, Austin, TX, USA) with 24-bit resolution. This instrumentation set ensures a measurement uncertainty of less than in the electrolyser’s operating range, allowing for an accurate assessment of the reported stable and transient thermal regimes. Thermocouples were calibrated using a comparative method; readings were taken at different points against a Fluke 5627A Precision Industrial Platinum Resistance Thermometer (Fluke Calibration, Everett, WA, USA) over the range [20–90 ° C ], and a correction curve was generated. A mass flow meter MS-20SLPM-D from the Alicat M-Series was employed; it is designed for dry, clean gases. This device has an accuracy of ± 0.8 %   o f   t h e   r e a d i n g + 0.2 %   o f   t h e   s c a l e   b a c k g r o u n d and was calibrated by the manufacturer with NIST traceability for hydrogen and oxygen, using the laminar differential pressure principle, which allows for precise measurements even with variations in line pressure.
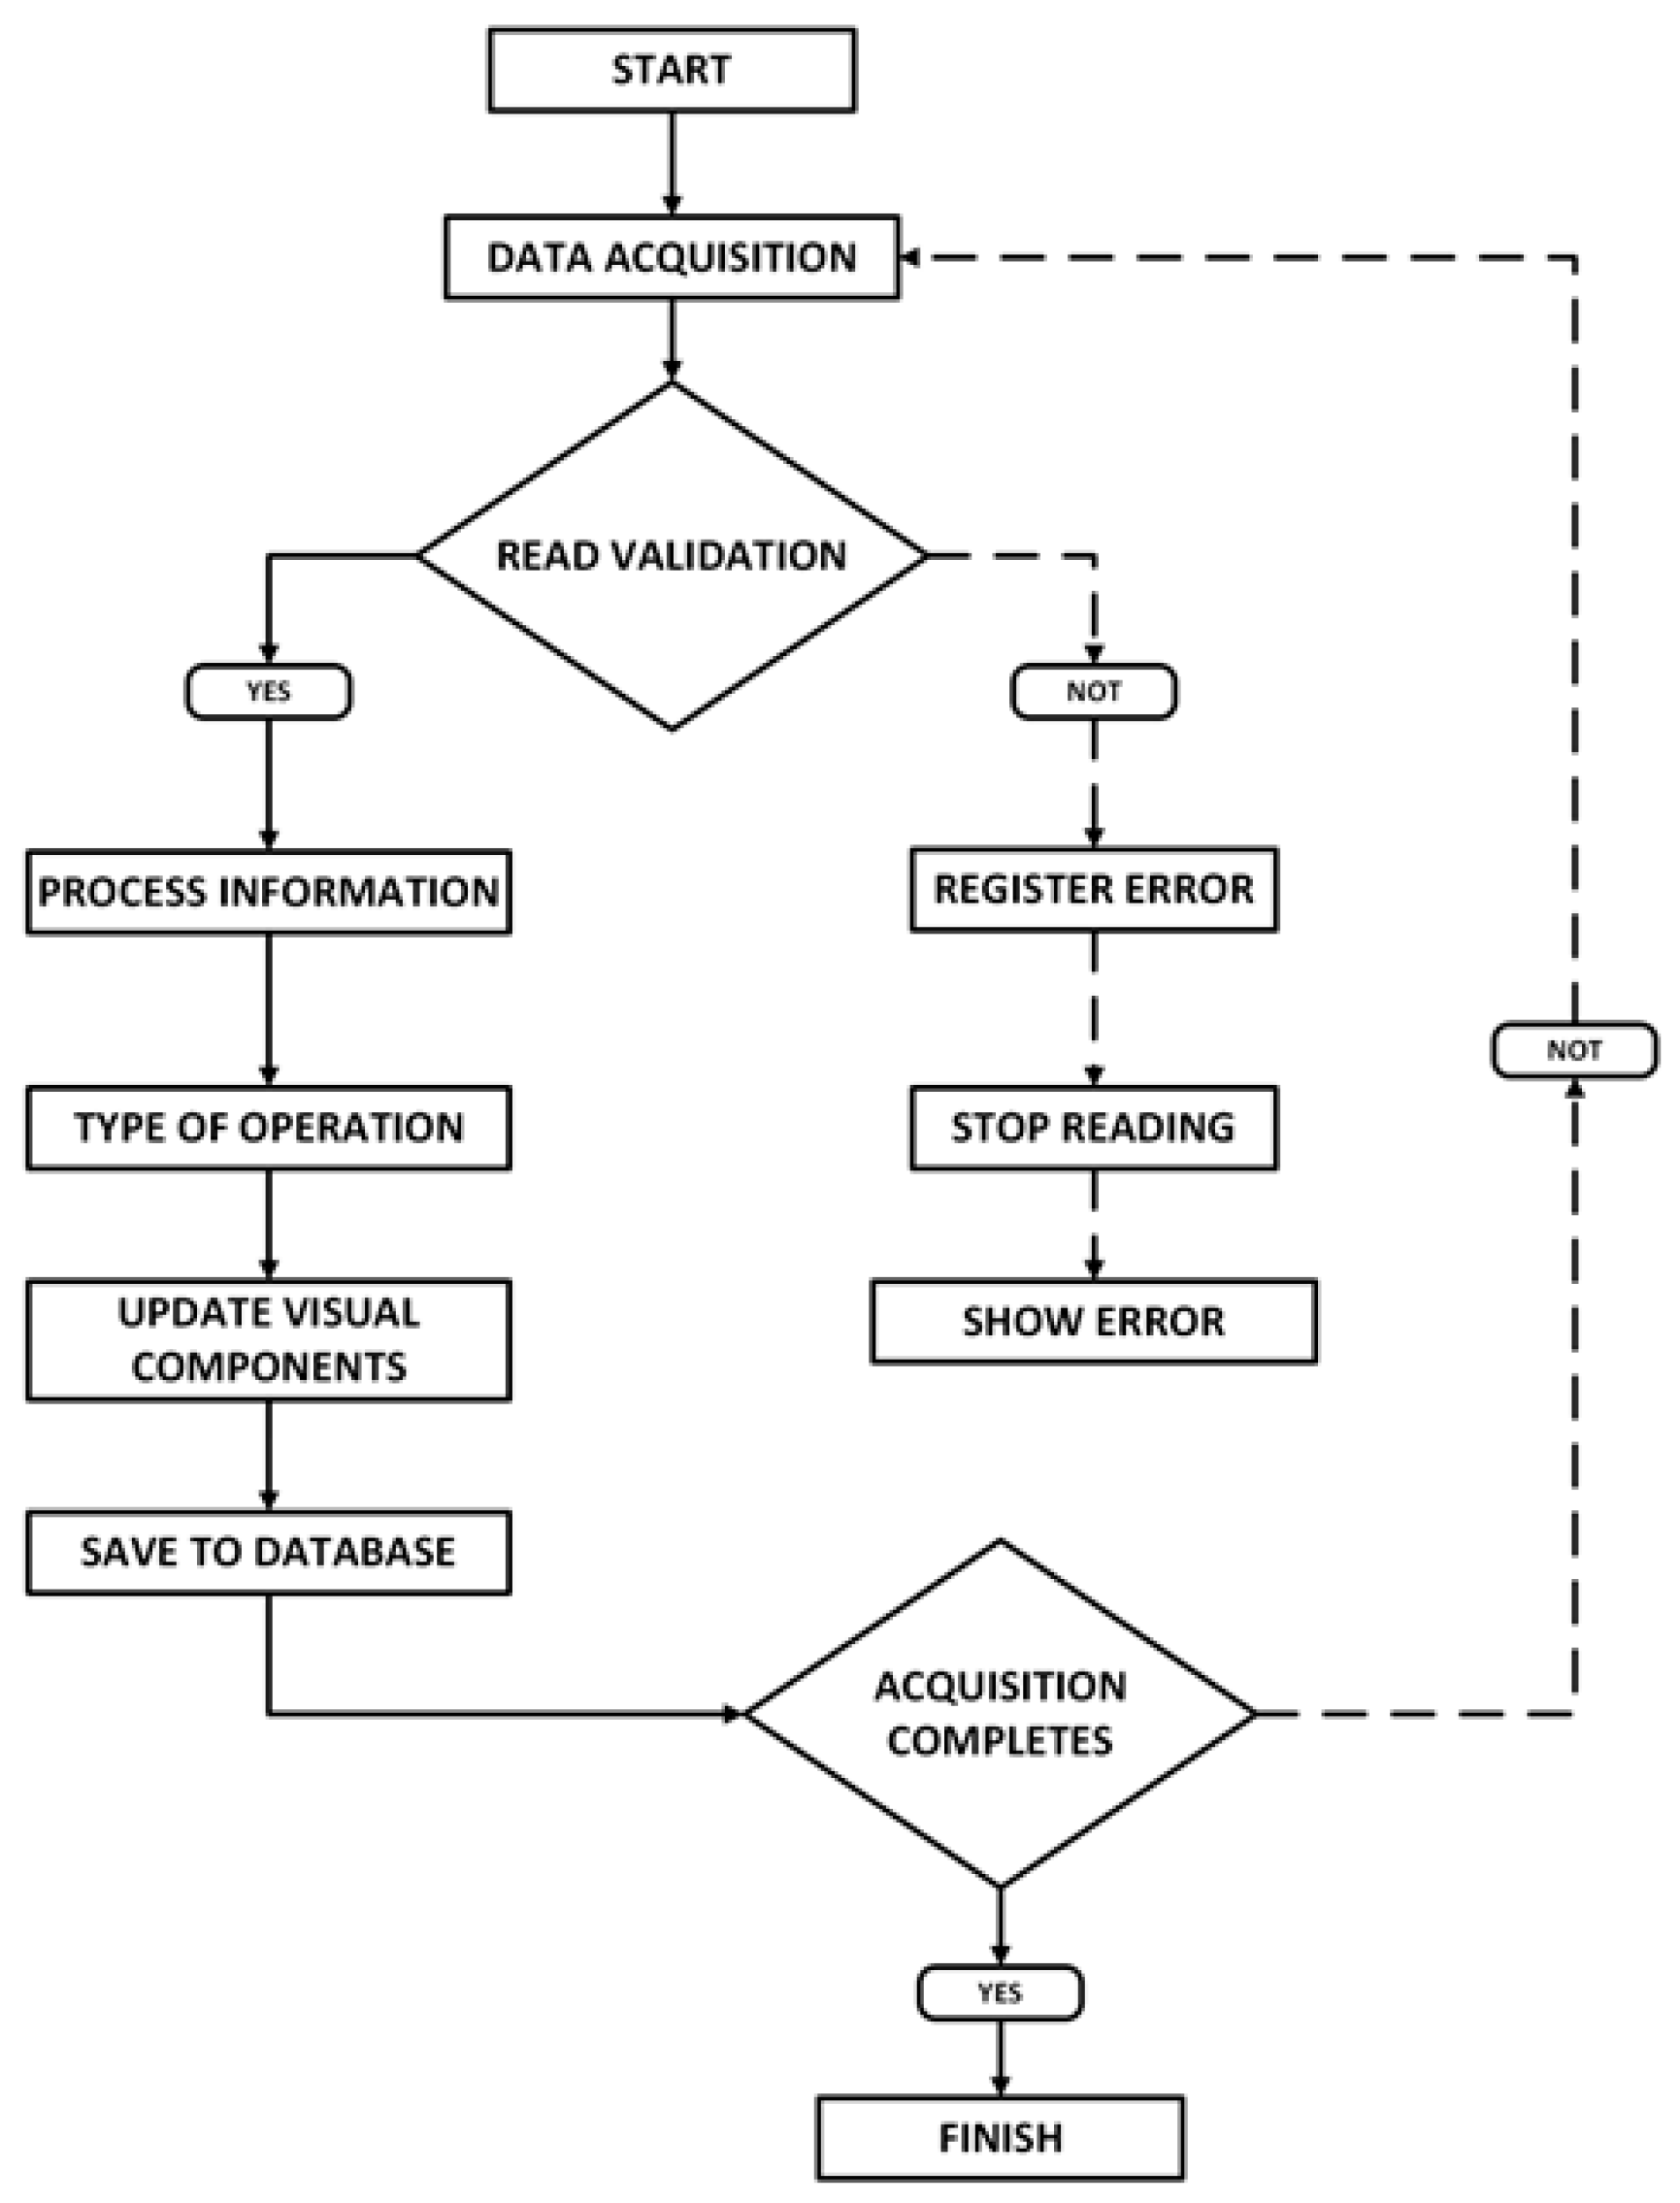
The acquisition system operates at an internal sampling frequency of 10   H z across all channels, enabling accurate tracking of both electrical and thermal signals. To account for the system’s relatively slow thermal dynamics and avoid excessive data redundancy, the recorded values are averages stored at 5   s intervals, ensuring proper synchronisation between variables while maintaining a manageable data size for long-duration experiments. The total system latency was on the order of 100 milliseconds, significantly lower than the electrolyser’s characteristic thermal dynamics, ensuring an effective controller response. Synchronisation between electrical variables (current and voltage) and thermal measurements was ensured within the acquisition system prior to data logging. No abnormal phase delays were observed beyond the expected thermal inertia during load transitions. Figure 5 shows the logic implemented by each acquisition channel. All variables were automatically recorded in a database for further analysis. During extended tests exceeding 10   h of continuous operation, no data discontinuities, signal saturation, or acquisition interruptions were observed. The architecture demonstrated stable performance over extended experimental runs.
During the validation tests, the acquisition system enabled real-time monitoring of process variables via the software console. The dashed inner line in Figure 5 illustrates the control flow during a data reading failure, while the dashed outer line indicates the feedback loop showing that data acquisition is still ongoing. The continuous visualisation included T1 and T2 temperatures, simultaneously showing the current signal in the 4–20 m A range and its corresponding conversion to engineering units.
Table 2 shows values of the continuous recording obtained during the experimentation.
Temperature readings remained at approximately 17.5   ° C , 18.9   ° C , and 19.8   ° C , with minimal variation between consecutive samples, indicating stable operating conditions and adequate repeatability of the measurement system.
The consistency between the current values and the calculated physical quantities confirms that the scaling and processing implemented in the software operate correctly. The small fluctuations observed are within the expected range for industrial instrumentation, validating the reliability of the acquisition system for continuous monitoring of the experimental bench.
The complete measurement chain (sensor–transmitter–DAQ) was verified through a comparative calibration using a standard thermometer with international traceability, ensuring linearity across the entire test thermal range ( 20   ° C to 90   ° C ).

3.2. Thermal Response Without Control

The thermal behaviour of the system was evaluated under steady-state operation without activating the cooling system.
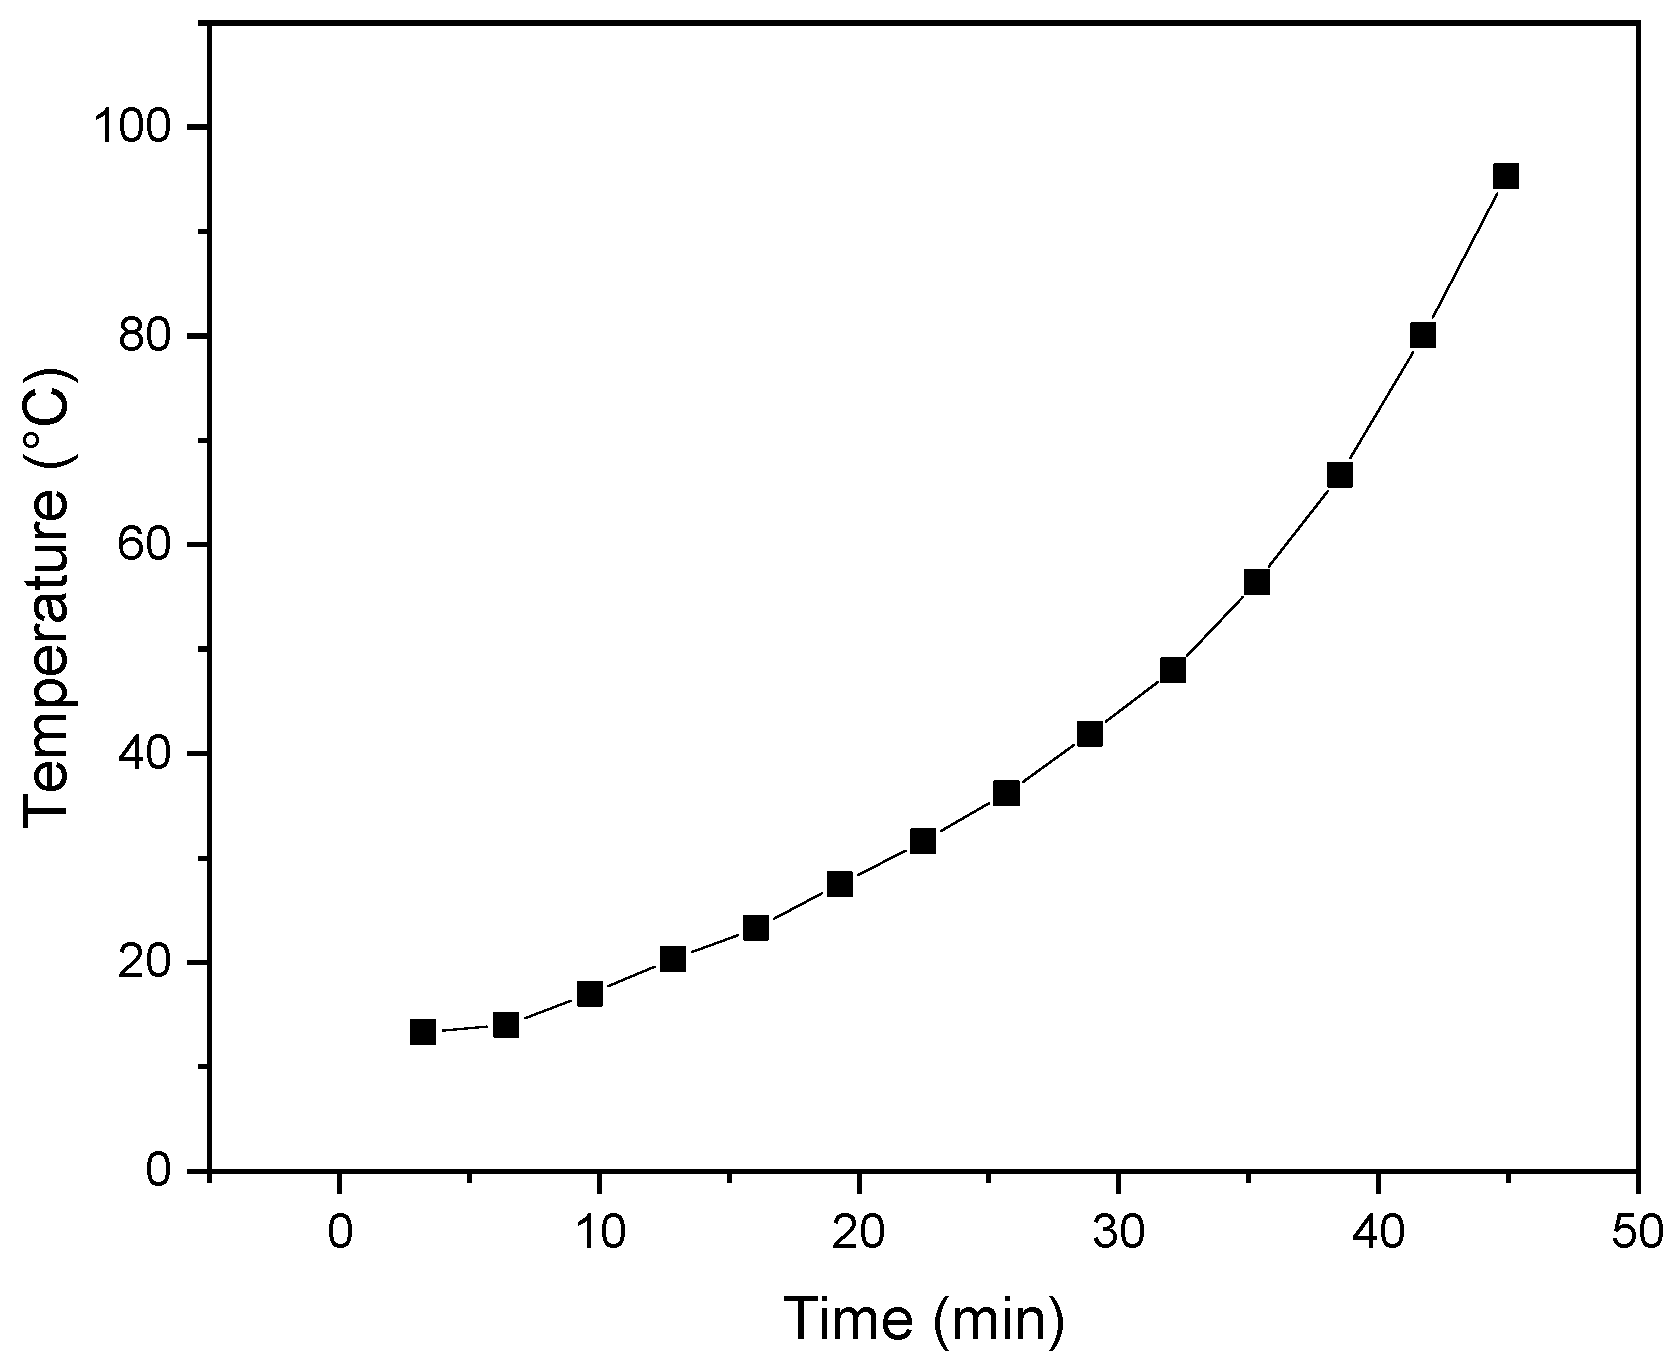
As shown in Figure 6, the electrolyte temperature increased progressively from an initial value near 13   ° C . The temperature rise followed an exponential trend, as confirmed by trendline fitting, reaching nearly 100   ° C during the first hour of operation.
The absence of active heat dissipation led to cumulative heat generation within the system, requiring experimental termination for safety reasons. This result confirms that operating at power levels near 3   k W requires active thermal regulation to ensure stable and safe operation.
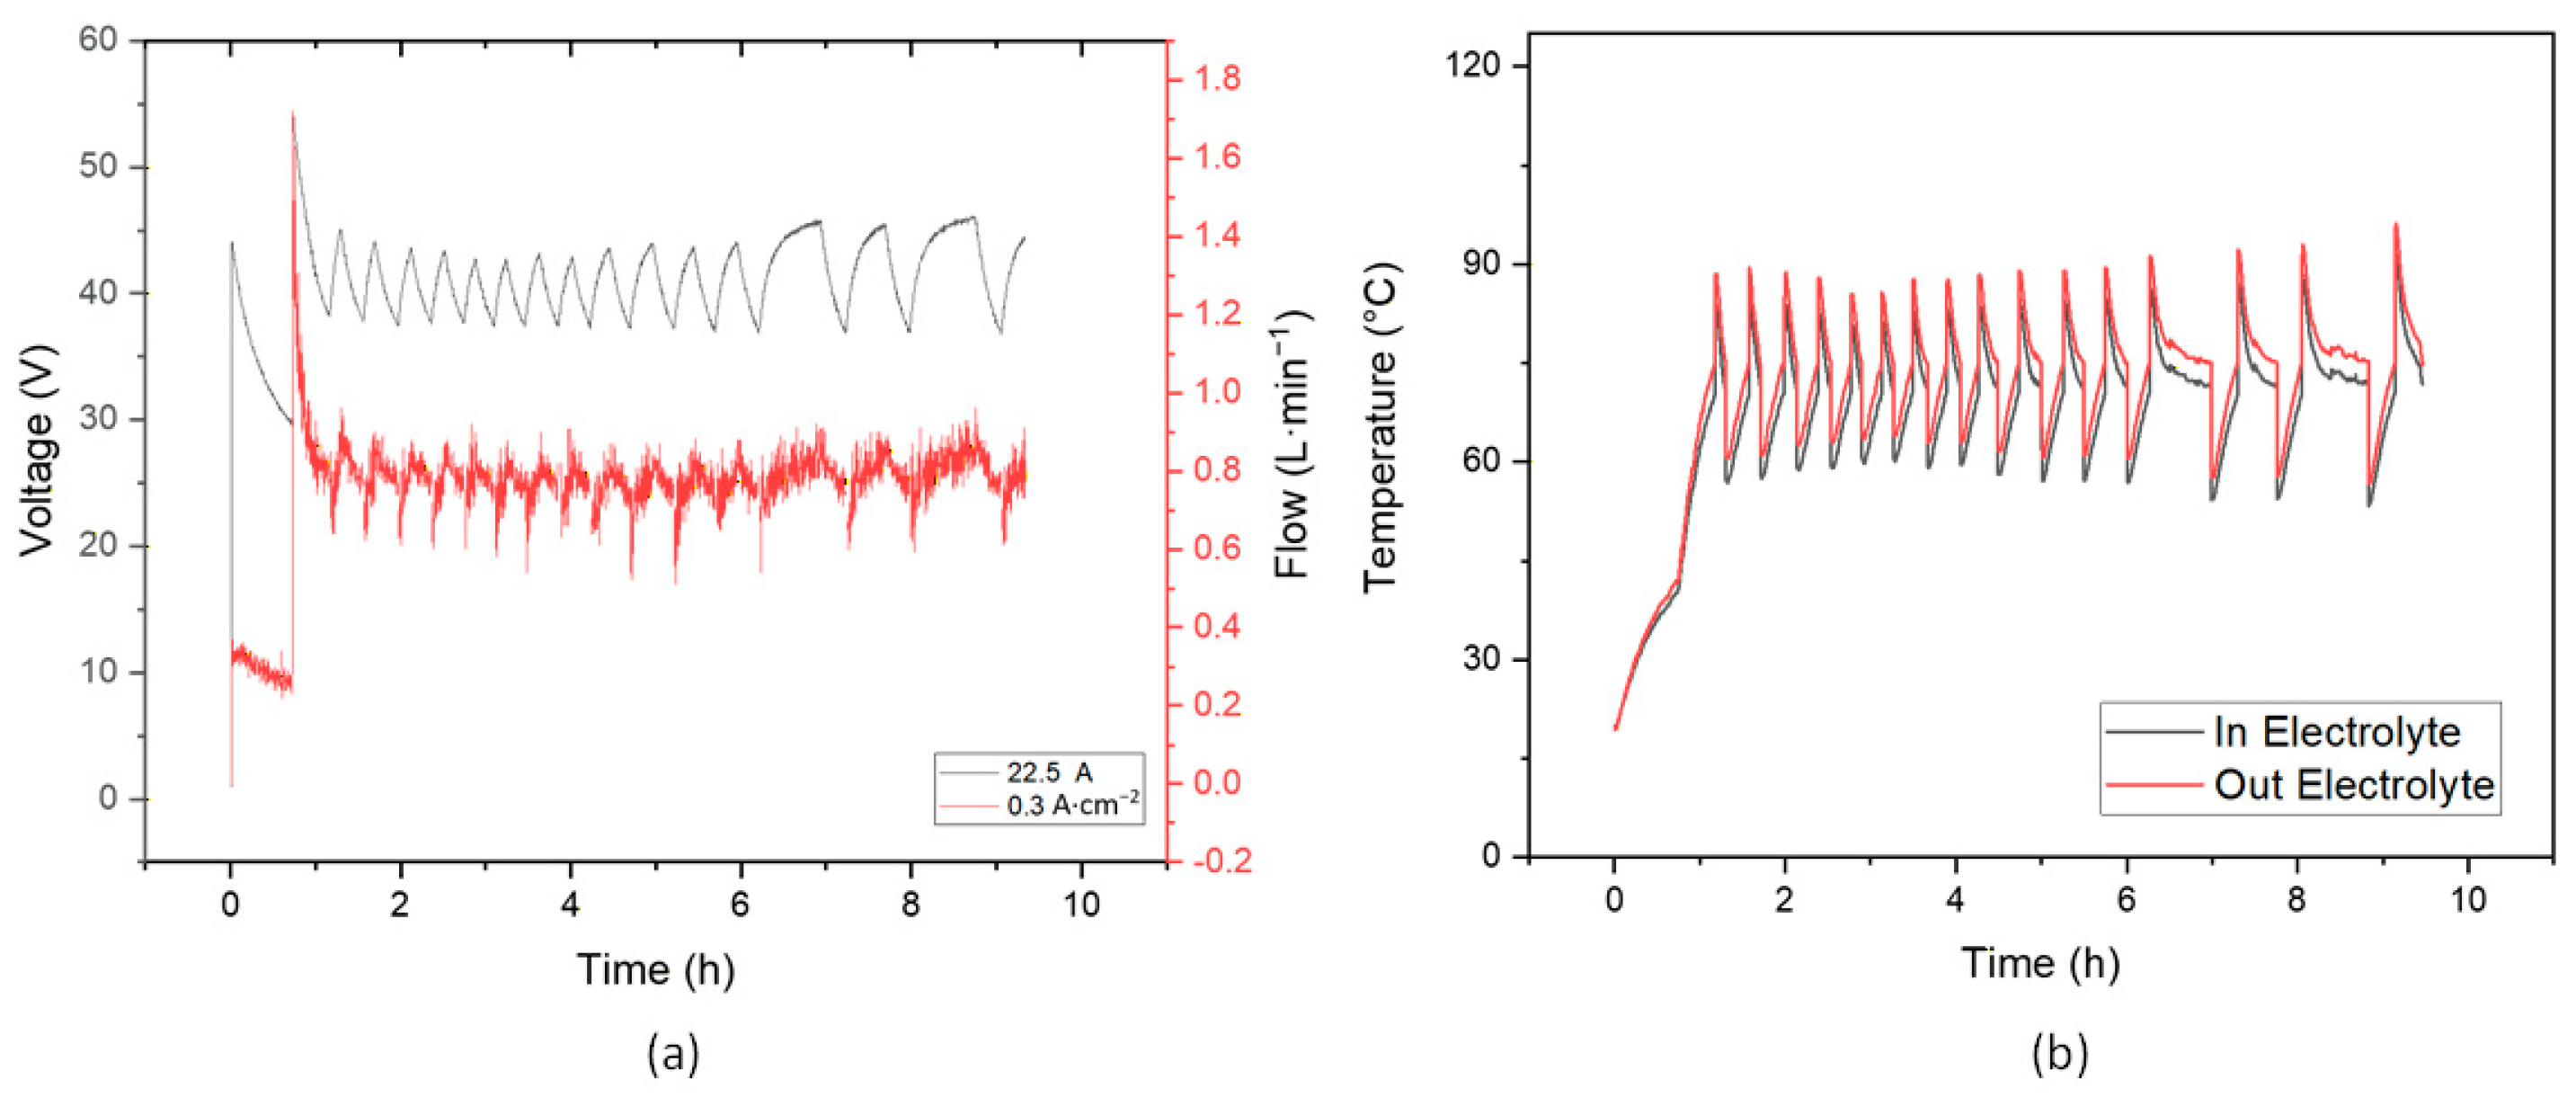
Figure 7a shows the simultaneous evolution of voltage (left axis) and gas flow rate (right axis) as functions of time. The system operated with a voltage stabilised between 37   V and 45   V after the initial transient period. The oxyhydrogen production rate was approximately 0.8   L / m i n under this load condition.
Figure 7b presents the inlet and outlet electrolyte temperature profiles. The temperature increased from approximately 20   ° C and entered an oscillatory regime between 60   ° C and 85   ° C . The thermal amplitude was approximately 25   ° C under these conditions.
The cyclic behaviour corresponded to the intermittent activation of the ON/OFF cooling system. This occurred because heat generation did not reach a steady state with the cooling system’s heat dissipation capacity. The outlet temperature remained consistently higher than the inlet temperature, indicating effective heat removal through the cooling circuit.
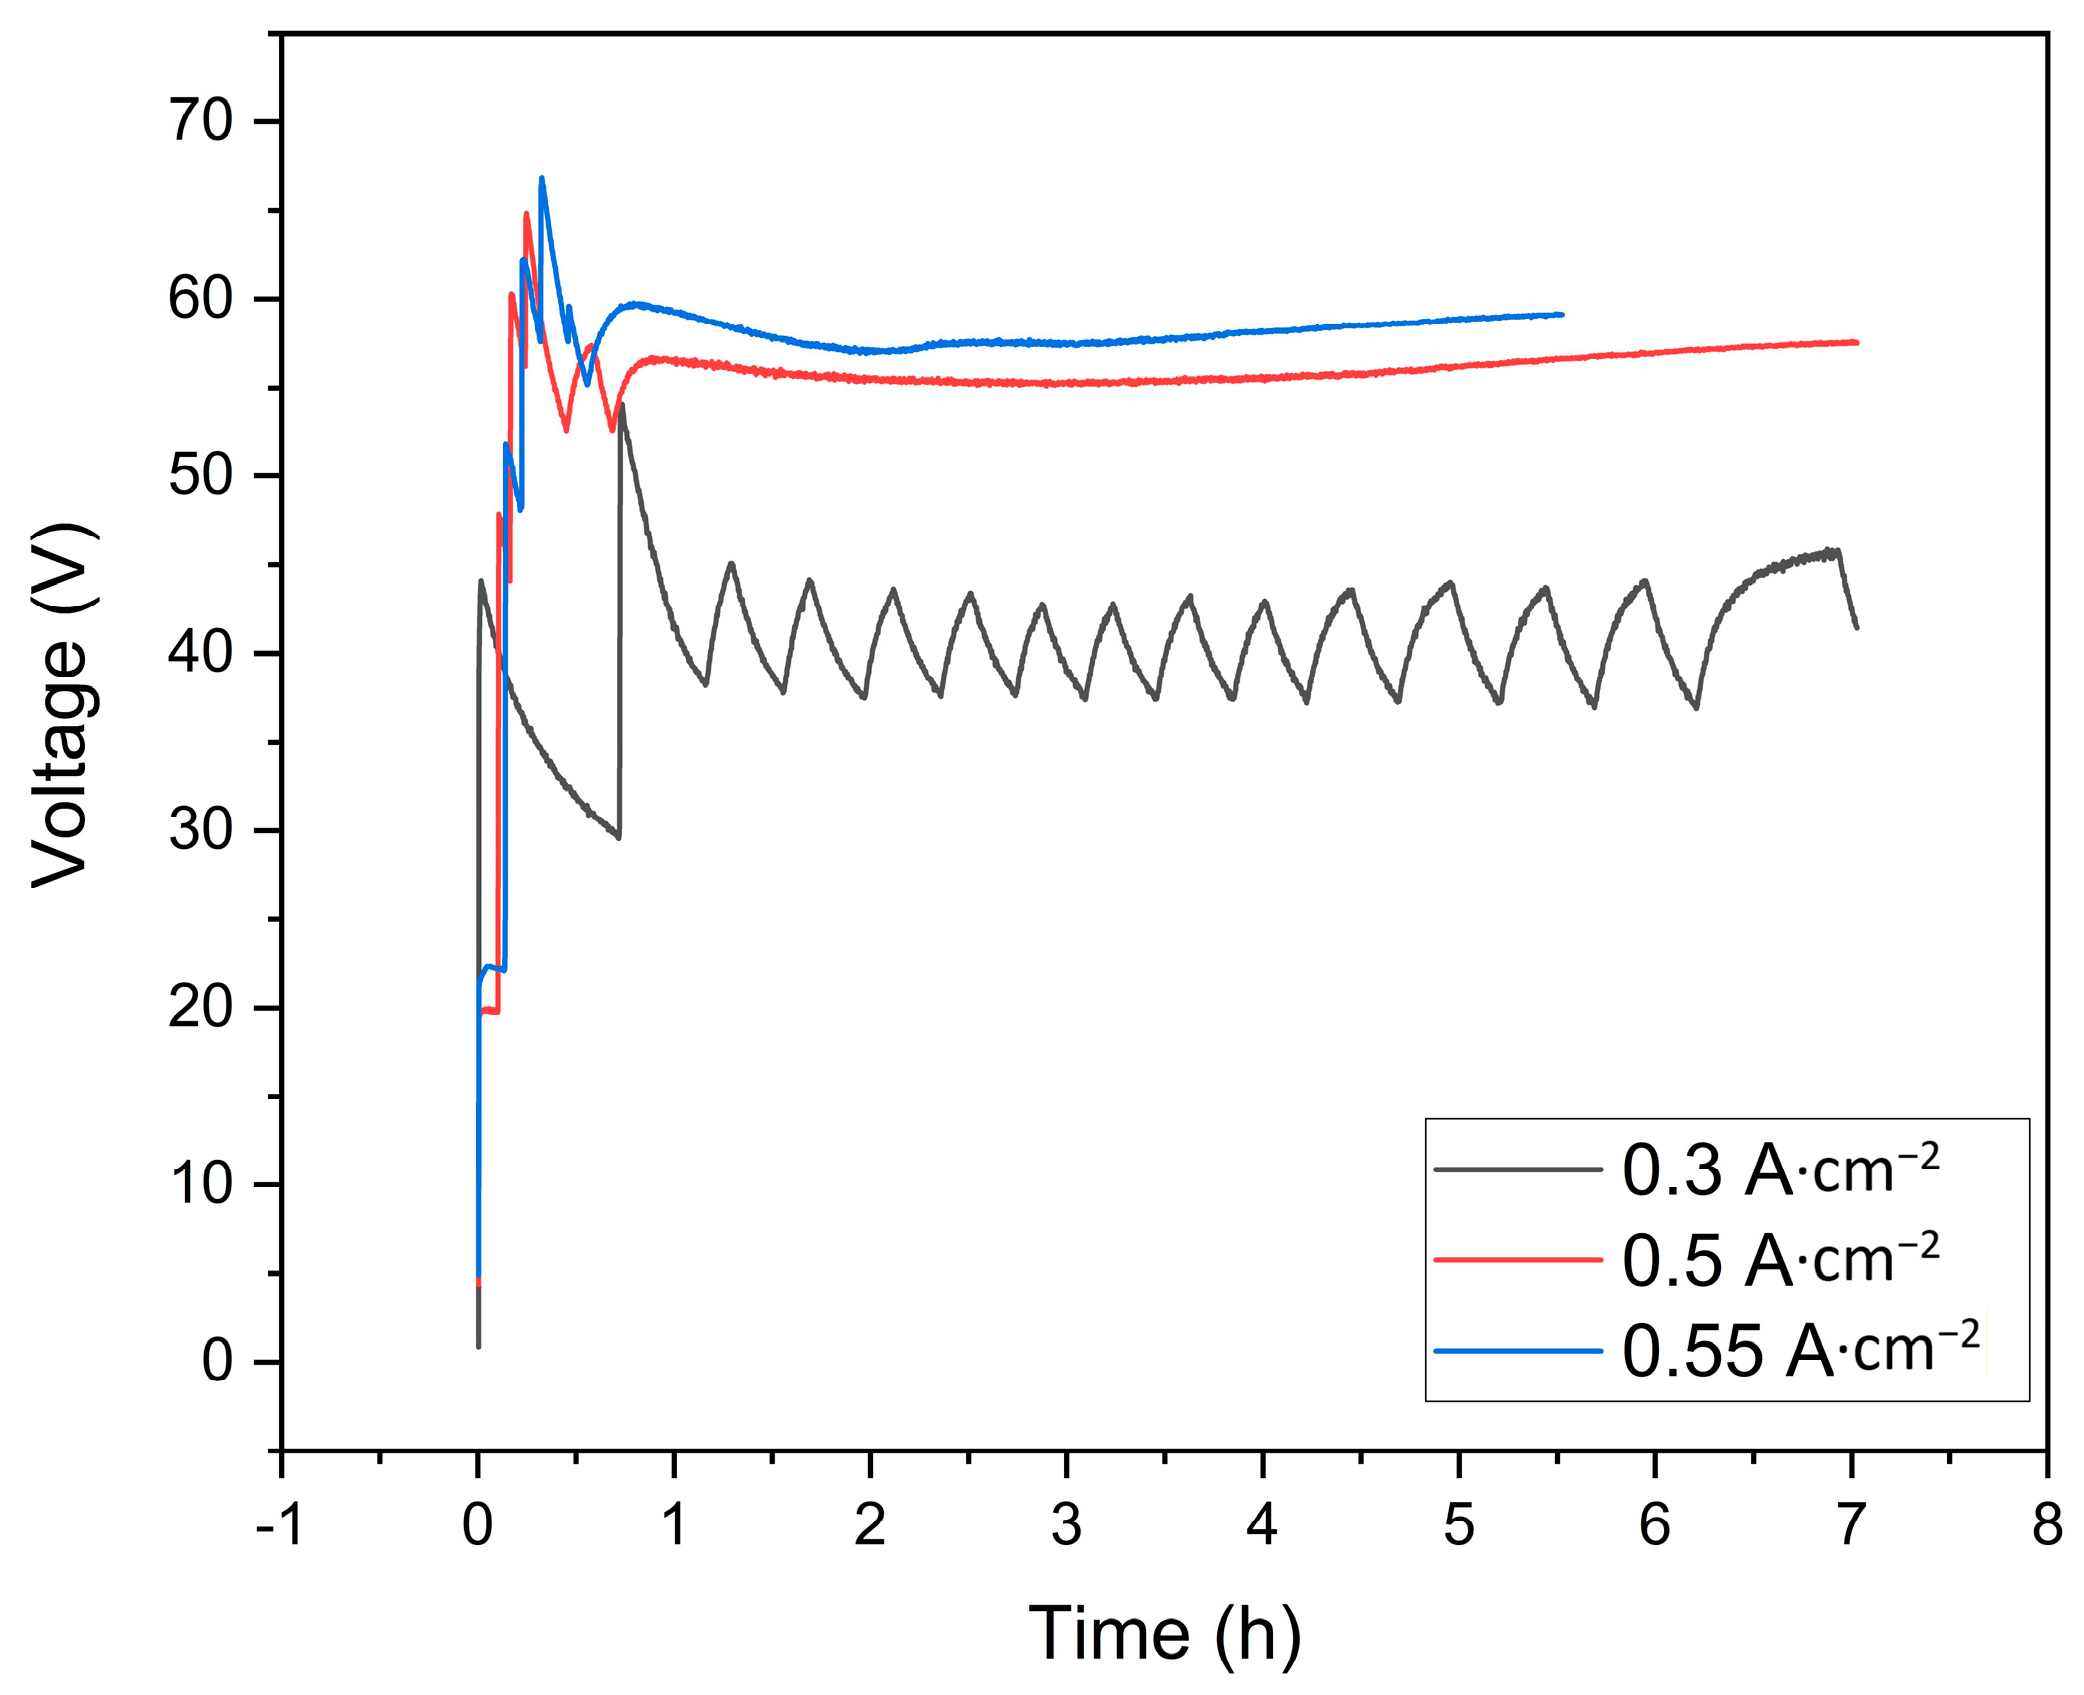
Figure 8 presents the voltage evolution for three current densities: 0.3 , 0.5 , a n d   0.55   A · c m 2 . The case of 0.3   A · c m 2 is included as a comparative reference. For 0.5   A · c m 2 , the voltage stabilised near 58   V during approximately 7   h of continuous operation. For 0.55   A · c m 2 , stable operation was maintained near 60   V during a 12   h long-duration test. In all cases, a pronounced transient voltage peak was observed during the first hour of operation, associated with the system’s initial heating and electrochemical stabilisation. Higher current density promoted a more stable thermal regime, reducing the amplitude of oscillations observed at lower load. It is noted that all generated gas was oxyhydrogen ( H H O ), as the electrolyser configuration does not include membrane-based gas separation.

3.3. Electrical Stability

Thermal regulation maintained voltage within narrow operating bands during extended test periods. In comparison with uncontrolled operation, voltage variation under regulated conditions was significantly reduced. The reduction in voltage fluctuations suggests a decrease in the effects of internal thermal gradients. The observed electrical stability confirms that the implemented DAQ system and ON/OFF controller enable reproducible data acquisition and the safe operation of the test bench under different load conditions.
Several recent studies indicate that alkaline electrolysers typically operate with KOH solutions in the range of 20–30% by weight at temperatures between 60   ° C and 90   ° C and at atmospheric pressure, with current densities between 0.2   a n d   0.6   A · c m 2 and cell voltages around 1.8–2.2 V, depending on the system configuration [16,33,40,41,42]. In the present work, the electrolyser operated within a temperature range of 60–85 °C, using 30 % weight K O H at atmospheric pressure. At a current density of 0.5   A · c m 2 , a total voltage of approximately 60   V was measured over 12   h of continuous operation, consistent with expected values given the number of cells in the system. Additionally, Table 3 is a comparison to visualise the agreement between the results obtained and those reported in the recent literature. This comparison confirms that the system’s behaviour falls within the typical operational ranges.

4. Discussion

The implementation of the data-acquisition system and automated temperature control proved to be a determining factor in the test bench’s operational stability. The results showed that, in the absence of thermal regulation, electrolyte temperature increased exponentially, reaching critical values within approximately one hour of operation. This condition compromised system safety and reduced the reliability of experimental data. In addition to the kinetic effects of higher temperatures on activation overpotentials, the system’s effective resistance varies due to the absence of thermal regulation. This leads to differences in local temperature, which alter the current density distribution and electrolyte conductivity, causing instability in the electrical reaction. The observed voltage decrease during our uncontrolled thermal experiments exemplifies this behaviour. In these runs, the system was unable to reach a stable electrochemical steady state.
The observed reduction in voltage variations under controlled conditions suggests a decrease in the effects of internal thermal gradients. This is particularly relevant in experimental test benches intended for electrochemical characterisation, where the repeatability of polarisation curves and long-duration tests depends on thermal stability. In energetic terms, the specific energy consumption obtained ( 11.67   k W h · N m 3 ) is reported as an experimental reference under thermally regulated conditions. Although stack optimisation is not the objective of the present study, the achieved thermal stability represents a necessary condition for future efficiency-oriented evaluations. From an experimental infrastructure perspective, the implemented DAQ architecture enabled synchronised acquisition of electrical and thermal variables, as well as automated response of the cooling system. The absence of data discontinuities during tests exceeding 10   h confirms the system’s reliability for extended experimental campaigns. The results demonstrate that integrating real-time monitoring and automated thermal control into intermediate-power alkaline electrolysis test benches is essential to ensure safe operation, electrical stability, and experimental reproducibility.
A statistical summary of the steady-state operating conditions is presented in Table 4, including mean values, standard deviation, and coefficient of variation for the main process variables.
The ON/OFF strategy is appropriate for this 3   k W platform and was selected as the first control strategy to implement because the acquisition architecture’s latency ( ~ 100   m s ) is significantly lower than the electrolyte’s heating dynamics. This is suitable due to its low implementation complexity and its effectiveness in maintaining operational integrity by preventing the system from reaching critical temperatures near 100   ° C . However, the ON/OFF control ceases to be suitable at low current densities ( 0.3   A · c m 2 ), as heat generation is insufficient to reach a steady-state equilibrium with the dissipation capacity, causing cyclic oscillations of up to 25   ° C . In contrast, at 0.5   a n d   0.55   A · c m 2 , the higher heat generation led to a more stable thermal regime, with the temperature remaining within narrow bands after the initial transient period. This behaviour suggests that the interaction between heat generation and cooling capacity can lead to distinct dynamic states, with greater stability achieved once sustained thermal equilibrium is reached. We would like to implement improved control strategies whose comparative analysis would enhance system evaluation, allowing us to reduce the amplitude of these oscillations and improve stability under dynamic load profiles by anticipating the system’s thermal response. Some of these control strategies to implement could be PID, predictive control (MPC), or schemes based on differential neural networks, which may increase computational resource demands and modelling complexity compared to the robustness of the implemented ON/OFF method (see Table 5).
The reduction in voltage observed under controlled-temperature conditions can be interpreted as the influence of temperature on the components of the overpotential. In alkaline electrolysis systems, increasing the temperature favours the kinetics of electrochemical reactions, reducing the activation overpotential, while also increasing the ionic conductivity of the electrolyte, thereby decreasing ohmic losses. Additionally, higher temperatures can facilitate the release of gas bubbles, thereby partially alleviating mass-transport limitations. These effects have been widely reported in the literature [36,44]. Although these phenomena underpin the observed trend, this study did not perform a quantitative decomposition of the voltage contributions using techniques such as electrochemical impedance spectroscopy. Therefore, the interpretation presented should be considered qualitative. Future work will focus on implementing these techniques to achieve a more detailed characterisation of the system’s electrochemical behaviour.
The influence of temperature on electrolyser voltage can be understood in terms of the kinetics of electrochemical reactions at the electrodes, specifically the hydrogen evolution reaction (HER) at the cathode and the oxygen evolution reaction (OER) at the anode. In alkaline electrolysis systems, the reaction rate exhibits a strong dependence on temperature, following Arrhenius-type behaviour, in which an increase in temperature increases the kinetic constant and, consequently, decreases the activation overpotential [45]. In particular, the HER is favoured by higher temperatures, which accelerate charge transfer and hydrogen adsorption/desorption on the electrode surface. Meanwhile, the OER, which generally constitutes the kinetically limiting step of the process, also shows significant improvement with increasing temperature, as reflected in a reduction in the required overpotential [43]. In this sense, the experimentally observed reduction in voltage under controlled temperature conditions in this work is consistent with the expected kinetic behaviour of both reactions. However, it is recognised that no specific electrochemical characterisation of the kinetics of HER and OER was performed, so this interpretation should be considered qualitative.

5. Conclusions and Future Works

This work developed and implemented a data acquisition (DAQ) architecture and automated thermal control for an alkaline electrolysis test bench with a nominal power of 3   k W . The system enabled synchronised monitoring of electrical and thermal variables, as well as automatic activation of the cooling system via an ON/OFF control strategy. The results demonstrated that operation without thermal regulation leads to an exponential increase in electrolyte temperature, reaching critical levels near 100   ° C within approximately 1   h , compromising the system’s integrity. Conversely, the implementation of control prevented overheating and enabled the establishment of distinct thermal stability regimes as a function of current density. At a density of 0.3   A · c m 2 , a cyclic behaviour between 60   ° C   a n d   80   ° C was observed due to the inherent dynamics of the ON/OFF control under low thermal load conditions. However, at a density of 0.5   A · c m 2 , the system reached a more stable regime between 70   ° C and 75   ° C , maintaining steady-state fluctuations of just ± 1   ° C after transient stabilisation. This thermal stabilisation significantly reduced voltage variations caused by internal thermal gradients, improving electrical stability and experimental reproducibility in long-duration tests exceeding 12   h of continuous operation without data loss. In terms of energy performance, a specific consumption of 11.67   k W h · N m 3 was reported as a reference value under controlled thermal conditions, establishing a solid baseline for future stack efficiency optimisations. Compared to other recent research works, the results align with typical operational ranges for laboratory-scale alkaline electrolysers, which usually operate between 60   ° C and 90   ° C with current densities of 0.2   t o   0.6   A · c m 2 . While much of the literature focuses on validation through simulation or industrial-scale implementations, the main contribution of this manuscript is the experimental integration of a robust, low-cost DAQ system that ensures operational safety and standardises testing in intermediate-power units ( 3   k W ). The architecture demonstrated a system latency ( ~ 100   m s ) significantly lower than the electrolyte’s thermal dynamics, validating the controller’s effectiveness in preventing critical thermal events.
Under thermally controlled conditions, the system achieved a stable operating regime with an average electrolyte inlet temperature of 80.74   ° C and outlet temperature of 74.18   ° C . Temperature variability remained low, with standard deviations below 0.36   ° C and coefficients of variation of 0.43 % and 0.40 % for inlet and outlet temperatures, respectively, confirming highly stable thermal behaviour.
In contrast, under uncontrolled conditions, the electrolyte temperature increased progressively up to approximately 100   ° C , leading to unstable operation and test termination. The implemented ON/OFF thermal control strategy significantly reduced temperature fluctuations and enabled consistent system performance, as reflected by the low dispersion in electrical and flow variables.
Looking ahead, it is considered essential to evolve towards more advanced control strategies to mitigate oscillation amplitudes at low load densities. The implementation of predictive control schemes (MPC), adaptive control, or Differential Neural Networks is proposed. These tools would enable anticipation of the system’s thermal dynamics in response to current variations, especially under dynamic load profiles that simulate renewable energy sources. Additionally, strengthening the test bench requires integrating simplified thermal mathematical models and more in-depth electrochemical characterisation techniques, such as electrochemical impedance spectroscopy (EIS) and Tafel plots. These improvements will enable a quantitative decomposition of overpotentials and a more detailed understanding of mass transport phenomena, establishing this platform as a robust tool for the technological development of alkaline electrolysis.

Author Contributions

Conceptualization, E.M.-Z. and I.T.-O.; Methodology, E.M.-Z.; Software, E.M.-Z., I.D.R.-Y. and R.R.-B.; Validation, A.W.-F., J.M.S.-P. and R.R.-B.; Formal analysis, R.d.G.G.-H. and L.A.F.-H.; Investigation, E.M.-Z.; Resources, J.M.S.-P. and R.R.-B.; Data curation, A.W.-F., I.D.R.-Y. and R.R.-B.; Writing—review & editing, L.A.F.-H. and R.R.-B.; Visualization, R.d.G.G.-H. and J.M.S.-P.; Supervision, J.M.S.-P.; Project administration, J.M.S.-P.; Funding acquisition, R.d.G.G.-H., L.A.F.-H., J.M.S.-P. and R.R.-B. All authors have read and agreed to the published version of the manuscript.

Funding

This research was funded by SECIHTI and the Instituto Politécnico Nacional (IPN) under SIP project numbers 20260321, 20260276, and 20260350; the Multidisciplinary project 2388; and the Comisión de Operación y Fomento de Actividades Académicas (COFAA) del Instituto Politécnico Nacional.

Data Availability Statement

The original contributions presented in this study are included in the article. Further inquiries can be directed to the corresponding author.

Acknowledgments

The Authors acknowledge the Instituto Politécnico Nacional (IPN) in Mex-ico for the use of their facilities and resources to complete this research work and the Secretaría de Ciencia, Humanidades, Tecnología e Innovación (SECIHTI) for their contribution to the devel-opment of this academic research. The authors have reviewed and edited the output and take full responsibility for the content of this publication.

Conflicts of Interest

The authors declare no conflicts of interest. The funders had no role in the design of the study, in the collection, analysis, or interpretation of data, in the writing of the manuscript, or in the decision to publish the results. Thank you for your time and for considering our work for review.

Abbreviations

The following abbreviations are used in this manuscript:
Abbreviations
AWEAlkaline Electrolysis
ICurrent
KOHPotassium Hydroxide
H2Hydrogen
HHOOxyhydrogen
SLPMStandard Litres per Minute
DAQData Acquisition
FCTESTNETFuel Cell Testing and Standardisation Network
HHVHigher Heating Value
Symbols
η a overpotentials of the anode
η c overpotentials of the cathode
iR Ohmic voltage drop term
n   = 2 (number of electrons involved)
n c number of cells
n H 2 , theoretical moles of theoretical Hydrogen ( m o l / s )
F Faraday constant ( 96,485   C / m o l )

References

  1. David, M.; Ocampo-Martínez, C.; Sánchez-Peña, R. Advances in alkaline water electrolysers: A review. J. Energy Storage 2019, 23, 392–403. [Google Scholar] [CrossRef]
  2. Dash, S.; Singh, K.A.; Jose, S.; Wilson, D.V.H.; Elangovan, D.; Surapraraju, S.K.; Natarajan, S.K. Advances in green hydrogen production through alkaline water electrolysis: A comprehensive review. Int. J. Hydrogen Energy 2024, 83, 614–629. [Google Scholar] [CrossRef]
  3. Benbrigite, H.; Chait, S.; Chater, E.A.; Laaroussi, N. Hydrogen Production Technologies: A Review. In Proceedings of the 2025 5th International Conference on Innovative Research in Applied Science, Engineering and Technology (IRASET), Fez, Morocco, 15–16 May 2025; pp. 1–7. [Google Scholar] [CrossRef]
  4. Palacios, A.; Cordova-Lizama, A.; Castro-Olivera, P.M.; Palacios-Rosas, E. Hydrogen production in Mexico: State of the art, future perspectives, challenges, and opportunities. Int. J. Hydrogen Energy 2022, 47, 30196–30212. [Google Scholar] [CrossRef]
  5. Singla, M.K.; Gupta, J.; Beryozkina, S.; Safaraliev, M.; Singh, M. The colorful economics of hydrogen: Assessing the costs and viability of different hydrogen production methods—A review. Int. J. Hydrogen Energy 2024, 61, 664–677. [Google Scholar] [CrossRef]
  6. Farhana, K.; Mahamude, A.S.F.; Kadirgama, K. Comparing hydrogen fuel cost of production from various sources—A competitive analysis. Energy Convers. Manag. 2024, 302, 118088. [Google Scholar] [CrossRef]
  7. Lin, K.; Chen, B.; Liu, Z.; Fu, L.; Hao, S.; Li, J.; Zhang, Y.; Xie, H. Toward efficient, low-carbon, and Cost-effective hydrogen production shifting from fossil fuel-based to renewable water electrolysis: A perspective and outlook. Appl. Energy 2025, 401, 126661. [Google Scholar] [CrossRef]
  8. Martínez-Rodríguez, A.; Abánades, A. Comparative Analysis of Energy and Exergy Performance of Hydrogen Production Methods. Entropy 2020, 22, 1286. [Google Scholar] [CrossRef]
  9. Hu, S.; Guo, B.; Ding, S.; Yang, F.; Dang, J.; Liu, B.; Gu, J.; Ma, J.; Ouyang, M. A comprehensive review of alkaline water electrolysis mathematical modeling. Appl. Energy 2022, 327, 120099. [Google Scholar] [CrossRef]
  10. Amores, E.; Rodríguez, J.; Carreras, C. Influence of operation parameters in the modeling of alkaline water electrolysers for hydrogen production. Int. J. Hydrogen Energy 2014, 39, 13063–13078. [Google Scholar] [CrossRef]
  11. Abdin, Z.; Webb, C.J.; Gray, E.M. Modelling and simulation of an alkaline electrolyser cell. Energy 2017, 138, 316–331. [Google Scholar] [CrossRef]
  12. Sarbaland, F.b.N.; Kobayashi, M.; Tanaka, D.; Fujita, R.; Tanaka, N.; Furuya, M. Temperature Control in Microfluidic Devices: Approaches, Challenges, and Future Directions. Appl. Sci. 2025, 15, 9902. [Google Scholar] [CrossRef]
  13. Narputro, P.; Effendi, P.; Akbar, I.M.; Rahman, S. Analysis of the Role of Temperature and Current Density in Hydrogen Production via Water Electrolysis: A Systematic Literature Review. Eng. Proc. 2025, 107, 23. [Google Scholar] [CrossRef]
  14. Yang, J.; Zhang, J.; Liu, M.; Sun, J.; Shangguan, Z. Dynamic Simulation and Performance Analysis of Alkaline Water Electrolyzers for Renewable Energy-Powered Hydrogen Production. Energies 2024, 17, 4915. [Google Scholar] [CrossRef]
  15. Luo, S.; Zhang, T.; Xu, H.; Zhang, J.; Zhao, H.; Yun, J.; Zhao, H. Optimizing Alkaline Water Electrolysis: A Dual-Model Approach for Enhanced Hydrogen Production Efficiency. Energies 2024, 17, 5512. [Google Scholar] [CrossRef]
  16. Liu, M.; Zheng, X.; Jia, Y.; Shao, G.; Shi, J.; Zeng, S.; Wang, K.; Li, Y.; Gu, C. Mathematical Modeling and Experimental Validation for a 50 kW Alkaline Water Electrolyzer. Processes 2024, 12, 2616. [Google Scholar] [CrossRef]
  17. Aboukalam da Cruz, M.H.A.; Etancelin, M.; Marias, F.; Reneaume, J.-M.; Sochard-Reneaume, S.; Serra, S. Dynamic modelling of an alkaline water electrolysis system and optimisation of its operating parameters for hydrogen production. Int. J. Hydrogen Energy 2023, 48, 12982–12999. [Google Scholar] [CrossRef]
  18. Li, Z.; Tu, Z.; Yi, Z.; Xu, Y. Coordinated Control of Proton Exchange Membrane Electrolyzers and Alkaline Electrolyzers for a Wind-to-Hydrogen Islanded Microgrid. Energies 2024, 17, 2317. [Google Scholar] [CrossRef]
  19. Wang, T.; Wang, J.; Zhang, C.; Wang, P.; Ren, Z.; Guo, H.; Wu, Z.; Wang, F. Direct operational data-driven workflow for dynamic voltage prediction of commercial alkaline water electrolysers based on artificial neural network (ANN). Fuel 2024, 376, 132624. [Google Scholar] [CrossRef]
  20. Aguirre, O.A.; Ocampo-Martinez, C.; Camacho, O. Control strategies for alkaline electrolysers: A survey. Int. J. Hydrogen Energy 2024, 86, 1195–1213. [Google Scholar] [CrossRef]
  21. Ulleberg, O. Modeling of advanced alkaline electrolysers: A system simulation approach. Int. J. Hydrogen Energy 2003, 28, 21–33. [Google Scholar] [CrossRef]
  22. Shamoo, A.E.; Resnik, D.B. ‘Data Acquisition and Management’, Responsible Conduct of Research, 4th ed.; online edn; Oxford Academic: New York, NY, USA, 2022. [Google Scholar] [CrossRef]
  23. Flamm, B.; Peter, C.; Büchi, F.N.; Lygeros, J. Electrolyzer modeling and real time control for optimized production of hydrogen gas. Appl. Energy 2021, 281, 116031. [Google Scholar] [CrossRef]
  24. Qi, R.; Li, J.; Lin, J.; Song, Y.; Wang, J.; Cui, Q.; Qiu, Y.; Tang, M.; Wang, J. Thermal modeling and controller design of an alkaline electrolysis system under dynamic operating conditions. Appl. Energy 2023, 332, 120551. [Google Scholar] [CrossRef]
  25. Jiang, Y.-C.; Dong, S.-M.; Liang, Z.; Wang, X.-L.; Shi, L.; Yan, B.; Zhao, T. Holistic Dynamic Modeling and Simulation of Alkaline Water Electrolysis Systems Based on Heat Current Method. Energies 2024, 17, 6202. [Google Scholar] [CrossRef]
  26. Haug, P.; Koj, M.; Turek, T. Influence of process conditions on gas purity in alkaline water electrolysis. Int. J. Hydrogen Energy 2017, 42, 9406–9418. [Google Scholar] [CrossRef]
  27. Bloom, I.; Walker, L.K.; Basco, J.K.; Malkow, T.; Saturnio, A.; De Marco, G.; Tsotridis, G. A comparison of Fuel Cell Testing protocols, A case study: Protocols used by the U.S. Department of Energy, European Union, International Electrotechnical Commission/Fuel Cell Testing and Standardization Network, and Fuel Cell Technical Team. J. Power Sources 2013, 243, 451–457. [Google Scholar] [CrossRef]
  28. Barhoumi, E.M.; Almutairi, S.Z. Challenges in Integrating Electrolyzers into Power Systems: Review of Current Literature and Suggested Solutions. Energies 2025, 18, 6258. [Google Scholar] [CrossRef]
  29. Tsotridis, G.; Podias, A.; Winkler, W.; Scagliotti, M. FCTESTNET Fuel Cells Glossary; EUR 22295 EN; Version 2; Office for Official Publications of the European Communities: Luxembourg, 2006; Available online: https://op.europa.eu/en/publication-detail/-/publication/32352f65-ad68-4b15-91ae-583c53161dc9/language-en (accessed on 17 November 2025).
  30. Wang, Q.; Yang, L.; Wang, M.; Ma, B.; Yuan, L.; Li, S.; Liu, Z. Static Voltage Stability Assessment of Renewable Energy Power Systems Based on DBN-LSTM Power Forecasting. J. Low Power Electron. Appl. 2026, 16, 11. [Google Scholar] [CrossRef]
  31. Rodríguez Leal, B.; Decrozant-Triquenaux, J.; Hardell, J.; Pelcastre, L. Development of a Laboratory-Scale Test Methodology for Performance Evaluation of Lubricants for Hot Stamping of an Aluminium Alloy. Lubricants 2023, 11, 359. [Google Scholar] [CrossRef]
  32. Horcasitas-Verdiguel, M.; Sandoval-Pineda, J.M.; Grunstein-Ramírez, B.A.; Terán-Balaguer, L.F.; González-Huerta, R.d.G. Design and Manufacture of ICE Test Module to Reduce Gasoline Consumption Using Oxyhydrogen Gas from an Alkaline Electrolyzer. ACS Energy Fuel 2016, 30, 6640–6645. [Google Scholar] [CrossRef]
  33. Xia, Y.; Cheng, H.; He, H.; Wei, W. Efficiency and consistency enhancement for alkaline electrolysers driven by renewable energy sources. Commun. Eng. 2023, 2, 22. [Google Scholar] [CrossRef]
  34. Guillet, N.; Millet, P. Alkaline water electrolysis. In Hydrogen Production: Electrolysis; Godula-Jopek, A., Ed.; Wiley-VCH: Weinheim, Germany, 2015; pp. 123–180. [Google Scholar] [CrossRef]
  35. Guo, L.; Su, J.; Wang, Z.; Shi, J.; Guan, X.; Cao, W.; Ou, Z. Hydrogen safety: An obstacle that must be overcome on the road towards future hydrogen economy. Int. J. Hydrogen Energy 2024, 51, 1055–1078. [Google Scholar] [CrossRef]
  36. Zeng, K.; Zhang, D. Recent progress in alkaline water electrolysis for hydrogen production and applications. Prog. Energy Combust. Sci. 2010, 36, 307–326. [Google Scholar] [CrossRef]
  37. Carmo, M.; Fritz, D.L.; Mergel, J.; Stolten, D. A comprehensive review on PEM water electrolysis. Int. J. Hydrogen Energy 2013, 38, 4901–4934. [Google Scholar] [CrossRef]
  38. Millet, P.; Mbemba, N.; Grigoriev, S.A.; Fateev, V.N.; Aukauloo, A.; Etiévant, C. Electrochemical performances of PEM water electrolysis cells and perspectives. Int. J. Hydrogen Energy 2011, 36, 4134–4142. [Google Scholar] [CrossRef]
  39. DIN EN 60751:2009-05; Industrial Platinum Resistance Thermometers and Platinum Temperature Sensors (IEC 60751:2008). German Version EN 60751:2008; Beuth Verlag GmbH: Berlin, Germany, 2009.
  40. Shi, G.; Tano, T.; Tryk, D.A.; Yamaguchi, M.; Iiyama, A.; Uchida, M.; Iida, K.; Arata, C.; Watanabe, S.; Kakinuma, K. Temperature Dependence of Oxygen Evolution Reaction Activity in Alkaline Solution at Ni–Co Oxide Catalysts with Amorphous/Crystalline Surfaces. ACS Catal. 2022, 12, 14209–14219. [Google Scholar] [CrossRef]
  41. Cheng, H.; Xia, Y.; Wei, W. Hydrogen production efficiency enhancement for alkaline water electrolyzers operating at varying temperature via an adaptive multi-mode control. Int. J. Hydrogen Energy 2024, 93, 430–440. [Google Scholar] [CrossRef]
  42. Tüysüz, H. Alkaline water electrolysis for green hydrogen production. Acc. Chem. Res. 2024, 57, 558–567. [Google Scholar] [CrossRef]
  43. Shanian, S.; Savadogo, O. Techno economic analysis of electrolytic hydrogen production by alkaline and PEM electrolysers using MCDM methods. Discov. Energy 2024, 4, 23. [Google Scholar] [CrossRef]
  44. Ursúa, A.; Gandía, L.M.; Sanchis, P. Hydrogen production from water electrolysis: Current status and future trends. Proc. IEEE 2012, 100, 410–426. [Google Scholar] [CrossRef]
  45. Zahra, R.; Moshtaghi, M.; Ruuskanen, V.; Kosonen, A.; Ahola, J.; Chatzichristodoulou, C.; Jensen, J.O.; Kannan, A.M.; Kauranen, P. Advances and challenges in intermediate temperature alkaline water electrolysis: A critical review. Renew. Sustain. Energy Rev. 2026, 228, 116569. [Google Scholar] [CrossRef]
Figure 1. Process of system development.
Energies 19 01894 g001
Figure 2. Schematic diagram of the 3 kW alkaline electrolyser test bench, including electrical series connection, parallel electrolyte circulation, thermal management, and gas conditioning system.
Energies 19 01894 g002
Figure 3. Experimental 3 kW alkaline electrolyser test bench in operation.
Energies 19 01894 g003
Figure 4. DAQ Diagram.
Energies 19 01894 g004
Figure 5. Data acquisition logic structure.
Energies 19 01894 g005
Figure 6. Electrolyte temperature evolution during operation without active cooling.
Energies 19 01894 g006
Figure 7. Experimental test at 0.3   A · c m 2 : (a) voltage and oxyhydrogen flow rate evolution over time; (b) inlet and outlet electrolyte temperature profiles demonstrating ON/OFF cooling system.
Energies 19 01894 g007
Figure 8. Voltage evolution over time at three current densities ( 0.3 , 0.5 , a n d   0.55   A · c m 2 ), showing transient behaviour and steady-state stabilisation under controlled thermal conditions.
Energies 19 01894 g008
Table 1. Specifications of the 3 kW alkaline electrolyser test bench.
ParameterValue
Nominal power3 kW
Number of electrolyser modules3
Number of cells per module12
Total number of cells36
Electrical configurationSeries
Electrolyte30 wt% KOH solution
Operating temperature60–80 °C
Maximum current60 A
Operating current range22.5–40 A
Nominal voltage~70 V
Flow measurementAlicat MS-20SLPM-D v0.5.0.
Cooling systemExternal antifreeze circuit (ON/OFF control)
Data acquisitionNI CompactDAQ (NI-DAQmx version 2024, Python version 3.12)
Table 2. Readings of sensors T1 and T2 from the experimentation.
SensorValue °CSensorValue °C
RTD117.488RTD218.857
RTD117.488RTD218.856
RTD117.488RTD218.855
RTD117.487RTD218.854
RTD117.487RTD218.853
RTD117.487RTD218.851
Table 3. Comparison of operating conditions and electrical characteristics with recent literature.
StudiesStopoverElectrolyteTemperature (°C)Current Density (A·cm−2)VoltagePressureObservations
[16]50 kWKOH (20–30%)60–800.2–0.61.8–2.2 V/cellVariablemodelling and experimental validation
[33]kW-scaleKOH60–800.2–0.5~2.0 V/cellAtmosphericImproved efficiency through dynamic control
[41]10 kWKOH60–850.3–0.6~1.8–2.2 V/cellAtmosphericThe effect of temperature on efficiency
[42]ReviewKOH (20–30%)60–900.2–0.5~2.0 V/cellAtmosphericState of the art in AWE
[43]Techno economicKOH60–900.2–0.61.8–2.2 V/cellAtmosphericComparative assessment: AWE vs. PEM
This work3 kWKOH 30%60–850.3–0.55≈60 V (stack)AtmosphericDAQ + temperature control ( 12   h stable)
Table 4. Statistical summary of steady-state operating conditions.
Time (h)Current (A)Flow Rate (SLPM)Inlet Temperature (°C)Outlet Temperature (°C)
113.01683.6381.674.2
219.05953.5281.173.8
318.68933.2880.273.7
418.48583.0480.974.5
519.16133.480.674.2
619.16133.281.174.3
719.16133.2180.974.2
Standard deviation0.29300.16780.35070.2950
Mean value18.95313.27580.7474.18
Coefficient of variation (%)1.555.120.430.4
Table 5. Comparison of implementation complexity, oscillation amplitude, and robustness.
CriteriaControl ON/OFF (Implemented)Alternative Strategies (MPC/Neural Networks)
Implementation ComplexityLow: Simple binary logic, without the need for complex mathematical models.High: Requires higher computational demands and precise system modelling.
Amplitude of OscillationsVariable: Significant at low loads (up to 25   ° C ), but minimal ( ± 1   ° C ) in steady state.Reduced: Allows minimising oscillations by anticipating the thermal dynamics of the electrolyser.
RobustnessHigh: Effective in directly preventing critical overheating.Dependent on the Model: Its effectiveness depends on the accuracy of the thermal model used.
Disclaimer/Publisher’s Note: The statements, opinions and data contained in all publications are solely those of the individual author(s) and contributor(s) and not of MDPI and/or the editor(s). MDPI and/or the editor(s) disclaim responsibility for any injury to people or property resulting from any ideas, methods, instructions or products referred to in the content.