Article

Market Assessment of Biomethane from Crop Residues in Ukraine: Techno-Economic Feasibility and Environmental Performance


1
School of Business, VIZJA University, 01-043 Warsaw, Poland
2
Department of Agricultural Markets and Quantitative Methods, Institute of Agricultural and Food Economics, National Research Institute, 20 Świętokrzyska St., 00-002 Warsaw, Poland
3
Department of Forms and Methods of Management in Agri-Food Complex of SO, Institute of Economics and Forecasting of National Academy of Sciences of Ukraine, 01011 Kyiv, Ukraine
4
School of Humanities and Arts, VIZJA University, Okopowa 59, 01-043 Warsaw, Poland
5
Department of Foreign Languages, Dmytro Motornyi Tavria State Agrotechnological University, 72-000 Zaporizhzhia, Ukraine
6
School of Social Sciences, VIZJA University, Okopowa 59, 01-043 Warsaw, Poland
7
Department of Insurance, Banking and Risk Management at Faculty of Economics, Taras Shevchenko National University of Kyiv, 03680 Kyiv, Ukraine
*
Author to whom correspondence should be addressed.
Energies 2026, 19(8), 1891; https://doi.org/10.3390/en19081891
Submission received: 20 February 2026 / Revised: 31 March 2026 / Accepted: 8 April 2026 / Published: 13 April 2026

Abstract

Global agriculture generates more than 5 billion tonnes of post-harvest crop residues each year, most of which remain unused for energy production. Within the broader landscape of advanced biomass and waste conversion technologies (thermochemical and biochemical pathways), producing biomethane from agricultural residues represents a complementary waste-to-energy route that converts decentralized feedstock into a standardized energy carrier. Mobilizing this agro-biomass for biogas/biomethane production via the anaerobic digestion of crop residues offers a promising instrument for decarbonizing agriculture, reducing greenhouse gas emissions, and advancing a circular bioeconomy. This study provides a techno-economic, environmental, and market assessment of biomethane production from post-harvest residues—specifically wheat and barley straw and maize stover—in Ukraine. We estimate the feedstock potential of crop residues and substantiate environmentally permissible removal levels accounting for soil organic matter requirements; we also characterize the role of digestate and biochar amendments in improving soil fertility, increasing mineral nitrogen availability, and enhancing crop yields. The results indicate substantial greenhouse gas mitigation potential relative to fossil natural gas. Practical recommendations are proposed to scale biomethane production from crop residues as part of Ukraine’s agricultural sustainability strategy. Under current cost and policy assumptions, many biomethane projects in Ukraine approach commercial viability, particularly in regions where damaged gas infrastructure creates local demand for a decentralized gas supply. The paper evaluates market assessment and investment feasibility of crop-residue biomethane scenarios under cost, regulatory, and infrastructure constraints. Overall, the findings suggest that agricultural residues can serve as a key feedstock for decarbonizing agriculture and biomethane-based energy systems in Ukraine.

1. Introduction

Global climate change is one of the key challenges facing society in the 21st century. Rapid growth in the use of fossil energy carriers, the destruction of forest ecosystems, and other anthropogenic activities have increased the concentration of carbon dioxide in the atmosphere by 50% and raised the mean annual surface temperature of the Earth by 1.1 °C compared to the mid-19th century. Achieving carbon neutrality requires policies and measures across most sectors of the economy, particularly the energy sector, which plays a pivotal role. Reducing fossil fuel use and increasing the share of zero-carbon energy sources will help cut global greenhouse gas emissions [1].
Alongside technological decarbonization solutions, increasing the resilience of agrolandscapes in Ukraine is increasingly associated with nature-based approaches, including agroforestry and the restoration of shelterbelts, which reduce erosion risks and support ecosystem services under climate pressure [2]. Accordingly, when assessing the potential of crop residues for biomethane production, it is critical to consider agro-ecological constraints on biomass removal and the spatial heterogeneity of soil degradation risks.
Agriculture is among the most energy-intensive sectors and relies heavily on fossil fuels. Greenhouse gas emissions from livestock, the use of mineral fertilizers, and the burning of agricultural residues remain major issues. Agriculture accounts for 20–24% of global greenhouse gas emissions [3], with the main sources being soil processes, mineral fertilizer application, energy use, animal husbandry, and organic matter degradation.
The rising energy demand, global challenges related to climate change, and the need to strengthen energy security underscore the importance of seeking renewable energy sources. Growing demand for such sources, the need to reduce greenhouse gas emissions, and the implementation of a circular economy make the use of agricultural residues (post-harvest residues, processing wastes, livestock wastes, and secondary biomass) for energy purposes increasingly relevant [4,5].
Agricultural residues generated during crop cultivation and processing are among the most accessible yet underestimated resources for bioenergy production [6]. Each year, global agriculture generates more than 5 billion tonnes of plant residues, only a small share of which is used as fuel, as organic fertilizer, or as an industrial feedstock. International studies estimate that agricultural residues comprise up to 60% of the total global biomass potential [7], and their energy equivalent could cover up to 20% of rural areas’ heat demand. A large portion of these residues, especially in countries with developed agriculture, is simply burned in fields, degrading air quality and increasing CO2 emissions, even though they could be used for energy without environmental harm [8].
Ukraine’s agricultural sector generates substantial biomass that often remains unused despite its high energy potential. Using these residues for bioenergy production offers opportunities to improve agricultural efficiency, optimize resource use, and reduce environmental impacts.
In Ukraine, the annual potential of agricultural residues is estimated at 25–35 million tonnes, of which 10–12 million tonnes can be utilized without impairing soil recovery [9]. This is comparable to the EU, where post-harvest residues account for up to 30% of resources used to produce bioenergy [10,11]. The concept for implementing state policy in the heat-supply sector in Ukraine envisages reaching a 40% share of renewables in heat production by 2035 [12]. In this context, the investment attractiveness of biomethane projects is determined not only by techno-economic parameters and regulatory conditions, but also by companies’ ability to integrate them into sustainable business models. Empirical results for leading Ukrainian companies prior to the outbreak of the war indicate a positive relationship between business-model sustainability and financial performance, thereby strengthening the case for investments in decarbonization solutions, including biomethane [13].
At the same time, the growth in the European biomethane market and emerging opportunities for injection and export create, for Ukraine, not only a climate imperative but also a market one: projects processing agricultural biomass need to be evaluated against renewable-gas market requirements and commercial feasibility parameters. Therefore, in addition to techno-economic assessment of the crop-residue potential, it is important to verify investment feasibility (NPV/IRR/PBP) under realistic assumptions regarding CAPEX/OPEX, logistics, and regulatory constraints, and to outline scenarios for positioning biomethane in domestic and export markets.
Replacing fossil fuels with bioenergy resources aligns with global trends in the green energy transition. Green energy has been identified as one of eight key sectors of the economy, whose reforms could lead to significant GDP growth over the next ten years. According to the International Energy Agency, bioenergy will play an important role in bringing greenhouse gas emissions to net zero: demand for bioenergy by 2030 will increase by almost 30% compared to 2020, and biofuel-based energy production by 2030 could become comparable to total energy generation from nuclear, solar, and wind power plants worldwide [14]. The substantial destruction of traditional energy capacity creates new opportunities for Ukraine to develop green energy, which may help strengthen the country’s energy resilience.
Despite a substantial body of research assessing the bioenergy potential of agricultural residues, including crop residues as a separate component, certain gaps remain. Many studies estimate crop-residue potential at the national or macro-regional level without accounting for the spatial heterogeneity of agricultural production [11]. In addition, logistical supply factors such as transport distances, feedstock density, road infrastructure availability, seasonal collection, and storage options are often overlooked, leading to the overestimation of technically accessible resources [15].
Competing uses of agricultural residues (animal bedding, mulching, returning organic matter to soil, on-site burning) are often represented in assessments using a fixed availability coefficient that does not account for regional differences in crop and livestock production structures and soil management practices [16,17].
Moreover, most studies rely on statistical estimates and do not account for annual yield variability, climate risks, and wartime factors, which are particularly relevant to Ukraine.
The main objective of this study is to provide a comprehensive assessment of the technical availability, economic efficiency, environmental impacts, and market understanding of biomass-to-bioenergy conversion technologies in Ukraine, with a focus on their potential to support the in-depth decarbonization of agriculture.
The object of this study is to assess biomethane production from post-harvest crop residues, considering the resource base, technological parameters, and economic efficiency of bioenergy facilities.
The central hypothesis of this study is that post-harvest residues generated during agricultural production represent a significant underutilized energy potential that can be used for biogas/biomethane production. Converting these residues into fuel enables energy efficiency, economic benefits, and reduced anthropogenic environmental impacts.
Furthermore, the study’s results indicate that agricultural residues, including crop residues, are a strategic resource for bioenergy development. Given their large volumes, environmental advantages, and economic efficiency, their utilization can serve as a basis for sustainable energy systems, contribute to energy independence, and reduce the agricultural sector’s carbon footprint.
Unlike previous studies, which have primarily focused on general issues in bioenergy development, this study emphasizes the prospects for bioenergy production from crop residues in Ukraine. This paper details three scenarios for assessing the feedstock potential of agricultural crop residues and the technologies used to convert them into bioenergy. The benefits and risks of using crop residues as biofuel feedstock are highlighted.
This study addresses gaps by developing an availability-oriented assessment of crop residues for biomethane production in Ukraine that accounts for agronomic constraints, environmental risks, and economic feasibility.

2. Methods and Materials

This study employs a comprehensive interdisciplinary approach to assess the energy potential of biomass from post-harvest residues in Ukraine. The study combines statistical and analytical data with an extensive review of the scientific literature, enabling the identification of key trends, constraints, and prospects for the use of agricultural residues, with crop residues treated as a distinct category.
The study’s methodological framework is structured and comprises several stages that combine different analytical approaches.
In the first stage, we characterize the most promising energy-use pathway for cereal crop residues: biogas and biomethane production. Biomethane production from residues is a strategic pathway for decarbonization.
Assessment of Cereal Crop Residues as a Feedstock Potential for Bioenergy
The feedstock base is a key factor in bioenergy development, as it determines the volume of biomass that is potentially available for bioenergy and biomethane production. In Ukraine, the main sources of agro-biomass are the post-harvest residues of cereal crops such as wheat, barley, and maize. Estimating the accessible potential of crop residues requires integrating quantitative data on grain yields, residue-to-product ratios (RPR), residue moisture content (MC), agro-ecological constraints, competing uses of residues, and losses during collection, transport, and storage.
RPR indicates the mass of crop residues generated per unit of the main product. For wheat and barley, straw typically equals 130–150% of grain mass; for maize, residues range from 100 to 210%. That is, for each tonne of grain, 1.3–2.1 t of dry residue mass is generated [18].
MC is the average moisture content of residues after harvesting and is used to convert wet mass to dry mass. The ranges used here (13–15% for cereal straw and 20–25% for maize residues) are commonly applied in global assessments of crop-residue potential [19].
AF is the share of crop residues that can be removed for energy use without degrading soils and taking alternative uses into account. Bioenergy project assessments often use a sustainable crop-residue removal rate that reflects the need to maintain soil fertility and organic carbon and minimize erosion. According to numerous studies, in temperate climates, this rate is about 30–50% of the total residue potential for cereals, and 30–60% for maize residues [11].
L is an aggregated coefficient of biomass losses across all harvesting and logistics stages. Losses during harvesting, baling, storage, and transport are typically 10–20% of the total residue mass (an empirical assumption in techno-economic models). Losses due to mechanical handling, material left in the field, spillage, and similar causes are standard practical adjustments. This parameter is often set based on field data and practical experience [11].
The feedstock potential calculation is as follows:
Rusable = Y × RPR × (1 − MC) × AF × (1 − L)
where Y is the yield of the main product (t of grain);
RPR is the crop-specific residue-to-product ratio;
MC is the residue moisture content;
AF is the fraction available for energy use;
L is losses during logistics/collection.
The feedstock potential of crop residues (dry mass) was calculated by the authors for wheat, maize, and barley, using baseline parameters (RPR, MC, AF, L) and data from the State Statistics Service of Ukraine for 2024.
At the second stage, we provide a techno-economic assessment of biogas/biomethane production from crop residues. The economic feasibility analysis includes capital expenditures (CAPEX), operating expenditures (OPEX), residue logistics and collection costs, the energy efficiency of the technologies, the levelized cost of energy (LCOE), and the project payback period (PBP).
Within the study, two energy products are distinguished: raw biogas and upgraded biomethane, which differ in their composition, technological processing stages, and areas of application.
Biogas is considered the primary product of the anaerobic digestion of organic feedstock, particularly post-harvest residues. The main components of biogas are methane (CH4) and carbon dioxide (CO2), as well as impurities such as hydrogen sulfide (H2S), ammonia, and water vapor. Its composition may vary considerably depending on the type of feedstock, the fermentation conditions, and process duration. Biogas is generally used to produce heat and electricity at the local level, for example in cogeneration units, or as an intermediate product for further processing.
Biomethane is defined as purified and upgraded biogas with a high methane content (usually above 95%), suitable for injection into the gas distribution network or for use as an environmentally friendly motor fuel. The process of obtaining biomethane involves several technological stages, including the removal of CO2, H2S, water vapor, and other impurities, ensuring compliance with natural gas quality standards. Purified biomethane is characterized by stable energy properties and a wider range of applications compared with raw biogas.
The process of obtaining these energy products includes two key technological stages: the production of biogas through the anaerobic digestion of organic feedstock with control of technological parameters (temperature, pH, process duration, and feedstock composition), and the upgrading of biogas to biomethane, which involves the use of various purification technologies—absorption, membrane, cryogenic separation, or adsorption—for removing CO2, H2S, water vapor, and other undesirable components. This approach increases the transparency of the study and provides a clear understanding of the potential differences between the use of raw biogas and biomethane.
The economic performance of biogas production from crop residues was assessed using the discounted cash flow (DCF) methodology, which is widely applied to evaluate bioenergy investment projects. The main indicators selected were levelized cost, net present value (NPV), internal rate of return (IRR), and payback period (PBP), consistent with current approaches to bioenergy project appraisal.
Economic Evaluation Methodology: Calculations were performed for a baseline scenario with a 20-year plant operating life, corresponding to the typical service life of major process equipment, and a 10% discount rate, reflecting the weighted-average cost of capital for renewable-energy projects.
CAPEX encompasses all costs associated with construction and equipment procurement required to bring a biogas plant into operation. It includes process equipment, civil and installation works, feedstock preparation, utility connections, engineering networks, design and surveys, contingencies/reserves, licenses and permits, and engineering services.
CAPEX values were adapted from scientific publications, where calculations were based on equipment costs, construction and installation works, feedstock preparation infrastructure, utility connections, project design and permitting, and a contingency reserve. Equipment costs were about EUR 2.4 million; construction and installation were estimated at 30% of equipment costs [20,21,22] (EUR 0.72 million); feedstock preparation and storage infrastructure at EUR 0.4 million [23]; utility connection and site works at EUR 0.25 million [24]; and design and permitting at EUR 0.15 million [25,26]. A 10% contingency reserve was included to account for project risks, resulting in total capital expenditures of approximately EUR 4.0 million. The initial investment is assumed to occur in year 0.
OPEX is the recurring expenditures required to operate and maintain biogas and biomethane plants. These include feedstock collection and transport, energy for mixing and heating, labor, maintenance, chemical additives, and administrative costs. For agricultural residues, OPEX is strongly influenced by logistics and the seasonal variability of feedstock supply.
The OPEX of a biogas plant using crop residues (straw) is defined as the sum of equipment operation and maintenance costs (O&M) and feedstock supply costs (collection, storage, and transport of agricultural residues):
OPEX = O&M + Cfeedstock
where O&M are operation and maintenance costs.
In the scientific literature, the discount rate used to assess the economic feasibility of technological projects is typically derived from the weighted average cost of capital (WACC), which accounts for the financing structure, the cost of equity and debt, and project implementation risks. This approach is standard in the financial analysis of investment decisions and is widely applied in techno-economic models for renewable energy technologies [27].
The methodology assumes constant annual production volumes and unchanged operating costs. Actual values may vary due to feedstock seasonality, price fluctuations, and logistics conditions, suggesting the need for further sensitivity analyses.
The baseline scenario assumes an annual production of 5.2 million m3 of biogas from agricultural crop residues, mainly cereal straw. This output corresponds to a medium-scale, stand-alone biogas plant and is used as a scenario assumption to evaluate the project’s techno-economic performance.
This value is consistent with assessments of Ukraine’s crop-residue resource potential, which indicate that the aggregate theoretical biogas production potential from this biomass type is approximately 5.2 billion m3 per year. Thus, the baseline scenario represents only a small share of the national potential and reflects a realistic level of local feedstock availability for a single bioenergy facility [16].
Current market assessments indicate that techno-economic justifications [28] often assume average prices for biomethane exports to Europe of around EUR 0.9/m3. In revenue calculations, we used the biogas sales price.
LCOE is the average levelized cost of producing a unit of energy over the plant’s lifetime. It accounts for both capital and operating expenditures, discounted to present value.
LCOE = C A P E X × r 1 1 + r n + O P E X E a n n u a l
where Eannual is the annual amount of energy produced (for biogas or biomethane), m3/year or MWh/year.
For biomethane (LCOBm), this indicator represents the total investment and operating costs, expressed as EUR/m3 CH4 or EUR/m3 biomethane, allocated over the total gas volume produced during the plant’s lifetime.
LCOE indicates the minimum energy price at which the project recovers all investment and operating costs over its service life.
The technical potential for biomethane production is relatively high, particularly for maize residues. The environmental benefits outweigh the negative impacts on soil when residue removal rules are followed, and the option is economically efficient for medium- and large-scale projects.
NPV (net present value) is a key indicator of an investment project’s economic efficiency and reflects the present value of the total discounted future cash flows minus the initial capital investment. NPV accounts for the time value of money and allows for an assessment of whether a project increases in economic value relative to alternative investments.
In the context of biomethane production from crop residues, a positive NPV indicates that discounted revenues from biomethane sales exceed total investment and operating costs over the plant’s full life cycle.
For a constant annual cash flow, the formula can be expressed as an annuity:
NPV   =   CF · 1 ( 1 + r ) n r     CAPEX ,
NPV is used as a base criterion for investment decision-making and also as a basis for determining IRR (the discount rate at which NPV = 0); a criterion for calculating LCOE/LCOBm as a break-even price; and an indicator of the long-term financial sustainability of a bioenergy project.
Thus, NPV integrates all key economic parameters (CAPEX, OPEX, production volume, product price, and risks) into a single summary indicator, enabling an objective evaluation of the economic feasibility of biomethane production from agricultural residues.
IRR enables the assessment of the investment attractiveness of biomethane production, the comparison of biomethane projects with alternative renewable energy technologies, and the testing of the sensitivity of economic outcomes to changes in prices, costs, and production volumes.
IRR indicates the project’s efficiency.
NPV (IRR) = 0
0 = t = 1 n C F t 1 + I R R t CAPEX ,
where t is the operating year number.
The IRR is determined by numerically solving NPV = 0, which corresponds to the generally accepted methodology for the financial and economic appraisal of investment projects in renewable energy [29].
Therefore, IRR is an important complement to NPV and provides an interpretation of economic analysis results in terms of investment risk and expected return.
PBP (payback period) is the time required to recover the initial capital investment through the cumulative net cash flows generated by the project.
Calculation formula:
PBP   =   C A P E X C F
PBP characterizes the speed of capital recovery and serves as an indicator of an investment project’s liquidity and short-term financial risk.
At the third stage, we present the environmental assessment. Specifically, we describe the counterfactual scenario used to estimate emission reductions and explain the role of digestate as a valuable organic fertilizer.
The functional unit in the study is 1 Nm3 of biomethane (CH4) at standard conditions, as Nm3 CH4 is the most appropriate unit for comparison with natural gas, analyses of injections into the gas transmission system, and assessments of fossil-fuel substitution.
For system boundaries, a ‘cradle-to-use’ approach was applied, including the following stages: the collection of crop residues (baling, loading, on-farm operations); the transport of feedstock to the biogas plant (typical distance 30–50 km); anaerobic digestion (AD) including energy use, own consumption, and emissions; cleaning and upgrading biogas to biomethane quality (CO2 removal, compression); injection into the gas grid or end use (including compressor energy consumption); and digestate management (storage, field application, mineral fertilizer substitution, where applicable).
The counterfactual scenario represents alternative resource use in the absence of a biomethane project. It is used to quantify GHG reductions relative to the baseline. Two baseline variants are considered:
1. Substitution of Fossil Natural Gas: Biomethane substitutes natural gas in the gas distribution network.
Emission reductions are calculated as
Δ GHG = GHGNG − GHGBM,
where GHGNG are the greenhouse gas emissions from natural gas per 1 Nm3 CH4,
GHGBM is the life cycle of GHG emissions of biomethane per 1 Nm3 CH4.
For GHGBM calculations, we used data adapted from the following sources: NG emissions—2.75 kg CO2-eq/Nm3 CH4 [30]; methane losses during AD and upgrading—2.4% of CH4 [31]; transport and residue collection emissions—0.15 kg CO2-eq/Nm3 CH4 [32]; digestate credit − 0.50 kg CO2-eq/Nm3 CH4 [33].
GHGBM = EFCH4_loss + EFN2O_loss + EFproduction − Creditdigestate,
where EFCH4_loss is methane losses as a percentage of produced CH4;
EFN2O_loss is emissions associated with digestate/fertilizer application;
EFproduction is GHG emissions from residue collection, transport, and shredding;
Creditdigestate is an emission reduction resulting from the substitution of mineral fertilizers.
Methane losses EFCH4_loss = 2.4% × 2.75 = 0.066 kg CO2-eq/Nm3 CH4.
GHGBM = 0.066 + 0.15 − 0.50 = −0.284 kg CO2-eq/Nm3 CH4
The negative value indicates that biomethane production offsets more CO2-equivalent emissions than it creates due to the digestate credit.
Δ GHG = GHGNG − GHGBM = 2.75 − (−0.284) = 3.034 kg CO2-eq/Nm3 CH4.
Using biomethane from crop residues instead of natural gas reduces total GHG emissions by approximately 3.03 kg CO2-Eq per Nm3 CH4. The primary contributor to the reduction is the digestate credit, which offsets emissions from collection and methane losses.
2. Alternative Fate of Crop Residues: Residues remain in the field (slow mineralization) or are burned on site (uncontrolled emissions). In this case, additional CH4 and N2O emissions that were avoided but would occur in the absence of digestion are considered. Methane leakage is accounted for at all critical stages: anaerobic digestion, upgrading, compression, and injection. The assumed range is >1–3% of produced CH4.
The calculation of leakage impacts using methane’s global warming potential was adapted from the following sources [34]:
GWP100(CH4) = 27.2–29.8 CO2-eq
According to [34], the life cycle of different energy technologies should be analyzed considering all greenhouse gases on a CO2-equivalent basis (GWP100), enabling a proper comparison of biomethane with fossil fuels within LCA. This also allows for an evaluation of how sensitive environmental results are to plant operational discipline.
Using digestate in agriculture can improve soil quality and water-holding capacity, increase nutrient availability, and reduce the need for mineral fertilizers, thereby lowering N2O emissions. Digestate replenishes nutrients because it contains nitrogen (10–12%), phosphorus (3–5%), and potassium (4–6%).
When digestate is applied as an organic fertilizer in agriculture, a system-expansion approach is used that accounts for the substitution of mineral nitrogen, phosphorus, and potassium fertilizers. According to LCA studies, the digestate GHG credit can reduce total specific biomethane emissions by about 7.5 g CO2-eq/MJ, even accounting for potential N2O and NH3 emissions during storage and field application [33].
From an LCA perspective, this means that the biomethane system avoids emissions associated with the production (particularly nitrogen), transport, and application of synthetic fertilizers, thereby yielding a negative contribution to the GHG balance, known as the digestate GHG credit [35].
The digestate GHG credit is calculated as [35]
GHGdigestate = GHGavoided fertilizers − GHGapplication,
where GHGavoided fertilizers are emissions that do not occur because digestate substitutes for synthetic fertilizers.
GHGapplication accounts for the additional emissions arising from the use of digestate in the field.
When reliable data are unavailable, a conservative approach is applied: no credit is granted.
Methane leakage during biomethane production and upgrading is a key factor determining the overall greenhouse-gas reduction balance across the biomethane life cycle. Given methane’s higher global warming potential compared to carbon dioxide, even small CH4 losses can significantly affect the total GHG emissions of bioenergy systems.
According to recent LCA studies, methane slip during biogas upgrading to biomethane quality is typically around 1% of the produced biogas, consistent with values reported for membrane and water-scrubbing upgrading technologies [36]. At the same time, empirical measurements at operating agricultural biogas plants indicate that total methane losses across the technological chain (reactor, gas storage, upgrading, compression) can reach about 2.4%, reflecting the effects of operating conditions, the level of technical control, and equipment design features [31].
Thus, the results of the GHG analysis of biomethane production from crop residues depend strongly on assumptions about methane leakage rates and digestate management options.
Within the life-cycle assessment of biomethane production from post-harvest crop residues, additional environmental impact categories were considered: Acidification potential (AP) and eutrophication potential (EP). Acidification potential was determined on the basis of the total emissions of acidifying substances, particularly ammonia (NH3), nitrogen oxides (NOx), and sulfur dioxide (SO2), which may be generated during biomass transport, the anaerobic digestion process, and digestate use. Eutrophication potential was assessed based on the potential losses of nitrogen and phosphorus compounds that may enter aquatic ecosystems during digestate storage and land application.
The indicators are determined using the following formulas:
AP = ∑ (Ei × CFi), kg SO2-eq.
EP = ∑ (Ei × CFi), kg PO43—eq.
where Ei is the emissions of substance i.
CFi is the characterization factor expressing the impact equivalency of that substance [37].
The authors substantiate the importance of biochar, whose application improves soil fertility, increases mineral nitrogen content, and can increase crop yields by up to 40%.
The methods of comparative analysis, information systematization, and assessment were used.
The conclusions from this study formed the basis for strategic recommendations to ensure the sustainable development of Ukraine’s bioenergy sector. Bioenergy from crop residues contributes to agricultural decarbonization, improved energy security, circular economy development, and the development of low-carbon energy systems.
The methodological approaches applied in this study ensure the reliability and reproducibility of the results while maintaining their relevance in both national and international contexts. All data used in the study were obtained from authoritative open-access sources, thereby ensuring the objectivity of the analysis and the accuracy of the conclusions presented.
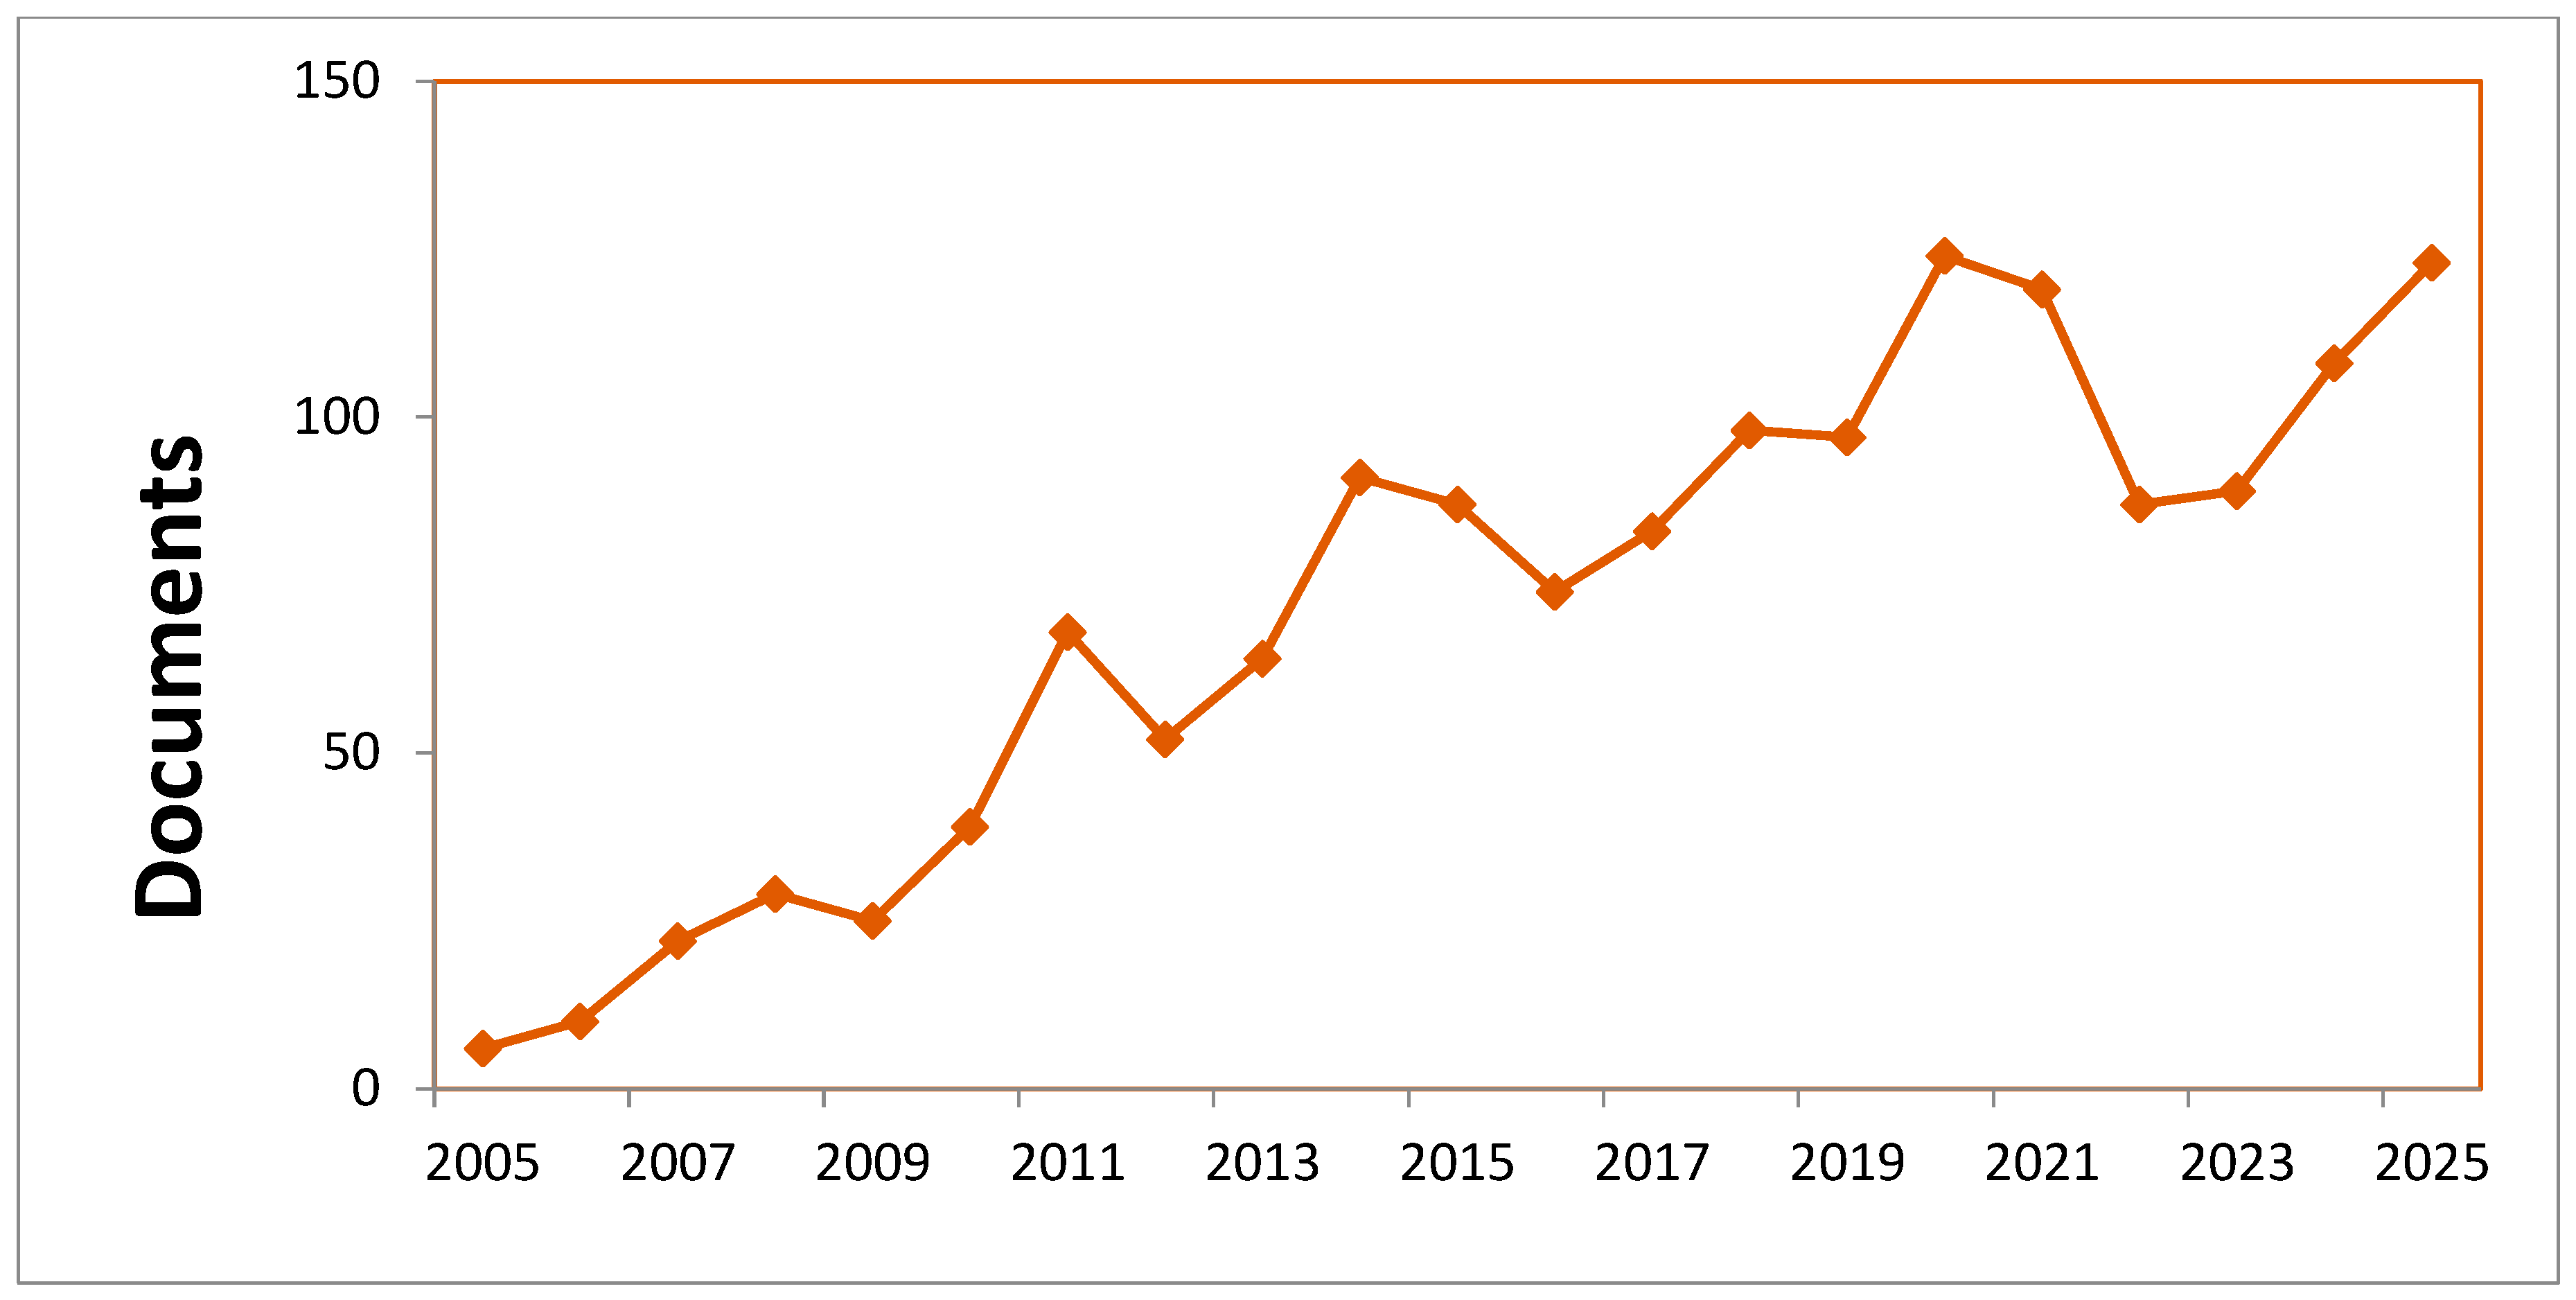
One of the fundamental stages of this study was a systematic review of the scientific literature conducted using the Scopus database with the search query (‘crop residues’ and ‘bioenergy’ or ‘Ukraine’). The search returned 1495 publications (as of 13 February 2026), of which 320 were published over the last three years (since 2023), confirming the growing research interest in bioenergy amid the ongoing full-scale war (Figure 1).
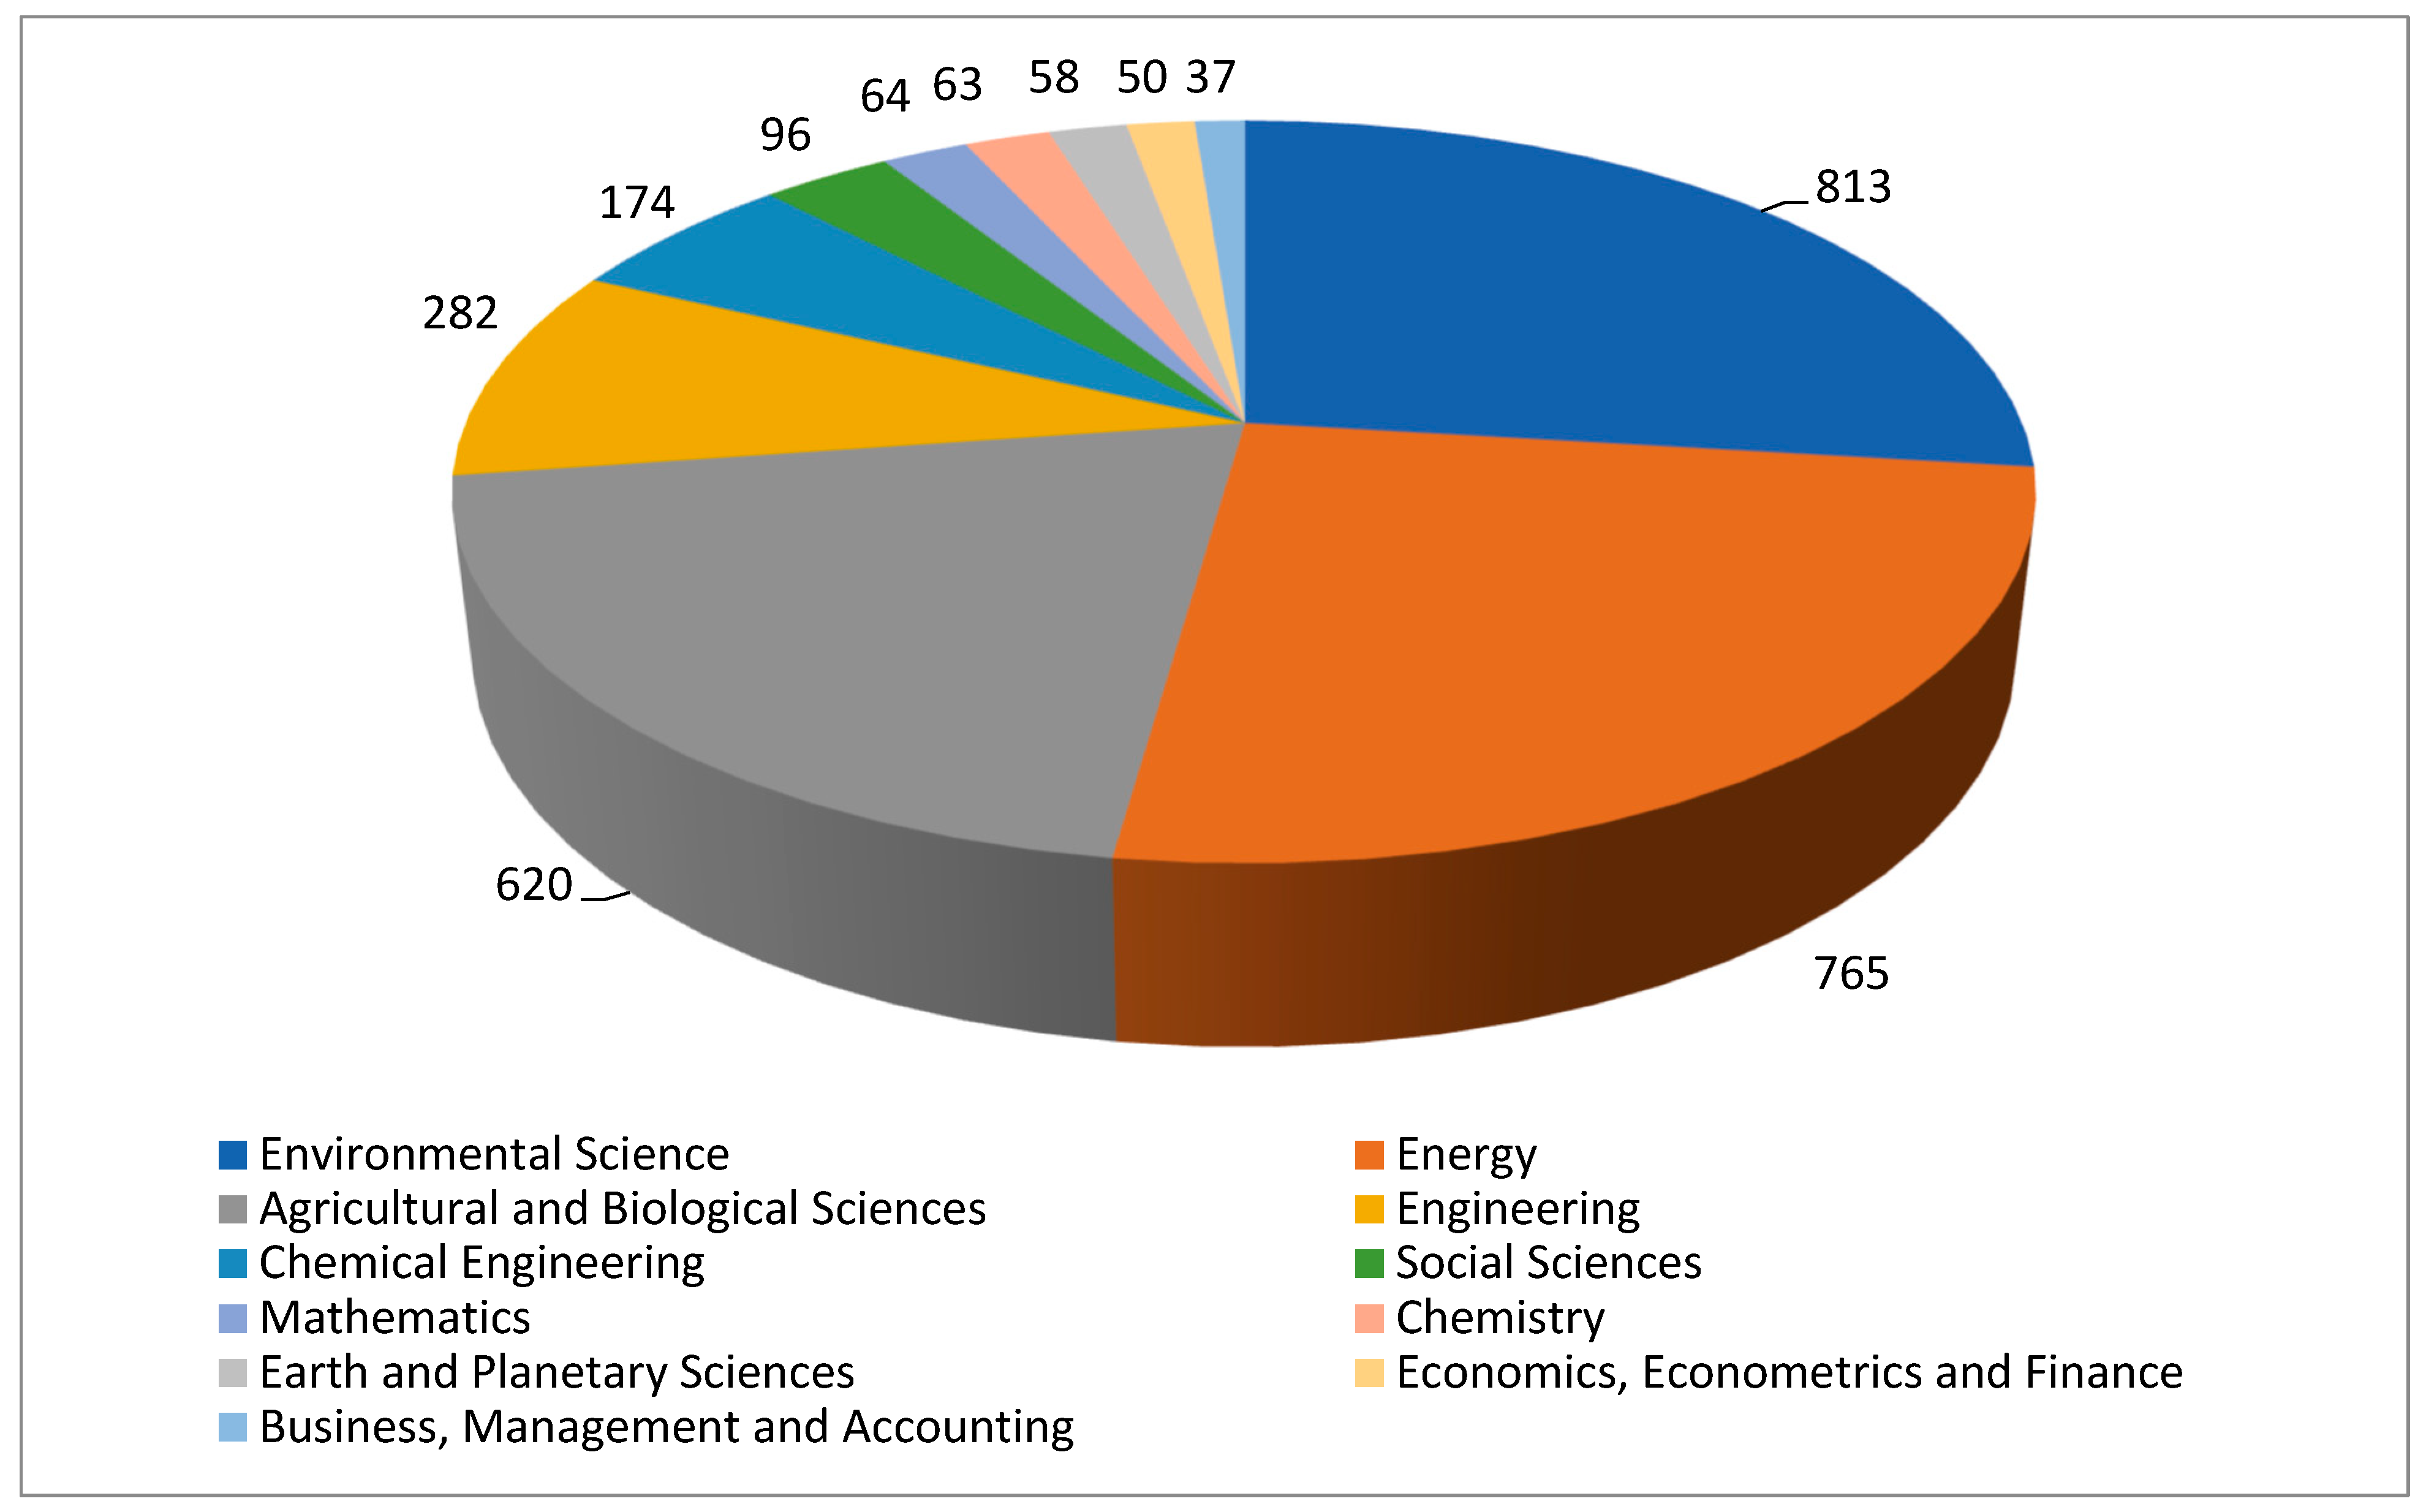
However, over the last three years, only 146 of the 320 scientific papers were directly related to the energy sector, and 107 addressed bioenergy development in the context of Ukraine’s agricultural sector, including during the wartime period (Figure 2).

3. Results

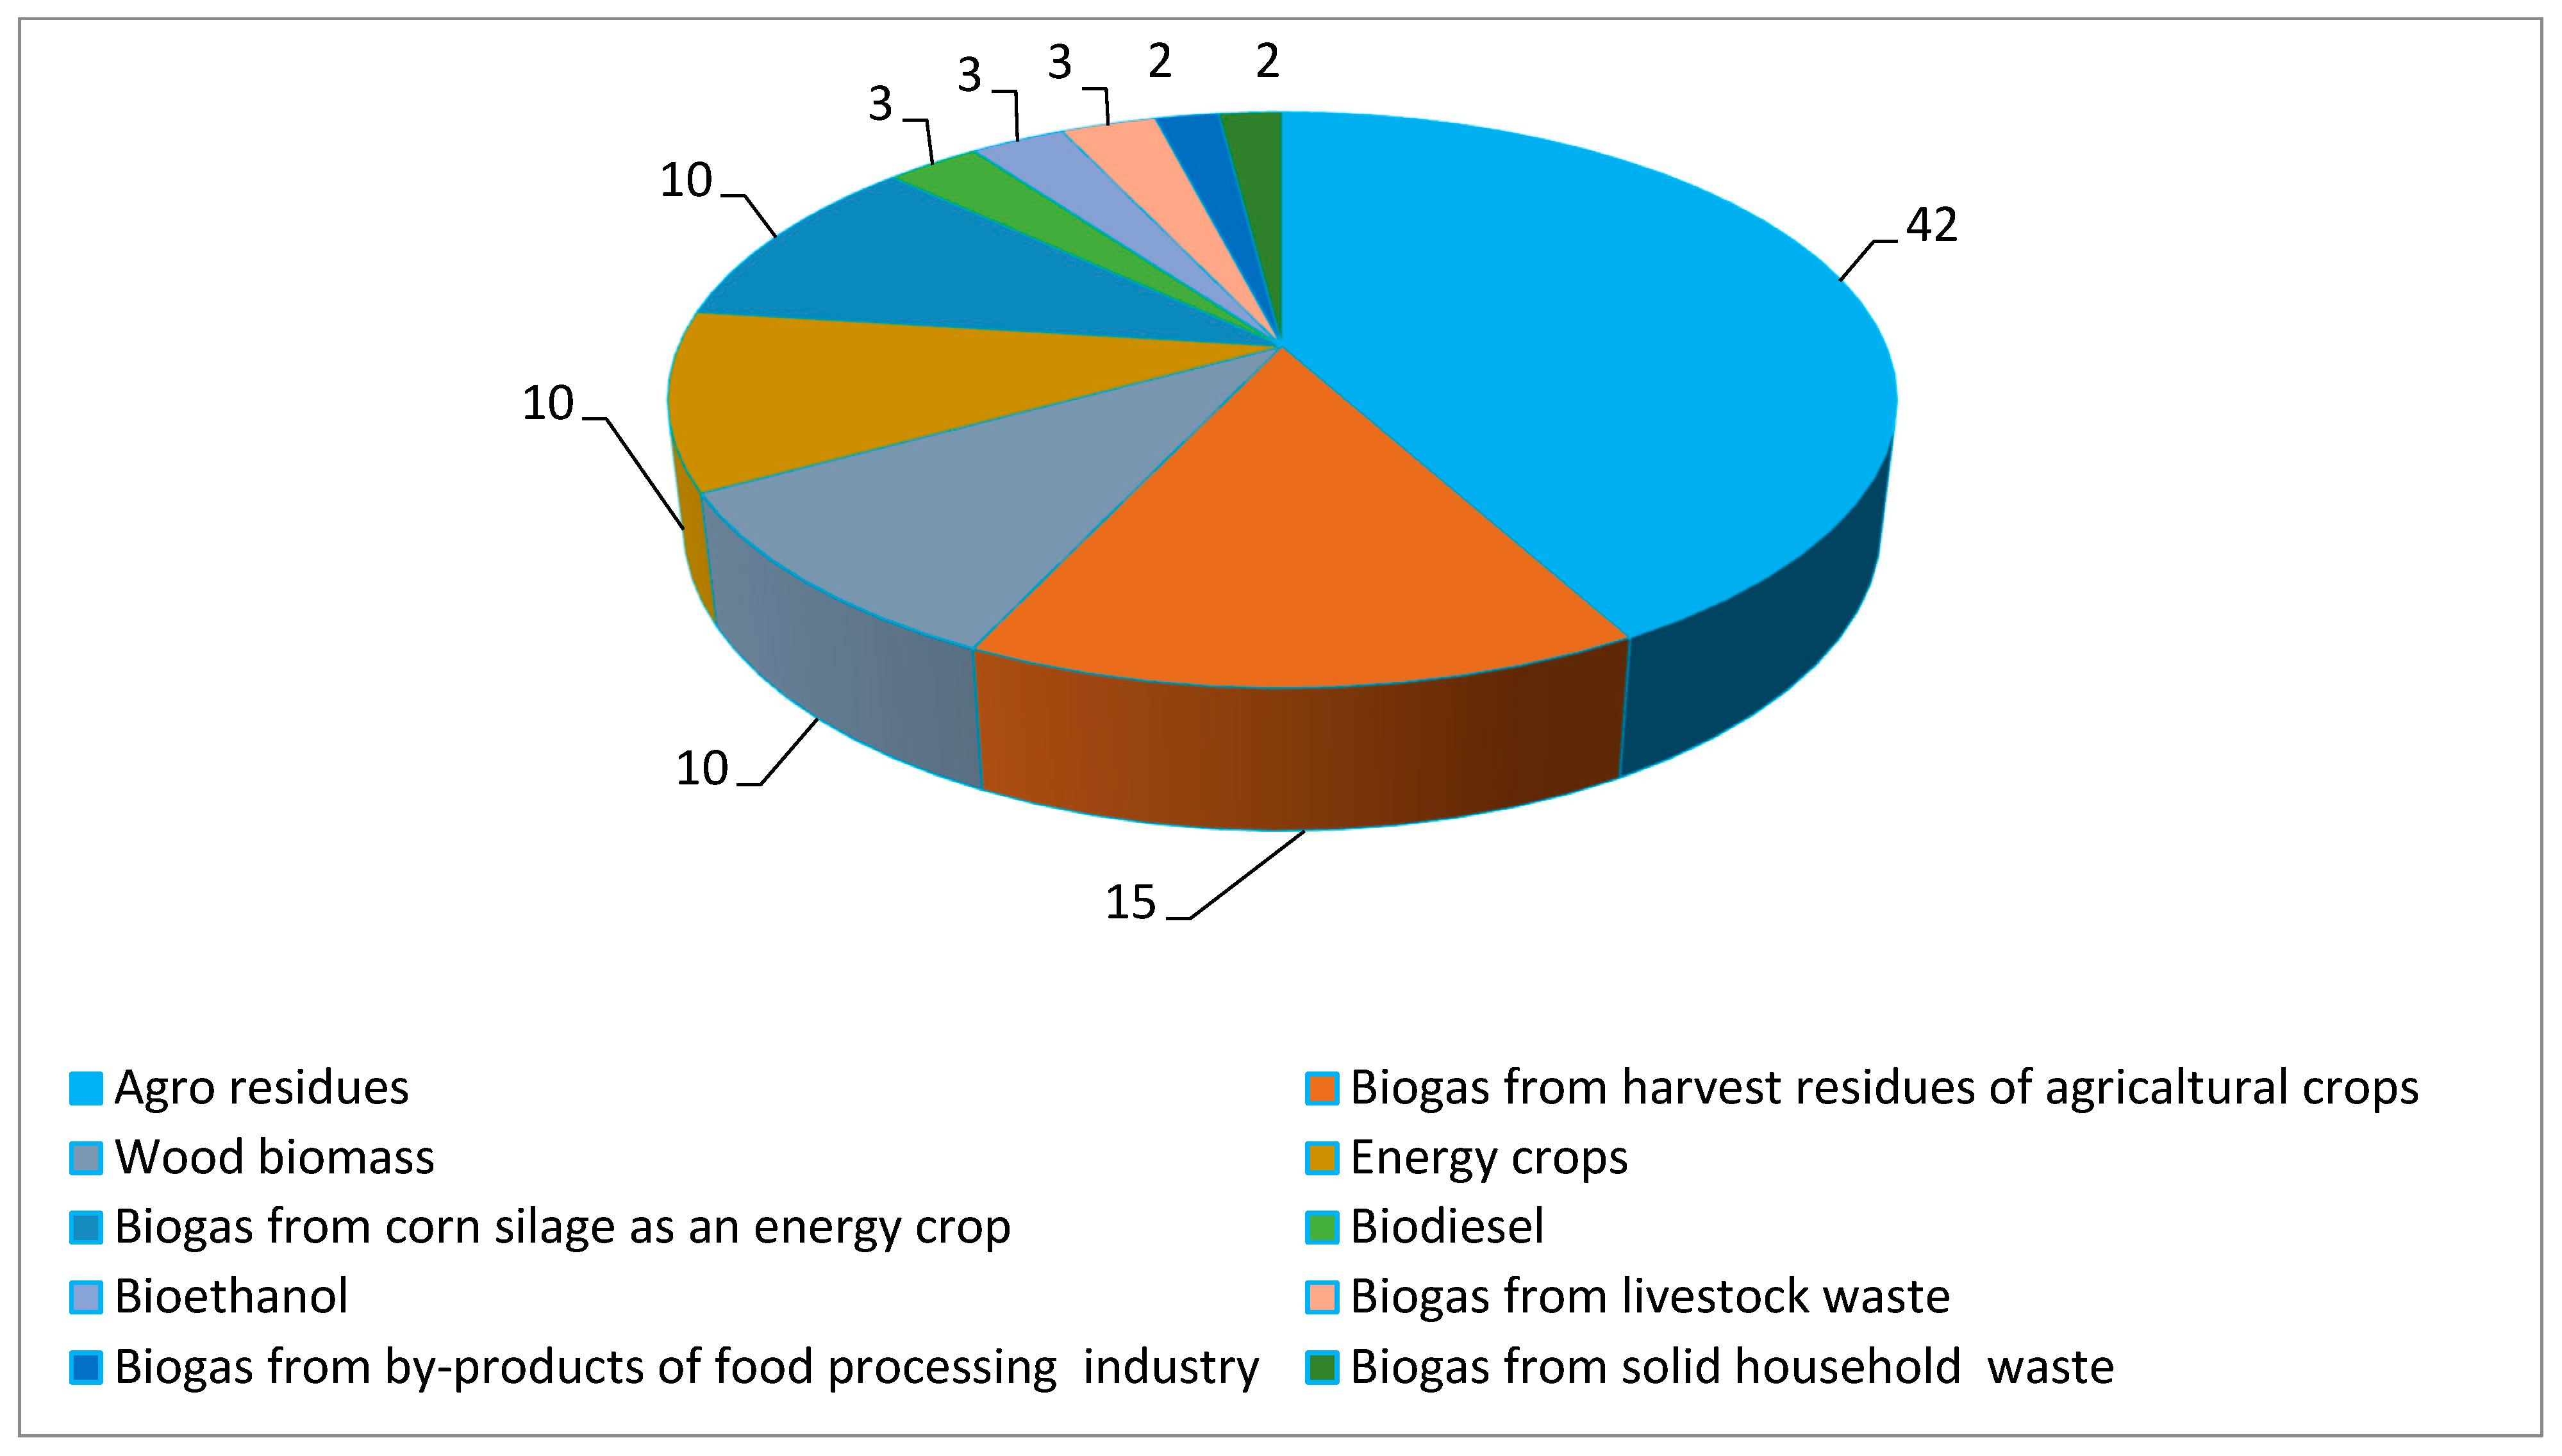
According to the latest estimates from the Bioenergy Association of Ukraine, agricultural residues remain the primary source of biomass in Ukraine, accounting for approximately 42% of the total bioenergy potential (Figure 3) [38,39].
Post-harvest crop residues constitute a distinct component of agricultural residues generated after the main crop is harvested. They include cereal straw, maize, sunflower, and rapeseed stalks, chaff, and other plant residues that remain in the field after harvest. These biomass resources are characterized by seasonality, substantial generation volumes, and high organic matter content, making them an important potential source of renewable energy. The volumes of post-harvest crop residues generated depend on the structure of sown areas, crop yields, harvesting technologies, and the agronomic features of crop production.

3.1. The Most Promising Pathway for Energy Use of Crop Residues Is Biogas and Biomethane Production

Biogas is a mixture of gases produced as a result of anaerobic methanogenic fermentation of a substrate and consists of methane (55–75%), carbon dioxide (25–45%), hydrogen sulfide, and impurities of hydrogen, ammonia, nitrogen oxides, and other gases [40].
Feedstock for biogas production via methanogenic fermentation can be any biomass that contains a sufficient share of biologically degradable organic matter (Table 1).

3.1.1. Estimate the Feedstock Potential of Crop Residues

To estimate the feedstock potential of crop residues, we use three variants of typical parameter values together with statistical data from the State Statistics Service of Ukraine. In 2024, gross grain harvests were 23.5 million t of wheat, 24.1 million t of maize, and 5.3 million t of barley [42].
Scenario 1 (minimum). Calculations use the lowest parameter values: RPR (wheat) and RPR (barley) = 1.3; RPR (maize) = 1.0; moisture: MC (cereal straw) = 13%, maize residues = 20%; availability (AF) = 0.3; losses (L) = 0.10.
Crop-residue calculation:
Wheat:
Theoretical residue volume:
RPRwheat × Y = 23.5 × 1.3 = 30.55 million t.
Dry mass after moisture adjustment:
30.55 × (1 − 0.13) = 26.58 million t.
Volume available for energy use:
26.58 × 0.30 = 7.98 million t.
Accounting for losses:
7.98 × (1 − 0.10) = 7.18 million t.
Thus, the accessible potential of wheat straw is about 7.2 million t of dry mass.
Maize:
Theoretical residue volume:
RPRmaize × Y = 24.1 × 1.0 = 24.1 million t.
Dry mass after moisture adjustment:
24.1 × (1 − 0.20) = 19.28 million t.
Accessible volume:
19.28 × 0.30 = 5.78 million t.
Accounting for losses:
5.78 × (1 − 0.10) = 5.2 million t.
Thus, the accessible potential of maize residues is about 5.2 million t of dry mass.
Barley:
Theoretical residue volume:
RPRbarley × Y = 5.3 × 1.3 = 6.89 million t.
Dry mass after moisture adjustment:
6.89 × (1 − 0.13) = 5.99 million t.
Accessible volume:
5.99 × 0.30 = 1.80 million t.
Accounting for losses:
1.80 × (1 − 0.10) = 1.62 million t.
Thus, the accessible potential of barley straw is about 1.6 million t of dry mass.
Overall, approximately 14.0 million t of dry biomass can be mobilized for bioenergy without adversely affecting agroecosystems.
Scenario 2 (baseline). Medium typical values were used: RPR (wheat) and RPR (barley) = 1.4; RPR (maize) = 1.5; moisture: MC (cereal straw) = 14%; maize residues = 22%; availability AF = 0.4; losses L = 0.15.
Crop-residue calculation:
Wheat :   RPR wheat = 9.6 million t . Maize :   RPR maize = 9.6 million t . Barley :   RPR barley = 2.2 million t .
Accessible dry-biomass potential under this scenario: 21.4 million t.
Scenario 3 (maximum). The highest typical values were used: RPR (wheat) and RPR (barley) = 1.5; RPR (maize) = 2.1; moisture: MC (cereal straw) = 15%; maize residues = 25%; availability AF for cereal straw = 0.5, for maize residues = 0.6; losses L = 0.2.
Crop-residue calculation:
Wheat :   RPR wheat = 12.0 million t . Maize :   RPR maize = 18.2 million t . Barley :   RPR barley = 2.7 million t .
The attainable dry-biomass potential for wheat, maize, and barley under Scenario 3, based on 2024 data, is 32.9 million t.
The second and third scenarios are optimal for mobilizing crop residues for bioenergy without harming soils and the environment.

3.1.2. Calculation of Operating Expenditures

Operating expenditures (OPEX) include operation and maintenance costs as well as feedstock-related costs.
In bioenergy projects, O&M is typically assumed to be 3–6% of CAPEX (excluding feedstock costs) [43].
O&M = CAPEX × kO&M
Assumptions
CAPEX = EUR 4.0 million . k O & M = 4.5 % ( typical value for biogas plants ) . O & M = 4000 × 0.045 = EUR 180 thousand / year ( including staff , auxiliary electricity consumption , repairs , reagents , and insurance ) .
Feedstock cost calculation (agricultural residues) includes the following:
1. Calculation of Feedstock Demand (Straw).
The mass of straw required to deliver the target biogas production volume is determined by
M straw = Q b g Y b g ,
where Qbg is the annual biogas/biomethane production volume, m3/year.
Ybg is the specific biogas yield from straw, m3 biogas per t of dry matter.
Typical specific biogas yield from straw: about 350 m3 biogas per t of dry matter.
Q bg = 5.2 million m 3 / year ; Y bg = 350 m 3 / t ; M straw = 5,200,000 / 350 = 14,900 t / year .
2. Cost of Collection, Storage, and Transport.
For straw in Ukraine, a typical range is EUR 30–40/t (collection, baling, storage, and delivery within 30–50 km) [44].
C straw = EUR 35 / t . C feedstock = 15,000 × 35 = EUR 525 thousand / year .
Total operating expenditures (OPEX):
OPEX = 180 + 525 = EUR 705 thousand/year.
Annual operation and maintenance costs were estimated at 4.5% of total capital expenditures, equal to EUR 180 thousand per year. Feedstock costs were estimated based on an annual straw demand of approximately 15,000 t (Mstraw) and an average cost of EUR 35 per tonne (Cstraw), yielding EUR 525,000 per year (Cfeedstock). Therefore, total operating expenditures (OPEX) are EUR 705 thousand per year.

3.1.3. Calculation of LCOE

Next, we calculate LCOE, which indicates the minimum energy price at which the project recovers all investment and operating costs over its lifetime.
Example application to biomethane:
CAPEX = EUR 4 million, OPEX = EUR 0.705 million/year, r = 10%, n = 20 years.
Eannual = 5.2 million m3/year of biogas, corresponding to 2.92 million m3/year of biomethane after upgrading.
Calculation of the annualized present value of CAPEX:
CAPEX annual   =   4.0   0.1 1 1.1 20   EUR   0.47   million / year . LCOE   =   0.47 + 0.705 2.92   EUR   0.4 / m 3 .
Thus, a biomethane price above EUR 0.4/m3 makes the project economically viable.

3.1.4. Calculation of Net Present Value

To calculate net present value (NPV), several steps are required, as follows: estimate the annual revenue, net cash flow, and the present value of cash flows.
Annual revenue is defined as the product of the volume of biogas produced and its sales price:
Revenue = Vbg × Pbg,
where Vbg is the annual biogas/biomethane production volume, m3/year.
Pbg is the biogas sales price, EUR/m3.
Revenue = 2.92 × 106 × 0.9 = EUR 2.628 million/year.
Net cash flow (CF) for each operating year is calculated as
CF = Revenue OPEX CF = EUR   2628   thousand EUR   705   thousand = EUR   1923   thousand/year .
Next, we calculate the present value (PV) of the cash flows, i.e., the value of future cash flows discounted to the present, accounting for the time value of money.
In investment project financial analysis, PV is used to compare revenues and costs across different operating years on a common time basis. PV indicates the present value of the future cash flow stream.
Formula for a constant annual cash flow (annuity):
PV   =   CF   ×   ( 1     ( 1 + r ) t r ) PV   =   1,923,000   ×   ( 1     ( 1.10 ) 20 0.10 )   =   1,923,000   ×   8.514   =   EUR   16.37   million . ( 1.10 ) 20   =   0.1486
Final NPV calculation:
NPV = 16.37 − 4.00 = +EUR 12.37 million.
Thus, at a sales price of EUR 0.9/m3, the crop-residue biogas project shows a strongly positive NPV (+EUR12.37 million), indicating high financial attractiveness given stable demand and long-term contracts. The result highlights the critical role of pricing policy and support mechanisms in ensuring the economic viability of bioenergy projects. Such an NPV level is consistent with scenarios involving biogas upgrading to biomethane or energy sales in premium-price segments rather than the base raw-biogas market.

3.1.5. Calculation of IRR

IRR is defined as the discount rate at which net present value equals zero.
For an annuity cash-flow stream,
CAPEX = CF   ×   1 1 + r 20 r
4.0 = 1923   ×   1 1 + r 20 r
C A P E X C F = 4.0 1923 = 2.08
Therefore,
1 1 + r 20 r = 2.08 .
Thus, IRR = 44%. This IRR indicates extremely high profitability in this scenario due to the combination of relatively low capital costs and a high product sales price (EUR 0.9/m3). Such an IRR is atypical for conventional biogas projects and corresponds to scenarios with premium prices or additional support mechanisms (biomethane, guarantees of origin, CfD).
Simple payback period (PBP):
PBP   =   4000 1923   =   2.1   year .
The investment would be recouped in two years, indicating a quick return on investment and high profitability for the project at a price of EUR 0.9/m3.
To assess the financial robustness and reliability of the biomethane production project based on post-harvest crop residues, a quantitative one-factor sensitivity analysis of key economic and technological parameters was conducted. The analysis covers critical factors such as the market price of biomethane, CAPEX, OPEX, methane yield per unit of feedstock, methane leakage rate, and feedstock availability. For each parameter, a baseline value, as well as optimistic and pessimistic scenarios, were considered to reflect possible variations under real-world conditions, as shown in Table 2.
The results presented in Table 2 show how changes in each parameter affect NPV, IRR, and payback period, enabling identification of the most critical risk factors. This approach provides a more realistic assessment of the project’s economic efficiency, demonstrates the range of possible financial outcomes, and enhances the methodological robustness of the conclusions, which is particularly important given the regional heterogeneity of agro-climatic conditions, soil organic carbon levels, and infrastructure availability.
Thus, biogas production from post-harvest residues is an economically justified solution that combines energy efficiency with the rational use of agricultural resources.
Upgrading biogas to biomethane increases investment costs but yields a product with a higher market value and more flexible end uses (grid injection, transport, cogeneration). There are no universally applicable technological solutions for biogas production, as they depend on the feedstock type, composition, and volume.
Upgrading biomass to biomethane involves removing undesirable components from raw biogas, such as hydrogen sulfide, ammonia, and siloxanes, before enrichment (CO2 removal). The pre-cleaning of biogas from hydrogen sulfide and water vapor is performed within the biogas plant. For biomethane production, a typical biogas plant is equipped with a biogas cleaning and upgrading unit, a biomethane quality-monitoring unit, and a unit for injecting biomethane into the gas grid [45].
From an economic perspective, biomethane production is competitive when feedstock is available at a moderate price, residue collection infrastructure exists, supportive policies are in place (feed-in tariffs, quotas, decarbonization premiums, carbon credits), and co-products can be used holistically (heat, electricity, biomethane, and fertilizer: digestate) [46,47].
For Ukraine, techno-economic indicators (CAPEX/OPEX, LCOE/LCOG) fall within ranges consistent with European practice and may be competitive under appropriate market incentives.
A comparison of the obtained techno-economic results with data from scientific publications indicates their overall consistency with current estimates for biomethane projects in Europe. In particular, the production cost of biomethane usually ranges from EUR 40 to 120/MWh (EUR 0.4–1.2/m3), depending on the feedstock type, plant scale, and logistics costs [45]. Studies confirm that the LCOE of biomethane produced from agricultural waste and post-harvest residues typically ranges from EUR 70 to 140/MWh (EUR 0.7–1.4/m3), depending on the upgrading technology and logistics efficiency [48,49]. In addition, studies on the use of lignocellulosic feedstock indicate that pretreatment and logistics costs substantially influence the economic efficiency of biomethane projects [50,51]. This is consistent with the results of this study, in which the cost structure and production scale determine the key economic indicators.
The values obtained in this study fall within the cited ranges, confirming the realism of the assumptions adopted for CAPEX and OPEX. At the same time, the results are consistent with the International Energy Agency Bioenergy’s analytical assessments [52,53], which point to the high share of capital expenditures in the cost structure of biomethane and the considerable variability of economic indicators depending on the system’s technological configuration. Thus, the comparison confirms that the economic estimates obtained align with current scientific approaches and may be considered justified in the European context, especially for projects focused on the use of agricultural residues.

3.1.6. Calculation of Biomethane Production Potential

We estimate biomethane production potential (m3 CH4/year) based on the previously obtained accessible dry biomass potential for 2024, using the following:
BM = MDM × BMP
where BM is the biomethane potential, m3 CH4/year; MDM is the accessible dry mass of crop residues, t dry matter/year; and BMP is the specific methane yield (biochemical methane potential), m3 CH4 per t DM.
For agricultural residues, global biogas assessments use the following average BMP values: wheat straw 190–210 m3 CH4/t DM; barley straw 180–200; and maize stover 210–230 m3 CH4/t DM [54].
For the baseline scenario (without optimistic assumptions), we adopt the following: wheat, 200 m3 CH4/t DM; maize, 220 m3 CH4/t DM; and barley, 190 m3 CH4/t DM (conservative mean values typical of lignocellulosic biomass without deep pretreatment).
For biomethane potential calculations, we use the accessible dry-mass values for 2024 under Scenario 2 (baseline): wheat, 9.6 million t; maize, 9.6 million t; and barley, 2.2 million t.
Average specific methane yield values are used.
Wheat (straw):
BMwheat = 9.6 × 106 × 200 = 1.92 billion m3 CH4/year.
Maize (crop residues):
BMmaize = 9.6 × 106 × 220 = 2.1 billion m3 CH4/year.
Barley (straw):
BMbarley = 2.2 × 106 × 190 = 0.4 billion m3 CH4/year.
Thus, according to the authors’ calculations, residues from wheat, maize, and barley produced in Ukraine in 2024 could generate approximately 4.42 billion m3 of biomethane per year under conservative assumptions regarding residue availability and methane yields. The largest contribution comes from maize residues (approximately 50%), followed by wheat straw (approximately 40%), whereas barley straw plays a secondary role.
It should be noted that 4.42 billion m3 of biomethane is comparable to 4.42 billion m3 of natural gas, amounts to up to 30% of Ukraine’s pre-war domestic gas consumption, and is obtained only from residues of three crops (excluding energy crops and livestock waste).
Environmental Assessment
Using agricultural residues for bioenergy has a significant decarbonization effect when they are substituted for fossil fuels, reducing methane emissions from uncontrolled decomposition, and preventing the open burning of crop residues, a common problem in many agricultural regions [55]. Life-cycle assessments of biogas/biomethane production from agricultural residues show greenhouse-gas reductions of 60–120% compared with conventional fuels, depending on system configuration and co-product use [56,57].
An additional environmental benefit is the production of digestate, which can be used as an organic fertilizer, thereby promoting circularity in agricultural systems and reducing reliance on synthetic fertilizers. At the same time, environmental performance depends on the sustainable removal of residues from fields; excessive removal can adversely affect the balance of soil organic matter. Therefore, modern studies emphasize the principles of ‘environmentally safe removal’ [11,55].
As a quantitative illustration of the digestate GHG-credit formula, an example from LCA studies of biogas systems can be provided. According to [32], avoided emissions from mineral fertilizer substitution are about 10–12 g CO2-eq/MJ of biogas, whereas additional emissions associated with digestate application are about 2–4 g CO2-eq/MJ. Accordingly, the net digestate GHG credit is about 7.5 g CO2-eq/MJ. Converted per unit volume, this corresponds to roughly 0.27 kg CO2-eq per 1 Nm3 CH4, which is consistent with other LCA estimates for agricultural biomethane systems [31].
The system boundaries of the assessment include the main stages of the technological chain: the collection and preparation of post-harvest crop residues, the transportation of biomass to the biogas plant, the anaerobic digestion process, the purification and upgrading of biogas to biomethane quality, the storage and use of digestate as an organic fertilizer, as well as the transportation and final use of biomethane as a substitute for fossil natural gas. This approach makes it possible to more comprehensively account for all major sources of emissions and environmental impacts within the life cycle of the bioenergy system.
The environmental assessment was complemented by the AP and EP impact categories, which enable the assessment not only of climatic impacts but also of other important environmental aspects of the biomethane production system’s operation.
For a comprehensive assessment of the environmental impact of biomethane production within the LCA framework, the AP and EP indicators were calculated using wheat straw as an illustrative example. The calculations were performed for the functional unit of 1 m3 of biomethane, based on typical emissions arising from technological processes associated with feedstock delivery, anaerobic digestion, and digestate treatment.
AP was assessed based on the total emissions of acidifying substances, particularly ammonia (NH3), nitrogen oxides (NOx), and sulfur dioxide (SO2). EP was determined as the cumulative impact of nitrogen (N) and phosphorus (P) losses to the environment [58].
Selected data used for the calculation of AP, EP, and GWP for the production of 1 m3 of biomethane from straw are presented in Table 3.
As a result, AP for the production of 1 m3 of biomethane from straw is estimated at approximately 0.0048 kg SO2-eq./m3, while EP is estimated at approximately 0.0019 kg PO4-eq./m3. These additional indicators complement conventional data on greenhouse gas emission reductions and provide a more comprehensive description of the environmental profile of the biomethane production system. The use of multidimensional indicators is a generally accepted practice in contemporary LCA studies of biogas/biomethane for understanding the full range of environmental consequences, including the acidification and nutrient loading of ecosystems.
Within the life-cycle assessment of biomethane production, methane (CH4) leakage during the storage and handling of liquid manure, as well as credit for the reduction in these emissions, were accounted for using average values proposed in the literature [58]. According to the calculations, GWP is 0.0075 kg CO2-eq. The specific CH4 emission values depend on the technological parameters of manure handling, such as storage duration and storage method, as well as on climatic conditions that affect emission rates. The use of standardized coefficients enables a comparison of the results and assesses the contribution of reduced emissions from liquid manure to the overall environmental profile of biomethane production.
Methane (CH4) leakages reflect the contribution of technological solutions to global warming potential and account for emissions during liquid-manure storage, whereas credits for their reduction reflect the decrease in emissions due to co-digestion or optimized manure storage.
This approach enables more accurate representation of the overall environmental impact of implementing biomethane production technologies using post-harvest crop residues. As a result, expanding the life-cycle assessment boundaries and using multidimensional environmental indicators ensures a more complete and reliable evaluation of the environmental impact of bioenergy systems.
To assess the effect of methane leakage on total greenhouse gas emissions in biomethane production from post-harvest crop residues, a sensitivity analysis of methane leakage (1–5%) was carried out. Since methane has a high global warming potential, even small variations in its leakage rate can substantially affect the system’s environmental performance.
Table 4 presents total GHG emissions under different methane leakage scenarios, enabling assessment of the sensitivity of the LCA results to this parameter and the possible range of environmental impacts.
Table 4 demonstrates how different methane leakage scenarios affect total greenhouse gas emissions in biomethane production from post-harvest crop residues. The baseline scenario with a leakage rate of 2.4% shows total emissions of 320 t CO2-eq., with methane emissions accounting for the largest share. When leakage is reduced to 1%, total emissions decline to 250 t CO2-eq., which demonstrates a substantial environmental benefit even with a relatively small reduction in methane losses.
By contrast, increasing the leakage rate to 5% results in total emissions of 450 t CO2-eq, exceeding the baseline scenario by 40%. This highlights the high sensitivity of the LCA results to changes in methane leakage, given its large global warming potential (GWP). Thus, even a moderate increase in leakage can substantially reduce the system’s greenhouse gas mitigation efficiency, which must be taken into account when planning production technologies and methane monitoring systems.
When biogas is converted to biomethane, a large amount (30–40%) of carbon dioxide remains; this can be used in greenhouse crop production. CO2 stimulates earlier and more active flowering and increases yields. This is why greenhouses are often built near biomethane plants [45].
Market Assessment
The global biomethane market is developing rapidly, particularly in Europe, where biomethane is regarded as a key element of the energy transition, transport decarbonization, and the decarbonization of gas grids. Support is implemented through mechanisms such as feed-in tariffs (FITs), green premiums, renewable gas certificates, carbon credits, and industrial decarbonization programs [61]. In several EU and North American countries, biomethane is being integrated into gas networks under clear quality standards.
Demand for biomethane is also growing due to strategic energy priorities related to reducing dependence on imported natural gas, developing low-carbon transport (CBG/LBG), and expanding the renewable-gas market. Forecasts suggest that by 2030–2040, biomethane will play an increasing role in rural economies and agricultural energy systems, enabling the integration of agriculture into modern energy markets [11,62].
Overall, producing biogas and biomethane from crop residues combines high technological maturity, economic feasibility (given efficient logistics and policy support), significant environmental benefits, and favorable market prospects. It contributes to agricultural decarbonization, improved energy security, the development of the circular economy, and the formation of low-carbon energy systems.

3.2. Technologies for Converting Crop Residues into Energy

Biochemical Technologies
Anaerobic digestion is the decomposition of organic matter by microorganisms in the absence of oxygen. Key stages include the following: hydrolysis—the conversion of complex polymeric materials into simple soluble compounds available to other microorganisms; acidogenesis—the conversion of sugars and amino acids into hydrogen, carbon dioxide, ammonia, and organic acids; acetogenesis—the conversion of organic acids into ammonia, acetic acid, carbon dioxide, and hydrogen; and methanogenesis—the conversion of these products by methanogenic archaea into carbon dioxide and methane (CH4 formation) [63,64].
AD is the most widely used method for converting agricultural waste into energy as biogas. Lignocellulosic materials have limited bioavailability due to their structure and require pretreatment [65,66].
Different pretreatment methods are used: mechanical (size reduction to 10–20 mm), thermal (120–180 °C), chemical (alkaline treatment), and combined methods.
The complex structure (cellulose + hemicellulose + lignin) requires the disruption of biopolymers before digestion. Effective methods include: mechanical comminution → +15–30% gas yield; thermo-chemical treatment (e.g., alkaline) → +40–80%; and biological methods (white-rot fungi) → +10–25% [67,68].
Studies report average methane yields of lignocellulosic substrates such as wheat straw 180–250 m3 CH4/t DM [69]; maize stalks 200–280 m3 CH4/t DM [66,70]; and sunflower stalks 160–220 m3 CH4/t DM. Values vary substantially depending on the fiber structure, lignin content, and the applied pretreatment.
With anaerobic digestion, biogas typically contains 55–60% CH4, while biomethane contains about 97% CH4 after upgrading.
The anaerobic digestion process involves the sequential interaction of different groups of microorganisms that ensure the stepwise decomposition of complex organic compounds into simpler products. Each stage is characterized by specific microbial consortia, biochemical reactions, and optimal environmental parameters that determine the efficiency of biogas formation. The main stages of anaerobic digestion, their microbiological features, the main reaction products, and the optimal process conditions are summarized in Table 5.
Thermal Technologies
Thermochemical processes include pyrolysis (300–700 °C) for producing biochar, bio-oils, and syngas; gasification—the conversion of biomass at 800–1200 °C with limited oxygen supply; and combustion, which is the simplest but least efficient technology.
The effective use of biomass to generate heat and electricity marks the onset of a fourth energy transition in Ukraine. The first three transitions—from firewood to coal, from coal to oil, and from oil to natural gas—are virtually completed.
Currently, depending on biomass moisture, two technologies for converting biomass energy into fuel can be considered. One promising route for processing biomass to enable the effective use of the resulting products as fuels in existing equipment is pyrolysis. A limiting factor for pyrolysis is the requirement that external heat is supplied to operate the process, which significantly increases the cost of pyrolysis products. Researchers note that biomass pyrolysis can also proceed in an autothermal mode. That is, it is sufficient to initially heat the biomass to a specified temperature; thereafter, the process continues automatically due to its own heat release. Straw pyrolysis is also exothermic, releasing heat [71].
The heat supplied to the feedstock (Q) is used for moisture evaporation (Q1), heating to the temperature at which active biomass decomposition begins (Q2), heating to the end of the carbon-residue formation process (Q3), and losses with volatile products (Q4).
Q = Q1 + Q2 + Q3 + Q4 + QTE
The process will be autothermal when the magnitude of the thermal effect exceeds the sum of the required heat inputs for pyrolysis. Thus, Equation (1) can be transformed into Equation (2), which represents the condition for the autothermal pyrolysis of biomass:
QTE = Q1 + Q2 + Q3 + Q4
The thermal effect for straw in the 235–575 °C temperature range is 1475 kJ/kg. The total thermal effect depends on the moisture content of the biomass. At a moisture content of 30.5%, the heat requirement equals the thermal effect. This value can be considered a threshold for autothermal straw thermal processing. Table 6 presents indicators that affect the implementation of pyrolysis for specific biomass types [71].
Gasification is the thermochemical conversion of biomass at high temperatures with limited oxygen, producing syngas (CO, H2, CH4) that can be used to generate electricity, heat, or synthetic fuels [72].
The direct combustion of residues is used in boilers, CHP plants, and boiler–turbine units to generate heat or electricity in cogeneration systems.
Autothermal pyrolysis technology enables the production of high-quality biochar fertilizer from agricultural wastes. Biochar has attracted increasing global interest in recent years due to its ability to increase agricultural yields by 30–40% in some cases [73]. Applying biochar to soil substantially increases mineral nitrogen content [74], thereby reducing the need for nitrogen fertilizers and, consequently, the use of natural gas in nitrogen-fertilizer production. Unique properties of biochar include [73]: improved soil structure; accelerated plant growth; increased availability of Ca, Mg, P, and K in soil; improved retention of soil moisture and nutrients in the root zone; prevention of soil clumping; enhanced nutrient uptake by roots; and improved soil fertility. In one production cycle, both biofuel and fertilizer are produced, helping to reconcile environmental and financial trade-offs in the agricultural sector.
Global researchers report that, in arid regions of Oregon, adding 10 tonnes of biochar per acre to wheat cultivation increased soil pH and increased yields by nearly 30%. In South America, farmers use biochar when growing young cocoa trees to halve the time required to begin harvesting cocoa pods [75].
Applying biochar to soil reduces nutrient leaching, thereby reducing the need for additional fertilization and saving fertilizer costs. In the longer term, biochar may become an important component of carbon farming; its use can accelerate access to carbon certificates and related compensation.

4. Discussions

Bioenergy from agricultural residues, including crop residues, is a key instrument for decarbonizing the agricultural sector. It reduces emissions, creates new income streams for farmers (biogas, pellets, biomass), increases energy independence, and supports closed resource cycles. At the same time, it requires investment in infrastructure and technologies (e.g., gasification, anaerobic digestion), entails environmental challenges (e.g., soil conservation), and requires clear policies and market incentives to scale [76].
For Ukraine, particularly important factors include the large residue resource base, high demand for substituting imported gas, the opportunity for integration into the European biomethane market, and the economy’s agricultural orientation.
Ukraine has one of the largest agricultural biomass potentials in Europe. About 35–40 million tonnes of crop residues are generated annually. Of these, it is economically feasible to use 12–15 million tonnes, equivalent to 5–7 billion m3 of biomethane per year or 30–40 TWh of heat. This could substitute a significant share of imported natural gas.
Leaving plant residues on fields helps avoid losses of soil organic carbon and improves soil fertility and erosion protection. Fertility improvement occurs through improved soil structure and water-holding capacity, the stimulation of beneficial microorganisms, and enrichment of the soil with organic matter and nutrients (nitrogen, phosphorus, potassium, microelements, etc.). At the same time, removing part of the residues enables their use to produce heat and/or electricity, solid biofuels (pellets or briquettes), biogas/biomethane, or livestock feed or bedding [76,77].
The findings of international studies were grouped by the authors into three crop-residue removal scenarios:
Scenario 1: Removing crop residues at a rate of 20% results in minimal loss of soil organic carbon. Researchers report that returning residues to soil significantly increases organic carbon stocks compared to removal (an 11.3% increase in soil organic carbon, SOC, with residue return) [78].
Scenario 2: Removing 30% of crop residues reduces soil organic carbon [79].
Scenario 3: Removing crop residues at a rate of 40% reduces soil organic carbon to a risky threshold unless it is compensated for. Researchers indicate that significant residue removal can reduce SOC in topsoil by about 11% [80].
Thus, partial removal (e.g., up to 30–40%) does not threaten soil carbon if residue return or compensation with organic amendments (digestate, biochar) is ensured to maintain long-term SOC.
To prevent soil degradation, it is recommended to remove no more than 30–50% of residue mass (30–40% of straw to preserve humus; ≤50% of maize stover on soils with sufficient organic matter). Excessive removal can reduce humus, impair the water regime, increase erosion, and reduce yield. Digestate and biochar amendments should be used to restore soils.
Therefore, removing some of the plant residues does not pose a threat to soil if the normative limit of up to 40% is respected and digestate and biochar are applied as organic fertilizers. Under such conditions, humus levels decrease by less than 0.1% per year, and the nutrient balance remains neutral or positive.
Studies indicate that agricultural residues are a stable and large feedstock source for biogas and biomethane production [46]. European countries have already successfully integrated biomethane into gas transmission networks, using it to substitute natural gas in transport, industry, and energy [81].
Wheat straw and maize stalks are optimal substrates for anaerobic fermentation. Table 7 shows the biogas yields for different types of crop residues.
According to IEA estimates [55], Ukraine has one of the largest biomethane potentials in Europe owing to its well-developed agricultural sector. At the same time, researchers note that the economic efficiency of biogas complexes largely depends on logistics, seasonality, and the availability of by-product feedstock [39].
According to the Bioenergy Association of Ukraine, the estimated biomethane potential from crop residues is 5.2 billion Nm3 CH4 per year. A significant share of this potential is associated with maize stover (48.0%) and wheat straw (27.3%). Regionally, the biomethane potential of plant residues in each oblast ranges from 10 to 447 million Nm3 CH4/year, with the highest values in central and northern Ukraine and the lowest in western Ukraine. Table 8 presents the biomethane potential from crop residues by region.
Operating Ukrainian biomethane plants use a feedstock base that includes livestock wastes (manure, poultry litter), maize silage, sugar beet pulp, and other agricultural residues, and may include some crop residues. The scientific literature does not report cases in which crop residues are the sole or dominant feedstock for biomethane production. For example, VITAGRO Group, with facilities located in Khmelnytskyi, Rivne, Volyn, Ivano-Frankivsk, and Kyiv oblasts, uses agricultural residues including crop residues together with animal wastes to produce about 3 million m3/year of biomethane (2024) [82], and Hals Agro, with facilities in Chernihiv and Kyiv oblasts, produces about 3 million m3/year of biomethane from manure, maize silage, and sugar beet pulp (2023–2025) [83]. In these projects, crop residues are treated as part of the overall feedstock mix rather than as an exclusive feedstock.
The Ministry of Energy of Ukraine reported that Ukrainian producers can now export biomethane to Europe via the Ukrainian gas transmission system. This opens new markets for Ukrainian bioenergy producers and supports the country’s integration into the European energy system [84].
Biomethane meets two criteria at once: the export of high-value products and the absence of major logistics problems. The bioenergy sector continues to grow even during the war.
Biogas and biomethane production from agricultural feedstocks is regarded as a strategic direction for the EU; according to REPowerEU, the biomethane potential from waste could exceed 35 billion m3 by 2030 [85].
According to expert assessments and analytical studies, the biomethane market could expand significantly by 2030 due to technological progress and expansion of the feedstock base. Production could increase to 1.5 billion m3 of biomethane per year; biorefineries could be established in regions with high feedstock concentration; and biogas complexes could be integrated into dairy farms and grain farms to optimize logistics and improve gas production efficiency [86].
According to the National Bioenergy Development Plan, as of early 2024, Ukraine had 68 biogas plants with a total electrical capacity of approximately 135 MW and 24 solid-fuel (biomass) power plants with a total capacity of approximately 178 MW. This corresponds to a total bioenergy capacity of about 319 MW in the biomass and biogas sectors (excluding occupied territories) [87].
Using crop residues in bioenergy has both advantages and risks. The advantages of converting residues into bioenergy include: environmental benefits-reduced greenhouse gas emissions; waste utilization and reduced soil and water pollution; reduced risk of stubble burning in fields; economic benefits, such as an additional income for agricultural producers; the creation of local energy markets; and reduced dependence on imported energy. Incorporating crop residues into the energy cycle creates additional revenue streams for agricultural enterprises, stimulates the development of local energy markets, and reduces energy dependence. In many regions, economic efficiency is improved by the lower mineral fertilizer and waste-disposal costs; agronomic benefits include returning nutrients to the soil via digestate, improving soil structure, and enabling integration into farm systems.
The risks of using crop residues include the need for lignocellulose pretreatment, seasonality, logistics and storage requirements, the need for compliance with agro-ecological biomass removal norms, and the high upfront capital costs for bioenergy installations. The lignocellulosic nature of agricultural wastes makes them challenging for biochemical conversion but also more resilient and accessible than energy crops.
Given these benefits, agro-biomass becomes an important component of the sustainable development of rural areas.
The market deployment of bioenergy value chains requires developing logistics and infrastructure and formulating supportive policies. Researchers note that the market potential of agricultural residues in Ukraine during 2020–2022 was approximately 9.4 Mtoe, representing about 43% of the country’s total biomass potential [39,88].
Study Limitations and Sources of Uncertainty
Limitations of Input Data: Calculations of feedstock, energy, and economic potential are based on the generalized statistical and scientific literature data. Specifically, yield values, crop-residue ratios (RPR), moisture, losses during collection and transport, and biomethane yield parameters (BMP) are taken as the average or as a range typical of Ukraine. Actual values can differ substantially depending on the specific farm, year, soil and climatic conditions, and crop production technologies.
Regional Heterogeneity: Because Ukraine exhibits considerable agro-climatic and structural diversity, the spatial distribution of crops and the requirements for crop residues for bedding and for returning organic matter to the soil differ significantly across regions. In this study, these differences are captured only indirectly through the biomass availability coefficient; a detailed regional residue-use balance was not determined.
Uncertainty of Feedstock-Potential Parameters: Crop-residue potential is sensitive to parameters such as the residue-to-product ratio (RPR), residue moisture content (MC), losses during collection/storage/transport, and the share of biomass that can be removed without harming soil, etc. Each parameter exhibits a wide range of values in the literature, resulting in cumulative uncertainty in the final results. Even small changes in one parameter can significantly affect the calculated accessible biomass volume and biomethane production potential.
Assumptions Regarding Crop-Residue Removal Rates: The baseline scenario assumes partial residue removal (20–40%), consistent with common approaches in the literature, provided that organic matter is compensated for (e.g., digestate, biochar). However, in practice, the permissible removal rate depends on initial soil organic carbon content, tillage system, crops and rotation, and the availability of organic fertilizers. Therefore, applying a single removal norm nationwide is a simplification; the results should be interpreted as scenario estimates rather than as a precise forecast.
Infrastructure Constraints on Biomethane Production and Injection: The calculated technical and economic potential does not fully account for spatial and infrastructure constraints, including the limited availability of gas distribution and transmission networks in rural regions; technical limits on injection into local networks; the need to build compressor stations, metering nodes, and gas quality-control systems; and regional differences in connection costs and complexity. These factors can materially affect the feasibility of specific projects even when sufficient feedstock is available.
Limitations of the Environmental Assessment (LCA): The environmental assessment is based on typical emission factors, including for methane leakage, upgrading, and digestate accounting. Actual emissions may differ significantly depending on plant tightness, digestate management practices, and local agronomic conditions. In addition, applying a digestate GHG credit assumes agricultural use and substitution of mineral fertilizers; when reliable data are absent, results may be overestimated.
Interpretation of the Results: Given these limitations, the results should be considered AS scenario estimates of biomethane production potential; a tool for comparing alternative options (residue removal levels, economic parameters, environmental effects); and a basis for further, more detailed regional studies.
The practical application of the results on biogas and biomethane production depends to a large extent on the current regulatory environment and market conditions. The key factors affecting commercial efficiency include subsidies and state support—the availability of financial incentives for biomethane producers can significantly reduce investment risks and shorten project payback periods; guarantees of origin—clean-energy certification systems provide additional market value for biomethane and facilitate its integration into the gas distribution network; and market price fluctuations—volatility in biomethane and electricity prices can affect the economic feasibility of projects, so it is important to consider pricing scenarios. Taking these aspects into account makes it possible to more objectively assess the prospects for technology deployment and to increase the practical value of the results for investment and regulatory decision-making.
In the near term, scaling biomethane production from crop residues should be implemented through the expansion of regional biomethane clusters that combine agricultural producers (including farmers), processing enterprises, and energy infrastructure (Forest–Steppe and Steppe zones), and through modular small- and medium-scale biomethane units adapted to the seasonality of agricultural feedstock supply. Integrating biomethane into Ukraine’s gas transmission system requires simplifying connection procedures, developing an injection infrastructure, and establishing a system of guarantees of origin. In parallel, the scaling of biomethane value chains increasingly depends on digital MRV and data infrastructure to verify sustainable feedstock sourcing, track supply-chain performance, and support credible guarantees of origin. Recent evidence on AI-enabled sustainability monitoring at the regional ecosystem level highlights both the potential of data-driven approaches and the governance constraints (data quality, transparency, institutional capacity) that are directly relevant to biomethane MRV and traceability architectures in Ukraine [89]. State support should focus on financial incentives for investments, the development of the carbon certificate market, and the mobilization of international finance.
Thus, using crop residues as feedstock for biofuel production is technically feasible, environmentally effective, and economically promising. It represents one of the most efficient directions for decarbonizing Ukraine’s agricultural sector and developing a circular bioeconomy in the post-war period.

5. Conclusions

This study underscores the strategic importance of the rational use of agricultural residues in bioenergy for enhancing the resilience of agricultural production, supporting the development of a low-carbon economy, and ensuring Ukraine’s balanced transition to renewable energy sources. The results indicate that agricultural residues have substantial bioenergy potential and can play a critical role in the development of the biomethane sector. Biomethane production from agricultural feedstock is a promising technology for substituting natural gas and achieving climate goals. For Ukraine, it is advisable to develop national strategies to support the biomethane sector using lignocellulosic agricultural feedstock, taking into account regional resource potential [45] and existing infrastructure constraints.
Overall, biomethane from post-harvest crop residues is a strategically important direction for the development of green energy, combining decarbonization of the energy sector, the economic viability of energy production, the preservation of soil fertility, and the enhancement of the socio-economic development of rural areas. It can serve as a foundation for the sustainable development of the agricultural sector and as an important element of Ukraine’s integration into the European energy space. In addition, this feedstock has significant resource potential across practically all regions of Ukraine, with the highest concentration in the central and northern regions.
Biomethane production from post-harvest crop residues is a promising direction for bioenergy development in Ukraine, combining techno-economic feasibility with a significant environmental effect and potentially becoming an important component of the transition to sustainable, low-carbon energy development [9,38].
The techno-economic analysis demonstrates the feasibility of producing biomethane from post-harvest crop residues, provided that biomass collection logistics are optimized, modern anaerobic digestion technologies are employed, and biomethane is integrated into the existing gas transmission infrastructure. In the long-term, such projects may be economically competitive with fossil energy resources.
According to the authors’ calculations, agricultural residues from wheat, maize, and barley produced in Ukraine in 2024 could generate approximately 4.42 billion m3 of biomethane per year under conservative assumptions regarding residue availability and methane yields. This volume of biomethane is comparable to 4.42 billion m3 of natural gas, which amounts to up to 30% of Ukraine’s pre-war domestic gas consumption, and is derived solely from residues of three crops.
The main conclusion of this study is that the development of bioenergy based on agricultural residues will facilitate the transition to circular-economy principles, the efficient utilization of organic waste, and the reduction in greenhouse gas emissions, the creation of added value in the agricultural sector, the reduction in the state’s energy dependence, and the restoration of agrolandscapes.
The use of post-harvest crop residues for biogas and biomethane production, provided that digestate is returned to the fields from which such agro-biomass was collected, is an agronomically, environmentally, and energetically justified solution. Such an approach enables the balance of soil organic matter to be maintained, preventing soil depletion, and minimizing additional greenhouse gas emissions.
At the enterprise and regional levels, this requires not only techno-economic optimization but also formalized models for assessing competitiveness and sustainable development, enabling the comparison of alternative investment and management trajectories in the agricultural sector [90]. Within this logic, biomethane from crop residues can be interpreted as one of the practical ‘pathways’ in which the evidentiary basis of results and institutional design determine whether resource potential transforms into a sustainable market trajectory. At the same time, scaling biomethane production from crop residues to market scale requires alignment with circular-economy frameworks and EU policy instruments that set requirements for evidence, traceability, and comparability of sustainability outcomes across supply chains. EU experience with circular-economy policy instruments and governance of secondary resource supply underscores that regulatory and institutional design determines whether resource potential can transform into sustainable market trajectories [91].

Author Contributions

Conceptualization, O.P., W.R., L.U., L.M., Y.K., B.I. and S.S.; Methodology, O.P., W.R., L.U., L.M., Y.K., B.I. and S.S.; Software, O.P., W.R., L.U., L.M., Y.K., B.I. and S.S.; Validation, O.P., W.R., L.U., L.M., Y.K., B.I. and S.S.; Formal analysis, O.P., W.R., L.U., L.M., Y.K., B.I. and S.S.; Investigation, O.P., W.R., L.U., L.M., Y.K., B.I. and S.S.; Resources, O.P., W.R., L.U., L.M., Y.K., B.I. and S.S.; Data curation, O.P., W.R., L.U., L.M., Y.K., B.I. and S.S.; Writing—original draft, O.P., W.R., L.U., L.M., Y.K., B.I. and S.S.; Writing—review & editing, O.P., W.R., L.U., L.M., Y.K., B.I. and S.S.; Visualization, O.P., W.R., L.U., L.M., Y.K., B.I. and S.S.; Supervision, O.P.; Project administration, O.P.; Funding acquisition, O.P., W.R., Y.K. and B.I. All authors have read and agreed to the published version of the manuscript.

Funding

This research received no external funding.

Data Availability Statement

The original contributions presented in this study are included in the article. Further inquiries can be directed to the corresponding author.

Conflicts of Interest

The authors declare no conflicts of interest.

Abbreviations

RPRResidue-to-Product Ratio
MCMoisture Content
AFAvailability Factor
LLoss Factor
CAPEXCapital Expenditure
OPEXOperating Expenditures
LCOELevelized Cost of Energy
LCOBmLevelized Cost of Biomethane
NPVNet Present Value
IRRInternal Rate of Return
PBPPayback Period
GHGGreenhouse Gas Emissions
CFNet Cash Flow
rdiscount rate, %
noperational lifetime (years)
APAcidification Potential
EPEutrophication Potential
GWPGlobal Warming Potential
ADAnaerobic Digestion

References

  1. IPCC. Climate Change 2021: The Physical Science Basis. Working Group I Contribution to the Sixth Assessment Report of the Intergovernmental Panel on Climate Change; IPCC: Cambridge, UK, 2021; Available online: https://www.ipcc.ch/report/ar6/wg1/downloads/report/IPCC_AR6_WGI_SummaryVolume.pdf (accessed on 24 December 2025).
  2. Pimenow, S.; Pimenowa, O.; Moldavan, L.; Prus, P.; Sadowska, K. Agroforestry as a Resource for Resilience in the Technological Era: The Case of Ukraine. Resources 2025, 14, 152. [Google Scholar] [CrossRef]
  3. Mukherji, A.; Marshall, S.; Arango, J.; Costa, C.; Flintan, F.E.; Hebebrand, C.; Kihara, J.M.; Masso, C.; Molloy, P.; Rusinamhodzi, L.; et al. 2024 Breakthrough Agenda Report: Agriculture; CGIAR: Montpellier, France, 2024; p. 44. Available online: https://hdl.handle.net/10568/152247 (accessed on 24 December 2025).
  4. Spizzirri, E.; Maraldi, M.; Valenti, F. Valorising agricultural waste and by-products for renewable energy: Sustainable technologies and pathways. Energy Rep. 2026, 15, 109000. [Google Scholar] [CrossRef]
  5. Alengebawy, A.; Ran, Y.; Osman, A.I.; Jin, K.; Samer, M.; Ai, P. Anaerobic digestion of agricultural waste for biogas production and sustainable bioenergy recovery: A review. Environ. Chem. Lett. 2024, 22, 2641–2668. [Google Scholar] [CrossRef]
  6. Xu, X.L.; Chen, H.H.; Li, Y. Exploring the influencing factors of continuous crop residue supply: From the perspective of a sustainable and bioenergy-oriented crop cultivation. Energy Sustain. Soc. 2020, 10, 35. [Google Scholar] [CrossRef]
  7. Odai Mensah, T.N.; Oyewo, A.S.; Breyer, C. The global sustainable bioenergy potential until 2050 in global-national resolution. Appl. Energy 2025, 400, 126464. [Google Scholar] [CrossRef]
  8. FAO. The Role of Agricultural Residues in Sustainable Agriculture; FAO: Rome, Italy, 2017; Available online: https://openknowledge.fao.org/server/api/core/bitstreams/7468fe06-7dd7-4e7a-8f10-bb0084594977/content (accessed on 24 December 2025).
  9. Geletukha, G.; Zheliezna, T.; Bashtovyi, A. Roadmap for bioenergy development in Ukraine until 2050. Thermophys. Therm. Power Eng. 2020, 42, 60–67. [Google Scholar] [CrossRef]
  10. European Commission, Joint Research Centre. Healthy Production Systems Are Key to Sustainable Biomass Supply; European Commission: Brussels, Belgium, 2025; Available online: https://joint-research-centre.ec.europa.eu (accessed on 24 December 2025).
  11. Scarlat, N.; Fahl, F.; Dallemand, J.F.; Lugato, E.; Monforti-Ferrario, F.; Dallemand, J. Integrated and spatially explicit assessment of sustainable crop residues potential in Europe. Biomass Bioenergy 2019, 122, 257–269. [Google Scholar] [CrossRef]
  12. Cabinet of Ministers of Ukraine. On the Approval of the Concept for the Implementation of State Policy in the Field of Heat Supply (Order No. № 569-r); Verkhovna Rada of Ukraine: Kyiv, Ukraine, 2017. Available online: https://zakon.rada.gov.ua/laws/show/569-2017-%D1%80#Text (accessed on 24 December 2025).
  13. Pimenow, S.; Pimenowa, O.; Prus, P. The Impact of Business Model Sustainability on the Financial Performance of Ukraine’s Leading Companies Before the Military Conflict. Sustainability 2024, 16, 10008. [Google Scholar] [CrossRef]
  14. Renewables 2025. Analysis and Forecasts to 2030. Available online: https://www.iea.org/reports/renewables-2025 (accessed on 24 December 2025).
  15. Wang, S.; Huang, X.; Yin, C.; Richel, A. A critical review on the key issues and optimization of agricultural residue transportation. Biomass Bioenergy 2021, 146, 105979. [Google Scholar] [CrossRef]
  16. Jaleta, M.; Kassie, M.; Shiferaw, B. Tradeoffs in crop residue utilization in mixed crop–livestock systems and implications for conservation agriculture. Agric. Syst. 2013, 121, 96–105. [Google Scholar] [CrossRef]
  17. Paradelo, R.; Navarro-Pedreño, J.; Glaser, B.; Grobelak, A.; Kowalska, A.; Singh, B.R. Potential and Constraints of Use of Organic Amendments from Agricultural Residues for Improvement of Soil Properties. Sustainability 2024, 16, 158. [Google Scholar] [CrossRef]
  18. Rodino, S. Potential of Agricultural Biomass Valorization for Circular Bioeconomy. Sci. Pap. Ser. Manag. Econ. Eng. Agric. Rural Dev. 2024, 24, 301–310. Available online: https://managementjournal.usamv.ro/pdf/vol.24_3/Art80.pdf (accessed on 29 December 2025).
  19. Oyedeji, O.; Sokhansanj, S.; Webb, E. Spatial analysis of stover moisture content during harvest season in the U.S. Trans. ASABE 2017, 60, 1015–1023. [Google Scholar] [CrossRef]
  20. Belinska, S.; Bielik, P.; Adamičková, I.; Husárová, P.; Onyshko, S.; Belinska, Y. Assessment of Environmental and Economic-Financial Feasibility of Biogas Plants for Agricultural Waste Treatment. Sustainability 2024, 16, 2740. [Google Scholar] [CrossRef]
  21. Sánchez-Martín, L.; Ortega Romero, M.; Llamas, B.; Suárez Rodríguez, M.D.C.; Mora, P. Cost Model for Biogas and Biomethane Production in Anaerobic Digestion and Upgrading. Case Study: Castile and Leon. Materials 2023, 16, 359. [Google Scholar] [CrossRef]
  22. UABIO. Current Status and Prospects for the Development of Bioenergy in Ukraine. 2014. Available online: https://uabio.org/wp-content/uploads/2014/07/round-table-naas.pdf (accessed on 25 December 2025).
  23. Wendt, L.; Smith, W.; Hartley, D.; Wendt, D.; Ross, J.; Sexton, D.; Lukas, J.; Nguyen, Q.; Murphy, J.; Kenney, K. Techno-Economic Assessment of a Chopped Feedstock Logistics Supply Chain for Corn Stover. Front. Energy Res. Sec. Bioenergy Biofuels 2018, 6, 90. [Google Scholar] [CrossRef]
  24. UABIO. Renewable Energy Developers’ Manual: Ukraine Sustainable Energy Lending Facility (USELF). 2014. Available online: https://uabio.org/wp-content/uploads/2014/07/uself-re-developers-manual-en.pdf (accessed on 25 December 2025).
  25. Pilarski, K.; Pilarska, A.A.; Pietrzak, M.B. Biogas Production in Agriculture: Technological, Environmental, and Socio-Economic Aspects. Energies 2025, 18, 5844. [Google Scholar] [CrossRef]
  26. Holm-Nielsen, J.; Al Seadi, T.; Oleskowicz-Popiel, P. The future of anaerobic digestion and biogas utilization. Bioresour. Technol. 2009, 100, 5478–5484. [Google Scholar] [CrossRef]
  27. Steffen, B. Estimating the Cost of capital for renewable energy projects. Energy Econ. 2020, 88, 104783. [Google Scholar] [CrossRef]
  28. Interfax-Ukraine. Biomethane Export Price Could Reach €900 per 1,000 Cubic Meters, February 2025. Available online: https://en.interfax.com.ua/news/economic/1046444.html (accessed on 29 December 2025).
  29. Brealey, R.A.; Myers, S.C.; Allen, F. Principles of Corporate Finance; McGraw-Hill: New York, NY, USA, 2025; Available online: https://www.mheducation.com/content/dam/mhe/blog/higher-ed/2025/pdfs/brealey-principles-of-corporate-finance-evergreen-2025.pdf (accessed on 30 December 2025).
  30. Intergovernmental Panel on Climate Change (IPCC). Climate Change 2022: Mitigation of Climate Change. Contribution of Working Group III to the Sixth Assessment Report of the Intergovernmental Panel on Climate Change; Cambridge University Press: Cambridge, UK, 2022; Available online: https://www.ipcc.ch/report/ar6/wg3 (accessed on 25 January 2026).
  31. Scheutz, C.; Fredenslund, A. Total methane emission rates and losses from 23 biogas plants. Waste Manag. 2019, 97, 38–46. [Google Scholar] [CrossRef] [PubMed]
  32. Buffi, M.; Hurtig, O.; Scarlat, N. Methane Emissions in the Biogas and Biomethane Supply Chains in the EU: An Analysis to Update the Greenhouse Gas Emissions Accounting Methodology of Renewable Energy Directive Annex VI; Publications Office of the European Union: Luxembourg, 2024; Available online: https://data.europa.eu/doi/10.2760/7927411 (accessed on 15 January 2026).
  33. Börjesson, P.; Prade, T.; Lantz, M.; Björnsson, L. Energy Crop-Based Biogas as Vehicle Fuel—The Impact of Crop Selection on Energy Efficiency and Greenhouse Gas Performance. Energies 2015, 8, 6033–6058. [Google Scholar] [CrossRef]
  34. Shukla, P.; Skea, J.; Slade, R.; Fradera, R.; Malley, J.; Pathak, M.; Some, S.; Kumar, A.; Li, X.; Zhang, Y.; et al. Climate Change 2022: Mitigation of Climate Change. Contribution of Working Group III to the Sixth Assessment Report of the Intergovernmental Panel on Climate Change; Cambridge University Press: Cambridge, UK, 2022. [Google Scholar] [CrossRef]
  35. Styles, D.; Adams, P.; Thelin, G.; Vaneeckhaute, C.; Chadwick, D.; Withers, J. Life Cycle Assessment of Biofertilizer Production and Use Compared with Conventional Liquid Digestate Management. Environ. Sci. Technol. 2018, 52, 7468–7476. [Google Scholar] [CrossRef] [PubMed]
  36. Buivydas, E.; Navickas, K.; Venslauskas, K. A Life Cycle Assessment of Methane Slip in Biogas Upgrading Based on Permeable Membrane Technology with Variable Methane Concentration in Raw Biogas. Sustainability 2024, 16, 3323. [Google Scholar] [CrossRef]
  37. Ortiz-Reyes, E.; Anex, R. A life cycle impact assessment method for freshwater eutrophication due to the transport of phosphorus from agricultural production. J. Clean. Prod. 2018, 177, 474–482. [Google Scholar] [CrossRef]
  38. UABIO; Geletukha, G. Current State and Prospects of Bioenergy Development in Ukraine; Bioenergy Association of Ukraine: Kyiv, Ukraine, 2023; Available online: https://uabio.org/wp-content/uploads/2023/12/1.-Geletuha-G.-G.-Potochnyj-stan-ta-perspektyvy-rozvytku-bioenergetyky-v-Ukrayini.pdf (accessed on 23 January 2026).
  39. Pimenow, S.; Pimenowa, O.; Moldavan, L.; Udova, L.; Wasilewski, M.; Wasilewska, N. Transforming Agriculture into Energy: Unlocking Ukraine’s Bioenergy Potential for Sustainable Post-Conflict Recovery. Energies 2025, 18, 1212. [Google Scholar] [CrossRef]
  40. DSTU 7721:2015; Gaseous Fuel. Biogas. Technical Requirements and Control Methods. Institute of Renewable Energy of the National Academy of Sciences of Ukraine: Kyiv, Ukraine, 2015. Available online: https://online.budstandart.com/ua/catalog/doc-page?id_doc=62188 (accessed on 12 December 2025).
  41. Agriculture: Sustainable Practices for Food Security and Climate Goals; Dixi Group, UK International Development: London, UK, 2025. 184p. Available online: https://gto.dixigroup.org/assets/images/files/gto-agriculture-sectoral-study-2025.pdf (accessed on 25 December 2025).
  42. Ukrstat. Areas, Gross Harvests and Crop Yield. 2025. Available online: https://stat.gov.ua/uk/explorer?md5=77e95f06eb7b52bee161556391f506dd (accessed on 5 January 2026).
  43. Nahwani, A.; Soeprijanto, S.; Widodo, E. Strategic model for integrating biogas a framework for sustainable energy integration in agro-industries. Sci. Rep. 2024, 14, 31515. [Google Scholar] [CrossRef] [PubMed]
  44. Björnsso, L.; Prade, T. Sustainable Cereal Straw Management: Use as Feedstock for Emerging Biobased Industries or Cropland Soil Incorporation? Waste Biomass Valorization 2021, 12, 5649–5663. [Google Scholar] [CrossRef]
  45. UABIO; Geletukha, G.; Zheliezna, T.; Drahniev, S.; Kucheruk, P.; Kramar, V. Analytical Note No. 2: Advanced Biomethane Production from Ligno-Cellulose Materials. 2025. Available online: https://uabio.org/wp-content/uploads/2025/07/Analit_Zapiska2_2025_UA.pdf (accessed on 28 December 2025).
  46. Scarlat, N.; Dallemand, J.-F.; Fahl, F. Biogas: Developments and perspectives in Europe. Renew. Energy 2018, 129, 457–472. [Google Scholar] [CrossRef]
  47. European Commission. Union Bioenergy Sustainability Report 2023 (COM/2023/650 as Part of 8th Report on the State of the Energy Union). European Commission. 2023. Available online: https://energy.ec.europa.eu/strategy/energy-union/8th-report-state-energy-union_en (accessed on 24 December 2025).
  48. Hahn, H.; Krautkremer, B.; Hartmann, K.; Wachendorf, M. Review of concepts for a demand-driven biogas supply for flexible power generation. Renew. Sustain. Energy Rev. 2014, 29, 383–393. [Google Scholar] [CrossRef]
  49. Miltner, M.; Makaruk, A.; Harasek, M. Review on available biogas upgrading technologies and innovations towards advanced solutions. J. Clean. Prod. 2017, 161, 1329–1337. [Google Scholar] [CrossRef]
  50. Zhang, C.; Su, H.; Baeyens, J.; Tan, T. A review of the chemistry of anaerobic digestion: Methods of accelerating and optimizing process efficiency. Processes 2019, 7, 504. [Google Scholar] [CrossRef]
  51. Wang, J.; Liu, S.; Feng, K.; Lou, Y.; Ma, J.; Xing, D. Anaerobic digestion of lignocellulosic biomass: Process intensification and artificial intelligence. Renew. Sustain. Energy Rev. 2025, 210, 115264. [Google Scholar] [CrossRef]
  52. IEA Bioenergy. The Role of Anaerobic Digestion and Biogas in the Circular Economy. 2018. Available online: https://www.ieabioenergy.com/blog/publications/the-role-of-anaerobic-digestion-and-biogas-in-the-circular-economy/ (accessed on 31 March 2026).
  53. IEA Bioenergy. Outlook for Biogas and Biomethane: Prospects for Organic Growth. 2020. Available online: https://www.iea.org/reports/outlook-for-biogas-and-biomethane-prospects-for-organic-growth (accessed on 31 March 2026).
  54. Angelidaki, I.; Alves, M.; Bolzonella, D.; Borzacconi, L.; Campos, J.L.; Guwy, A.J.; Kalyuzhnyi, S.; Jenicek, P.; Van Lier, J.B. Defining the biomethane potential (BMP) of solid organic wastes and energy crops: A proposed protocol for batch assays. Water Sci. Technol. 2009, 59, 927–934. Available online: https://pubmed.ncbi.nlm.nih.gov/19273891/ (accessed on 23 January 2026). [CrossRef]
  55. IEA Bioenergy. Global Biomethane Market and Potential. 2022. Available online: https://www.iea.org/reports/outlook-for-biogas-and-biomethane/key-findings (accessed on 15 December 2025).
  56. Fusi, A.; Bacenetti, J.; Fiala, M.; Azapagic, A. Life cycle environmental impacts of electricity from biogas produced by anaerobic digestion. Front. Bioeng. Biotechnol. 2016, 4, 26. [Google Scholar] [CrossRef] [PubMed]
  57. Lijó, L.; González-García, S.; Bacenetti, J.; Fiala, M.; Feijoo, G.; Lema, J.M.; Moreira, M.T. Life Cycle Assessment of electricity production in Italy from anaerobic co-digestion of pig slurry and energy crops. Renew. Energy 2014, 68, 625–635. [Google Scholar] [CrossRef]
  58. Florio, C.; Fiorentino, G.; Corcelli, F.; Ulgiati, S.; Dumontet, S.; Güsewell, J.; Eltrop, L. A Life Cycle Assessment of Biomethane Production from Waste Feedstock Through Different Upgrading Technologies. Energies 2019, 12, 718. [Google Scholar] [CrossRef]
  59. Žalys, B.; Navickas, K.; Venslauskas, K. Life Cycle Assessment of CO2, Rumen, and Biological Biomass Pretreatment Methods for Biomethane Production. Agriculture 2025, 15, 1169. [Google Scholar] [CrossRef]
  60. Jafari, G.; Ardabili, S.; Pourdarbani, R.; Abbaszadeh, B.; Hernandez-Hernandez, M. Sustainable biomethane production from sewage sludge and wheat straw co-digestion in the presence of polypyrrole Fe3O4 nanoparticles and alkaline pretreatment: Life cycle assessment point of view. Acta Technol. Agric. 2023, 26, 133–141. [Google Scholar] [CrossRef]
  61. International Energy Agency. Outlook for Biogas and Biomethane. IEA. 2025. Available online: https://www.iea.org/reports/outlook-for-biogas-and-biomethane (accessed on 24 December 2025).
  62. IEA Bioenergy. Sustainable Potentials for Renewable Gas Trade—Synthesis Report of WP3 of the IEA Bioenergy Intertask Project “Renewable Gas—Deployment, Markets and Sustainable Trade.” IEA Bioenergy. 2022. Available online: https://www.ieabioenergy.com/wp-content/uploads/2022/03/IEA-Bioenergy-Renewable-Gas-Intertask-WP3-Synthesis-report_2022.pdf (accessed on 24 December 2025).
  63. Profportal. Biogas Plants: Energy of the Future from Today’s Waste. Available online: https://profportal.com.ua/blog/biohazovi-ustanovky-enerhiya-maybutnoho-z-vidkhodiv-teperishnoho/?srsltid=AfmBOor52BtFrMlGJmA0-lbpmZYG7KZVQEyDYXx3Gd73P6HzaWwpXfly (accessed on 24 December 2025).
  64. Poulsen, J.S.; Macêdo, W.V.; Bonde, T.; Nielsen, J.L. Energetically exploiting lignocellulose-rich residues in anaerobic digestion technologies: From bioreactors to proteogenomics. Biotechnol. Biofuels Bioprod. 2023, 16, 183. [Google Scholar] [CrossRef]
  65. Schultz, J.; Scherzinger, M.; Elbanhawy, A.Y.; Kaltschmitt, M. Long-Term Continuous Anaerobic Co-digestion of Residual Biomass—Model Validation and Model-Based Investigation of Different Carbon-to-Nitrogen Ratios. BioEnergy Res. 2025, 18, 58. Available online: https://link.springer.com/article/10.1007/s12155-025-10858-4 (accessed on 28 January 2026). [CrossRef]
  66. Sayara, T.; Sánchez, A. A Review on Anaerobic Digestion of Lignocellulosic Wastes: Pretreatments and Operational Conditions. Appl. Sci. 2019, 9, 4655. [Google Scholar] [CrossRef]
  67. Sun, Y.; Cheng, J. Hydrolysis of lignocellulosic materials for ethanol production: A review. Bioresour. Technol. 2002, 83, 1–11. [Google Scholar] [CrossRef]
  68. Zheng, Y.; Zhao, J.; Xu, F.; Li, Y. Pretreatment of lignocellulosic biomass for enhanced biogas production. Prog. Energy Combust. Sci. 2014, 42, 35–53. [Google Scholar] [CrossRef]
  69. Angelidaki, I.; Ellegaard, L. Codigestion of manure and organic wastes in centralized biogas plants. Appl. Biochem. Biotechnol. 2003, 109, 95–105. [Google Scholar] [CrossRef]
  70. Sawatdeenarunat, C.; Surendra, K.C.; Takara, D.; Oechsner, H.; Khanal, S.K. Anaerobic digestion of lignocellulosic biomass: Challenges and opportunities. Bioresour. Technol. 2015, 178, 178–186. [Google Scholar] [CrossRef] [PubMed]
  71. Geletuha, G.G.; Zheleznaya, T.A.; Triboy, A.V. Prospects for use of agricultural waste for energy production in Ukraine. Part 2. Promyishlennaya Teploteh. 2014, 36. [Google Scholar]
  72. Basu, P. Biomass Gasification and Pyrolysis: Practical Design and Theory; Academic Press: Cambridge, MA, USA, 2010; p. 364. Available online: https://www.rexresearch1.com/WoodGasifierLibrary/BiomassGasificationPyrolysisPracticalDesignTheory.pdf (accessed on 8 December 2025).
  73. Biochar—A New Word in Organic Cultivation. Available online: https://www.growlight.ru/content/7-biochar (accessed on 24 December 2025).
  74. Biochar: A Panacea for 21st Century Agro-Industry. Available online: http://www.pyrolys.net/biochar-panaceja-XXI-veka/ru/1 (accessed on 12 December 2025).
  75. Superagronom. Biochar—A Solution for Agriculture, Energy and Ecology. 2025. Available online: https://superagronom.com/articles/786-biochar--rishennya-dlya-silskogo-gospodarstva-energetiki-ta-ekologiyi (accessed on 12 December 2025).
  76. Venslauskas, K.; Navickas, K.; Rubežius, M.; Žalys, B.; Gegeckas, A. Processing of Agricultural Residues with a High Concentration of Structural Carbohydrates into Biogas Using Selective Biological Products. Sustainability 2024, 16, 1553. [Google Scholar] [CrossRef]
  77. Zhelezna, T.A. Impact on Soil from Removal of Crop By-Products from the Field. Report at the Webinar “Creation and Functioning of Effective Value Chains in Bioenergy, Including Issues of Biomass Logistics”, December 2023. Available online: https://uabio.org/news/15539/ (accessed on 25 December 2025).
  78. Wang, X.; He, C.; Liu, B.; Zhao, X.; Liu, Y.; Wang, Q.; Zhang, H. Effects of residue returning on soil organic carbon storage and sequestration rate in China’s croplands: A meta-analysis. Agronomy 2020, 10, 691. [Google Scholar] [CrossRef]
  79. Poeplau, C.; Don, A. Carbon sequestration in agricultural soils via cultivation of cover crops—A meta-analysis. GCB Bioenergy 2015, 200, 33–41. Available online: https://www.cabidigitallibrary.org/doi/full/10.5555/20153099707 (accessed on 2 January 2026). [CrossRef]
  80. Alvarez, R. A quantitative review of the effects of residue removing on soil organic carbon in croplands. Soil Tillage Res. 2024, 240, 106098. Available online: http://hdl.handle.net/11336/233243 (accessed on 22 January 2026). [CrossRef]
  81. European Biogas Association. EBA Statistical Report 2025. 2025. Available online: https://www.europeanbiogas.eu/news/eba-statistical-report-2025/ (accessed on 24 December 2025).
  82. Interfax. Ukrainian Producers Inject 1 Mcm of Biomethane into UGS Facilities—UABIO Head. 2025. Available online: https://en.interfax.com.ua/news/press-conference/1039604.html (accessed on 31 January 2026).
  83. UABIO. The Company “Gals Agro” has Launched the First Biomethane Plant in Ukraine. 2023. Available online: https://uabio.org/en/news/14702 (accessed on 22 January 2026).
  84. Government Portal. Ministry of Energy: Ukraine Has Started Exporting Biomethane to the European Union. Available online: https://www.kmu.gov.ua/en/news/minenerho-ukraina-rozpochala-eksport-biometanu-do-ievropeiskoho-soiuzu (accessed on 12 December 2025).
  85. European Commission. REPowerEU: A Plan to Rapidly Reduce Dependence on Russian Fossil Fuels and Rapidly Advance the “Green Transition”; European Commission: Brussels, Belgium, 2022; Available online: https://ec.europa.eu/commission/presscorner/detail/uk/ip_22_3131 (accessed on 2 January 2026).
  86. Biomethane Market Projected to Reach $60.2 Billion, at a 28.7% CAGR by 2030. MarketsandMarkets™. Available online: https://www.globenewswire.com/news-release/2025/11/25/3194329/0/en/Biomethane-Market-Projected-to-Reach-60-2-Billion-at-a-28-7-CAGR-by-2030-MarketsandMarkets.html (accessed on 5 January 2026).
  87. UABIO. Bioenergy in Ukraine Until 2030: Analysis of the National Renewable Energy Action Plan Is Now Available on SAF, 2024. Available online: https://uabio.org/en/materials/16524/ (accessed on 3 January 2026).
  88. UABIO; Geletukha, G.; Zheliezna, T.; Drahniev, S.; Haidai, O. Ten Actions of Ukraine to Reject Russian Natural Gas. Position Paper № 28, April 2022. Available online: https://uabio.org/wp-content/uploads/2022/04/10-Krokiv-Ukrayiny-vid-PG_19-04-2022_ENG.pdf (accessed on 5 January 2026).
  89. Pimenow, S.; Pimenowa, O.; Prus, P.; Niklas, A. The Impact of Artificial Intelligence on the Sustainability of Regional Ecosystems: Current Challenges and Future Prospects. Sustainability 2025, 17, 4795. [Google Scholar] [CrossRef]
  90. Pimenowa, O.; Pimenow, S.; Fyliuk, H. Model of assessment of competitiveness and sustainable development of Ukrainian agricultural enterprises. Manag. Theory Stud. Rural Bus. Infrastruct. Dev. 2020, 42, 330–338. Available online: https://portalcris.vdu.lt/server/api/core/bitstreams/68d8473f-6546-4b4b-9053-308843769f16/content (accessed on 23 January 2026). [CrossRef]
  91. Pimenow, S.; Pimenowa, O.; Rembisz, W. Circular Economy Pathways for Critical Raw Materials: European Union Policy Instruments, Secondary Supply, and Sustainable Development Outcomes. Sustainability 2026, 18, 562. [Google Scholar] [CrossRef]
Figure 1. Literature review: documents by year. Source: Scopus Document Analyzer, 2005–2025.
Energies 19 01891 g001
Figure 2. Literature review: documents by subject area. Source: Scopus Document Analyzer, 2005–2025.
Energies 19 01891 g002
Figure 3. Energy potential of biomass in Ukraine. Source: [38,39].
Energies 19 01891 g003
Table 1. Crop-based feedstocks for biogas production.
CategoryFeedstock Collection PointsExamples of Feedstock Types
Post-harvest crop residuesCrop production enterprisesCereal straw,
Maize stalks and cobs,
Sunflower stalks and heads,
Rapeseed straw
Soybean straw
Sugar beet tops.
Source: [41].
Table 2. One-factor sensitivity analysis of the economic indicators of biomethane production from post-harvest crop residues.
ParameterChangeNPV
(EUR Million)
IRR
(%)
Payback
biomethane price−20%7.0283.0
basic 12.4442.1
+20% 17.8571.6
CAPEX+25% 9.5332.6
basic 12.4442.1
−25% 15.3551.6
OPEX+20% 11.2402.3
basic 12.4442.1
−20% 13.6481.9
methane yield−15%9.2362.7
basic12.4442.1
+15%15.5511.7
Source: calculated by the authors.
Table 3. Input data for the calculation of AP, EP, and GWP in biomethane production from straw.
Source of EmissionsEmissionsImpact CategoryCharacterization Factor CF
NH3 from digestate0.002 kgAP1.88 kg SO2-eq./kg
NOx from transport0.0005 kgAP1.57 kg SO2-eq./kg
SO2 from processes0.0003 kgAP1 kg SO2-eq./kg
N from digestate0.001 kgEP0.42 kg PO4-eq./kg
P from digestate0.0005 kgEP3 kg PO4-eq./kg
CH4 leakages from liquid manure0.0018 kgGWP25 kg CO2-eq.
Credits for CH4 reduction−0.0015 kgGWP25 kg CO2-eq.
Source: [58,59,60].
Table 4. Sensitivity analysis of methane leakage.
ScenarioMethane Leakage Rate (%)Methane Emissions (t CO2-eq.)CO2 Emissions (t CO2-eq.)Total GHG Emissions (t CO2-eq.)
Minimum1.050200250
Baseline2.4120200320
Moderate3.0150200350
High4.0200200400
Maximum5.0250200450
Source: authors’ own calculations.
Table 5. Stages of anaerobic digestion.
Process StageMain MicroorganismsMain Reactions and ProductsIndicative Quantitative IndicatorsOptimal Conditions
HydrolysisHydrolytic bacteriaBreakdown of polymers (cellulose, proteins, lipids) → sugars, amino acids, fatty acids17–45% of organic matter is converted into soluble form; 1–3 dayspH 5.0–6.0
AcidogenesisAcidogenic bacteriaSimple organic compounds → volatile fatty acids (VFA), alcohols, H2, CO2≈70% of the substrate → acetate, H2, CO2; ≈30% → other acids and alcoholspH 5.0–6.5
AcetogenesisAcetogenic bacteriaVFA → acetic acid (CH3COOH), H2, CO2≈25% of acetate and ≈11% of hydrogen are formed at this stagepH 6.0–7.0
MethanogenesisMethanogenic archaeaCH3COOH → CH4 + CO2; H2 + CO2 → CH4≈70% of methane is formed from acetate, ≈30% from H2 + CO2; 10–20 dayspH 6.5–8.0
Source: [50].
Table 6. Indicators affecting the implementation of pyrolysis for certain biomass types.
IndicatorsFresh Straw (Yellow)Straw Stored in the Field (‘Grey’)Maize StalksSunflower Stalks
Moisture content, %10–2010–2045–6060–70
Lower heating value, MJ/kg141516.716
Ash melting temperature, °C750–1000950–11001050–1200800–1270
Ash content, %436.710
Volatile matter, %>70>706773
Source: [71].
Table 7. Biogas yield from different types of crop residues.
FeedstockBiogas Yield, m3/tMethane Content, %
Wheat straw230–26050–55
Maize stalks260–30055–60
Table 8. Biomethane production potential from crop residues in regions of Ukraine, 2021.
Oblast of UkraineBiomethane Potential, Million Nm3 CH4/year
Wheat StrawMaize StoverCrop Residues, Total
Autonomous Republic of Crimean/an/an/a
Vinnytsia81.8261.6447.1
Volyn26.133.196.7
Dnipropetrovsk116.955.1241.8
Donetsk72.85.1102.8
Zhytomyr35.6146.1232.4
Zakarpattia0.77.610.4
Zaporizhzhia111.216.4187.3
Ivano-Frankivsk7.335.660.7
Kyiv50.2204.6320.2
Kirovohrad85.9136.6291.0
Luhansk51.76.880.5
Lviv26.848.9132.8
Mykolaiv96.722.4188.0
Odesa108.837.8240.5
Poltava54.8256.8377.6
Rivne18.058.4113.5
Sumy45.36204.4289.3
Ternopil46.1111.4227.8
Kharkiv135.271.1259.6
Kherson77.827.6172.6
Khmelnytskyi64.2202.0369.5
Cherkasy54.9225.2331.4
Chernivtsi6.411.027.5
Chernihiv47.0315.9414.0
Total1422.22501.55214.8
Source: [45]. n/a—no data.
Disclaimer/Publisher’s Note: The statements, opinions and data contained in all publications are solely those of the individual author(s) and contributor(s) and not of MDPI and/or the editor(s). MDPI and/or the editor(s) disclaim responsibility for any injury to people or property resulting from any ideas, methods, instructions or products referred to in the content.