Article

Energy Effects of Ground Vortex-Induced Flow Distortion and Foreign Object Ingestion in Aeroengine Intakes


1
School of Aeronautics and Astronautics, Sichuan University, Chengdu 610065, China
2
Sichuan Gas Turbine Establishment, Aero Engine Corporation of China, Mianyang 621703, China
*
Author to whom correspondence should be addressed.
Energies 2026, 19(5), 1317; https://doi.org/10.3390/en19051317
Submission received: 22 January 2026 / Revised: 28 February 2026 / Accepted: 3 March 2026 / Published: 5 March 2026

Abstract

Ground vortex formation beneath aeroengine intakes during near-ground operations represents an energy-related aerodynamic issue, as it degrades inlet flow quality, induces pressure distortion, and reduces the effective utilization of incoming kinetic energy. This study investigates the unsteady characteristics of ground vortex flow under headwind conditions and its influence on foreign object ingestion (FOI) in an aeroengine intake. Three-dimensional unsteady Reynolds-averaged Navier–Stokes (URANS) simulations coupled with a Lagrangian Discrete Phase Model (DPM) are employed to resolve the interaction between intake-induced vortices and dispersed particles near the ground. The results indicate that the ground vortex rapidly develops into a quasi-periodic state, generating significant unsteady total pressure distortion at the intake face, with peak fluctuations reaching approximately 10% of the mean value. This flow non-uniformity reflects a deterioration of inlet energy distribution and is detrimental to downstream compression efficiency. Particle ingestion behavior is strongly dependent on particle density and diameter. Low-density and small particles are more readily entrained into the vortex core and ingested, whereas particles with higher density or larger size exhibit increased inertia and reduced sensitivity to vortex-induced energy transport. The ingestion region is biased toward the lower portion of the intake, consistent with the vortex core location. These findings provide insight into vortex-induced energy distortion and FOI mechanisms, offering guidance for improving aeroengine intake design and energy-efficient operation during near-ground conditions.

1. Introduction

During the operation of an aircraft engine near the ground, the interaction between the flow tube created by the engine’s suction and the ground results in the formation of a strong vortex structure between the inlet of the engine and the ground. This phenomenon is referred to as the ground vortex [1,2,3]. The presence of ground vortices not only affects the quality of the engine’s airflow, leading to intake distortion, but it may also trigger instability phenomena such as fan stall and surge, thereby jeopardizing the engine’s normal operation [4,5]. From an energy perspective, ground vortex-induced flow distortion degrades the uniformity of inlet total pressure and velocity, leading to inefficient utilization of incoming kinetic energy and potential deterioration of downstream compression performance. Furthermore, the powerful suction generated by ground vortices can draw foreign objects, such as pebbles and sand, into the engine, causing structural damage and compromising both the engine’s lifespan and flight safety [6,7].
The formation of ground vortices is closely related to vortex theory in fluid dynamics. Colehour and Farquhar [8] suggested that the formation of ground vortices requires a certain vortex circulation, which can be easily induced when airflow is disturbed near solid boundaries at the intake. Siervi et al. [9] proposed that the formation of ground vortices requires two vortex sources: one from the ground boundary layer and the other from a vortex source induced by crosswind conditions in a non-rotational flow field. Zantopp et al. [10], through experimental and computational fluid dynamics (CFD) simulations, investigated the variation in ground vortex intensity under different wind speeds and ground clearance conditions. Their study showed that, under crosswind conditions, the intensity of the ground vortex gradually increases with wind speed. Conversely, under headwind conditions, the vortex intensity initially increases to a local maximum and then decreases as the wind speed continues to rise. Martin et al. [11] conducted CFD studies, focusing on the impact of ground vortices on aircraft engines. Their research combined experimental wind tunnel data with CFD simulations, employing advanced vortex structure characterization techniques to assess the formation of ground vortices under different crosswind conditions. Horvath [12] further investigated the formation process of ground vortices under crosswind conditions. The results revealed that, under crosswind conditions, multiple smaller vortices rapidly merge into a stronger ground vortex, with significant changes in vortex intensity and size during the merging process, which substantially impacts the flow field of the engine’s intake.
Murphy [13] utilized Particle Image Velocimetry (PIV) technology to measure the flow field in a short-cabin intake and further examined the effects of ground clearance, ambient inflow speed, and boundary layer on the intensity of ground vortices. Murphy and MacManus [14,15,16], through experimental studies, quantitatively analyzed the impact of ground vortices on total pressure distortion at the intake and total pressure changes at the fan face. Their research demonstrated that the formation of ground vortices distorts the airflow at the fan face, affecting engine thrust output and performance. Ho et al. [17] explored the ground vortex flow and its effects on fluid dynamics under low Reynolds number conditions through experiments and numerical simulations. Their findings suggested that vortex formation is relatively independent of Reynolds number, with vortex phenomena observable even at low Reynolds numbers. In addition, Guimarães et al. [18] investigated vortical flow development in round ducts across multiple geometric scales for engine inlet applications using detailed experimental measurements. Their study provided valuable insight into vortex structure evolution, scaling behavior, and distortion characteristics within inlet ducts, further highlighting the importance of accurately capturing vortex dynamics in engine intake flow analyses.
Additionally, Rodert and Garrett [19] conducted early studies on the issue of foreign object ingestion caused by ground vortices. They demonstrated that the vortex formed between the engine intake and the ground can draw debris, such as gravel, into the engine. MacManus and Slaby [20] employed CFD and particle tracking methods to analyze vortex characteristics under different ground clearance and intake speed ratios and examined the effects of particle size and material density on foreign object ingestion. They identified the critical sizes and characteristics of foreign objects under different operational conditions. Their results showed that the intensity of ground vortices, particle characteristics, and the presence of crosswinds significantly influenced the ingestion process. Glenny [21] emphasized that ground vortices not only draw debris into the intake but also that the size of the debris is closely related to the vortex intensity, intake height, and wind speed, highlighting the impact of intake height on vortex strength. Experimental findings showed that vortices could lift large debris, including concrete, and suggested a method of gradual acceleration during takeoff to reduce the risk of ingestion. Hua et al. [22] investigated through numerical simulations and experiments how geometric factors, engine thrust, and boundary layer height affected the vortex formation threshold. Their research indicated that intake design and the intensity of surrounding vortices play a critical role in foreign object ingestion, especially under high wind speed conditions. Chennuru’s [23] numerical simulations under crosswind conditions found that the periodic motion of the vortex significantly influenced foreign object ingestion under crosswind conditions. Berthelon et al. [24] analyzed the effects of ground vortex flow on fan blade vibration, concluding that the flow distortion caused by ground vortices could not only lead to foreign object ingestion but also exacerbate blade vibration, impacting engine stability.
Despite extensive efforts to investigate the ground vortex phenomena and their implications for intake flow distortion and FOI, several critical gaps remain. Prior studies have largely focused on crosswind conditions, with limited exploration of ground vortex dynamics under headwind inflow—a scenario commonly encountered during taxiing, takeoff, or landing. Moreover, the coupling between vortex-induced flow distortion and particulate ingestion has also not been sufficiently addressed, particularly in terms of quantifying the effects of particle inertia and density on particle tracking under the dynamically evolving vortex conditions.
To address these deficiencies, the present study employs three-dimensional unsteady RANS simulations coupled with a Lagrangian DPM to investigate ground vortex dynamics and foreign object ingestion under headwind conditions. By resolving vortex-induced flow distortion and particle transport characteristics, this work elucidates their combined effects on inlet energy distribution and provides insights relevant to improving aeroengine intake efficiency and operational energy performance.

2. Methods

This section outlines the methodologies used to simulate and analyze the flow field and FOI characteristics of ground vortex. The physical model, including the geometry and boundary conditions, is described first. The grid and grid independence verification are discussed, and the numerical method is validated against experimental data to ensure accurate representation of flow features. The DPM is then introduced to simulate particle ingestion. Finally, the key parameters are defined to quantitively assess the characteristics of ground vortex.

2.1. Physical Model

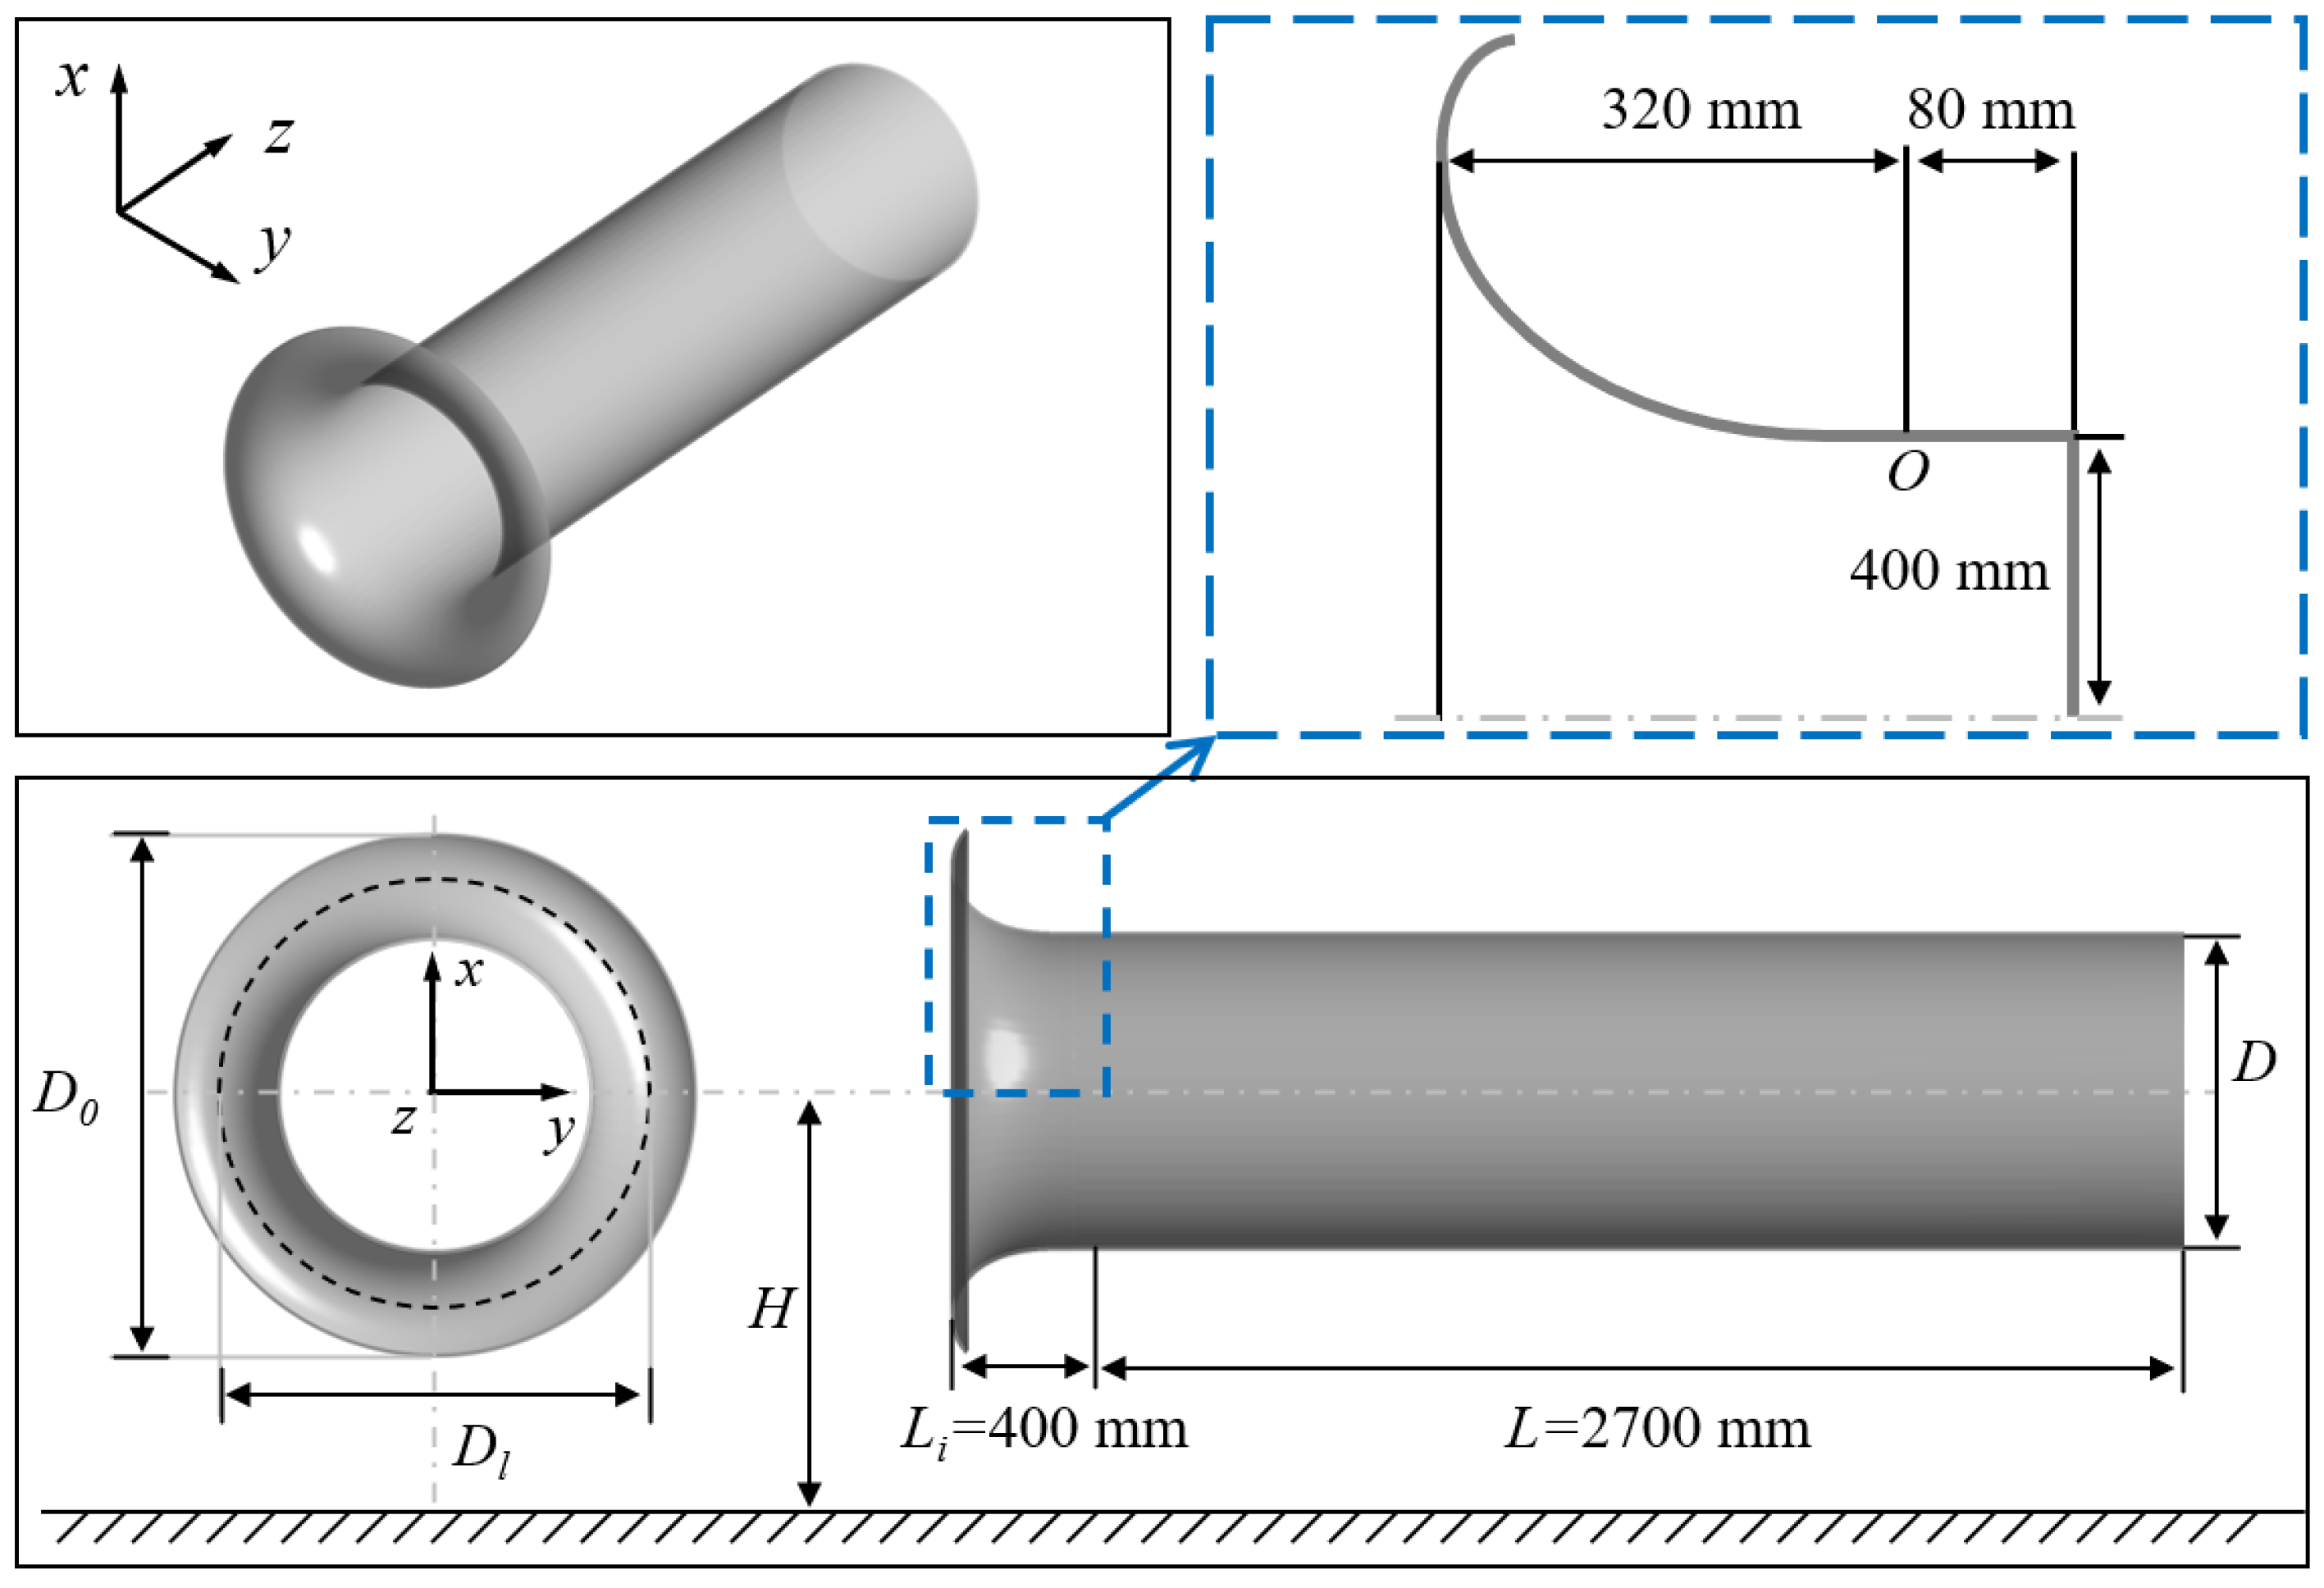
This paper focuses on the inlet of a certain type of aeroengine, the geometric configuration of which is illustrated in Figure 1. The inner diameter of the inlet is D = 800 mm, the outer diameter is D0 = 1300 mm, and the median diameter is Dl = 1050 mm. The length of the inlet is L = 3100 mm, and the ground clearance (the distance from the central axis of the inlet to the ground) is H = 1.5 D = 1200 mm. The lip contour of the inlet is hyperbolic, and the relationship between the coordinates and the angle is determined by Equation (1):
r = 380 2 c o s 2 45 ° θ x = r c o s θ y = r s i n θ   ,   0 θ 45 °
where the vector angle θ ranges from 0° to 45°, and the vector radius r ranges from 0–380 mm, with the origin of the vector radius r located at point O in Figure 1.
It should be noted that, in the present study, the downstream rotating machinery (e.g., fan or compressor) is not explicitly modeled. Instead, the aerodynamic influence of the downstream system is represented by prescribing a constant mass-flow rate at the intake outlet (further discussed in Section 2.5). This treatment provides a controlled and physically consistent representation of the suction effect imposed by the downstream components, while enabling isolation of the ground vortex formation and particle ingestion mechanisms under headwind conditions.
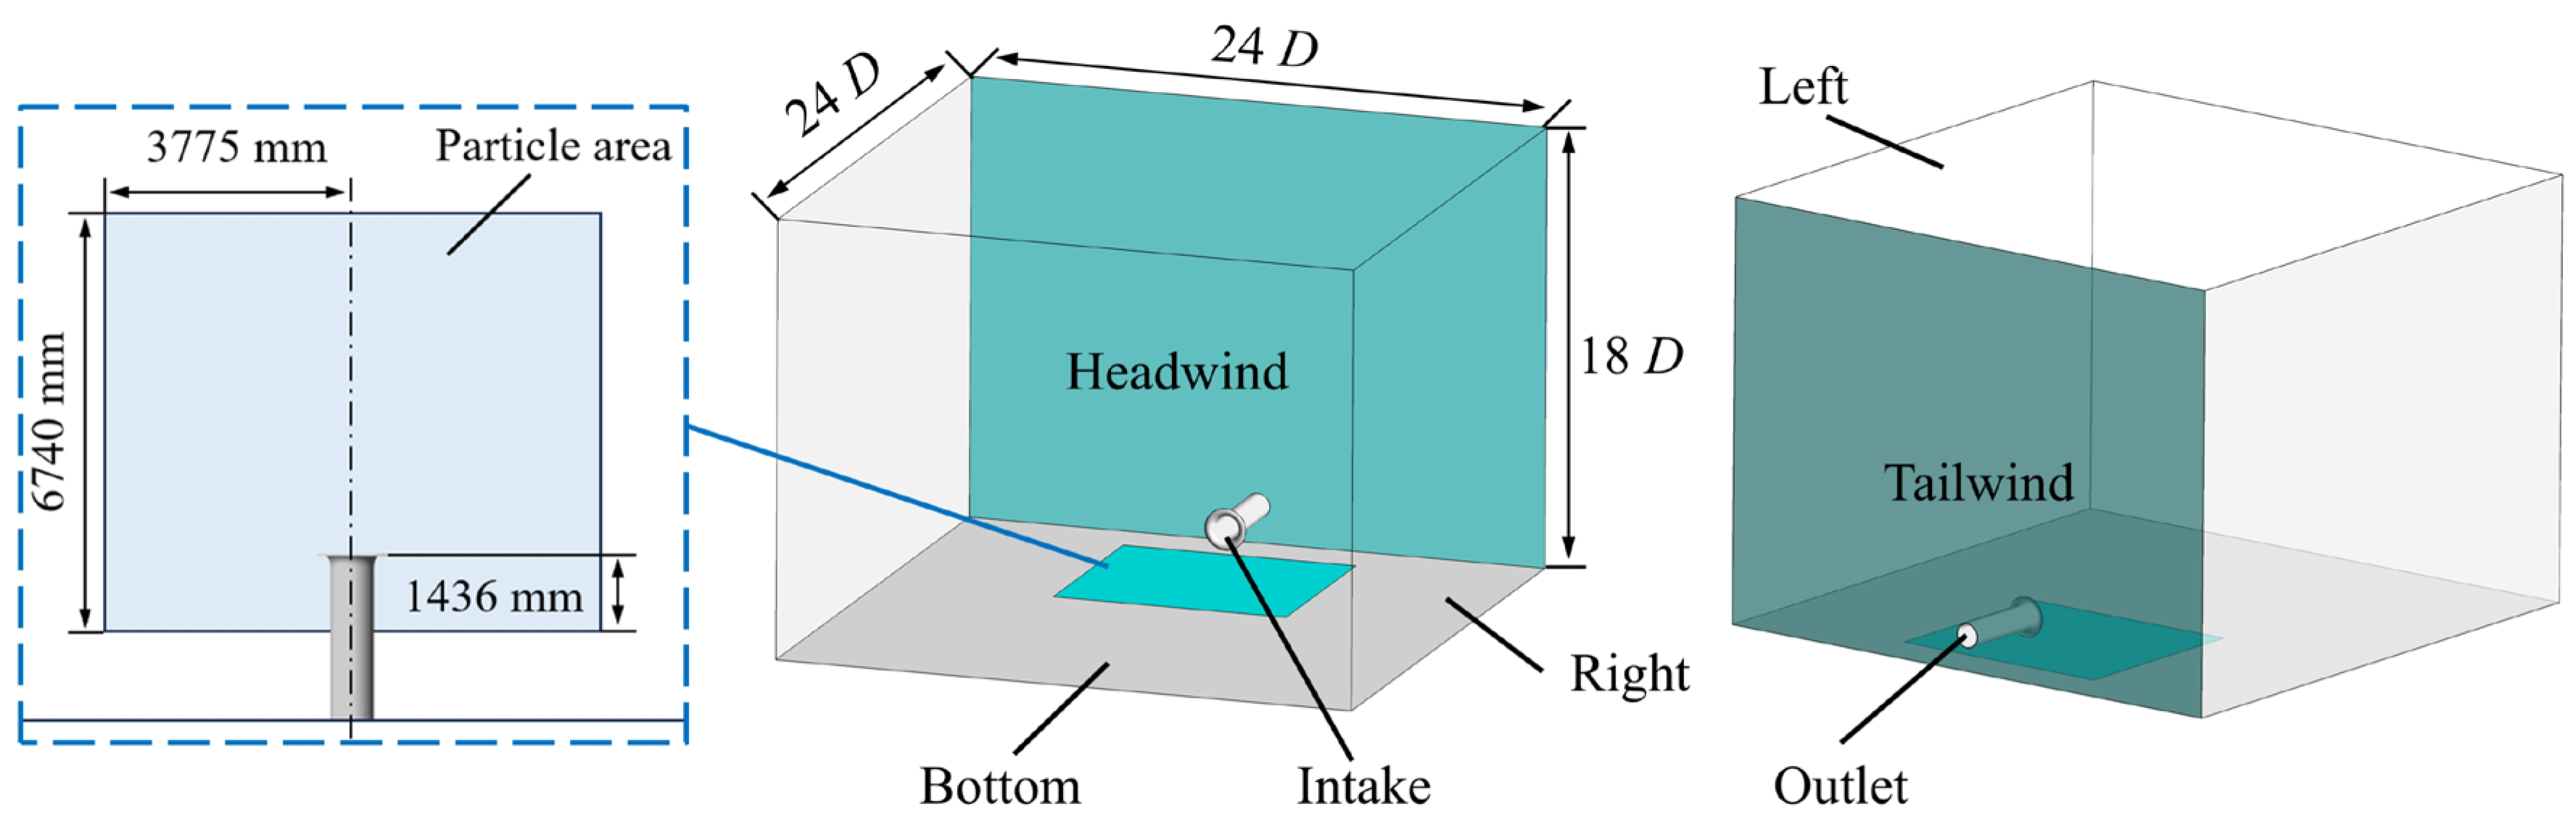
As illustrated in Figure 2, a rectangular computational domain was constructed to investigate the flow field structure. To minimize the influence of far-field boundary conditions on the development and strength of the ground vortex, the inner diameter (D) of the inlet was adopted as the characteristic length scale. Accordingly, the computational domain dimensions were defined as 18 D × 24 D × 24 D in the streamwise (x), lateral (y), and vertical (z) directions, respectively. This configuration ensures sufficient spatial extent for natural vortex formation and evolution while preventing artificial confinement or reflection effects from the domain boundaries. In particular, the lateral and vertical boundaries are located 12 D away from the intake centerline, providing adequate clearance for vortex development under headwind conditions. The outlet of the inlet is flush with the downstream wall to maintain a consistent mass-flow boundary condition and stable numerical implementation.
The boundaries of the computational domain were designated based on their relative positions to the intake. Specifically, the inner and outer walls of the intake were labeled as “intake”, while the exit of the intake was termed “outlet”. A rectangular region (6740 mm × 7550 mm) for particle placement, situated directly beneath the intake, was defined as the “Particle area”.

2.2. Definition of Parameters

2.2.1. Circulation Γ

To quantitatively analyze the strength of the ground vortex, the circulation Γ of the characteristic cross-section needs to be calculated. The definition of Γ is given by Equation (2) [12]:
Γ = ( × V )   d s = V d l
where V is the velocity vector along the closed curve, l is the closed curve enclosing the ground vortex, and s is the surface bounded by the closed curve. For data processing, the circulation is normalized, and the dimensionless circulation Γ* is defined as Equation (3):
Γ * = Γ / ( D V i )
where D is the inner diameter of the intake, and Vi is the axial average velocity at the measurement cross-section of the intake entrance.

2.2.2. Pressure Distortion Coefficient DC60

The pressure distortion at the intake entrance is quantitatively characterized by the pressure distortion coefficient DC60, defined as Equation (4) [12]:
DC 60 = p a v * p min 60 * q av
where pav is the average total pressure at the measurement cross-section of the intake, qav is the average dynamic pressure of the airflow at the measurement cross-section, and p min 60 * is the minimum average total pressure within a 60° sector. Following the approach of Murphy et al. [14], the measurement cross-section in this study is located at a distance of 0.7 D from the intake entrance.

2.2.3. Feature Plane

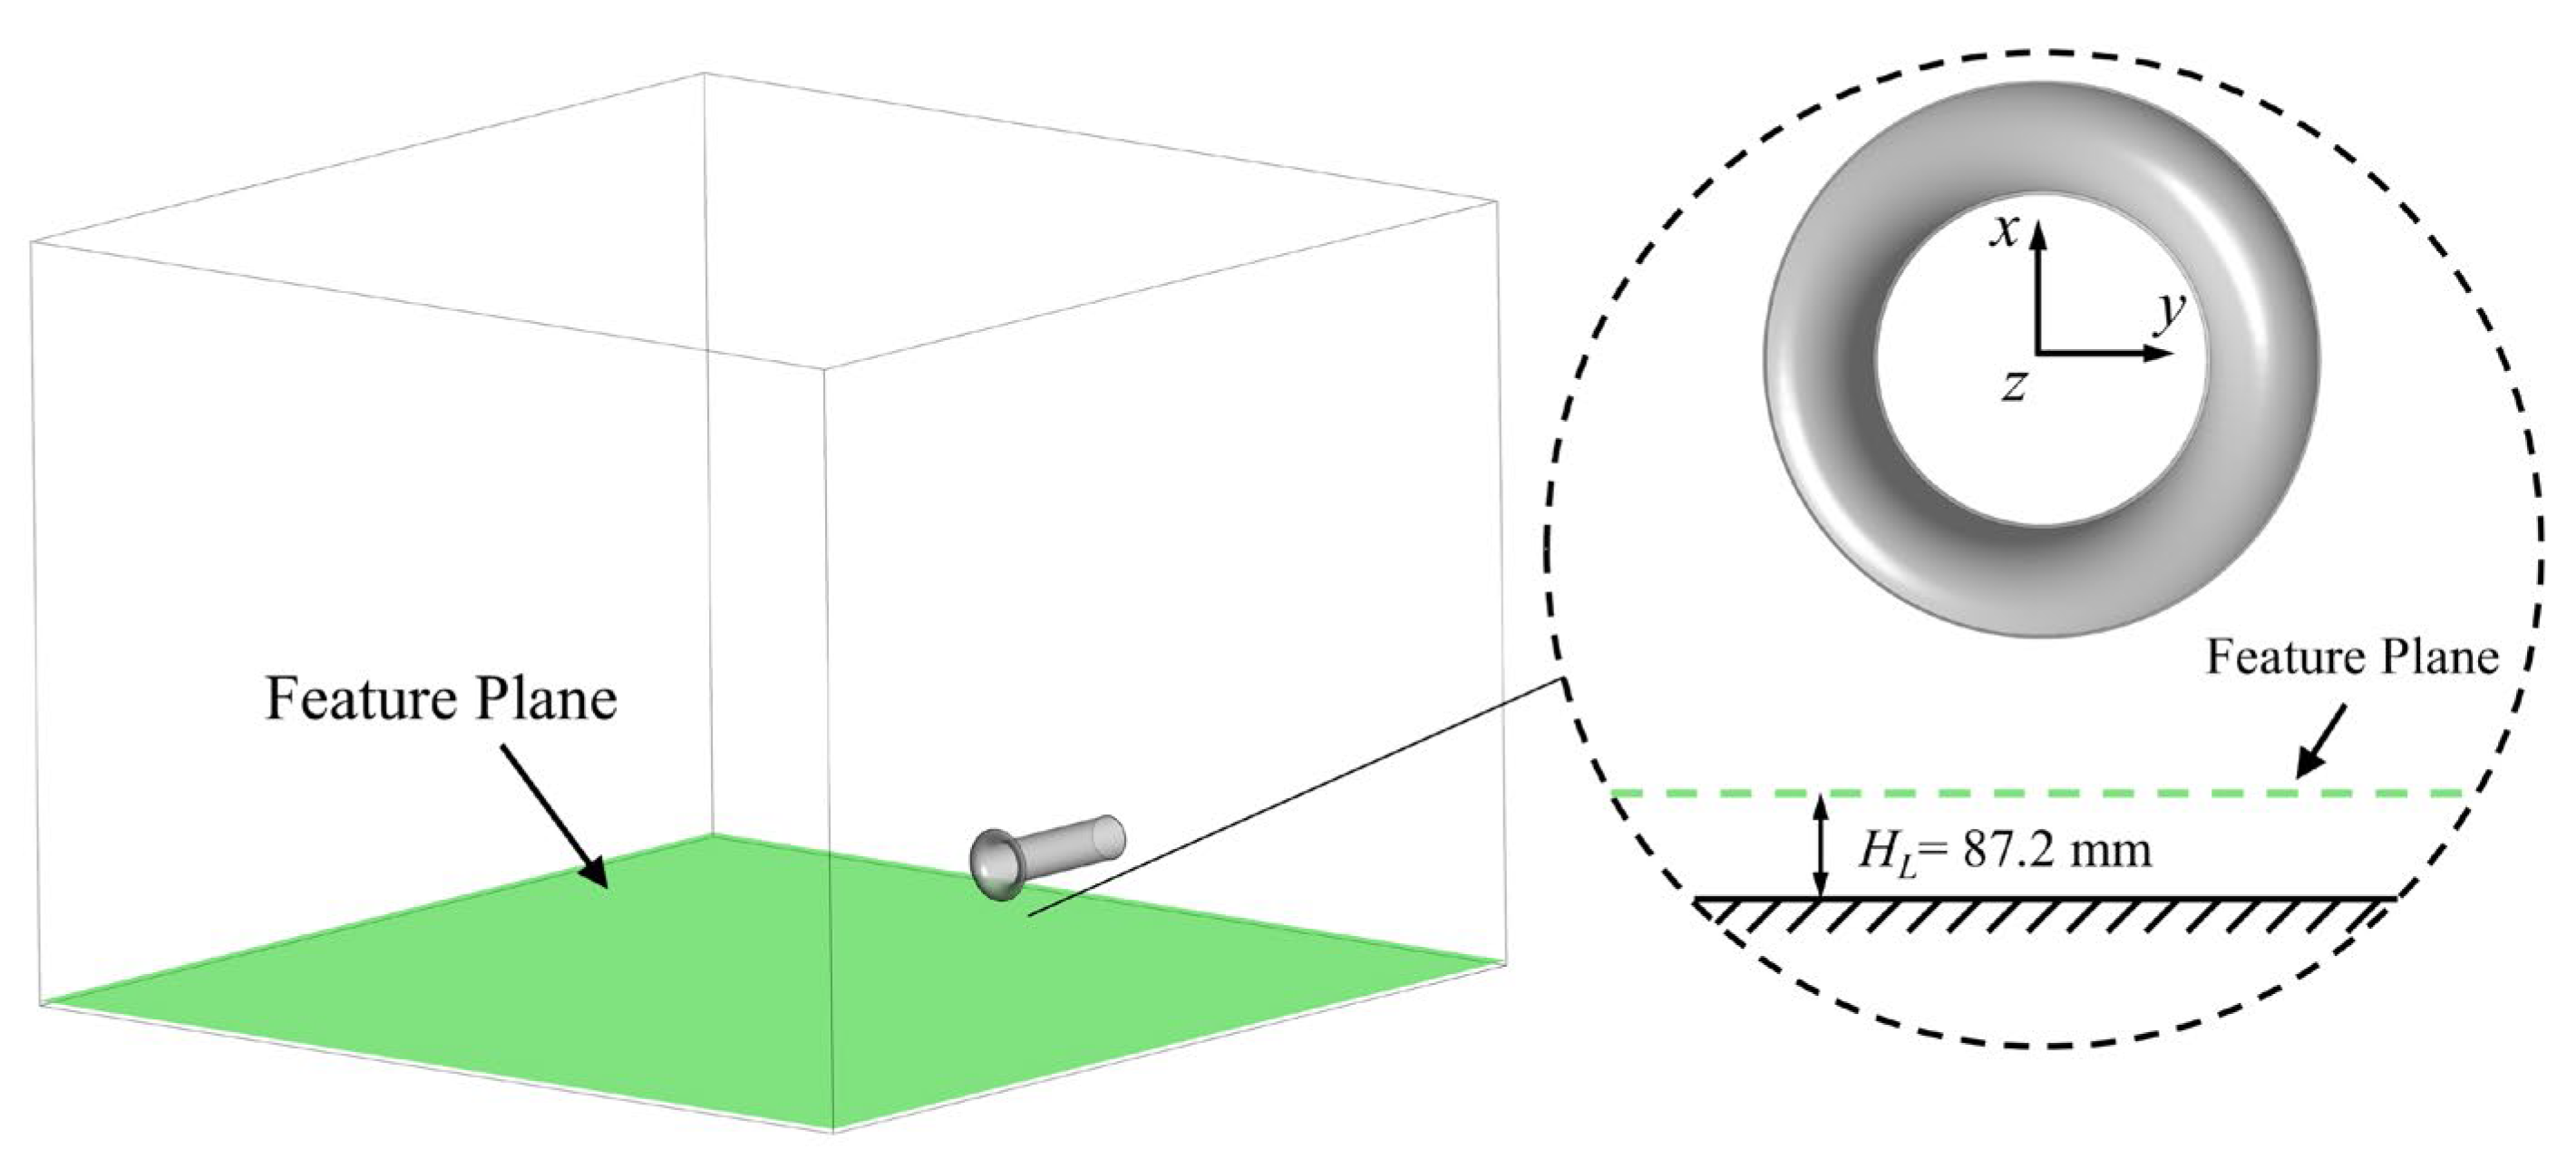
Since the ground is a no-slip boundary, the vorticity is zero. Therefore, to analyze and process the strength of the ground vortex, a new feature plane near the ground must be established to calculate the circulation of the ground vortex. As shown in Figure 3, this plane is parallel to the lower surface of the computational domain and remains fixed in position. Based on the findings of Murphy et al. [13], the flow field information of the ground vortex can be effectively captured when the height HL of the feature plane above the ground satisfies Equation (5):
H L / D l = 0.083
where Dl = 1050 mm is the mid-diameter of the intake, yielding HL = 87.2 mm.
A circular domain encompassing the ground vortex is created on the feature plane. To determine the radius of this disk zone, nine radii ranging from 600 mm to 760 mm are selected at equal intervals. A validation case is conducted with a ground clearance of 1.5 D, an incoming flow velocity of 10 m/s, and an engine flow rate of 60 kg/s. Under these conditions, the total circulation Γ and the circulation variation rate ε within circular domains of different radii are calculated. The circulation variation rate ε is defined as Equation (6):
ε = ( Γ n + 1 Γ n ) / Γ n × 100 %   ,   n = 1 ,   2 ,   8
where n is the index of the test case.
The calculation results are presented in Table 1. As the radius of the circular domain increases, the circulation variation rate gradually decreases. When r = 740 mm, the circulation variation rate falls below 1%. Therefore, a radius of 740 mm is adopted for the circular domain in subsequent calculations of ground vortex circulation integration.

2.3. Mesh and Verification

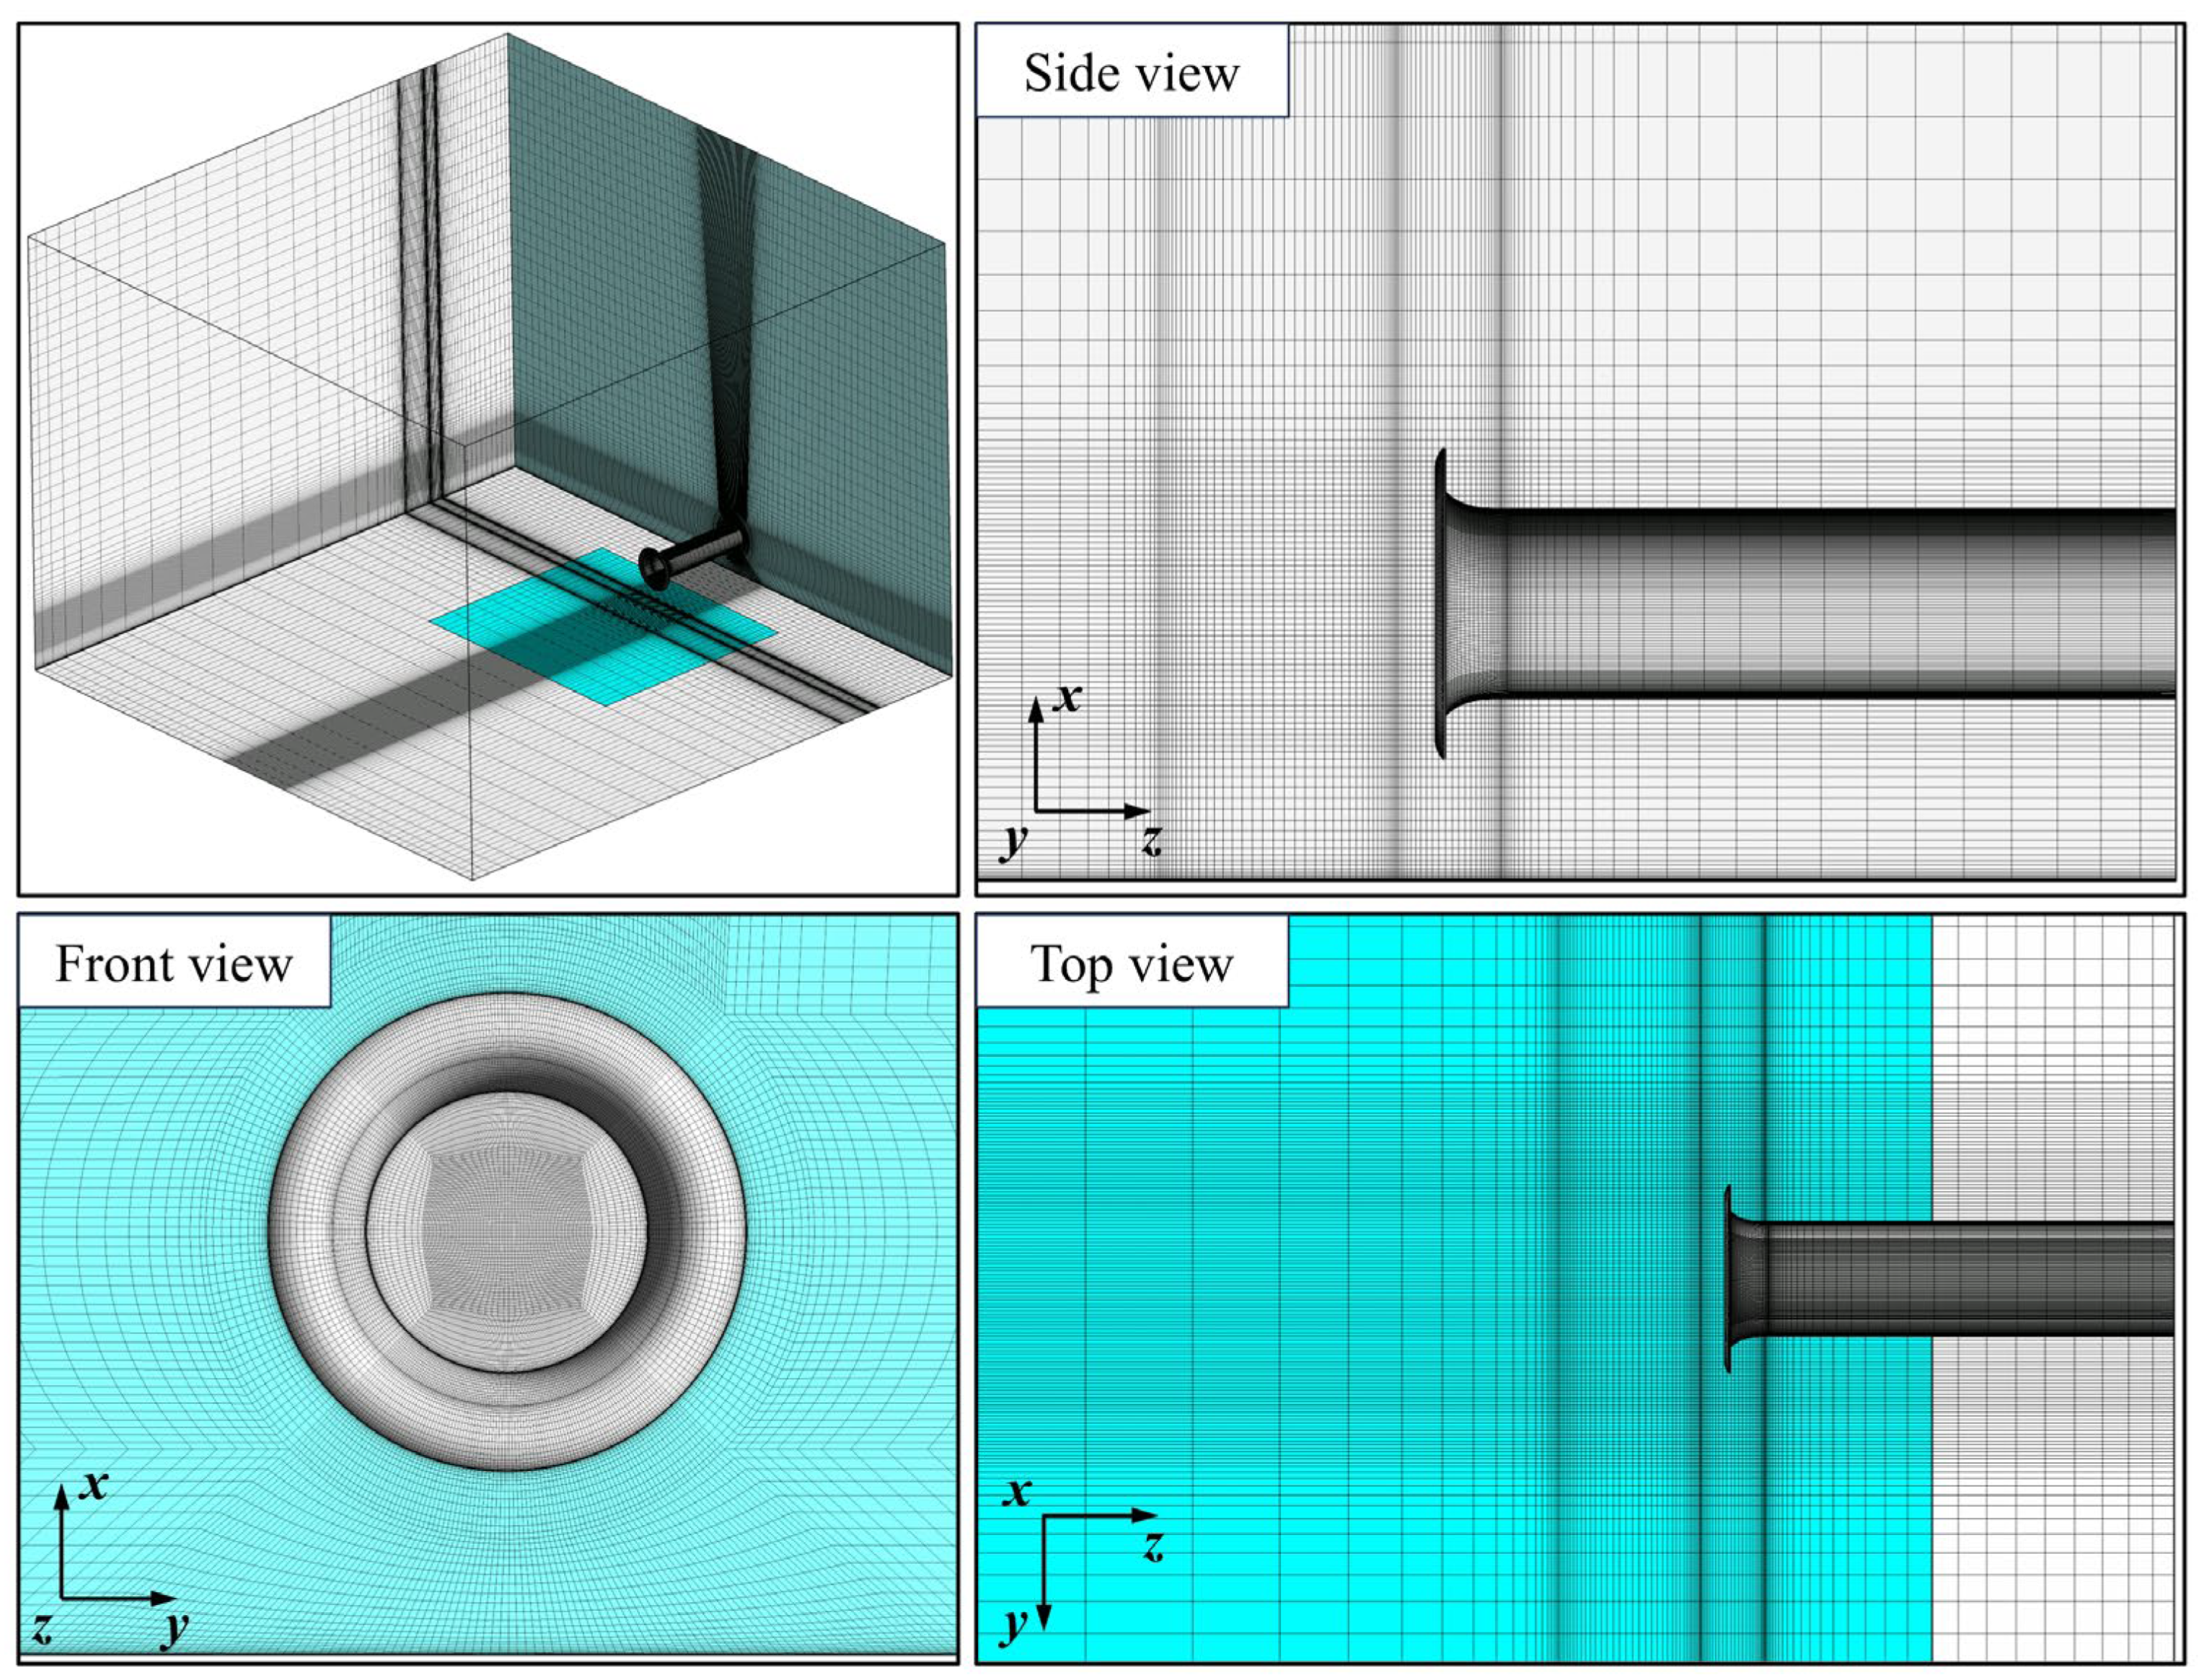
The computational domain depicted in Figure 2 was meshed using ICEM-CFD, employing a hexahedral structured grid. The height of the first layer of grid at the wall boundaries was set to 0.001 mm, with a total of 15 layers within the boundary layer. To accurately capture the flow field characteristics of the ground vortex, the grid was refined below the intake and at the intake entrance. The meshing results are shown in Figure 4.
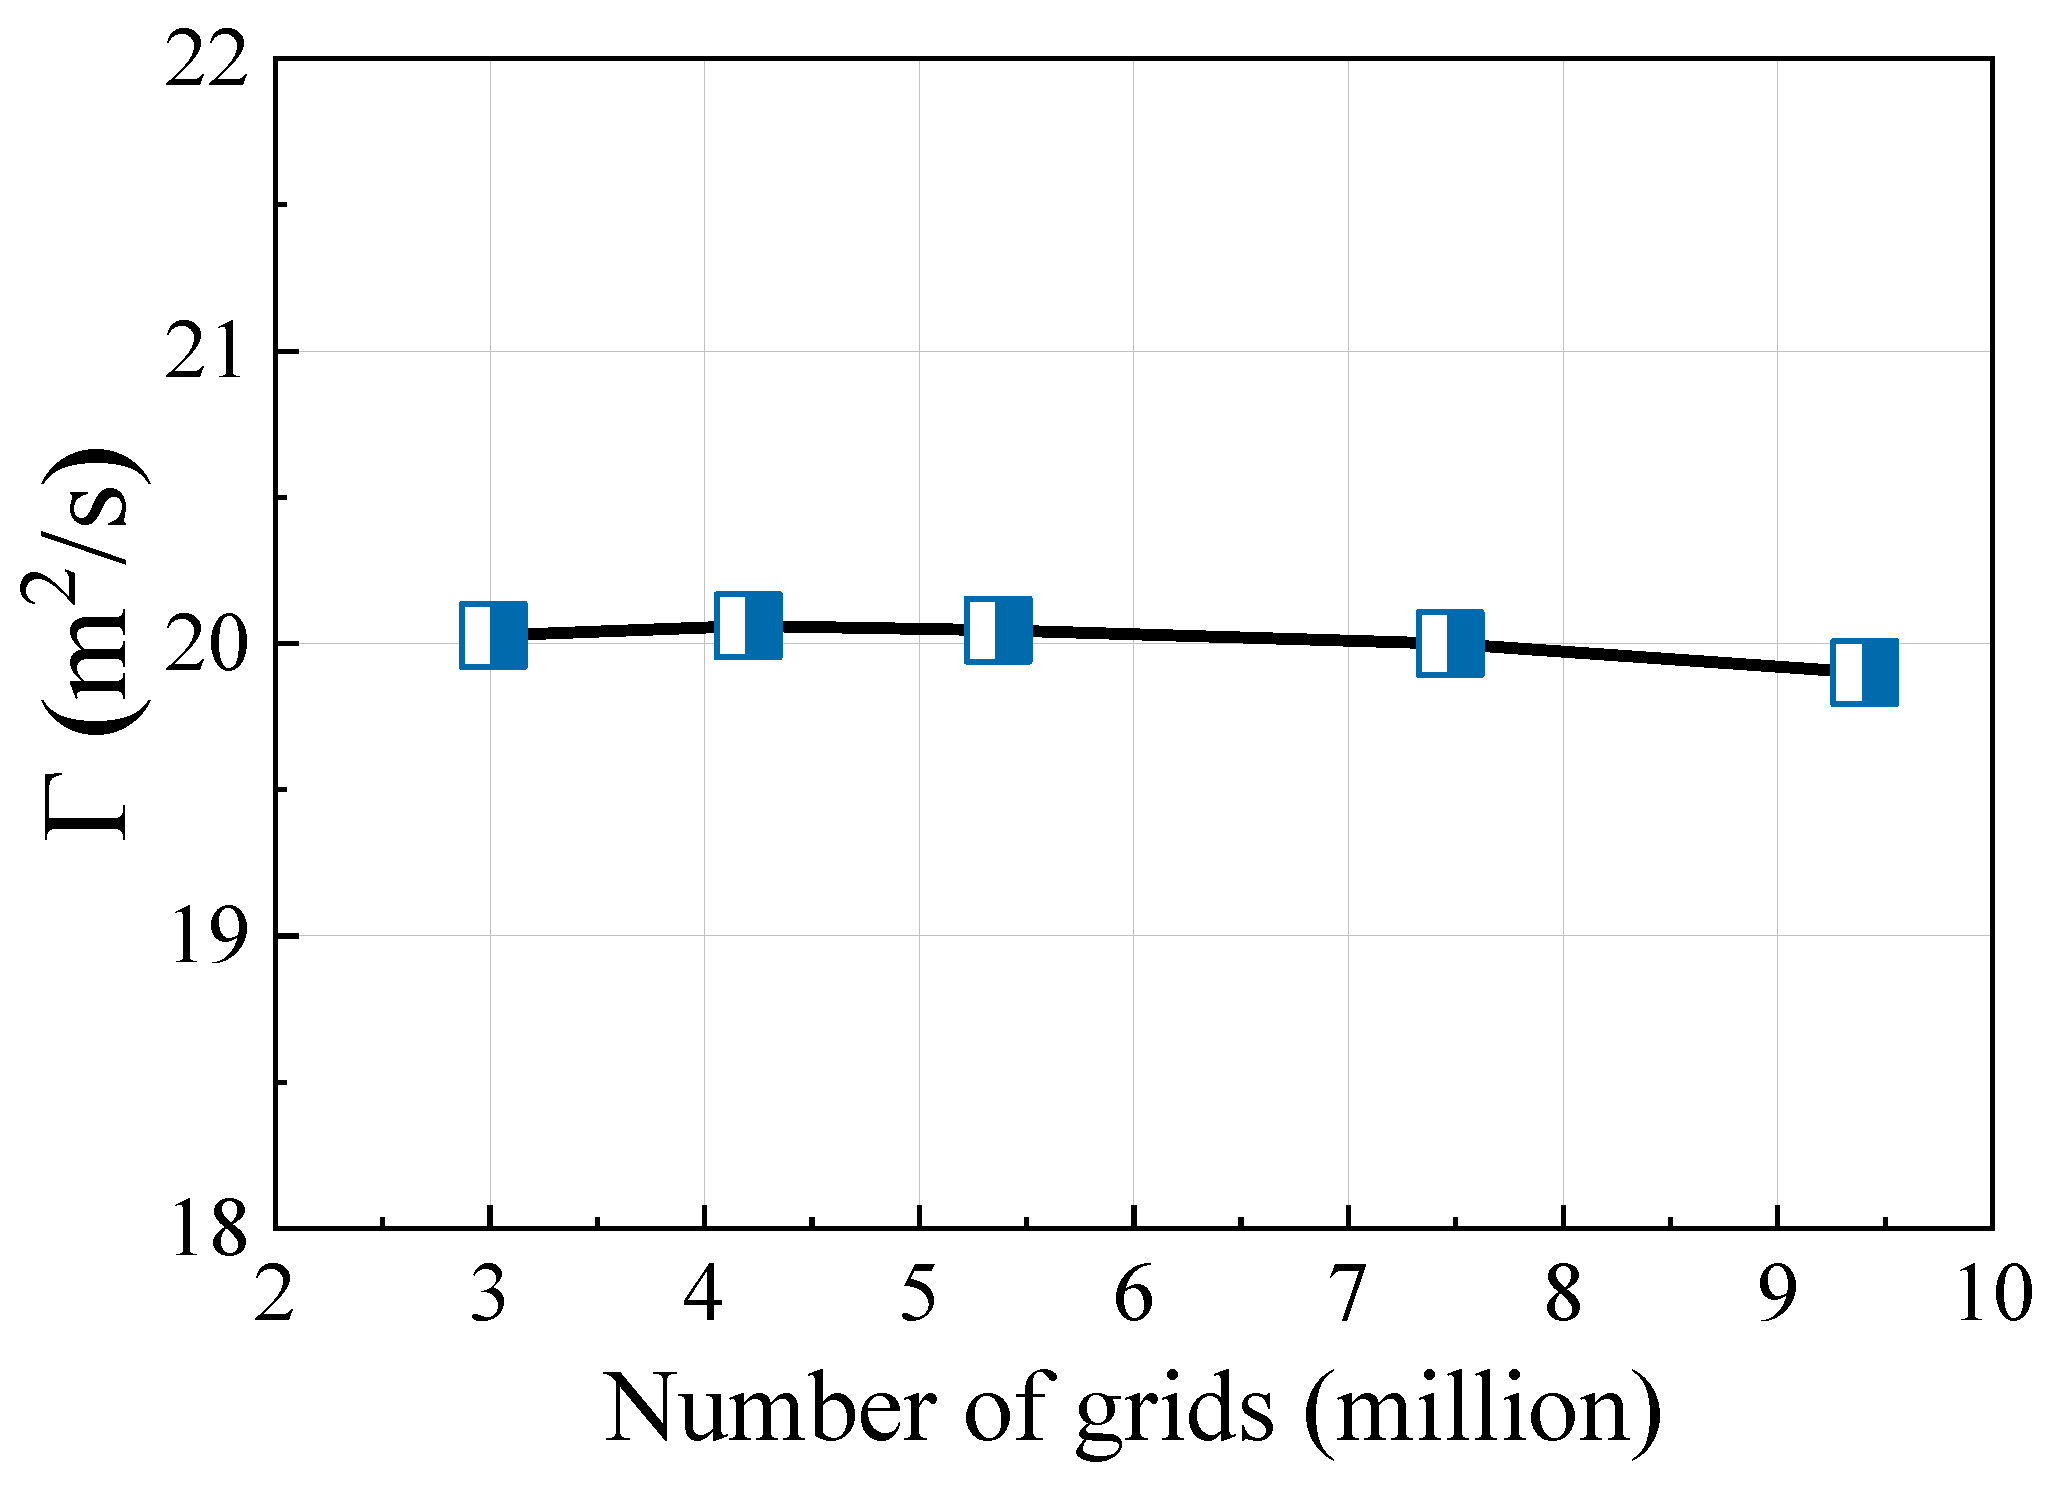
To assess the influence of grid density on the accuracy of the computational results, the circulation Γ of the ground vortex was used as a validation parameter. The variation in Γ with grid size was compared across five different grid densities, as illustrated in Figure 5. The results demonstrate that when the number of grid cells reaches approximately 5.5 million, the circulation Γ remains essentially unchanged. Consequently, a grid size of 5.5 million cells was adopted for subsequent simulations.
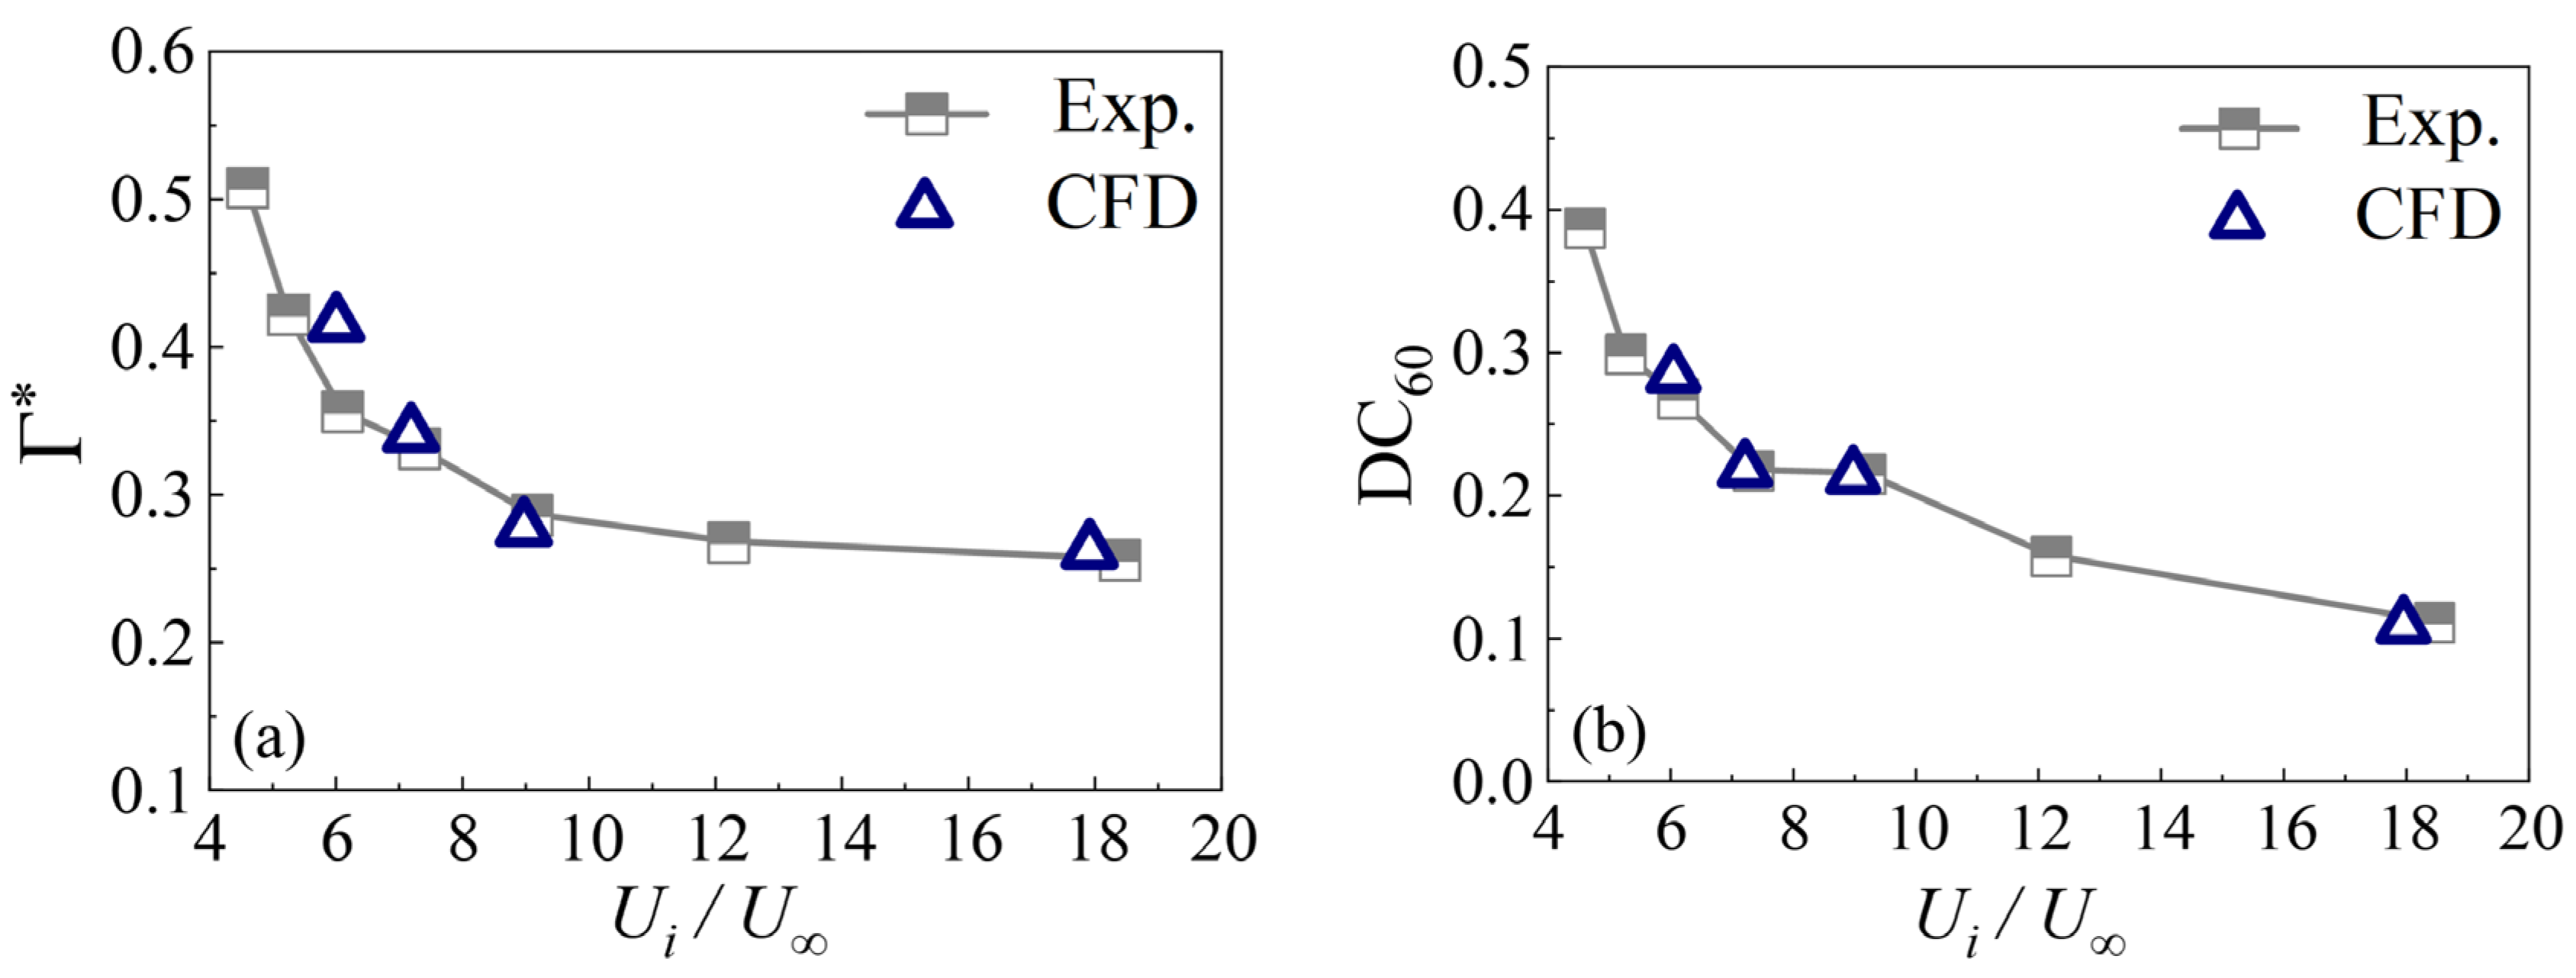
While the intake geometry investigated herein is relatively simple and could, in principle, be reproduced experimentally, a dedicated test facility would require simultaneous control of headwind inflow conditions, precise suction (mass-flow) regulation, time-resolved distortion measurements at the intake plane, and repeatable particle seeding and tracking for foreign object ingestion (FOI) assessment. Therefore, no dedicated experimental campaign was conducted for the specific intake configuration shown in Figure 1. To verify the credibility of the numerical methodology adopted in this study, the computational results were validated against the scaled intake experimental data reported by Murphy [13]. The comparison focused on engine intake operation under crosswind conditions, where well-documented measurements of vortex strength and distortion characteristics are available. The dimensionless circulation (vortex strength) Γ* and the pressure distortion coefficient DC60 under different incoming flow velocities were compared with the corresponding experimental results, as shown in Figure 6. The predicted Γ* and DC60 values at the monitoring locations exhibit close agreement with the experimental data. Although the deviation in vortex strength Γ* is noticeable at low velocity ratios U* (where the ratio of intake velocity to incoming flow velocity is less than 7), the deviation decreases to less than 3% when U* exceeds 7. In the present study, where U* is greater than 10, the numerical approach is therefore demonstrated to accurately capture the essential characteristics of ground vortex formation and associated inlet distortion.

2.4. Discrete-Term Governing Equations

In this study, the solid volume fraction is relatively small, and inter-particle collisions are negligible. Therefore, the Euler–Lagrange DPM is employed to simulate the process of particle ingestion into the intake by tracking the trajectory of each individual particle [25]. In this model, the gas phase is treated as a continuous medium and described using the Eulerian approach, while the solid particles are treated as a discrete phase and described using the Lagrangian approach [26]. When solving for particle trajectories using the Lagrangian method, the particles are primarily influenced by the resultant force of gravity and buoyancy ( F h ), drag force ( F d ), pressure gradient force ( F p ), virtual mass force ( F v m ), and Safran lift force ( F l s ) [27,28]. According to Newton’s second law, the force balance equation for a particle is given by Equation (7):
m P d u P d t = F h + F d + F p + F v m + F l s
where m P is the mass of the particle, and u P is the velocity of the particle.
The resultant force of gravity and buoyancy ( F h ) can be calculated as Equation (8):
F h = m P g ρ P ρ f ρ P
where g is the gravitational acceleration, and ρ P and ρ f are the densities of the particle and the continuous phase, respectively.
The drag force ( F d ), which acts on the particle due to its relative motion with respect to the fluid, is given by Equation (9):
F d = 1 2 C d ρ f A P u f u P u f u P
where u f and u p denote the velocity vectors of the fluid and the particles, respectively, while AP represents the projected area of the particles in the direction of motion. The Schiller–Naumann correlation [29], as expressed Equation (10), which is suitable for spherical solid particles, is used to calculate the drag coefficient Cd:
C d = 24 R e P 1 + 0.15 R e P 0.687 ,   R e P 10 3   0.44   ,   R e P > 10 3
where R e P is the particle Reynolds number which can be obtained through Equation (11):
R e P = ρ f u S D P / μ
where u s is the slip velocity of particles which can be calculated through Equation (12). μ is the dynamic viscosity of the fluid and DP is the particle diameter.
u f u P = u s
The pressure gradient force ( F p ), which arises due to the pressure gradient in the fluid, is expressed as Equation (13):
F P = m P ρ f ρ P A P u f u f
The virtual mass force ( F v m ), which represents the additional resistance encountered by a particle accelerating through the fluid, is given by Equation (14):
F v m = C v m m P ρ f ρ P u P u f d u P d t
where Cvm = 0.5 is the virtual mass coefficient.
The Saffman lift force ( F l s ) [30], which occurs when there is a velocity difference between the particle and the surrounding fluid and the velocity gradient of the fluid is perpendicular to the particle’s motion direction, is expressed as Equation (15):
F l s = 4.1126 R e S 0.5 ρ P π 8 D P 3 u S × × u
where × u = ω is the curl of the fluid velocity, and R e S is the shear flow Reynolds number, defined as Equation (16):
R e S = ρ f D P 2 ω μ
In addition to force balance, the rotation of the particles also significantly influences their trajectory in the fluid. Therefore, the discrete phase model also accounts for the effect of particle rotation by solving the angular momentum of ordinary differential equation, as shown in Equation (17):
I P d ω P d t = ρ f 2 D P 2 5 C ω   ·  
where I P is the moment of inertia, ω p is the particle angular velocity, Cw is the rotational drag coefficient, and Ω is given by Equation (18), which represents the relative angular velocity between the particle and the fluid:
  Ω   = 1 2 × u ω P

2.5. Boundary Conditions

The simulations were performed using ANSYS Fluent 2021 R1. To improve computational convergence, a steady-state approach was initially employed to simulate the ground vortex flow field without particles. Once the flow characteristics of the ground vortex (including vortex strength, pressure at monitoring points, and velocity) reached a statistically steady equilibrium, this state was utilized as the initial condition for unsteady calculations. The Euler–Lagrange method was applied with a time step of 0.01 s and a total computation time of 10 s. Turbulence was modeled using the SST k-ω model, with the working fluid treated as an ideal gas and the particles as solids [31].
The outlet of the intake was configured as a mass flow outlet with a flow rate of 90 kg/s. The “Headwind” was defined as a velocity inlet with a speed of 10 m/s. The bottom surface beneath the intake and the inner and outer walls of the intake were set as adiabatic walls. The “Particle area” is designated as both an adiabatic wall and an inflow boundary for particles, with a total particle count of 5.0887 × 10⁷. The prescribed particle population ensures a statistically representative dilute particulate field while remaining consistent with the one-way coupling assumption of the Euler–Lagrange DPM framework. For the investigation of particle size effects on FOI characteristics, three different diameters (20 μm, 30 μm, and 40 μm) of sand particles are employed. These particle sizes fall within the representative range of fine sand-scale debris typically reported in near-ground ingestion studies and have been widely considered in experimental and numerical investigations of vortex-induced foreign object ingestion [19,20]. In the study of particle density effects on FOI, particles with a uniform diameter of 10 μm—comprising sand (ρ = 2.64 g/cm3), titanium alloy (ρ = 4.85 g/cm3), and structural steel (ρ = 7.85 g/cm3)—are utilized to isolate the influence of inertia while maintaining geometric consistency. All remaining boundaries are assigned far-field conditions with a relative pressure of 101,325 Pa and a static temperature of 288 K. Detailed boundary condition settings are summarized in Table 2.

3. Results and Discussions

This section investigates the aerodynamic behavior of ground vortices and their role in FOI under headwind conditions. Unsteady vortex formation, pressure distortions, and vorticity structures are analyzed. The study also explores how particle density and diameter affect ingestion dynamics. Through visualizations and statistical analyses, it reveals the interaction between vortex structures and particle responses, enhancing understanding of FOI mechanisms near the ground.

3.1. Aerodynamic Characteristics of Ground Vortex

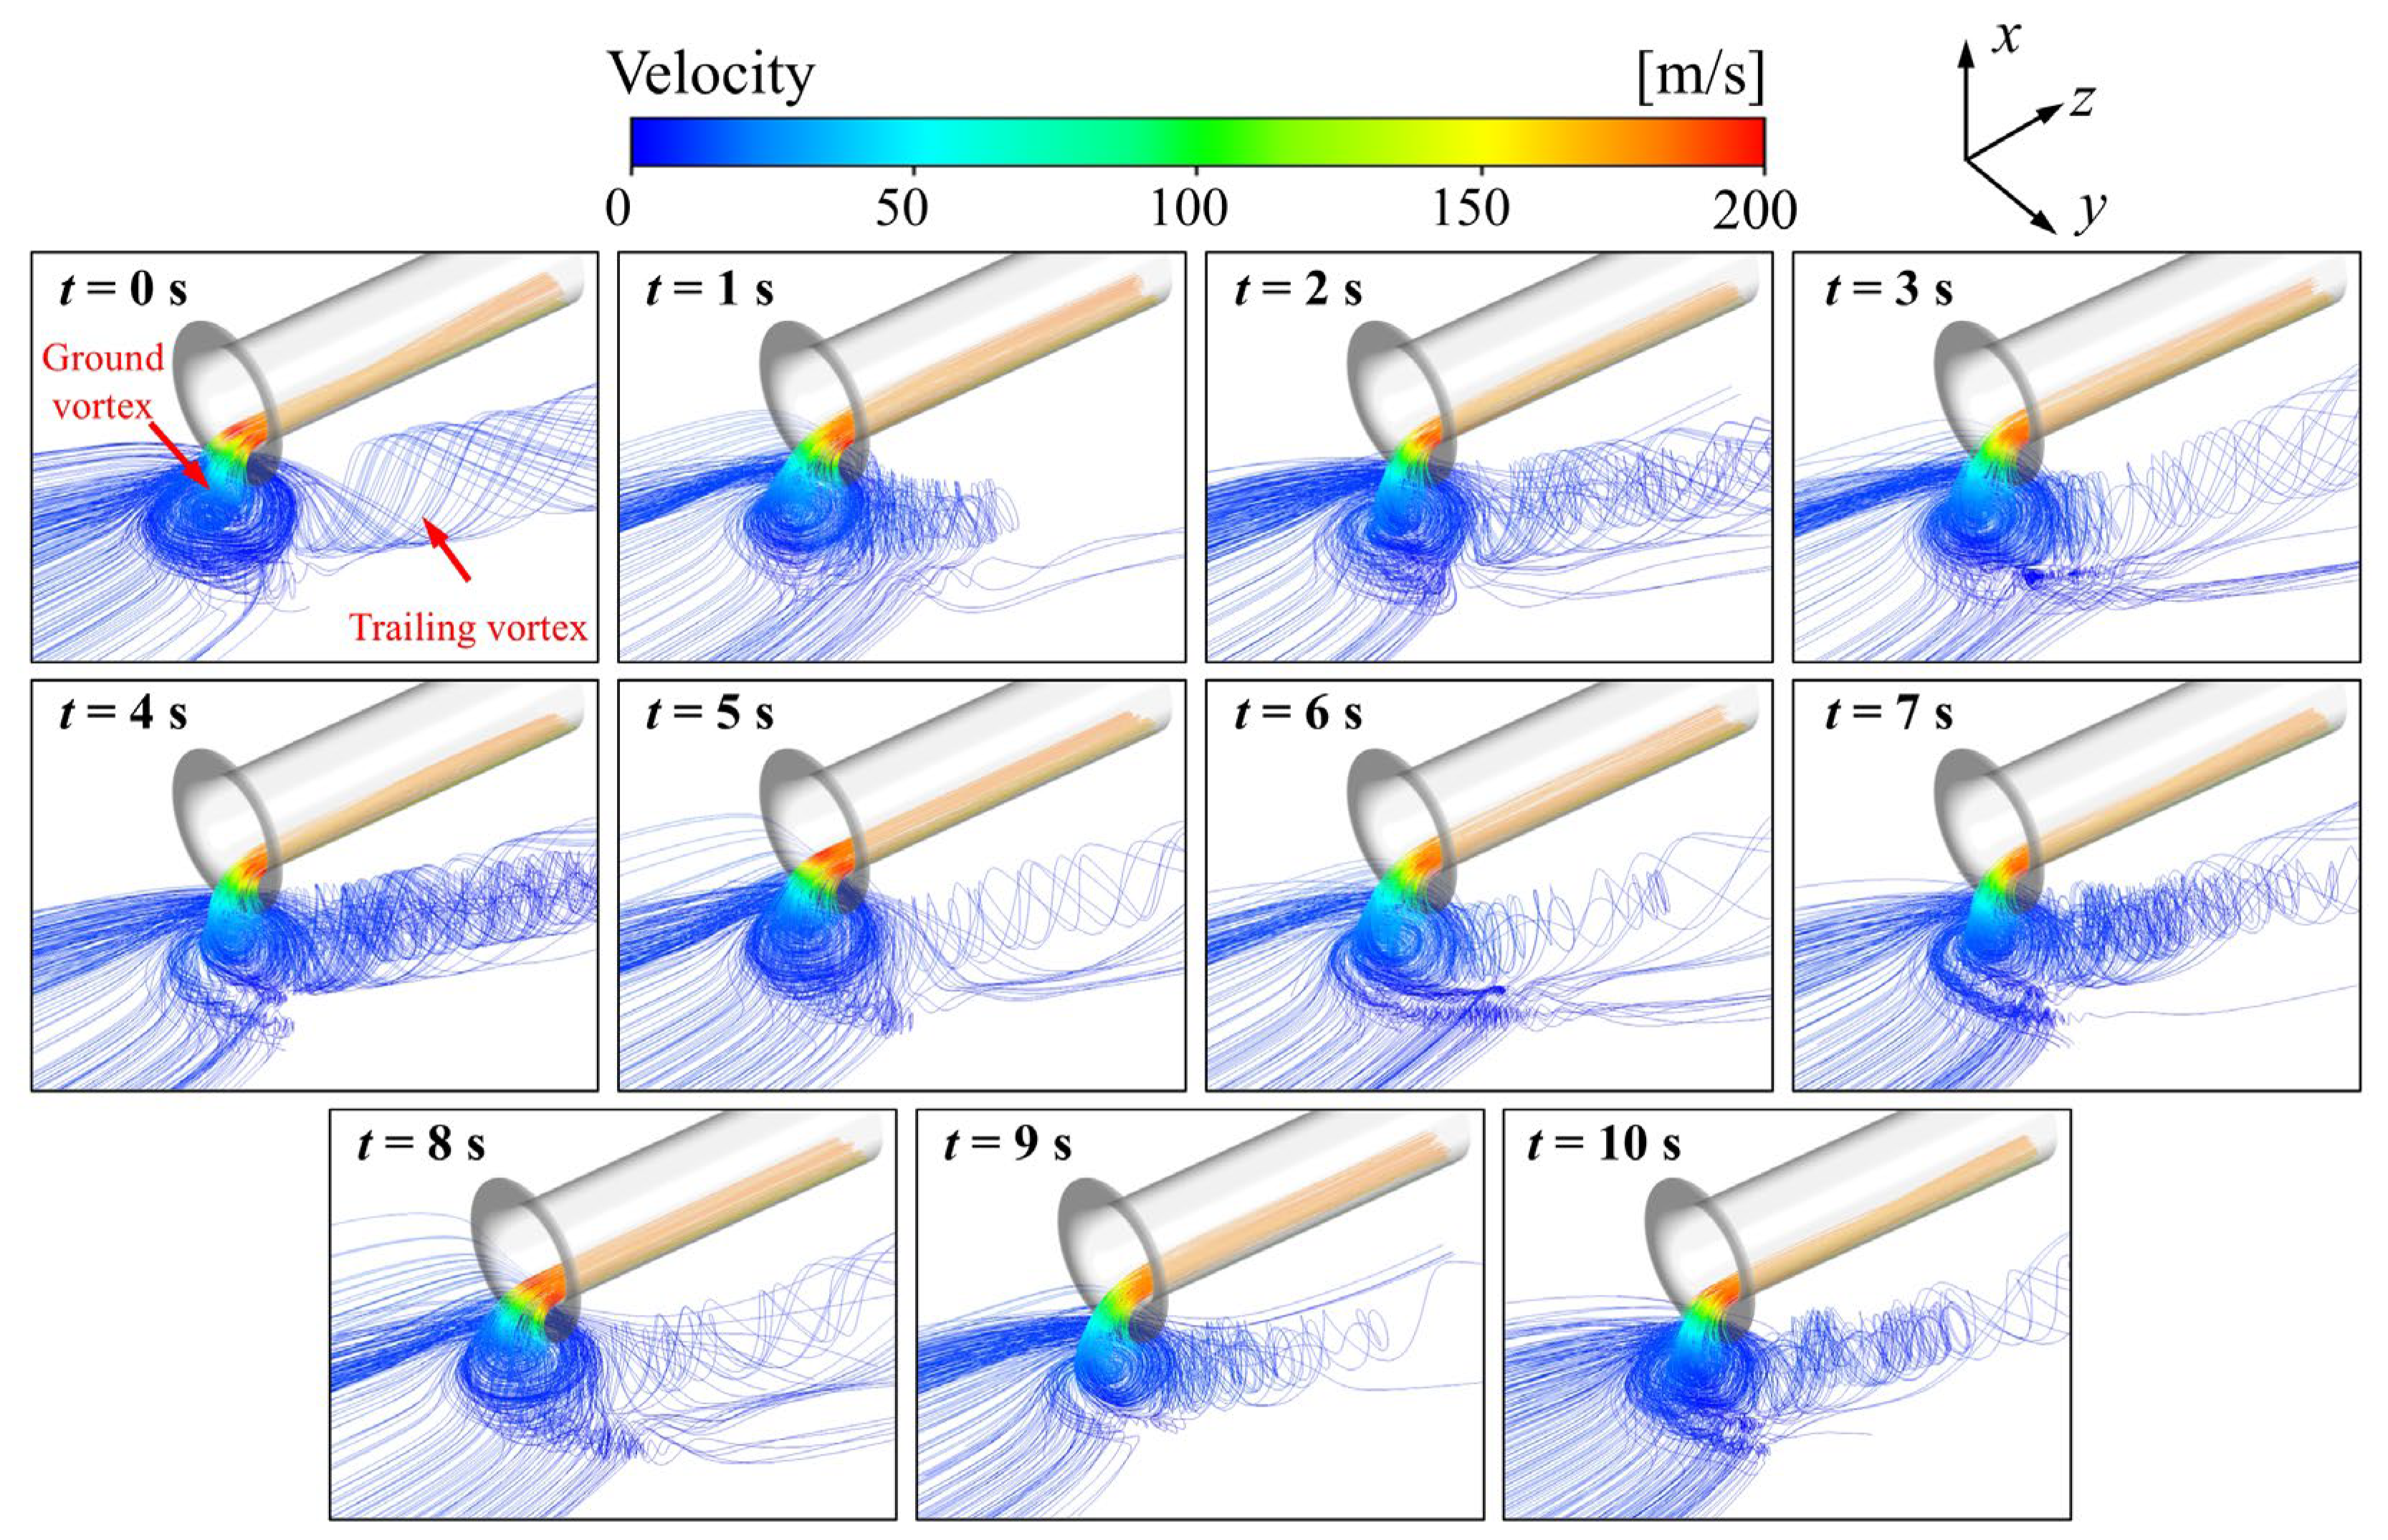
Figure 7 illustrates the ground vortex streamline at different times. Under the suction effect of the inlet, the surrounding streamlines converge beneath the inlet lip and form a vortex structure with clockwise rotation. This vortex structure subsequently lifts under continuous suction and is eventually ingested into the inlet, culminating in the formation of a ground vortex. Additionally, due to the blocking effect of the inlet lip, a trailing vortex structure emerges below the inlet. Over time, both the size and position of the ground vortex and trailing vortex exhibit noticeable variations, indicating the highly unsteady nature of the ground vortex.
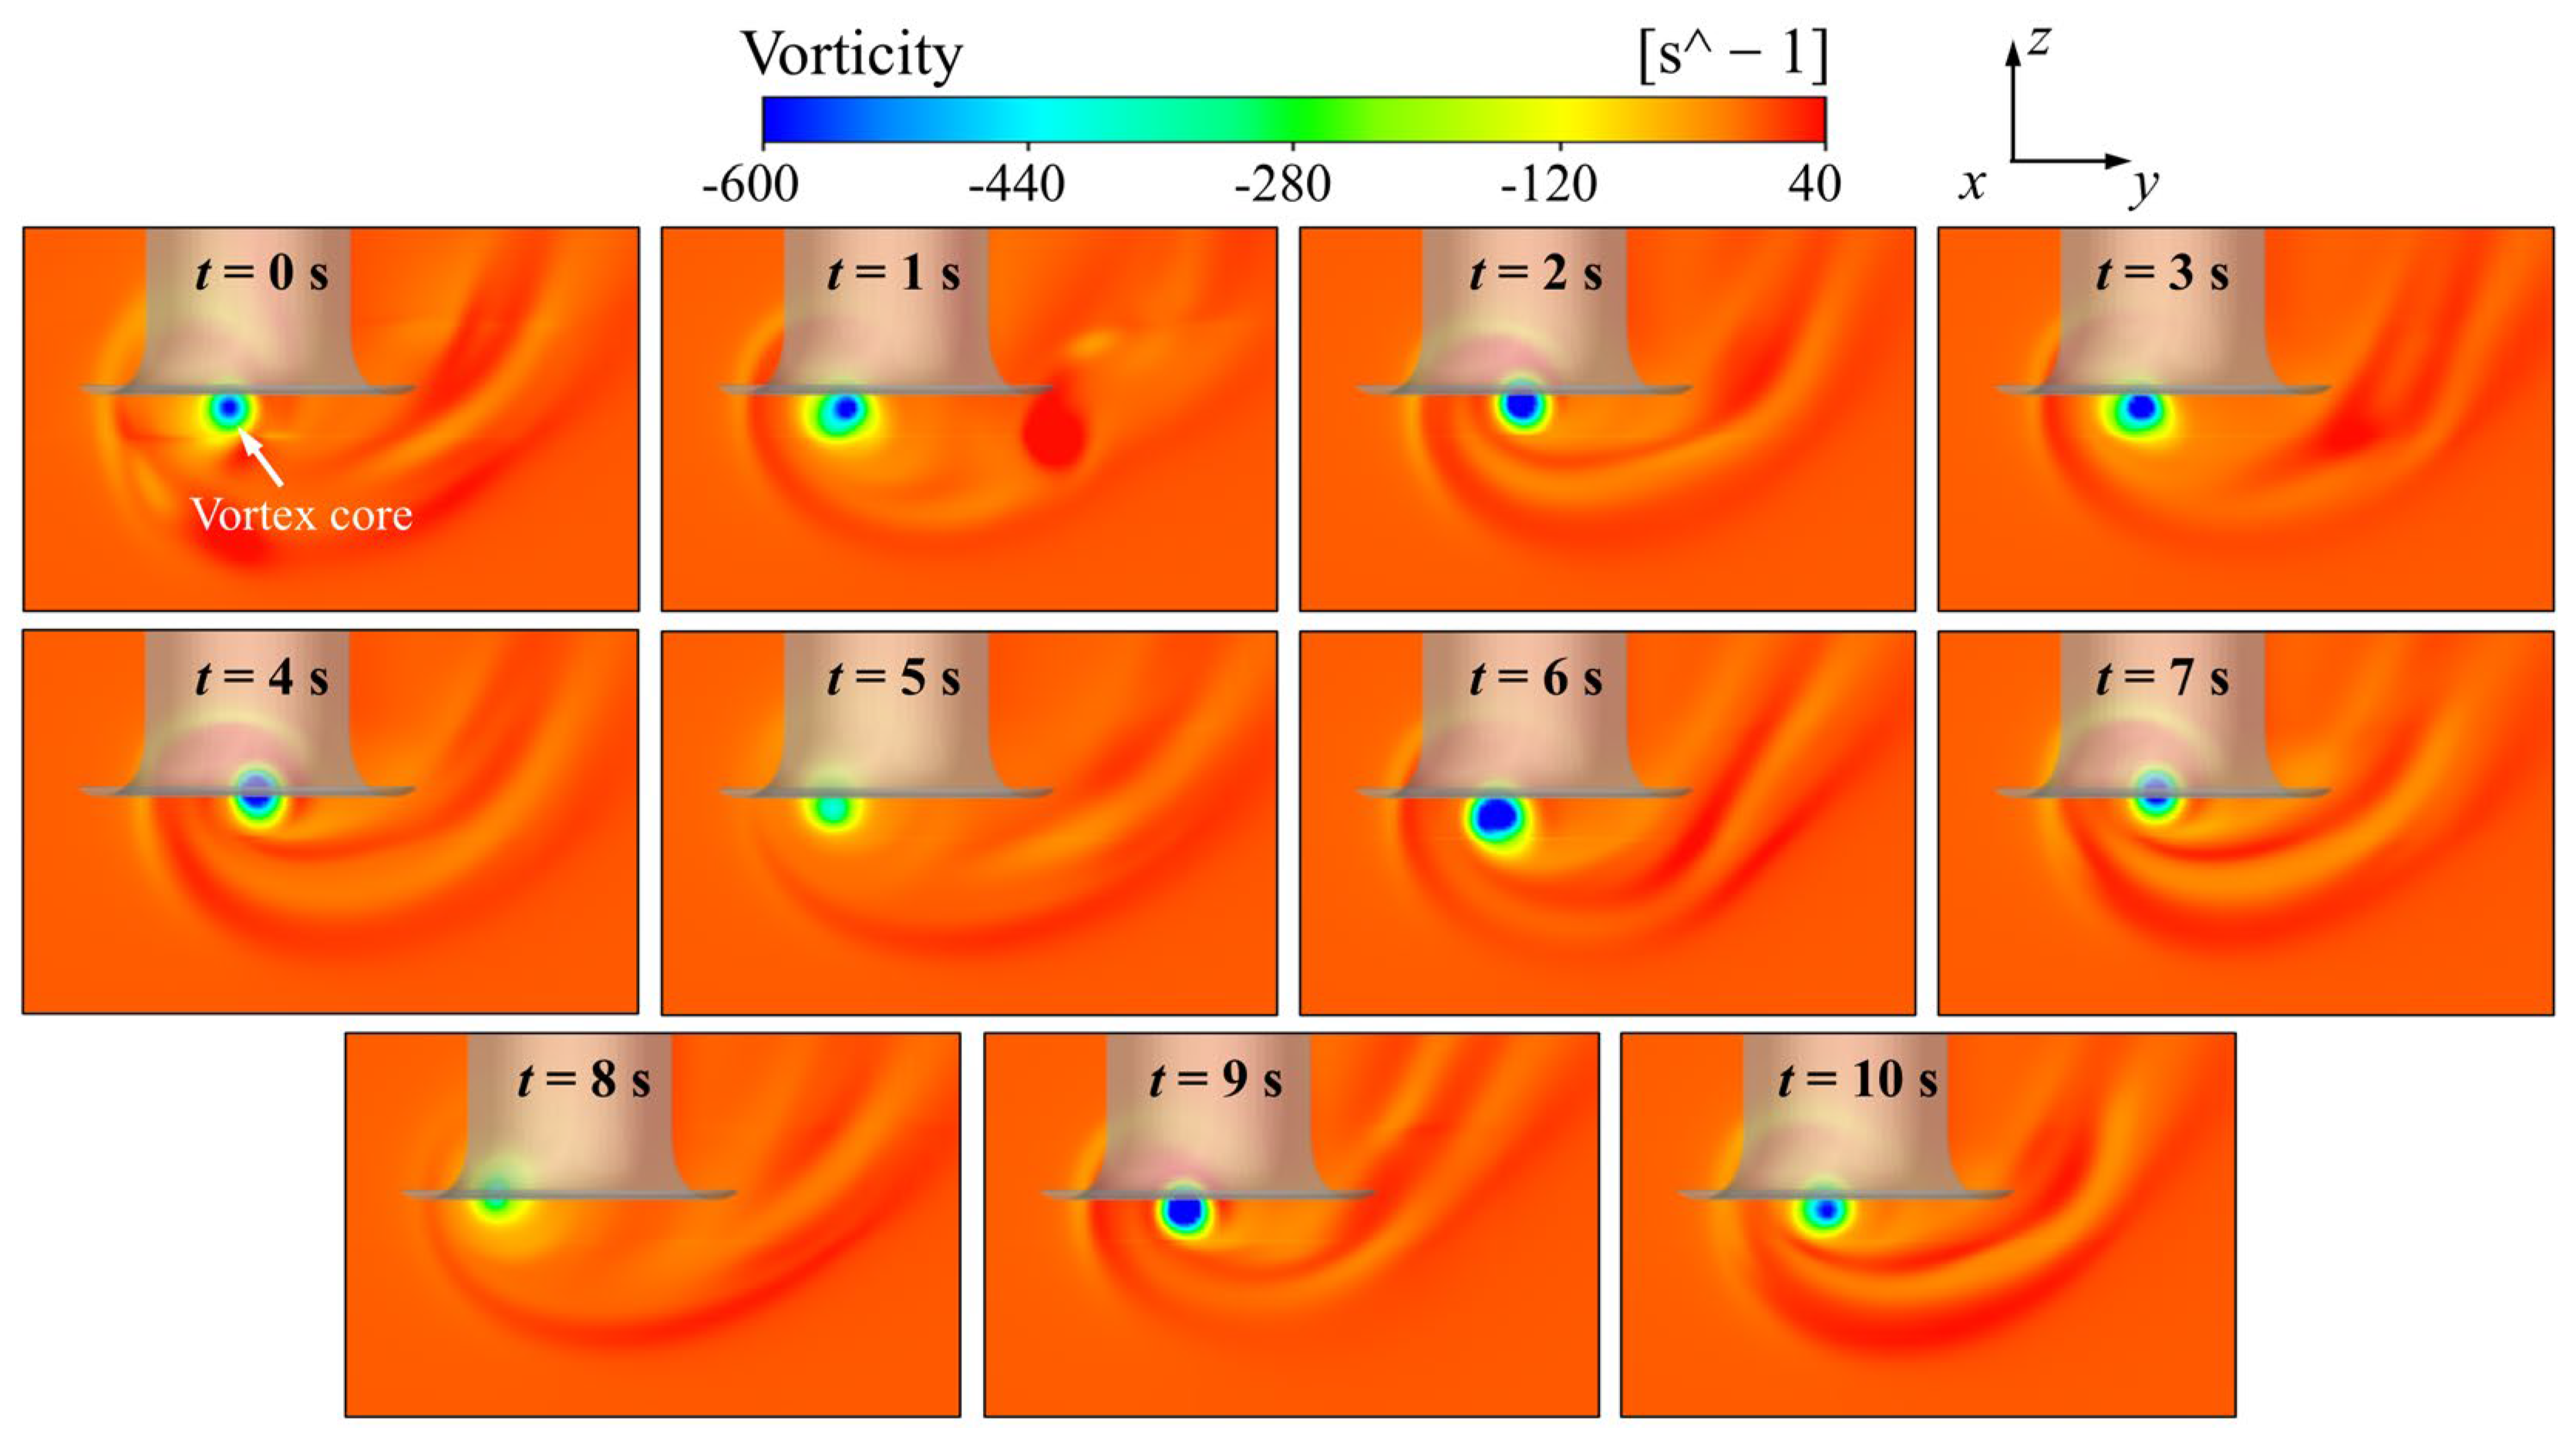
Figure 8 presents the vorticity contours on feature plane at different times. The contours reveal that a ground vortex with clockwise rotation consistently forms below the inlet, with its core size and position varying temporally. The vortex core maintains a relatively fixed position in the z-direction, situated directly beneath the inlet lip on the ground, while its y-position fluctuates significantly.
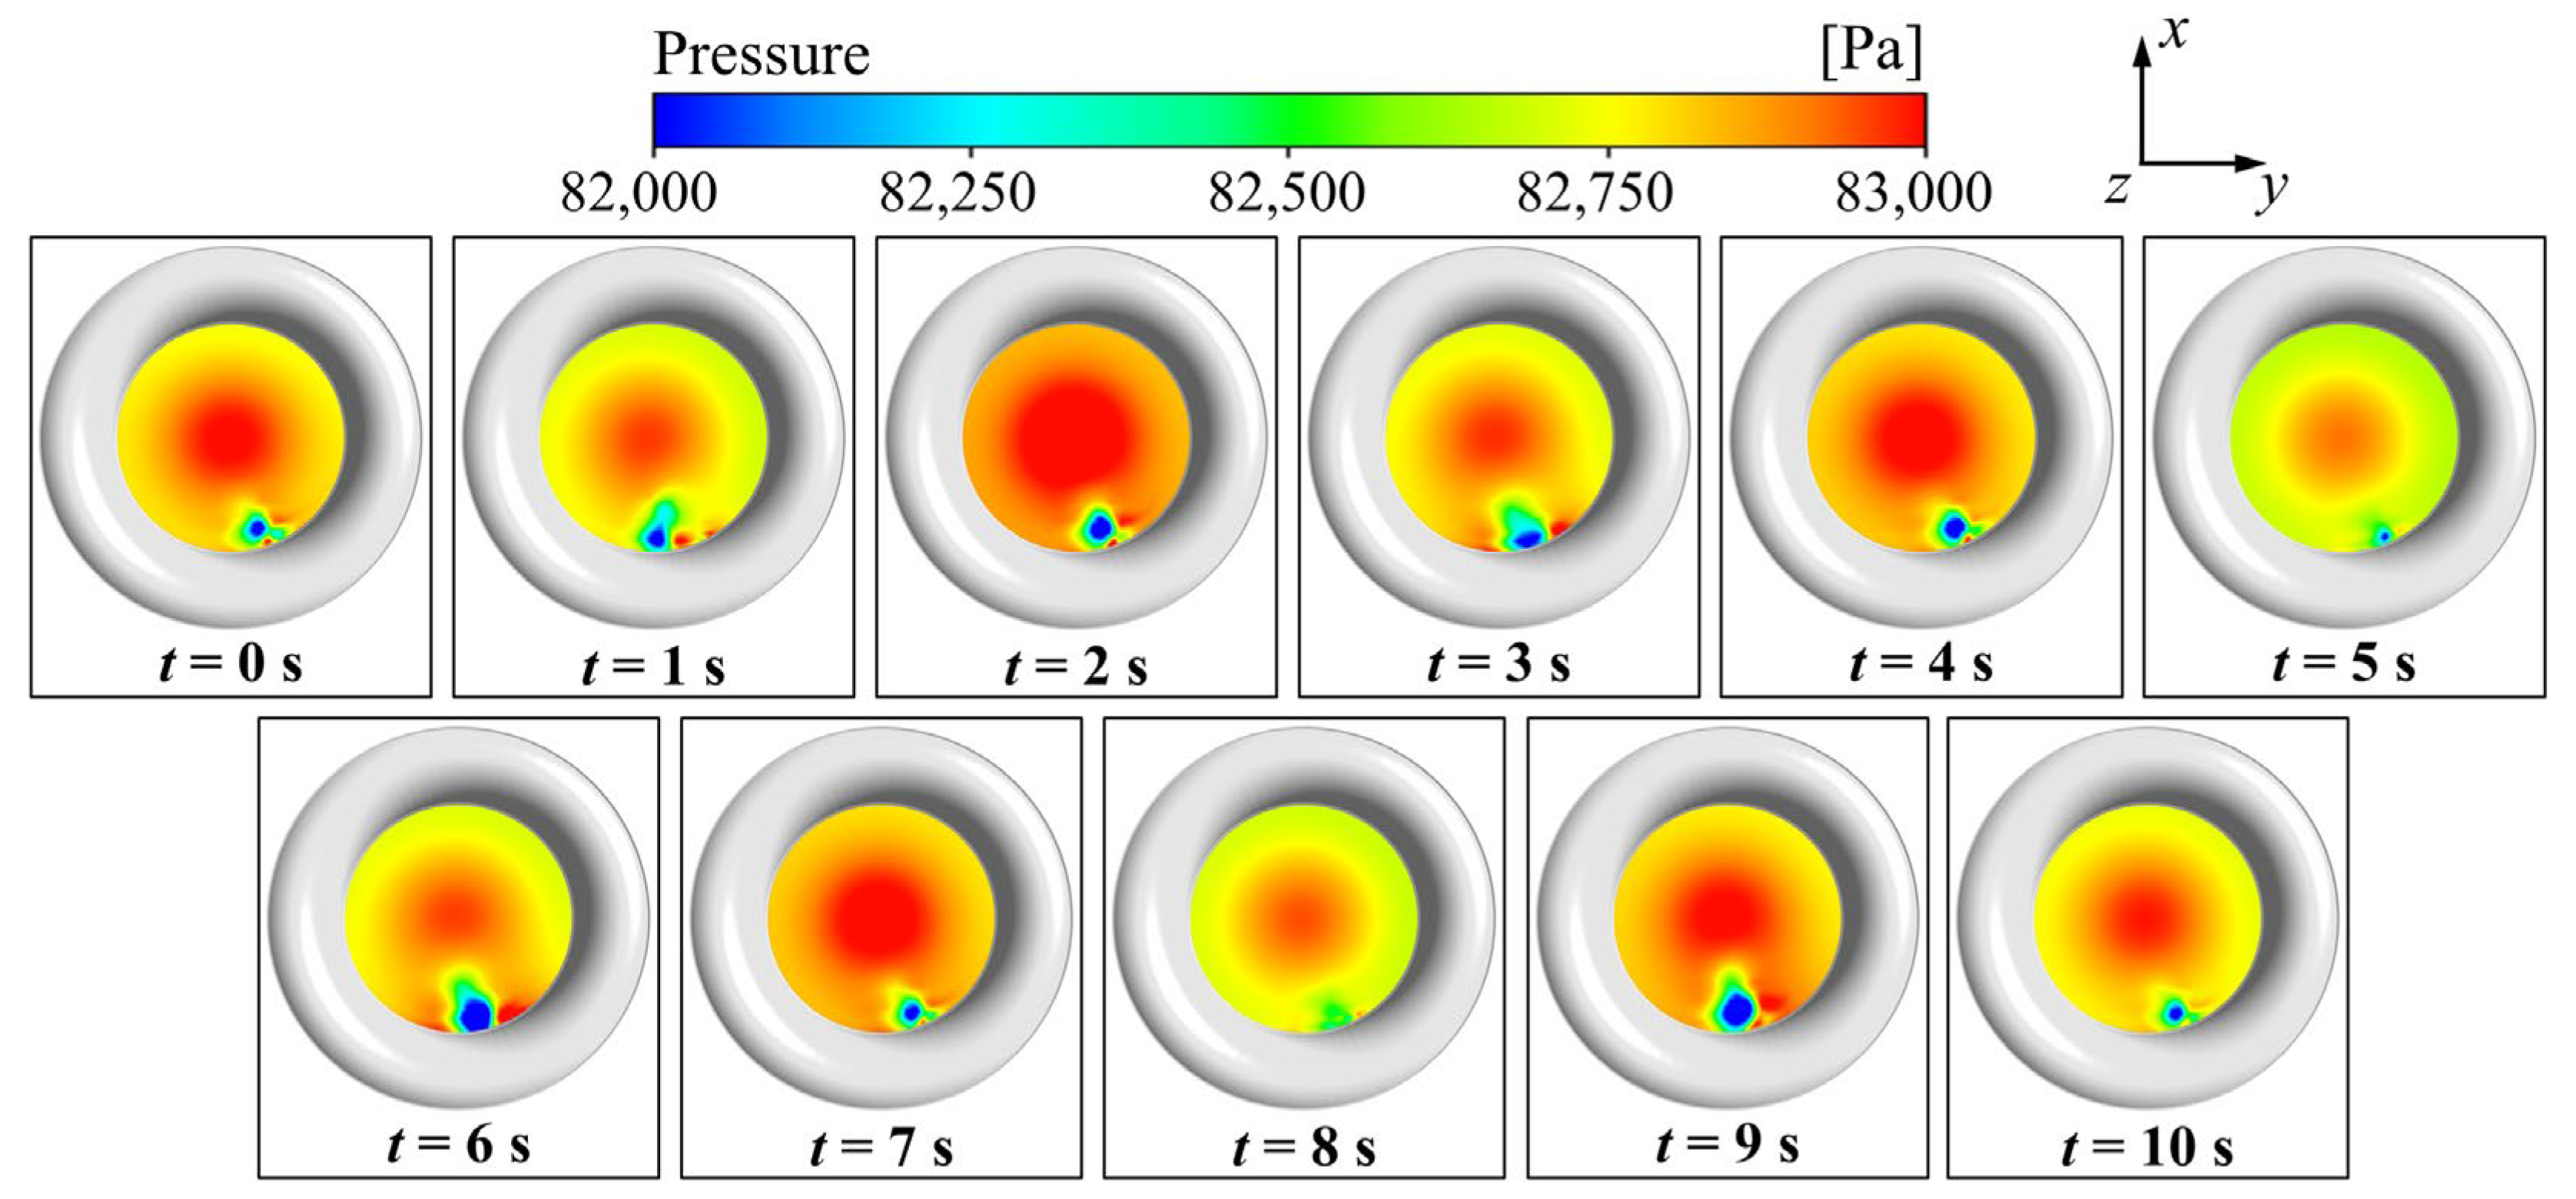
Figure 9 displays the pressure distribution contours at the inlet cross-section. Under fixed flow conditions, the pressure distortion predominantly occurs below the inlet—the ingestion region of the ground vortex—with its location remaining relatively stable over time. However, the severity of the pressure distortion varies considerably. By comparing with Figure 7, this variation can be attributed to the unsteady characteristics of the ground vortex, which lead to fluctuations in its size and intensity.
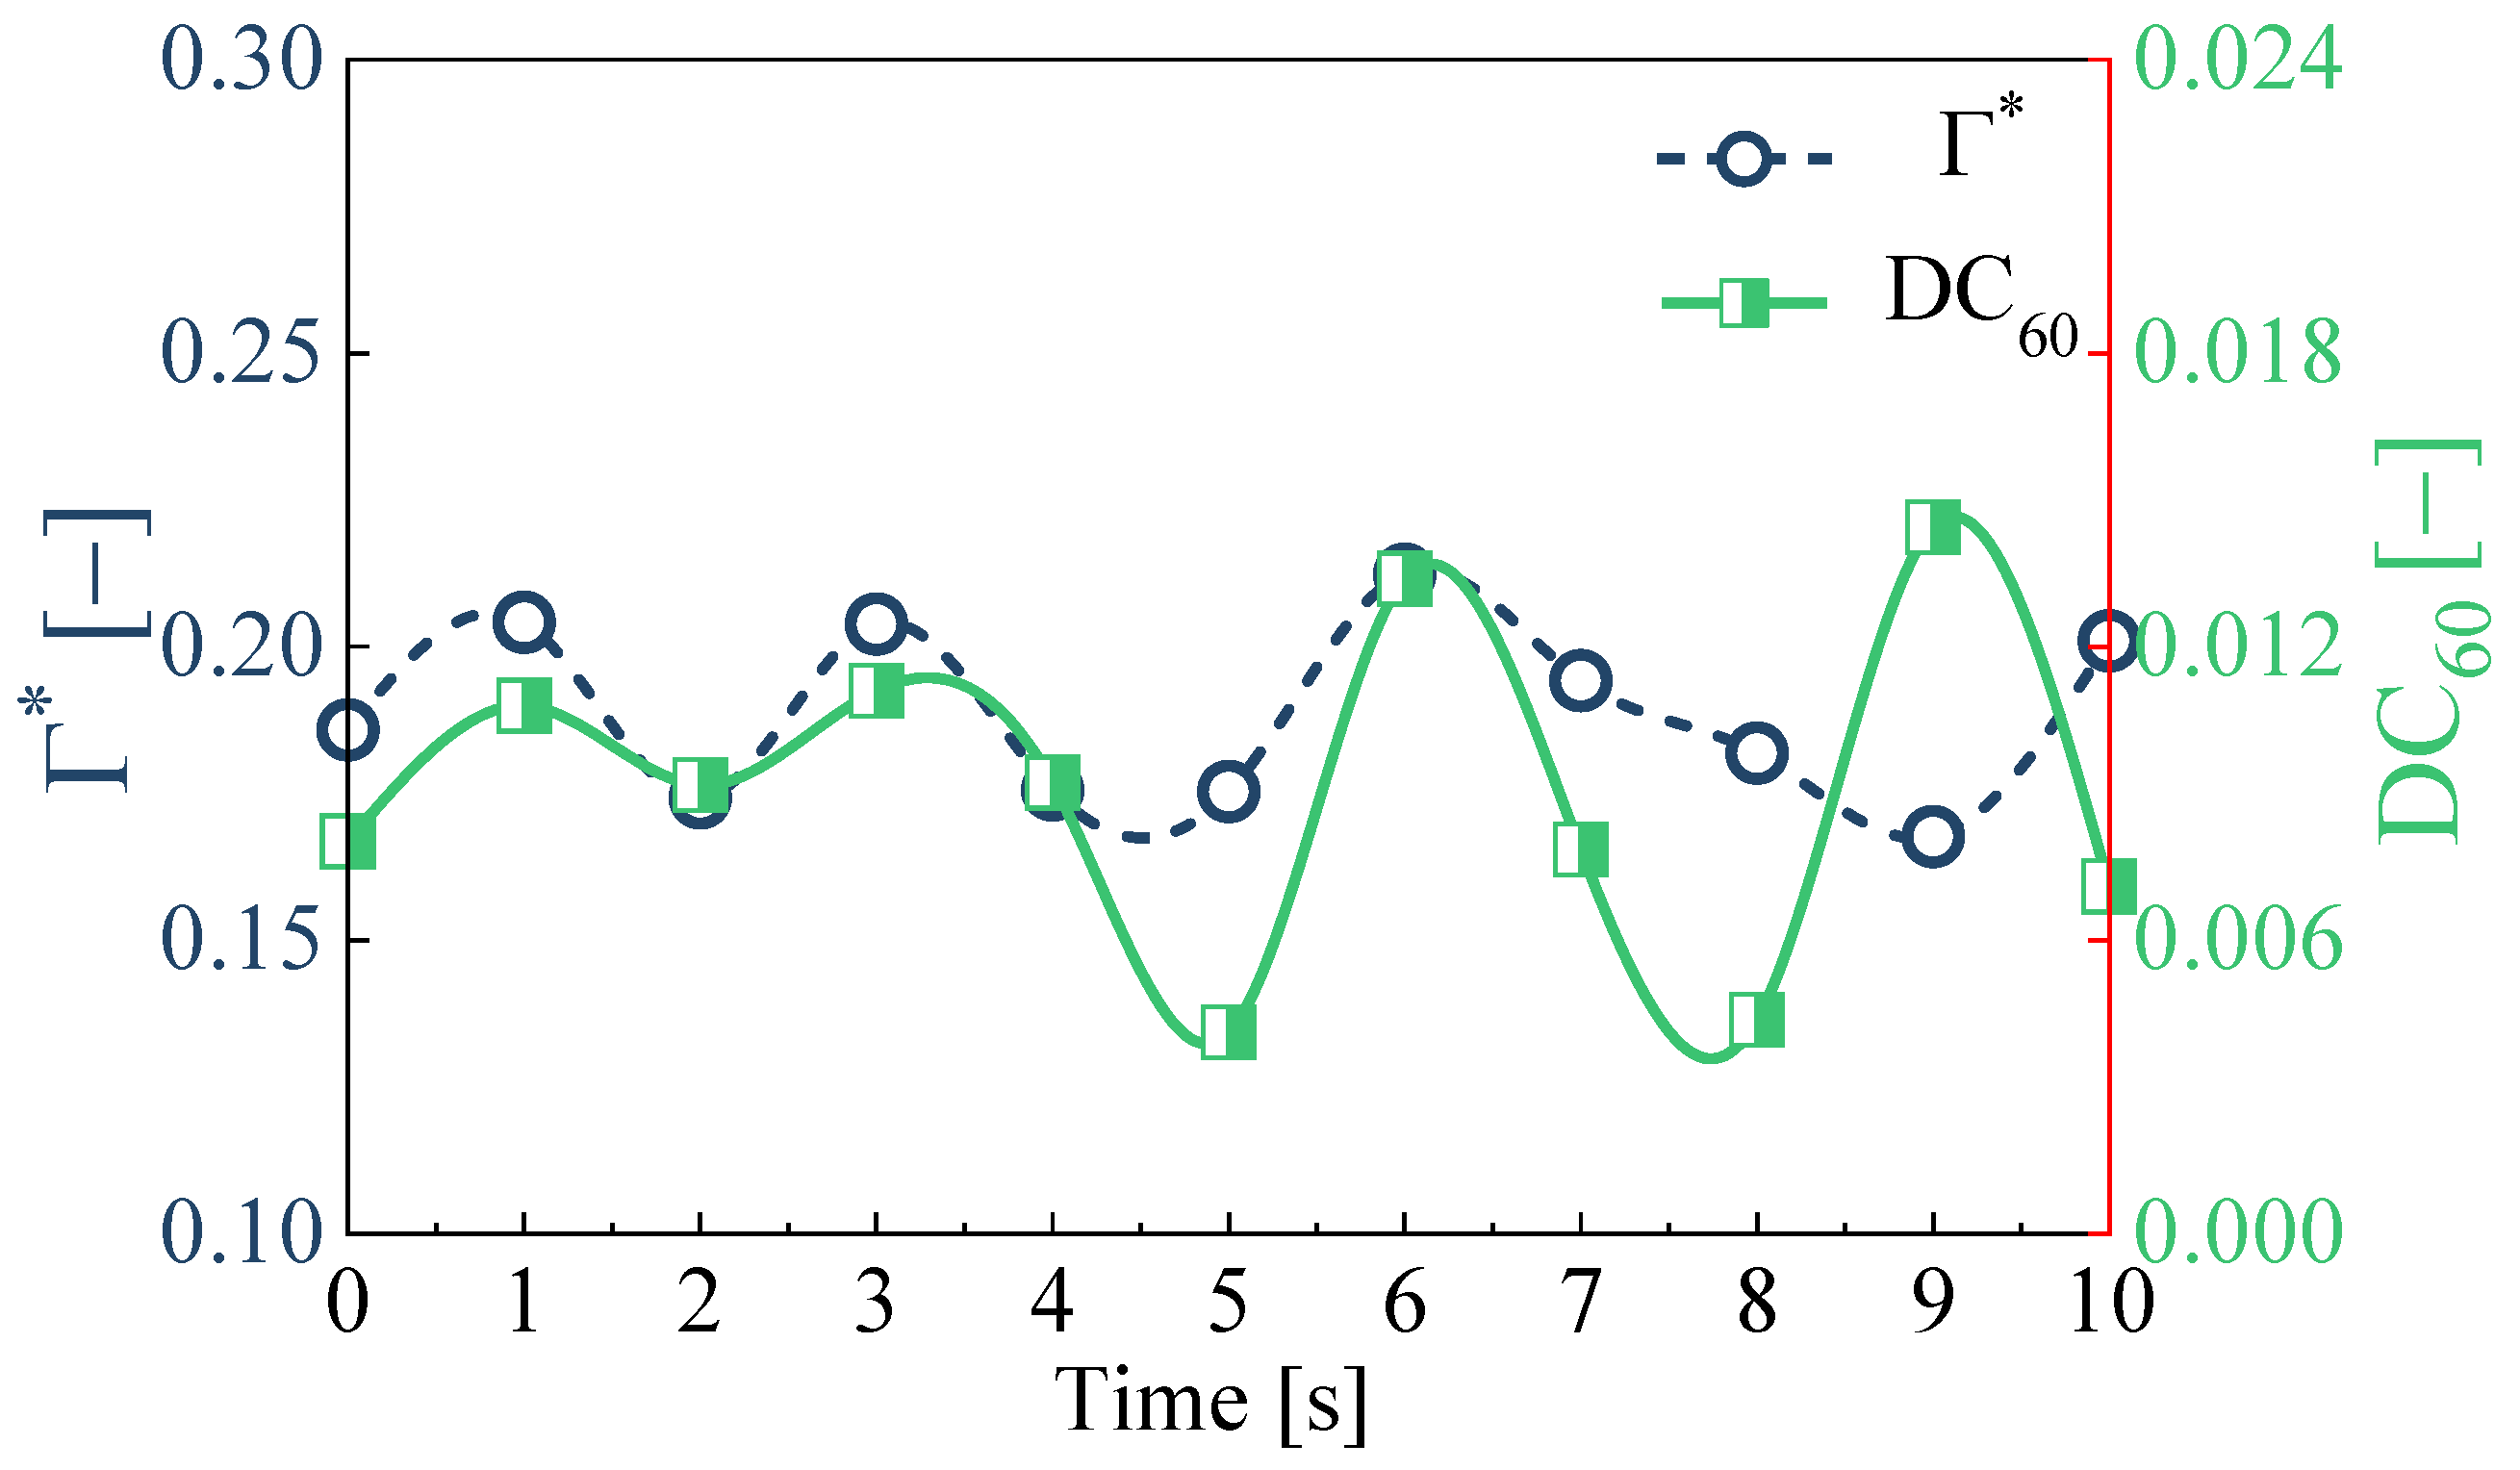
Furthermore, Figure 10 depicts the temporal evolution of the ground vortex strength (Γ*) and pressure distortion coefficient (DC60) over a 10 s period. Both parameters exhibit periodic oscillations, suggesting that despite the ground vortex’s strong unsteadiness, its strength achieves a dynamic equilibrium under constant aerodynamic conditions (incoming flow velocity, wind direction, and outlet mass flow rate). The vortex strength Γ* fluctuates slightly around its mean value (0.189). Meanwhile, for the DC60 coefficient, the oscillation amplitude remains relatively small in the first 5 s but increases in the latter half. This behavior may be associated with the transition from steady to unsteady state in the initial phase. The time-averaged DC60 value over the 10 s interval is 0.009.

3.2. The Influence of Particle Density and Diameter on FOI Characteristics

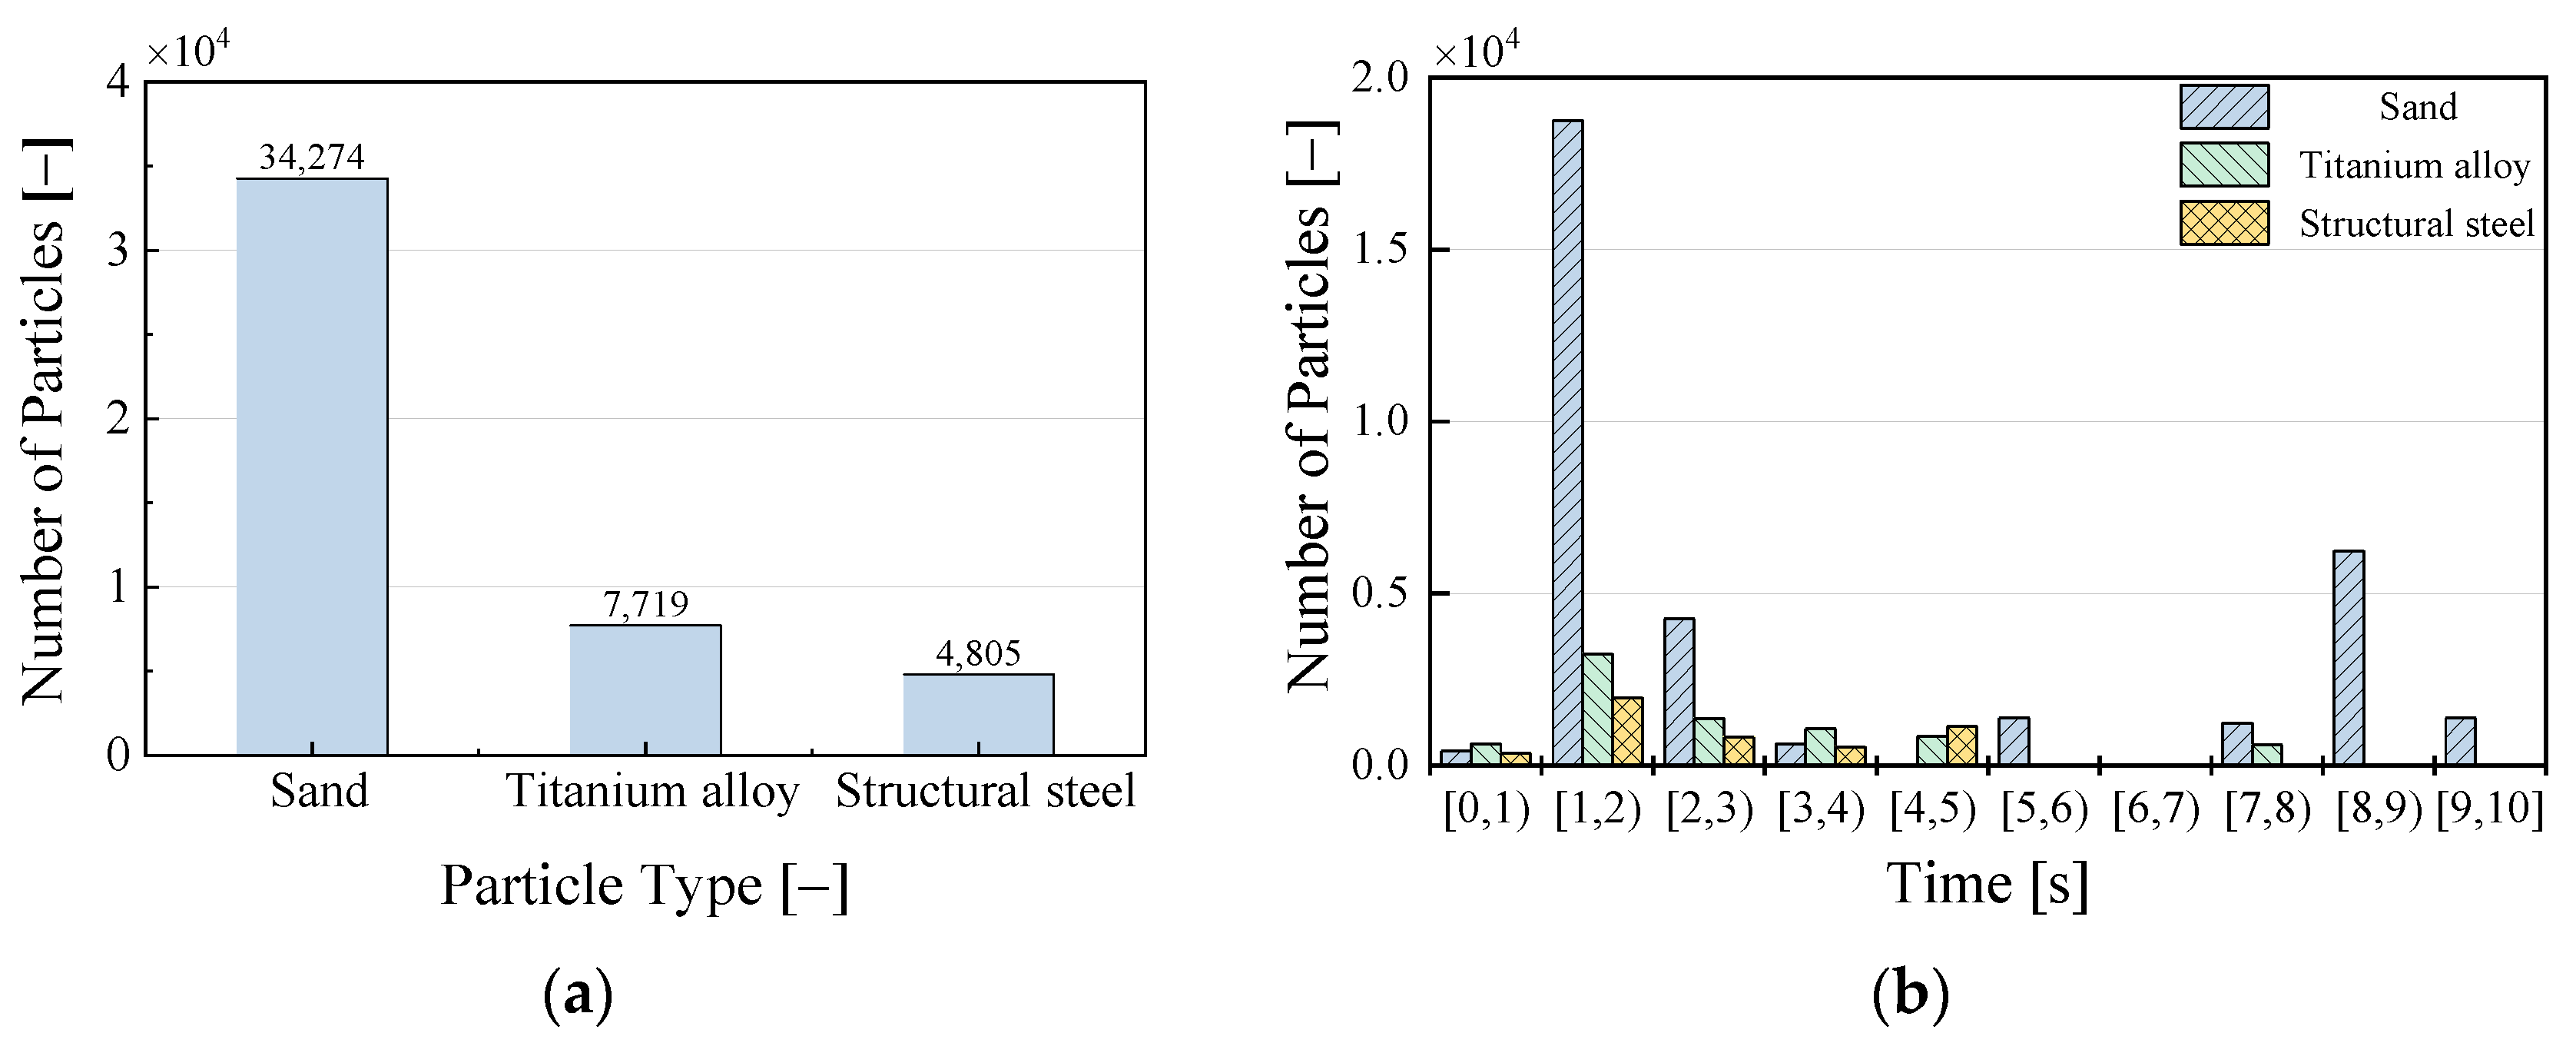
Figure 11 presents the distribution characteristics of particle numbers being drawn into the intake duct under the influence of ground vortex for particles with different densities. As shown in Figure 11a, with decreasing particle density, the number of particles drawn into the intake duct increases significantly. The sand particles (with the lowest density) exhibit the highest intake, reaching 34,274 particles, followed by titanium alloy particles (7719 particles) and structural steel particles (4805 particles). Given that the particle diameters are identical for all three types, particles with higher density possess a larger mass mP. According to Equation (7), under identical flow conditions, the acceleration of such particles is smaller, which results in a diminished capacity to respond to changes in the flow field. Consequently, these particles are less likely to be carried by the airflow, leading to a substantial reduction in the number of particles drawn into the intake duct. Figure 11b further illustrates the temporal distribution of particles being drawn into the intake. The results show that particles of all three densities are drawn into the intake within the first second, with the highest intake occurring during the 2nd second, followed by a gradual decrease. In contrast, particles with higher densities, such as titanium alloy and structural steel particles, exhibit stronger inertia, causing them to detach more easily from the primary vortex path during the early stages of motion. This makes it difficult for them to be continuously drawn into the intake, resulting in a near-zero intake at later time intervals.
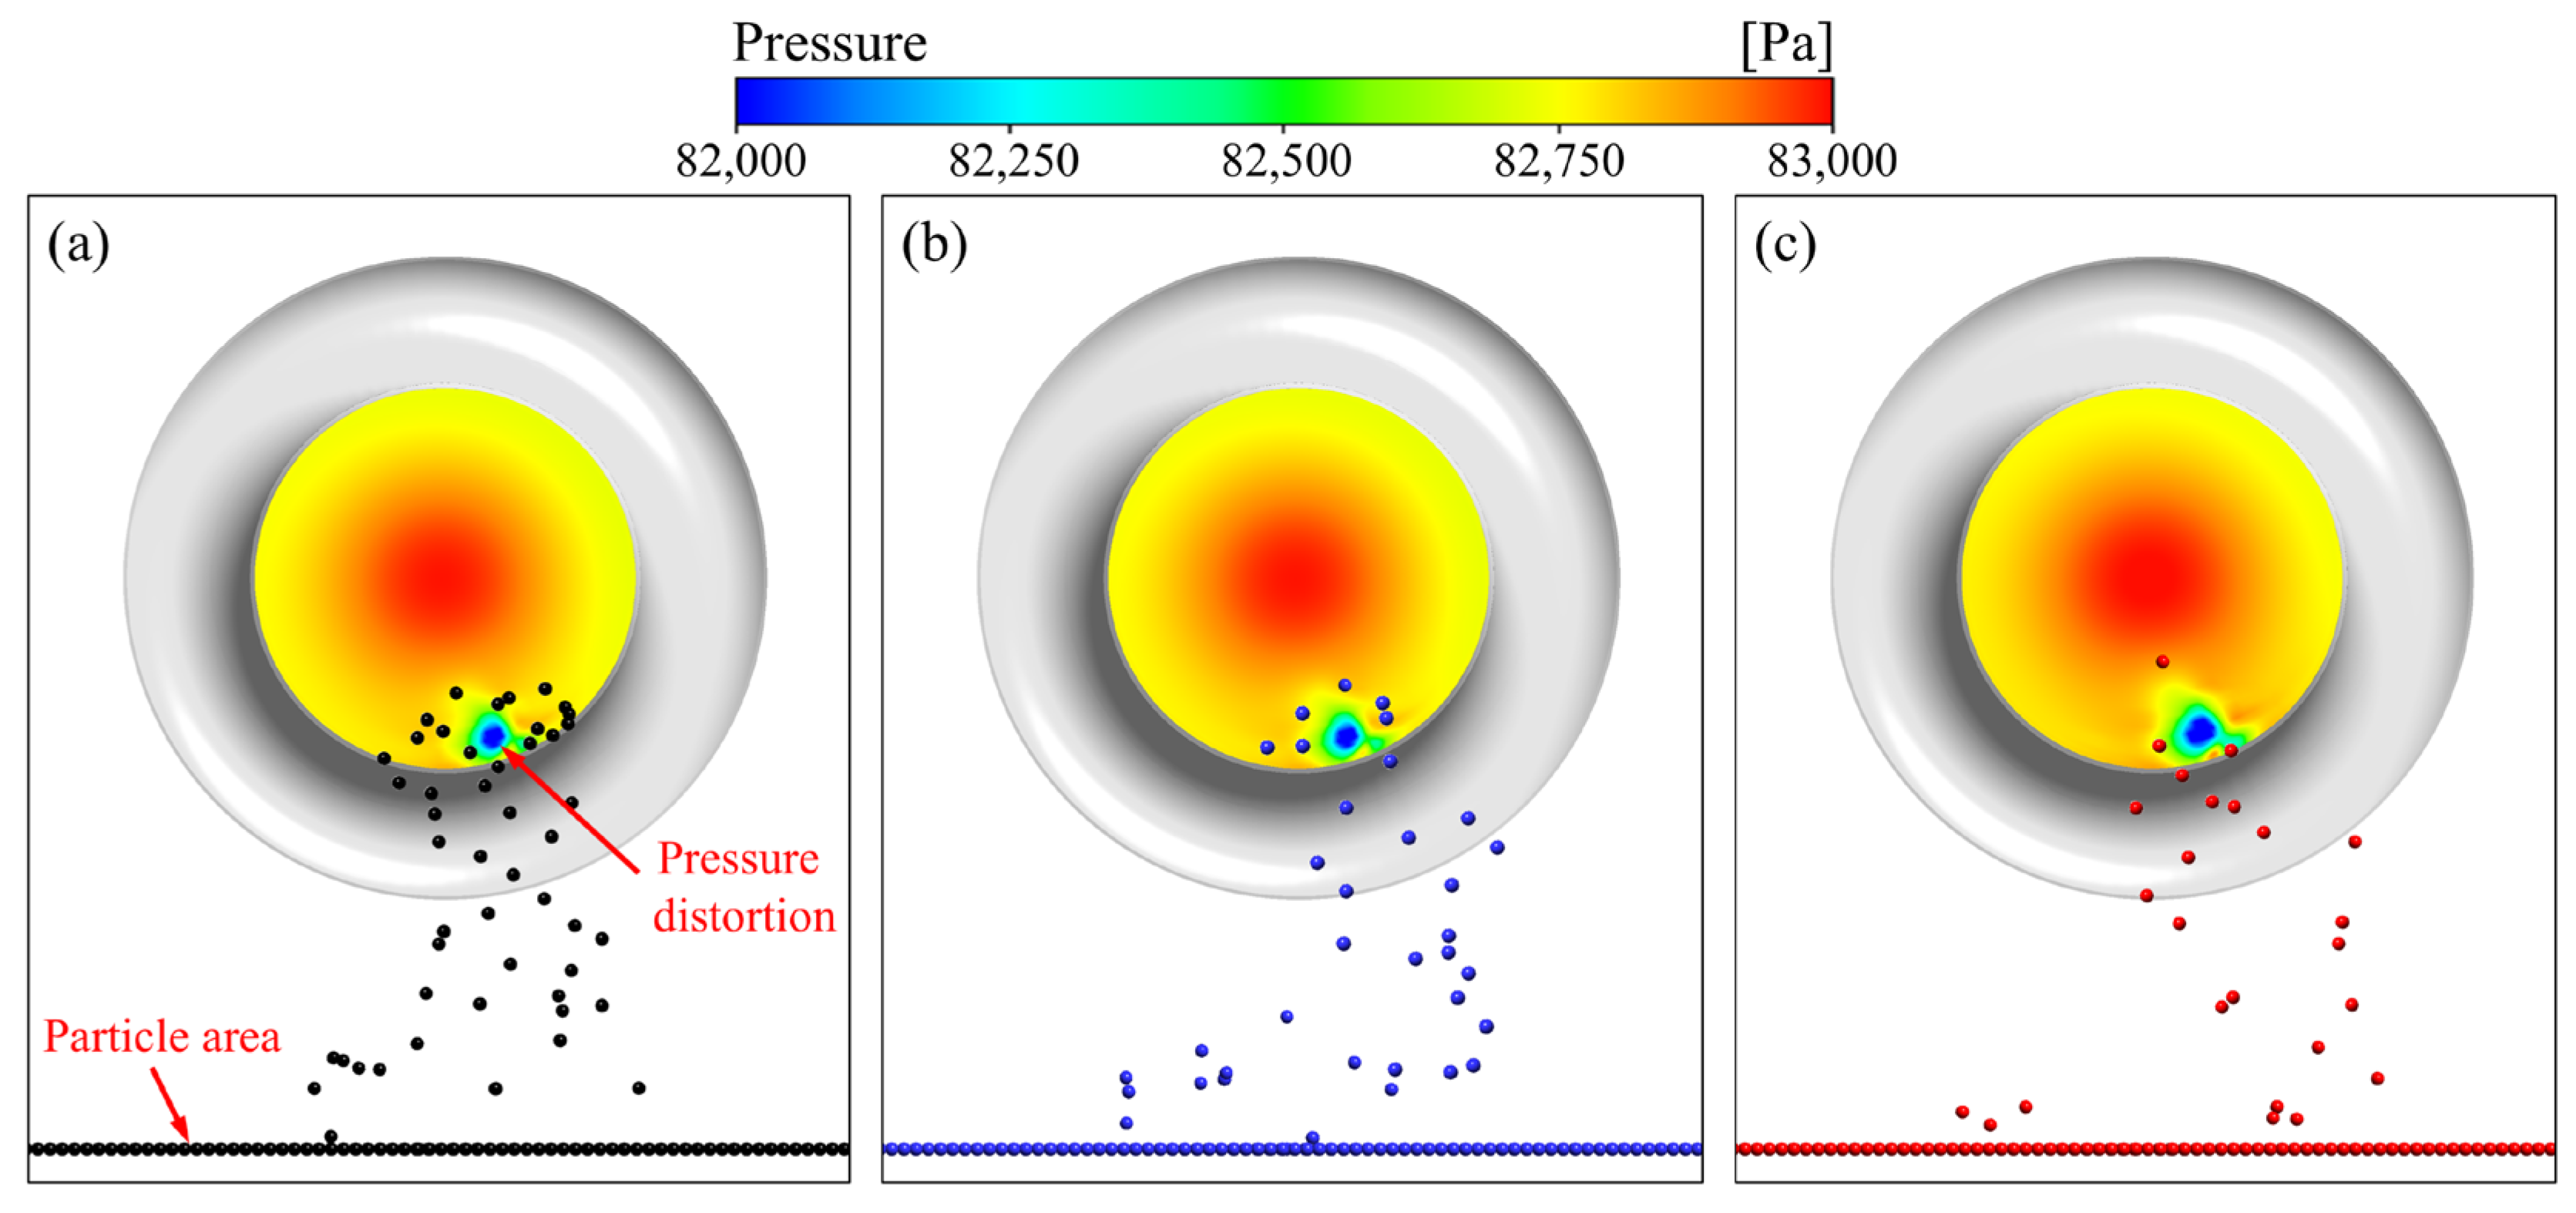
Figure 12 presents the ingestion of particles with varying densities. Under the influence of the ground vortex, all three types of particles gradually migrate away from the “Particle area” and are ingested into the intake duct. For all three particle types, more than 80% of the particles are located to the right of the central axis of the intake duct. This is attributed to the ingestion point of the ground vortex being positioned at the lower right corner of the intake cross-section. Furthermore, the center of the pressure distortion zone remains almost devoid of particles, with the ingested particles being distributed around the outer edge of this region. It is also evident that, with increasing particle density and mass, inertia grows, leading to a gradual reduction in the particles’ responsiveness to the flow field, resulting in a more irregular distribution. In contrast, particles with lower densities (sand) are more readily entrained by the ground vortex, resulting in a more concentrated distribution.
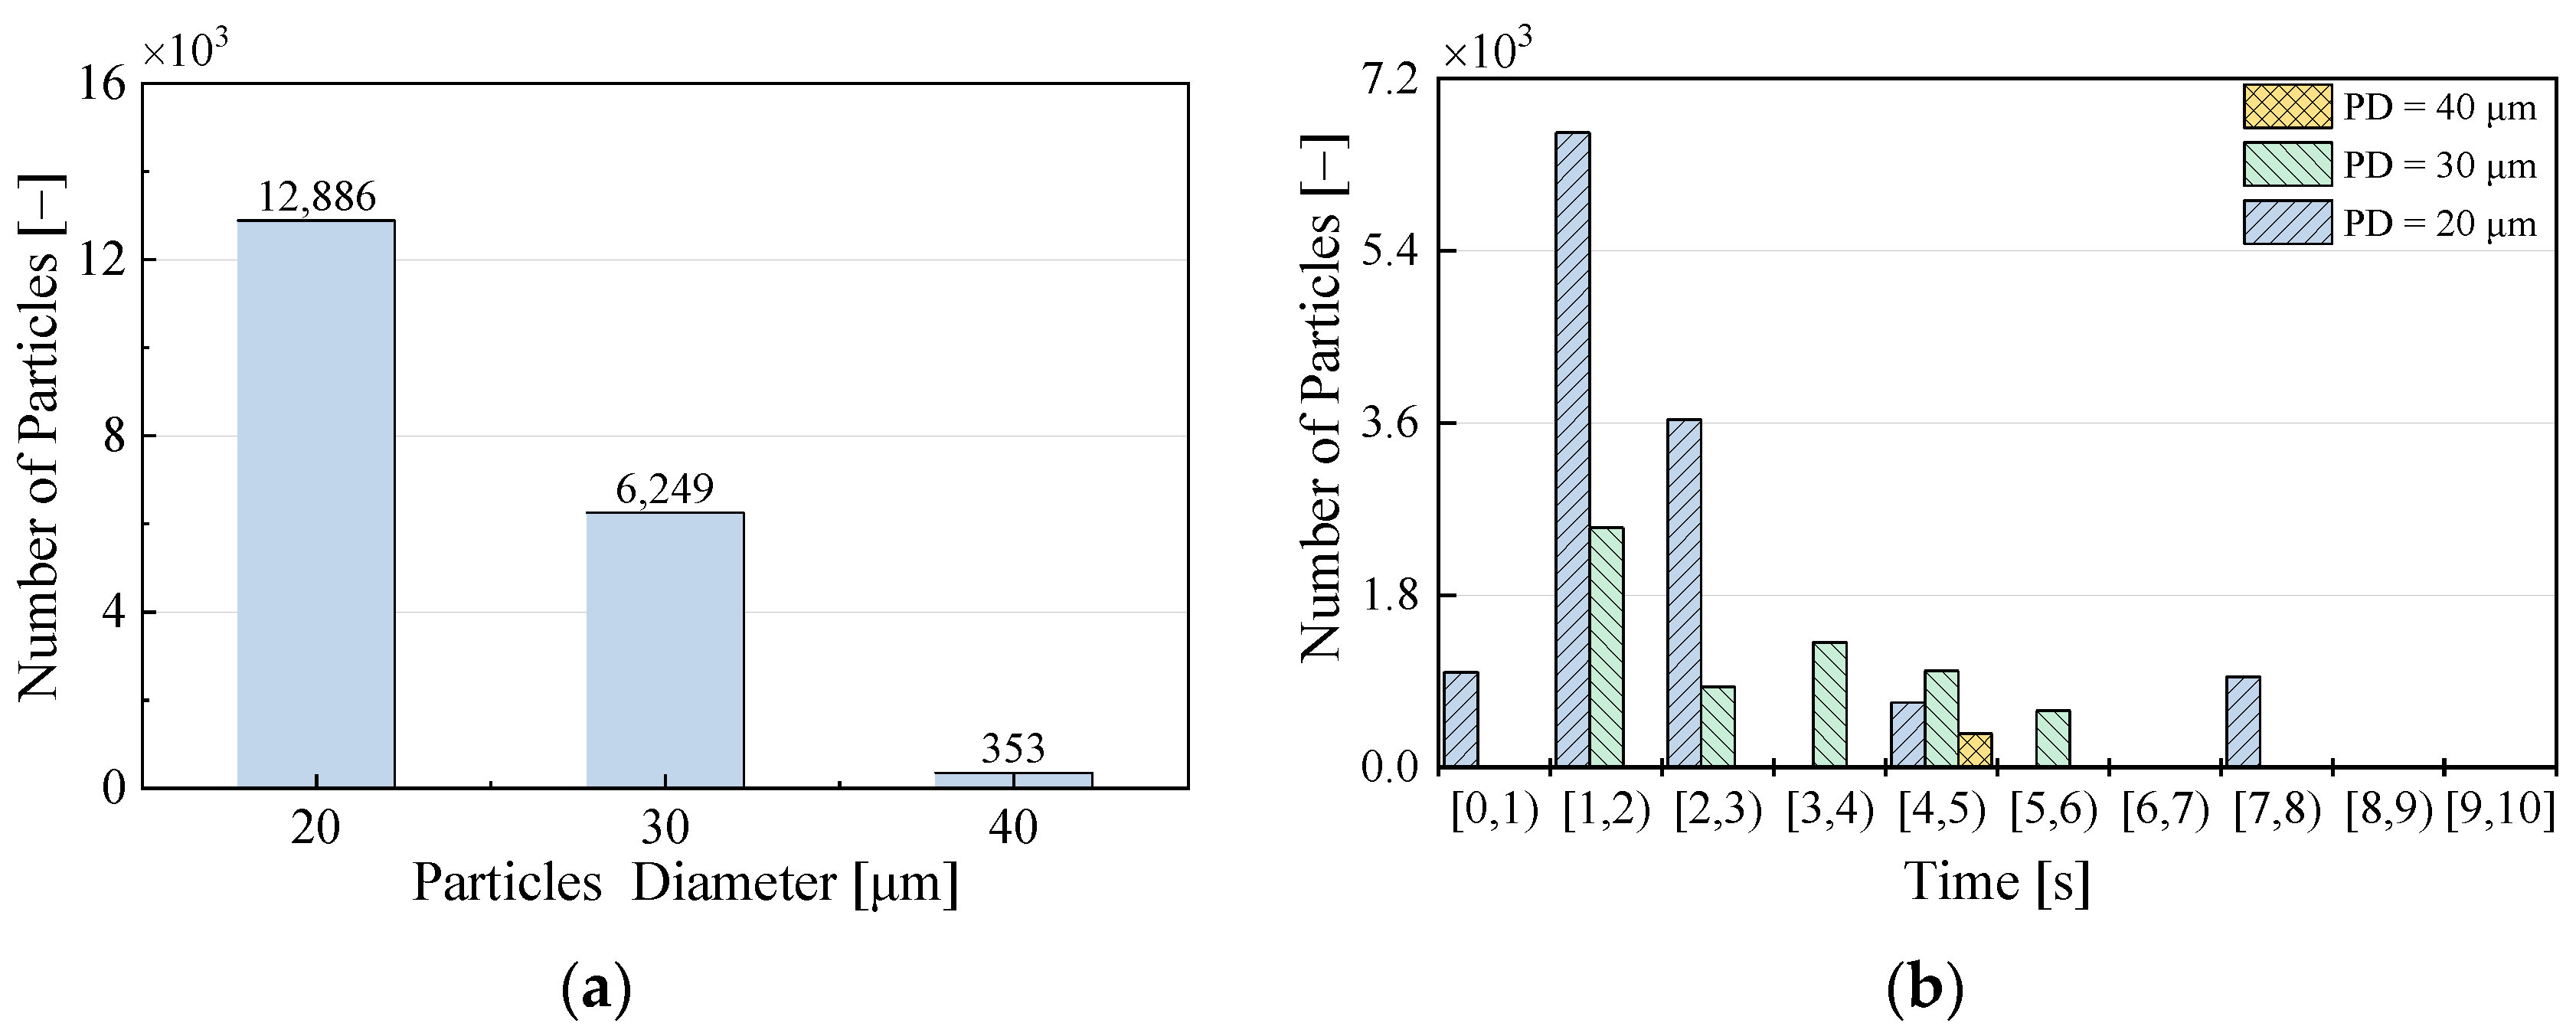
Figure 13 demonstrates the effect of particle diameter on the number of particles being drawn into the intake duct. As seen in Figure 13a, with increasing particle diameter, the number of particles drawn into the intake duct by the ground vortices significantly decreases. Under identical flow conditions, particles with a diameter of 20 μm dominate the intake, with 12,886 particles being drawn in, followed by 6249 particles of 30 μm and 353 particles of 40 μm. Since all particles are of the sand type, the larger the diameter (and thus the greater the mass), the more pronounced the inertia, as evidenced by Equation (7). Larger particles, with their increased mass, experience a reduced acceleration in the flow field and are less responsive to changes in the flow, making them less likely to be drawn into the intake. In contrast, smaller particles are more susceptible to the airflow, allowing them to follow the flow path more readily and thus be drawn into the intake duct in greater numbers. Further analysis of Figure 13b reveals that most particles are drawn into the intake duct within the first 8 s. Smaller particles are drawn in earlier and in greater numbers. This trend is closely related to the particles’ inertia and the dynamic properties of the fluid. Smaller particles have a shorter response time and can quickly adapt to changes in the flow field, allowing them to be rapidly drawn into the intake by the ground vortex. Larger particles, on the other hand, exhibit stronger inertia and require more time to accelerate, resulting in a delayed intake, with only a small number of particles being drawn in around t = 4–5 s.
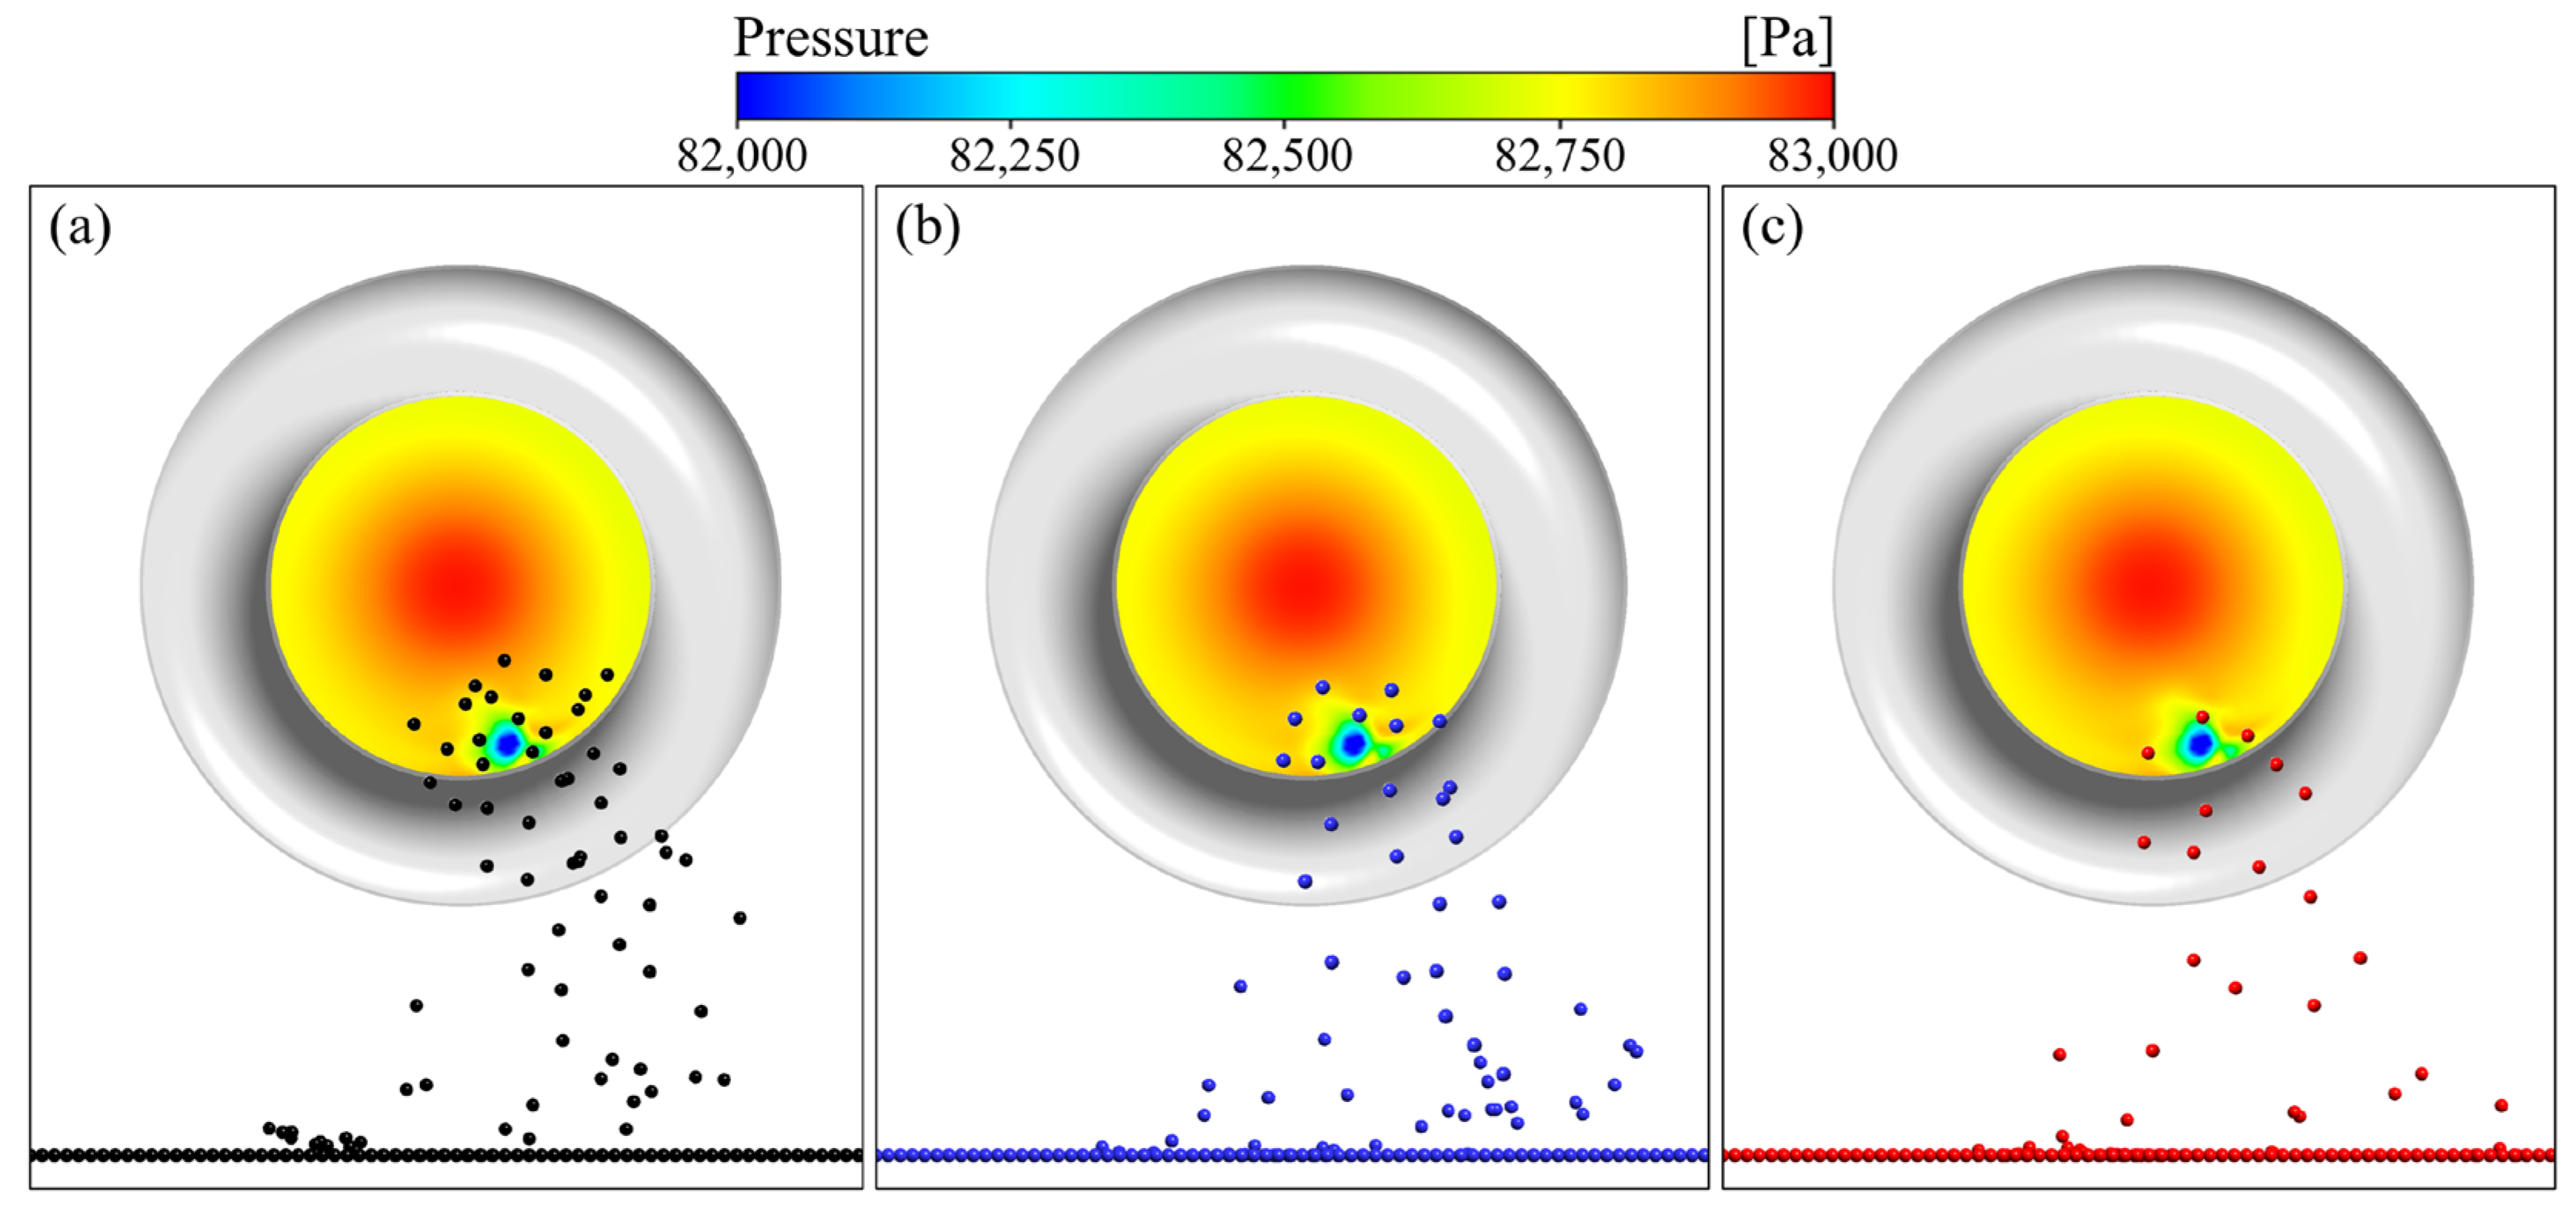
Figure 14 illustrates the ingestion behavior of particles with varying diameters. As observed, despite the identical initial positions and arrangements of the three particle types, their responses to the ground vortex exhibit significant differences. The smallest particles, with a diameter of 20 μm, possess the least mass and, consequently, the lowest inertia. As a result, they exhibit heightened sensitivity to flow disturbances and are more readily entrained by the ground vortex, leading to a more concentrated distribution. Moreover, due to their lower inertia, smaller particles are more easily lifted to greater heights above the ground by the vortex-induced flow. As the particle diameter increases, so does the mass, resulting in decreased sensitivity to aerodynamic forces and an increased dominance of inertia. These larger particles are less likely to be drawn off the ground by the vortex, causing a more dispersed distribution. Additionally, the center of the pressure distortion zone remains devoid of ingested particles, with the particles being distributed around the periphery of this region.

4. Conclusions

This study presents a numerical investigation into the unsteady behavior of ground vortex flows and their influence on particle ingestion into aeroengine intakes under headwind conditions. The main conclusions are summarized as follows:
  • The ground vortex generated beneath the intake lip exhibits strong temporal variability in both strength and position, characterized by clockwise rotation and the formation of trailing vortices. Despite this unsteady behavior, a quasi-equilibrium state is achieved under constant inflow and suction conditions, with the vortex strength and pressure distortion coefficient oscillating periodically around a mean value. Such unsteady pressure distortion reflects a degradation of inlet energy uniformity, which is unfavorable for stable and efficient downstream compression.
  • Particle density has a significant influence on ingestion behavior. For particles with identical diameters (10 μm), the total number of ingested particles decreases markedly as density increases. Under identical flow conditions, sand particles (ρ = 2.64 g/cm3) exhibit the highest ingestion count (34,274 particles), whereas titanium alloy and structural steel particles are reduced by approximately 77% and 86% compared with sand particles. The underlying mechanism is the increased particle inertia associated with higher density, which reduces particle responsiveness to vortex-induced aerodynamic forces and limits their ability to follow the unsteady vortex core trajectory.
  • Particle diameter exerts an even stronger influence on ingestion characteristics. For sand particles, increasing the diameter from 20 μm to 40 μm reduces the ingestion count from 12,886 to only 353 particles, corresponding to a reduction of more than 97%. Larger particles exhibit greater inertia and longer aerodynamic response times, preventing effective entrainment by the vortex-induced upward flow. In contrast, smaller particles are rapidly accelerated and preferentially transported along the vortex core, resulting in concentrated ingestion in the lower region of the intake cross-section.
Overall, the present results demonstrate that ground vortex-induced flow distortion and foreign object ingestion are closely coupled with inlet energy degradation. The findings provide practical guidance for mitigating energy losses, enhancing intake efficiency, and improving the energy-efficient operation of aeroengine systems during near-ground conditions.

Author Contributions

Conceptualization, L.L. and W.C.; methodology, L.L. and Z.L.; software, P.C. and H.Y.; validation, P.C. and H.Y.; formal analysis, L.L. and Z.L.; investigation, P.C.; resources, P.C. and H.Y.; data curation, H.Y. and Z.L.; writing—original draft preparation, L.L.; writing—review and editing, L.L. and W.C.; visualization, L.L. and Z.L.; supervision, W.C.; project administration, W.C.; funding acquisition, W.C. All authors have read and agreed to the published version of the manuscript.

Funding

This research was supported by the Natural Science Foundation of Sichuan Province (No. 2026NSFSCZY0046), and the Equipment Pre-research Joint Research Program of Ministry of Education (8091B02052303).

Data Availability Statement

The original contributions presented in this study are included in the article. Further inquiries can be directed to the corresponding author.

Acknowledgments

This research was supported by the Natural Science Foundation of Sichuan Province, and the Equipment Pre-research Joint Research Program of Ministry of Education. In addition, the authors would like to thank the editor and anonymous reviewers for their valuable and constructive comments on this manuscript.

Conflicts of Interest

Authors Pengfei Chen, Hua Yang and Zhiyou Liu were employed by the company Sichuan Gas Turbine Establishment, Aero Engine Corporation of China. The remaining authors declare that the research was conducted in the absence of any commercial or financial relationships that could be construed as a potential conflict of interest.

Abbreviations

The following abbreviations are used in this manuscript:
CFDComputational Fluid Dynamics
DPMDiscrete Phase Model
LESLarge-Eddy Simulation
N-SNavier–Stokes Equation
RANSReynolds Averaged Navier–Stokes
PIVParticle Image Velocimetry

References

  1. Knowles, K.; Bray, D. Ground vortex formed by impinging jets in crossflow. J. Aircr. 1993, 30, 872–878. [Google Scholar] [CrossRef]
  2. Klein, H.J. Vortex Inhibitor for Aircraft Jet Engines. U.S. Patent 2915262, 1 December 1959. [Google Scholar]
  3. Smith, J.P. Protective Air Curtains for Aircraft Engine Inlet. U.S. Patent 3527430, 8 September 1970. [Google Scholar]
  4. Bowditch, D.; Coltrin, R. A Survey of Inlet/Engine Distortion Compatibility; AIAA Paper; AIAA: Reston, VA, USA, 1983; pp. 83–1166. [Google Scholar]
  5. Lawson, N.; Knowles, K.; Bray, D.; Finnis, M.; Eyles, J. Transient and time-averaged characteristics of a compressible ground vortex flow. Proc. Inst. Mech. Eng. Part G J. Aerosp. Eng. 2014, 228, 375–383. [Google Scholar] [CrossRef]
  6. Tanguy, G.; MacManus, D.G.; Garnier, E.; Martin, P.G. Characteristics of unsteady total pressure distortion for a complex aero-engine intake duct. Aerosp. Sci. Technol. 2018, 78, 297–311. [Google Scholar] [CrossRef]
  7. Gil-Prieto, D.; Zachos, P.K.; MacManus, D.G.; McLelland, G. Unsteady characteristics of s-duct intake flow distortion. Aerosp. Sci. Technol. 2019, 84, 938–952. [Google Scholar] [CrossRef]
  8. Colehour, J.L.; Farquhar, B.W. Inlet vortex. J. Aircr. 1971, 8, 39–43. [Google Scholar] [CrossRef]
  9. De Siervi, F.; Viguier, H.C.; Greitzer, E.M.; Tan, C.S. Mechanisms of inlet-vortex formation. J. Fluid Mech. 1982, 124, 173–207. [Google Scholar] [CrossRef]
  10. Zantopp, S.; MacManus, D.; Murphy, J. Computational and experimental study of intake ground vortices. Aeronaut. J. 2010, 114, 769–784. [Google Scholar] [CrossRef]
  11. Babo, M. Numerical Evaluation of the Ground Vortex. Master’s Thesis, KTH Royal Institute of Technology, Stockholm, Sweden, October 2022. [Google Scholar]
  12. Horvath, N.R. Inlet Vortex Formation Under Crosswind Conditions. Master’s Thesis, Worcester Polytechnic Institute, Worcester, MA, USA, 25 April 2013. [Google Scholar]
  13. Murphy, J. Intake Ground Vortex Aerodynamics. Ph.D. Thesis, Cranfield University, Cranfield, UK, December 2008. [Google Scholar]
  14. Murphy, J.P.; MacManus, D.G. Ground vortex aerodynamics under crosswind conditions. Exp. Fluids 2011, 50, 109–124. [Google Scholar] [CrossRef]
  15. Murphy, J.P.; MacManus, D.G. Intake Ground Vortex Prediction Methods. J. Aircr. 2011, 48, 23–33. [Google Scholar] [CrossRef][Green Version]
  16. Murphy, J.P.; MacManus, D.G. Inlet ground vortex aerodynamics under headwind conditions. Aerosp. Sci. Technol. 2011, 15, 207–215. [Google Scholar] [CrossRef]
  17. Ho, W.H.; Idris, O.F.B.; New, T.H. Suction inlet vortex investigation at low reynolds numbers. Trans. Can. Soc. Mech. Eng. 2015, 39, 115–123. [Google Scholar] [CrossRef]
  18. Guimarães, T.; Lowe, K.T.; O’Brien, W.F. Vortical flow development in round ducts across scales for engine inlet applications. Exp. Fluids 2019, 60, 52. [Google Scholar] [CrossRef]
  19. Rodert, L.; Garrett, F. Ingestion of Foreign Objects into Turbine Engine by Vortices; NACA TN 3330; National Advisory Committee for Aeronautics: Washington, DC, USA, 1955. [Google Scholar]
  20. MacManus, D.G.; Slaby, M. Intake ground vortex and computational modelling of foreign object ingestion. Aeronaut. J. 2015, 119, 1123–1145. [Google Scholar] [CrossRef]
  21. Glenny, D.E.; Pyestock, N.G.T.E. Ingestion of Debris into Intakes by Vortex Action; Cranfield University: Bedford, UK, 1970; Available online: https://reports.aerade.cranfield.ac.uk/handle/1826.2/1127 (accessed on 2 March 2026).
  22. Hua, H.W.; Jermy, M.; Ao, S.-I.; Chan, A.H.-S.; Katagiri, H.; Castillo, O.; Xu, L. Formation and ingestion of vortices into jet engines during operation. AIP Conf. Proc. 2009, 1089, 132–143. [Google Scholar] [CrossRef]
  23. Chennuru, V.Y.T. Final Work: Numerical Investigation of the Ground Vortex Ingestion into the Intake Under Crosswind. Master’s Thesis, University of Liège, Liège, Belgium, 2022. [Google Scholar]
  24. Berthelon, T.; Dugeai, A.; Langridge, J.; Thouverez, F. Analysis of vortex ingestion impact on the dynamic response of the fan in resonance condition. In ASME Turbo Expo 2019: Turbomachinery Technical Conference and Exposition. Volume 7A: Structures and Dynamics; American Society of Mechanical Engineers: New York, NY, USA, 2019; p. V07AT36A010. [Google Scholar] [CrossRef]
  25. Martin, B.; Thomas, M.; Dombard, J.; Duchaine, F.; Gicquel, L. Analysis of Solid Particle Ingestion and Dynamics in a Turbomachine Using Large-Eddy Simulation. In Proceedings of the ASME Turbo Expo 2019: Turbomachinery Technical Conference and Exposition, Phoenix, AZ, USA, 17–21 June 2019. Volume 2D: Turbomachinery; ASME: New York, NY, USA, 2019; p. V02DT47A013. [Google Scholar] [CrossRef]
  26. Menter, F.R. Two-equation eddy-viscosity turbulence models for engineering applications. AIAA J. 1994, 32, 1598–1605. [Google Scholar] [CrossRef]
  27. Ghenaiet, A. Study of sand particle trajectories and erosion into the first compression stage of a turbofan. J. Turbomach. 2012, 134, 051025. [Google Scholar] [CrossRef]
  28. Saxena, S.; Jothiprasad, G.; Bourassa, C.; Pritchard, B. Numerical simulation of particulates in multistage axial compressors. J. Turbomach. 2017, 139, 031013. [Google Scholar] [CrossRef]
  29. Sommerfeld, M. Theoretical and Experimental Modelling of Particulate Flows; Lecture Series 2000-06; Martin-Luther-Universität Halle-Wittenberg: Halle, Germany, 2000. [Google Scholar]
  30. Saffman, P.G. The lift on a small sphere in a slow shear flow. J. Fluid Mech. 1965, 22, 385–400. [Google Scholar] [CrossRef]
  31. Mishra, N.; MacManus, D.; Murphy, J. Intake ground vortex characteristics. Proc. Inst. Mech. Eng. Part G J. Aerosp. Eng. 2012, 226, 1387–1400. [Google Scholar] [CrossRef]
Figure 1. Inlet geometric modeling diagram.
Energies 19 01317 g001
Figure 2. Schematic diagram of calculation domain.
Energies 19 01317 g002
Figure 3. Feature plane diagram.
Energies 19 01317 g003
Figure 4. Computational grids.
Energies 19 01317 g004
Figure 5. Verification of grid independence.
Energies 19 01317 g005
Figure 6. Verification of numerical method: (a) Vortex strength Γ*; (b) Pressure distortion coefficient DC60 [13].
Energies 19 01317 g006
Figure 7. Ground vortex streamlines at different times.
Energies 19 01317 g007
Figure 8. Vorticity contours on feature plane at different times.
Energies 19 01317 g008
Figure 9. Inlet section pressure contours at different times.
Energies 19 01317 g009
Figure 10. The variation in Γ* and DC60 with time.
Energies 19 01317 g010
Figure 11. Effect of particle density on the number of particles drawn into the intake: (a) Total number of particles drawn into the intake; (b) Number of particles drawn in different time intervals.
Energies 19 01317 g011
Figure 12. Effect of particle density on the distribution of particles drawn into the intake: (a) Sand; (b) Titanium alloy; (c) Structural steel.
Energies 19 01317 g012
Figure 13. Effect of particle diameter on the number of particles drawn into the intake: (a) Total number of particles drawn into the intake; (b) Number of particles drawn in different time intervals.
Energies 19 01317 g013
Figure 14. Effect of particle diameter on the distribution of particles drawn into the intake: (a) 20 μm; (b) 30 μm; (c) 40 μm.
Energies 19 01317 g014
Table 1. Circular radius sensitivity test.
TestRadius r/mmCirculation Γ/(m2/s)Difference ε/(%)
160017.781-
262018.3341.52
364018.8791.46
466019.4151.39
568019.9381.32
670020.4351.21
772020.91.10
874021.3280.99
976021.7260.92
Table 2. Boundary conditions.
NameBoundary TypeConditions
OutletMass flow outlet m ˙ = 90   kg / s
HeadwindVelocity inlet   V x = 0   m / s V y = 0   m / s V z = 10   m / s
Tailwind/UpPressure-far-field101325 [Pa]/288.15 [K]
Left/Right
Particle areaNo-slip adiabatic wall-
Intake/BottomNo-slip adiabatic wall-
Disclaimer/Publisher’s Note: The statements, opinions and data contained in all publications are solely those of the individual author(s) and contributor(s) and not of MDPI and/or the editor(s). MDPI and/or the editor(s) disclaim responsibility for any injury to people or property resulting from any ideas, methods, instructions or products referred to in the content.