Article

Green Hydrogen Production Assessment via Integrated Photovoltaic–Electrolyzer Modeling Framework

by
Abdullah Alrasheedi
1,*,
Mousa Marzband
2 and
Abdullah Abusorrah
2
1
Department of Electrical and Computer Engineering, Faculty of Engineering, King Abdulaziz University, Jeddah 21589, Saudi Arabia
2
Center of Research Excellence in Renewable Energy and Power Systems, Department of Electrical and Computer Engineering, King Abdulaziz University, Jeddah 21589, Saudi Arabia
*
Author to whom correspondence should be addressed.
Energies 2026, 19(5), 1316; https://doi.org/10.3390/en19051316
Submission received: 19 January 2026 / Revised: 12 February 2026 / Accepted: 4 March 2026 / Published: 5 March 2026
(This article belongs to the Special Issue Advances in Green Hydrogen Production and Applications)

Abstract

This study examines the impact of photovoltaic (PV) modeling fidelity utilizing single-diode (SDM), double-diode (DDM), and triple-diode (TDM) representations on the precision of hydrogen production (H2P) estimates when integrated with various electrolyzer technologies, specifically proton exchange membrane (PEM), alkaline (AEL), and solid oxide electrolysis cells (SOECs). Precise evaluation of solar-powered green hydrogen (H2) systems necessitated a dependable estimate of PV power under authentic working circumstances. Hourly site-specific irradiance and ambient temperature (Ta) data for Riyadh, Saudi Arabia, were used to calculate PV power outputs, which were then sent to physically based electrolyzer models regulated by electrochemical voltage relationships and Faraday’s law. The findings indicate that while all PV models display the same seasonal patterns, SDM somewhat overestimates yearly PV energy in comparison to DDM and TDM, with relative errors around 0.03%. These discrepancies somewhat affect H2 yield estimations but do not change the relative ranking of electrolyzer technology. Among the assessed options, SOEC consistently produced the highest H2 output, generating approximately 21.8% more H2 than PEM and 9.1% more than AEL, with annual yields of 62.46–62.47 g for PEM, 69.70–69.71 g for AEL, and 76.04–76.05 g for SOEC across the SDM, DDM, and TDM frameworks under equivalent solar power inputs. The findings indicate that the selection of electrolyzer technology significantly impacts H2P more than the choice of a PV model, while high-fidelity PV modeling is crucial for a physically realistic and precise system-level assessment of integrated PV-H2 energy systems.

1. Introduction

1.1. Motivation and Background

Recent scientific studies have focused on modeling the integration of photovoltaic (PV) energy with an electrolyzer for the production of green hydrogen (H2), driven by factors such as the exacerbation of global warming, the depletion of fossil fuels, the volatility of oil prices, the rising demand for electricity, economic considerations, and the role of renewable energy sources in addressing these challenges. In this research, “green hydrogen” denotes H2 generated only by water electrolysis with renewable electricity, namely PV solar energy, devoid of fossil fuel dependence or related carbon emissions. This differentiates it from other H2 routes, like gray, blue, or brown H2, which originate from fossil-based processes.
Solar energy is gaining traction as a viable alternative to fossil fuels, thanks to the decreasing costs of PV modules and increasing petrochemical prices. However, challenges in system design and modeling for widespread adoption remain. Understanding the impacts of temperature and irradiance on PV performance is essential, with ongoing research aimed at improving solar modeling and parameter extraction accuracy. Estimating energy generation involves climatic variables and the PV cell’s operating temperature, necessitating a thermal model. Approaches for estimating cell temperature ( T c ) can be categorized into steady-state models, which are simpler and less resource-intensive but potentially underestimate Tc, and dynamic models, which are more complex yet provide better accuracy by factoring in variations in solar irradiance [1,2].
The specifications of PV modules often lack crucial data for the accurate mathematical modeling of PV cells, which is necessary for optimizing system performance. Numerous circuit models have been documented for accurately depicting solar cells, including the single-diode model (SDM), the double-diode model (DDM), and the triple-diode model (TDM). The SDM is the simplest, consisting of a single DC source ( I PV ) and a diode in parallel with it, along with two resistors, one in parallel ( R P ) and another in series ( R s ). The diode current is characterized by the ideality factor (n) and the reverse saturation current ( I o ), with five parameters encompassed in a decision vector ( I PV , I D , n , R P , R s ) needed for precise I–V characteristic representation. However, the SDM lacks consideration of all physical dimensions, leading to lower accuracy compared to the DDM and TDM. The DDM includes two diodes, necessitating the calibration of seven unknown parameters ( I PV , I D 1 , n 1 , I D 2 , n 2 , R P , R s ), and it effectively accounts for the neutral area of the junction for better accuracy. The most detailed TDM model consists of three diodes and requires nine parameters ( I PV , I D 1 , n 1 , I D 2 , n 2 , I D 3 , n 3 , R P , R s ), designed to account for current leakage in smaller solar cells, thus representing the most precise model for solar cells. Due to enhanced model fidelity, recent research has concentrated on sophisticated hybrid optimization and numerical methods to accurately estimate the nine unknown TDM parameters, illustrating that resilient metaheuristic-deterministic frameworks can proficiently address the nonlinear parameter extraction challenge using experimental I–V and P–V characteristics, thereby bolstering the practical utility of the TDM for precise PV performance evaluation [3,4,5,6,7,8].
Electrolysis of water is a process that produces H2 using water (H2O) and generates pure oxygen (O2) as a byproduct. It requires direct current electricity from renewable sources, such as solar power, and offers higher cell efficiency and high-purity H2 yield, making it suitable for low-temperature fuel cells. The process involves dissociating water into H2 and O2, and it can be classified based on electrolyte and ionic charge carriers, with the main methods being the proton exchange membrane (PEM), alkaline water electrolysis (AWE), and the solid oxide electrolysis cell (SOEC) [9,10].
In a proton exchange membrane (PEM), water splits at the anode into O2, protons, and electrons; protons traverse the membrane while electrons head to the cathode to form H2. The membrane’s design enhances reactant flow, gas separation, and electrical conduction, allowing efficient operation under moderate temperatures and pressures without significant downstream compression [11,12]. Furthermore, PEM electrolyzers exhibit a rapid dynamic reaction and extensive operational flexibility, rendering them especially appropriate for direct integration with intermittent renewable energy sources like solar systems. Alkaline water electrolysis (AEL) is an efficient method for producing green H2 on a large scale using renewable energy. It utilizes an alkaline electrolyte to produce H2 and O2 separately. AEL features a durable design, low costs, and non-noble catalysts like nickel, operating at moderate temperatures with around 70% efficiency. While challenges like gas crossover exist, AEL is crucial for renewable H2 production due to its established technology, scalability, and effectiveness in energy storage and grid balancing [13,14]. Solid oxide electrolysis cells (SOECs) facilitate efficient green H2 production via high-temperature electrolysis, utilizing thermal energy to create steam and significantly reducing electrical energy needs. Achieving up to 90% power-to-H2 efficiency, SOECs electrochemically reduce steam to generate H2, with O2 ions traversing a dense oxide electrolyte to produce O2 gas. The elevated operational temperature boosts reaction kinetics and ionic conductivity, enabling versatile integration in H2 generation and reversible power applications [15].
The study selected PV and electrolyzer technologies to provide both modeling accuracy and technical variety among PV–H2 systems. The SDM, DDM, and TDM were selected to illustrate ascending degrees of electrical modeling precision, from basic formulations to high-fidelity representations that explicitly include various recombination processes. PEM, AEL, and SOEC electrolyzers were chosen since they represent the three most established electrolysis technologies, including low-, medium-, and high-temperature operations with varying efficiency attributes and degrees of commercial maturity. This integrated selection enables a methodical and physically coherent evaluation of the impact of PV modeling accuracy and electrolyzer technology on H2 generation efficiency.

1.2. Review of Prior Works

This subsection examines previous research on the integration of photovoltaic (PV) systems with electrolysis technologies, with the main approaches and results included in Table 1.
This study goes beyond previous research that compared PV electrical models in isolation by quantifying the impact of PV modeling fidelity on H2P when integrated with electrolysis systems under realistic, time-resolved operating conditions. Moreover, the bulk of previous work on PV–electrolyzer integration uses the SDM, but research utilizing the DDM is notably limited. To the authors’ knowledge, no prior research has directly investigated the integration of DDM-based PV modeling with electrolysis systems at the system level.

1.3. Scientific Contributions

This work advances the knowledge of solar-driven H2 systems by investigating a notable gap in the literature on the combined effects of PV modeling precision and electrolyzer technology selection on H2 and H2-derived power production. The primary aims of this study were to quantitatively compare SDM, DDM, and TDM under uniform climatic conditions; to evaluate the influence of PV modeling fidelity on H2P estimates for PEM, AEL, and SOEC; and to ascertain the comparative effects of PV modeling accuracy and electrolyzer technology selection on system-level H2 performance. The main scientific achievements (SA) are summarized as follows:
SA1: A comprehensive modeling framework that systematically incorporates three photovoltaic (PV) electrical models: the single-diode model (SDM), the double-diode model (DDM), and the triple-diode model (TDM), characterized by five, seven, and nine parameters, respectively. The framework was constructed using authentic inputs, comprising site-specific meteorological data for Riyadh, Saudi Arabia (December 2024–November 2025), indicative of elevated solar irradiance conditions, along with manufacturer datasheet specifications for both photovoltaic modules and electrolyzers, thus guaranteeing a physically coherent and realistic system evaluation.
SA2: This study quantitatively evaluated the influence of photovoltaic cell modeling precision on hydrogen production chains by explicitly modeling solar cell temperature, photovoltaic current, and output power according to the equivalent circuit formula of each photovoltaic cell model and the electronic and chemical properties of each electrolyzer. The electrolyzer models were provided with maximum output power, facilitating an accurate assessment of how discrepancies in photovoltaic cell model precision influence hydrogen production estimates.
SA3: This study diverges from prior research that utilized a singular photovoltaic representation (such as SDM) and a single electrolyzer technology (such as PEM or alkaline) by incorporating various photovoltaic models and electrolysis types within a maximum power point tracking (MPPT) framework. This method demonstrates the direct influence of photovoltaic model precision on hydrogen production estimation under realistic operating conditions, bringing to light the combined effects of photovoltaic electrical modeling accuracy and electrolyzer selection.
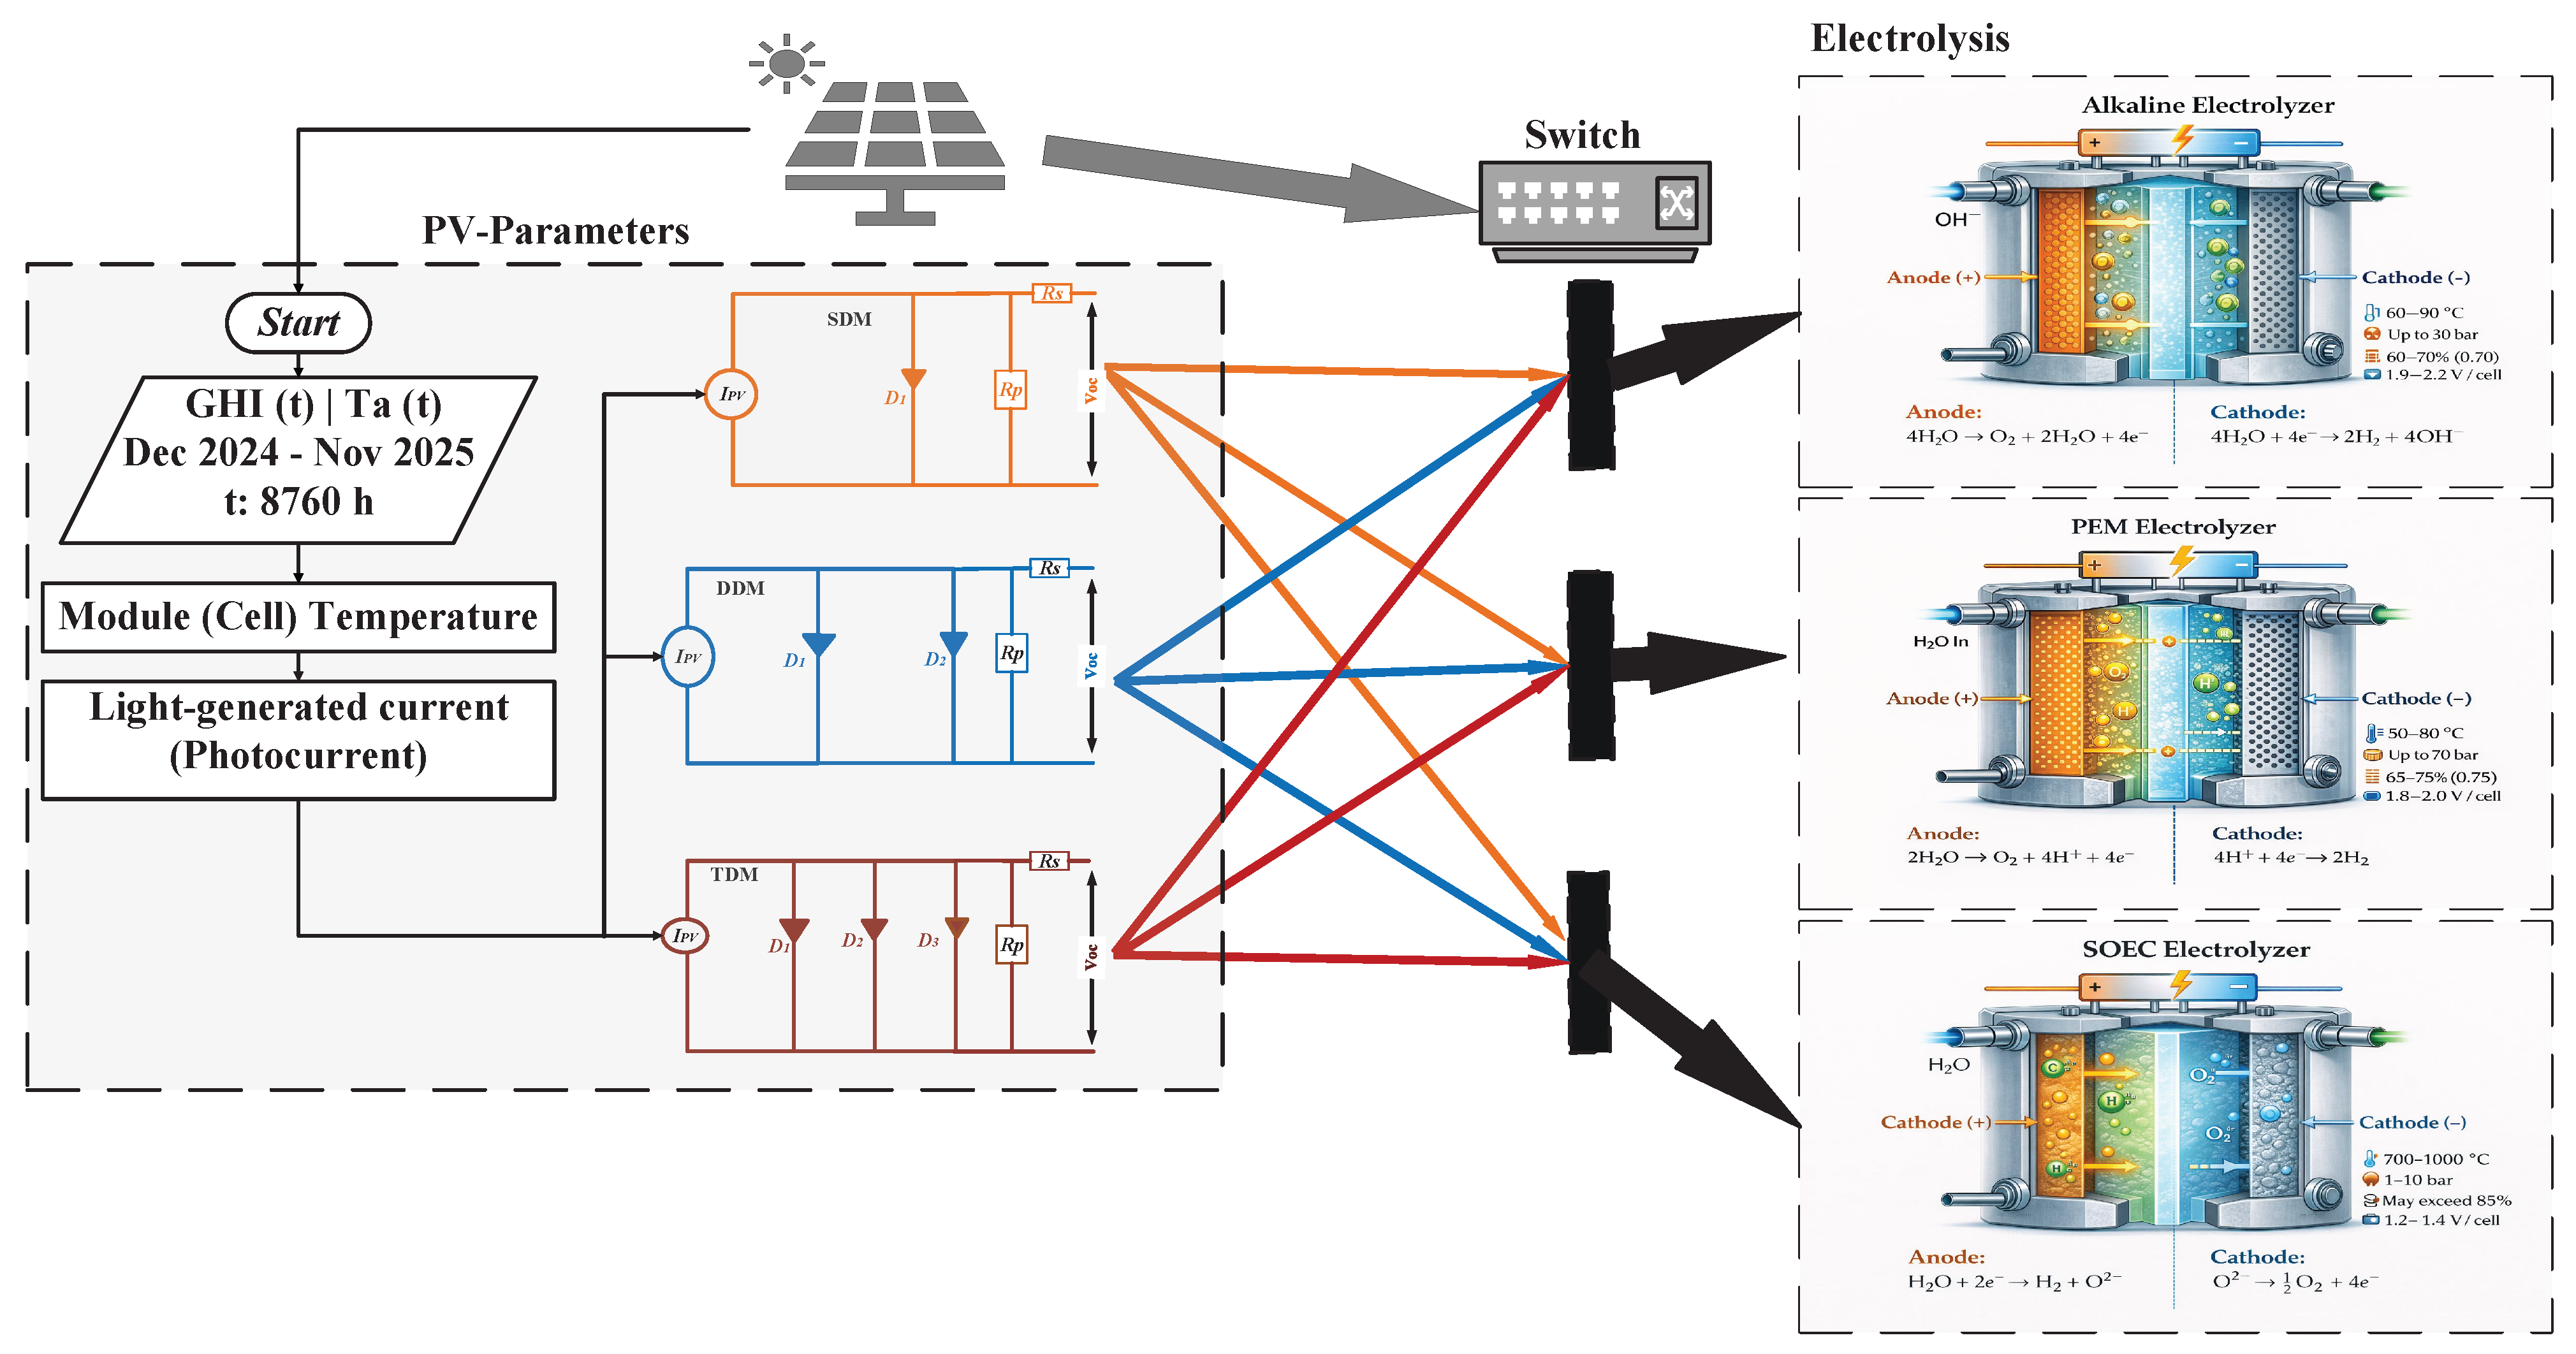
This discussion focuses on a practical study that analyzed actual data to compare PV models coupled with electrolysis systems, aiming to evaluate both the PV power output and the amount of H2 produced; the comprehensive interaction between the examined PV models and electrolyzer technologies is illustrated diagrammatically in Figure 1. Subsequent to this introduction, the work is structured into a series of methodological and analytical parts that delineate the modeling of green H2 generation using solar energy factors. The first part concentrates on physical sides, the modeling of PV module temperature, photocurrent, and open-circuit voltages, followed by a comparative review of several PV parameter estimate techniques. Then, it pertains to the modeling of various electrolyzer methods for H2 generation. The second part encapsulates the main results and discussion according to the previous steps. The final section concludes the paper by summarizing the methodology, key results, and overall implications of the study.


2. Material and Methods

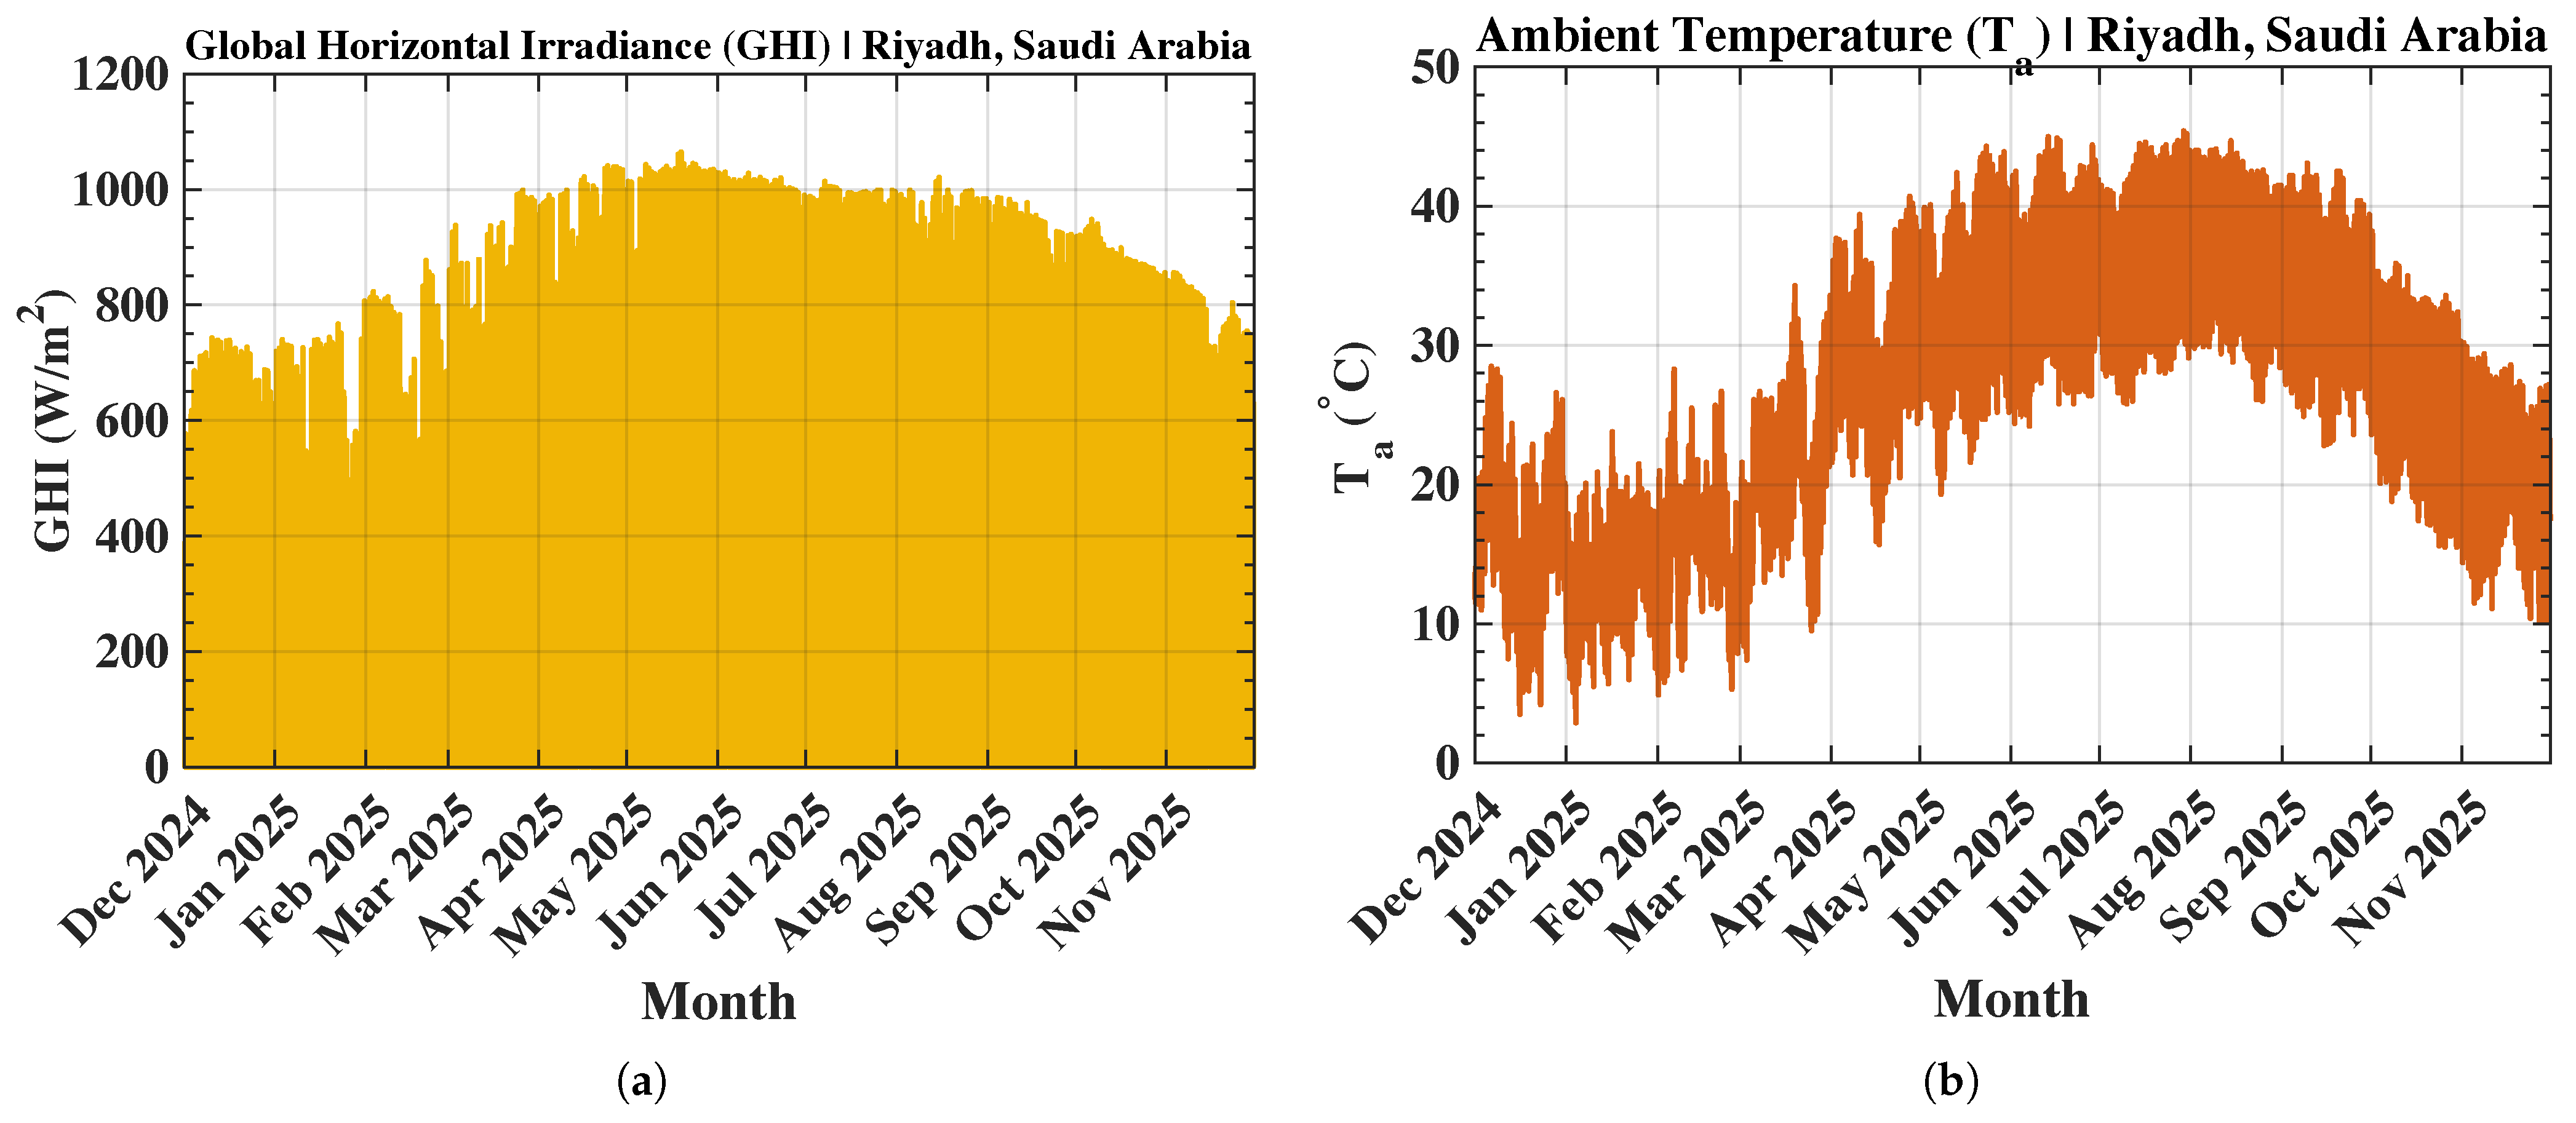
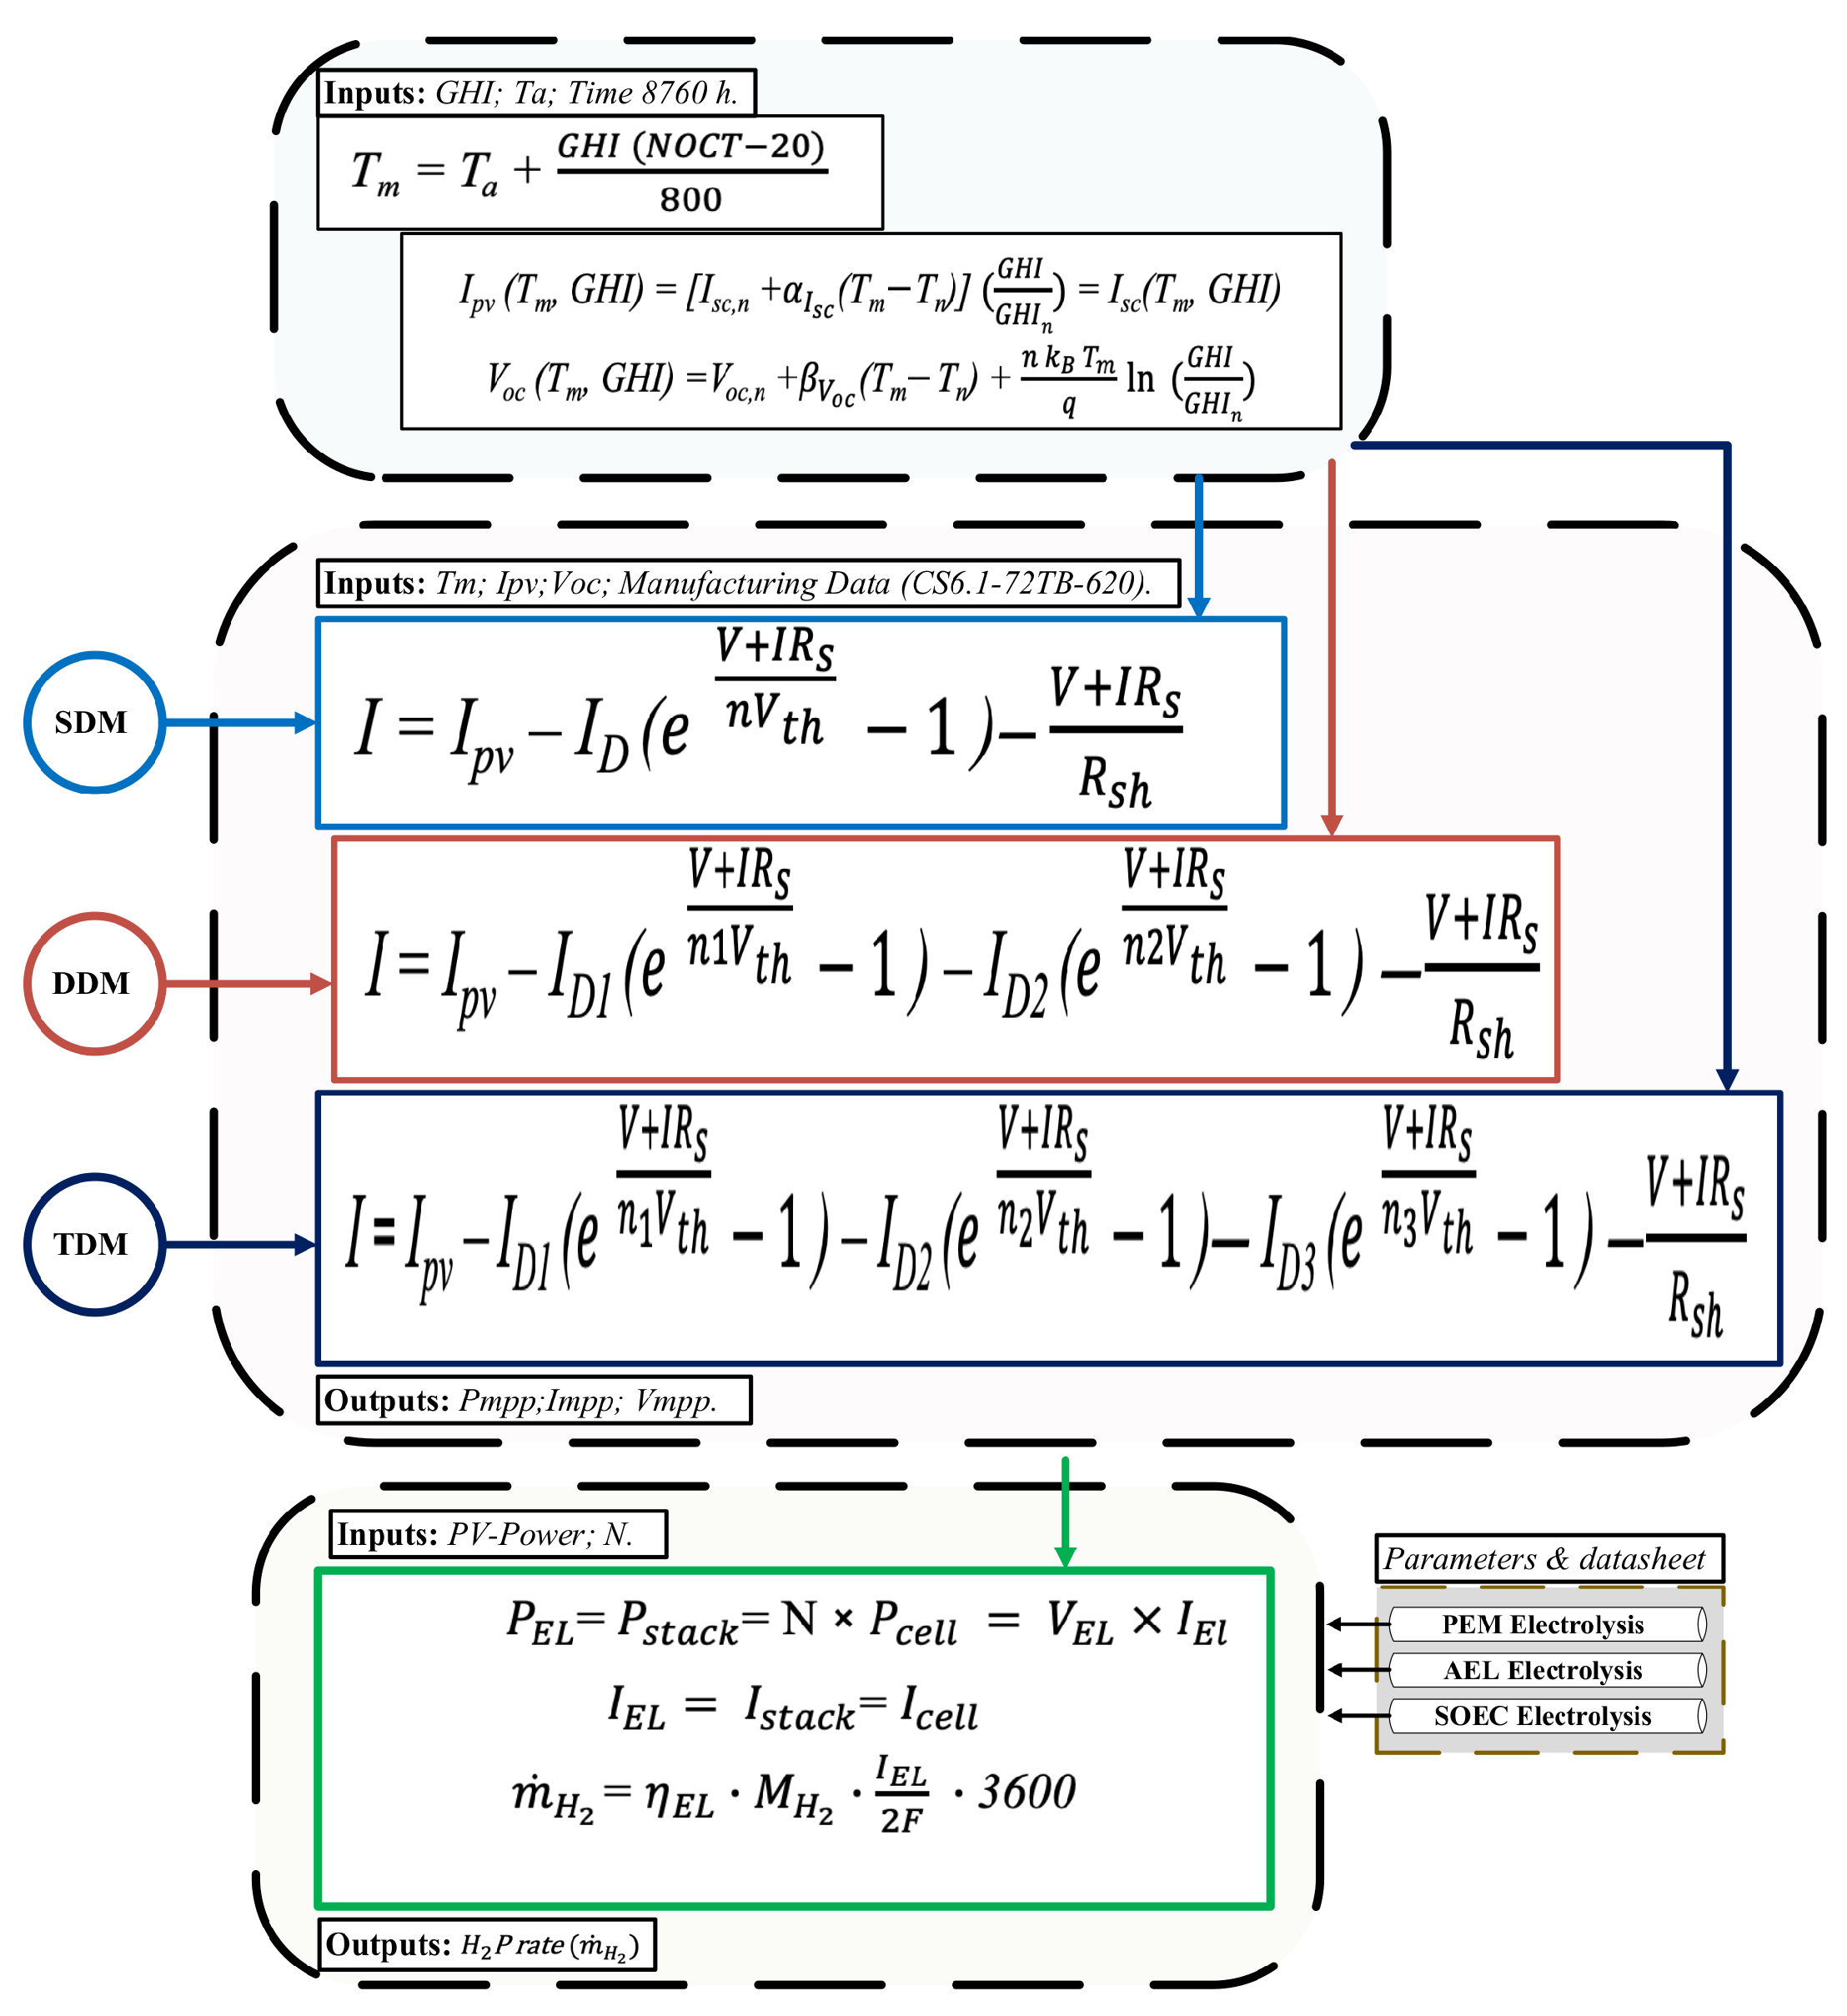
For this section, we assess three photovoltaic parameter estimating models—SDM, DDM, and TDM—and their applicability to prevalent electrolyzer technologies for green hydrogen generation, using actual manufacturing data simulated in MATLAB R2024b. Data on the site-specific global horizontal irradiance and ambient temperature for Riyadh, Saudi Arabia (24.71° N, 46.68° E) were used to depict authentic operational conditions, as shown in Figure 2, and they were obtained from the National Center for Meteorology (Saudi Arabia) database and the Open-Meteo partners (Free Weather API). Figure 3 is a flowchart illustrating the chronological stages of the proposed research, including PV parameter modeling and culminating in green H2 generation using electrolyzer systems.

2.1. Photovoltaic

2.1.1. Module (Cell) Temperature

A photovoltaic (PV) solar power system consists of photovoltaic cells made of semiconductor materials, which convert light energy directly into electrical energy. A PV solar module is made up of solar cells connected in series and parallel and mounted on a single frame. To meet high power demands, the modules are connected in series or parallel; these connections are collectively referred to as a solar array. Furthermore, the Ross model is a simple linear method that has shown considerable accuracy in forecasting the temperature of PV modules. It indicates that the disparity between the PV module’s temperature and ambient temperature ( T m T a ) is linear. Previous experimental research has shown that the proportionality constant k, which is unique to the design and material properties of the PV module, is determined by a specific set of boundary conditions. The IEC PV standards use the Ross model to figure out the normal operating cell temperature (NOCT) [22]. The temperature attained by PV cells in open-circuit conditions is measured under the following conditions: an irradiation of 800 W/m2, an ambient temperature of 20 °C, a wind speed of 1 m/s, a module tilt angle of 37°, and open-air ventilation. The Ross coefficient (k) in solar photovoltaic systems measures the increase in a module’s temperature above the ambient temperature per unit of solar irradiance (W/m2) incident on its surface, as expressed by the formula:
T m = T a + GHI ( NOCT 20 ) 800
where T m is the temperature of the photovoltaic module (°C); T a is the ambient temperature (°C); NOCT is the nominal operating cell temperature (°C); and GHI is the global horizontal irradiance (W/m2).

2.1.2. Photocurrent/Light-Generated Current (Short-Circuit Current), Ipv

The photocurrent of the photovoltaic module is modeled as a function of module temperature and solar irradiation. The model inputs include module temperature T m , global horizontal irradiance (GHI), reference irradiance ( GHI n = 1000 W/m2), reference temperature ( T n = 25 °C), short-circuit current temperature coefficient ( α I s c ), and short-circuit current under standard test circumstances ( I s c , n ). Consequently, the photocurrent is articulated as Equation (2). The diode saturation current has a significant dependence on temperature and is influenced by the semiconductor bandgap energy. The necessary inputs are the module temperature, the reference temperature, the diode ideality factor, the Boltzmann constant ( k B = 1.380649 × 10 23 J/K), and the reverse saturation current under reference circumstances I D , ref . The temperature dependency of the bandgap energy is shown as Equation (3). E g , n denotes the semiconductor bandgap energy at the reference temperature, which is 1.12 eV for crystalline silicon. Table 2 shows the parameters employed in the photovoltaic model for the manufactured datasheet under standard test conditions and temperature-dependent operation [23]. The temperature-dependent diode saturation current for each diode in the model is determined using the Equation (4). These formulations provide a precise depiction of the temperature and irradiance impacts on photocurrent production and diode behavior, establishing a crucial basis for diode-based photovoltaic models in actual operating settings [24].
I p v ( T m , GHI ) = I s c , n + α I s c ( T m T n ) GHI GHI n = I s c ( T m , GHI )
E g ( T m ) = E g , n 1 0.0002677 ( T m T n ) [ eV ]
I D , i ( T m ) = I D , ref T m T n 3 exp E g n i k B 1 T n 1 T m , i = 1 , 2 , 3
V o c ( T m , GHI ) = V o c , n + β V o c ( T m T n ) + n k B T m q ln GHI GHI n

2.2. Mathematical Analysis of SDM, DDM and TDM

The single-diode (SDM), double-diode (DDM), and triple-diode (TDM) PV models are regulated by implicit nonlinear I–V equations, since the output current is present on both sides of the equation owing to the inclusion of the series resistance factor. As a result, these equations cannot be solved analytically in closed form and must be assessed numerically inside the suggested modeling framework. This part offers a mathematical evaluation of PV models concerning parameter modification approaches, with more methodological information provided in the next section.

2.2.1. Single-Diode Model (SDM)

The single-diode model (SDM) is widely used to represent the current–voltage characteristics of photovoltaic (PV) modules due to its effective balance of accuracy and computational efficiency. It considers a PV module as a current source, alongside a diode for the p–n junction behavior, the series resistance for internal losses, and the shunt resistance for leakage currents. The SDM includes five parameters: photocurrent, diode saturation current, diode ideality factor, series resistance, and shunt resistance. Although these parameters are not typically listed in manufacturer datasheets, they can be derived from standard test condition (STC) data, which consist of short-circuit current, open-circuit voltage, maximum power point, number of series-connected cells, and temperature coefficients. Given the dependence of PV module characteristics on irradiance and temperature, it is crucial to adjust STC parameters to accurately reflect performance under actual operating conditions [25]. The mathematical analysis of the single-diode model equation is as follows:
I = I p v I D e V + I R s n V t h 1 V + I R s R s h
V t h = k B T q
The present I p v denotes the photocurrent, primarily influenced by the incident irradiance (GHI); the diode current ( I D ), is described by Shockley’s equation; and the last component, the current I s h , traverses the parallel resistance ( R s h ). The thermal equivalent voltage ( V t h ) is expressed in relation to the electronic charge (q), the temperature ( T a ), and Boltzmann’s constant k B = 1.3806503 × 10 23 J/K as Equation (7).

2.2.2. Double-Diode Model (DDM)

The double-diode model (DDM) enhances the single-diode formulation in solar circuit modeling by using two diodes to depict distinct loss mechanisms inside the p–n junction. One diode represents diffusion current under high forward bias, while the other pertains to recombination current in the depletion region, resulting in enhanced accuracy, especially at low-to-medium voltages and around the inflection point of the I–V curve. The DDM, although better aligning with real I–V characteristics in low light and fluctuating temperature circumstances, adds additional uncertainties and complicates parameter identification, often requiring five to seven parameters. I D 1 is the saturation current of the first diode linked to diffusion recombination, whereas I D 2 refers to the saturation current of the second diode, which considers recombination in the depletion region [26].
I = I p v I D 1 e V + I R s n 1 V t h 1 I D 2 e V + I R s n 2 V t h 1 V + I R s R s h

2.2.3. Triple-Diode Model (TDM)

The triple-diode model (TDM) is a complex photovoltaic equivalent-circuit model that fixes the problems with the single- and double-diode models, especially when the light is low and the temperature is high. The double-diode model improves accuracy by taking into account losses from diffusion and recombination. However, it may still not fully capture complex recombination processes. The TDM improves the DDM by adding a third diode that fixes recombination losses at the edges of grains and defects in the semiconductor material. In this model, the output current is the light-generated current minus the currents that come from diffusion, the depletion-region recombination, the grain-boundary recombination, and the shunt leakage. Because of this, the TDM gives a more accurate picture of the I–V characteristics, especially in the low-voltage and knee areas. This makes it perfect for high-fidelity solar performance testing and advanced energy system uses. To compute the output current, subtract the diode and resistive loss currents from the light-generated current [27,28]. The I D 1 represents diffusion-related recombination, the I D 2 indicates recombination in the depletion zone, and the I D 3 depicts trap-assisted or defect-related recombination, which is relevant in low light and high temperature. The TDM’s current–voltage relationship is detailed here:
I = I p v I D 1 e V + I R s n 1 V t h 1 I D 2 e V + I R s n 2 V t h 1 I D 3 e V + I R s n 3 V t h 1 V + I R s R s h
where I D 1 , I D 2 , and I D 3 signify the reverse saturation currents of the three diodes; n 1 , n 2 , and n 3 are the corresponding ideality factors; R s and R s h represent the series and shunt resistances; and V t h is the thermal voltage. The I–V and P–V characteristics show the TDM’s reaction to fluctuations in GHI.

2.3. Electrolysis

2.3.1. PEM, AEL, and SOEC

Most water electrolysis systems generate hydrogen and oxygen from water at low working temperatures. The primary water electrolysis methods utilized for hydrogen generation include proton exchange membrane (PEM) electrolysis, alkaline electrolysis (AEL), solid oxide electrolysis cell (SOEC), and anion exchange membrane (AEM) electrolysis. Each of these electrolyzer systems has unique operating principles, performance characteristics, and application fields, which are explored in depth in the following subsections [7]. The overall water electrolysis process explains the conversion of liquid water into hydrogen and oxygen gases using electrical energy, as in Table 3.
The reversible cell voltage [29], also known as the thermodynamic voltage, is the minimum voltage required for electrolyzing water into hydrogen and oxygen, as determined by the electrochemical process’s Gibbs free energy change. Under standard conditions (25 °C and 1 atm), the reversible voltage for water electrolysis is roughly 1.229 V. In practice, the actual voltage of the electrolyzer cell must exceed the theoretical value to compensate for irreversible losses such as activation, ohmic, and concentration overpotentials. Thus, the operating voltage of an individual electrolyzer cell may be expressed as Equation (10). It normally varies between 1.6 and 2.0 V per cell, depending on electrolyzer technology and operating circumstances. The electrolyzer stack voltage is calculated by connecting numerous cells in series and is expressed as Equation (11), where N is the number of cells in the stack. The electrolyzer’s electrical power consumption is proportional to its applied voltage and running current. The power consumed by a single cell is defined as Equation (12), while the total power consumed by the electrolyzer stack can be written as Equation (13). Because the cells are connected in series, the stack current is equal to the cell current, i.e., Equation (14).
V cell = V rev + η activation + η ohmic + η concentration
V EL = V stack = N × V cell
P cell = V cell × I cell
P EL = P stack = N × P cell = V EL × I EL
I EL = I stack = I cell

2.3.2. Hydrogen Production Rate (Faraday’s Law)

Faraday’s law is used to compute the H2 generation rate, which connects the electrical current to the quantity of H2 produced. This formulation is based on Faraday’s constant ( F = 96,485 C/mol), the molar mass of H2 ( M H 2 = 2.016 g / mol 0.002 kg / mol ), the electrolyzer current, and the electrolyzer efficiency η EL , which is specified by the electrolyzer technology (PEM, alkaline, or SOEC). This physically based technique allows for reliable calculation of H2 output from electrical input power across several electrolysis systems [30,31]. Table 4 and Table 5 outline the important technical characteristics and operational parameters of the alkaline (A485), PEM (MC500), and SOEC electrolyzers used in this work, serving as critical inputs for comparative modeling of H2 generation performance and energy consumption. The electrolyzer efficiency ( η EL ) denotes the comprehensive electrical-to-H2 conversion efficacy of the stack. For PEM and AEL systems, efficiency values use HHV, whereas for SOEC systems, efficiency is determined using LHV.
m ˙ H 2 = η EL · M H 2 · I EL 2 F · 3600

3. Results and Discussion

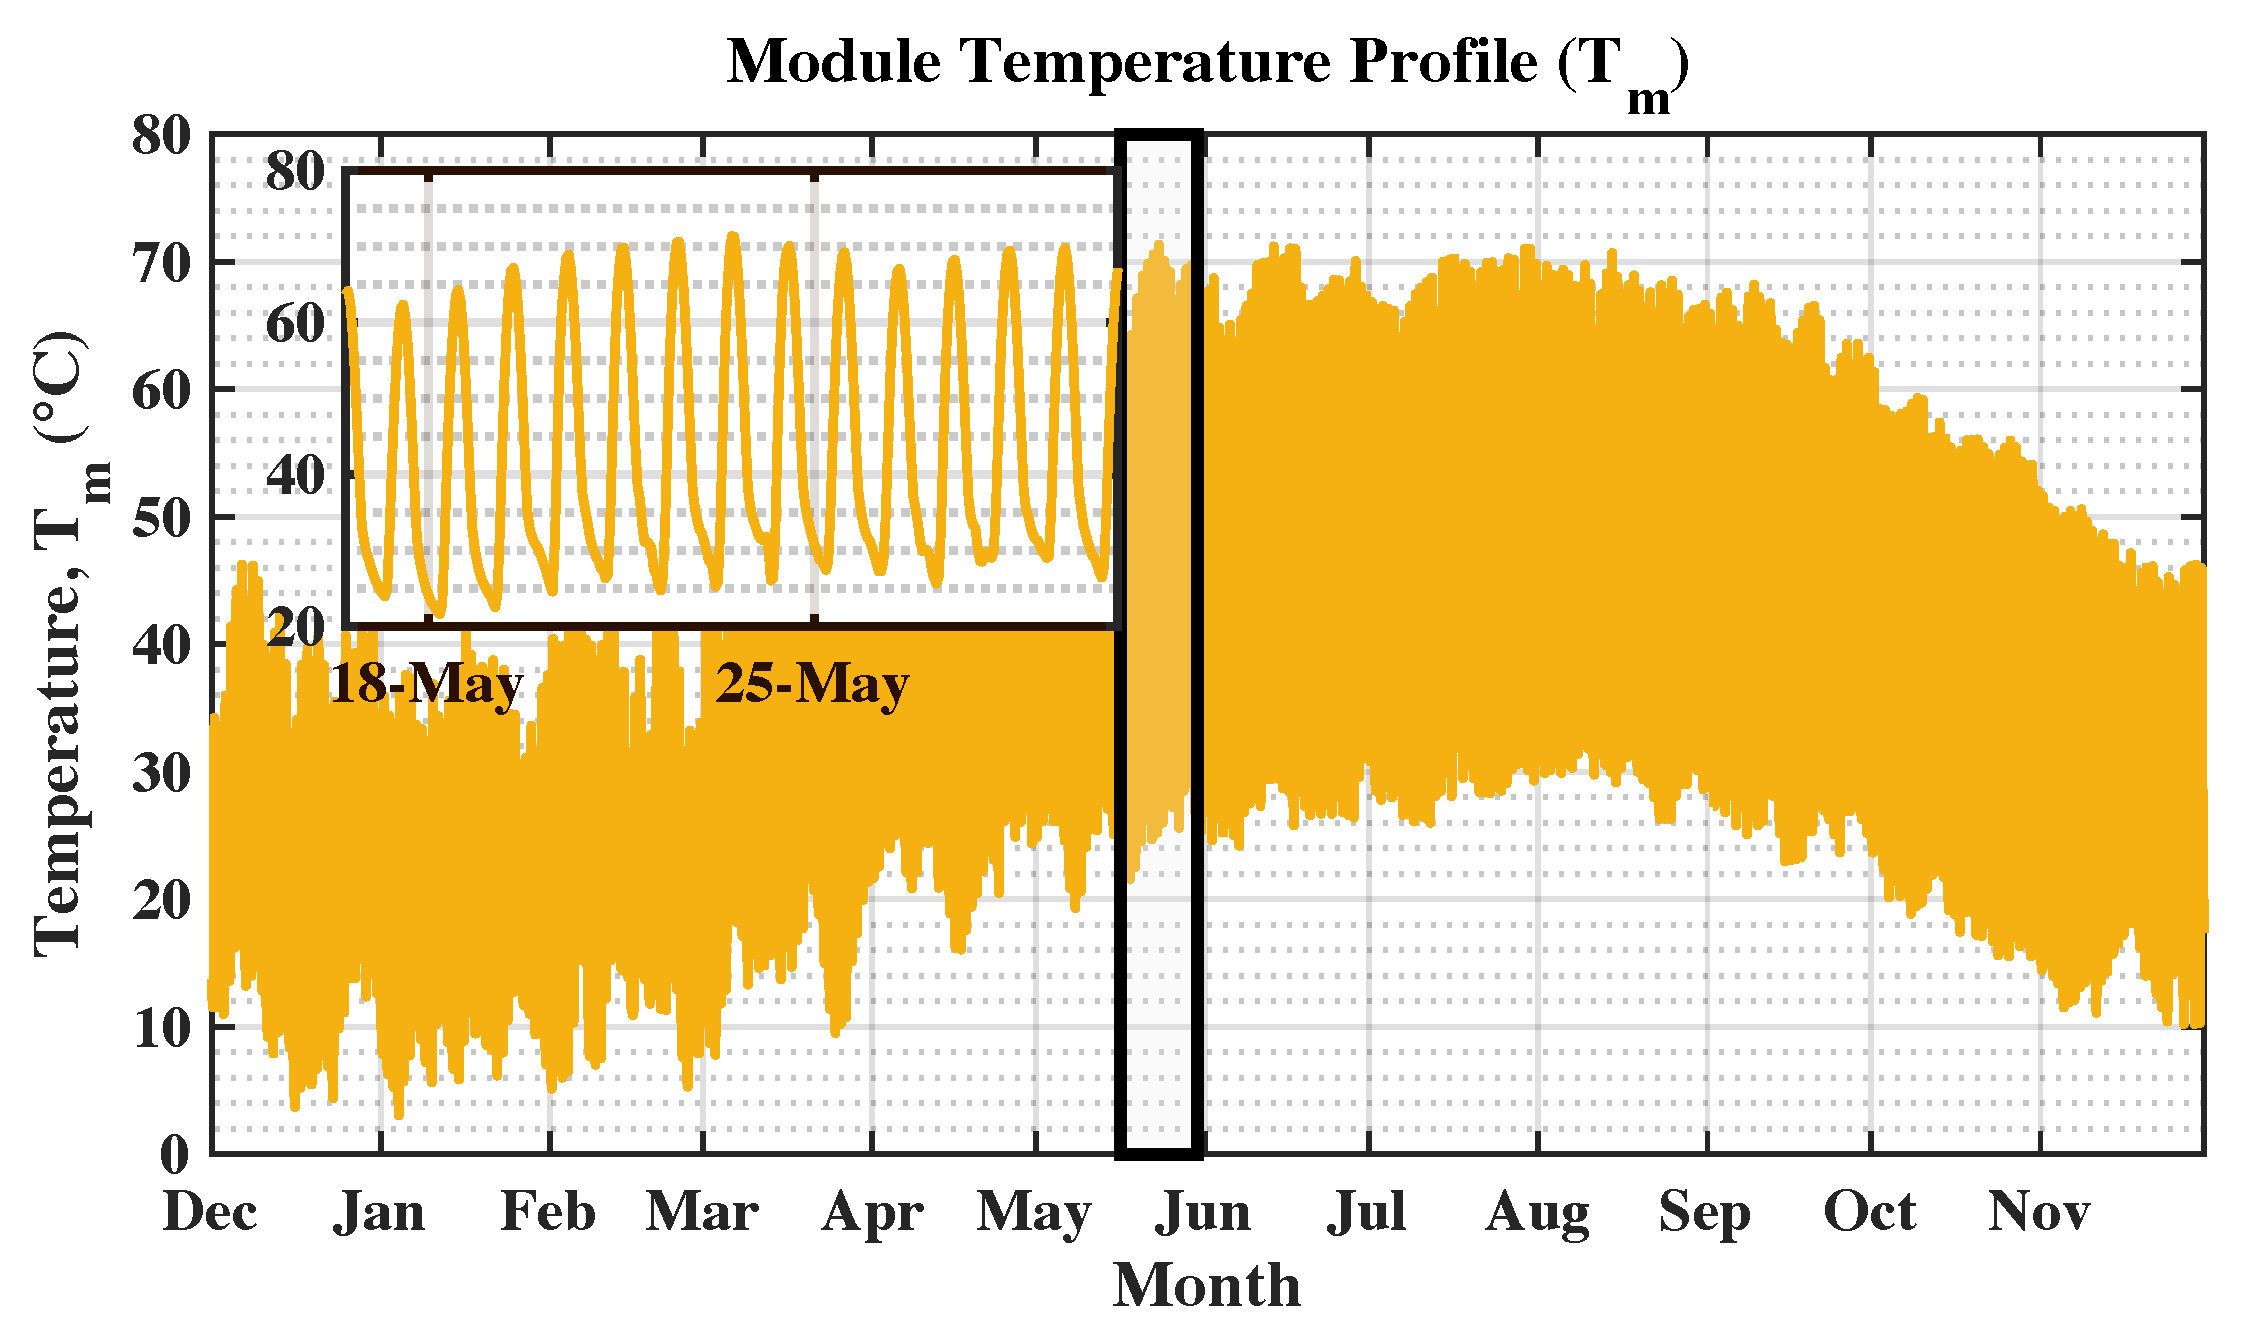
The findings of the solar cell modeling were examined using a multi-stage process. The cell temperature was first computed using Equation (1). The resultant cell temperature and photovoltaic current, based on the actual hourly GHI and Ta as depicted in Figure 1, along with additional parameters obtained from the manufacturing datasheet, are presented in Table 3 and Table 4. These were subsequently utilized as the physical input for the three photovoltaic cell models: the single-diode model (SDM), the double-diode model (DDM), and the triple-diode model (TDM). This procedure enabled the evaluation of Equations (1)–(7) and the subsequent derivation of the I–V and P–V characteristics of each model, explicitly accounting for all loss mechanisms, including series and shunt resistances. All simulations were performed under standard test conditions (STC), characterized by a reference temperature of 25 °C. Figure 4 depicts the yearly profile of the photovoltaic module temperature T m , emphasizing its seasonal and diurnal fluctuations. Elevated module temperatures were recorded in the summer months due to heightened solar irradiation and ambient temperature, while reduced values were noted in winter. The emphasized period and inset illustrate the significant daily temperature variations, indicating the responsive thermal behavior of the PV module to fluctuating irradiance circumstances.
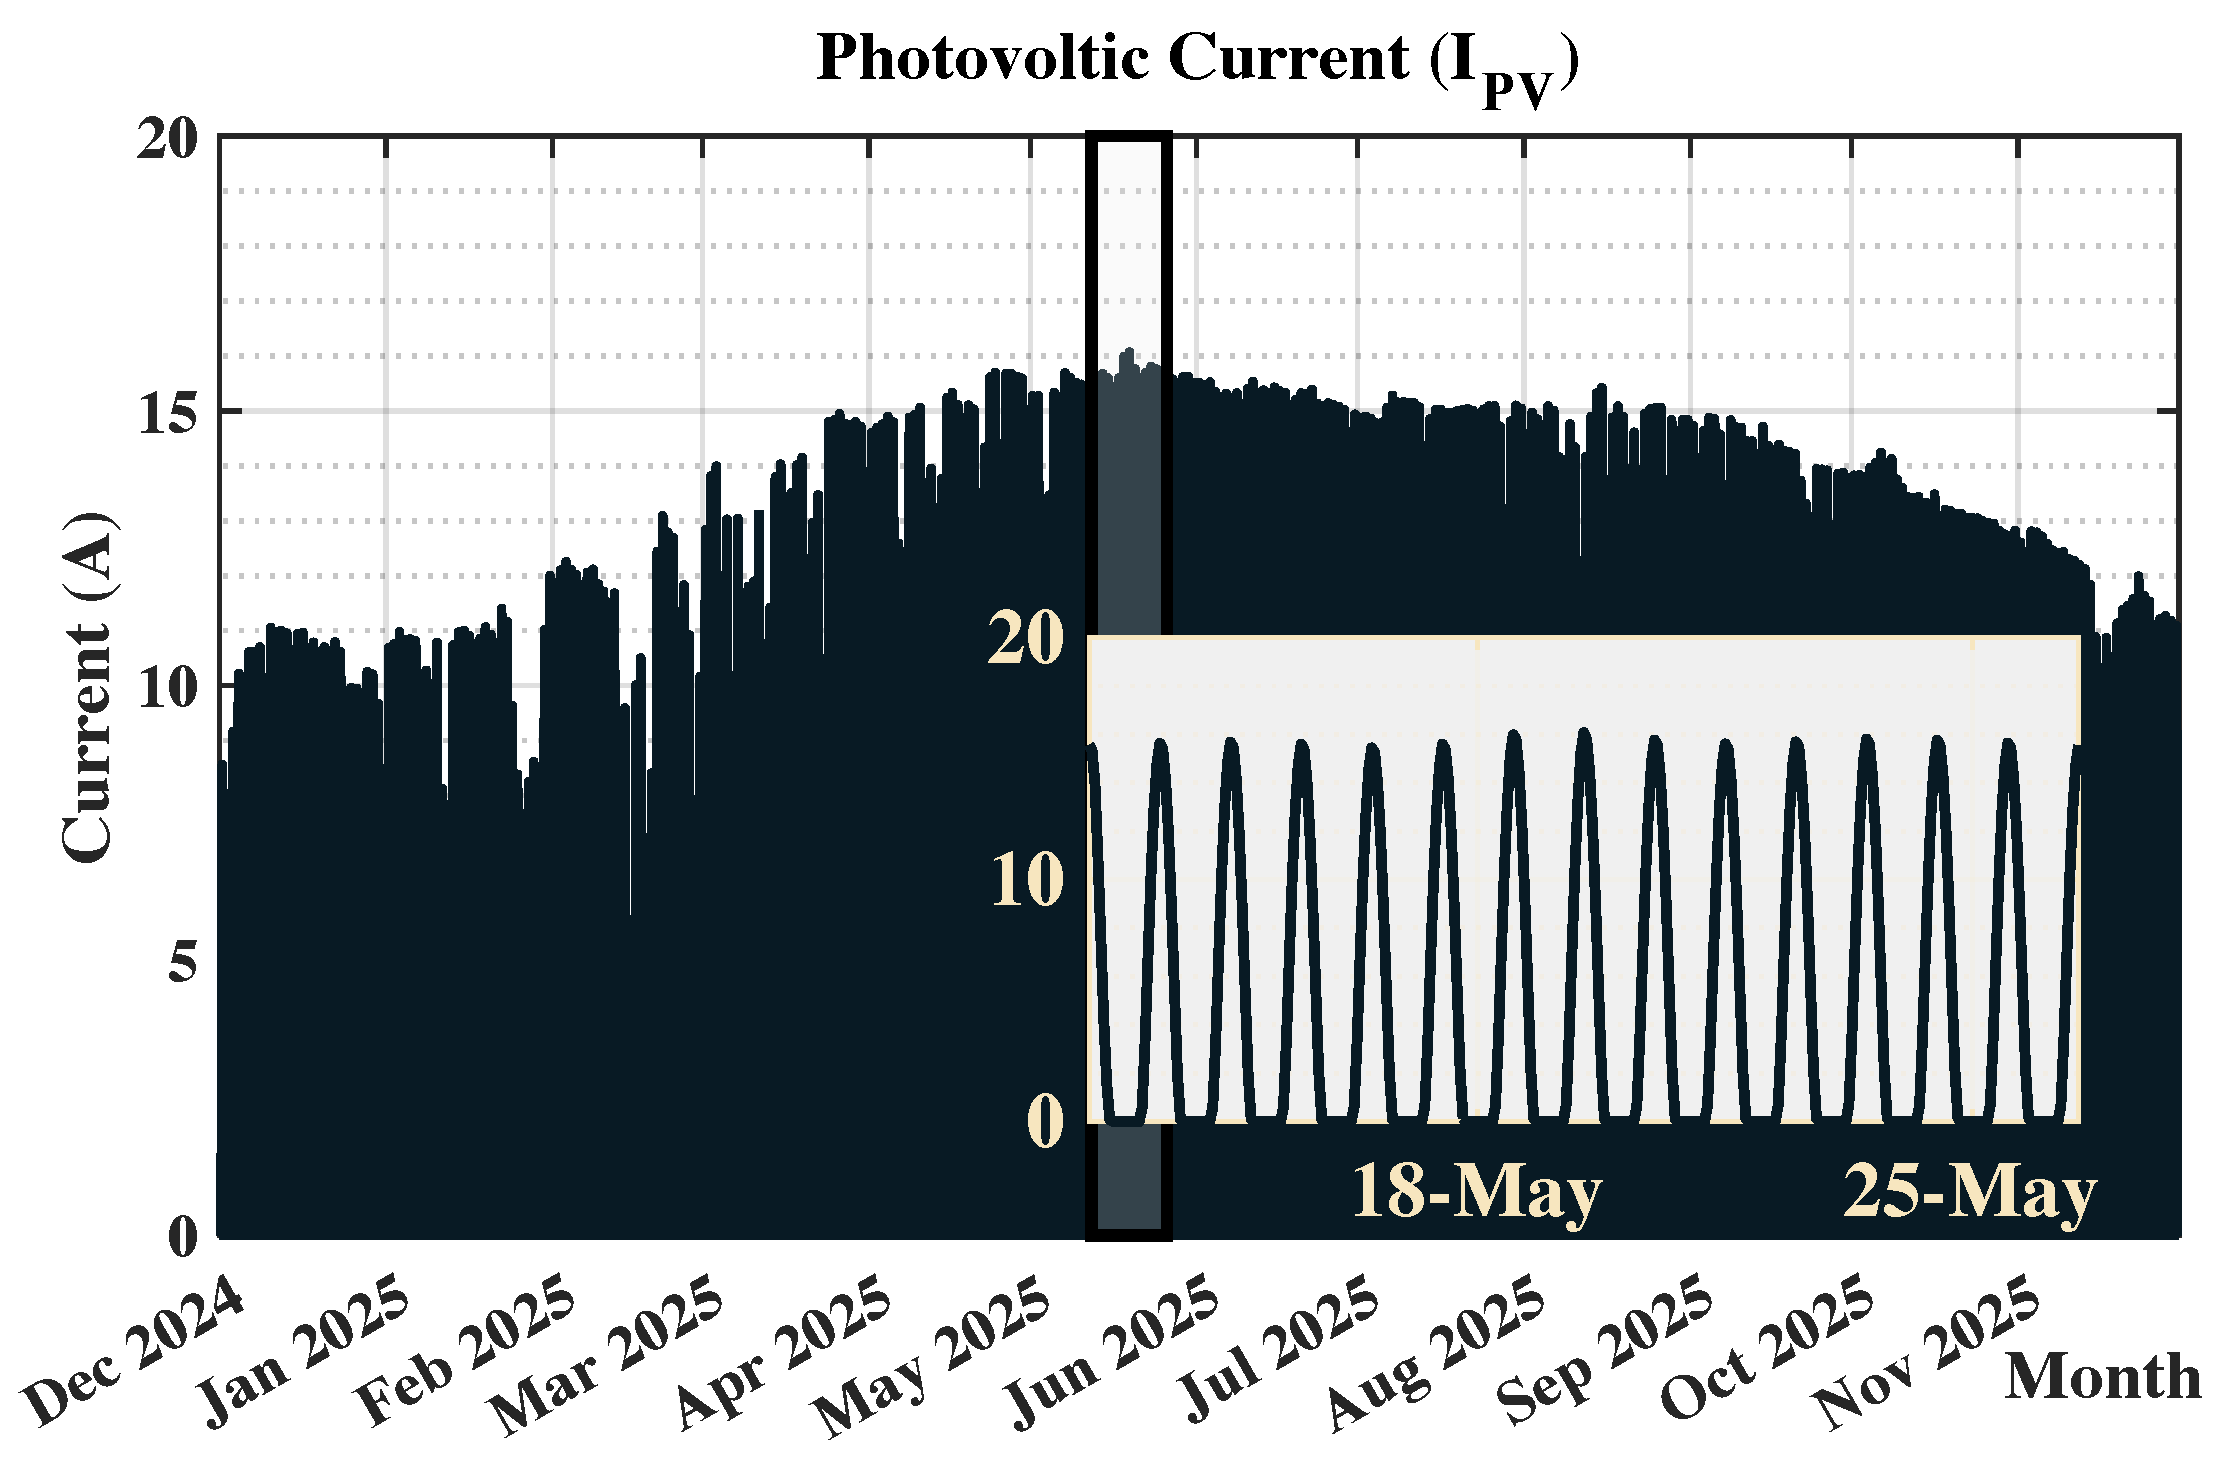
Figure 5 shows the output of Equation (2), which is the light-generated current I p v .
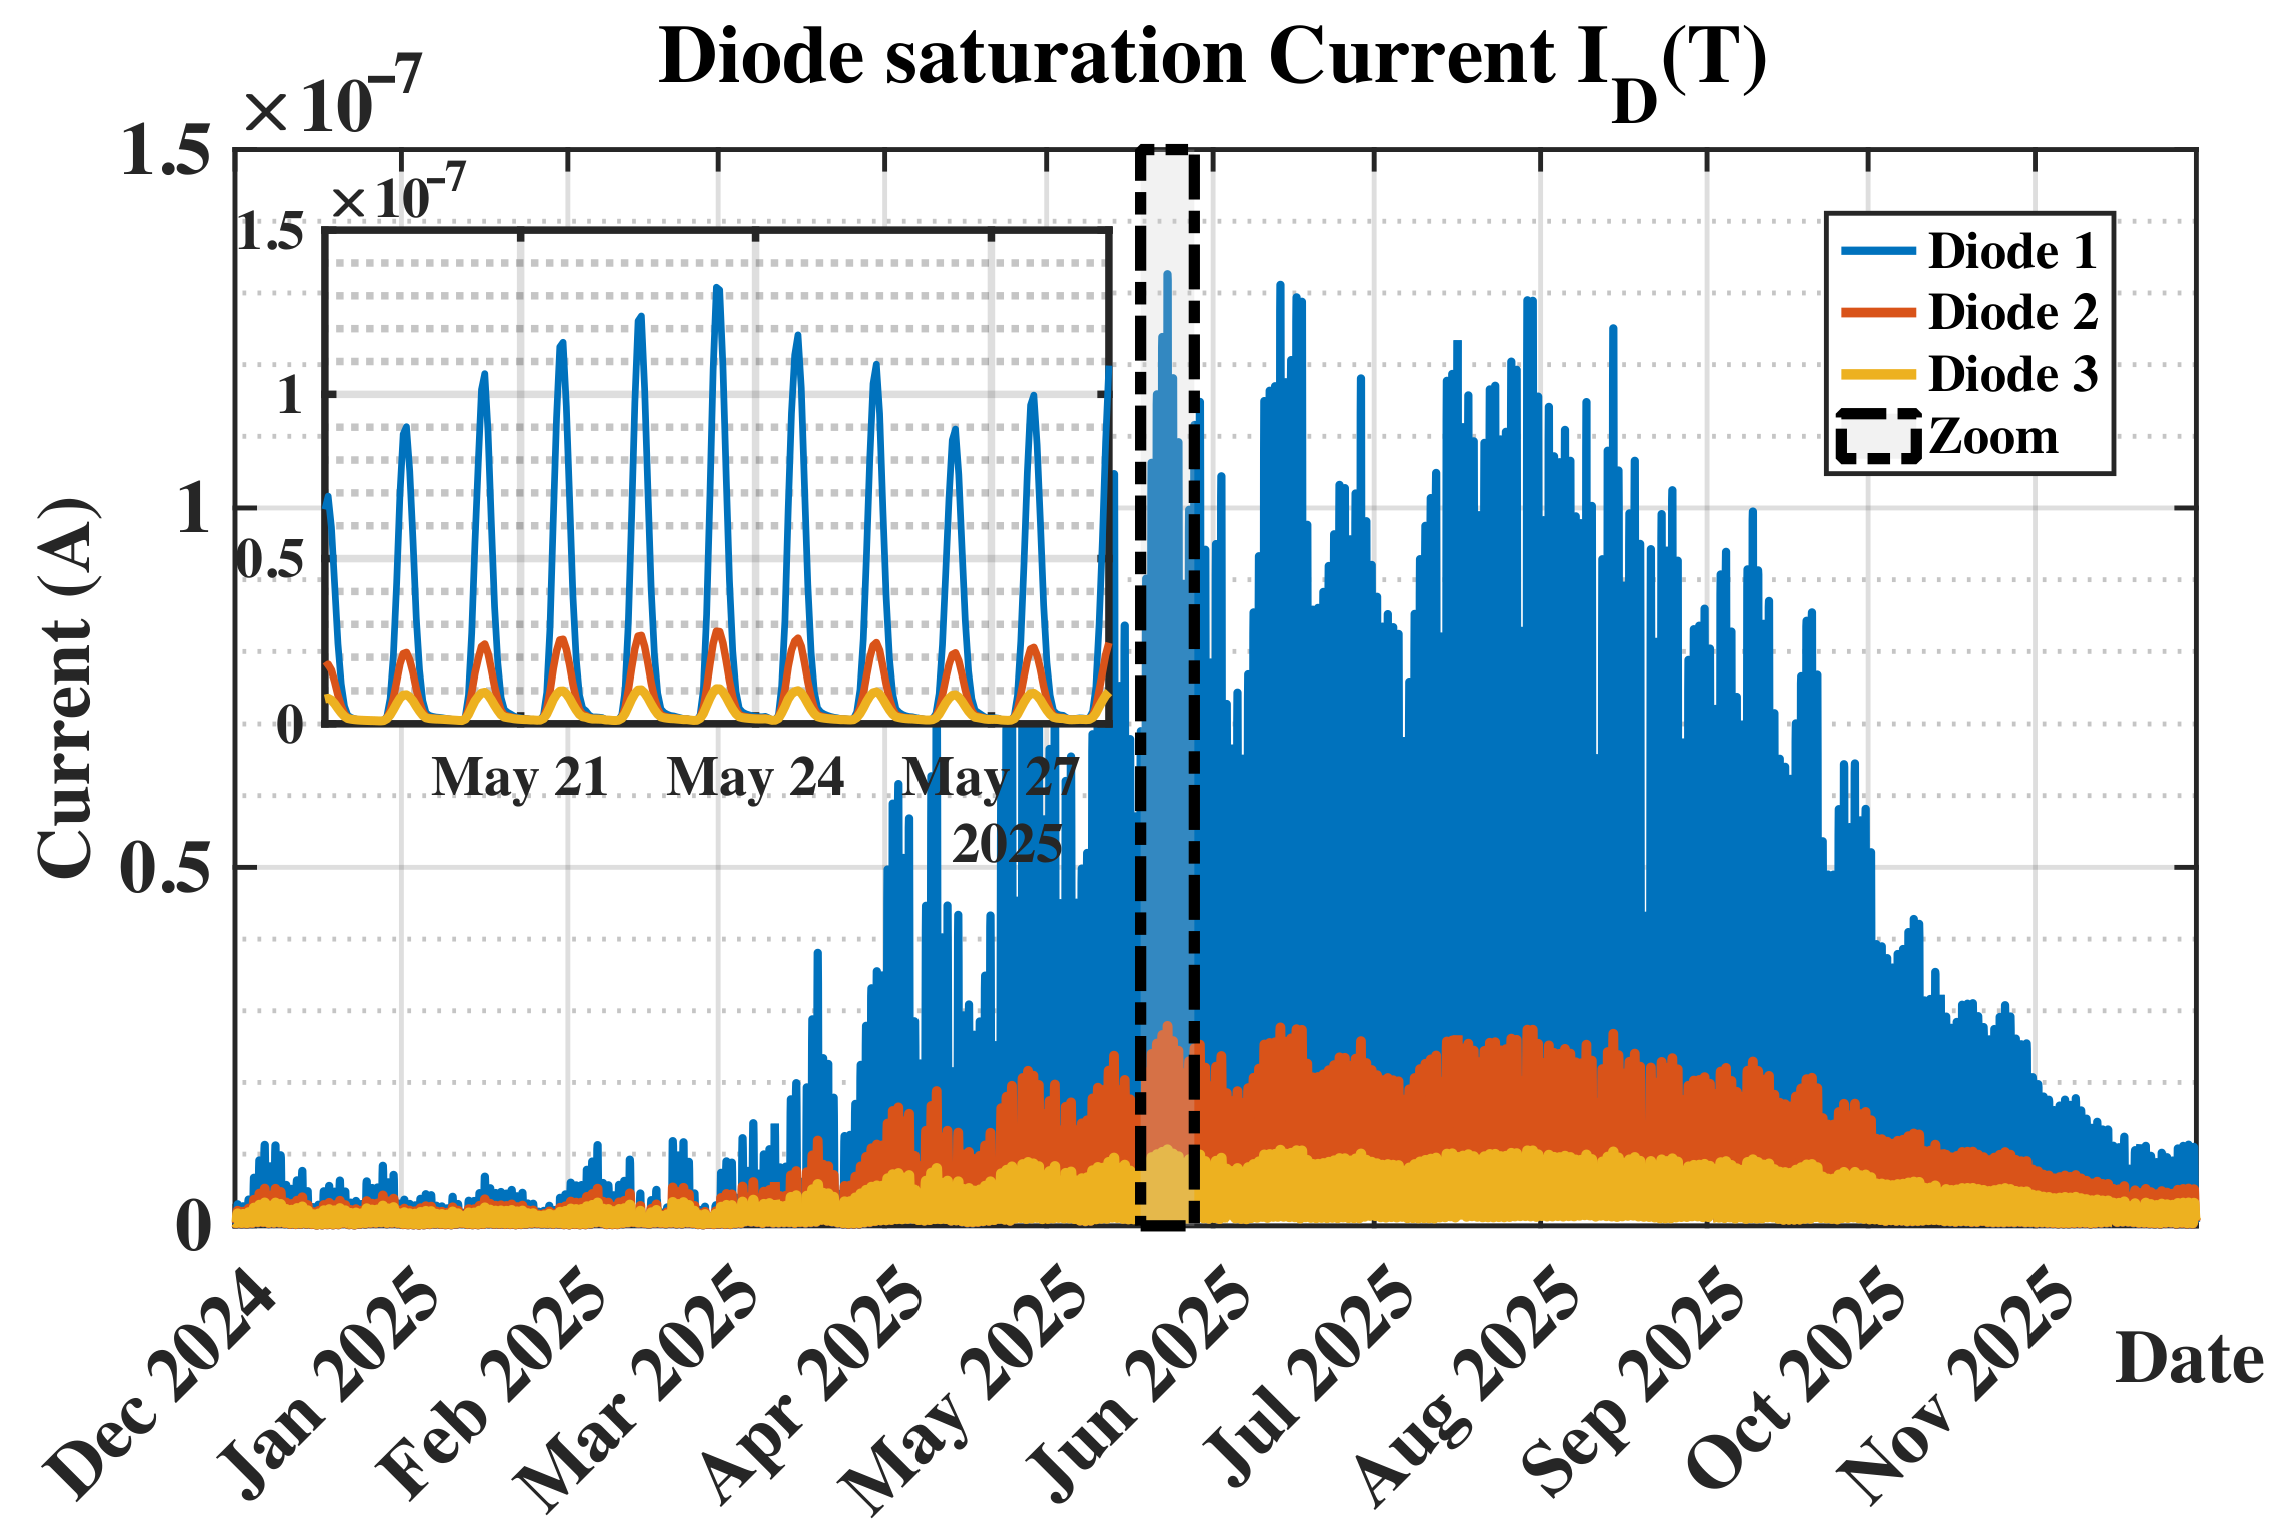
The findings illustrate the saturation current of the three diodes, as seen in Figure 6.
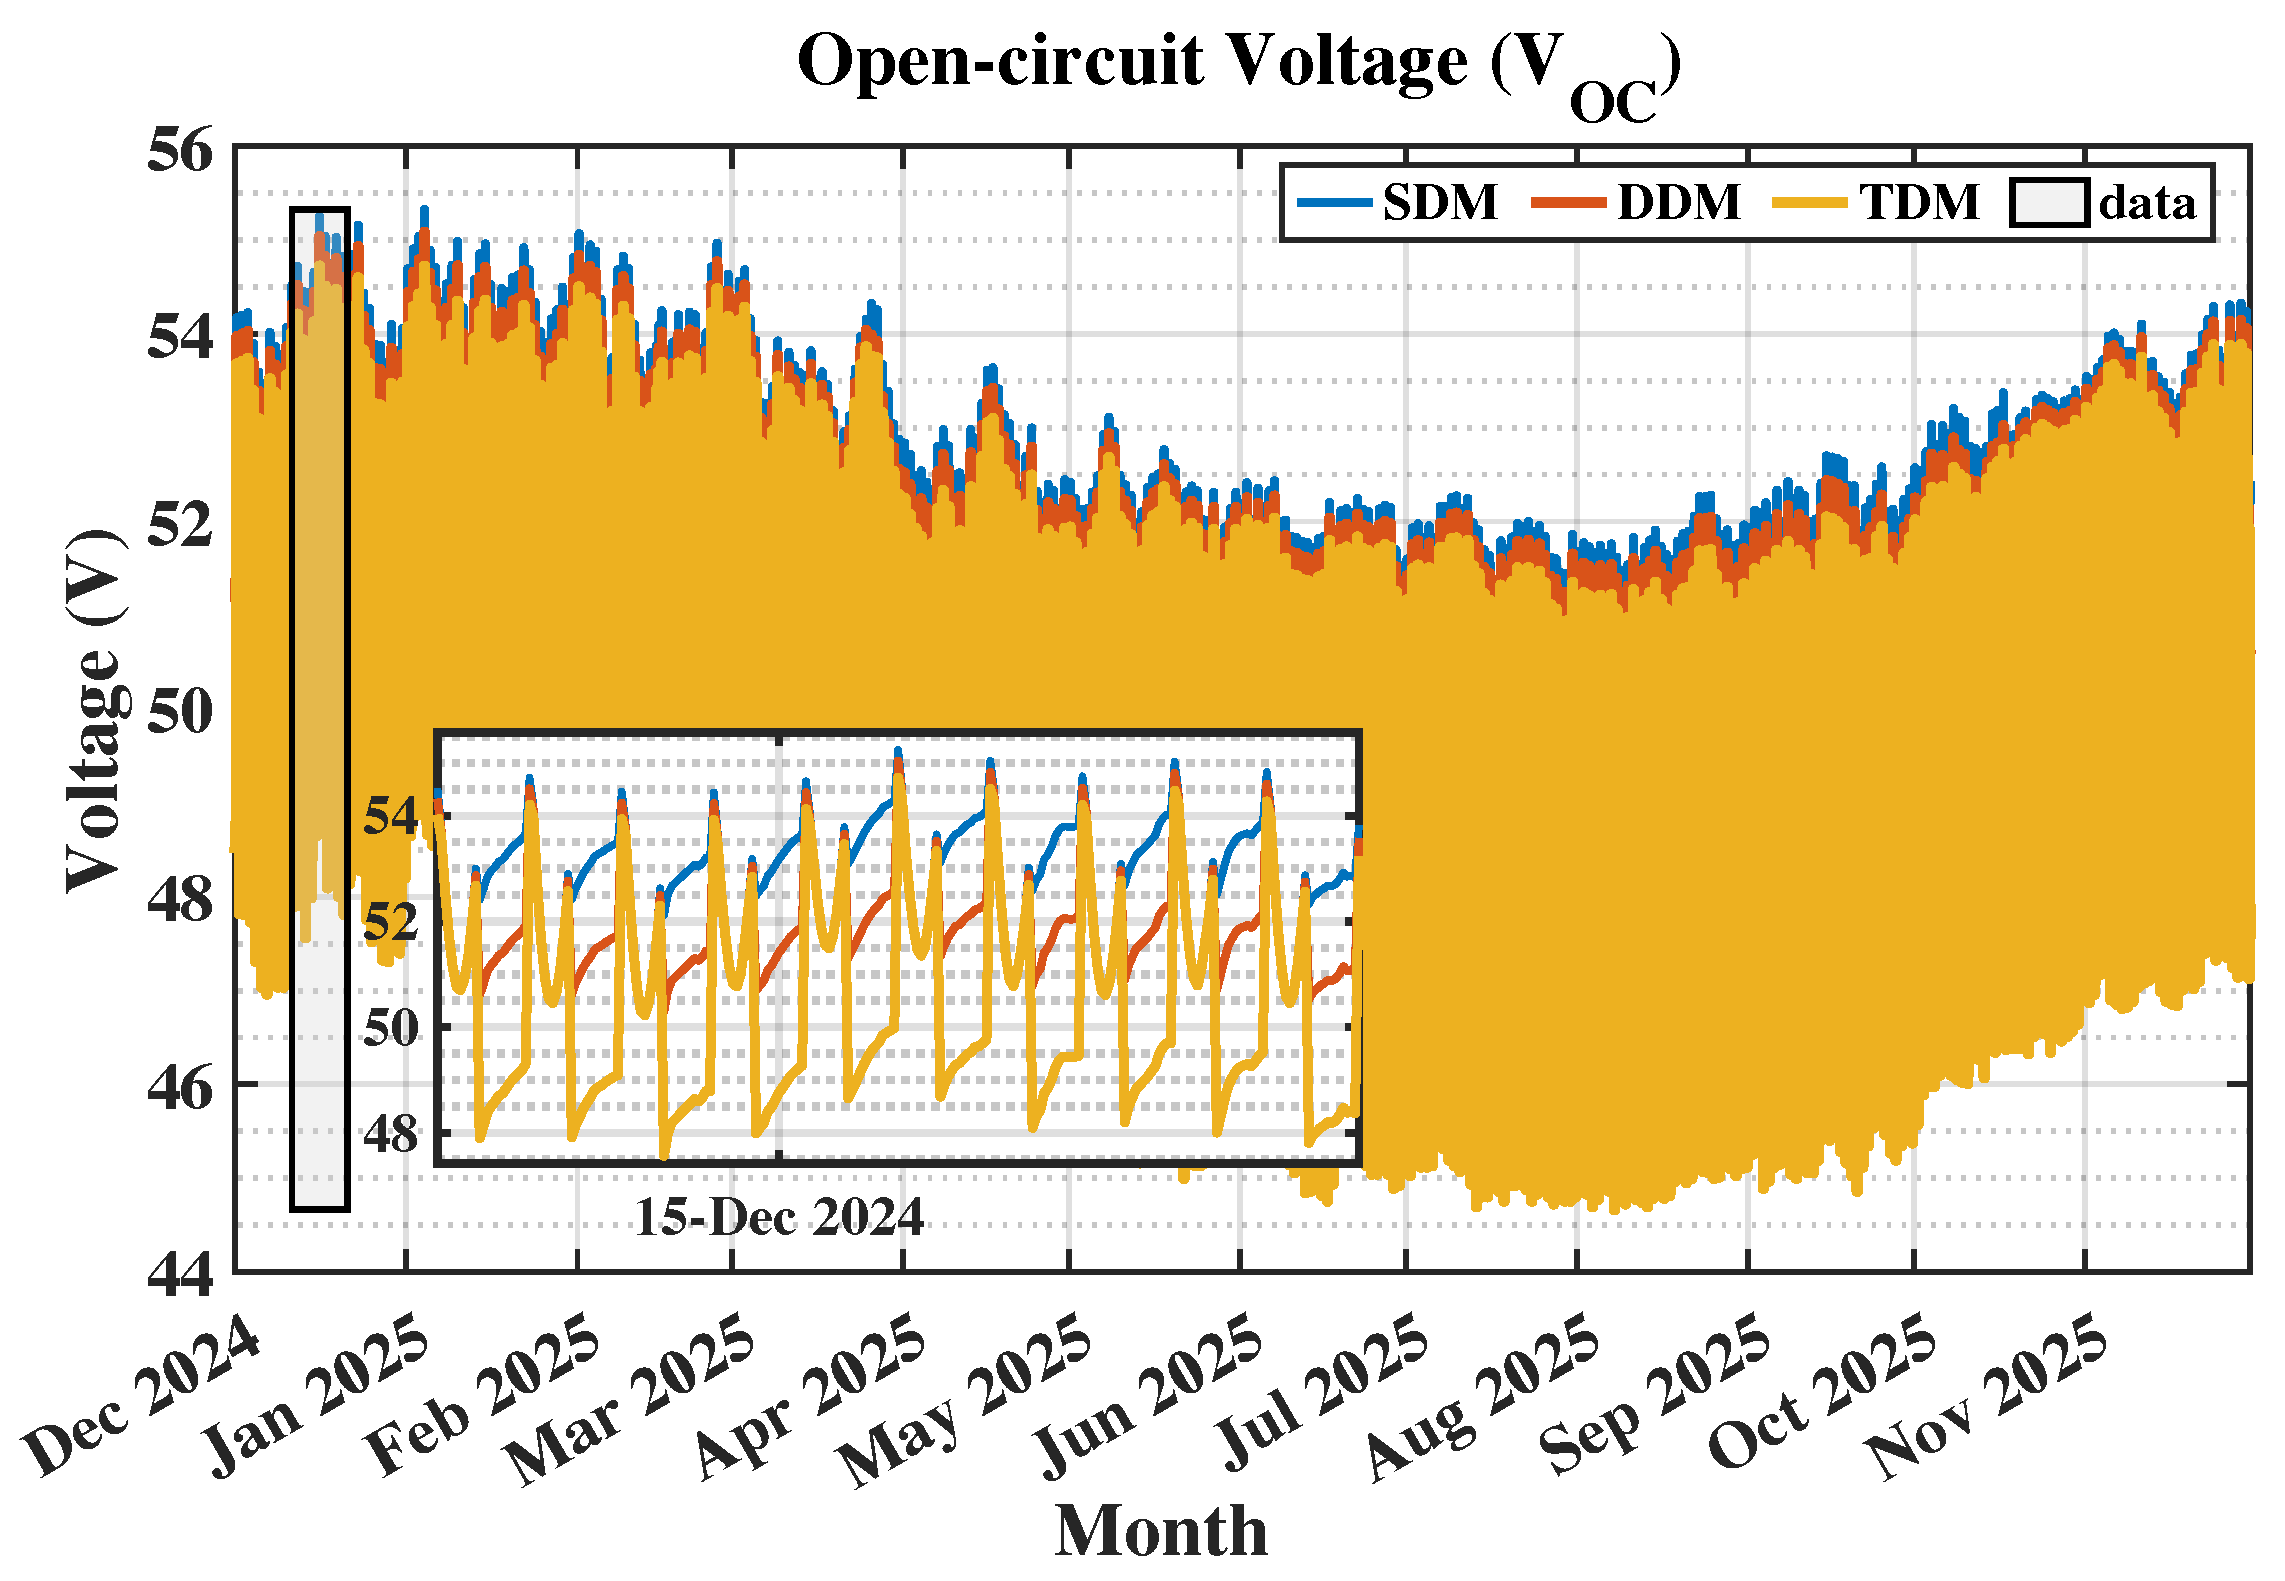
The open-circuit voltage ( V o c ) of a solar module is the peak voltage produced when no current flows. In photovoltaic models, V o c can be derived from the current–voltage equation, Equation (5), by setting the current to zero, highlighting its dependence on module temperature and solar irradiance. As temperature increases, the open-circuit voltage decreases due to the semiconductor properties. Additionally, variations in solar irradiance affect the open-circuit voltage through the light-generated current, following a logarithmic relationship as suggested by the diode equation [24]. This comprehension is crucial for precise photovoltaic performance modeling, according to Figure 7.
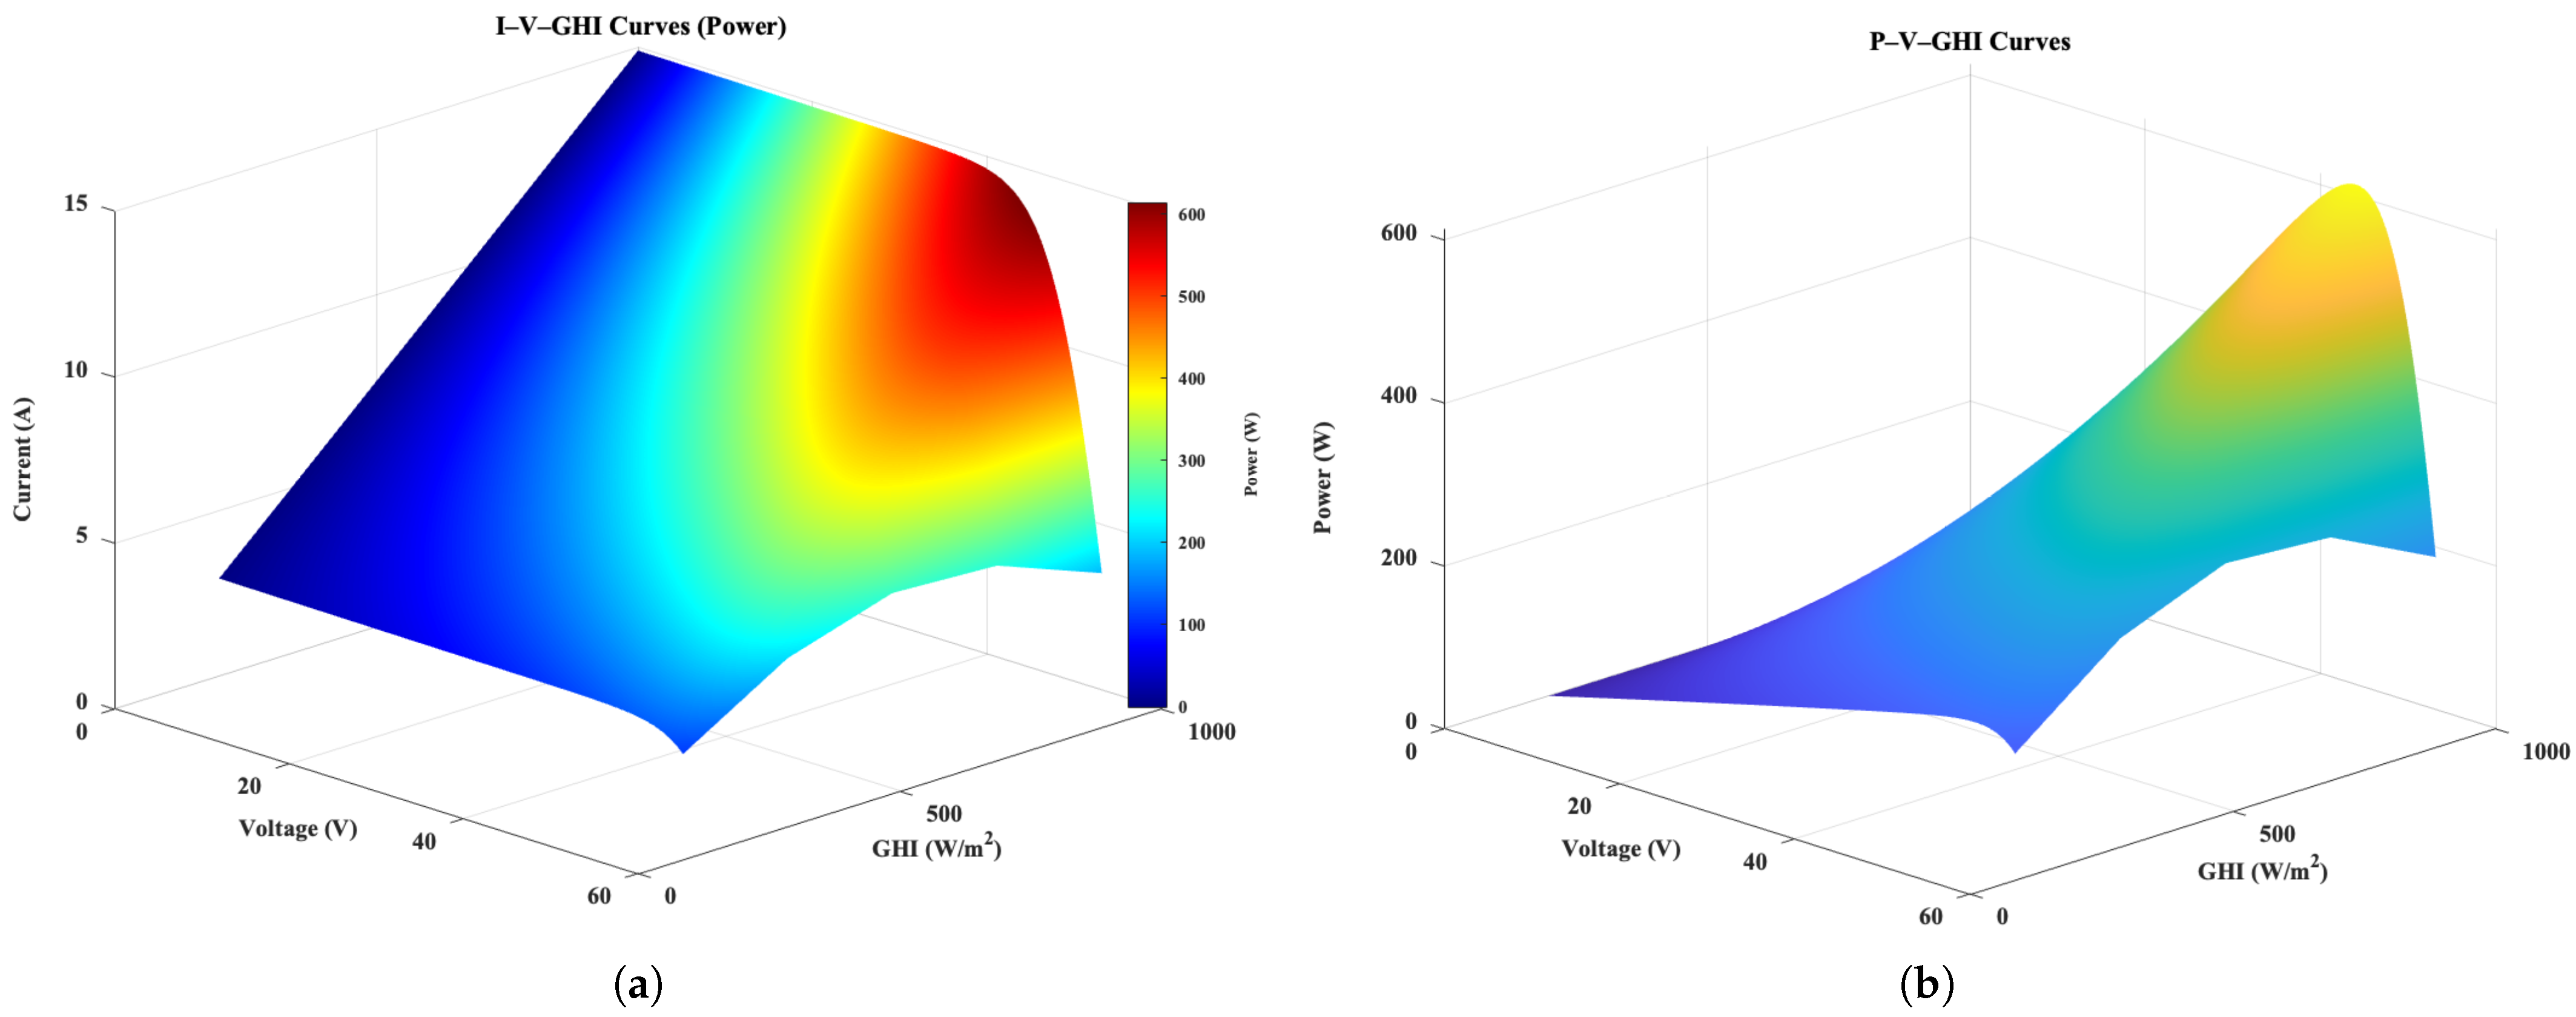
Figure 8 depicts the impact of global horizontal irradiance (GHI) on a solar system via current–voltage (I–V) and power–voltage (P–V) characteristics. The left figure illustrates that output current grows linearly with GHI at lower voltages, but open-circuit voltage has a lesser connection. The color distribution signifies power levels, emphasizing a notable escalation in high-power regions with increasing irradiance. The right graphic displays P–V surfaces, indicating that power output markedly escalates with GHI, with the maximum power point (MPP) transitioning to higher voltage as irradiance increases.
Figure 9 illustrates the three-dimensional I–V (a) and P–V (b) features of the double-diode model (DDM) at varying levels of global horizontal irradiance (GHI). The findings demonstrate that the output current and power markedly rise with elevated irradiance, although the open-circuit voltage exhibits reduced sensitivity to GHI. The displacement of the maximum power point toward higher voltage levels underscores DDM’s proficiency in precisely capturing irradiance-dependent photovoltaic performance.
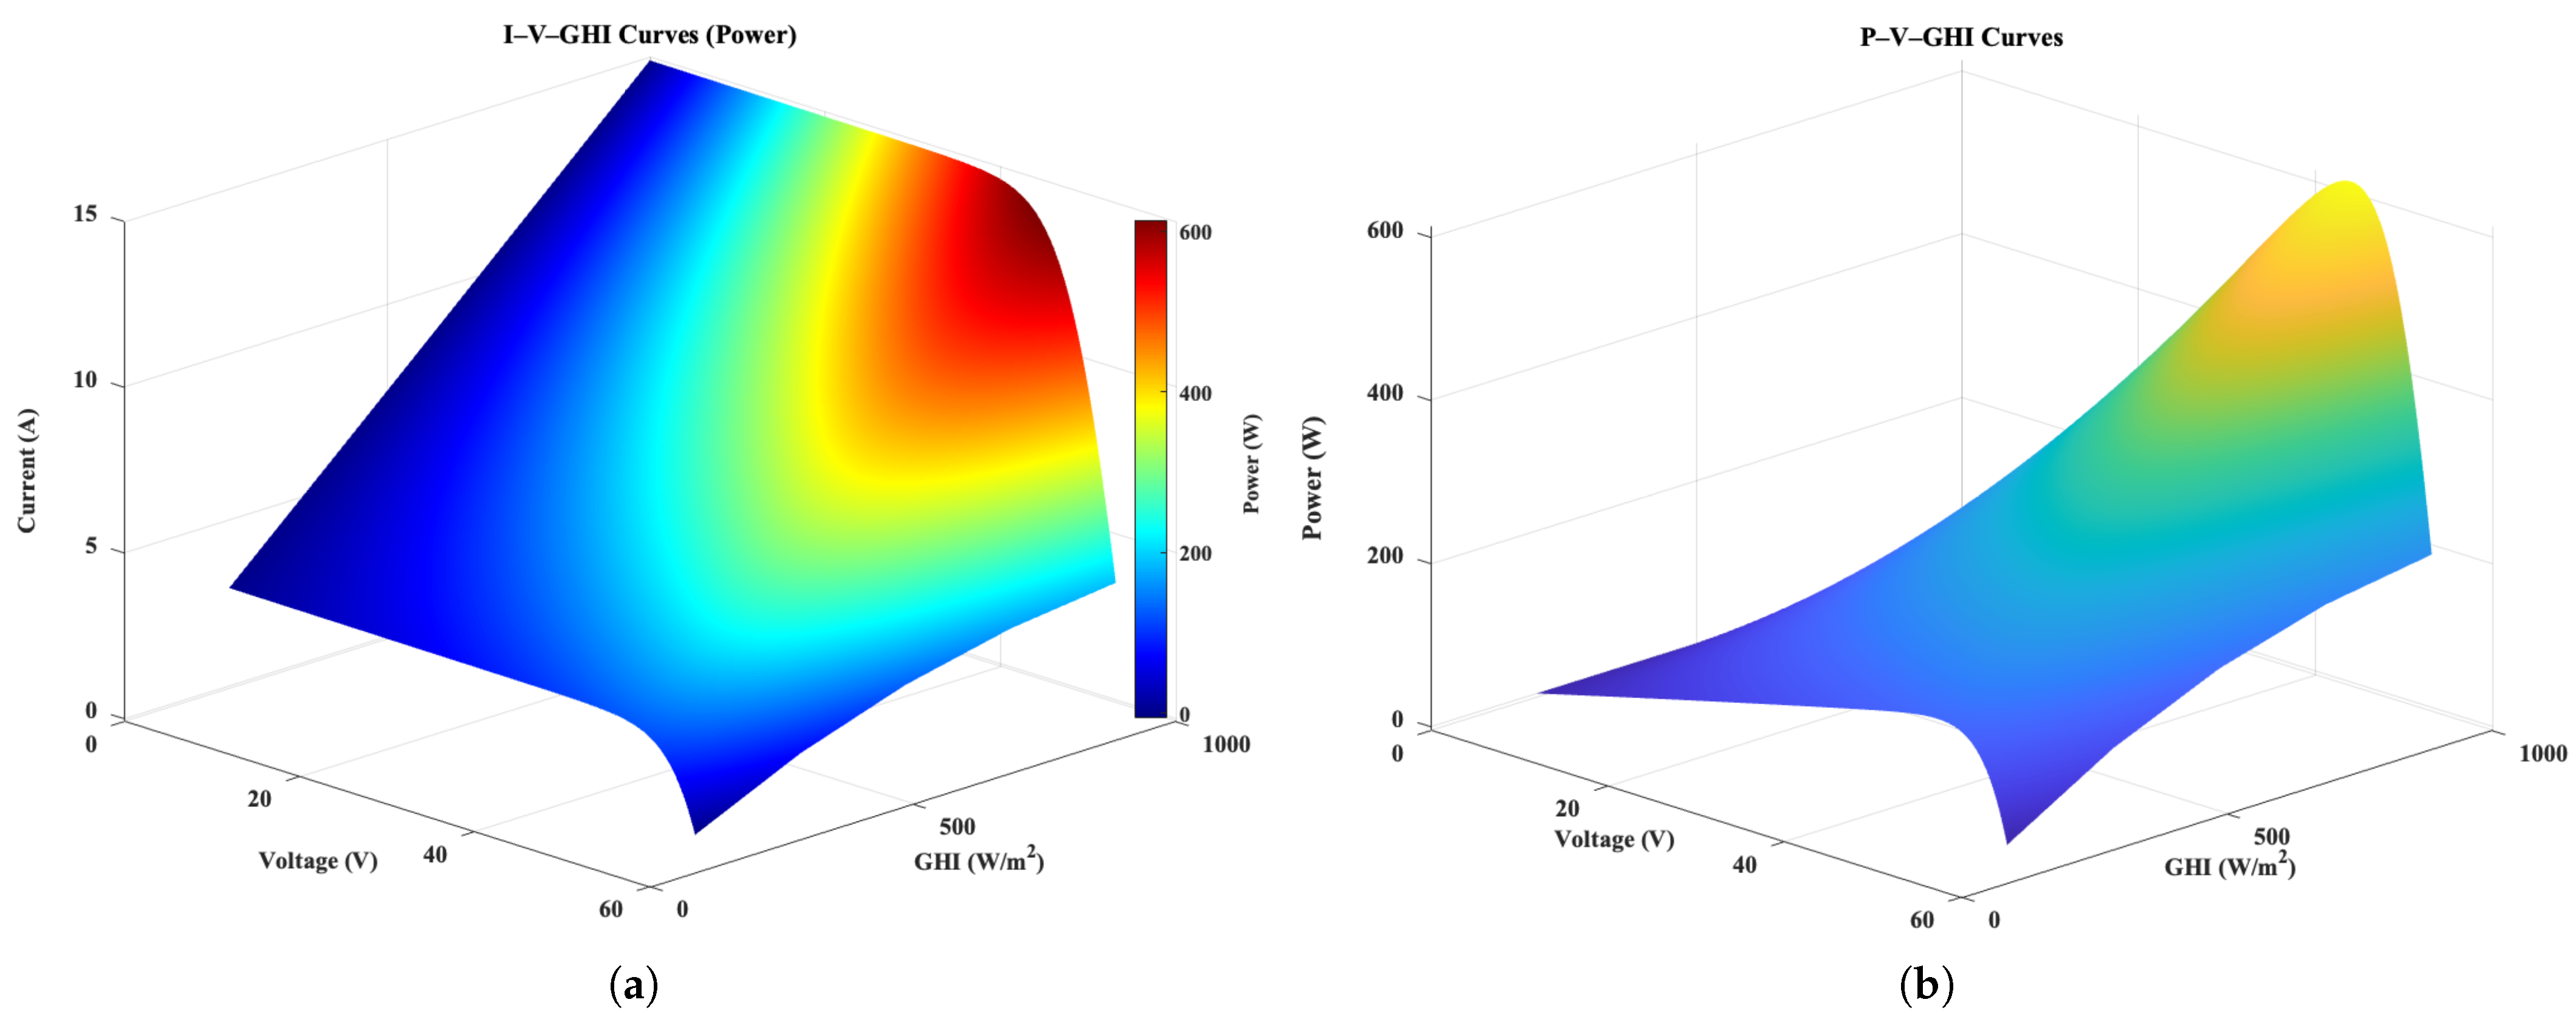
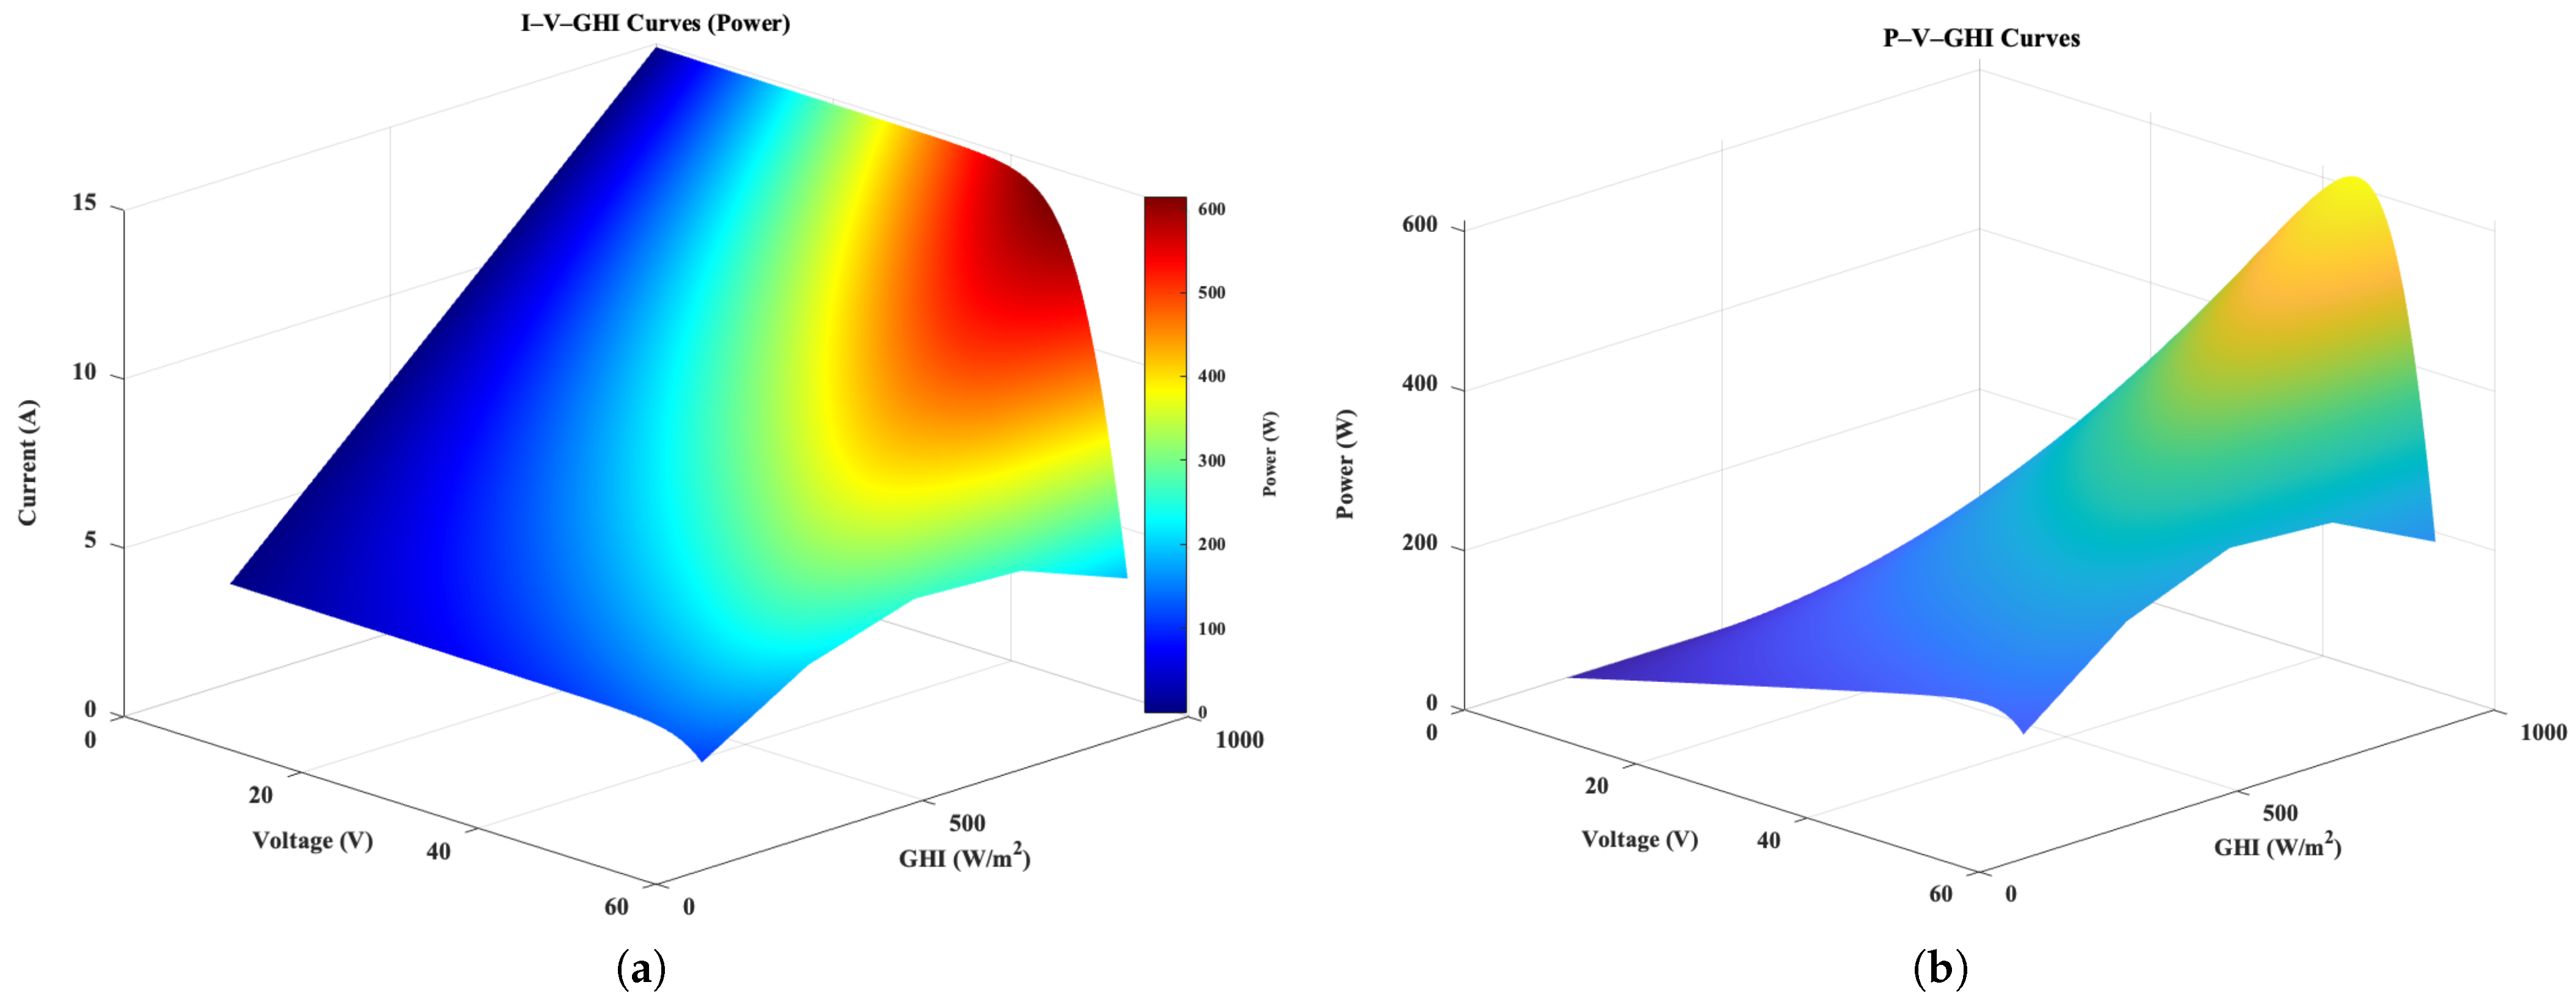
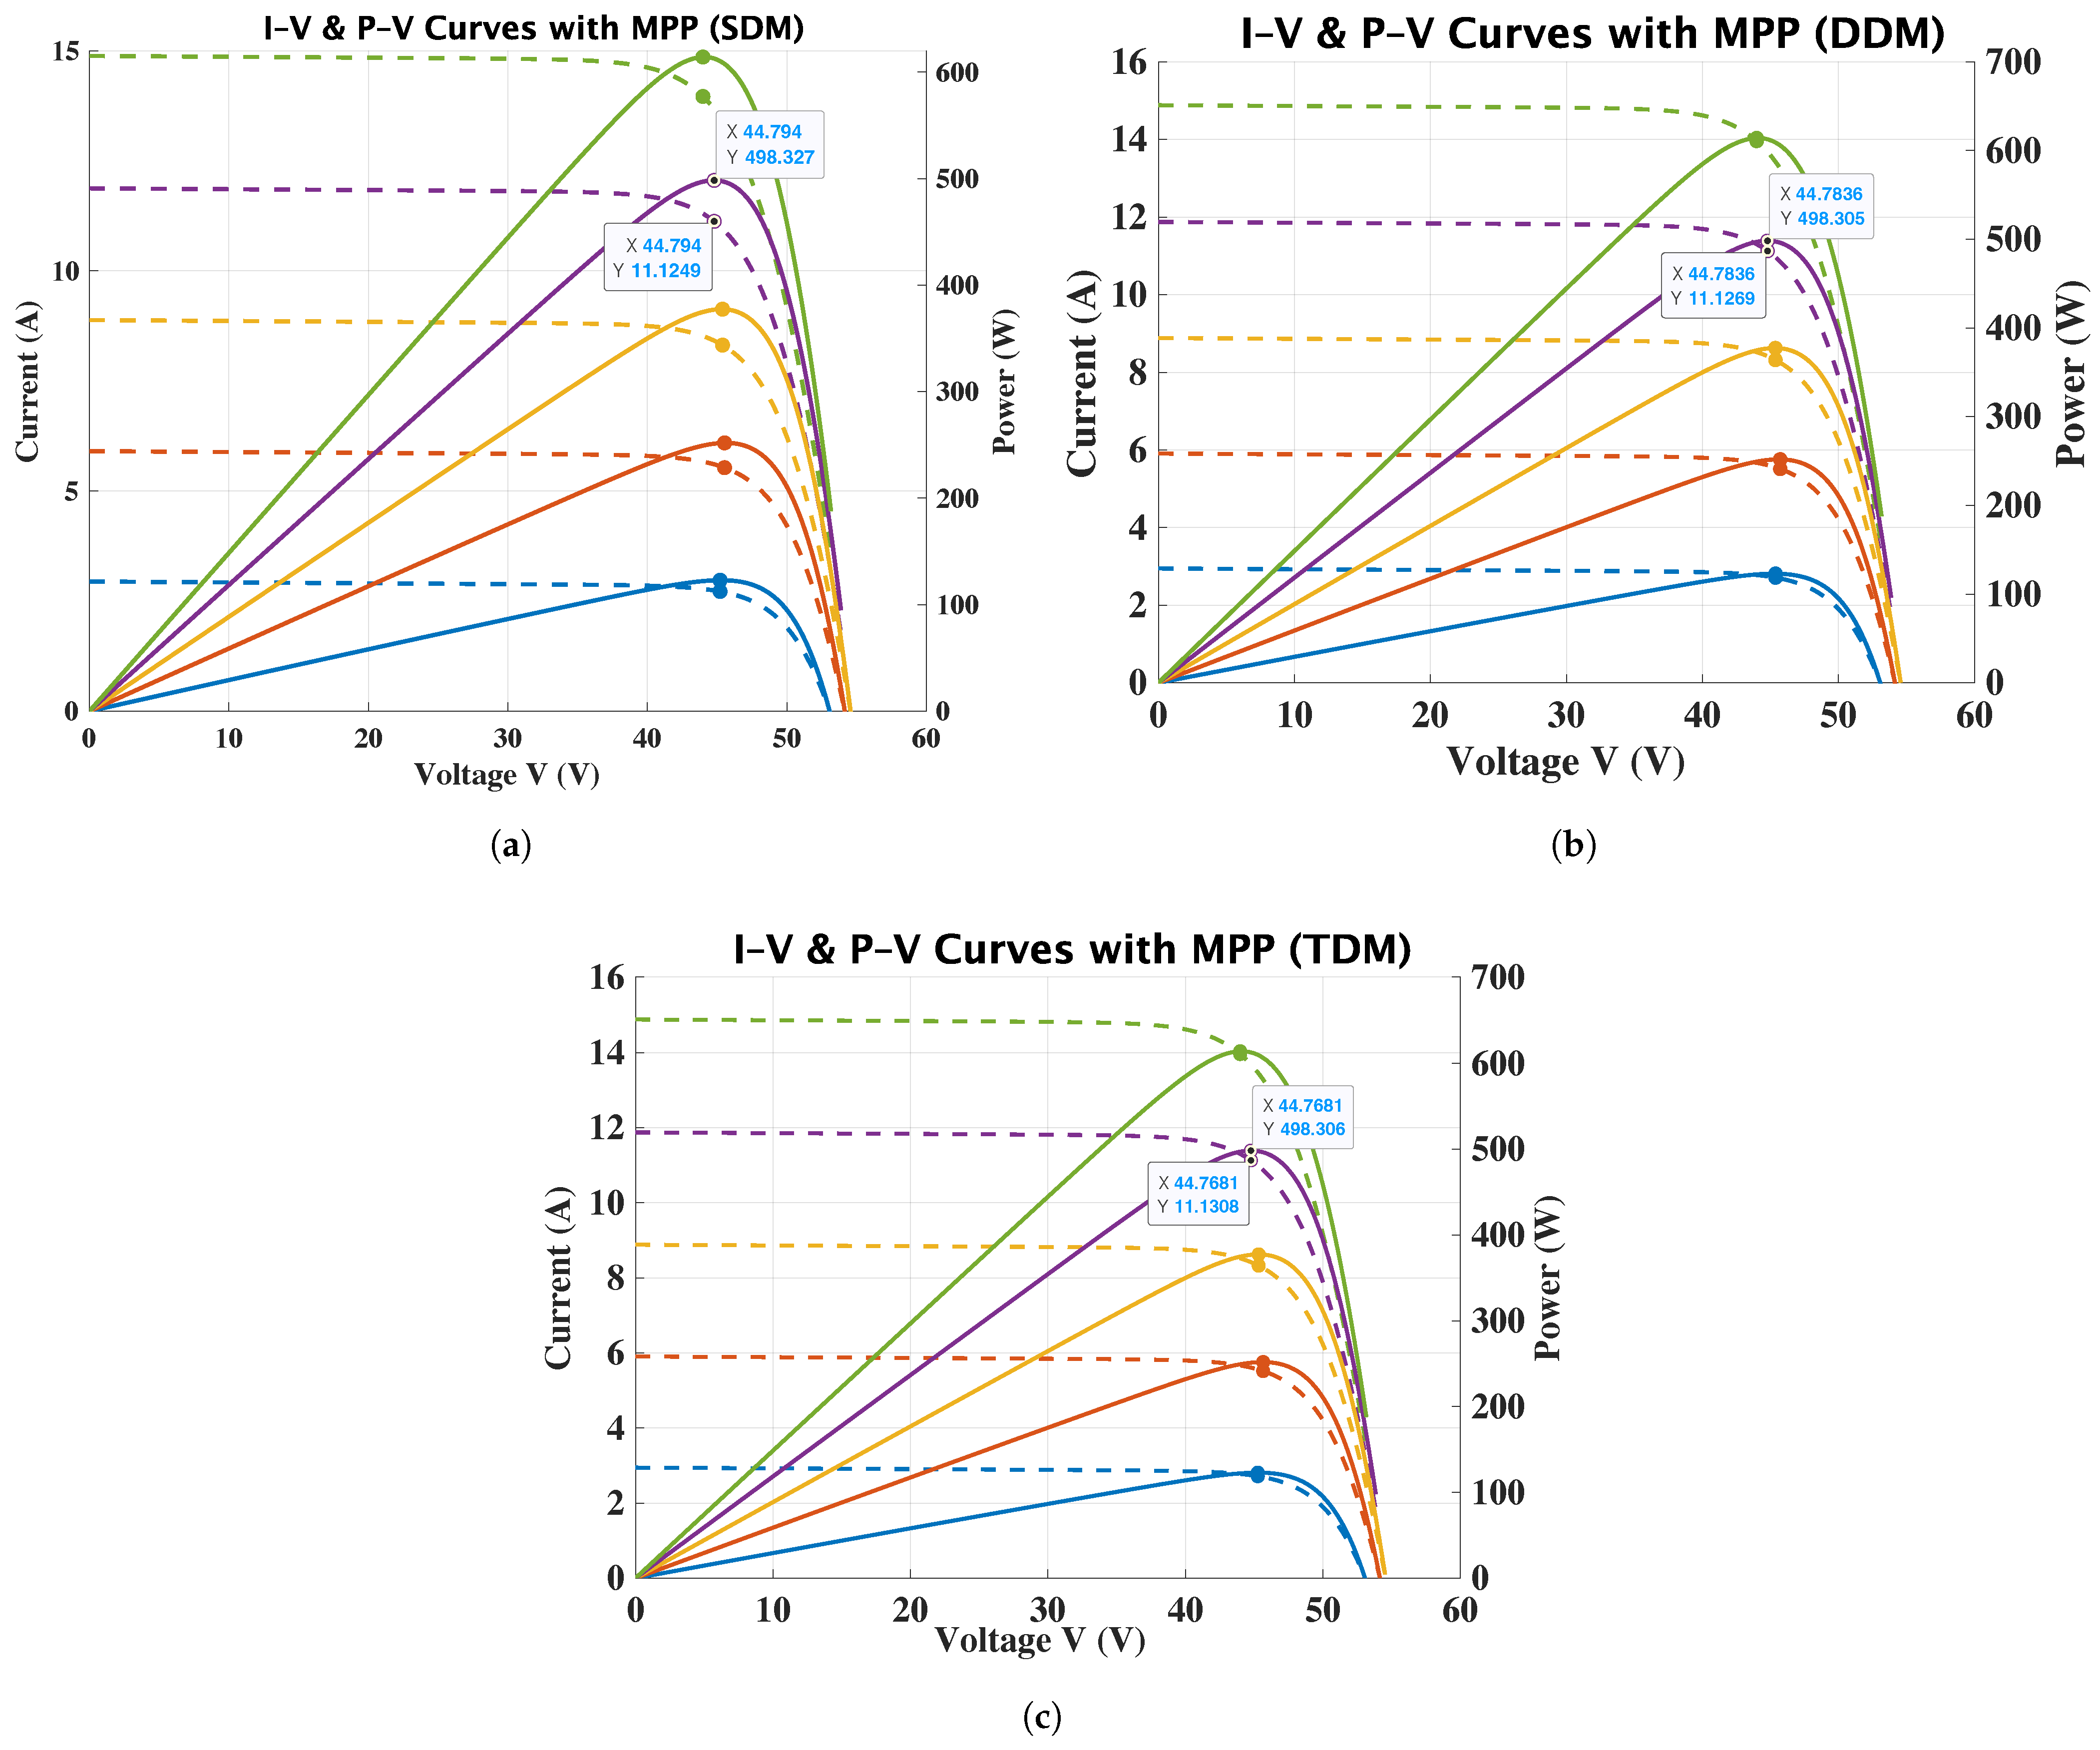
The I–V surfaces demonstrate that the output current grows practically linearly with increasing irradiance, although the open-circuit voltage has a much weaker relationship. The P–V characteristics show a significant rise in output power and a noticeable shift in the maximum power point to higher voltage values as irradiance increases. These findings demonstrate that the TDM improves accuracy in detecting recombination-related losses and irradiance-dependent behavior, especially in the low-voltage and knee areas of solar operation, as shown in Figure 10. This tendency is also corroborated by the monthly and yearly energy data shown in Table 6. Throughout the year, the total anticipated energy diminished from 1,360,403 W (SDM) to 1,360,321 W (DDM) and 1,360,312 W (TDM), resulting in a maximum relative difference of under 0.01% between the most basic and the most intricate models. The minor but regular discrepancies suggest that the SDM somewhat overestimates the available power, while the DDM, and particularly the TDM, account for additional loss processes with greater physical accuracy. The discrepancies, however minor in yearly totals, become significantly pertinent under high-resolution temporal analysis and non-linear operating situations, such as partial irradiance and increased temperatures. Figure 11 juxtaposes the I–V and P–V features against the equivalent MPP as forecasted by the SDM, DDM, and TDM. Although all the models have similar curve shapes and maximum power point positions, the SDM somewhat overestimates the peak power, whereas the DDM and TDM provide more nuanced and physically accurate forecasts owing to their enhanced depiction of recombination losses. It is important to acknowledge that, although the voltage axis remains consistent across the SDM, DDM, and TDM plots in Figure 11, minor discrepancies in the current axis limits are deliberately maintained to illustrate the intrinsic variations in current magnitude and recombination-loss representation among the three PV models. The findings indicate that although the SDM provides computational simplicity, the DDM and TDM are better suitable for precise energy yield evaluation and sophisticated applications such as hybrid PV–H2 energy systems.
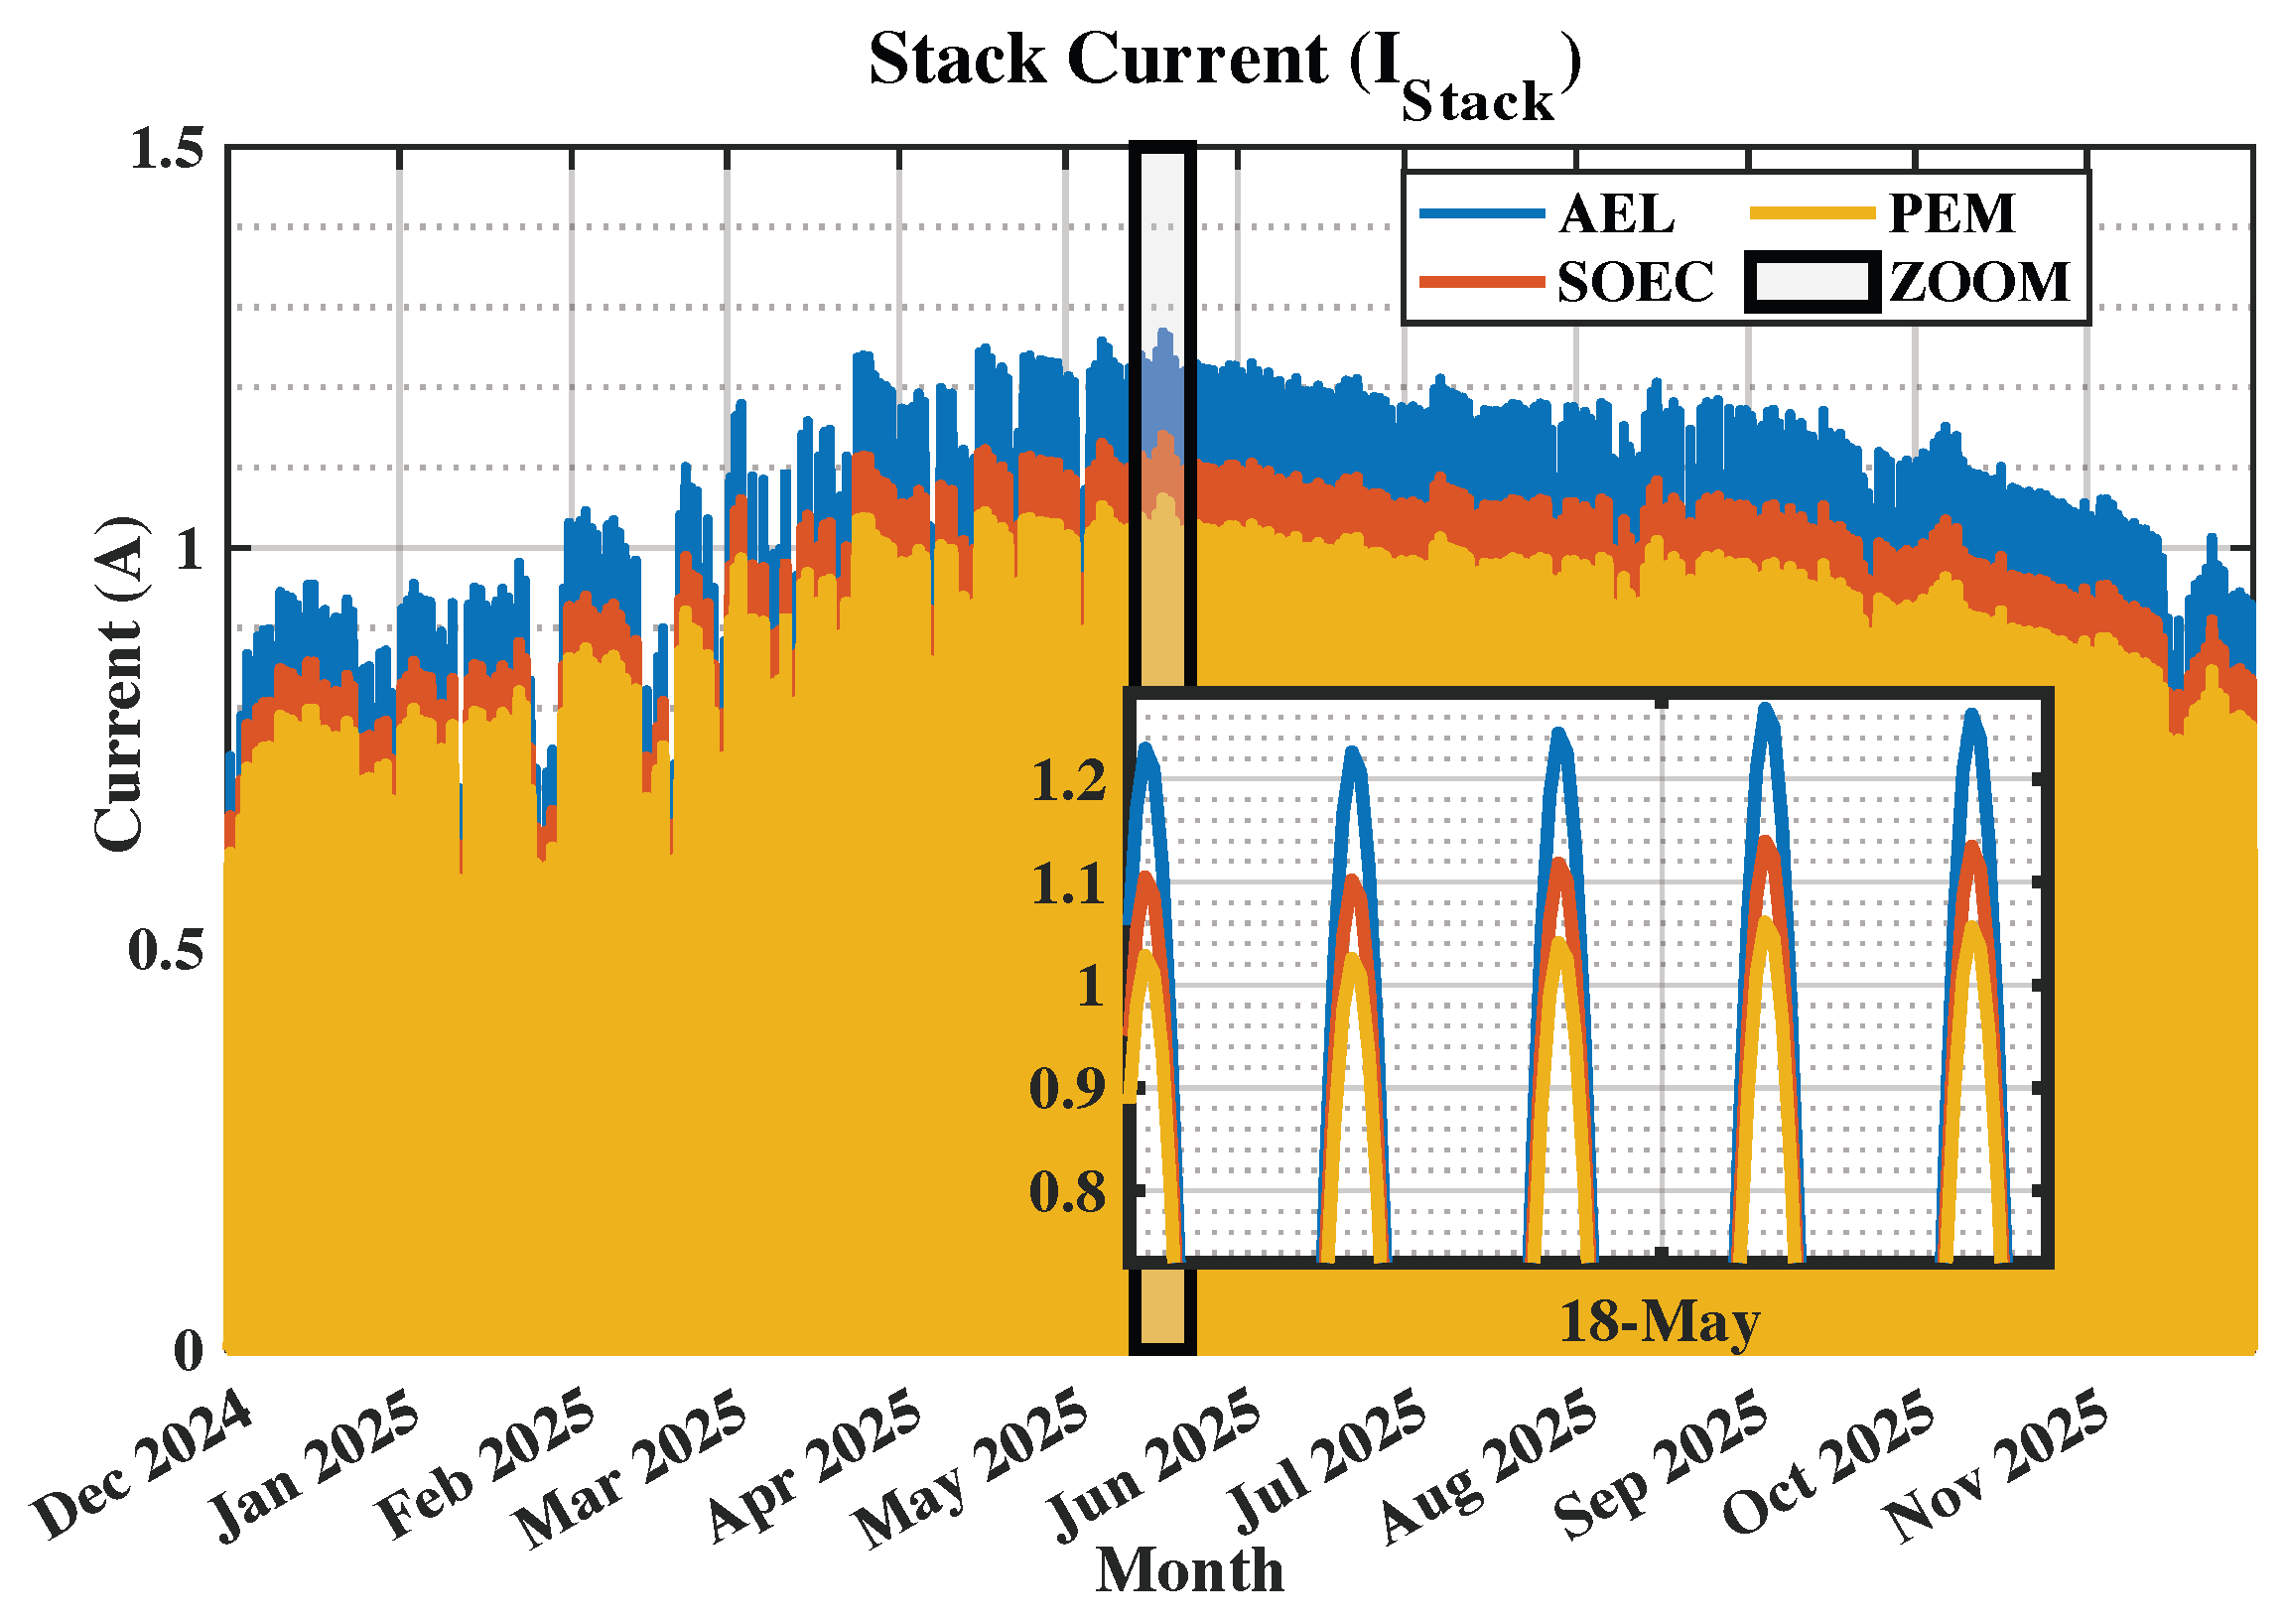
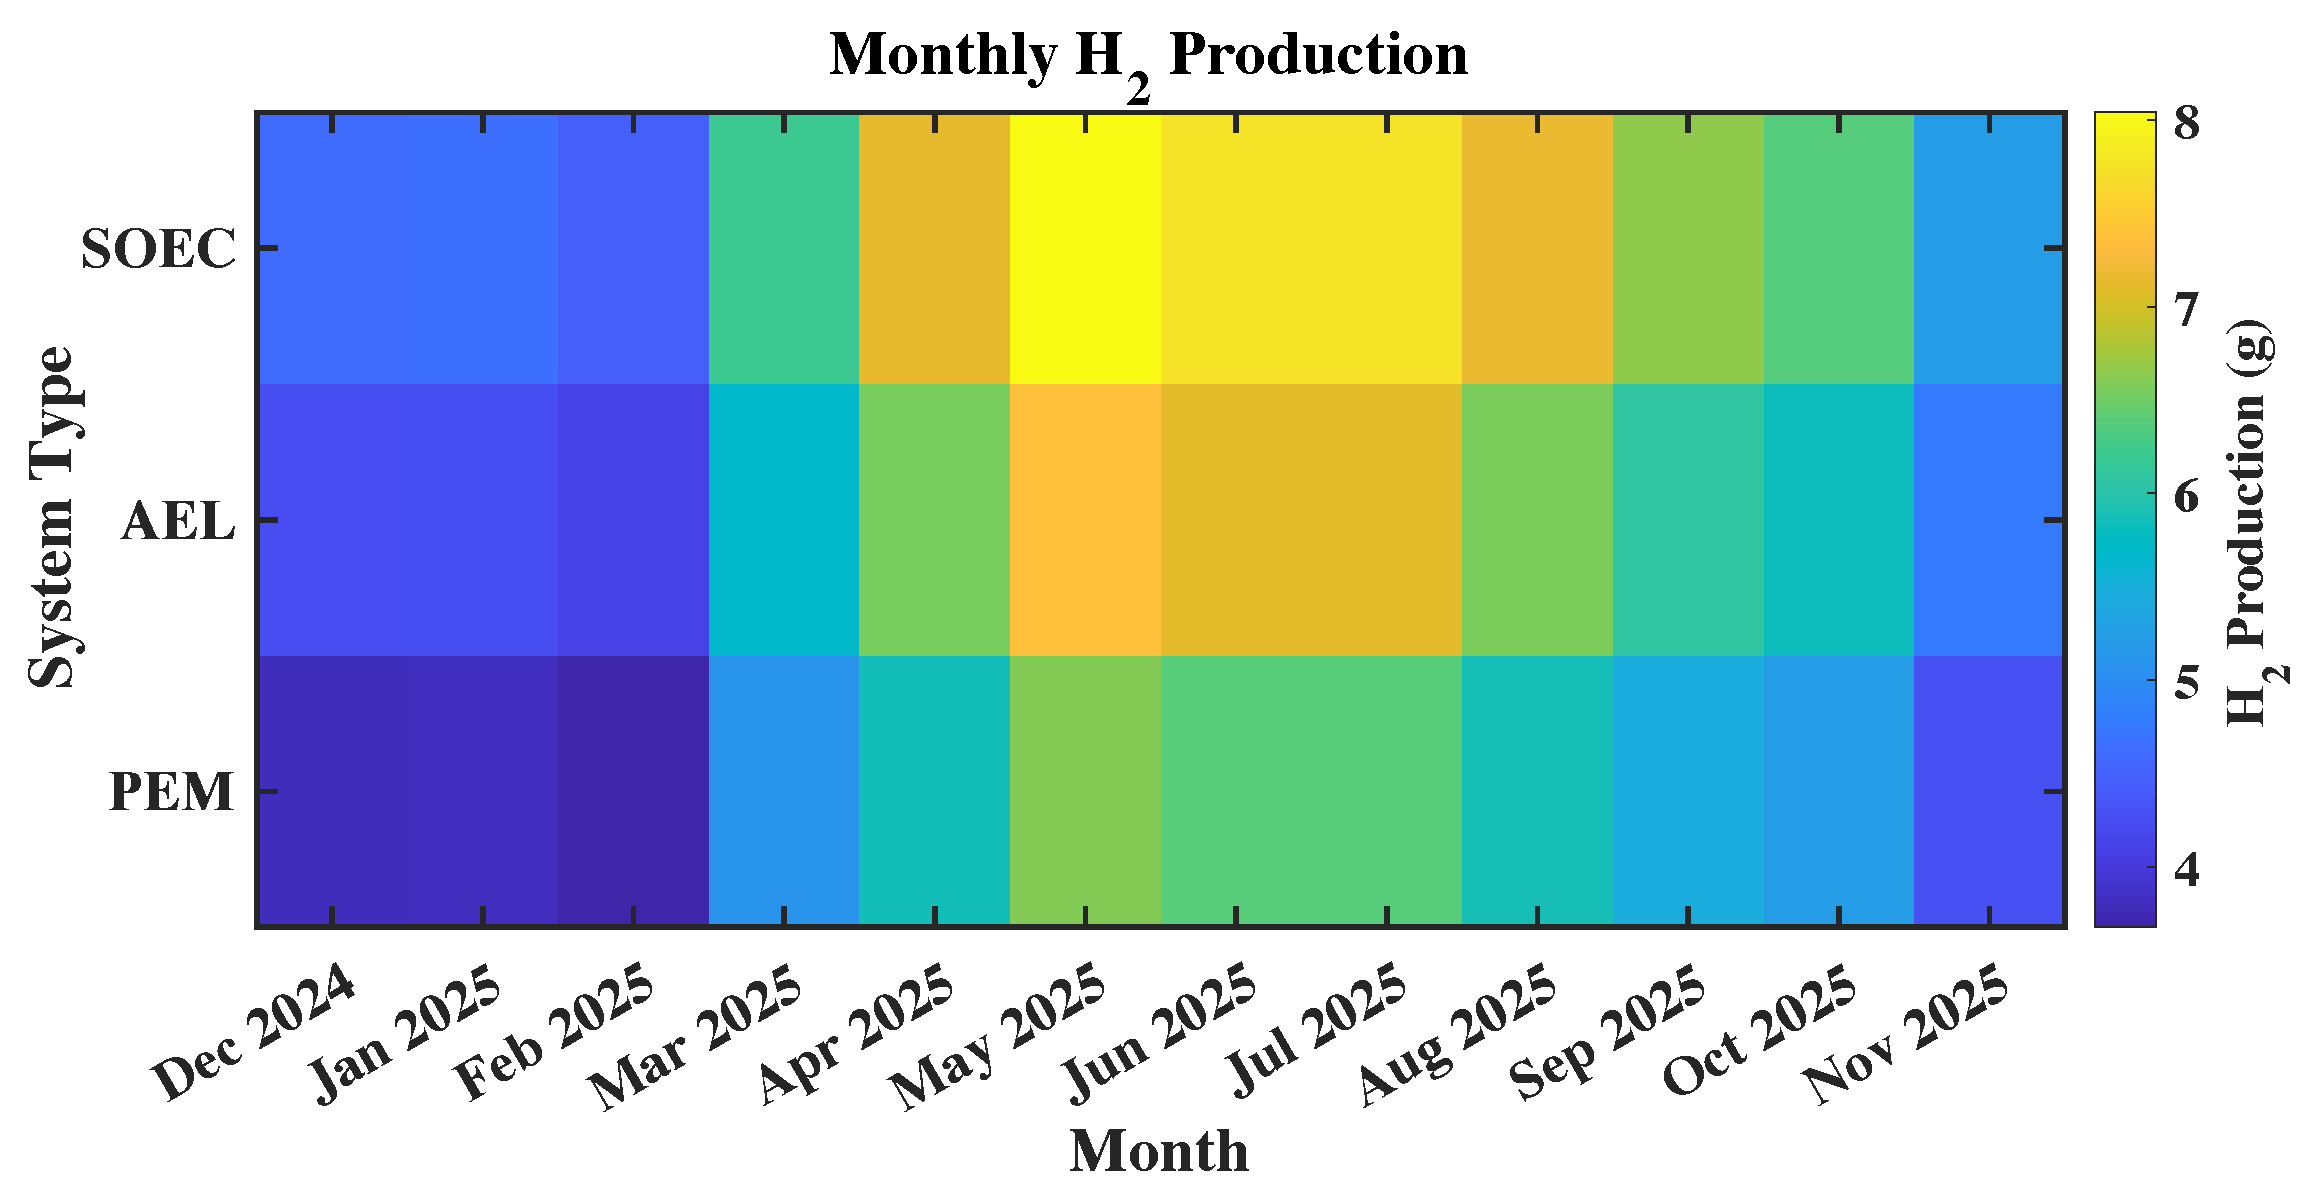
Table 7, Table 8 and Table 9 provide a complete comparison of hydrogen generation and water consumption for SDM–electrolysis setups with PEM, alkaline (AEL), and solid oxide (SOEC) electrolyzers. As seen in Table 7, Table 8 and Table 9, the monthly hydrogen output closely correlates with available power, with greater production in the spring and summer months correlating to increasing solar generation. On a yearly basis, the SDM–SOEC setup produced 76.05 g of hydrogen, which is roughly 21.8% more than SDM–PEM (62.47 g) and 9.1% more than SDM–AEL (69.71 g), demonstrating SOEC technology’s better efficiency. This performance trend is further highlighted in Figure 12, where the stack current profiles show that SOEC had continuously higher operating currents under identical power input, especially during peak irradiance times. Figure 13 supports these results by displaying the seasonal fluctuation in hydrogen generation, with maximum output recorded between April and August for all electrolyzer types, with the SOEC system producing the most. Overall, the findings show that, although all the configurations benefit from higher PV energy availability, the SOEC-based system has a significant quantitative advantage in hydrogen generation when compared to PEM and AEL technologies.
A comparative analysis of the SDM, DDM, and TDM-based PV–electrolysis systems indicates that all three modeling methodologies yielded identical seasonal hydrogen production patterns, with peak outputs occurring from April to August due to increased solar energy availability. The quantitative variations among the three PV models were quite minor but systematic. Annually, the SDM framework somewhat overestimated hydrogen generation in comparison to more intricate models, exhibiting variations of around 0.01–0.02% relative to DDM and 0.02–0.03% relative to TDM, contingent upon the kind of electrolyzer used. In the SOEC design, the annual hydrogen output diminished slightly from 76.05 g (SDM) to 76.05 g (DDM) and 76.04 g (TDM), with comparable modest reductions seen in the AEL and PEM systems. These minor discrepancies indicate the gradual incorporation of recombination and non-ideal loss processes in the transition from SDM to DDM and TDM. Notwithstanding these disparities, the hierarchy of electrolyzer technologies stayed stable across all the PV models, with SOEC consistently surpassing AEL and PEM. In summary, whereas SDM yields optimistic predictions, the DDM and TDM provide superior physical realism and robustness, with TDM serving as the most thorough modeling framework for high-fidelity evaluation of PV-driven hydrogen generation systems.

4. Conclusions and Future Work

This research introduced a cohesive modeling framework for solar-driven green H2 generation by merging photovoltaic electrical models of differing fidelity (SDM, DDM, and TDM) with several electrolyzer technologies (PEM, AEL, and SOEC). The investigation revealed that a precise depiction of PV temperature, photocurrent generation, and voltage characteristics is crucial for a dependable downstream H2P estimate. Despite the numerically minor changes in yearly energy production across SDM, DDM, and TDM, the more sophisticated models consistently delivered superior physical realism by accurately representing recombination and non-ideal loss processes, with TDM exhibiting the greatest modeling robustness. The comparative examination of electrolyzers has shown that SOEC systems much exceed PEM and AEL technologies in H2P efficiency, with an annual hydrogen output that is up to 21.8% more under the same electrical power input. The results indicate that the selection of electrolyzers significantly influences H2P more than the choice of PV models, but that sophisticated PV modeling is essential for precise system assessment. The suggested framework enhances the mathematical, physical, and practical aspects of the state of the art, establishing a robust basis for future techno-economic optimization and large-scale implementation of PV–H2 energy systems.
Future research will enhance the proposed framework by integrating dynamic and degradation-aware models for PV modules and electrolyzers, including temperature-dependent aging, load-following behavior, and part-load efficiency fluctuations. The use of high-resolution transient simulations (sub-hourly or minute-scale) and sophisticated thermal-electrical coupling would enhance the depiction of actual operating conditions, especially for SOEC systems functioning at extreme temperatures. The current research deliberately excludes long-term H2 storage and cross-period energy balancing, therefore clarifying the scope and application of the reported conclusions. Within this approach, solar power is transformed to H2 hourly without intermediate storage, hence limiting system dynamics and yearly production metrics to direct PV–electrolyzer coupling. This assumption facilitates a concentrated evaluation of PV model accuracy and electrolyzer attributes, although it fails to account for multi-timescale storage effects that might substantially affect long-term system dynamics. Recent research, including the multi-timescale H2 storage systems in [34], shows how daily and seasonal storage interactions impact overall energy equilibrium and H2 use. Consequently, the reader should comprehend the implications about the influence of PV modeling accuracy and electrolyzer type on systems with limited H2 storage capacity. Further investigation is required to ascertain the validity of these results when multi-timescale storage and cross-period borders are included. Moreover, future research will integrate the current energy-based framework into an extensive techno-economic and life-cycle evaluation to analyze capital expenditures, water use, carbon emissions, and system dependability at the utility scale. The integration of H2 storage, compression, and H2-to-power conversion units would provide closed-loop PV–H2–power studies, hence enhancing optimum system size and control techniques for extensive deployment in high-irradiance areas like Saudi Arabia.

Author Contributions

Conceptualization, A.A. (Abdullah Alrasheedi), M.M. and A.A. (Abdullah Abusorrah); methodology, A.A. (Abdullah Alrasheedi); software, A.A. (Abdullah Alrasheedi); validation, A.A. (Abdullah Alrasheedi) and M.M.; formal analysis, A.A. (Abdullah Alrasheedi); investigation, A.A. (Abdullah Alrasheedi); resources, A.A. (Abdullah Alrasheedi), M.M. and A.A. (Abdullah Abusorrah); data curation, A.A. (Abdullah Alrasheedi); writing—original draft preparation, A.A. (Abdullah Alrasheedi); writing—review and editing, M.M.; visualization, M.M. and A.A. (Abdullah Alrasheedi); supervision, M.M. and A.A. (Abdullah Abusorrah). All authors have read and agreed to the published version of the manuscript.

Funding

The project was funded by the KAU Endowment (WAQF) at King Abdulaziz University, Jeddah, Saudi Arabia.

Data Availability Statement

The original contributions presented in the study are included in the article, further inquiries can be directed to the corresponding author.

Acknowledgments

The authors acknowledge with thanks WAQF and the Deanship of Scientific Research (DSR) at King Abdulaziz University, Jeddah, Saudi Arabia, for technical and financial support.

Conflicts of Interest

The authors declare no conflicts of interest.

Abbreviations

AELalkaline electrolysis
DDMdouble-diode model
GHIglobal horizontal irradiance
H2hydrogen
H2Phydrogen production
I D diode saturation current
I p v photocurrent
MPPmaximum power point
NOCTnominal operating cell temperature
PEMproton exchange membrane electrolysis
PVphotovoltaic
R s series resistance
R s h shunt resistance
SDMsingle-diode model
SOECsolid oxide electrolysis cell
STCstandard test conditions
T a ambient temperature
T m module temperature
TDMtriple-diode model
V o c open-circuit voltage
V t h thermal voltage
η EL electrolyzer efficiency
HHVhigher heating value
LHVlower heating value

References

  1. Humada, A.M.; Darweesh, S.Y.; Mohammed, K.G.; Kamil, M.; Mohammed, S.F.; Kasim, N.K.; Tahseen, T.A.; Awad, O.I.; Mekhilef, S. Modeling of PV system and parameter extraction based on experimental data: Review and investigation. Sol. Energy 2020, 199, 742–760. [Google Scholar] [CrossRef] [Scilit]
  2. Santos, L.D.O.; De Carvalho, P.C.M.; Filho, C.D.O.C. Photovoltaic Cell Operating Temperature Models: A Review of Correlations and Parameters. IEEE J. Photovoltaics 2022, 12, 179–190. [Google Scholar] [CrossRef] [Scilit]
  3. Calasan, M.; Aleem, S.H.E.A.; Zobaa, A.F. A new approach for parameters estimation of double and triple diode models of photovoltaic cells based on iterative Lambert W function. Sol. Energy 2021, 218, 392–412. [Google Scholar] [CrossRef] [Scilit]
  4. Almansuri, M.A.K.; Yusupov, Z.; Rahebi, J.; Ghadami, R. Parameter Estimation of PV Solar Cells and Modules Using Deep Learning-Based White Shark Optimizer Algorithm. Symmetry 2025, 17, 533. [Google Scholar] [CrossRef] [Scilit]
  5. El-Dabah, M.A.; El-Sehiemy, R.A.; Hasanien, H.M.; Saad, B. Photovoltaic model parameters identification using Northern Goshawk Optimization algorithm. Energy 2023, 262, 125522. [Google Scholar] [CrossRef] [Scilit]
  6. Fathi, H.; Alsekait, D.M.; Al Tawil, A.; Kamal, I.W.; Aloun, M.S.; Manhrawy, I.I.M. Enhancing Sustainability in Renewable Energy: Comparative Analysis of Optimization Algorithms for Accurate PV Parameter Estimation. Sustainability 2025, 17, 2718. [Google Scholar] [CrossRef] [Scilit]
  7. Chermite, C.; Douiri, M.R. Differential evolution algorithm featuring novel mutation combined with Newton–Raphson method for enhanced photovoltaic parameter extraction. Energy Convers. Manag. 2025, 326, 119468. [Google Scholar] [CrossRef] [Scilit]
  8. Muñoz-Torres, D.F.; Montoya, O.D.; Hernández, J.C.; Gil-González, W.; Grisales-Noreña, L.F. Enhancing Solar Cell Performance: Atan-Sinc Optimization Algorithm for Precise Parameter Extraction in the Three-Diode Model. Appl. Syst. Innov. 2026, 9, 26. [Google Scholar] [CrossRef] [Scilit]
  9. Shiva Kumar, S.; Himabindu, V. Hydrogen production by PEM water electrolysis–A review. Mater. Sci. Energy Technol. 2019, 2, 442–454. [Google Scholar] [CrossRef] [Scilit]
  10. Shiva Kumar, S.; Lim, H. An overview of water electrolysis technologies for green hydrogen production. Energy Rep. 2022, 8, 13793–13813. [Google Scholar] [CrossRef] [Scilit]
  11. Foniok, K.; Drozdova, L.; Prokop, L.; Krupa, F.; Kedron, P.; Blazek, V. Mechanisms and Modelling of Effects on the Degradation Processes of a Proton Exchange Membrane (PEM) Fuel Cell: A Comprehensive Review. Energies 2025, 18, 2117. [Google Scholar] [CrossRef] [Scilit]
  12. Wang, C.R.; Stansberry, J.M.; Mukundan, R.; Chang, H.M.J.; Kulkarni, D.; Park, A.M.; Plymill, A.B.; Firas, N.M.; Liu, C.P.; Lang, J.T.; et al. Proton Exchange Membrane (PEM) Water Electrolysis: Cell-Level Considerations for Gigawatt-Scale Deployment. Chem. Rev. 2025, 125, 1257–1302. [Google Scholar] [CrossRef] [Scilit] [PubMed]
  13. Brauns, J.; Turek, T. Alkaline Water Electrolysis Powered by Renewable Energy: A Review. Processes 2020, 8, 248. [Google Scholar] [CrossRef] [Scilit]
  14. Tüysüz, H. Alkaline Water Electrolysis for Green Hydrogen Production. Acc. Chem. Res. 2024, 57, 558–567. [Google Scholar] [CrossRef] [Scilit] [PubMed]
  15. Nechache, A.; Hody, S. Alternative and innovative solid oxide electrolysis cell materials: A short review. Renew. Sustain. Energy Rev. 2021, 149, 111322. [Google Scholar] [CrossRef] [Scilit]
  16. Haidar, F.; Mrad, I.; Dam, Q.T. Modeling and simulation of integrated photovoltaic–alkaline electrolyzer system for sustainable hydrogen production. Eng. Perspect. 2024, 4, 60–68. [Google Scholar] [CrossRef] [Scilit]
  17. Bahri, H.; Harrag, A. PEM Fuel Cell Hydrogen Support Using PV–Electrolyzer Generation System. J. New Mater. Electrochem. Syst. 2021, 24, 55–65. [Google Scholar] [CrossRef] [Scilit]
  18. Ahaotu, M.C.; Ogbogu, C.E.; Thornburg, J.; Akwukwaegbu, I.O. Simulation of PEM Electrolyzer Power Management with Renewable Generation in Owerri, Nigeria. Energies 2025, 18, 208. [Google Scholar] [CrossRef] [Scilit]
  19. Pirouzfar, A.R.; Mishra, S.; Mirlekar, G.; Putta, K.R. Model Predictive Control for Integrated Photovoltaic (PV) and Electrolysers System. In Scandinavian Simulation Society; Linköping University Electronic Press: Linköping, Sweden, 2025; pp. 362–369. [Google Scholar] [CrossRef] [Scilit]
  20. Calderón, D.; Folgado, F.J.; González, I.; Calderón, A.J. Development and Real-World Implementation of a Digital Twin-Enhanced Supervisory System for RES-Green Hydrogen Microgrid. Energy Convers. Manag. 2026, 348, 120822. [Google Scholar] [CrossRef] [Scilit]
  21. Alrasheedi, A.; Marzband, M.; Abusorrah, A. Integrated Triple-Diode Modeling and Hydrogen Turbine Power for Green Hydrogen Production. Energies 2026, 19, 435. [Google Scholar] [CrossRef] [Scilit]
  22. Martín-Chivelet, N.; Polo, J.; Sanz-Saiz, C.; Núñez Benítez, L.T.; Alonso-Abella, M.; Cuenca, J. Assessment of PV Module Temperature Models for Building-Integrated Photovoltaics (BIPV). Sustainability 2022, 14, 1500. [Google Scholar] [CrossRef] [Scilit]
  23. Canadian Solar Inc. CS6.1-72TB TOPBiHiKu6 (590–620 W) Photovoltaic Module Datasheet; Version 1.7; CSI Solar Co., Ltd.: Suzhou, China, 2024; Available online: https://static.csisolar.com/wp-content/uploads/sites/9/2023/10/12111132/CS-Datasheet-TOPBiHiKu6-TOPCon_CS6.1-72TB_v1.5_EN.pdf (accessed on 4 November 2025).
  24. Gulkowski, S. Modeling and Experimental Studies of the Photovoltaic System Performance in Climate Conditions of Poland. Energies 2023, 16, 7017. [Google Scholar] [CrossRef] [Scilit]
  25. Anani, N.; Ibrahim, H. Adjusting the Single-Diode Model Parameters of a Photovoltaic Module with Irradiance and Temperature. Energies 2020, 13, 3226. [Google Scholar] [CrossRef] [Scilit]
  26. Abbassi, A.; Ben Mehrez, R.; Touaiti, B.; Abualigah, L.; Touti, E. Parameterization of Photovoltaic Solar Cell Double-Diode Model Based on Improved Arithmetic Optimization Algorithm. Optik 2022, 253, 168600. [Google Scholar] [CrossRef] [Scilit]
  27. Ramadan, A.; Kamel, S.; Taha, I.B.M.; Tostado-Véliz, M. Parameter Estimation of Modified Double-Diode and Triple-Diode Photovoltaic Models Based on Wild Horse Optimizer. Electronics 2021, 10, 2308. [Google Scholar] [CrossRef] [Scilit]
  28. Abdel-Basset, M.; Mohamed, R.; El-Fergany, A.; Abouhawwash, M.; Askar, S.S. Parameters Identification of PV Triple-Diode Model Using Improved Generalized Normal Distribution Algorithm. Mathematics 2021, 9, 995. [Google Scholar] [CrossRef] [Scilit]
  29. El-Shafie, M. Hydrogen Production by Water Electrolysis Technologies: A Review. Results Eng. 2023, 20, 101426. [Google Scholar] [CrossRef] [Scilit]
  30. Koponen, J.; Ruuskanen, V.; Hehemann, M.; Rauls, E.; Kosonen, A.; Ahola, J.; Stolten, D. Effect of Power Quality on the Design of Proton Exchange Membrane Water Electrolysis Systems. Appl. Energy 2020, 279, 115791. [Google Scholar] [CrossRef] [Scilit]
  31. Viinanen, T.; Ruuskanen, V.; Ahola, J.; Niemelä, M.; Küngas, R.; Sonnabend, P.; Vuorsalo, S.; Kauhanen, M.; Kauranen, P. Serial Connection of 48-Cell Alkaline Electrolysis Stacks. J. Power Sources 2025, 659, 238382. [Google Scholar] [CrossRef] [Scilit]
  32. Nel Hydrogen. Electrolysers Brochure, Rev. D; Nel Hydrogen: Oslo, Norway, 2021; Available online: https://nelhydrogen.com/resources/electrolysers-brochure/ (accessed on 1 December 2025).
  33. Ceres Power. Solid Oxide Electrolysis Stack Datasheet; Version 7; Ceres Power Ltd.: Horsham, UK, 2024; Available online: https://www.ceres.tech/media/f5wplhqd/soec-stack-product-datasheet.pdf (accessed on 1 December 2025).
  34. Wang, S.; Luo, F.; Fo, J.; Lv, Y.; Wang, C. Two-Stage Spatiotemporal Decoupling Configuration of SOP and Multi-Level Electric–Hydrogen Hybrid Energy Storage Based on Feature Extraction for Distribution Networks with Ultra-High DG Penetration. Appl. Energy 2025, 398, 126438. [Google Scholar] [CrossRef] [Scilit]
Figure 1. Schematic of PV parameters with electrolysis systems.
Energies 19 01316 g001
Figure 2. Meteorological dataset hourly (December 2024–November 2025): (a) Global Horizontal Irradiance; (b) Ambient temperature.
Energies 19 01316 g002
Figure 3. Flowchart of the overall PV–electrolysis Frameworks.
Energies 19 01316 g003
Figure 4. Annual fluctuation of PV module temperature.
Energies 19 01316 g004
Figure 5. The details output of the photovoltaic (PV) current.
Energies 19 01316 g005
Figure 6. The SDM, DDM, and TDM of the saturation current results.
Energies 19 01316 g006
Figure 7. The open-circuit voltage for SDM, DDM, and TDM, practically.
Energies 19 01316 g007
Figure 8. (a) I–V and (b) P–V curves of a typical SDM in term of GHI.
Energies 19 01316 g008
Figure 9. (a) I–V and (b) P–V curves of a typical DDM in term of GHI.
Energies 19 01316 g009
Figure 10. (a) I–V and (b) P–V curves of TDM with GHI.
Energies 19 01316 g010
Figure 11. Summary of PV parameters model: (a) SDM, (b) DDM, and (c) TDM results.
Energies 19 01316 g011
Figure 12. The details of stack current of system.
Energies 19 01316 g012
Figure 13. Summary of H2P for the integrated system.
Energies 19 01316 g013
Table 1. Literature review of the integration of the PV model with the electrolyzer system.
Ref.PV-ModelElectrolysisDescription
[16]SDMAELThe integration of an alkaline electrolyzer system with a PV array was analyzed to facilitate sustainable H2P. A novel approach integrated an alkaline electrolyzer with a PV system to assess and quantify the key electrical parameters governing electrolyzer operation. Mathematical formulations were developed to estimate H2P under varying operating conditions.
[17]SDMAELThe SDM-based model evaluated the I–V and P–V characteristics, achieving an MPPT efficiency of approximately 99.8% under optimal coupling. The results indicated that higher electrolyzer temperatures enhanced efficiency, whereas increased PV cell temperatures reduced the maximum power output.
[18]SDMPEMDynamic models of PV and wind systems were employed to evaluate the year-round operational feasibility of a PEM fuel cell under optimal efficiency. A case study validated the proposed energy management strategy by analyzing PEM system performance, which highlighted the importance of modeling and simulation in sustainable H2P.
[19]SDMPEMA simulation-based assessment of integrated PV and wind systems was conducted to examine the seasonal and climatic adaptability of a PEM electrolyzer. The proposed energy management framework was validated through performance evaluation, emphasizing the critical role of accurate system modeling in achieving high-efficiency H2P.
[20]SDMPEMExperimental outcomes from actual operations were shown to demonstrate the effective execution of the microgrid supervisory system, using statistical measures like RMSE, MAE, MAPE, and R2 to validate the appropriateness of the deployed Digital Twin (DT). The DT PV generator, DT PEM EL, and DT FC exhibited R2 values of 0.982, 0.899, and 0.888, respectively.
[21]TDMAELThe TDM effectively replicated the performance of a 144-cell photovoltaic module, generating 1.07 MWh from May to September 2025, which was used by an electrolyzer to produce 22.6 kg of green hydrogen using 203 L of water. The hydrogen fueled the H2T, producing 414.6 kWh and increasing hydrogen production to 31.4 kg, thereby contributing to a hybrid renewable energy source.
Table 2. Data of PV parameters under STC: 1000 W/m2, T cell = 25 °C; CS6.1-72TB-620 (CSI Solar Co., Ltd., Suzhou, Jiangsu, China).
Electrical Parameter (Front-Side Only)Value
Nominal maximum power ( P max ) [W]620
Optimum operating voltage ( V mp ) [V]44.8
Optimum operating current ( I mp ) [A]13.84
Open-circuit voltage ( V oc ) [V]52.6
Short-circuit current ( I sc ) [A]14.78
Module efficiency ( η )22.0%
R s and R p [ Ω ]0.25 and 500
α 1 , α 2 , and  α 3 1.3, 2.0, and 3.0
E g [eV]1.12
Cell numbers ( N s )72 cells
Table 3. Primary operational parameters and reactions of PEM, AEL and SOEC [10].
PEMAELSOEC
Reactions Cathode:
4 H + + 4 e 2 H 2
Anode:
2 H 2 O O 2 + 4 H + + 4 e
Cathode:
4 H 2 O + 4 e 2 H 2 + 4 OH
Anode:
4 OH O 2 + 2 H 2 O + 4 e
Cathode:
H 2 O + 2 e H 2 + O 2
Anode:
O 2 1 2 O 2 + 4 e
Temperature50–80 °C60–90 °C700–1000 °C
PressureUp to 70 barUp to 30 bar1–10 bar
Efficiency65–75% (0.75)60–70% (0.70)May exceed 85%
Cell operating voltage1.8–2.0 V/cell1.9–2.2 V/cell1.2–1.4 V
Hydrogen size/puritySmall/highSmall/highSmall/high
ElectrolyteA rigid polymer membrane (Nafion)Alkaline solution potassium hydroxide (KOH) or sodium hydroxide (NaOH)Solid ceramic
Table 4. Specifications of alkaline (A485) and PEM (MC500) electrolyzers [32].
ParameterAlkaline—A485PEM—MC500
Rated power2.2 MW2.5 MW
H2 production rate485 Nm3/h492 Nm3/h
H2 production1046 kg/day1062 kg/day
Efficiency (HHV)60–70%65–75%
Specific energy3.8–4.5 kWh/Nm3≈4.5 kWh/Nm3
Operating pressure∼0.03 barg∼30 barg
Turndown ratio15–100%10–100%
Electrolyte25% KOHPolymer membrane
Table 5. Specifications of SOEC [33].
ParameterSOEC
PV utilization factor0.95
Stack voltage512 V
SOEC efficiency (LHV)0.85
Faraday efficiency0.95
Faraday constant (F)96,485 C·mol−1
Electrons per H2 molecule (z)2
Water consumption ratio9.0 L (H2O/H2)
Table 6. The maximum power point of PV parameters.
Month P SDM (W) P DDM (W) P TDM (W)
24 December82,836.0582,831.1282,830.09
25 January83,285.7283,280.8683,279.79
25 February80,067.7680,062.9080,061.84
25 March111,005.12110,998.68110,997.89
25 April127,738.14127,730.62127,729.63
25 May143,834.66143,825.94143,824.96
25 June138,838.40138,829.91138,829.37
25 July138,751.28138,742.84138,743.13
25 August128,168.82128,160.93128,161.20
25 September118,920.34118,912.82118,912.18
25 October113,712.96113,706.10113,704.77
25 November93,243.8593,238.2393,237.30
Total Power1,360,403.101,360,320.961,360,312.16
Table 7. Details of coupled SDM–electrolysis.
MonthE (kWh)SDM–PEMSDM–AELSDM–SOEC
H2 (g)H2O (L)H2 (g)H2O (L)H2 (g)H2O (L)
December 202478.6943.80434.2334.24538.2034.63141.677
January 202579.1213.82434.4194.26838.4104.65641.904
February 202576.0643.67733.0894.10336.9264.47640.285
March 2025105.4555.09745.8755.68851.1946.20655.850
April 2025121.3515.86652.7906.54658.9117.14164.269
May 2025136.6436.60559.4427.37066.3348.04172.368
June 2025131.89656.37557.3777.11464.0307.76269.854
July 2025131.8146.37157.3417.11063.9907.75769.810
August 2025121.7605.88552.9686.56859.1097.16564.486
September 2025112.9745.46149.1466.09454.8446.64859.833
October 2025108.0275.22246.9945.82752.4426.35757.213
November 202588.5824.28238.5354.77843.0025.21346.914
Total (Year)1292.38362.468562.21069.710627.39476.051684.461
Table 8. Details of coupled DDM–electrolysis.
MonthE (kWh)DDM–PEMDDM–AELDDM–SOEC
H2 (g)H2O (L)H2 (g)H2O (L)H2 (g)H2O (L)
24 December78.6903.80334.2314.24438.2004.63141.675
25 January79.1173.82434.4174.26838.4084.65641.901
25 February76.0603.67633.0874.10336.9244.47640.282
25 March105.4495.09745.8725.68851.1916.20555.847
25 April121.3445.86552.7876.54558.9077.14164.265
25 May136.6356.60459.4397.37066.3308.04072.363
25 June131.8886.37557.3747.11464.0267.76169.850
25 July131.8066.37157.3387.11063.9867.75669.806
25 August121.7535.88552.9656.56759.1067.16564.482
25 September112.9675.46049.1436.09354.8406.64859.829
25 October108.0215.22146.9915.82752.4396.35757.209
25 November88.5764.28138.5324.77843.0005.21246.911
Total (Year)1292.30562.464562.17669.706627.35676.047684.420
Table 9. Details of coupled TDM–electrolysis.
MonthE (kWh)TDM–PEMTDM–AELTDM–SOEC
H2 (g)H2O (L)H2 (g)H2O (L)H2 (g)H2O (L)
24 December78.6893.80334.2314.24438.2004.63041.674
25 January79.1163.82434.4174.26738.4074.65641.901
25 February76.0593.67633.0874.10336.9234.47640.282
25 March105.4485.09745.8725.68851.1906.20555.847
25 April121.3435.86552.7866.54558.9077.14164.265
25 May136.6346.60459.4387.37066.3308.04072.363
25 June131.8886.37557.3747.11464.0267.76169.849
25 July131.8066.37157.3387.11063.9867.75669.806
25 August121.7535.88552.9656.56759.1067.16564.482
25 September112.9675.46049.1436.09354.8406.64859.828
25 October108.0205.22146.9905.82752.4396.35657.208
25 November88.5754.28138.5324.77842.9995.21246.911
Total (Year)1292.29762.462562.17369.706627.35376.046684.416
Disclaimer/Publisher’s Note: The statements, opinions and data contained in all publications are solely those of the individual author(s) and contributor(s) and not of MDPI and/or the editor(s). MDPI and/or the editor(s) disclaim responsibility for any injury to people or property resulting from any ideas, methods, instructions or products referred to in the content.