1. Introduction
In recent years, the trend of energy transformation has been noticeable in many countries. The growing interest in renewable energy sources (RESs) is particularly noticeable, with their importance increasing year by year in many countries’ energy mixes. In 2024, global electricity generation by RESs reached a record high of around 30.9 thousand TWh, which was 23% of the total final electricity consumption [
1]. Renewable energy sources such as wind farms and photovoltaic installations play an important role in the decarbonization of the energy sector. About 116.8 GW of installed wind power capacity and 602 GW of solar photovoltaic (PV) capacity was added to the world’s grids, which saw the global installed solar PV capacity grow by a record 37% between 2023 and 2024 [
1]. The use of renewable energy sources results in a reduction in greenhouse gas emissions, including carbon dioxide, during the electricity generation process. On the other hand, these sources are characterized by a variable amount of electricity produced, which depends largely on the prevailing weather conditions. From a legal framework, the energy from renewable energy sources has a priority in the network, as all generated energy is fed into the power system, irrespective of the current demand in the grid. This situation may require additional regulatory mechanisms that contribute to network stabilization. However, despite the significant increase in the importance of RESs, many countries in the world still base their electricity systems on fossil fuels such as coal or crude oil [
2]. Hence, the process of decarbonization to achieve net-zero emissions, which is a state where, in a given area within the analyzed energy system, the sum of all greenhouse gases emitted into the atmosphere is balanced by their capture, removal, storage, or reuse in various industries and is a tedious and slow process, requiring long-term planning and forecasting. Designing an efficient energy system equipped with a high installation capacity for RES installations requires a stable core supplying the power grid with energy regardless of the prevailing weather conditions, energy storage units allowing for the use of surplus energy during an excess in the grid and storing it until a deficit occurs, and peak sources capable of quickly supplying electricity when a sudden demand occurs within the power system.
With the growing importance of renewable energy sources like PVs or wind farms (WFs) and their increased share in energy mixes, it is necessary to use additional methods of regulating the electricity grid by using energy storage technologies (ES), because a further increase in the installation capacity for renewable energy installations may inconveniently affect the stability of energy systems [
3]. Currently, this task is mostly performed by pumped hydro storage power plants (PHS), which are well understood and commercially available energy storage technologies on a large scale [
4]. PHS is a mature technology that currently represents around 96% of the global energy storage capacity [
5]. Other possible technologies for storing large amounts of electricity within energy systems include compressed air energy storage systems (CAESs) and systems using hydrogen as an energy carrier [
6,
7]. Regardless of the choice of energy storage technology, these are expensive solutions, especially in terms of investment, but they are necessary when considering net-zero emission energy system scenarios.
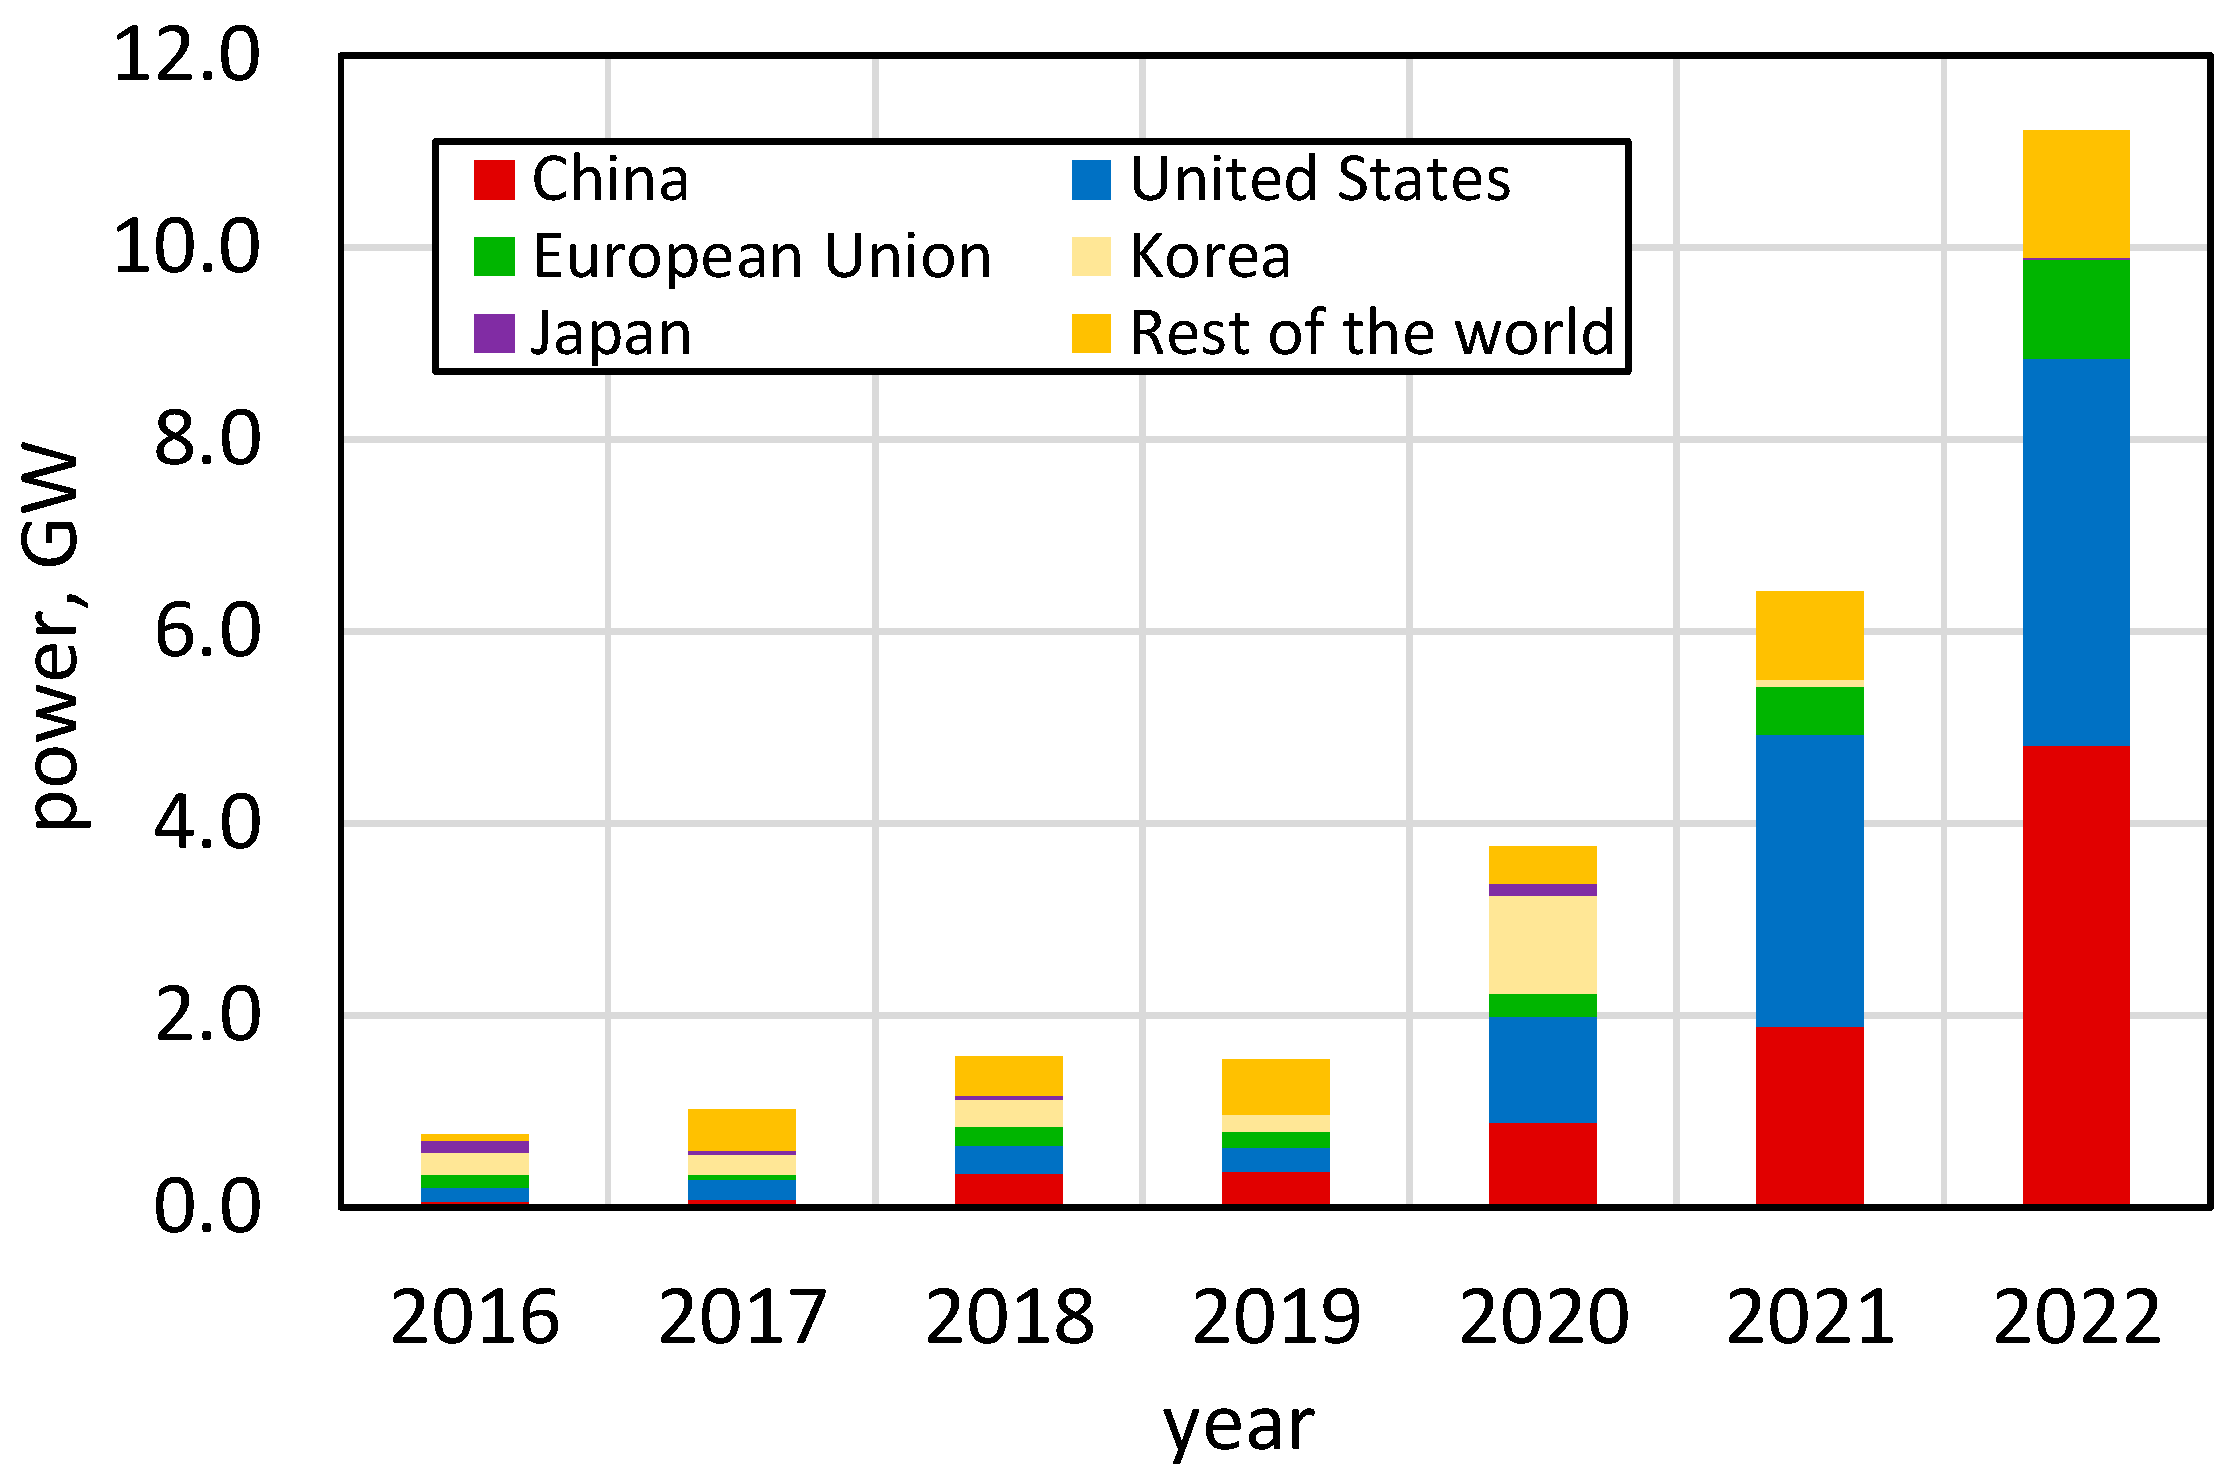
The energy storage market is under rapid development; however, it has to be emphasized that it is currently focused on battery systems. Annual grid-scale battery storage additions, according to International Energy Agency data [
8], are presented in
Figure 1.
This vast development is mostly in the USA and China. As presented in [
9], California has 8179 MW of operating batteries, Texas has 4252 MW, Arizona has 858 MW, Nevada has 758 MW, and New York has 232 MW of battery systems. A flagship example of the effective use of battery systems is California, USA, whose generation mix consisted of almost 58% non-GHG and renewable sources [
10], of which nuclear sources accounted for only 9.3%. In California, over 4 years, the grid-scale batteries’ discharging power capabilities increased over 40 times, reaching over 8 GW at the end of 2024. However, European countries are also interested in increasing their grid flexibility potential, including the Netherlands (data for October 2024), which has 251 MW of running batteries and 176 MW of systems under construction. Permits for construction have been issued for another 1744 MW, with as many as 33 installations above 5 MW [
11]. Utility-scale batteries are also becoming a reality in Europe, resulting in a noticeable reduction in capital expenditures—the United Kingdom, for example, boasts a 30% reduction in CAPEX in two years (from 2022) [
12], even though 2022 was the first year since 2010 when a global increase in the price of lithium was observed due to the Russian invasion of Ukraine. Russia is the largest producer of grade 1 nickel for batteries, accounting for 20% of the global supply. It is also a top five producer of cobalt and graphite [
13]. Given the cost and energy density, lithium iron phosphate (LFP) batteries are the preferred choice for grid-scale storage. Lithium-ion batteries with a higher energy density, such as nickel cobalt aluminum (NCA) and nickel manganese cobalt (NMC), are popular for energy storage located in households. Lithium supply thus remains one of the most critical elements shaping the future decarbonization of energy storage.
An important element of the design and management of energy systems are stable and failure-free sources ensuring a constant supply of electricity. In many cases, this core consists of installations using fossil fuels in the process of generating electricity. In 2024, the amount of electricity generated in units using fossil fuels was 59.1% globally [
1]. Many energy systems, including Poland’s, are largely based on the use of fossil fuels such as hard coal or lignite, where the installed power unit of this type is about 32 GW [
14]. There is a similar situation in the countries of South-Eastern Europe, where power systems have high shares of electricity generation from coal-fired power units with quite a low efficiency [
15]. Installations burning hydrocarbons in the process of generating electricity produce and emit significant amounts of greenhouse gases such as carbon dioxide into the atmosphere. In 2024, coal-fired power plants supplied about 55.9% of Poland’s electricity.
Therefore, to significantly reduce pollutant emissions and achieve net-zero emissions while maintaining this type of installation in the power system, it is necessary to use CO
2 sequestration installations—Carbon Capture and Storage (CCS). Carbon Capture, Utilization and Storage (CCUS installations) aim at capturing carbon dioxide from industrial processes or fossil fuel-based power plants, with the idea to either store it permanently underground or utilize it through new chemistries. In the case of energy systems equipped with coal-fired power plants, these installations are also considered to play a crucial role in meeting the climate change and global warming reduction target [
16].
In cases seeking to reduce greenhouse gas emissions from the energy sector without using additional costly sequestration installations, it is necessary to use other technological solutions that ensure the stable operation of energy systems. Nuclear power plants can provide such a solution [
17]. Nuclear energy can be a crucial factor in the transformation to clean energy due to its ability to provide energy systems with secure, low carbon emissions during the electricity generation process and lower life cycle emissions than fossil fuels and some renewable energy sources, because studies have shown that the contribution of nuclear power to net carbon emission reduction should consider not only the relative carbon emission reductions from the replacement of coal power but also the carbon emissions of some or the whole life cycle [
18,
19]. Combined with the increasing deployment of RESs, nuclear power plants can represent some of the key measures to achieving the net-zero carbon emissions target globally [
20].
In energy systems where the base of the system is operated by units with limited or low regulation capabilities and a significant installed capacity of renewable energy sources—where the amount of electricity produced depends on the prevailing weather conditions—it is also necessary to use installations that guarantee the possibility of supplying additional power to the system when sudden peaks in demand occur. Gas turbine installations can play such role in the system, because they are characterized by a short response time and a high regulation range, which can be a response to the frequent occurrence of demand peaks in the power grid.
The description of energy systems using numerous defined indicators, in particular, the transformation path for these systems and the path to achieving net-zero emissions, is common in academic research. This topic was discussed in article [
21], in which the author presents the results for the EROI (Energy Return on Investment) indicator defined as the ratio between the amount of usable energy produced by a power plant over its operational lifetime and the total amount of energy invested. The results of study show that, even with the EROI defined for highly developed systems, the maximum share of renewable energy sources may be significantly constrained. These results call for a reassessment of long-term plans for energy transition and the pursuit of net-zero emissions, in which renewable energy sources are to play a dominant role over synchronous generation capacities using nuclear or hydroelectric power, as well as power generated from the thermal conversion of fossil fuels, ensuring the stability and reliability of electricity supply within the energy system. The results presented by the author in article [
21] suggest the need for a more honest discussion of the energy transition plan, which would allow for the implementation of realistic plans to achieve net-zero emissions for individual countries, taking into account their capabilities in this area and enabling long-term changes that would not affect the comfort of society and energy security.
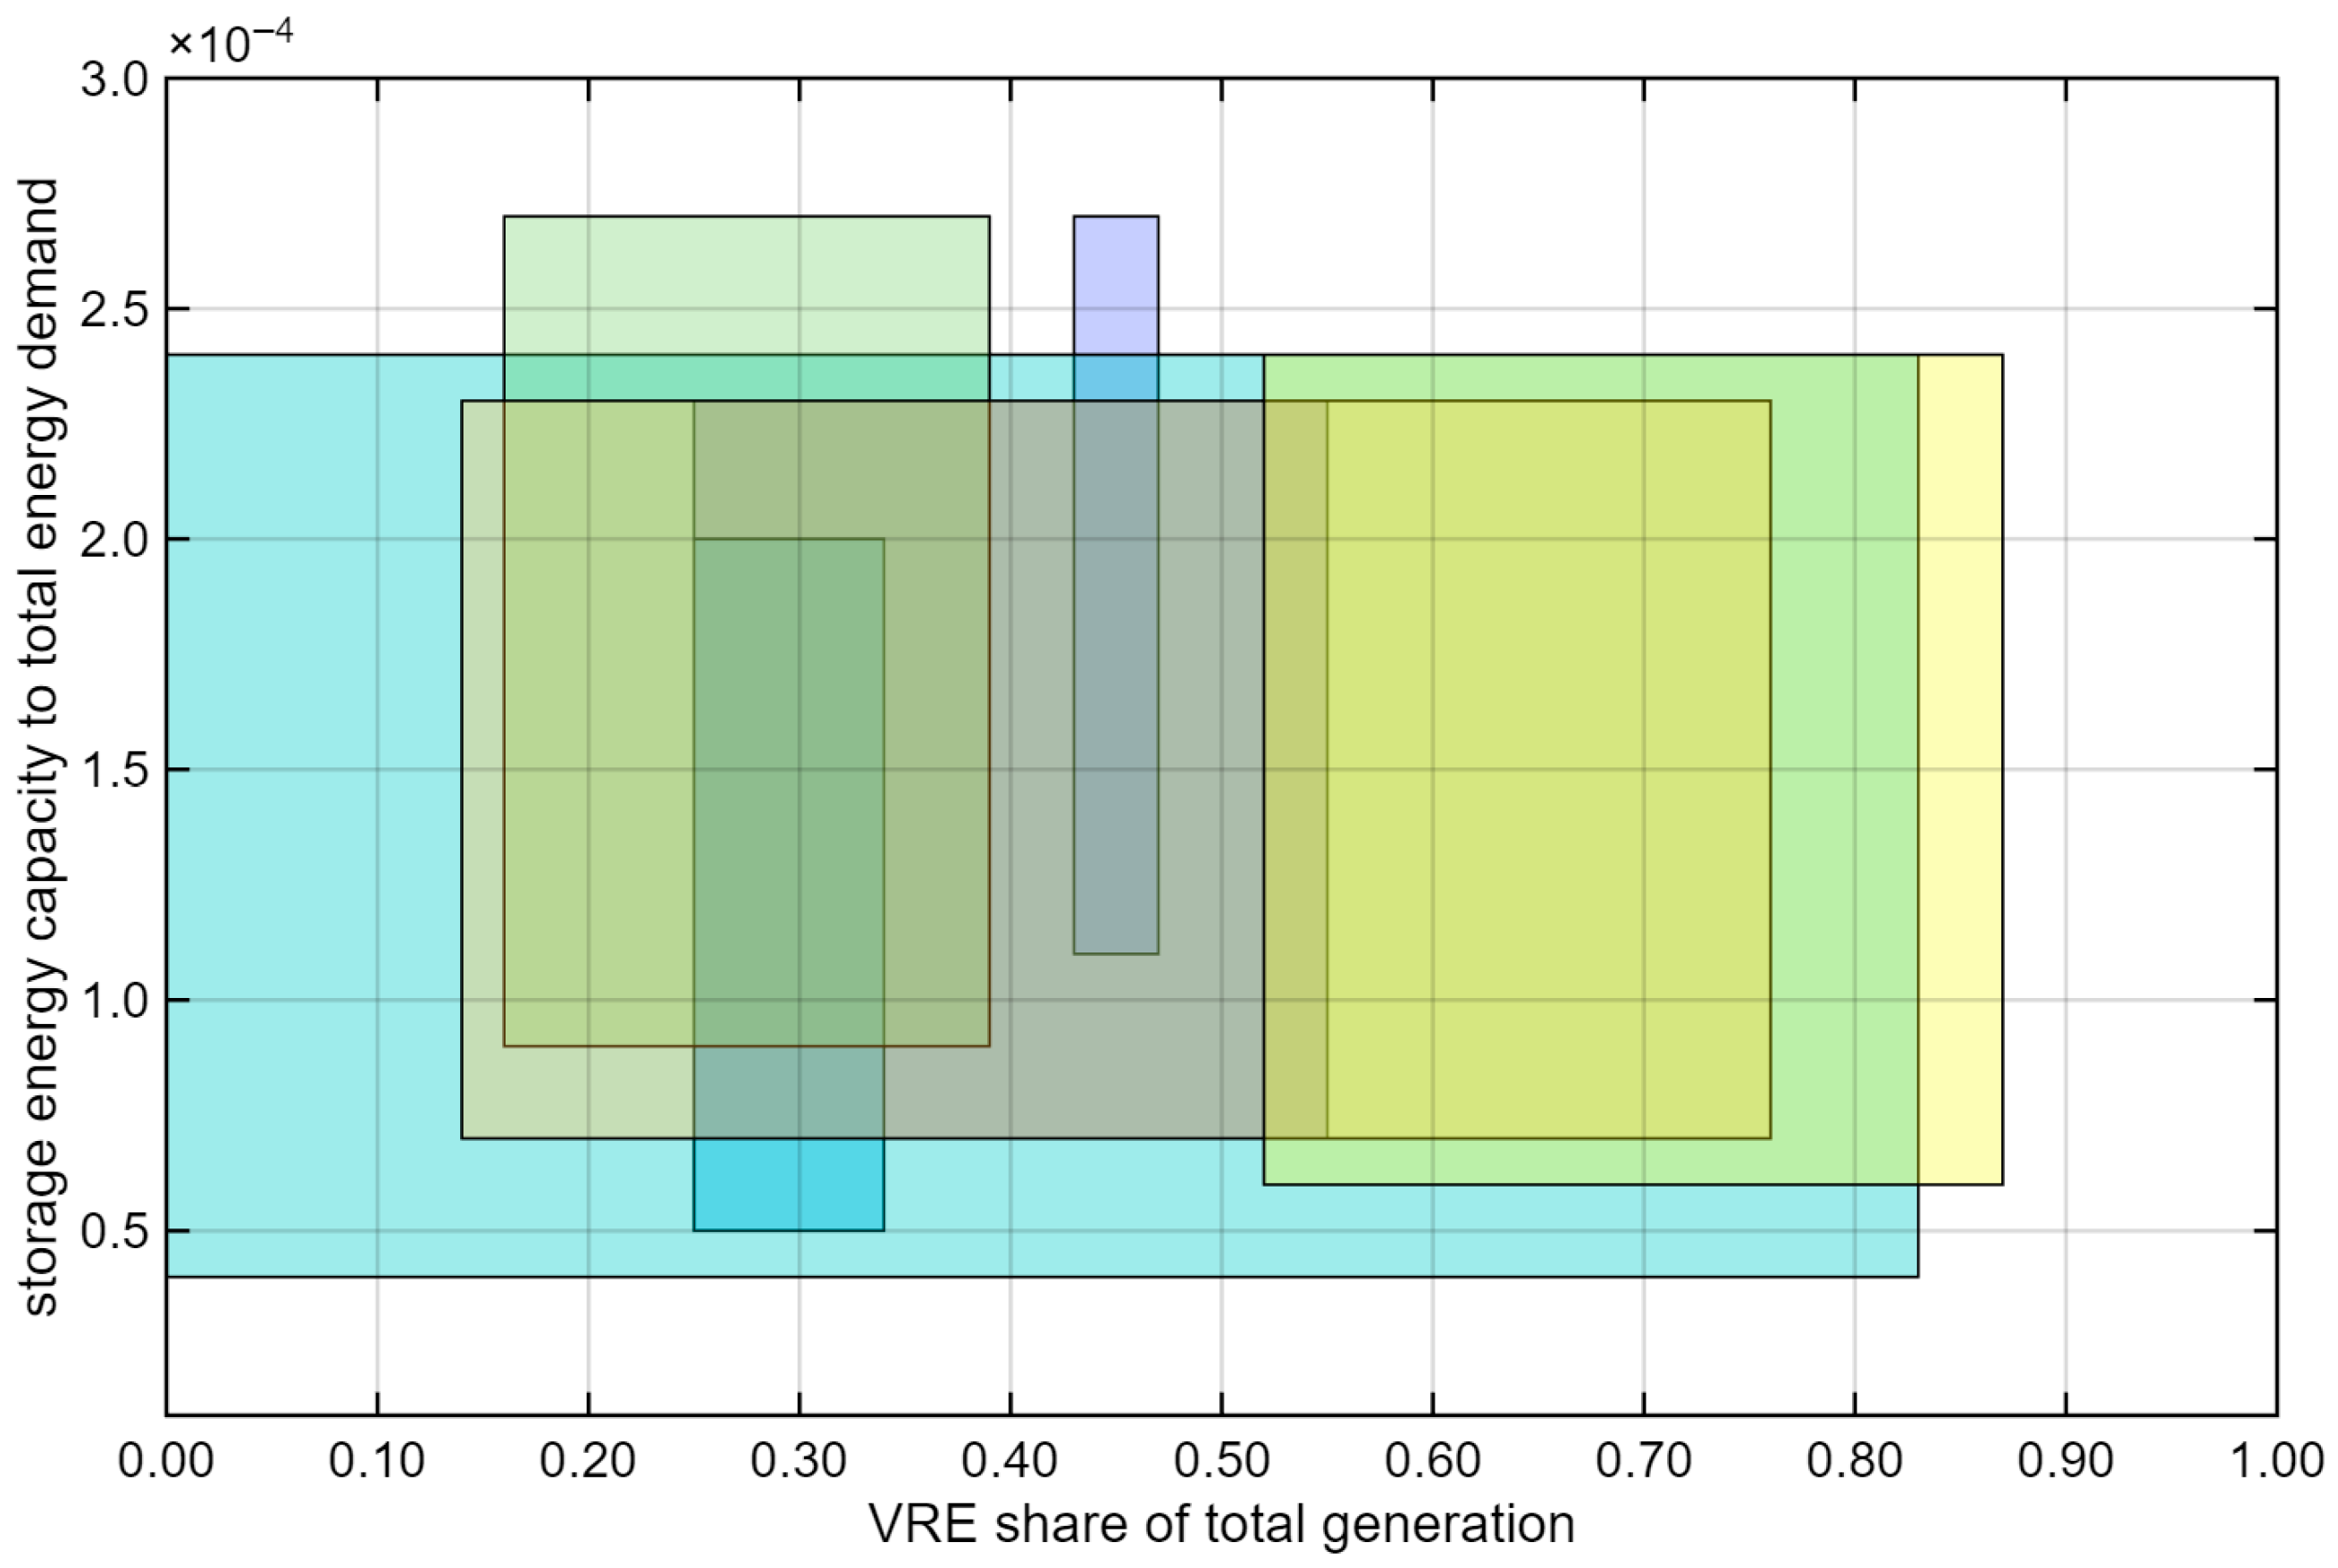
Figure 2 summarizes the ranges of parameters analyzed in the literature on the integration of renewable energy sources (based on [
22]). Colored areas represent the ranges of the VRE share in the total energy generation (horizontal axis) and the ratio of the energy storage capacity to the total energy demand (vertical axis) considered in the selected studies. The overview of these areas is the starting point for further analyses conducted in this paper.
Objective, Novelty, and Structure of the Paper
The main objective of this study is to determine, from a structural complementarity perspective and with a reliability impact, the effective penetration limits of non-dispatchable renewable energy sources in a synthetic energy system and to assess how key structural parameters, e.g., firm generation share, energy storage capacity, and the technological structure of variable renewable energy (wind vs. solar), influence system reliability.
The novelty of this study lies in a reliability-oriented assessment of high-penetration non-dispatchable renewable energy systems based on a synthetic yet representative European load profile. Instead of focusing on cost optimization, this paper introduces a coherent set of load profile indicators (SIs) and reliability indicators (RIs) to estimate the limits of VRE integration. Within this framework, the study addresses two central research questions: (1) Does increasing the energy storage capacity fully eliminate the effective penetration limit of non-dispatchable renewable sources? (2) How does the wind-to-solar generation ratio impact reliability indicators in high-VRE systems?
The results shown in the paper enable the identification of feasible operating regions for future low-emission power systems by jointly analyzing the roles of firm generation, flexible sources, and energy storage capacity. Importantly, the study demonstrates that increasing energy storage capacity shifts—but does not eliminate—the effective penetration limit of non-dispatchable renewables and that the technological structure of VRE (wind vs. solar) has a strong impact on system reliability.
The paper is organized as follows.
Section 2 provides an overview of selected European energy systems, highlighting differences in energy mix structures and electricity demand trends. This overview motivated the development of a representative synthetic load profile.
Section 3 describes the methodology applied in the study, including the construction and evaluation of the load profile, the formulation of the energy system model, and the definition of evaluation indices for both the system demand profile and system reliability.
Section 4 provides an analysis of the results based on preselected case studies.
Section 5 summarizes the findings and recommends areas worth exploring in future research.
2. Energy Systems in Selected European Countries
Several select energy systems of European countries with different characteristics of energy mixes were selected for further analysis. The authors analyzed the energy systems of Belgium, France, Italy, Poland, Sweden, and Switzerland (2000–2024).
Table 1 presents the share of electricity generation sources for selected European countries, while
Table 2 presents the share of total energy supply sources in those countries [
23].
Analyzing the data presented in
Table 1 and
Table 2, it can be seen that, both in terms of the sources responsible for electricity generation and in the case of total energy supply, the presented systems of the selected European countries differ from each other due to the resources used. In the case of fossil fuels used in the electricity production process in Europe, there are still countries that predominantly base their electricity systems on hard coal or lignite (Poland) or, to a large extent, on natural gas (Italy). In the case of countries with a low use of fossil fuels in the energy sector, it can be seen that their role is being taken over by nuclear energy, which is a key element of the electricity system in France, or the use of nuclear power plants combined with the increased production of electricity from renewable sources such as wind farms, photovoltaic installations, and hydropower, as is the case in Sweden and Switzerland. An interesting case is the Belgian power system, where one of the fossil fuels (natural gas), as well as nuclear energy and RESs are used to a large extent. In the case of total energy supply, fossil fuels such as hard coal, lignite, natural gas, oil, and their products still dominate in many countries. It is essential to take into account both electricity and heat generation sources when planning net-zero emissions energy systems, which may be particularly important for European countries that, due to their geographical location and the associated climatic conditions, produce significant amounts of heat.
Table 3 shows the total value and trend of electricity production in Belgium, France, Italy, Poland, Sweden, and Switzerland.
Based on available reports collected for European countries in [
23], a general increase in total electricity production between 2000 and 2024 can be observed in most European countries (e.g., France, Poland, Sweden, and Switzerland). There are also power systems where this value did not change significantly in the analyzed years (e.g., Italy). The trend in total electricity production rarely becomes negative, which is related to a decrease in the amount of electricity produced between 2000 and 2024—Belgium is an example of such a power system. Globally, China is the world’s largest energy consumer and carbon emitter, accounting for about one-third of global carbon emissions. Even for such a large economy, achieving net-zero emissions is a huge undertaking, requiring high costs and extensive analyses considering various scenario variances. China still has 35 years to achieve carbon neutrality, which poses a challenge for the country’s electricity system, which is responsible for approximately 90% of its greenhouse gas emissions [
24].
Due to the increasing demand for electricity in households in highly developed countries, it is important to take this trend into account when designing and modeling energy systems aiming for “net-zero”. Given differences in the structure of electricity networks across individual European countries, the demand for electricity, and the total energy supply, net-zero emissions planning requires an individual approach.
4. Results
4.1. Load Profile Evaluation
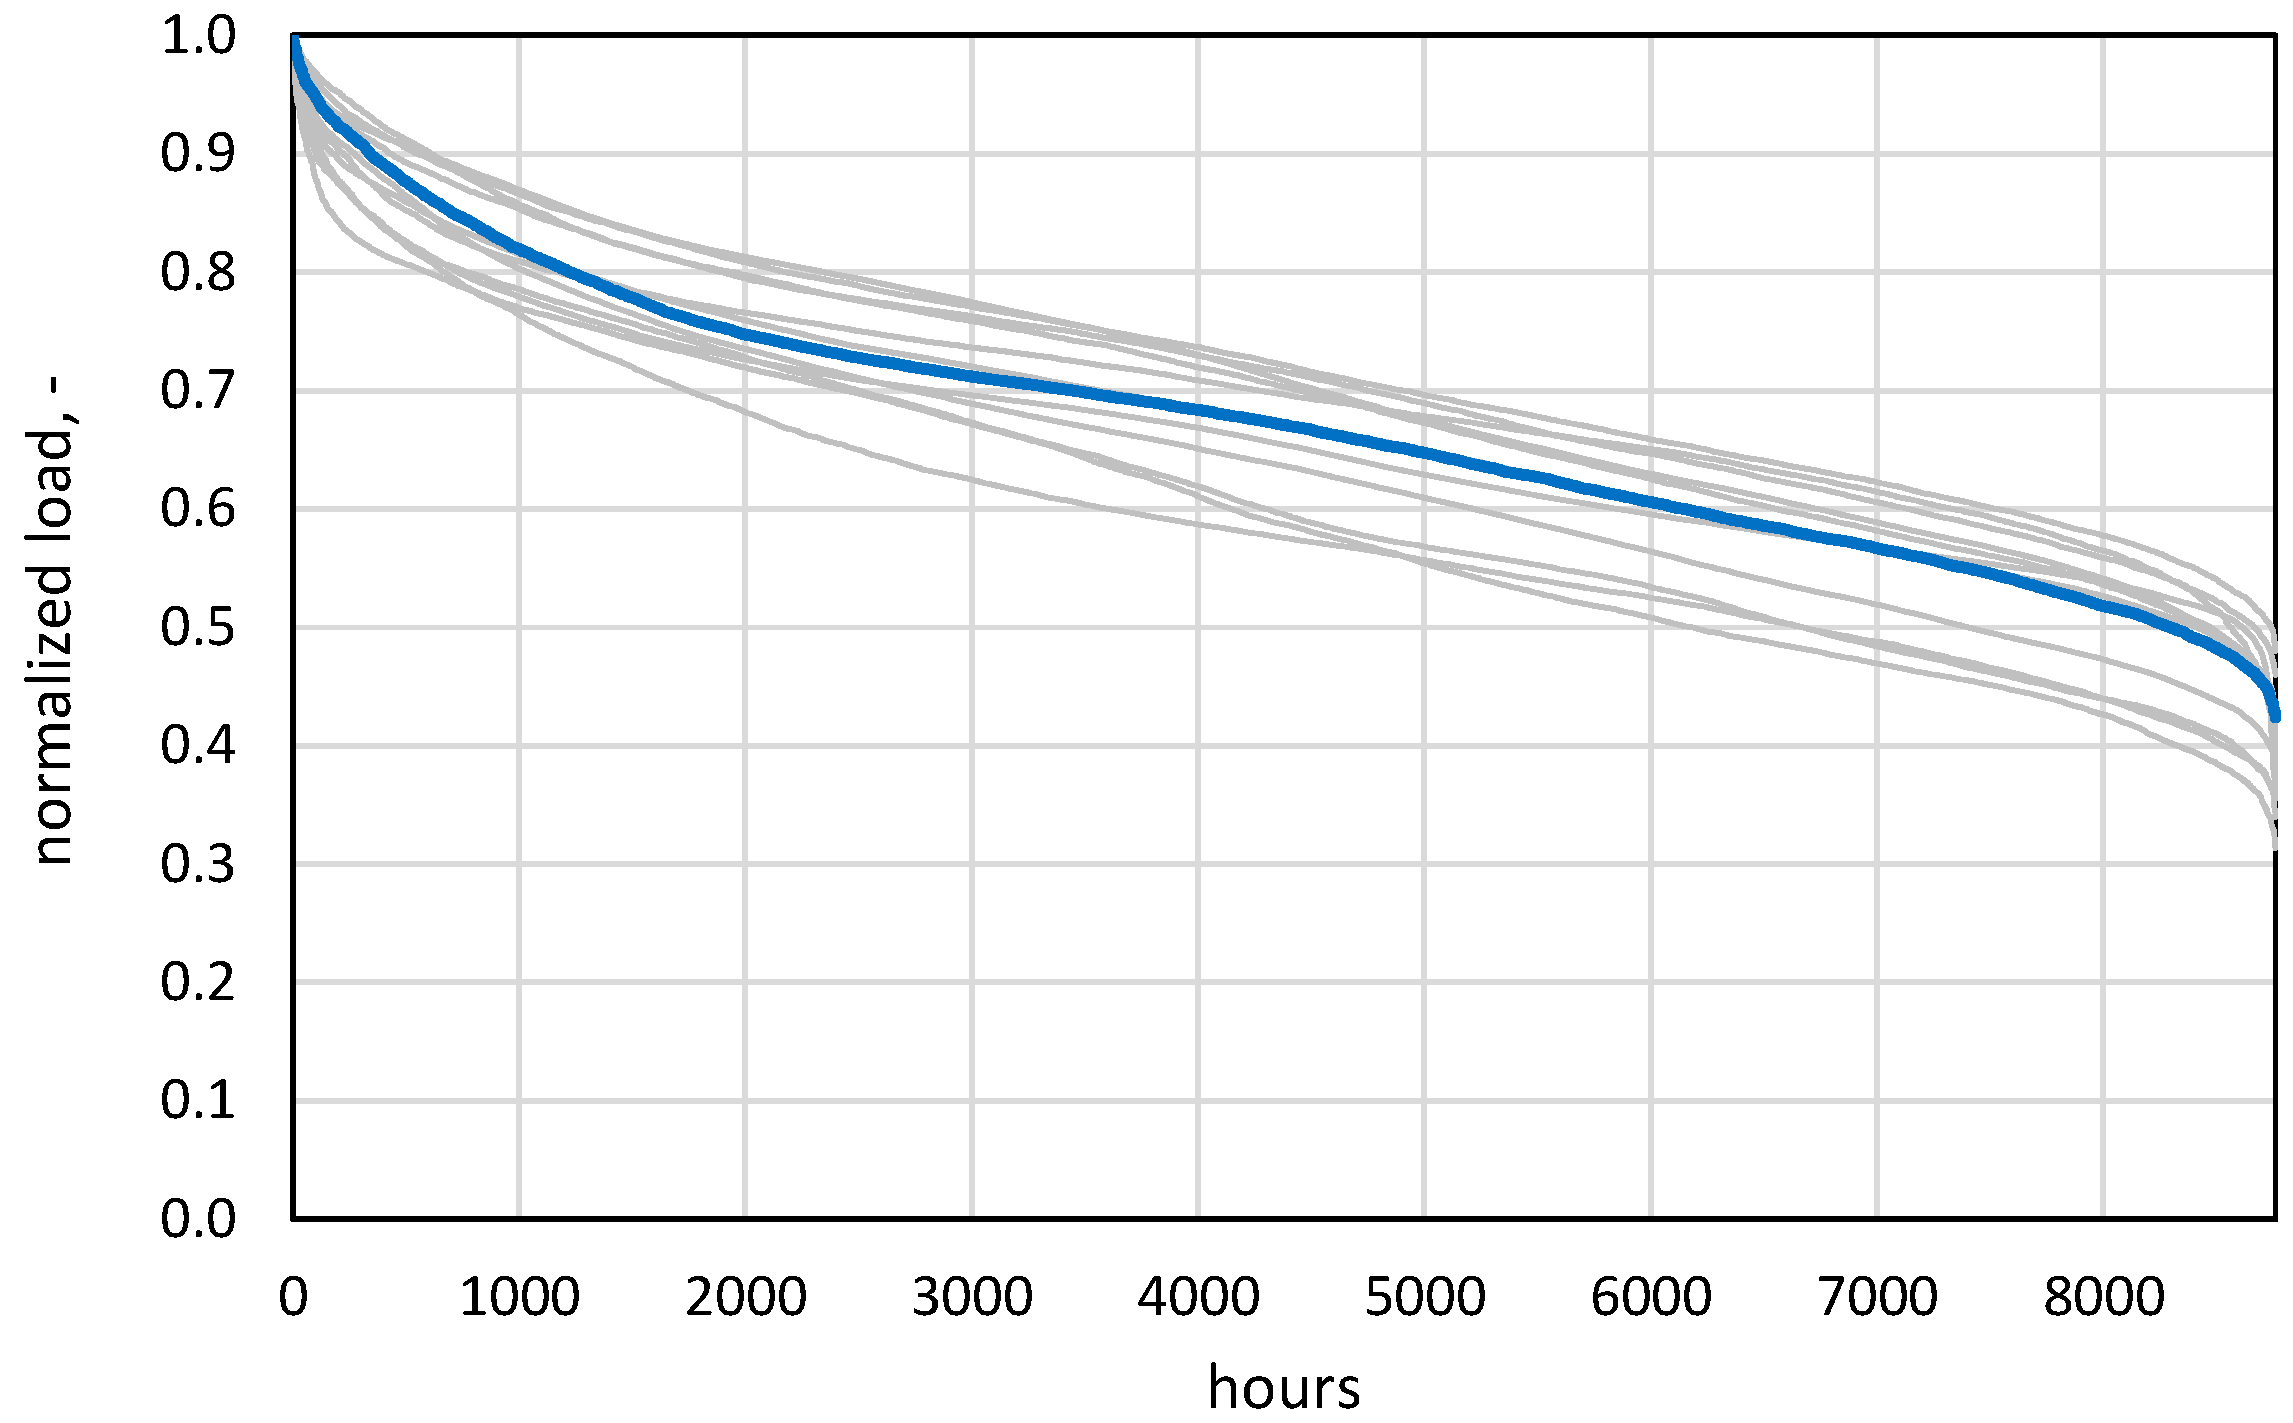
The analysis compared the load profiles of the energy systems of several selected European countries using a set of defined indicators,
SI1–
SI7, calculated on the basis of normalized data (0–1). Normalization allows for only the shape of the profile to be assessed, regardless of the size of the system and the actual load capacity. Data for the aggregated European Union is not the subject of a detailed analysis; however, the authors decided to present it for big-picture awareness.
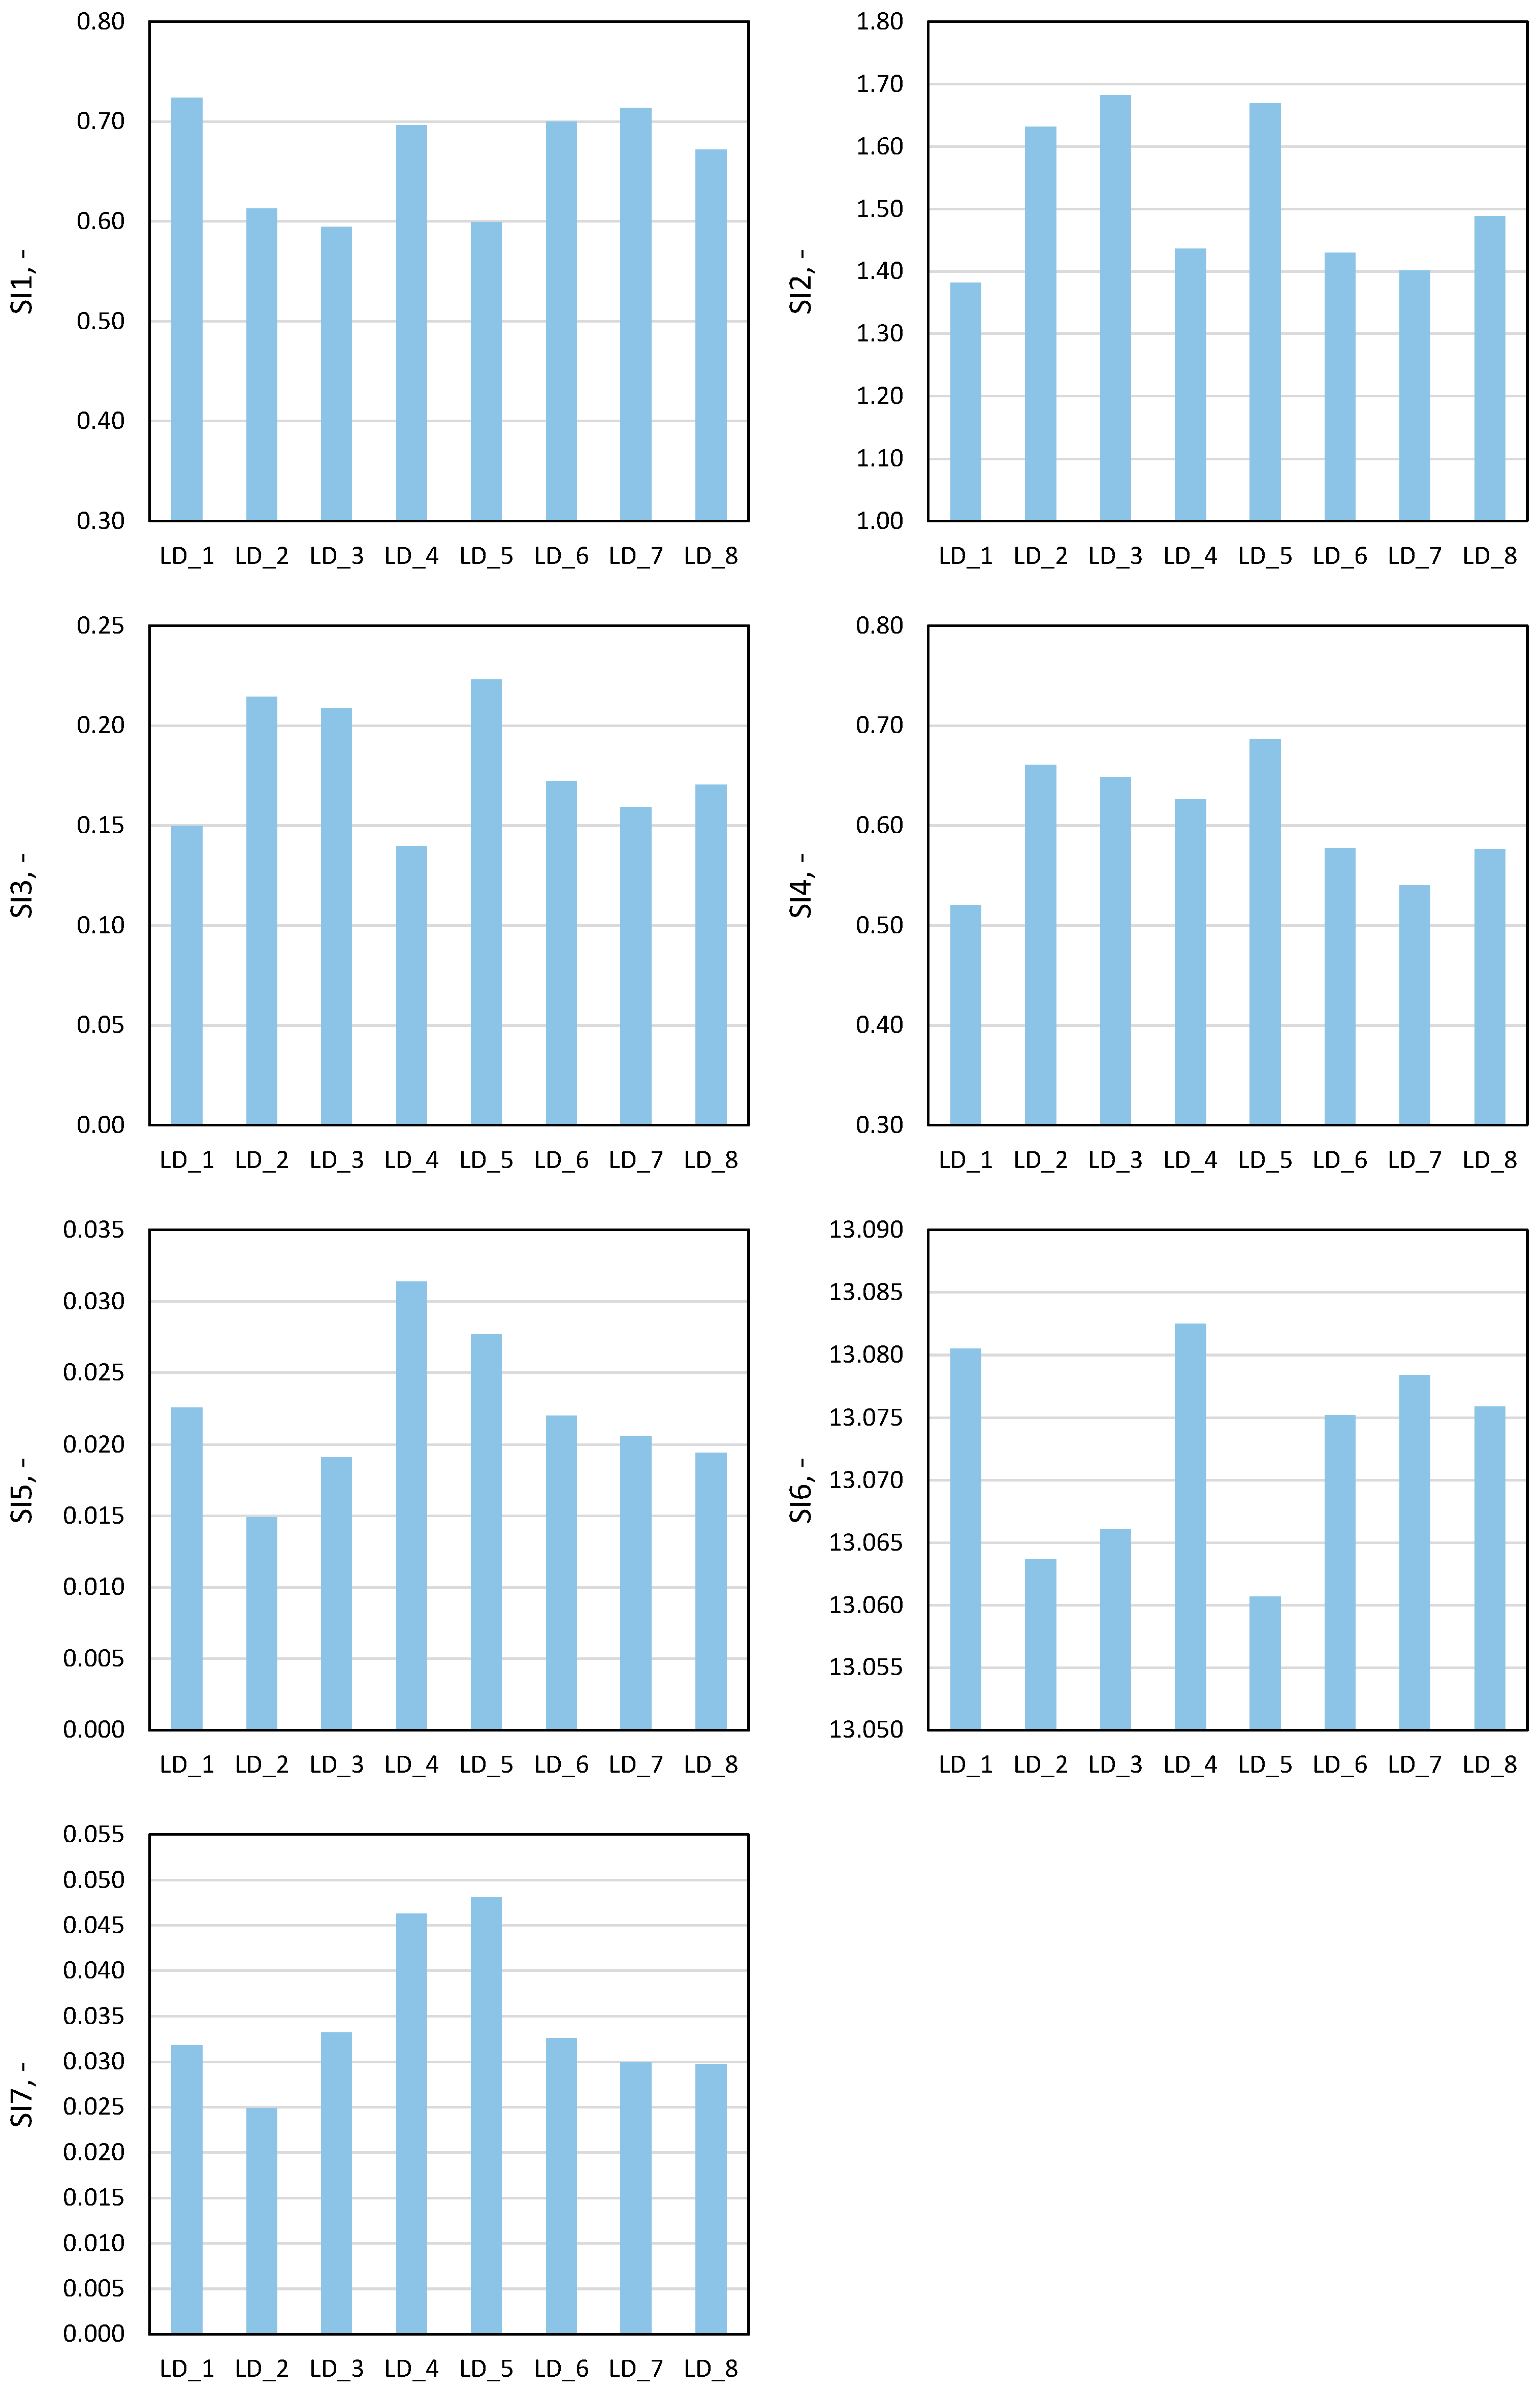
Figure 5 shows the values of the
SI1–
SI7 indicators for the selected energy systems of European countries and synthetic load profiles used for calculations in this paper.
Based on the first two indicators, it can be concluded that the most stable profiles among the group analyzed were observed in Belgium (SI1 = 0.724), Poland (SI1 = 0.700), and Switzerland (SI1 = 0.696). In these countries, the differences between average and peak loads are relatively small. The profiles are more “baseload” in nature, and the systems are more predictable than others and relatively evenly loaded throughout the year. The peakiest profiles are found in France (SI1 = 0.595), Italy (SI1 = 0.599), and Sweden (SI1 = 0.613). These systems are characterized by more pronounced differences between minimum and maximum load values, indicating greater seasonal or daily variability.
The SI3 indicator shows that low relative variability is characteristic of the profiles of Belgium (SI3 = 0.150) and Switzerland (SI3 = 0.140)—changes are more predictable and milder. In these systems, the load is subject to smaller deviations from the average than in other cases. Italy and Sweden have more dynamic fluctuations in relation to the typical load level. These countries also have the highest load amplitude (Italy SI4 = 0.687, Sweden SI4 = 0.661).
France, Belgium, and Poland have the mildest profiles with the lowest average load variation in the real-life profiles. Italy and Switzerland are among the most dynamic. Sweden is an interesting case here, characterized by high seasonality but lower dynamics in the short term (high profile range—high value of SI4, but low values of indicators responsible for dynamics SI5 = 0.015 and SI7 = 0.025). Entropy (SI6) is at a similar level for all countries, which suggests that the profiles are characterized by a similar complexity and the range of load states is similar.
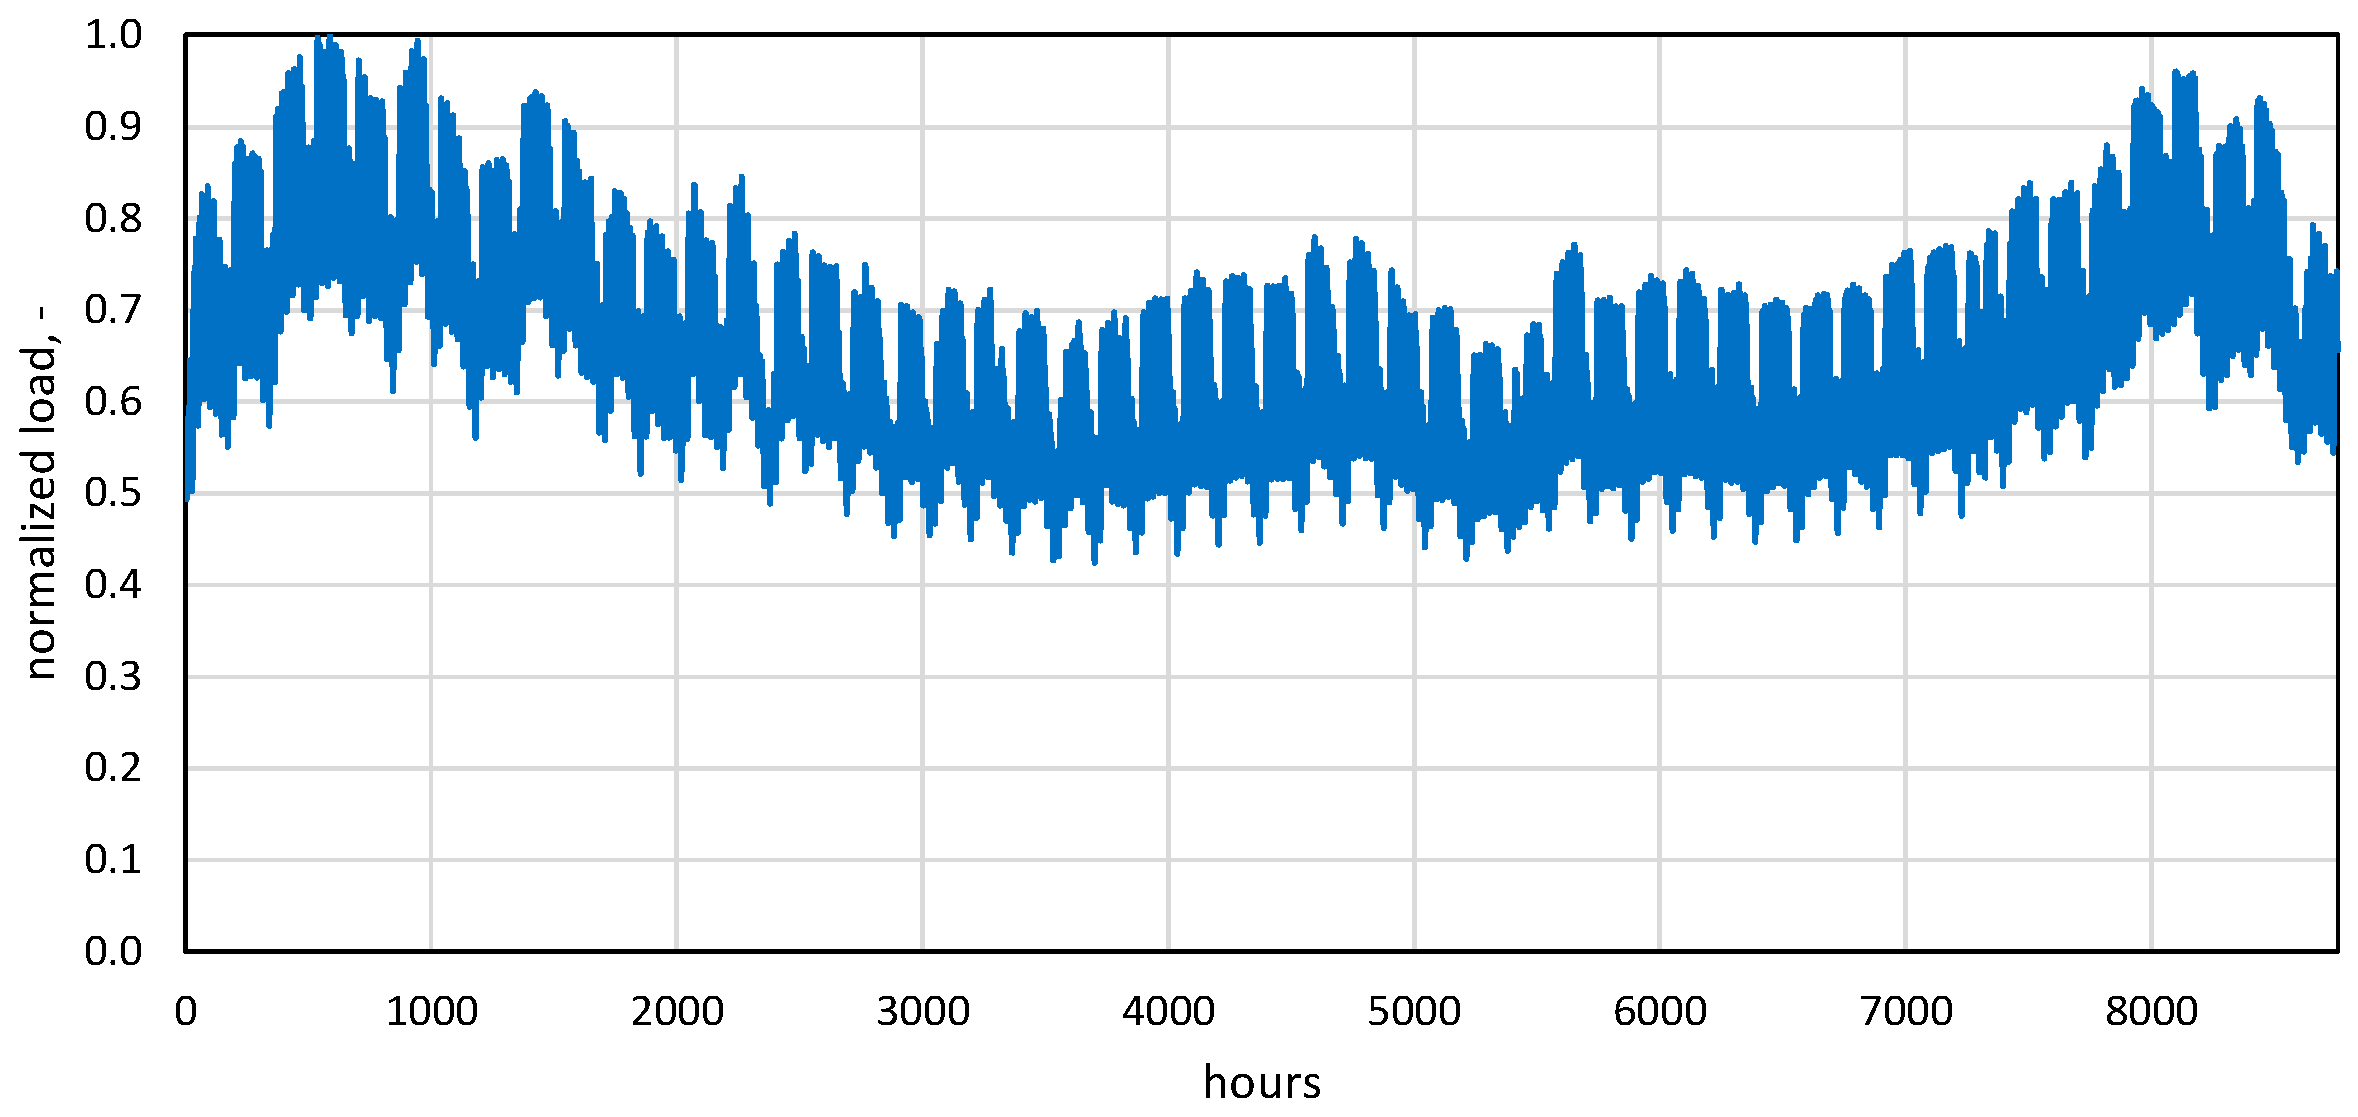
On this basis, the generated synthetic profile can be assessed as a profile with a relatively smooth course, moderate dynamics, and entropy similar to real countries. It can definitely be used to analyze simulated energy systems, as it reflects well the general characteristics of European systems.
4.2. Energy System Evaluation
The analysis focused on assessing the parameters of prospective energy systems, concentrating on the impact of the growing share of non-dispatchable sources and the scale of the necessary share of firm generation. The assessment was carried out using the RIs and auxiliary indicators described in
Section 3.3. All results presented in this subsection were obtained for a synthetic load profile representative of average European conditions. In the analyzed case, it was assumed that the maximum load power is 33 GW, which translates into roughly 194 TWh of electricity demand per year. The installed capacity of the flexible source (gas peakers) is constant and assumed to be 11 GW.
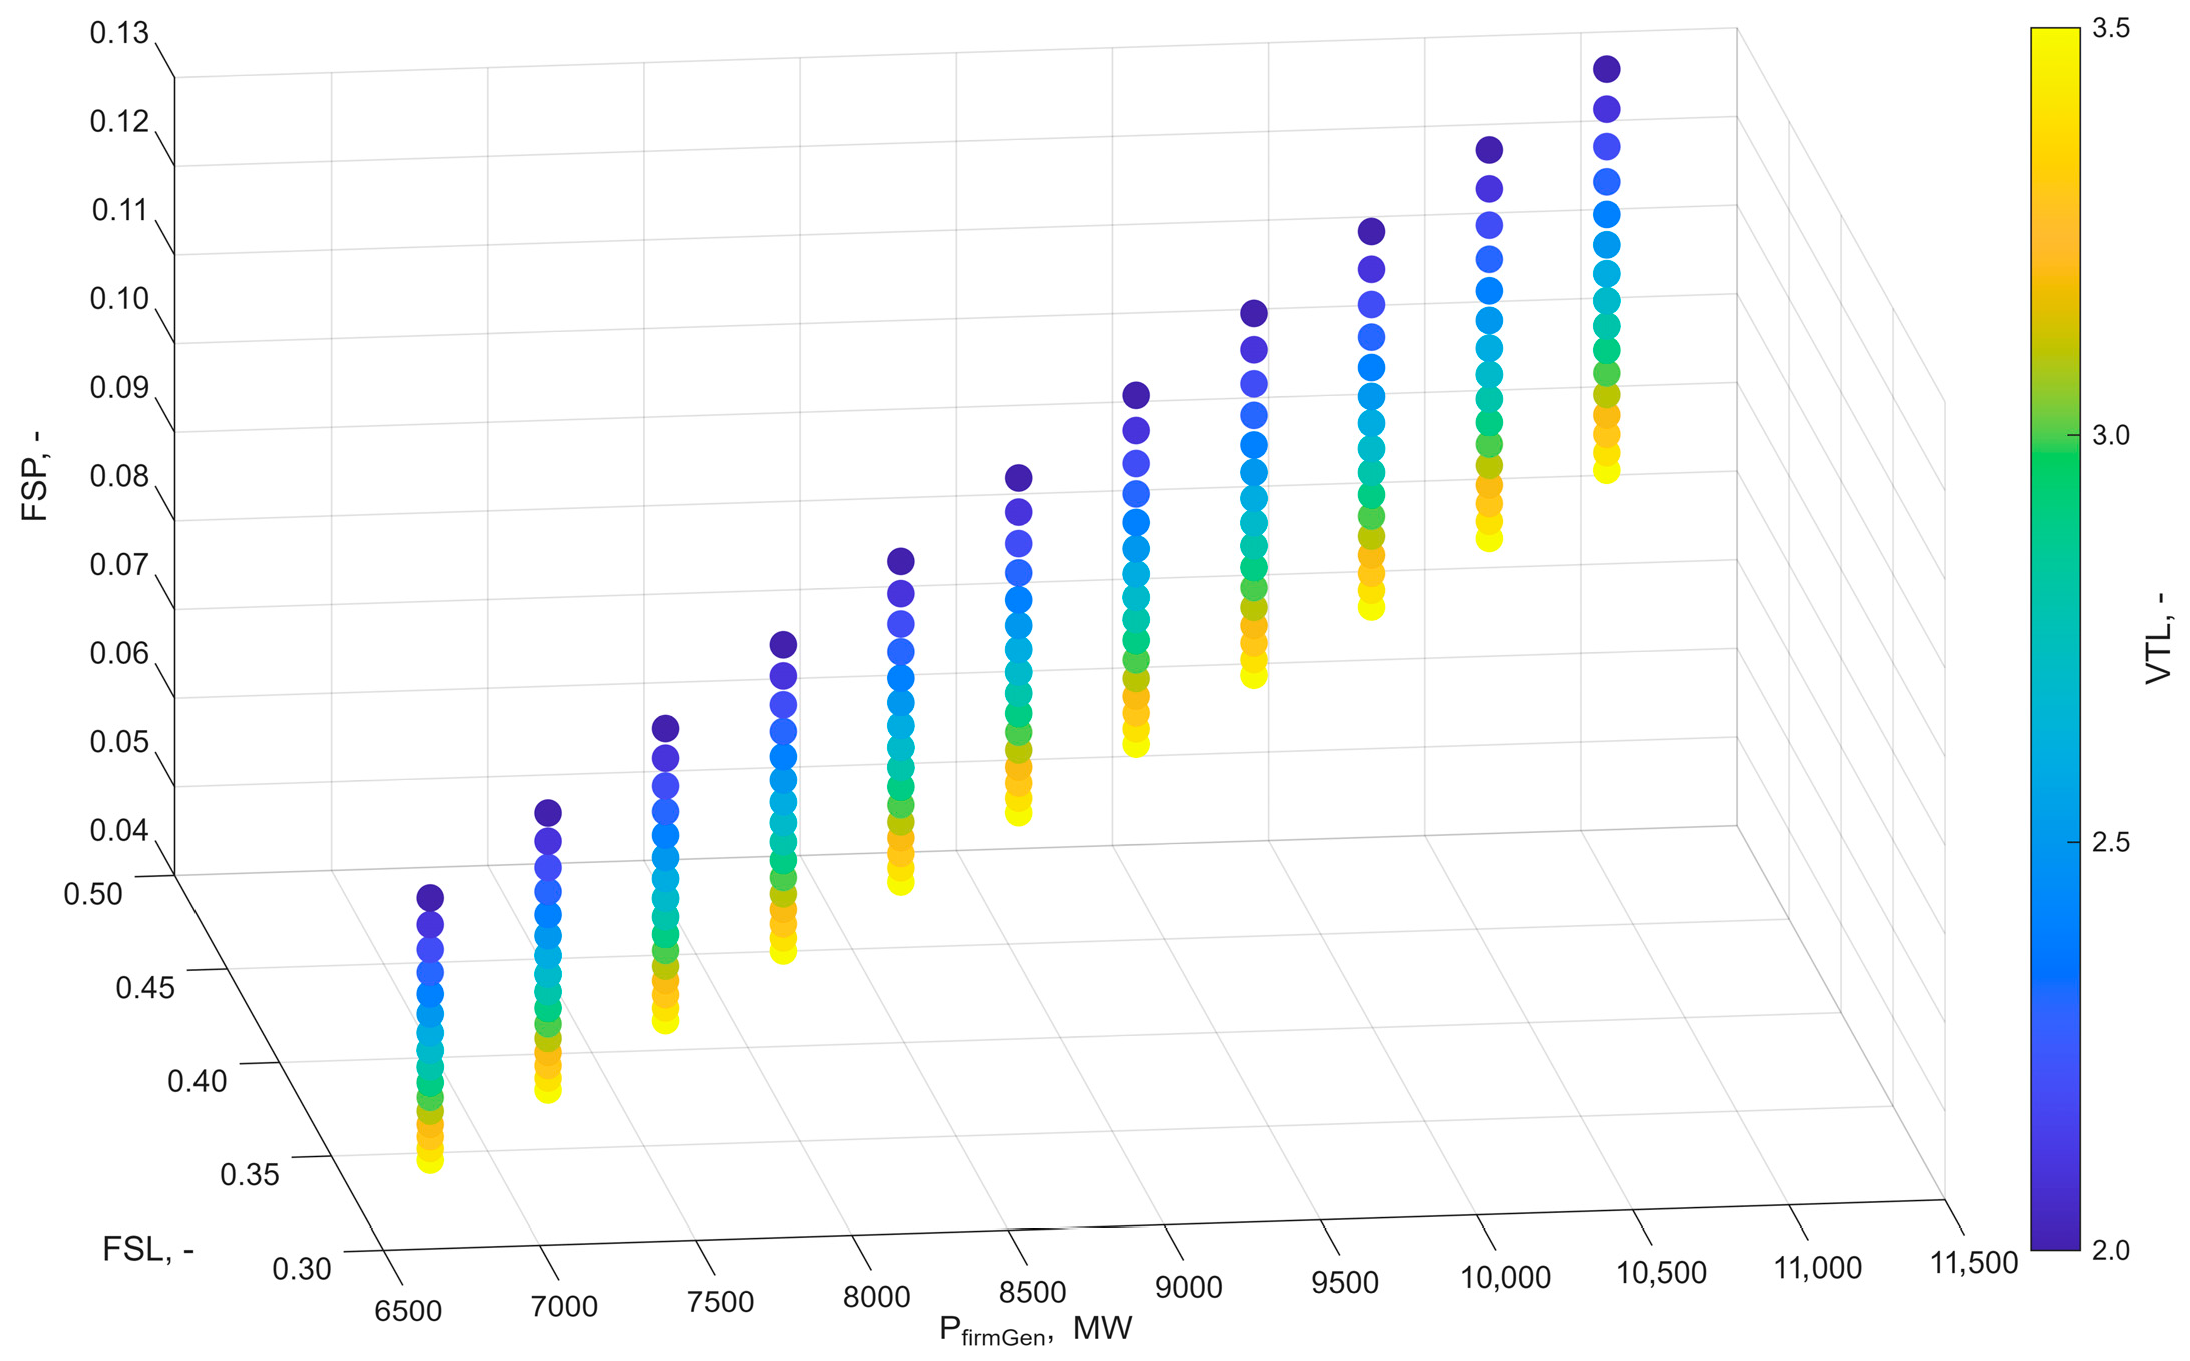
Figure 6 shows the potential use of stable sources (firm generation) in the range of 0.3 to 0.5 of the total demand, which translates into installations with an installed power capacity of approximately 6.65 GW to 11.083 GW. Depending on the scale of the installed capacity in non-dispatchable sources (
VTL), the share of firm sources in the total installed capacity (FSP) ranges from 0.0797 to 0.1258 (for
VTL = 2) and 0.0492 to 0.0806 (for
VTL = 3.5).
For the purpose of further analysis of the reliability indicators, the
FSL = 0.5 system was selected.
Figure 7 shows the
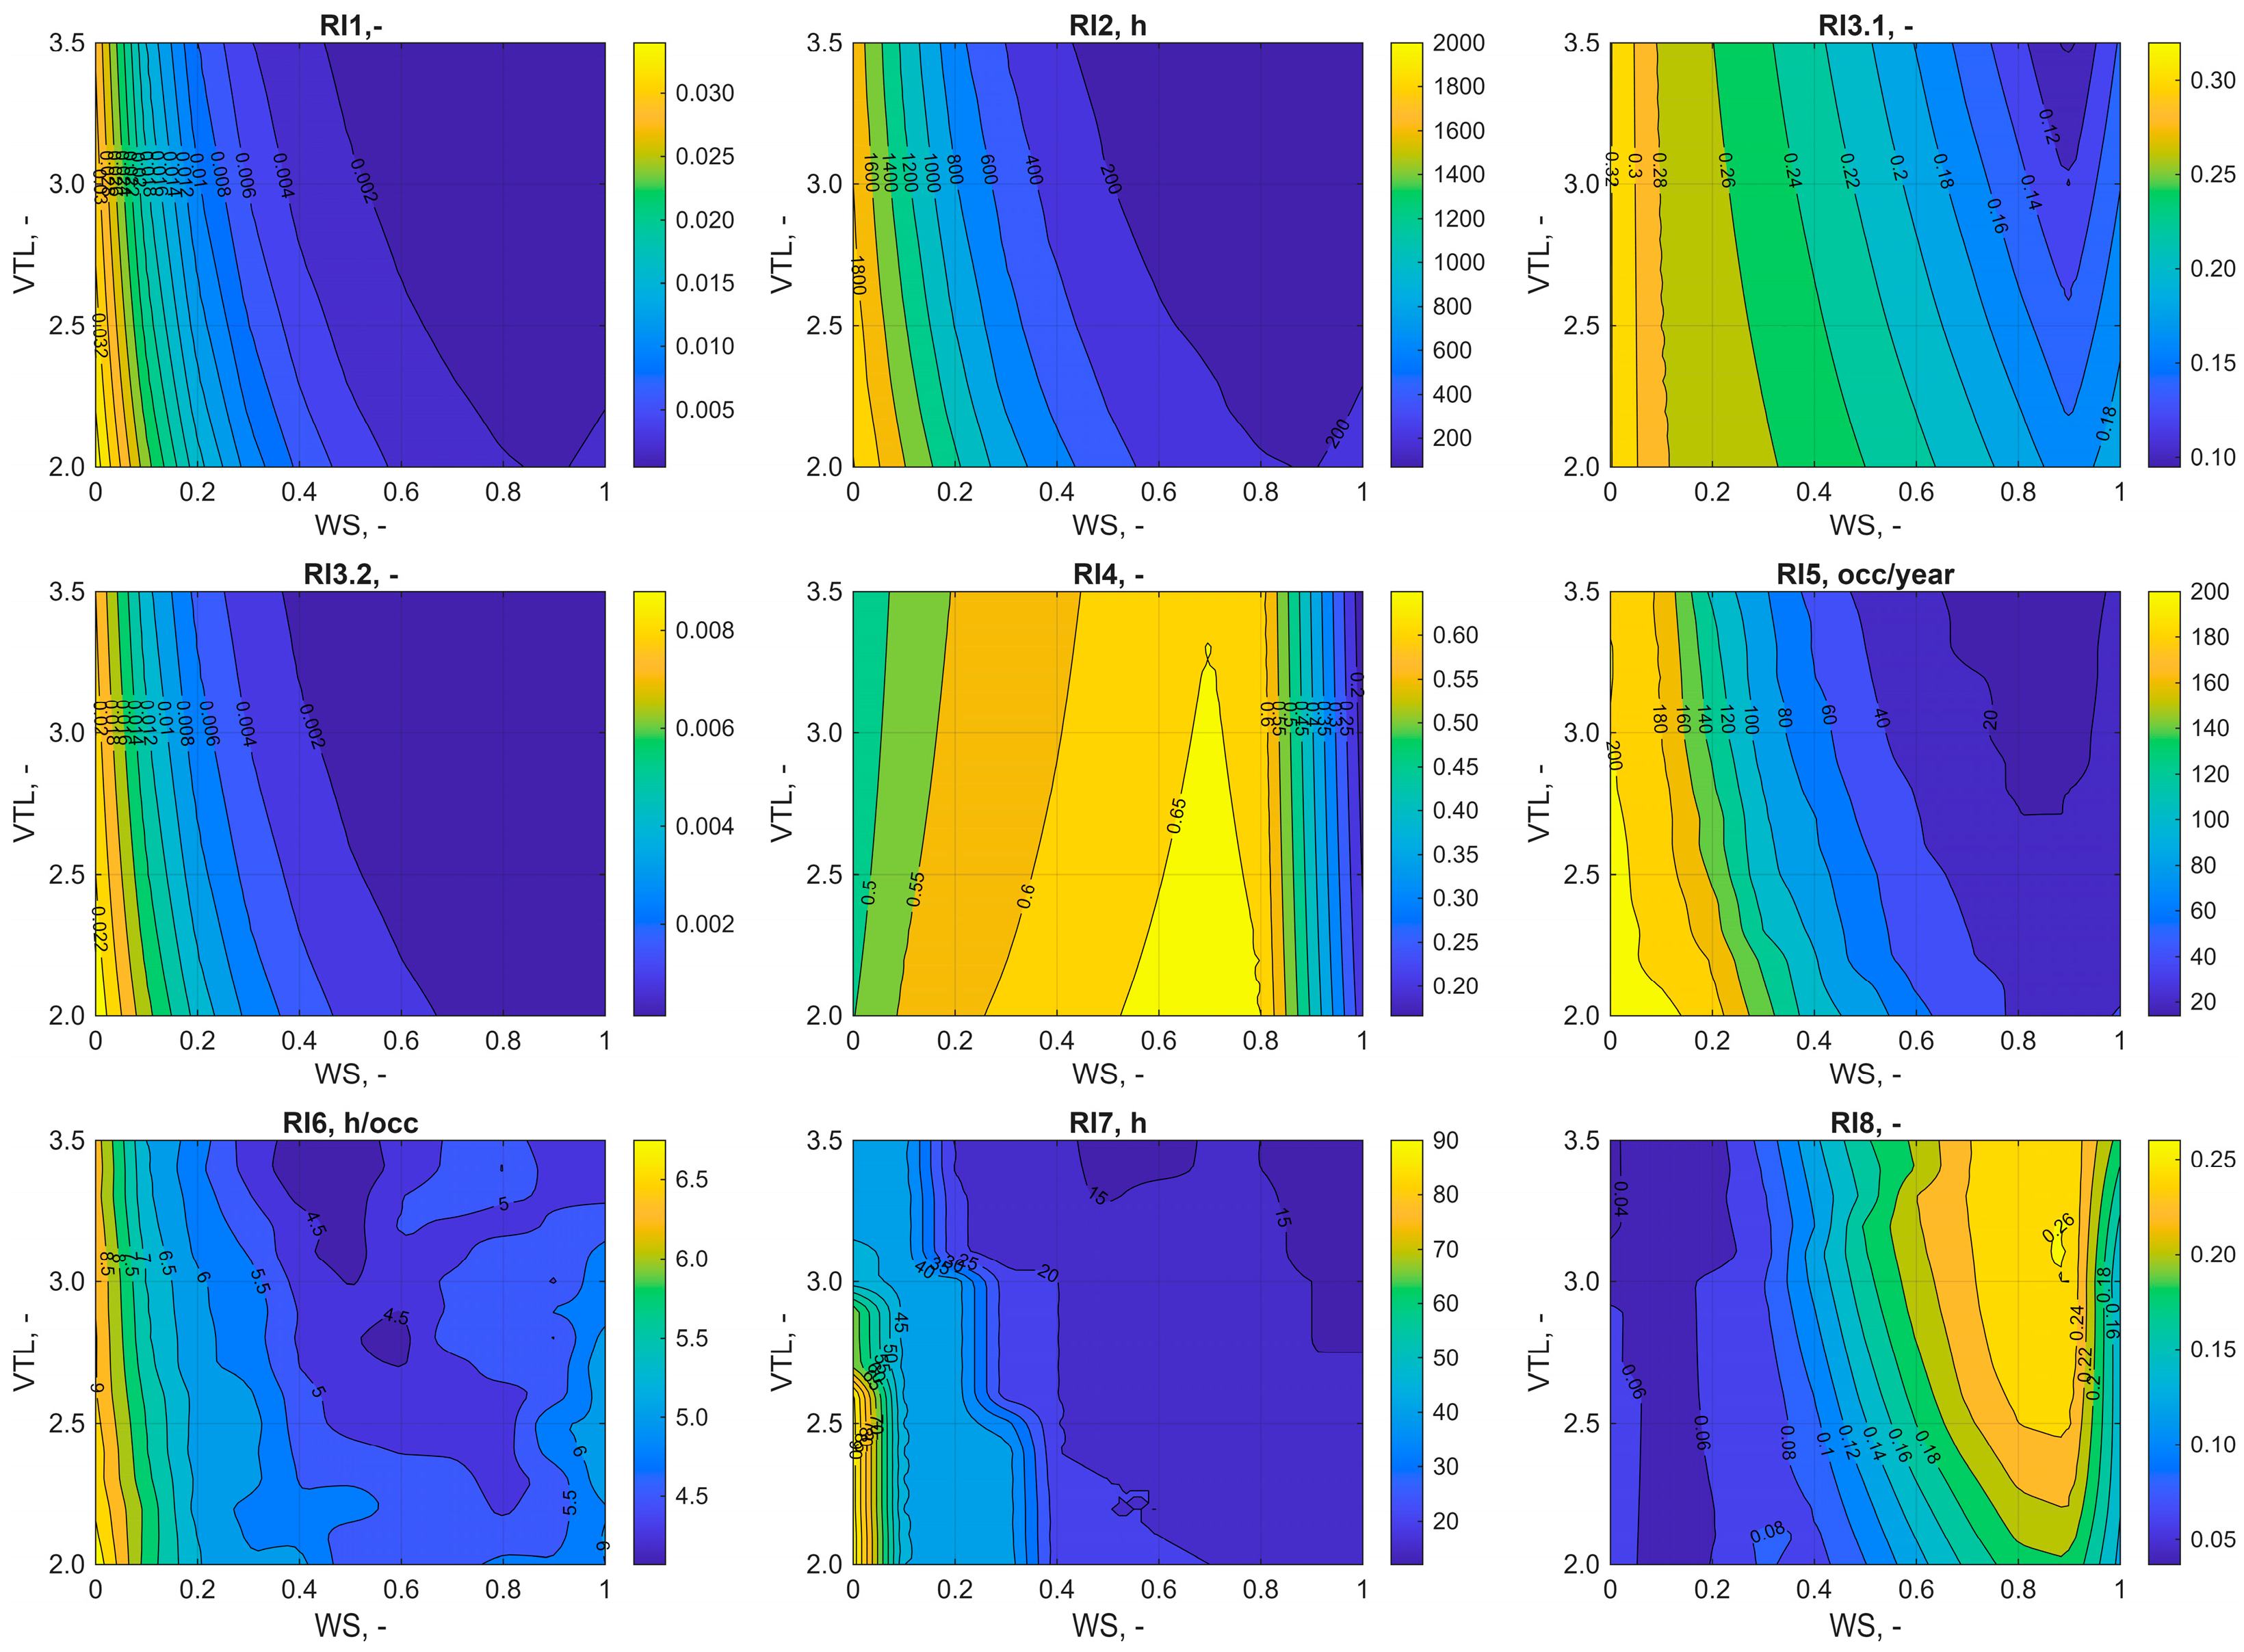
RI indicators for a fairly limited energy storage capacity in the system (
ESSL = 0.0001), which translates into a power capacity of approximately 2.43 GW and an energy capacity of 19.4 GWh. These parameters correspond to the ability to compensate for only a small part of daily demand fluctuations.
Figure 8 shows the
VUF,
FGUF, and
SUF indicators for the same system. It should be noted here that in the target net-zero system scenarios analyzed in the literature, the
VTL value quickly reaches a level above 3. The significant impact of wind power generation on unavailable sources is also clearly evident, with its dominant nature having a positive effect on reliability indicators (primarily, a higher capacity factor ensures the energy balance of the system) but also reducing the maximum (
RI3.1) and average (
RI3.2) capacity deficits.
In the case of the average capacity deficit, the wind share above approximately 0.65 reaches values below 66 MW, which suggests that this could be balanced with little effort, but thanks to RI3.1, it can be seen that the maximum reaches several gigawatts, which is why the system would not be able to balance itself without imports from outside the country. Regardless of this, even the system with the highest installed capacity among those analyzed has a highly unsatisfactory RI2 index value, reaching nearly 200 h of imbalance per year.
The number of deficits (RI5) also strongly depends on the generation structure in uncontrollable sources, and once again, the dominant share of wind sources is highlighted. However, if we look at RI6, which determines the average length of the deficit (in hours), it turns out that oversizing the wind share will not bring benefits, and balance is necessary.
When it comes to the longest episode of energy deficit (RI7), the dominance of solar sources is highly disadvantageous. RI8 again confirms, from the point of view of energy shortages, that there is an optimal share of wind generation (of course, the point will vary slightly depending on the climate of the year analyzed, demand profile, etc., but the range of 0.65–0.75 for the analyzed data seems to be a good choice). This is also the area with the largest capacity margin (RI4).
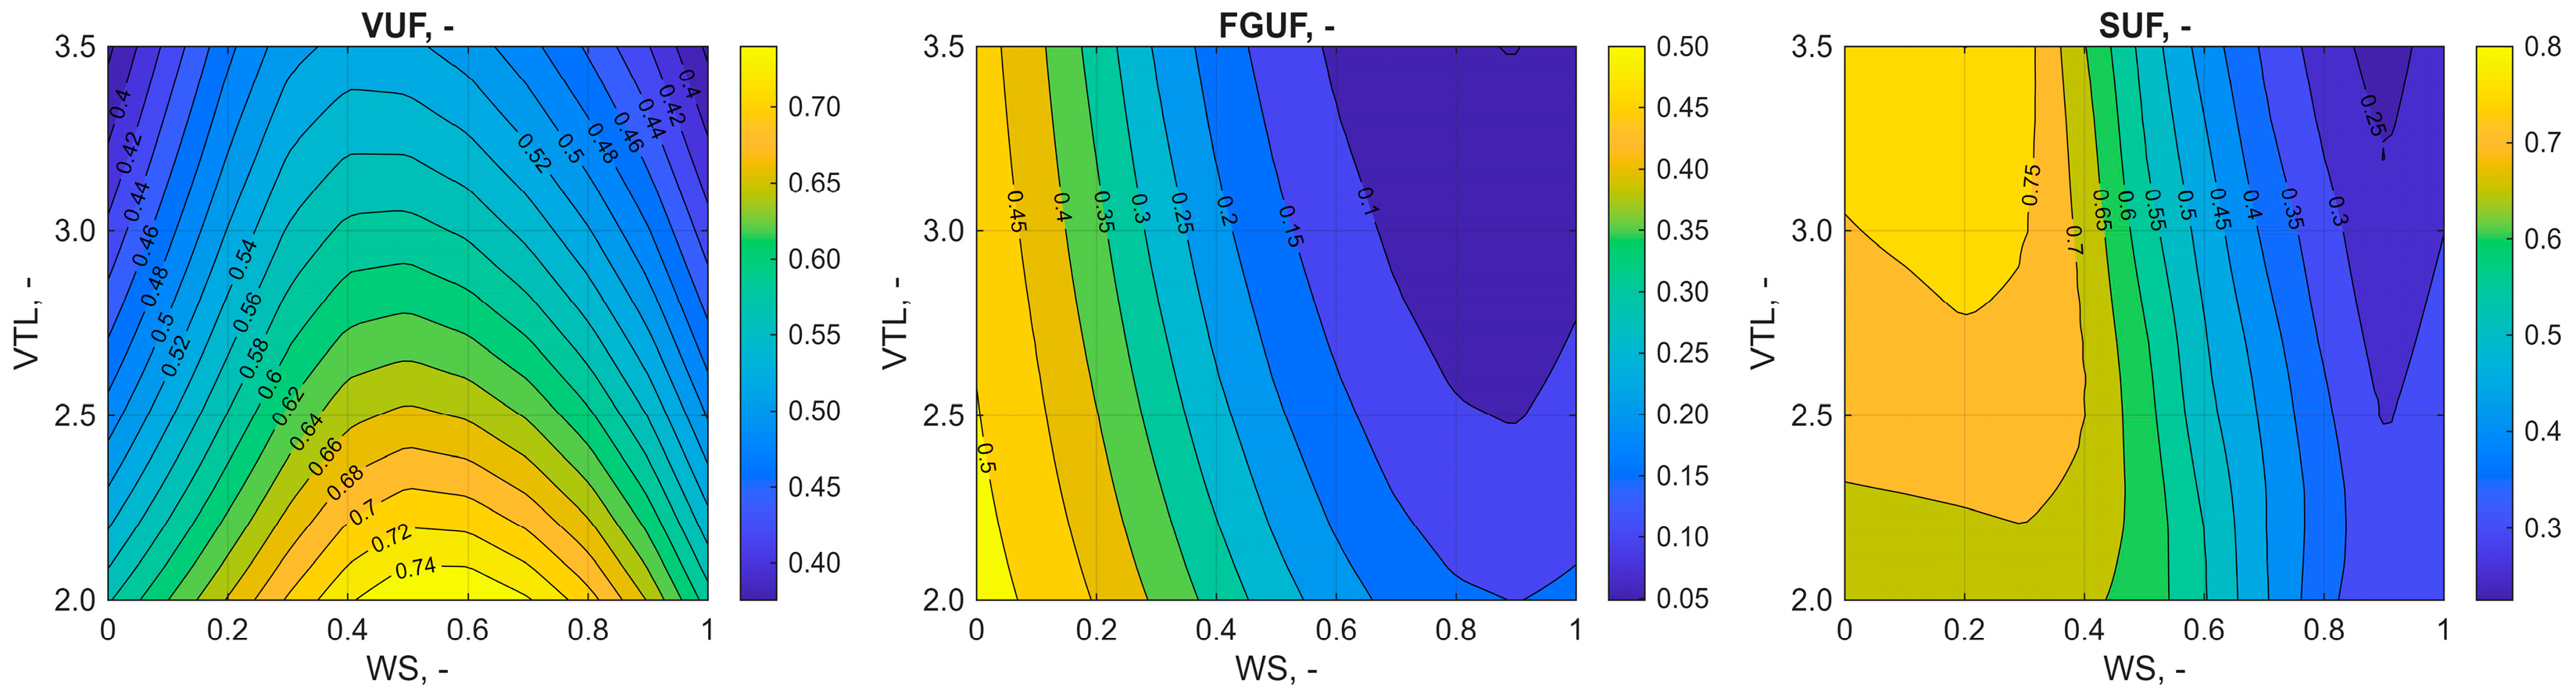
Figure 8 shows that, with an adequate installed capacity in non-dispatchable sources, the lowest use of flexible generation sources (
FGUF) was achieved for this range, even below 10%. In this range, the use of non-dispatchable sources can also be maximized—the
VUF indicator shows a strong tendency toward the optimum here. However, high
VTL values will require high curtailment. Maximizing the share of solar sources increases the degree of energy storage utilization (
SUF), which indicates a better match between the wind generation profile and the demand profile and an increase in the share of energy used directly.
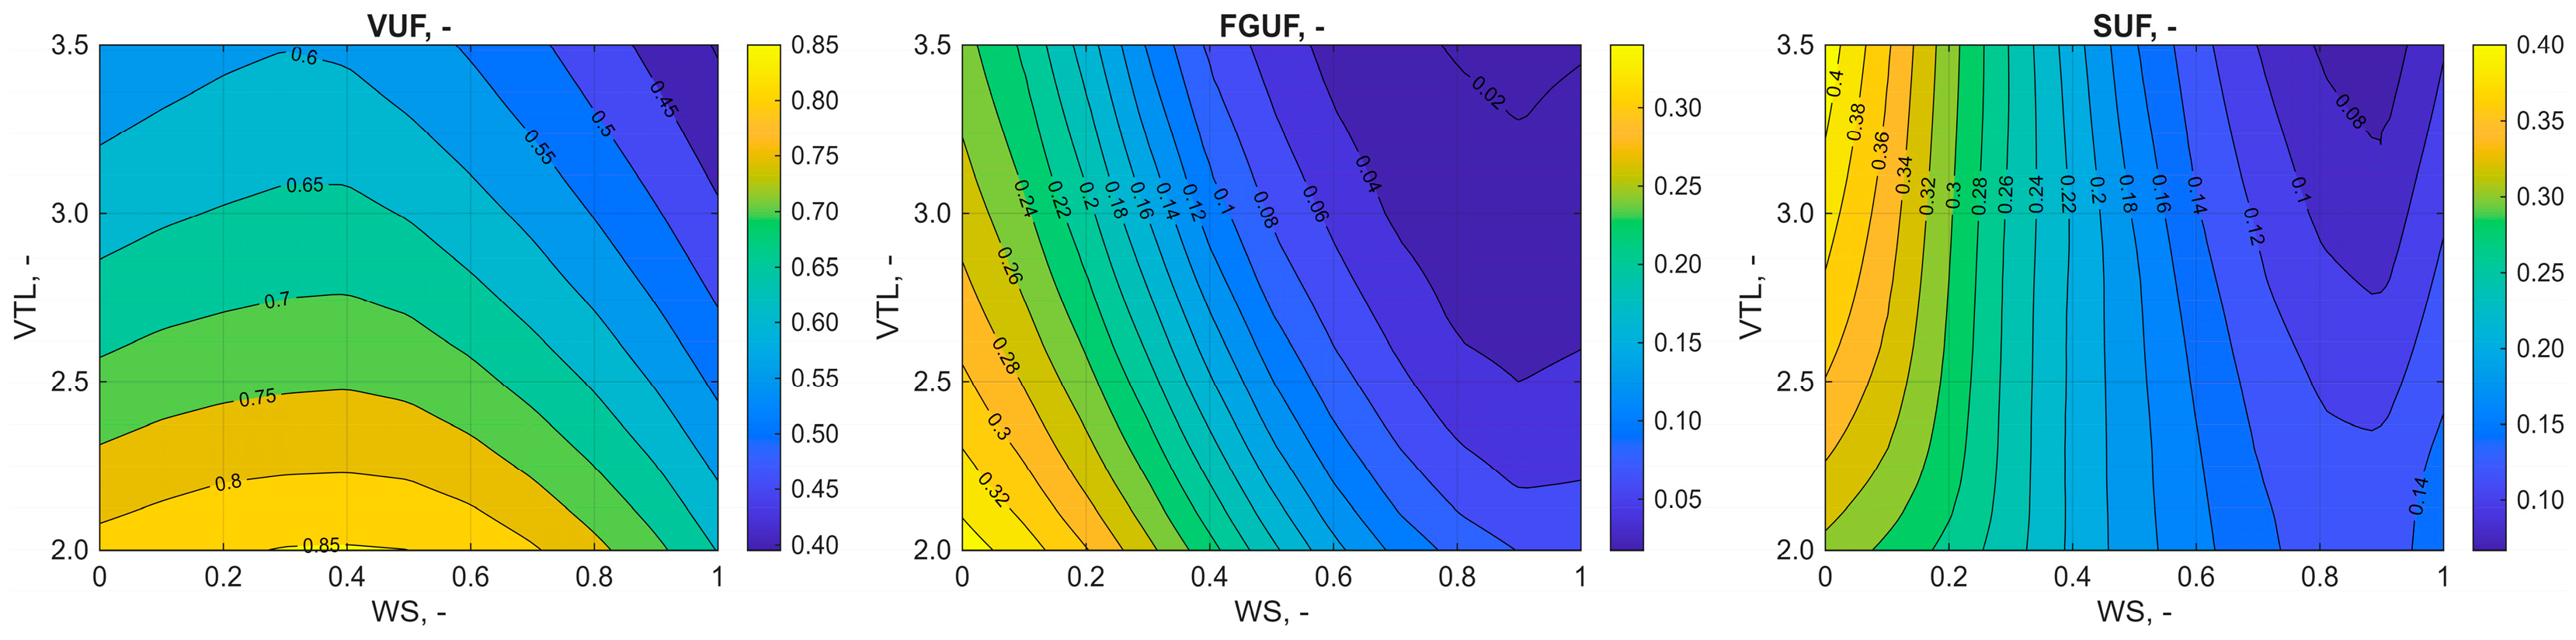
Figure 9 shows contour maps of system utilization indicators for a scenario with a moderate energy storage capacity (
ESSL = 0.001, corresponding to the storage energy capacity of 194 GWh and power capacity of 24.3 GW): variable generation utilization factor (
VUF), flexible generation utilization factor (
FGUF), and energy storage utilization factor (
SUF), as a function of the
VTL, and the share of wind energy in total VRE generation (
WS).
The VUF indicator reaches its highest values for moderate VTL values (≈2.0–2.6) and low and medium wind energy share (WS ≈ 0.2–0.5). This means that, within this range of parameters, the system is able to effectively integrate energy from VRE, using both direct consumption and energy storage. As VTL increases, a systematic decrease in VUF is observed, especially for high WS values, indicating a growing problem of energy surpluses and generation reduction with high VRE penetration. This phenomenon indicates that the system’s absorption capacity limit is being reached. The maximum utilization of renewable sources, together with a significant increase in storage capacity, has shifted towards a greater share of solar sources, which is due to the greater possibility of indirect (through storage) consumption of RES, as confirmed by the SUF indicator, which reaches its highest values for low wind share (WS < 0.3) and high VTL values. This means that intensive use of energy storage in systems is dominated by photovoltaics, where there are clear energy surpluses during daylight hours. As WS increases, SUF decreases, indicating a lower load on storage in systems with a higher share of wind energy.
The FGUF indicator decreases with an increase in WS and a decrease in VTL, which confirms that a higher share of wind energy and a moderate level of VRE are conducive to reducing the use of flexible fossil fuel-based sources. The lowest FGUF values occur in areas with high WS and moderate and high VTL, which indicates the most favorable operating conditions for the system in terms of reducing the demand for flexible (gas) generation. However, at very high VTL values, even a high share of wind does not completely eliminate the need to activate flexible sources, which confirms the existence of structural limitations in system balancing.
The analysis of the presented results indicates the existence of an optimal operating range for the system at moderate VTL values and a balanced VRE structure in which the use of renewable energy is maximized, the use of flexible sources is minimized, and energy storage is used efficiently. Outside this area, further increases in the VRE capacity led to diminishing system benefits, confirming that, even at ESSL = 0.001, the energy storage shifts but does not eliminate the effective penetration limit of non-dispatchable renewable sources.
The results of this study are consistent with broader theoretical discussions on the limits of renewable integration and system adequacy in high-VRE systems, e.g., [
14,
22,
29]. In line with previous research emphasizing the balancing of constraints and structural complementarity, the analysis confirms that increasing renewable penetration not only requires additional capacity but also an appropriate technological composition and coordination with firm generation and storage resources.