1. Introduction
In response to “carbon peaking” and “carbon neutrality” targets in China, distributed energy resources (DERs) such as wind power and photovoltaics have been expanding and becoming important components of actual power systems [
1,
2]. Meanwhile, massive user-side resources have been progressively transformed into controllable resources, driving the transition of a modern power system from “generation following load” to “generation-load interaction” [
3]. In this context, prosumers functioning as both electricity producers and consumers, such as load aggregators [
4], microgrids [
5], commercial buildings [
6], and smart parks [
7], have become a new type of participants in power system operation and electricity market trading [
8]. The term “prosumer” is a portmanteau derived from “producer” and “consumer”. Individual electricity users can transform from pure consumers into prosumers by installing power generation equipment for the self-production of electrical energy. The liberalization of electricity markets, coupled with the widespread adoption of distributed generation technologies, has accelerated this shift from pure consumers to prosumers.
However, the randomness and volatility of generation output from DERs within prosumers [
9,
10], coupled with the characteristics of small capacity and wide distribution, pose potential risks to power system security and stability [
11,
12]. In contrast to the traditional direct control mode of power systems, the distributed aggregation of prosumers by the VPP can simplify the operation and regulation mechanism of power systems and enhance overall system security and efficiency [
13,
14].
At present, extensive studies have focused on scheduling strategies and bidding models for the VPP with a single stakeholder [
15,
16]. However, with the expansion of the prosumer scale, multiple stakeholders may coexist within a VPP. Driven by individual rationality, everyone seeks to maximize their own profit, rendering traditional single-stakeholder optimal scheduling methods difficult to apply. Considering the above, existing studies have utilized game theory to analyze optimization strategies for VPPs with multiple stakeholders. In these studies, VPPs mainly adopt two control methods to balance the profits of different prosumers: One is the direct control of prosumers’ DERs by a given VPP, which participates in the electricity wholesale market to achieve power balance [
17]. This method aggregates prosumers into a single entity and performs unified optimization of all internal DERs. To balance the profits of various prosumers, the VPP needs to distribute the profit difference generated before and after aggregation. In [
18], the VPP improves the Shapley value method by incorporating prediction accuracy, historical reputation, and carbon emissions to redistribute the cooperative surplus. In [
19], based on Nash bargaining theory, the VPP distributes the cooperative surplus by considering the marginal contributions of each prosumer to the VPP. The other control method is that the VPP guides prosumers to indirectly control DERs through price signals; it establishes an internal electricity retail market to trade with prosumers and participates in the wholesale market to address residual imbalances [
17]. In [
20], the internal optimal electricity prices within a VPP are determined by engaging in a Stackelberg game with prosumers.
Between these two control methods, the former aggregates prosumers as a single entity, allowing the VPP to perform unified optimization of all internal DERs to achieve power balance in the wholesale market. This method exhibits global optimization capability, minimizing total operating cost when demands and renewable generation are deterministic. In contrast, the latter establishes an internal retail market where the VPP uses price signals to incentivize prosumers to adjust their DERs. This approach, often modeled as a Stackelberg game, respects prosumers’ individual electricity consumption preferences. Crucially, each method has inherent limitations when used in isolation. Relying solely on direct control fails to fully exploit DER scheduling potential and ignores individual preference of prosumers. Conversely, using only price guidance cannot guarantee the global minimum operating cost for the VPP. Therefore, integrating the strengths of both methods—the global cost optimization of direct control and the incentive flexibility of price guidance—presents a promising but under-explored direction.
In addition, to ensure the practical applicability of the strategy, it is essential to consider the volatility of renewable generation and loads. For prediction errors of a single stakeholder, refs. [
21,
22] resort to the conditional value at risk (CvaR) method and stochastic variable modeling separately to reduce their adverse effects. However, these methods entail exorbitant computational complexity in multi-stakeholder systems. Ref. [
23] develops a two-stage scheduling strategy to mitigate the aforementioned impacts for multiple stakeholders, but direct control measures are adopted in both day-ahead and intraday scheduling phases, failing to account for the extra influences introduced by prosumers’ energy usage preferences in real-world situations.
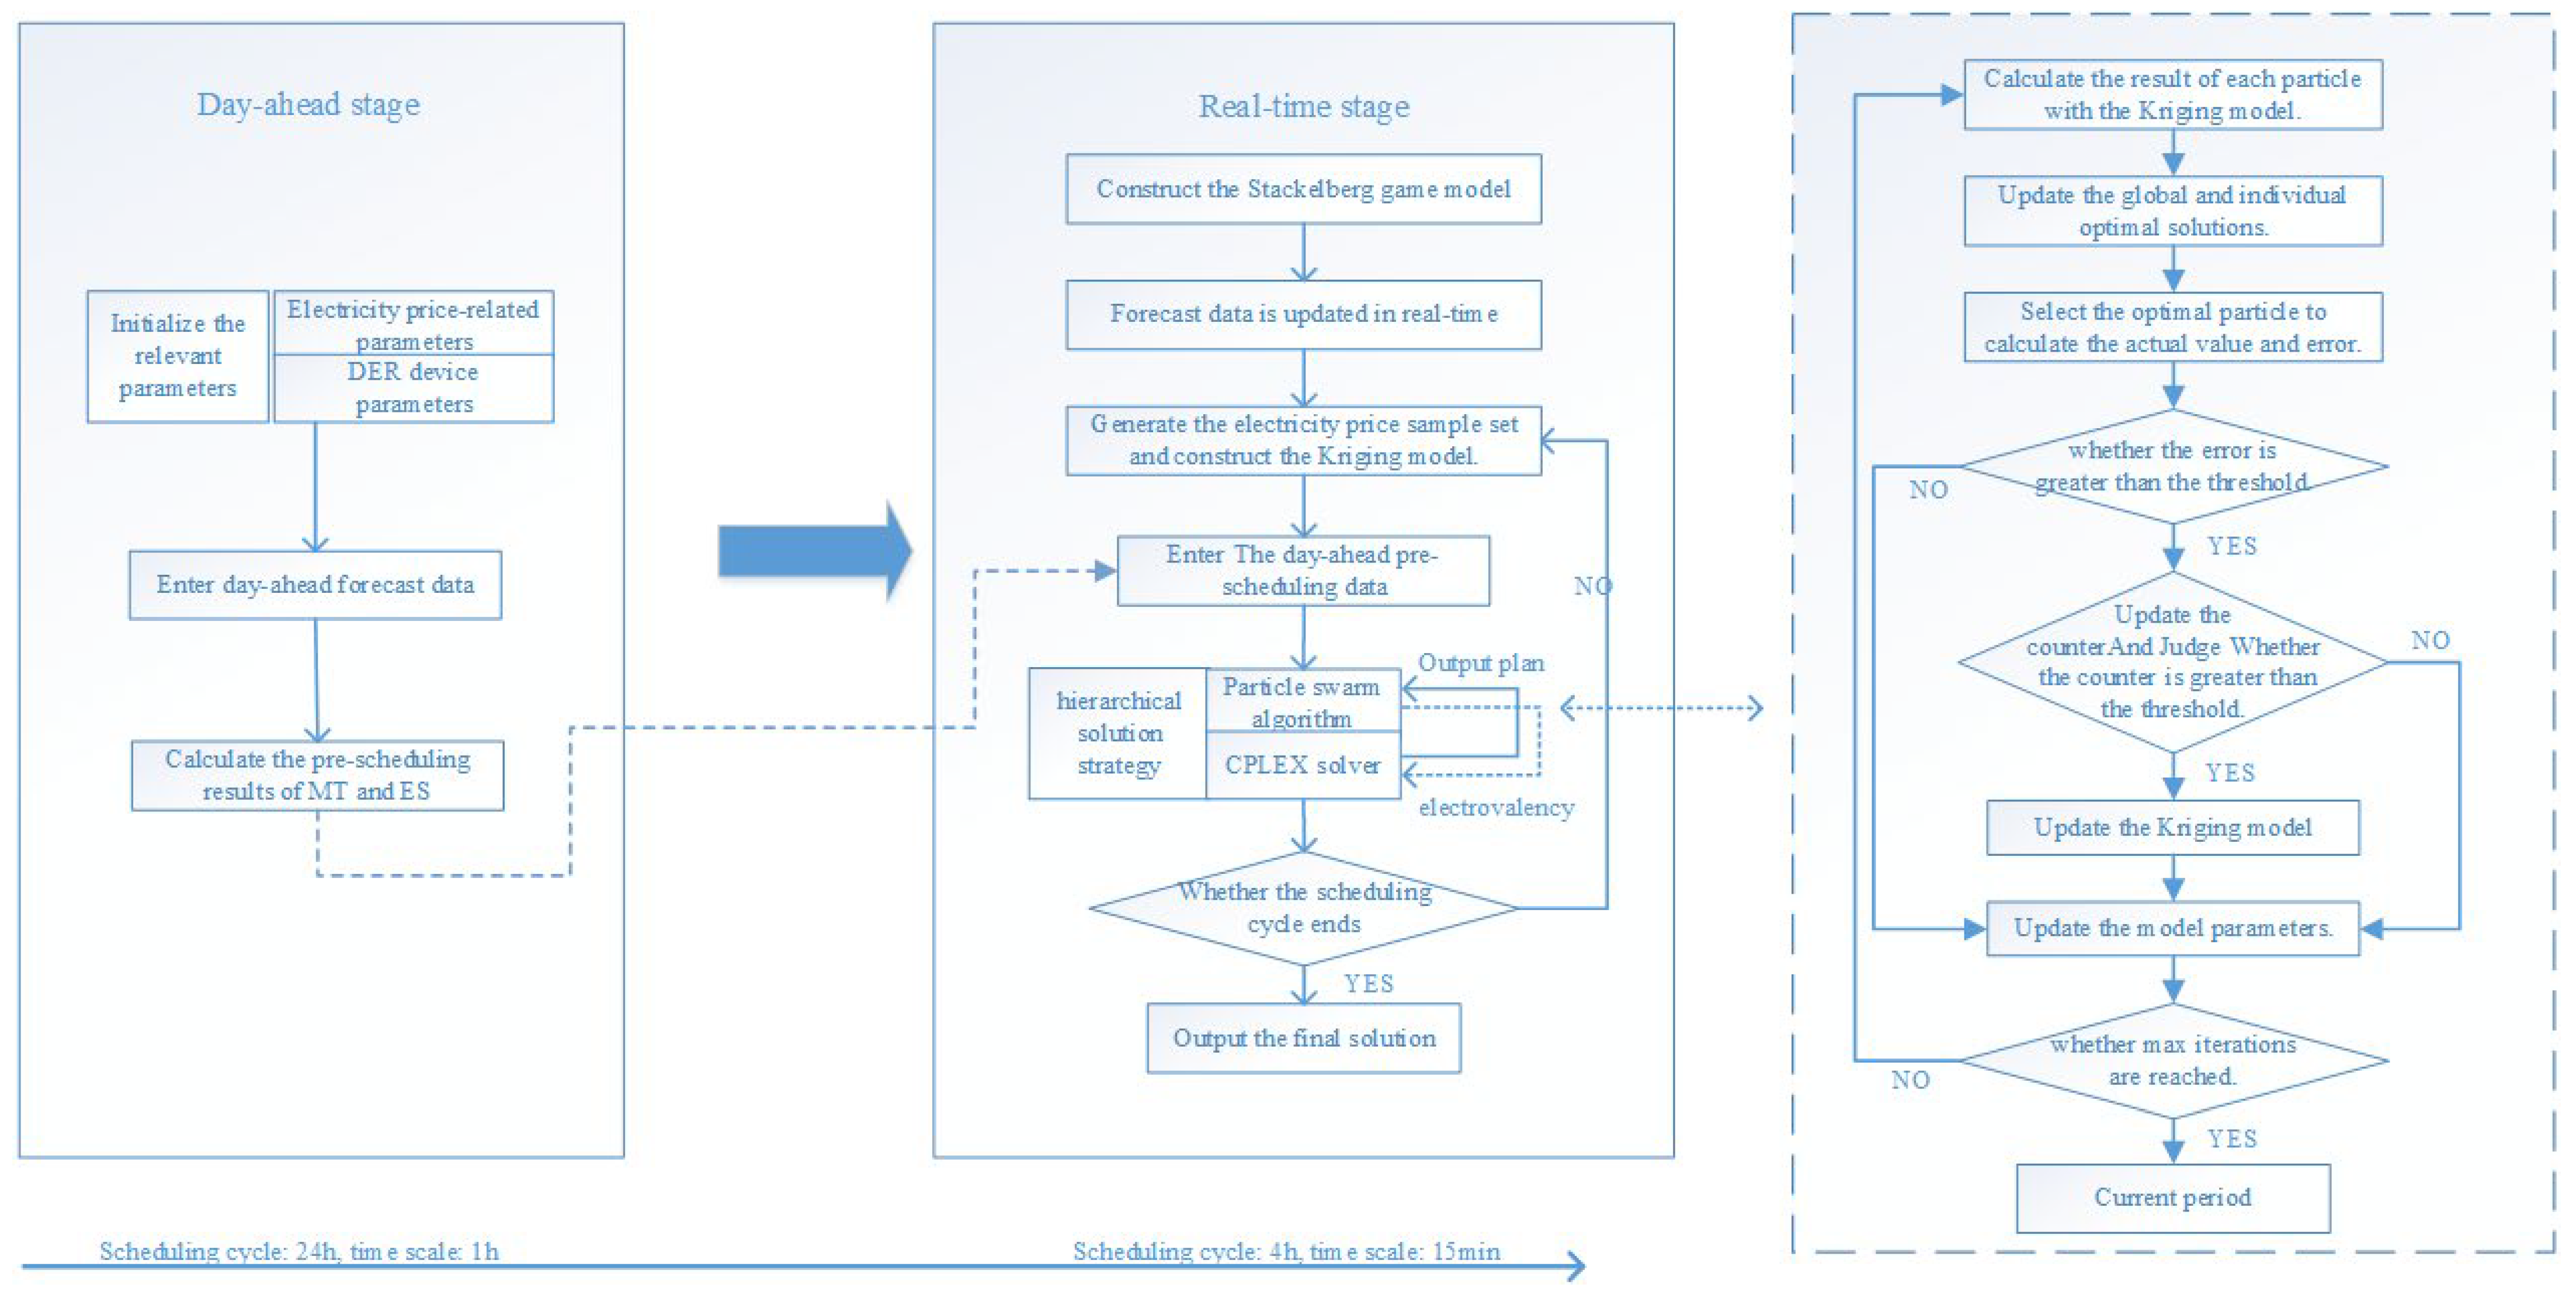
To bridge these identified research gaps, this study introduces an innovative two-stage operational optimization framework that strategically integrates both control paradigms. During the day-ahead phase, the proposed methodology capitalizes on the global optimization capabilities of direct control for preliminary scheduling. Subsequently, the intraday phase implements a Stackelberg game formulation with dynamic pricing mechanisms to guide prosumer responses, thereby harnessing DERs’ operational flexibility while accommodating individual preference structures.
Solving this model poses significant challenges. The day-ahead model is a Mixed-Integer Quadratic Programming (MIQP) problem, addressed using the CPLEX solver. In contrast, the intraday model embodies a bilevel optimization structure, recognized for its intrinsic complexity. Conventional methods like the Karush–Kuhn–Tucker (KKT) conditions [
24] impose stringent model constraints. However, intelligent algorithms [
25,
26] suffer from low efficiency due to frequent calls to prosumers’ models. To balance solution efficiency and accuracy, this paper adopts the PSO for hierarchical solution and introduces the Kriging model to enhance solution efficiency.
Simulation results of a sample VPP composed of three prosumers show that the proposed strategy can effectively balance operating costs and prosumers’ energy usage preferences. Moreover, the employed optimization algorithms can significantly improve the solving efficiency without compromising accuracy.
The main contributions of this paper are summarized as follows:
- 1.
An integrated two-stage framework that combines direct control and price-based incentives, enabling both global economic efficiency and prosumer autonomy.
- 2.
An efficient bilevel solution method using PSO with a Kriging surrogate model, which significantly reduces the number of calls to the lower-level model compared with the traditional PSO.
The structure is organized in the following manner: First, the background and objectives of this paper are briefly described. Secondly, a two-stage scheduling strategy for VPP and prosumers is developed. Subsequently, the solution attained for the two-stage optimization model is analyzed in detail. The advantages of the proposed strategy are next demonstrated through comparisons with other scheduling strategies. Finally, conclusions and prospects are given.
2. Day-Ahead Stage Global Optimization Model
To enhance the utilization efficiency of DERs, this paper initially conducts pre-scheduling for prosumers in the first stage to determine operating schedules for the micro-turbine (MT) and energy storage (ES). The MT’s startup and shutdown operations are constrained by temporal limitations, while the state of charge (SOC) of ES displays time-dependent coupling characteristics. Prosumers will encounter multiple difficulties when optimizing MT and ES in the intraday stage. Consequently, establishing ES and MT operational plans during the day-ahead phase proves more advantageous than exclusively optimizing them in the intraday stage. Taking the ES as an example, if the operation plan of the ES is not optimized in the day-ahead stage, its charging and discharging quantities will depend entirely on the information of the current period, which will impede efficient utilization of the ES. For instance, when a prosumer is without electricity, ES may be fully discharged due to high load demand in the current period. However, discharging electricity in subsequent periods might be more economically beneficial. In light of this, this paper conducts pre-scheduling and formulates the operational plans of the ES and the MT in the first stage.
The prosumer model in this work includes an MT, a photovoltaic generation (PV), a wind turbine (WT), an ES, and an interruptible load (IL). The day-ahead scheduling timeframe covers 24 h with 1-h intervals. At this stage, VPP formulates operation plans for the DERs of the prosumers, aiming to reduce operating costs. The costs in this paper mainly include the fuel and start-up/shutdown expense of MT, the charging cost and discharging compensation of ES, the transaction cost with the market, and the compensation of IL, which can be formulated as
where the superscript “DA” identifies day-ahead stage variables;
N indicates the overall number of prosumers within the VPP;
T denotes the scheduling period;
is the operational expenses of the MT of prosumer; and
i ,
and
are the coefficients of the quadratic, linear, and constant terms of the fuel cost, respectively.
is the output of the MT;
and
are the startup and shutdown states, which can only be “0” or “1”; and
and
are the shutdown and startup costs of the MT, respectively.
is the operating cost of the ES;
and
respectively represent the expense coefficients for charging and discharging of ES;
and
are the charging and discharging power, respectively;
is the compensation expense of the IL of prosumer
i at time
t;
is the compensation expense coefficient in the VPP;
is the amount of load shedding of prosumer
i.
represents the transaction cost between the VPP and the electricity wholesale market;
and
are the purchase price and the sale price of the wholesale market, respectively;
is the quantity of electricity sold by the VPP;
is the quantity of electricity that the VPP purchases from the market.
To ensure the stability of the VPP in the first stage, the model is also required to respect the following constraints:
where
is the transaction volumes between the VPP and the market;
represents a binary variable, where the value of “1” signifies electricity procurement by the VPP from the external grid, and the value of “0” represents VPP sells electricity to external system;
and
are the forecasted generation output of the PV and the WT during the first stage.
is the predicted data of the load;
and
are the up-ramping and down-ramping capabilities of the MT, respectively;
indicates the state of charge of the ES;
and
denote the charging and discharging efficiencies of the ES, respectively;
is the residual battery energy;
is the maximum ratio of the load that can be cut.
3. Intraday Stage Rolling Optimization Model
On the one hand, the approach in which the VPP directly controls DERs overlooks the energy consumption preferences of prosumers. On the other hand, the fixed price formulated by the market is related to the supply–demand relationship of the entire power system, which makes it difficult to reasonably guide prosumers with large differences in characteristics during the intraday stage. To address these limitations, this study establishes a Stackelberg game framework between VPP and prosumers to guide prosumers in formulating their operational plans through dynamic internal electricity prices in the second stage.
During the intraday stage, the scheduling horizon covers 4 h with a 15-min time interval. Within this phase, a Stackelberg game is conducted between the VPP and prosumers. Driven by their distinct objectives, the VPP formulates internal electricity prices to maximize profits, while prosumers determine the output plans of DERs to minimize operational costs. The VPP gives top priority to fulfilling prosumers’ electricity demand and regulates energy balance via transactions in the wholesale market.
3.1. Upper-Level Optimization Model
The VPP formulates the sale price
and purchase price
with the goal of maximizing profits, and its objective functions
can be expressed as
where the superscript “ID” indicates that it is in the intraday stage;
is the amount of electricity that the VPP sells to prosumer
i, and
is the amount of electricity that the VPP purchases from prosumer
i.
3.2. Lower-Level Optimization Model
Prosumers formulate output plans of DERs by incorporating day-ahead optimization and aiming to minimize operating costs based on internal electricity prices, and its objective function
is expressed as
where
is the transaction cost between the prosumer
i and the VPP;
and
are the adjustment penalty coefficients for the MT and the ES, respectively.
To ensure intraday transaction stability, the following operational constraints must be respected. These constraints are defined as follows:
where Equation (24) prevents prosumers from arbitraging with the wholesale market and ensures their willingness to trade with the VPP by limiting internal prices within market price boundaries. Assuming that prosumers are rational, they will inevitably trade with the VPP to maximize their own interests. This constraint ensures that VPP internal transactions be consistently more economically attractive compared with the external market, thereby eliminating arbitrage opportunities. Equation (25) is intended to ensure that the traded power be balanced. Equation (27) is designed to ensure that the energy balance of prosumers be maintained.
3.3. Existence of the Stackelberg Equilibrium
The profit of the VPP depends on the established prices and the transacted power with the prosumers. Generally, a larger spread between the purchase and sale prices or a higher transacted power leads to a greater profit for the VPP, but the spread between internal purchase and sale prices tends to be inversely proportional to the transaction volumes. Specifically, a higher internal selling price deters prosumers from purchasing electricity from the VPP, while a lower internal buying price discourages them from selling electricity to the VPP. It is observed that there is a Stackelberg game between prosumers and the VPP. To balance the objectives of multiple parties in the game process, prosumers and the VPP need to consider the response behavior of each other and identify Stackelberg equilibrium solutions as operational outcomes.
For the Stackelberg game established during the intraday stage, the Nash solution is defined as follows: within the entire set of optimizing strategies, if there exists an electricity price set and the corresponding transaction volumes strategy that simultaneously respect both and , then the strategy denotes the Nash solution of the Stackelberg game, where is the strategy of other prosumers except prosumer i. Under this strategy, both the VPP and prosumers achieve their optimal objectives, and neither can gain additional benefits by independently changing their own strategy, nor have an incentive to change the strategy.
The proof of the existence of the Stackelberg solution comprises three parts: the strategy spaces of the VPP and prosumers are non-empty, compact, and convex sets; given a price strategy of the VPP, an equilibrium solution exists for prosumers; given an operational strategy of prosumers, an optimal solution also exists for the VPP [
27,
28].
All constraints applicable to the VPP and DERs are linear, which means the strategy sets of all participants are non-empty, compact and convex; the VPP’s objective function is linear and hence quasiconvex; in the prosumers’ objective function, and are linear functions, while , , and are nonlinear functions with positive quadratic coefficients, and the prosumers’ objective function is also quasiconvex. Therefore, optimal solutions exist for both the VPP and prosumers under the given conditions. In conclusion, the Stackelberg game established in this paper satisfies all conditions for the existence of the Nash solution.
5. Case Studies
5.1. System Description
The VPP framework established in this work incorporates three prosumers. Each prosumer is equipped with a set of MT, PV, WT, ES, and IL. We made significant distinctions between the equipment parameters and prediction data of the three prosumers to simulate the characteristics of the uneven distribution of DERs, and the operation parameters of DERs are shown in
Table 1. Through a series of comprehensive comparative experiments, the optimal parameters of the PSO are determined as follows: the population size is 30, the maximum number of iterations is 100, the cognitive learning factor and social learning factor are both 0.5, and the inertia weight is set to 2. It should be noted that the aforementioned parameters have all passed the sensitivity analysis.
During the day-ahead stage, forecasting data for WT, PV, and load are generated using the Monte Carlo simulation method [
30]. During the intraday stage, the actual data of WT and PV are obtained by adding white noise with a standard deviation of 0.02 to the day-ahead forecast data, while the actual load data are obtained by adding white noise with a standard deviation of 0.002 to the day-ahead predictions [
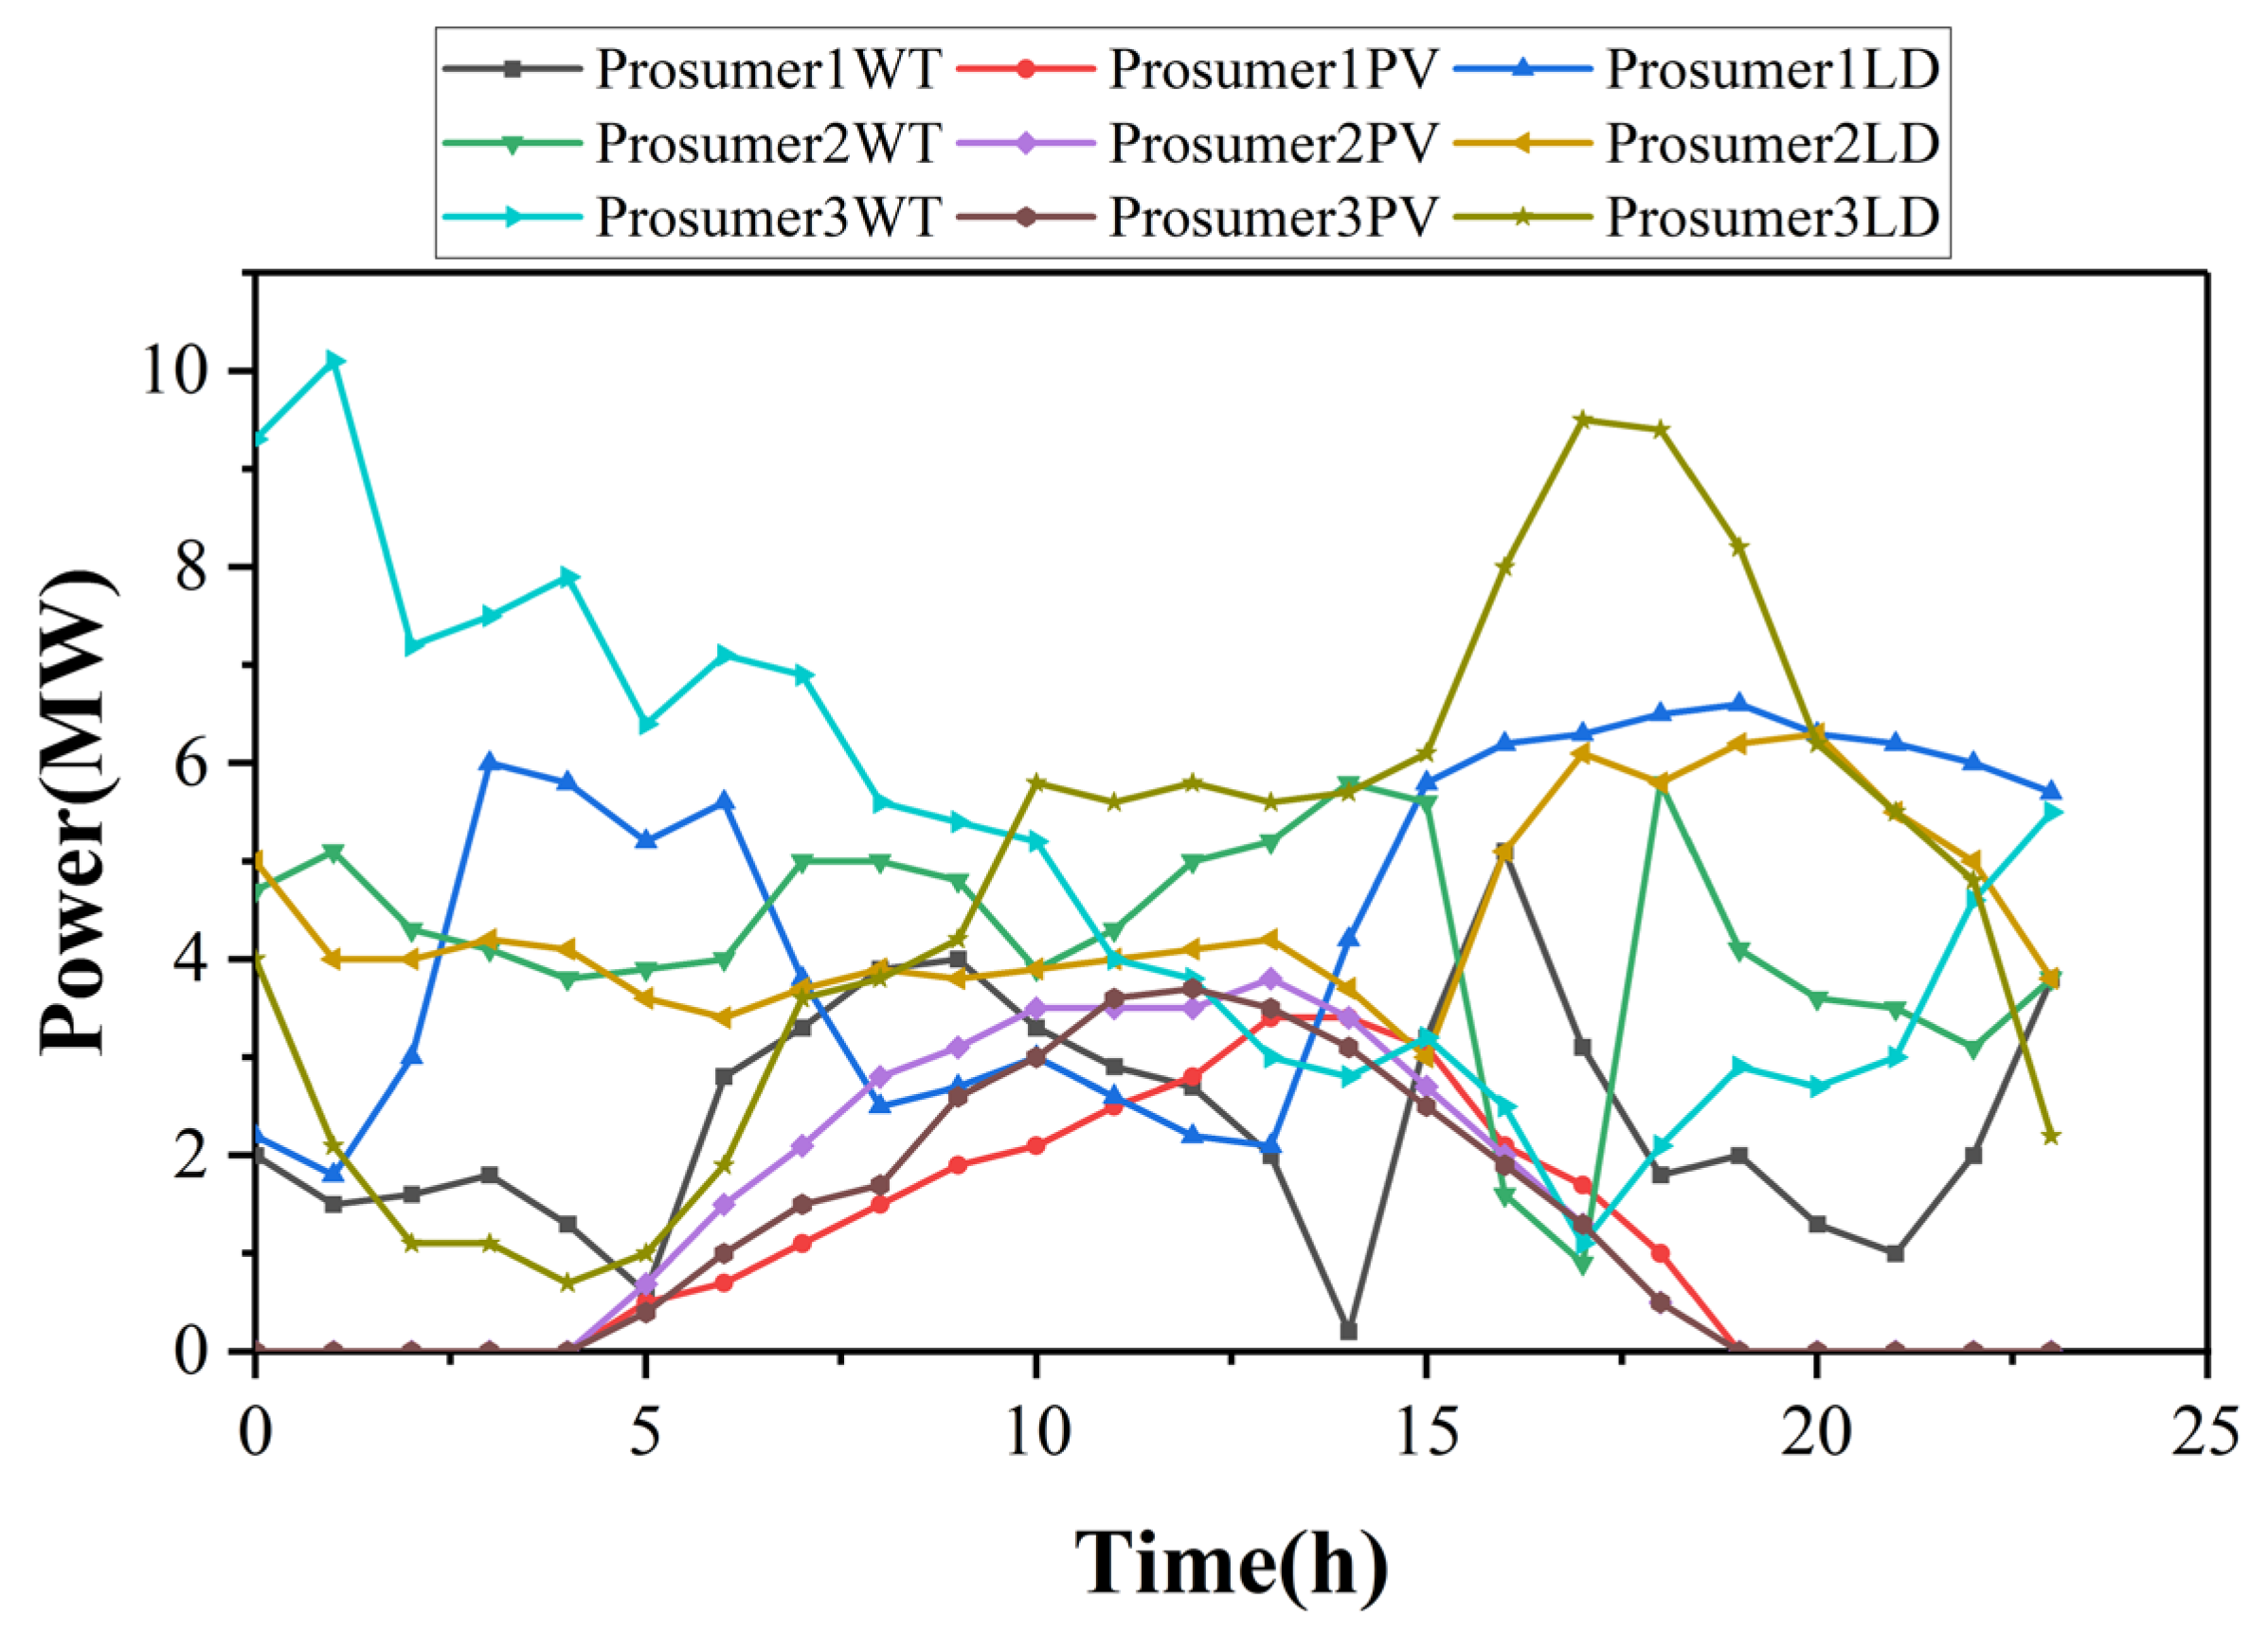
31]. The day-ahead forecast profiles are illustrated in
Figure 2.
5.2. Comparison of Scheduling Strategies
To investigate the impact of different prosumer behaviors on the output plans of DERs, this paper proposes three operation strategies as follows:
Strategy 1: Each prosumer optimizes its own DER schedule independently, without any coordination or sharing information among prosumers.
Strategy 2: After joining the VPP, the DERs of all prosumers are directly controlled by the VPP, which performs centralized optimization to minimize the total operating cost.
Strategy 3: After joining the VPP, prosumers participate in a Stackelberg game with the VPP. The VPP publishes internal purchase and sale prices, and prosumers respond by optimizing their DER schedules according to dynamic prices.
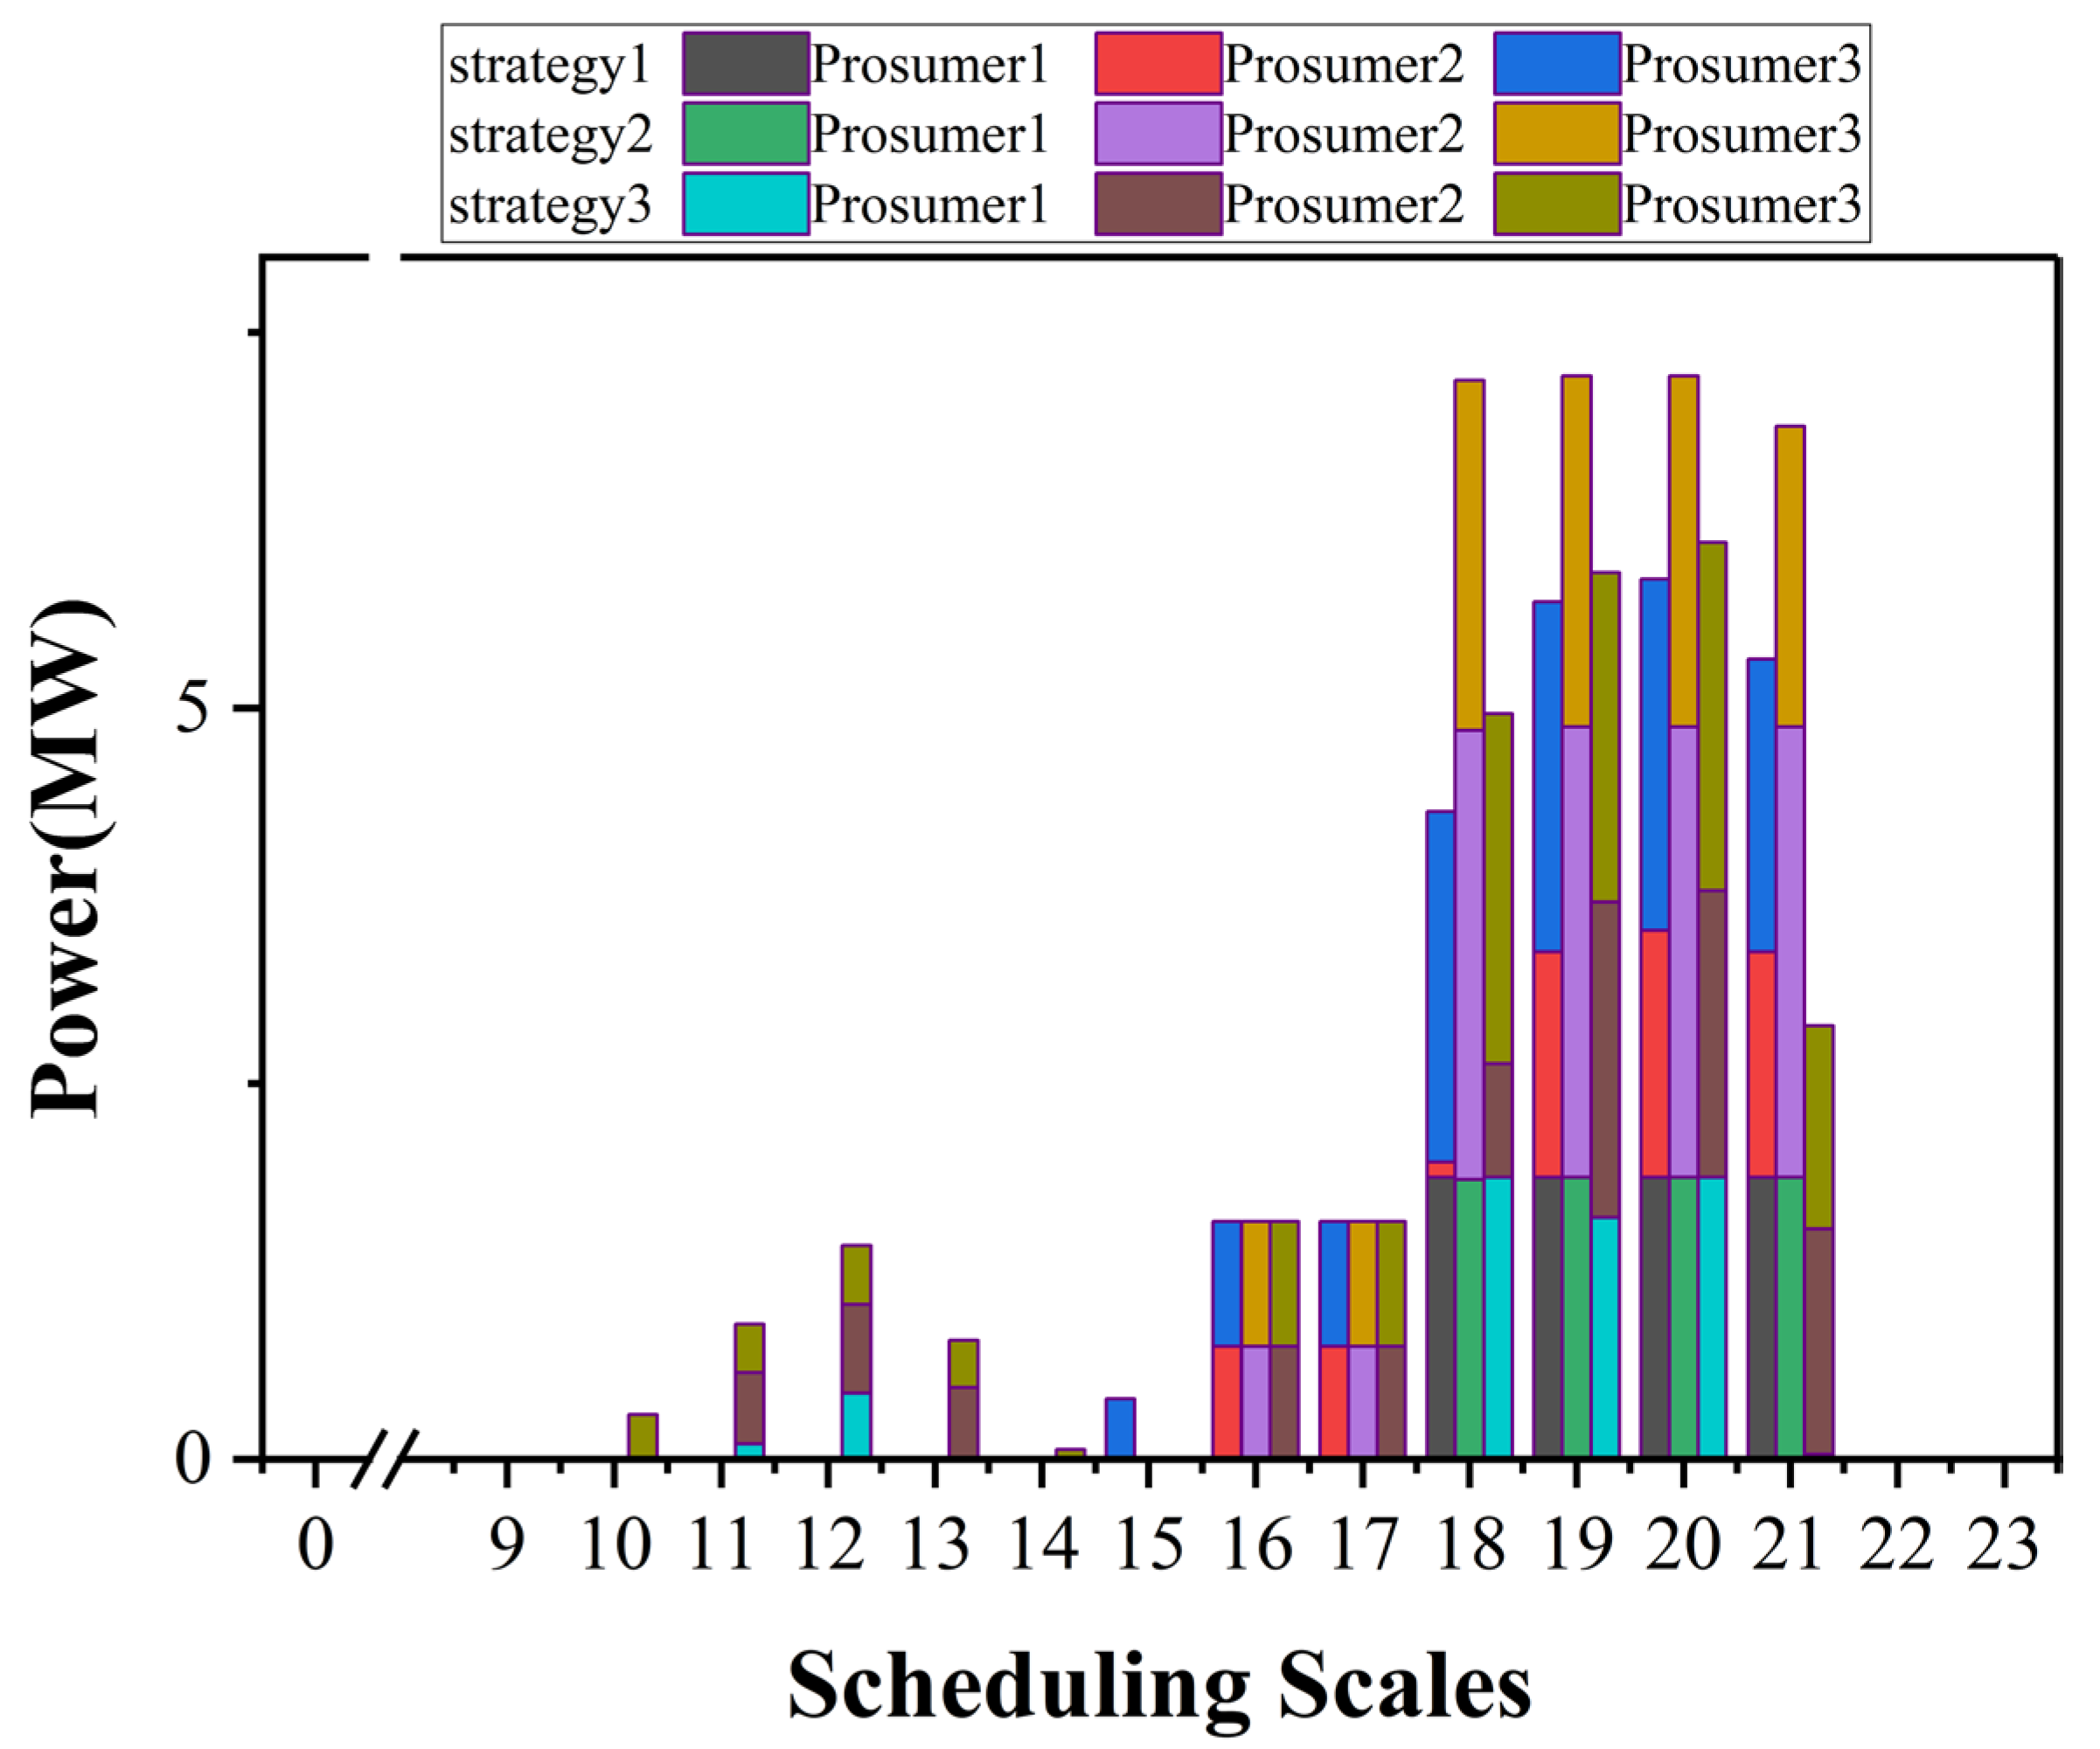
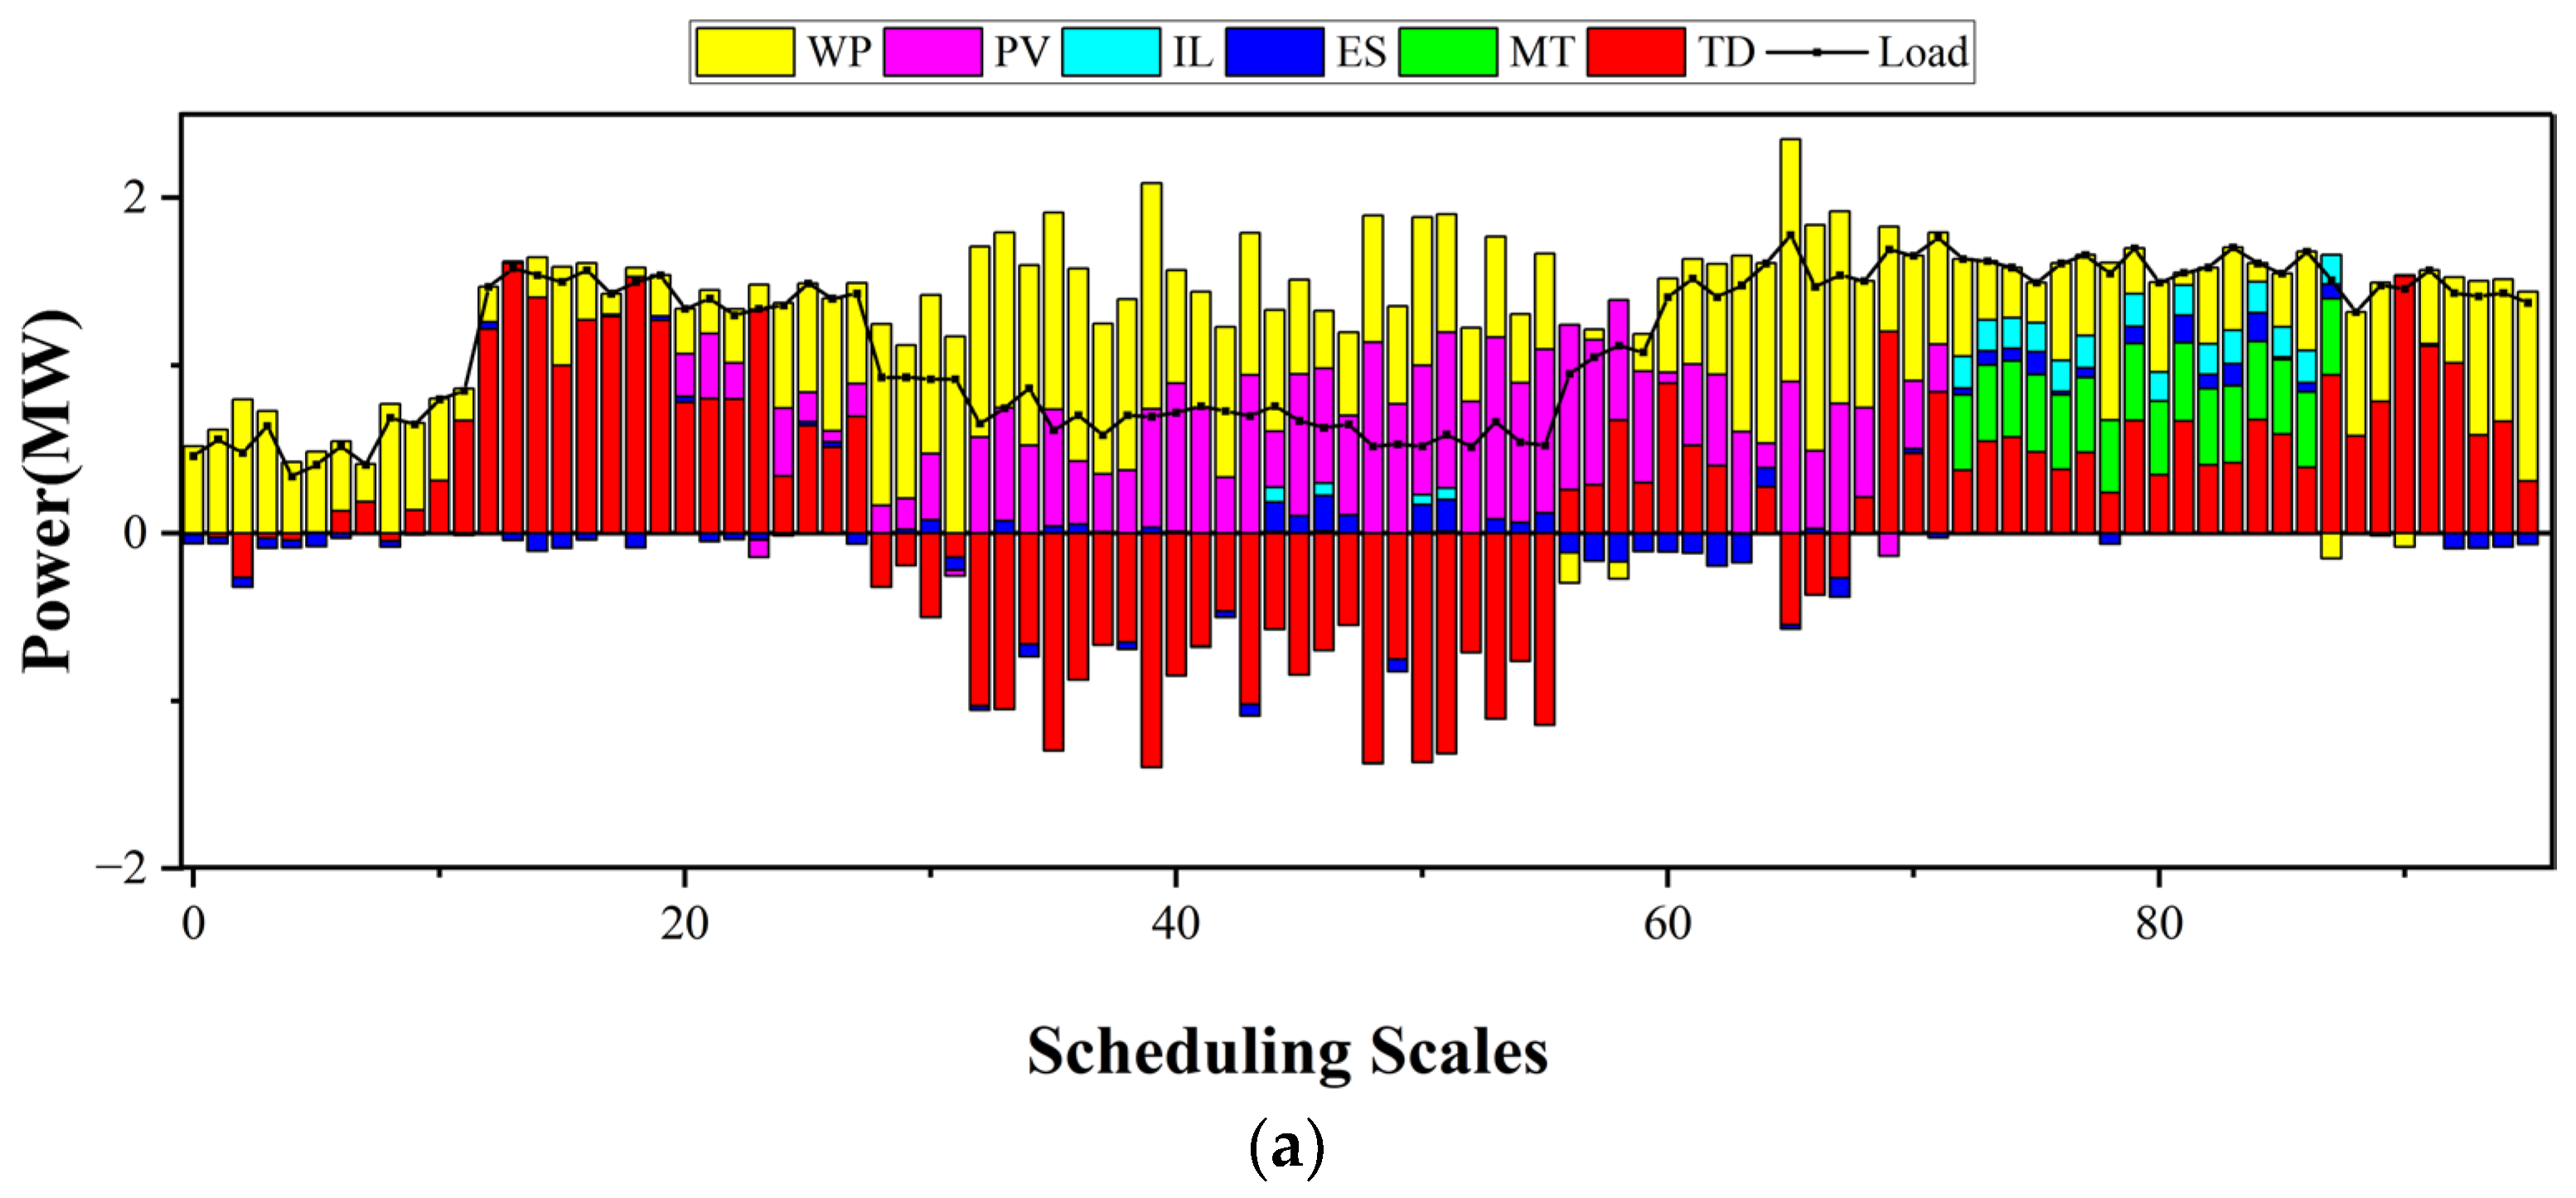
The day-ahead scheduling plan for all prosumers under Strategy 2 is depicted in
Figure 3,while the optimization results of the MT and the ES in the first stage under three strategies are shown in
Figure 4 and
Figure 5.
From 00:00 to 15:00, prosumers primarily utilize PV, WT, and ES to meet load requirement, and the VPP remains in a power surplus. It is evident that the states of ES align with the energy status of each prosumer when prosumers operate independently under Strategy 1 and Strategy 3. Under Strategy 2, where prosumers are dispatched by the VPP, the states of ES correspond to the energy status of the cluster. From 15:00 to 22:00, the significant reduction in generation output from the PV leads to prosumers relying on the WT, the ES, and the MT to satisfy load demand, and the cluster transforms into a power deficit and requires purchasing electricity from the wholesale market.
Strategy 1 lacks interconnections among prosumers, while Strategy 3 allows prosumers to optimize based on their own costs in decision making. Consequently, the operation plans are unable to take full advantage of the complementarity among prosumers with different operational characteristics during this timeframe. In contrast, under Strategy 2, prosumers are directly controlled by the VPP, which enables full leverage of the quadratic function characteristic of MT costs: within a certain range, the average cost decreases with the increase in output; thus, the overall output of MT in Strategy 2 is relatively higher.
In the day-ahead stage, Strategy 1 is characterized by mutually independent prosumers, which prevents the exploitation of complementarity among prosumers with different operational characteristics. Strategy 3 can explore the scheduling potential of the ES through dynamic electricity pricing, while the ES serves as critical equipment during the intraday stage for mitigating forecasting errors. Excessive utilization of the ES during the day-ahead stage will reduce its available controllable capacity for the intraday stage and increase operational regulation difficulty. Consequently, Strategy 2 is employed for day-ahead pre-dispatch.
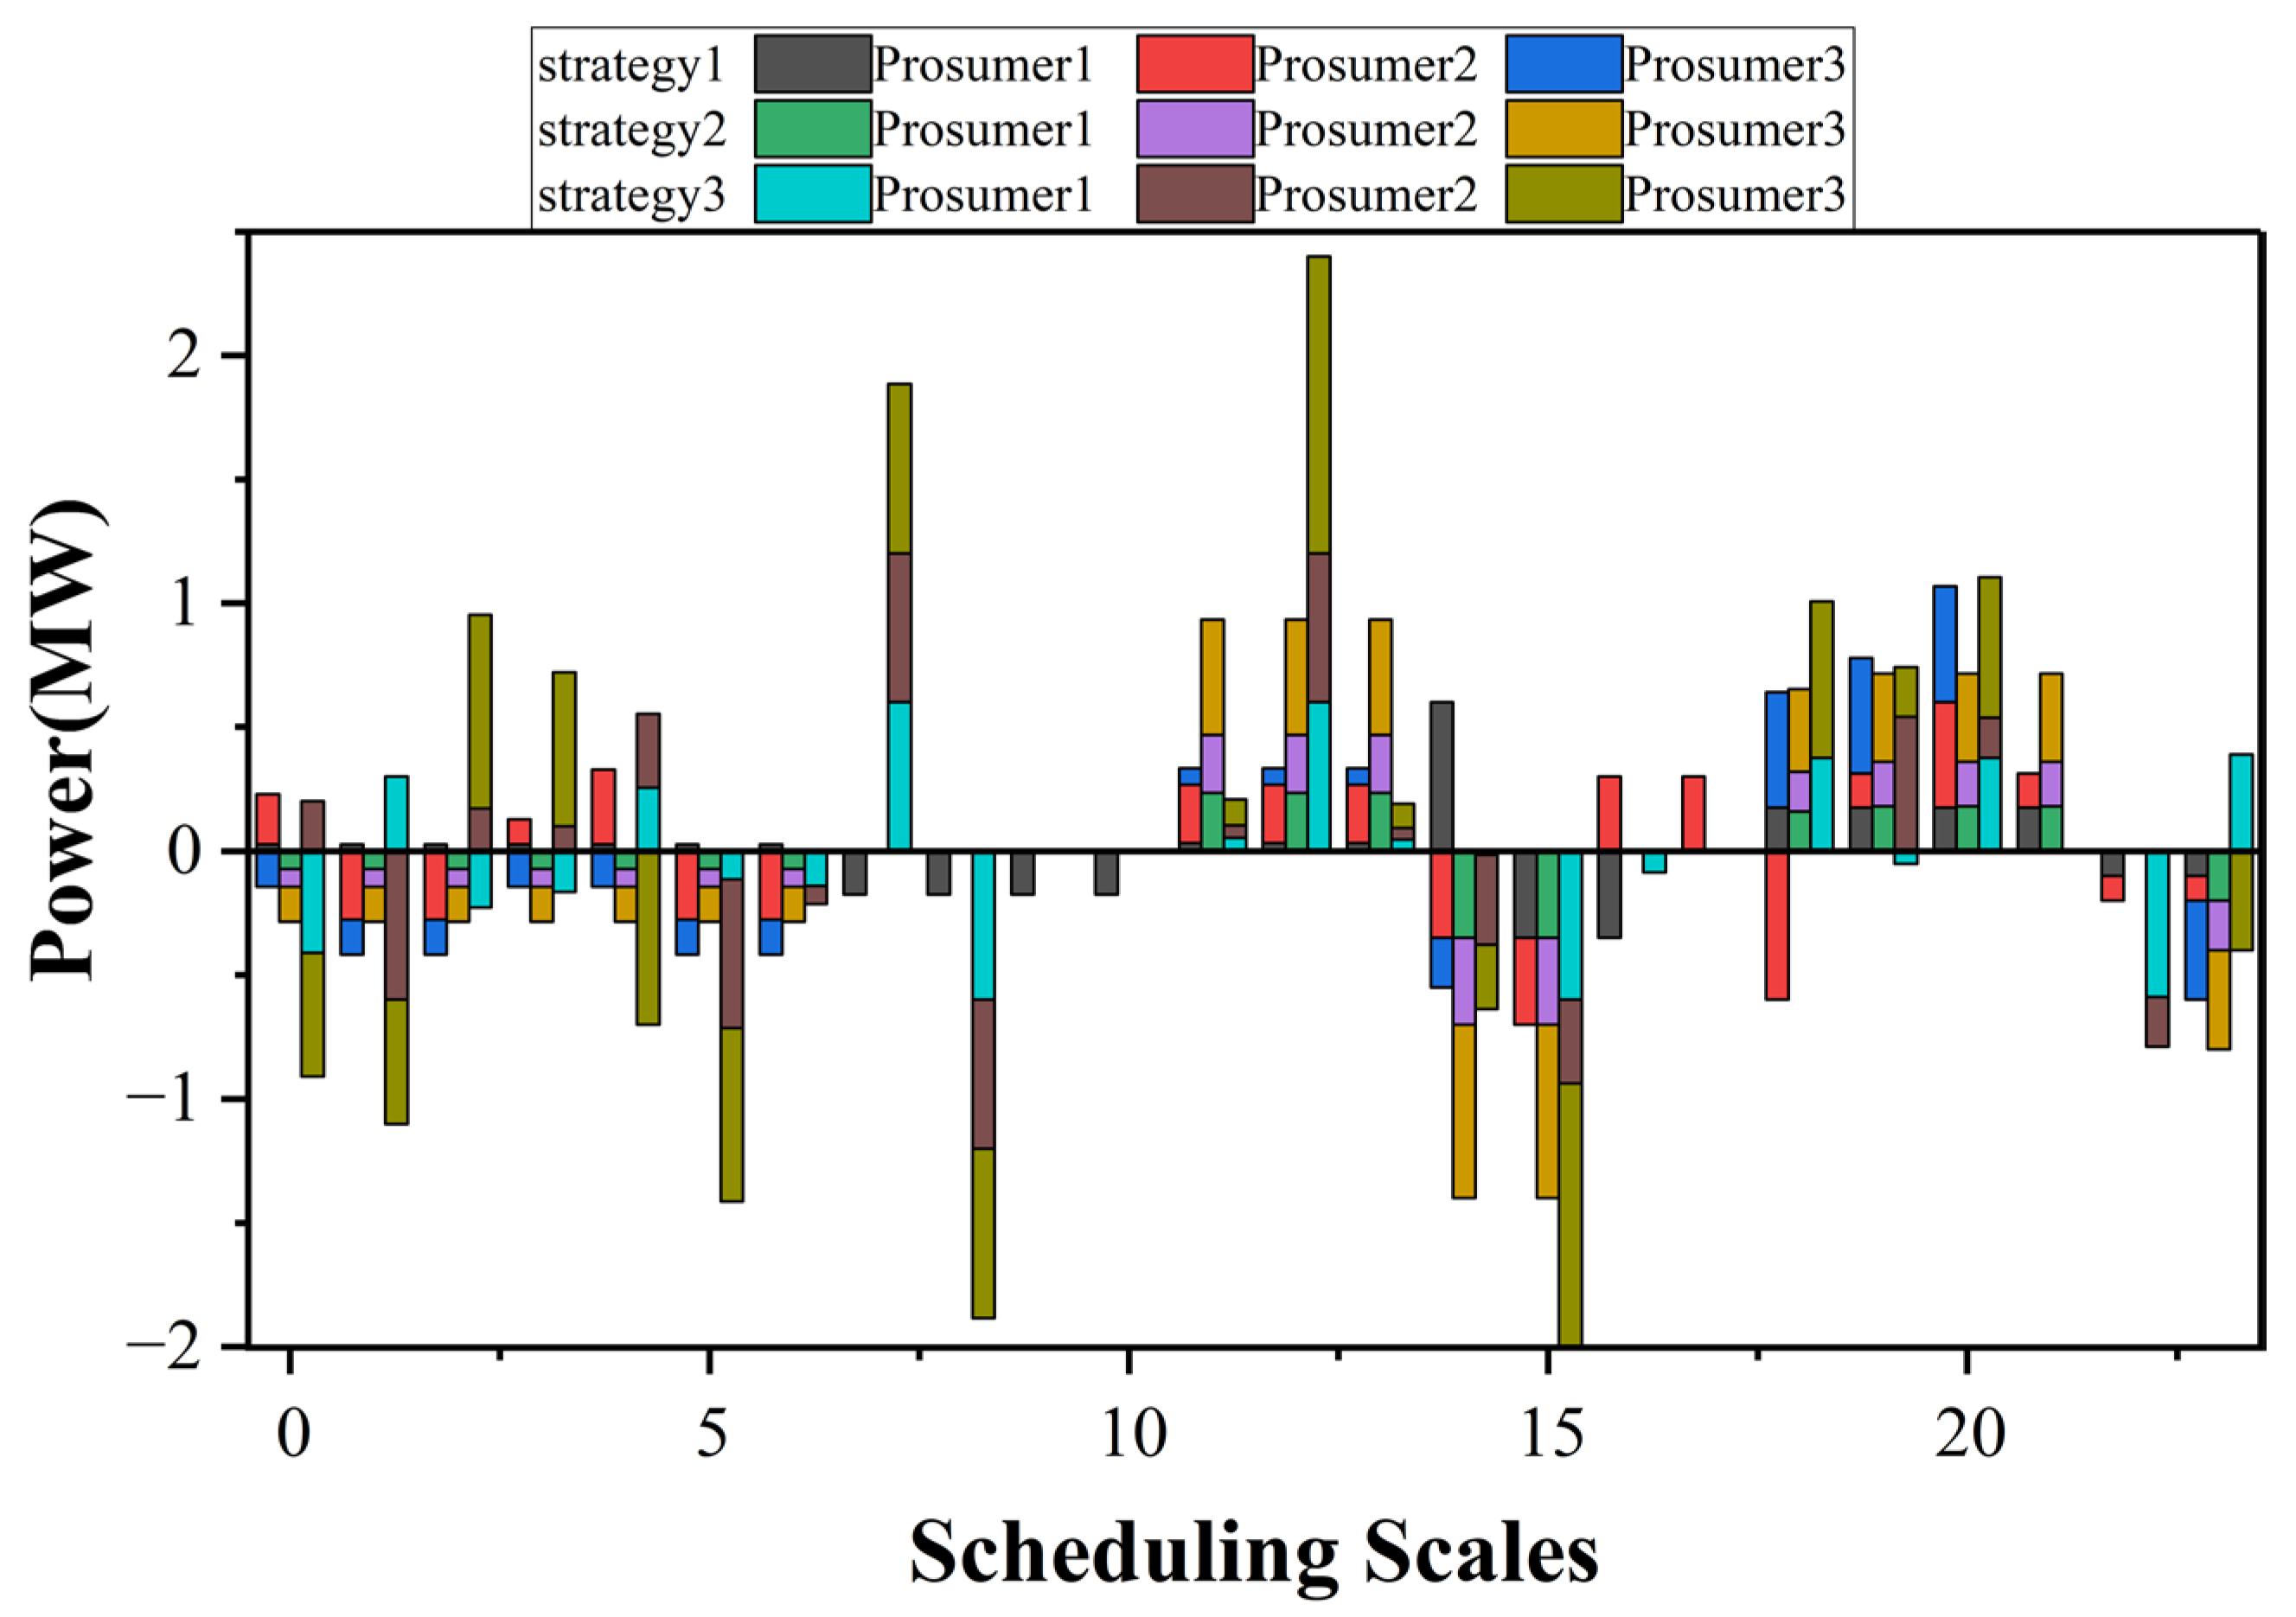
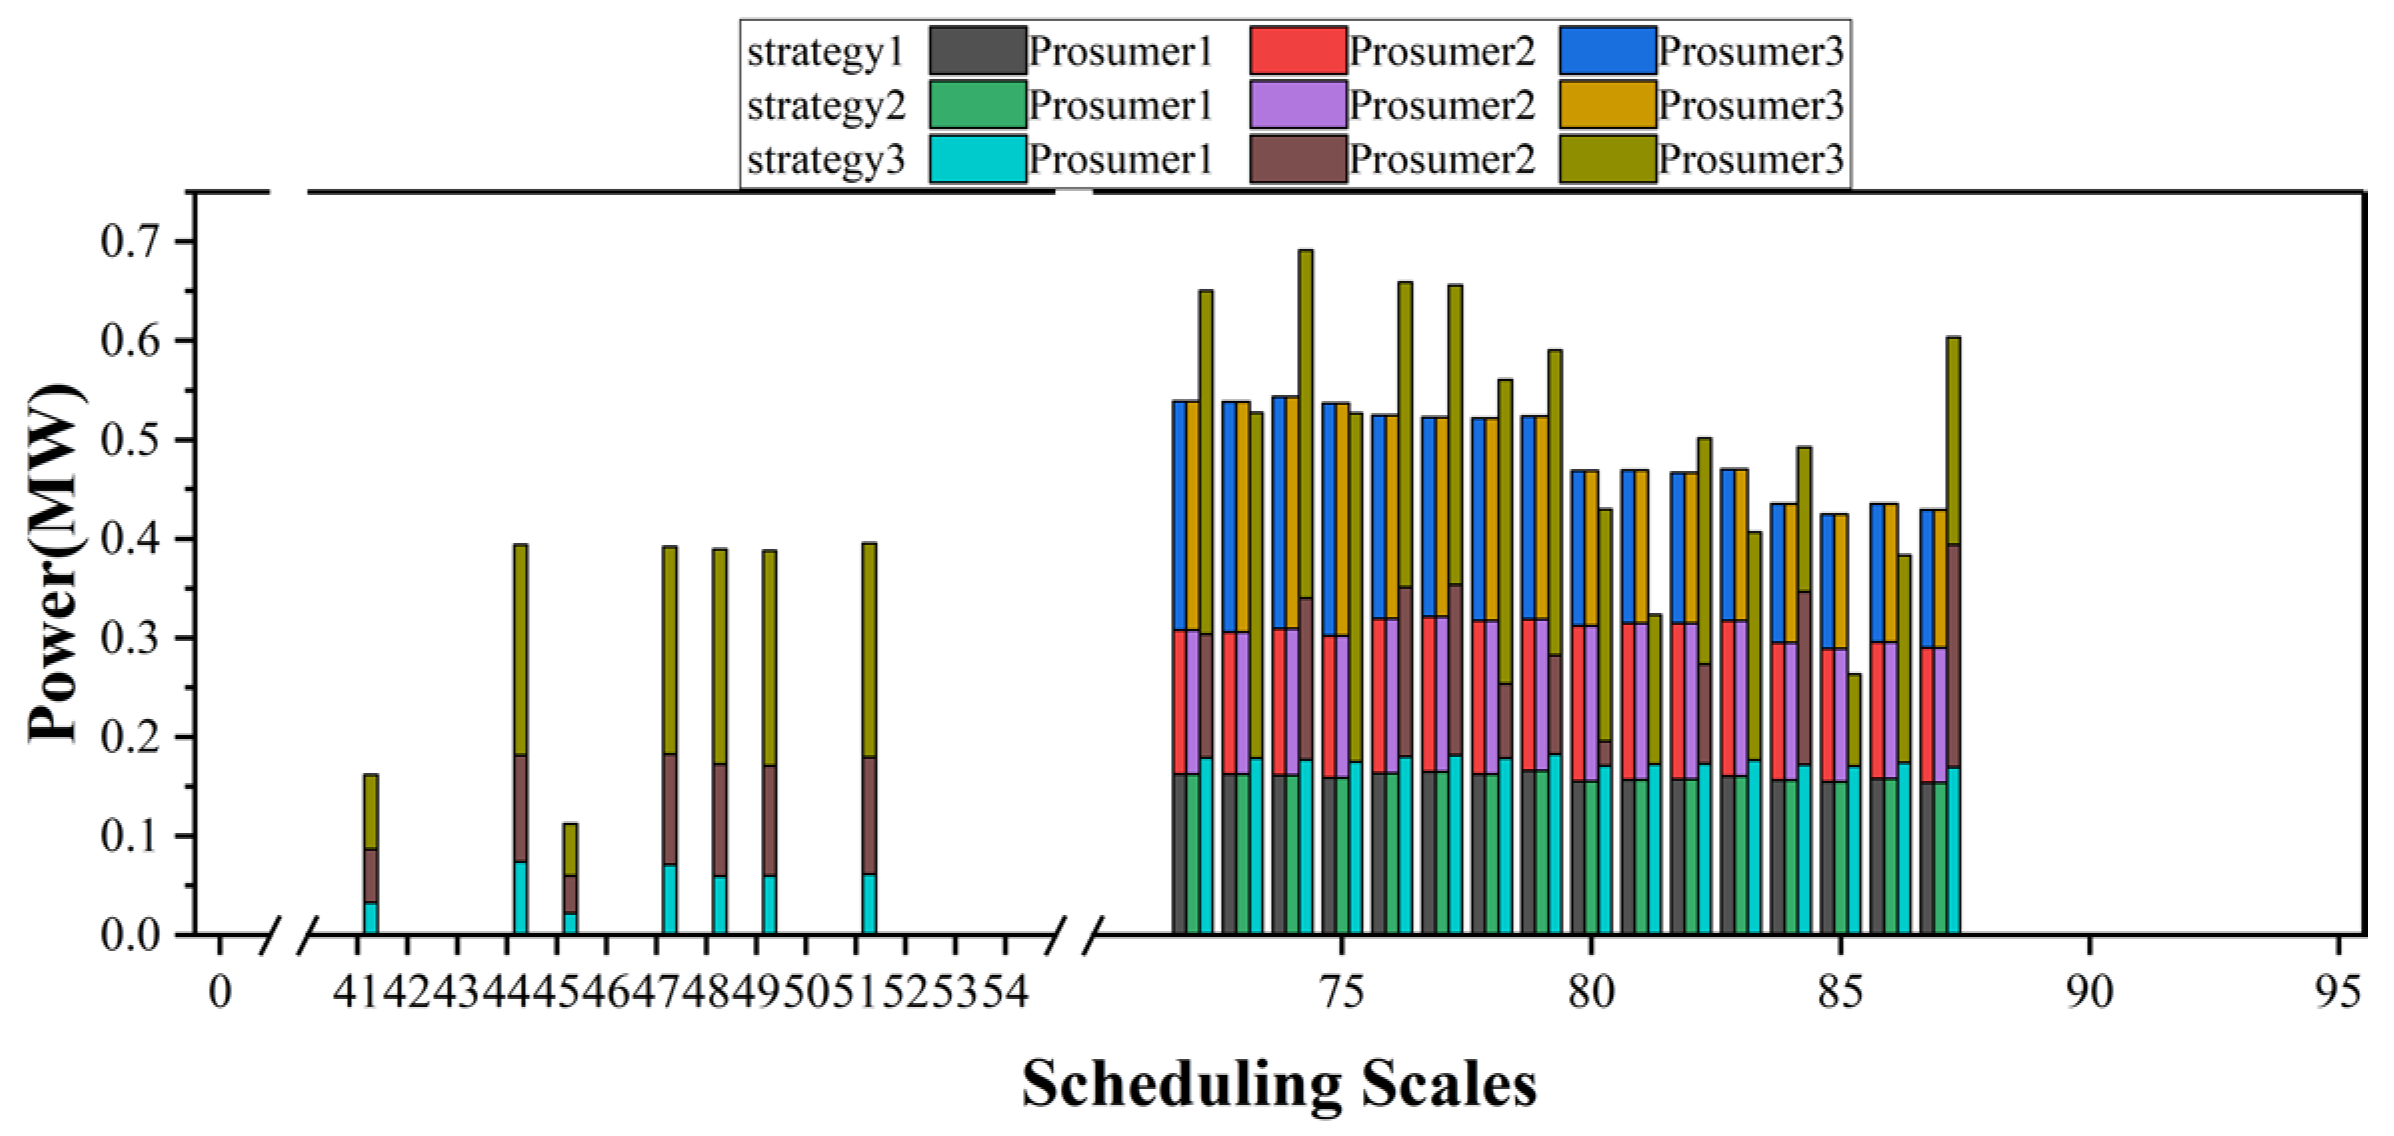
The optimization results of the IL during the intraday stage under the three strategies are shown in
Figure 6.
Since Strategy 1 and Strategy 2 both use fixed electricity prices from the wholesale market, their IL dispatch volumes and temporal distributions are similar, with relatively low overall dispatch levels. In contrast, under Strategy 3, the VPP employs dynamic internal electricity prices established through a Stackelberg game, which incentivizes prosumers to reduce loads during high-price periods. This results in longer dispatch duration and significantly higher IL utilization. This indicates that price-based guidance mechanisms can more effectively mobilize flexibility resources on the demand side, enhancing the VPP’s ability to regulate system power imbalances.
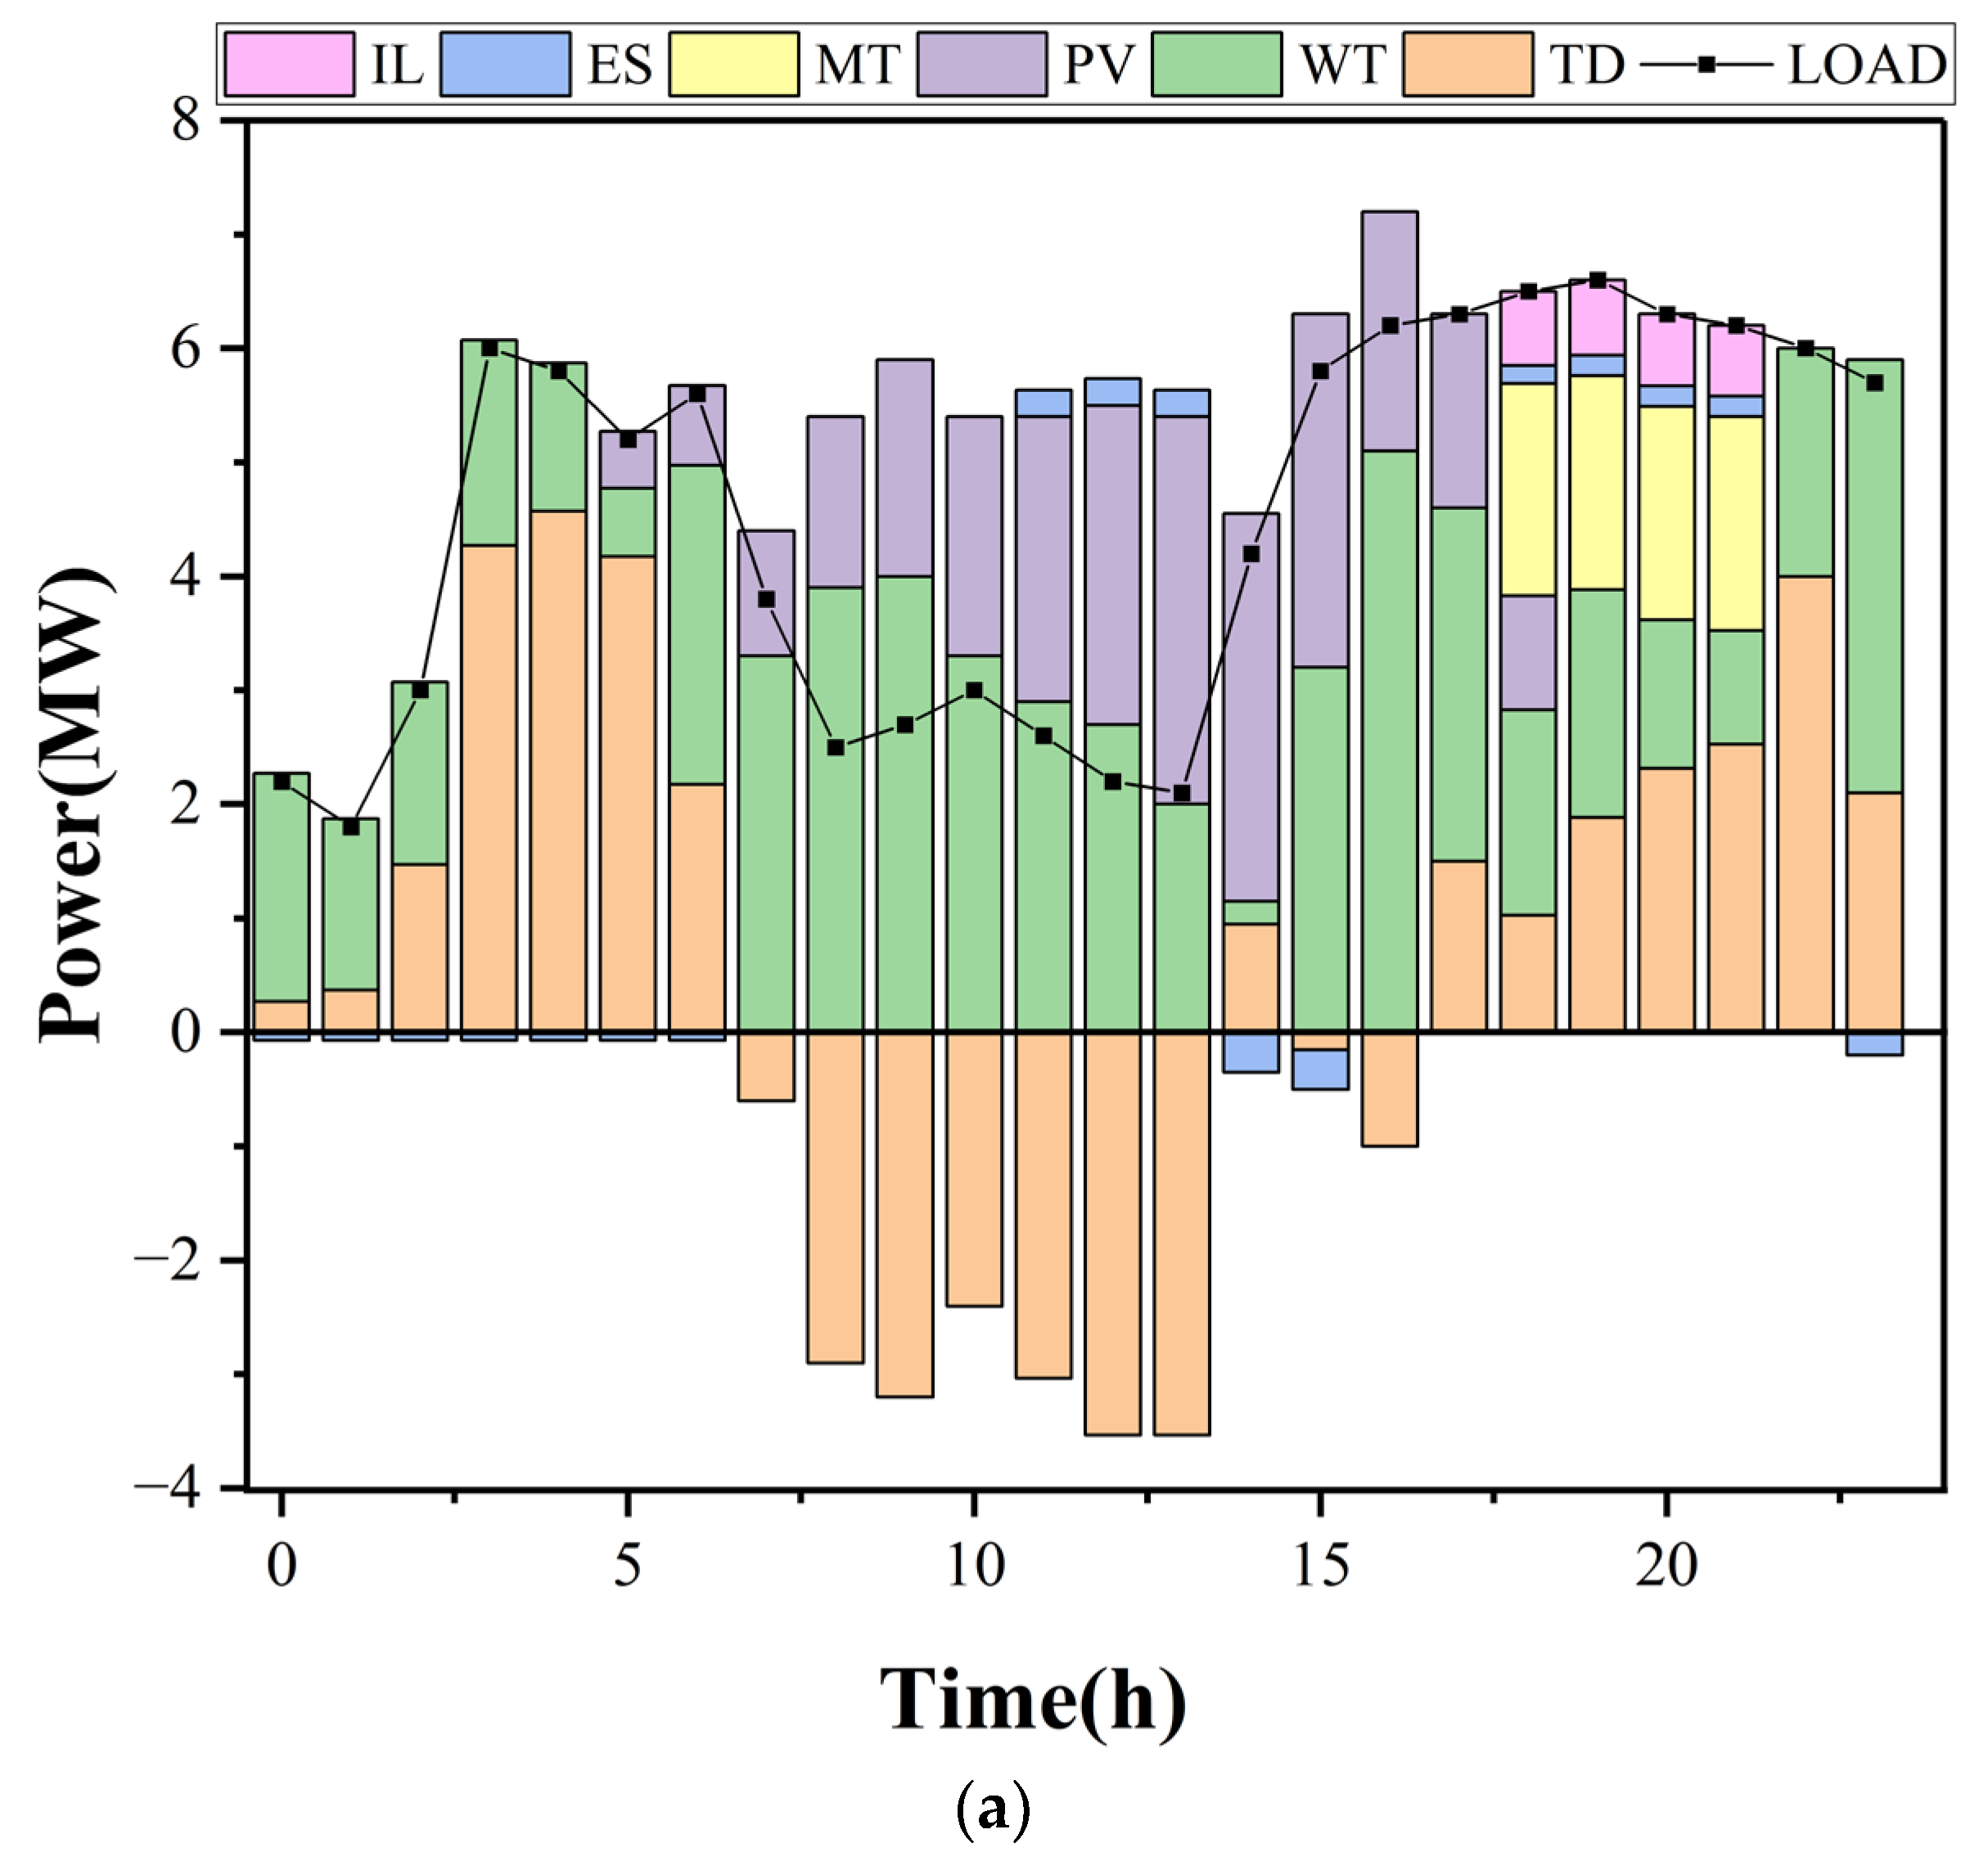
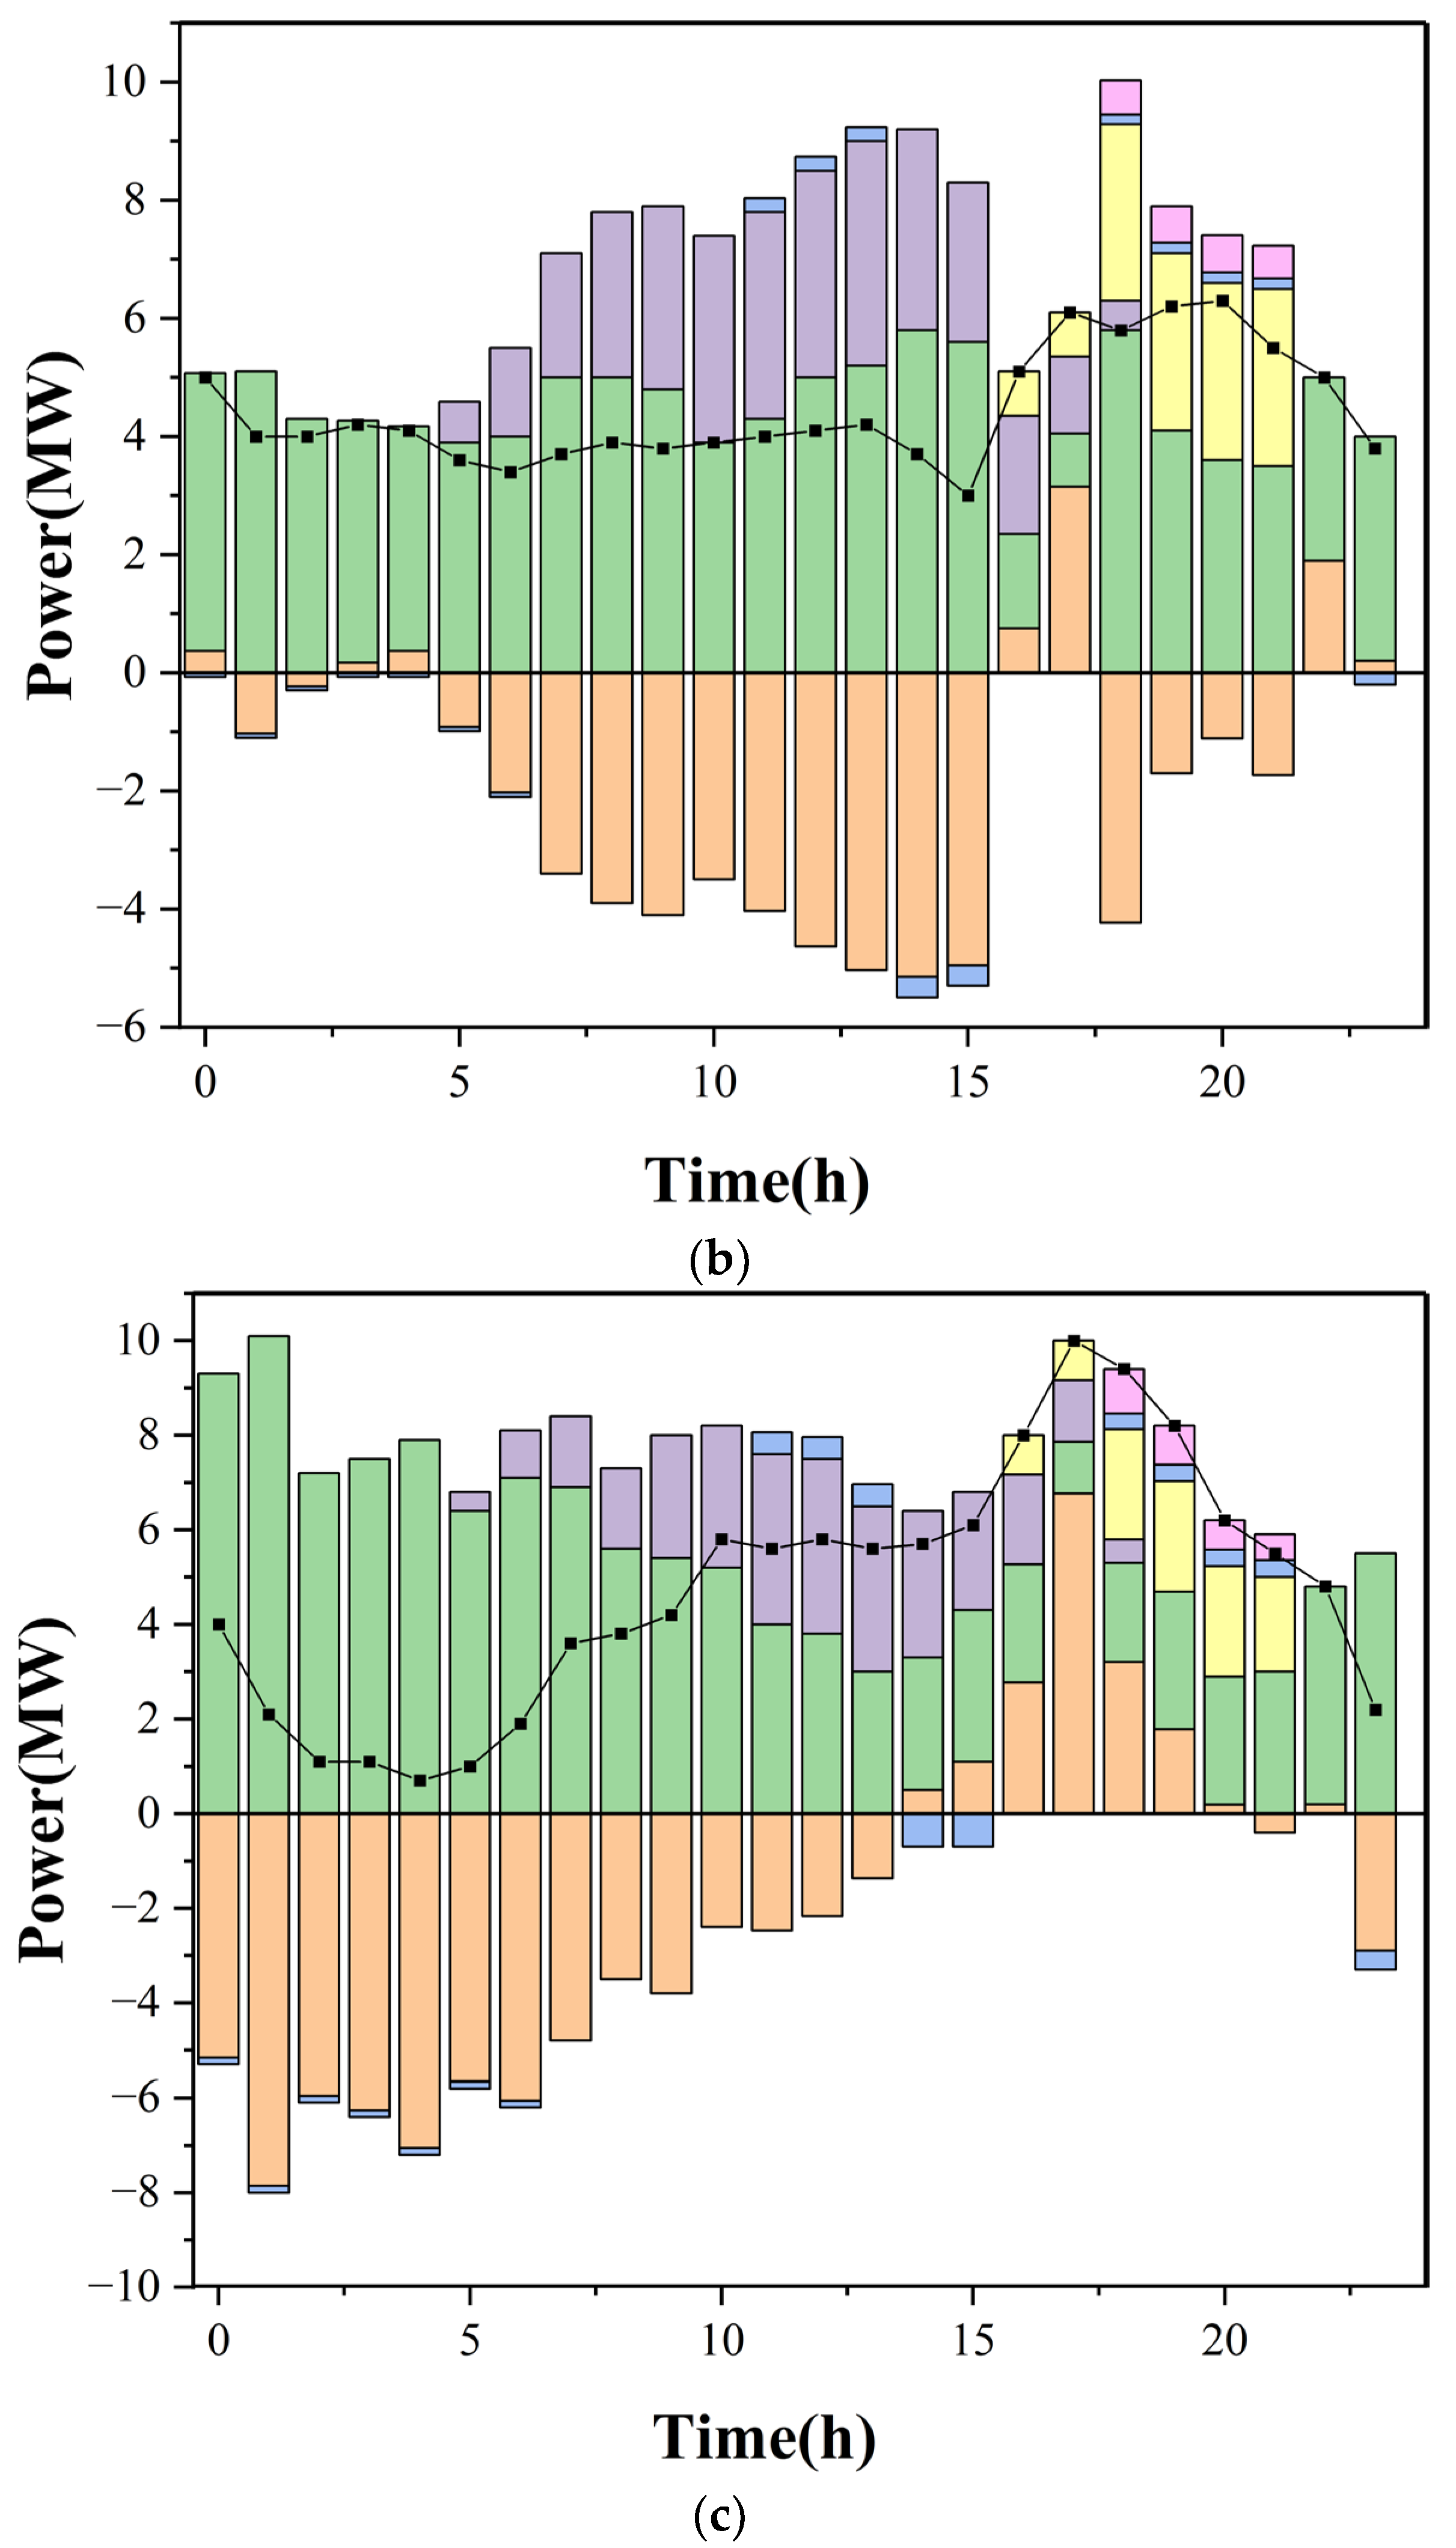
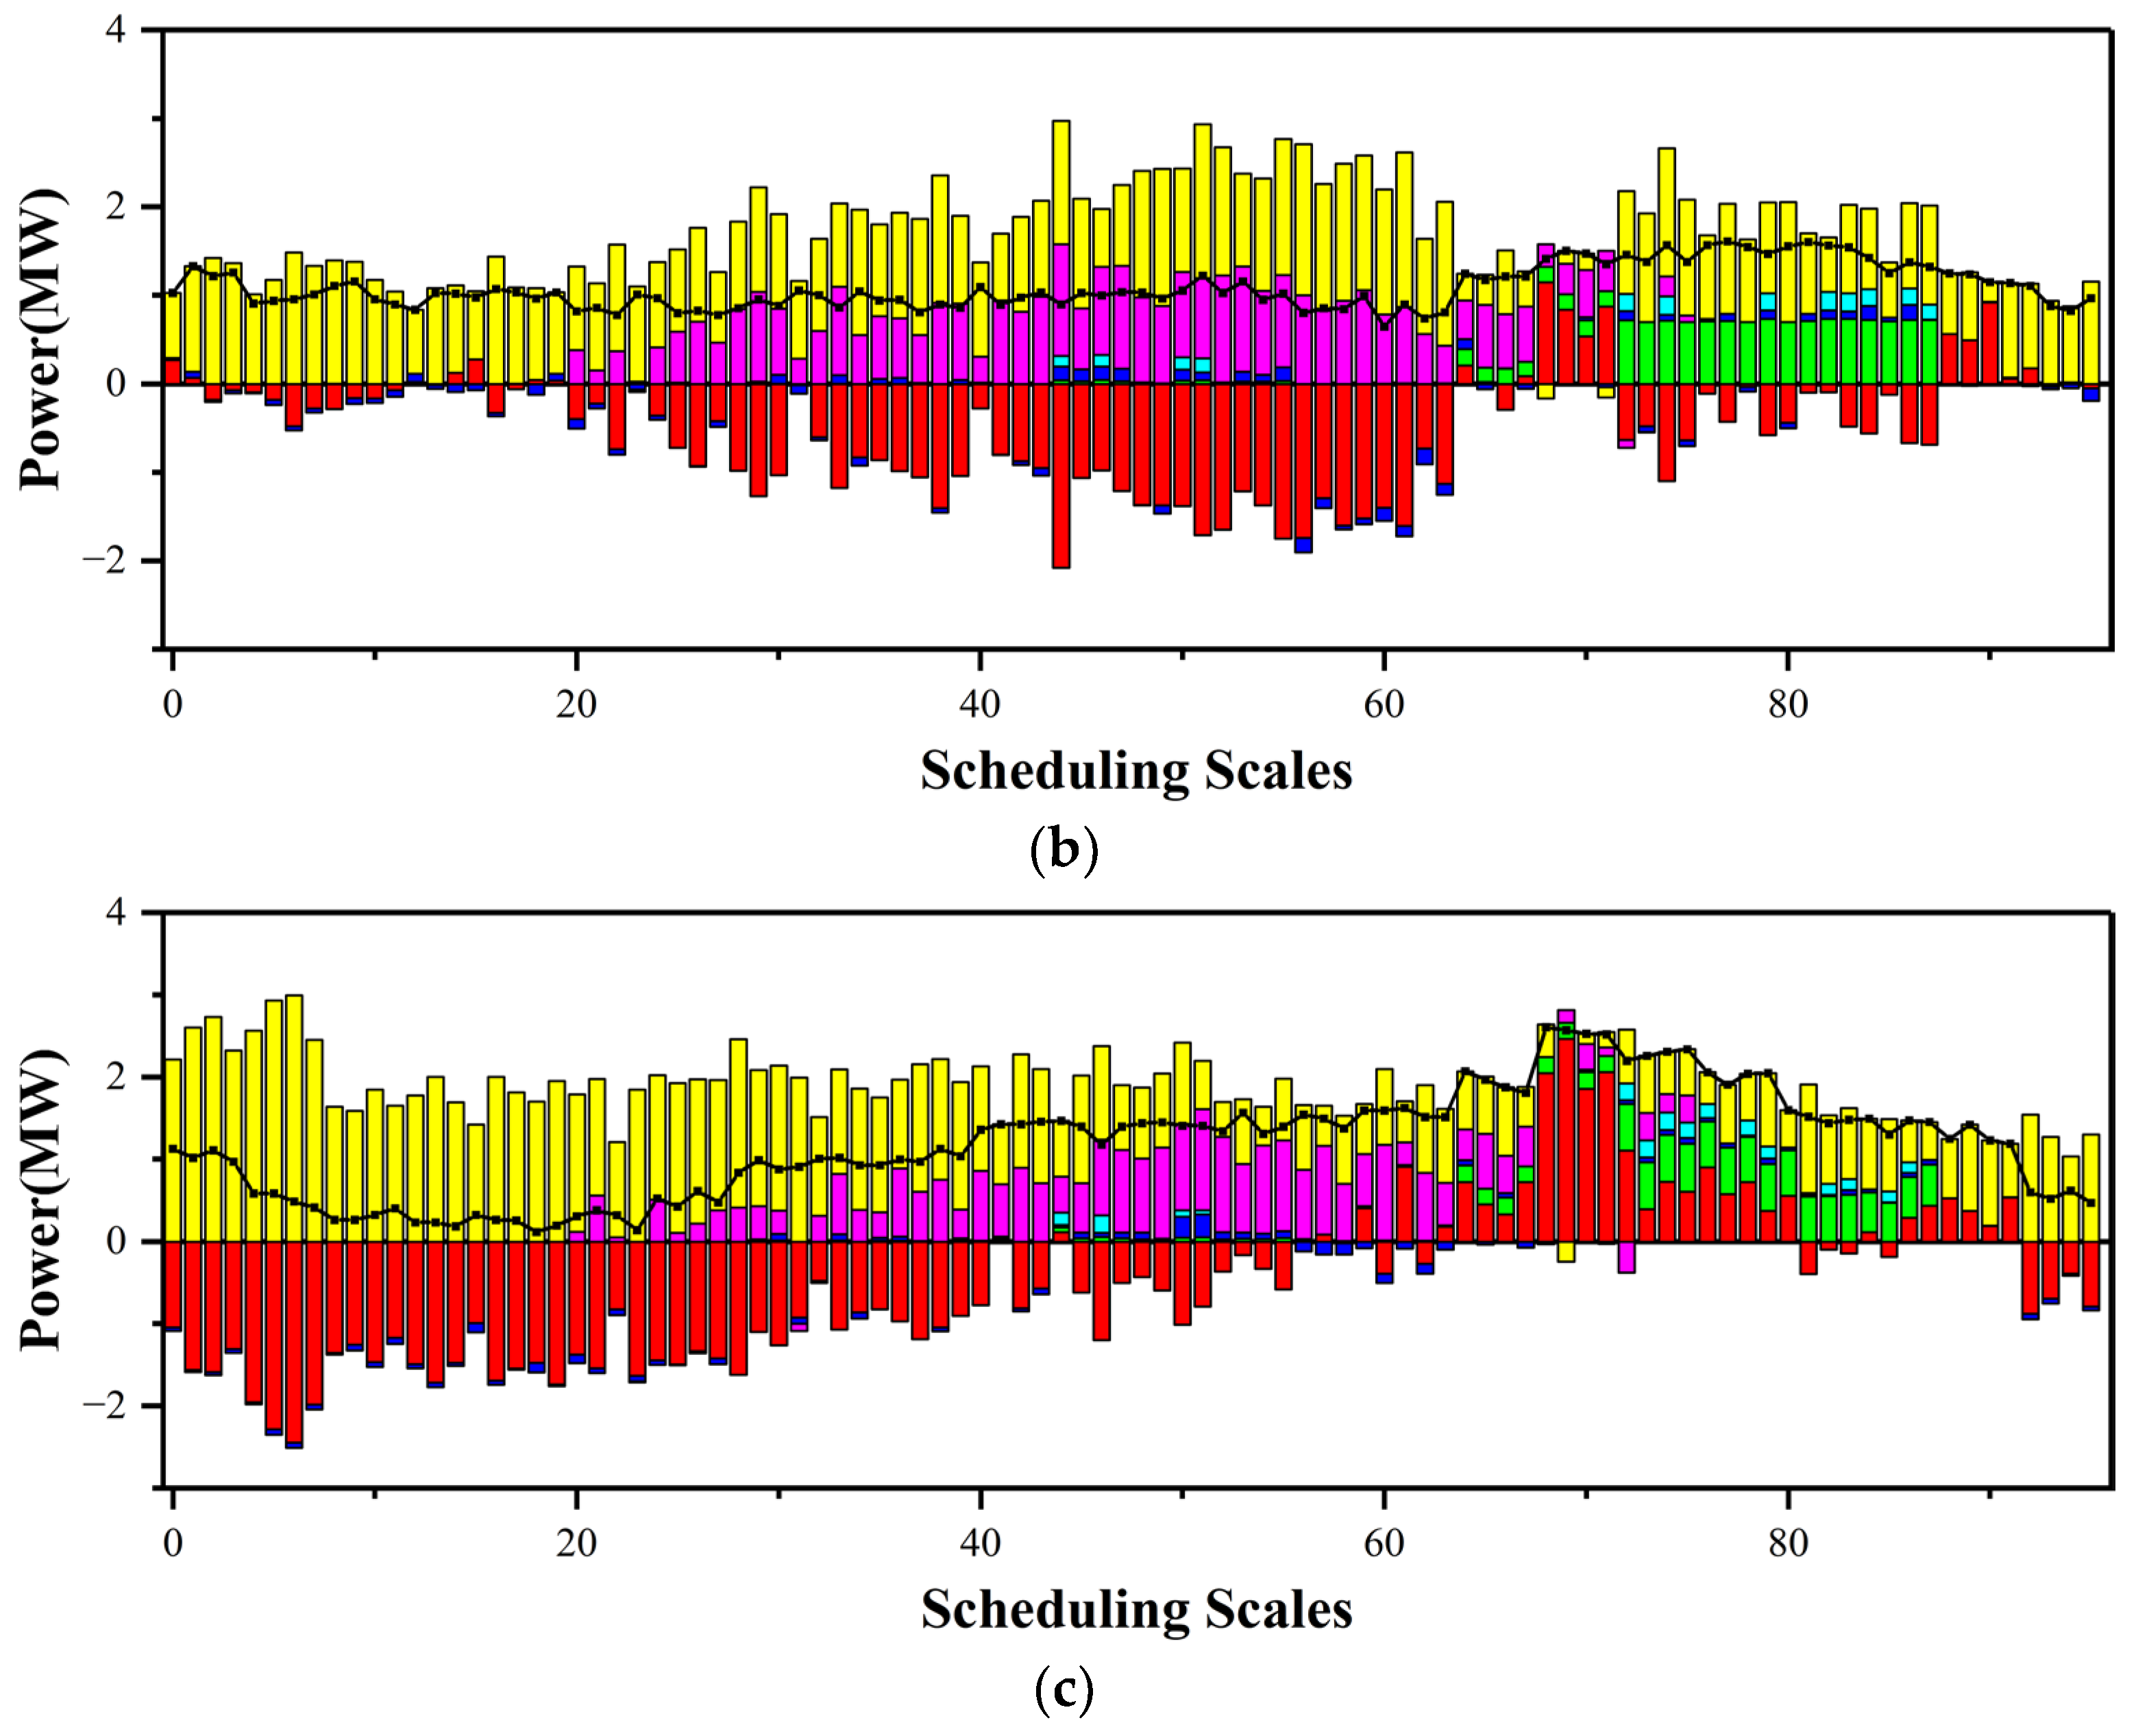
The actual output of DERs for the three prosumers after rolling scheduling with the proposed strategy in the intraday stage is shown in
Figure 7.
As shown, WT and PV outputs of each prosumer exhibit variability, while ES and MT achieve smooth output through rolling optimization, effectively supporting system power balance. Furthermore, the transaction power curves reveal that under dynamic electricity prices, significant power interactions occur among prosumers: those with energy surplus sell electricity to the system, while those in deficit purchase power, thereby achieving energy complementarity and balance within the VPP. Overall, by integrating day-ahead centralized dispatch with intraday price guidance, the proposed strategy enhances the overall utilization efficiency of distributed resources and system operational economy while respecting prosumer autonomy.
5.3. Analysis of Electricity Prices and Trading Volumes
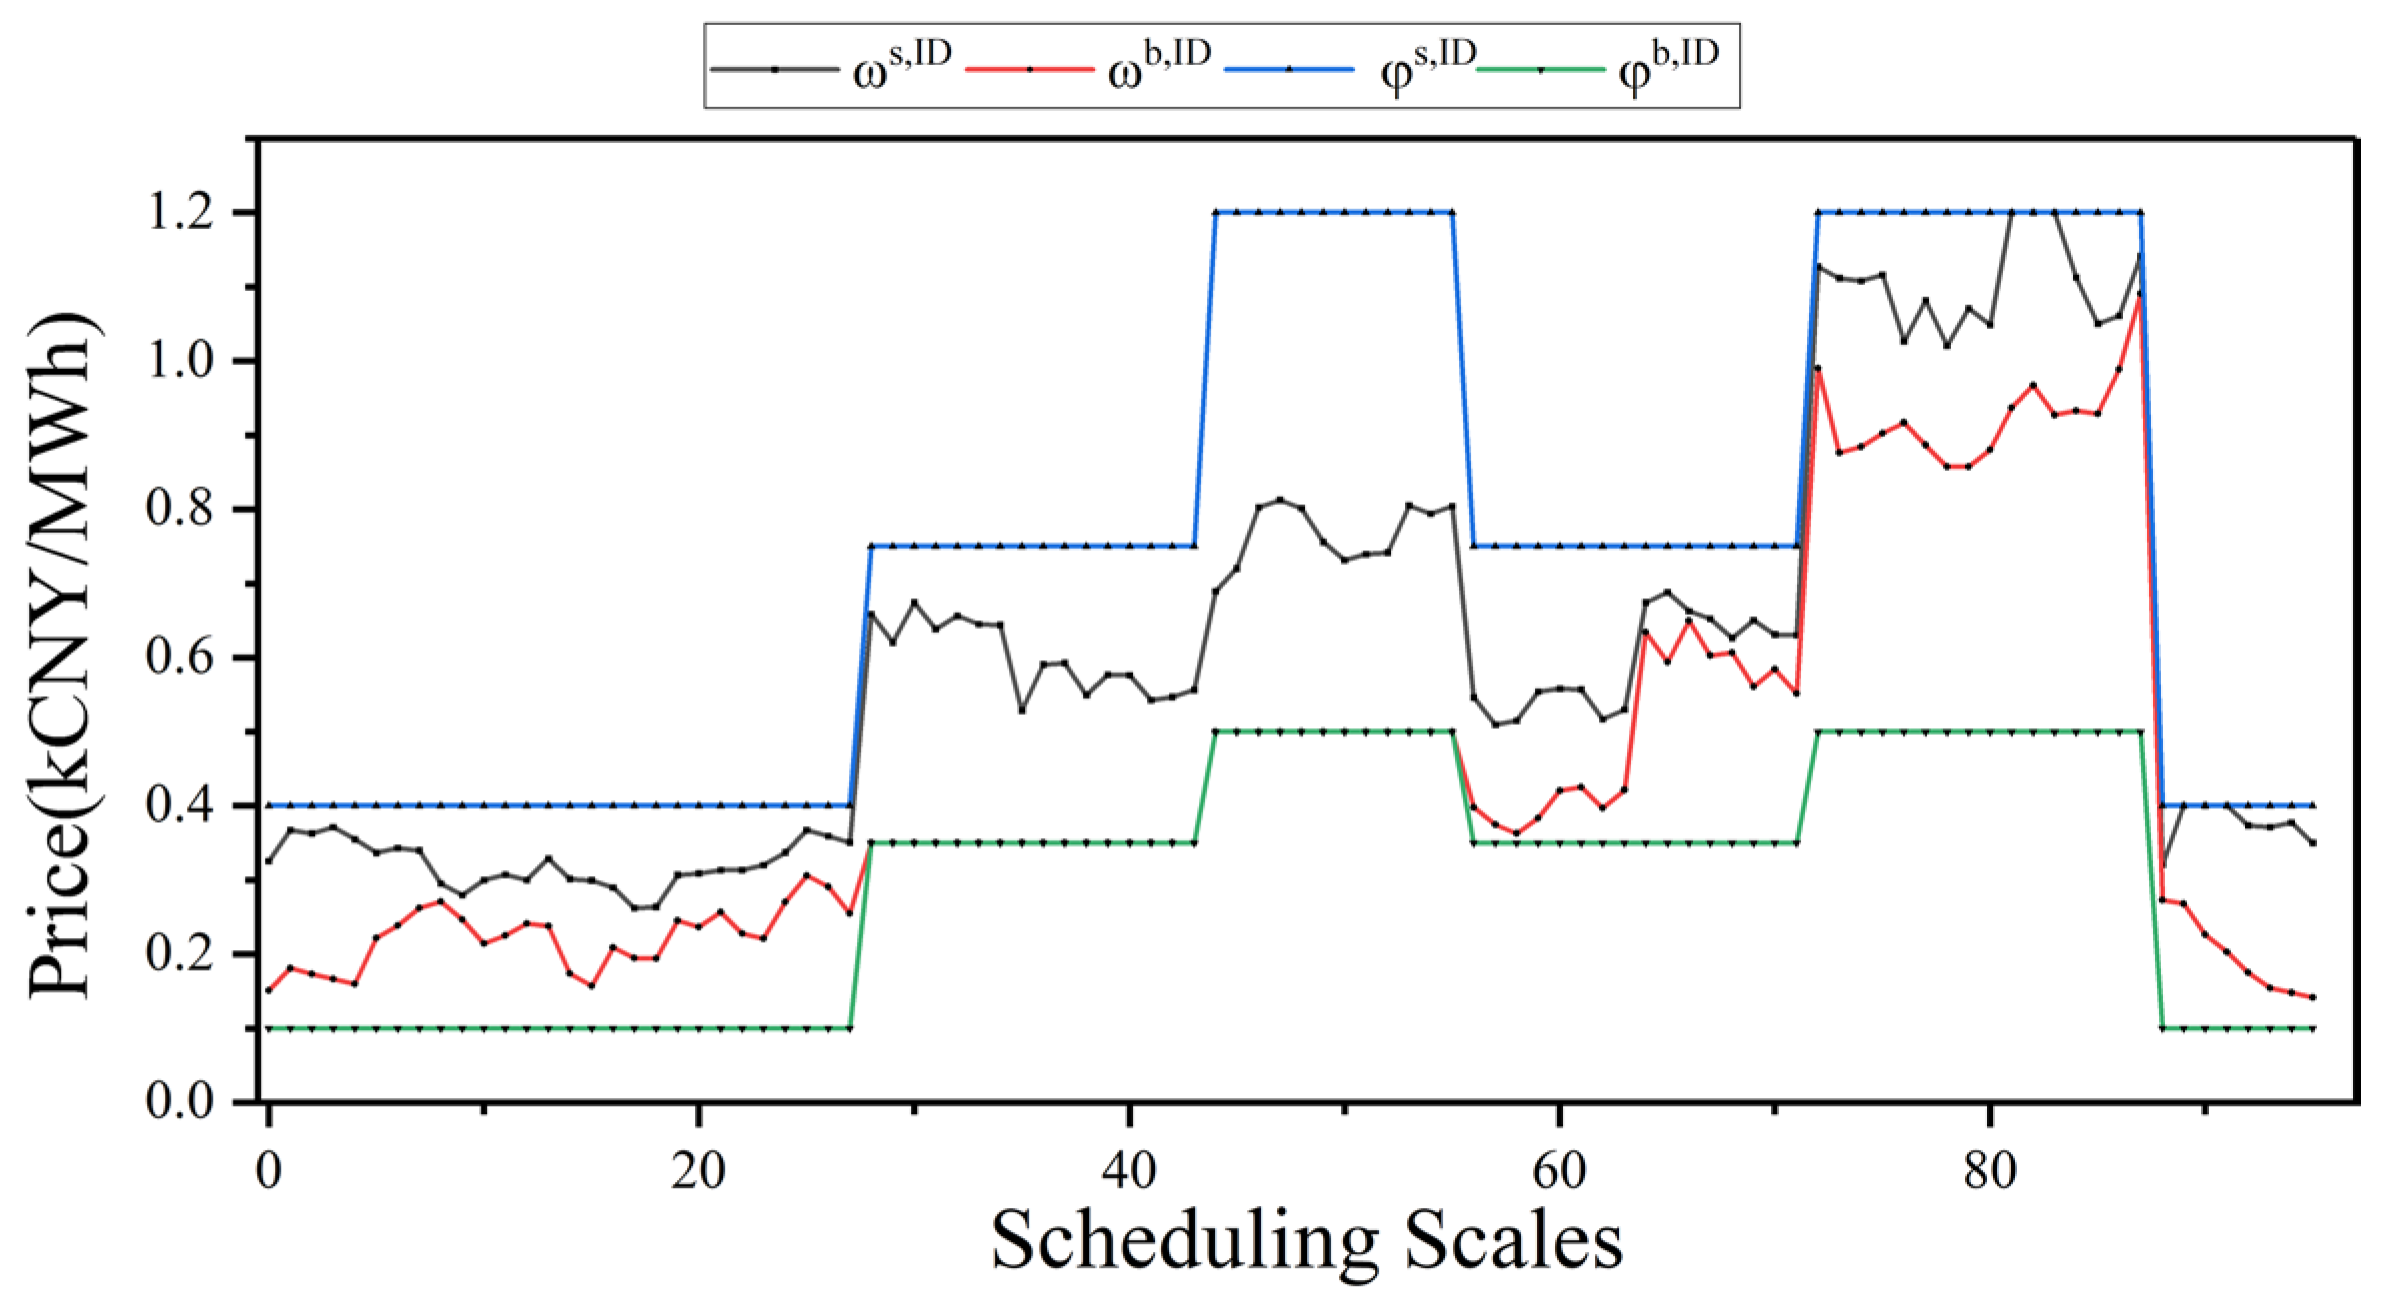
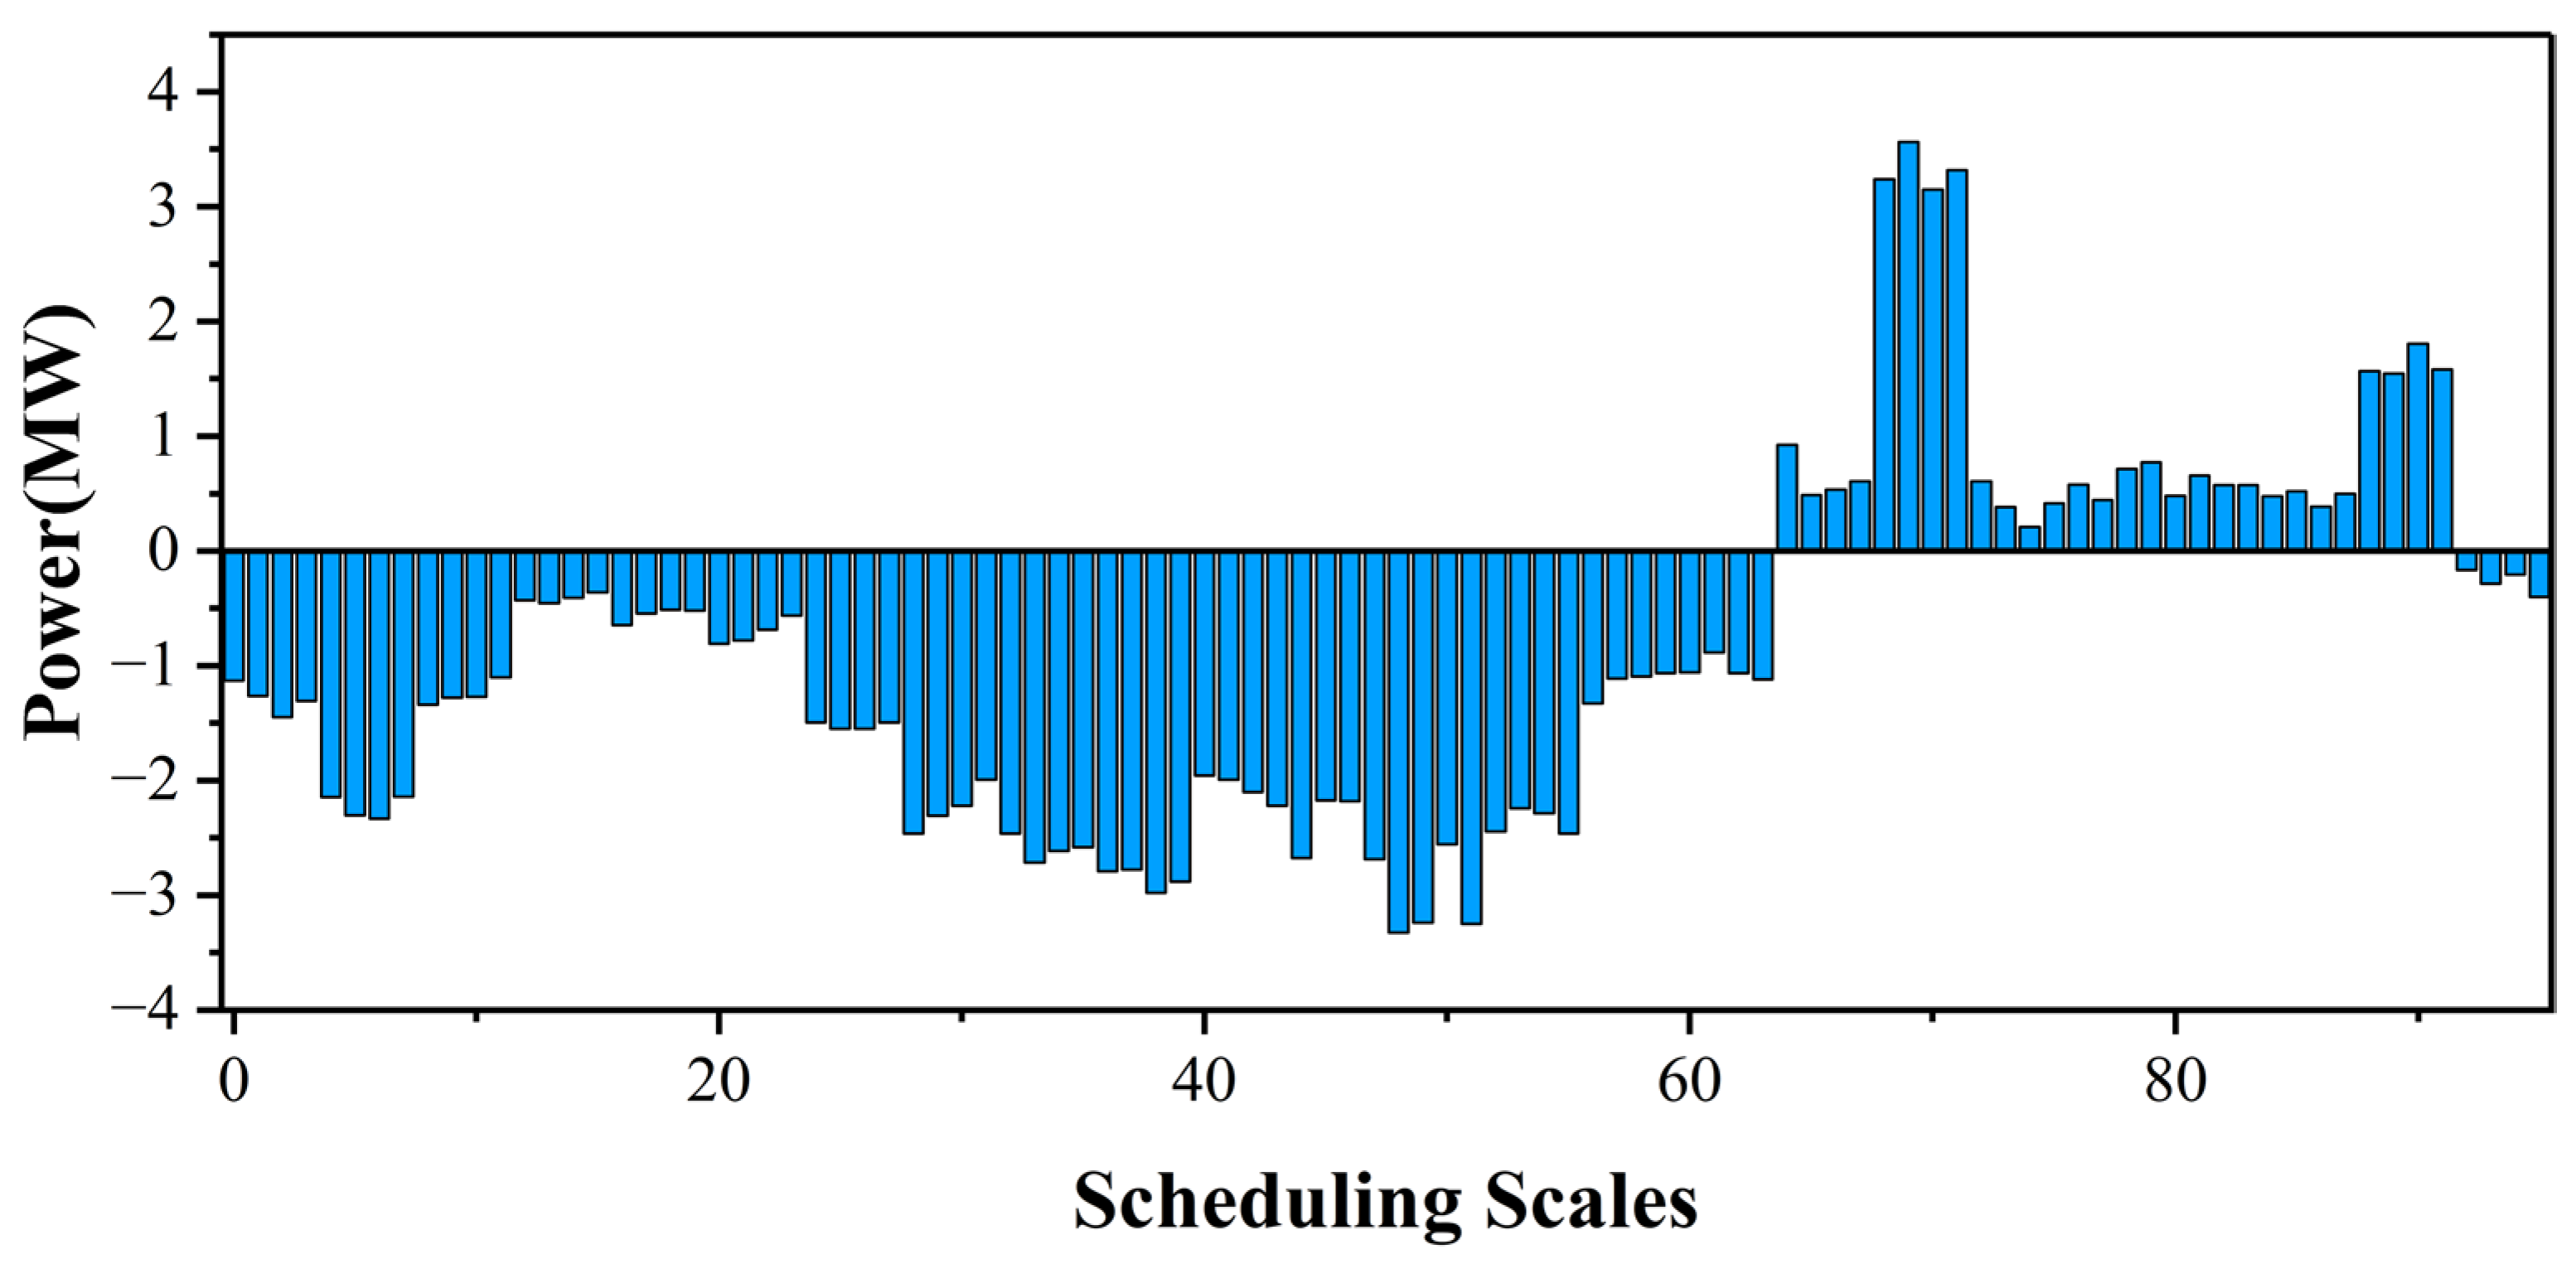
The optimization results of electricity prices and transaction volumes under the proposed strategy are presented in
Figure 8 and
Figure 9.
During the time intervals of 0–8 and 28–56, all prosumers are of power surplus. During these intervals, the VPP will lower the purchase price and increase the selling price to safeguard its own interests. During the 9–28 time interval, some prosumers are in a power deficit, while VPP as a whole maintains a power surplus. In this case, the VPP increases the purchase price to encourage transactions among prosumers. Particularly during the 20–28 time interval, Prosumer2 would remain in a power-balanced state under a fixed pricing mechanism. However, due to the increased purchase price, Prosumer2 is incentivized to generate more electricity to increase profits, thereby transforming into a power surplus state. During the 58–92 time interval, prosumers operate under heterogeneous power states; however, the overall VPP system exhibits a power deficit. In this stage, the VPP raises the purchase price to guide energy-surplus prosumers to sell more electricity, thereby meeting the demand of prosumers in power deficit.
These results indicate that the proposed dynamic pricing strategy enables the VPP to flexibly coordinate prosumer behaviors according to system-wide energy status, effectively redistributing power resources and enhancing overall system stability.
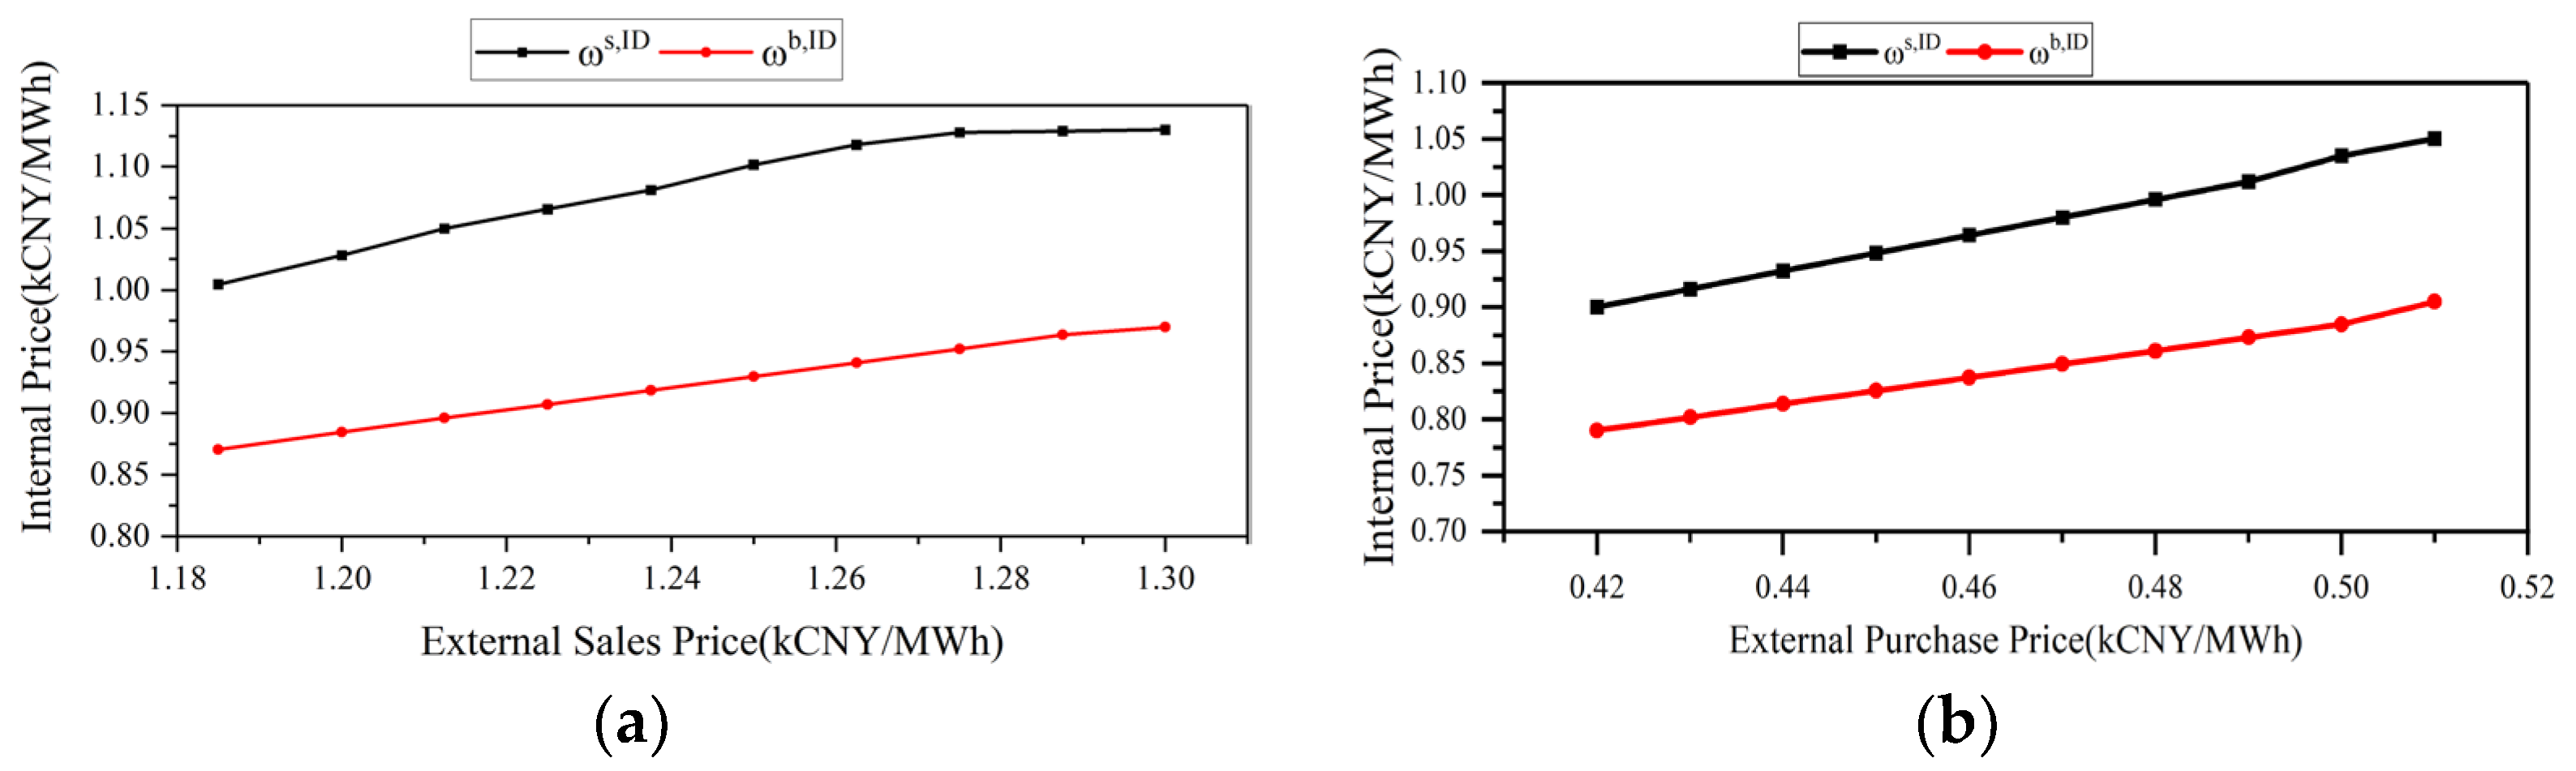
To investigate the impact of changes in external electricity prices on internal electricity prices, we take the 74th scheduling point in the intraday stage as the research object, and the adjusted internal electricity prices are shown in
Figure 10.
The results show that the changes in external electricity price boundaries directly drive adjustments to the VPP’s internal pricing strategy: when the external selling price rises, the VPP synchronously increases the internal purchasing price to promote internal transactions among prosumers and reduce reliance on the external market; meanwhile, to safeguard its own profits, the internal selling price is also raised accordingly. However, when the external selling price exceeds a certain threshold, the internal purchasing price tends to stabilize—the core reason for this phenomenon is that the regulatory potential of DERs within the prosumer cluster has been fully tapped at this point, and the VPP cannot explore additional scheduling space by further increasing the purchasing price.
When the external purchasing price decreases, the VPP lowers the internal purchasing price to expand its profit margin; the cost redundancy brought by the reduced purchasing price leads to a corresponding decrease in the internal selling price. It is important to note that since renewable generation marginal costs are not included in the model, the internal purchasing price decreases monotonically with the continuous reduction in the external purchasing price, without an obvious lower limit constraint.
Furthermore, supplementary analysis of the 30th and 85th intraday scheduling points shows that the overall energy status of the system significantly affects electricity price sensitivity: at the 30th scheduling point, all prosumers are in a state of power surplus, and the impact of the external purchasing price on the internal selling price is extremely weak; at the 85th scheduling point, the cluster as a whole experiences power shortage, and the impact of the external purchasing price on the internal selling price is also very slight. In these two extreme scenarios, the VPP adjusts the internal price to be consistent with the external price in consideration of its own interests.
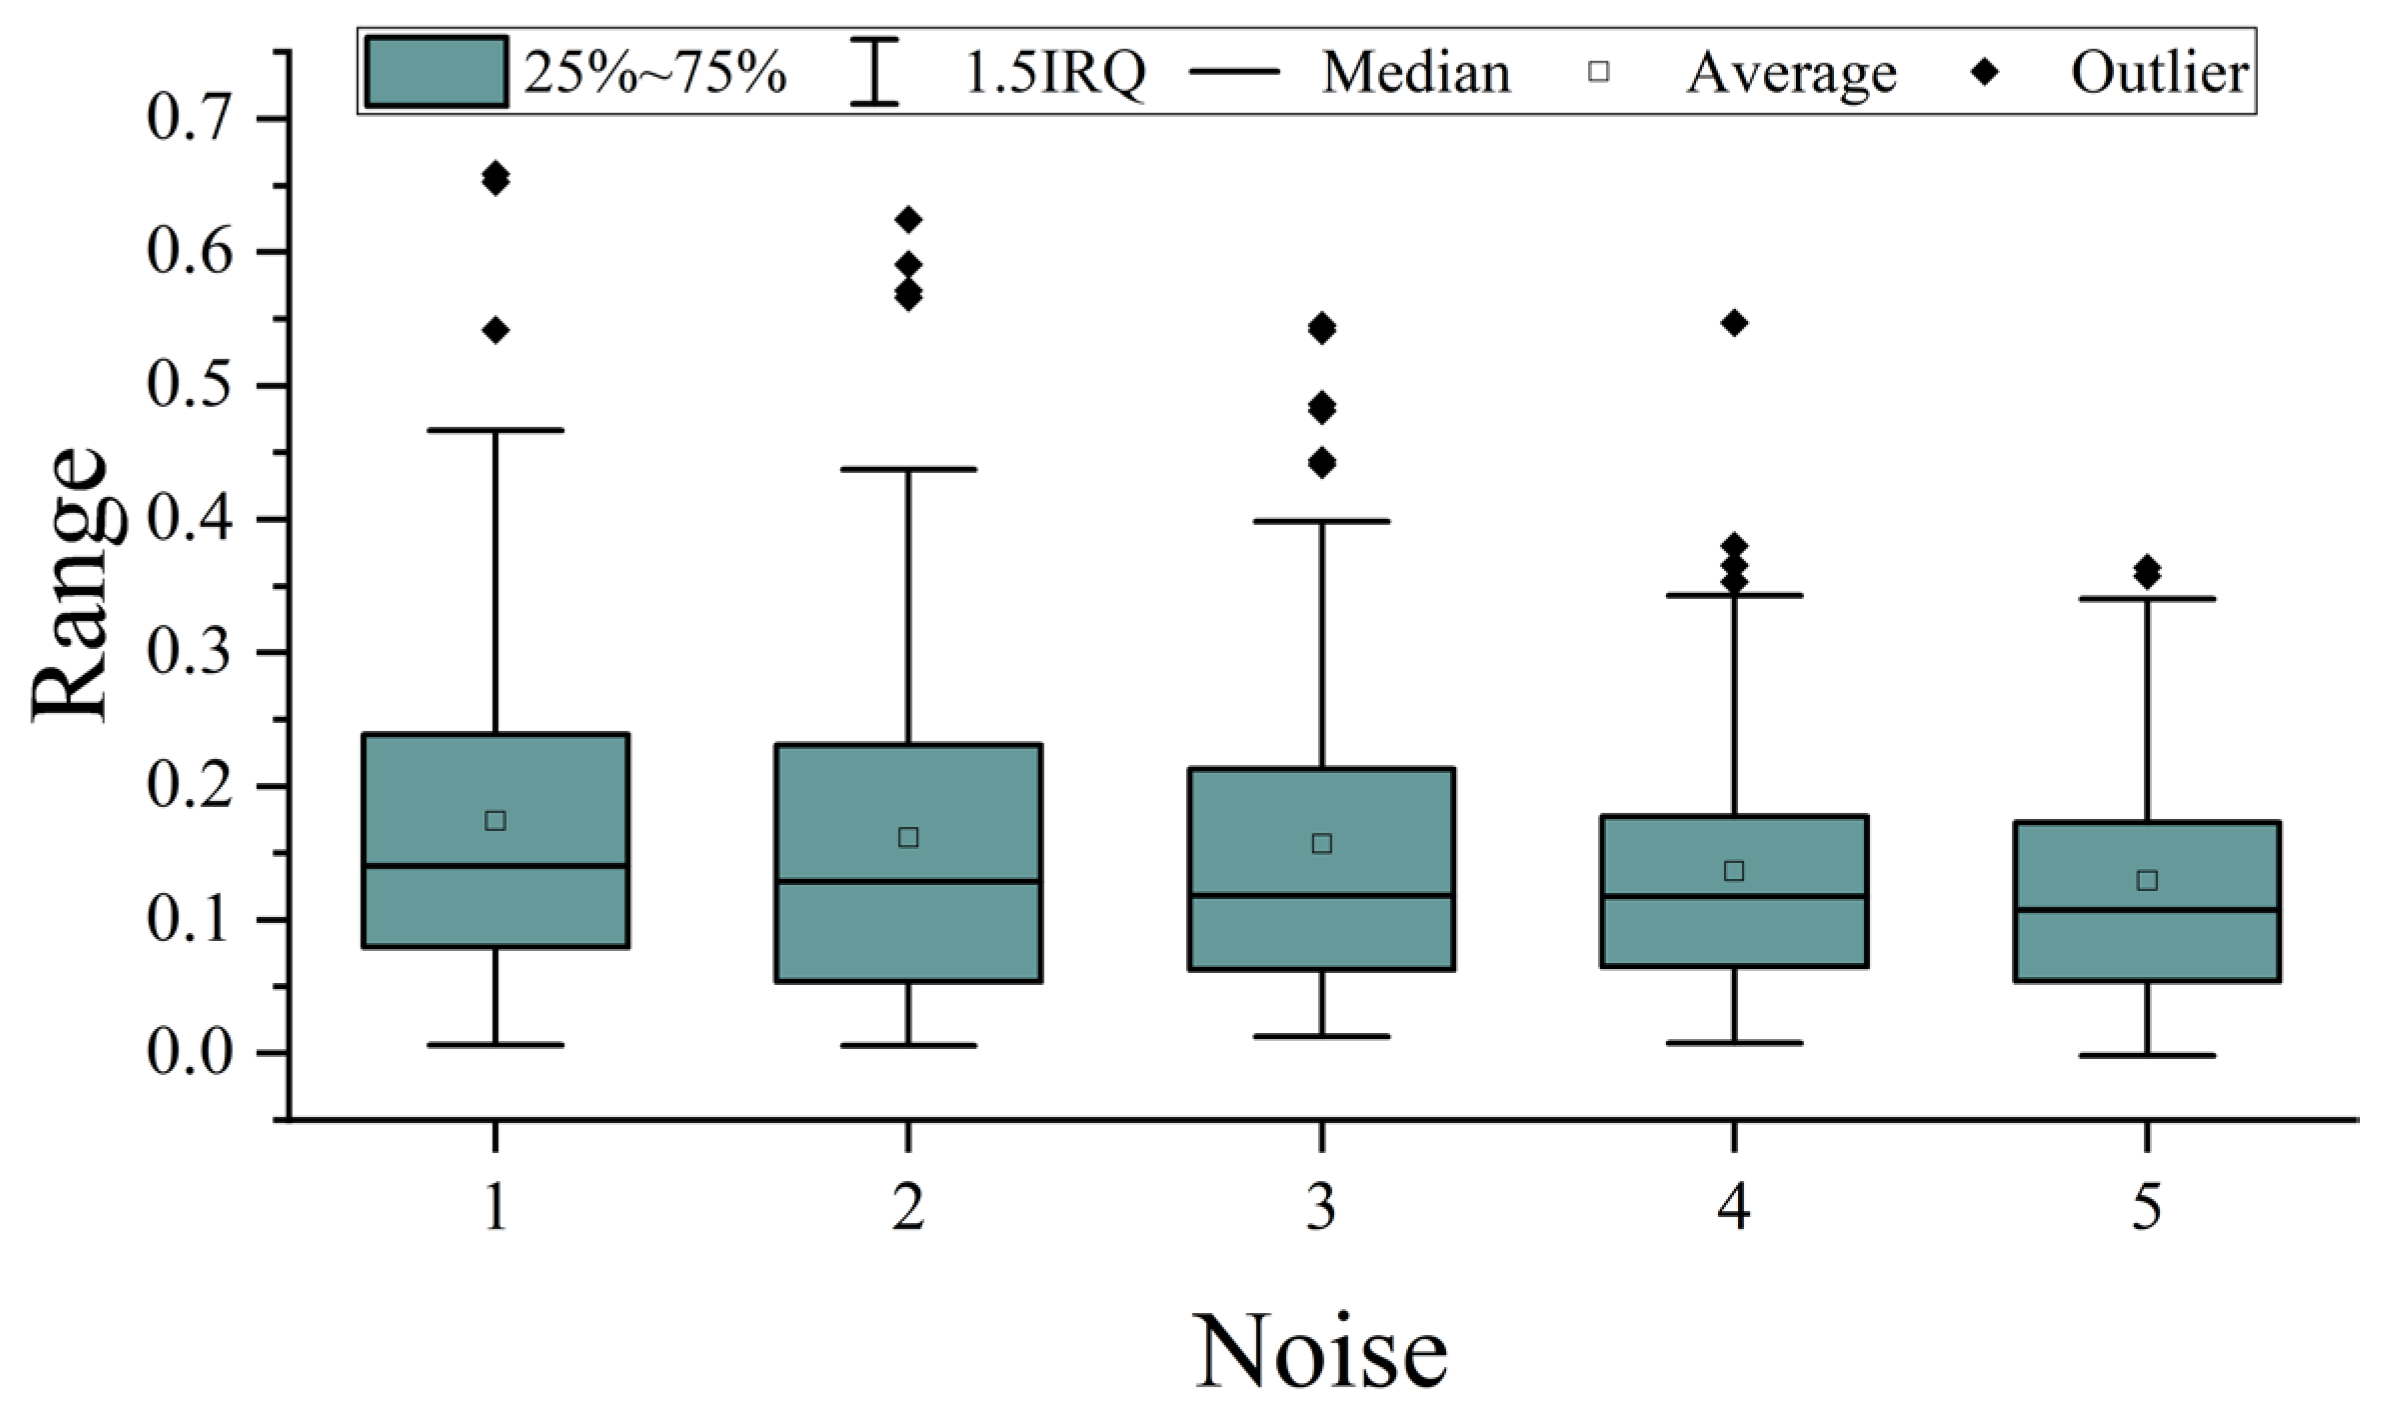
To quantify the impact of prediction accuracy on the internal transaction electricity prices of the VPP, this study introduces gradient-intensity white noise into the WT, PV, and load forecasting data; the noise intensities are 1%, 2%, 3%, 4%, and 5%, respectively. Taking the difference between internal purchase and sale prices as the core indicator, its statistical characteristics are visualized through boxplots, as shown in
Figure 11.
It can be seen that as the white noise intensity increases, the mean, median, and interquartile range (IQR) of the price difference gradually decrease, with outliers reducing and the distribution narrowing. This phenomenon is attributed to the VPP’s adaptive pricing mechanism: increased prediction errors intensify the volatility of DERs and loads, raising the risk of supply–demand imbalance. The VPP lowers the transaction threshold for prosumers by narrowing the price difference, incentivizing them to adjust the operation of DERs and actively participate in internal transactions.
This measure promotes prosumer interaction, fully taps the spatiotemporal complementarity of distributed resources, offsets the supply–demand gap caused by prediction errors, and achieves cluster energy self-balance. Meanwhile, it reduces the VPP’s reliance on high-cost external market transactions, enhancing the system’s operational robustness in scenarios with imperfect predictions.
The research results verify the adaptability of the proposed two-stage scheduling strategy to fluctuations in prediction accuracy, providing a quantitative reference for dynamic pricing in real-world scenarios where prediction errors are unavoidable.
5.4. The Impact of Different Scheduling Strategies on Operating Costs
To examine how different optimization strategies affect prosumers’ operating costs, this section establishes the following four optimization schemes based on the aforementioned operating strategies:
Scheme 1: Strategy 1 is adopted in both the day-ahead and intraday stages.
Scheme 2: Strategy 2 is adopted in both of the two stages.
Scheme 3: Strategy 3 is adopted in both of the two stages.
Scheme 4: Strategy 2 is adopted in the day-ahead stage, and Strategy 3 is adopted in the intraday stage.
The operating costs under the four schemes are shown in
Table 2.
For Scheme 1, the operating costs of prosumers are relatively high due to their mutual independence and inability to leverage synergies. For Scheme 2, prosumers incur a higher operating cost in the day-ahead stage compared to Scheme 3 because its reliance on fixed electricity prices set by the wholesale market fails to unlock the scheduling potential of DERs. For Scheme 3, prosumers incur a relatively high cost in the intraday stage because the high output level of the ES in the day-ahead stage limits the ability to adjust in the intraday stage, necessitating significant external electricity transactions to mitigate forecasting errors. For Scheme 4, prosumers achieve the minimum comprehensive cost by integrating the advantages of two control methods: optimizing the overall VPP operation status during the day-ahead stage and guiding prosumers through dynamic electricity prices in the intraday stage. In summary, under the test and comparison environment established in this paper, Scheme 4 is proven to be the most cost-effective.
5.5. Algorithm Performance
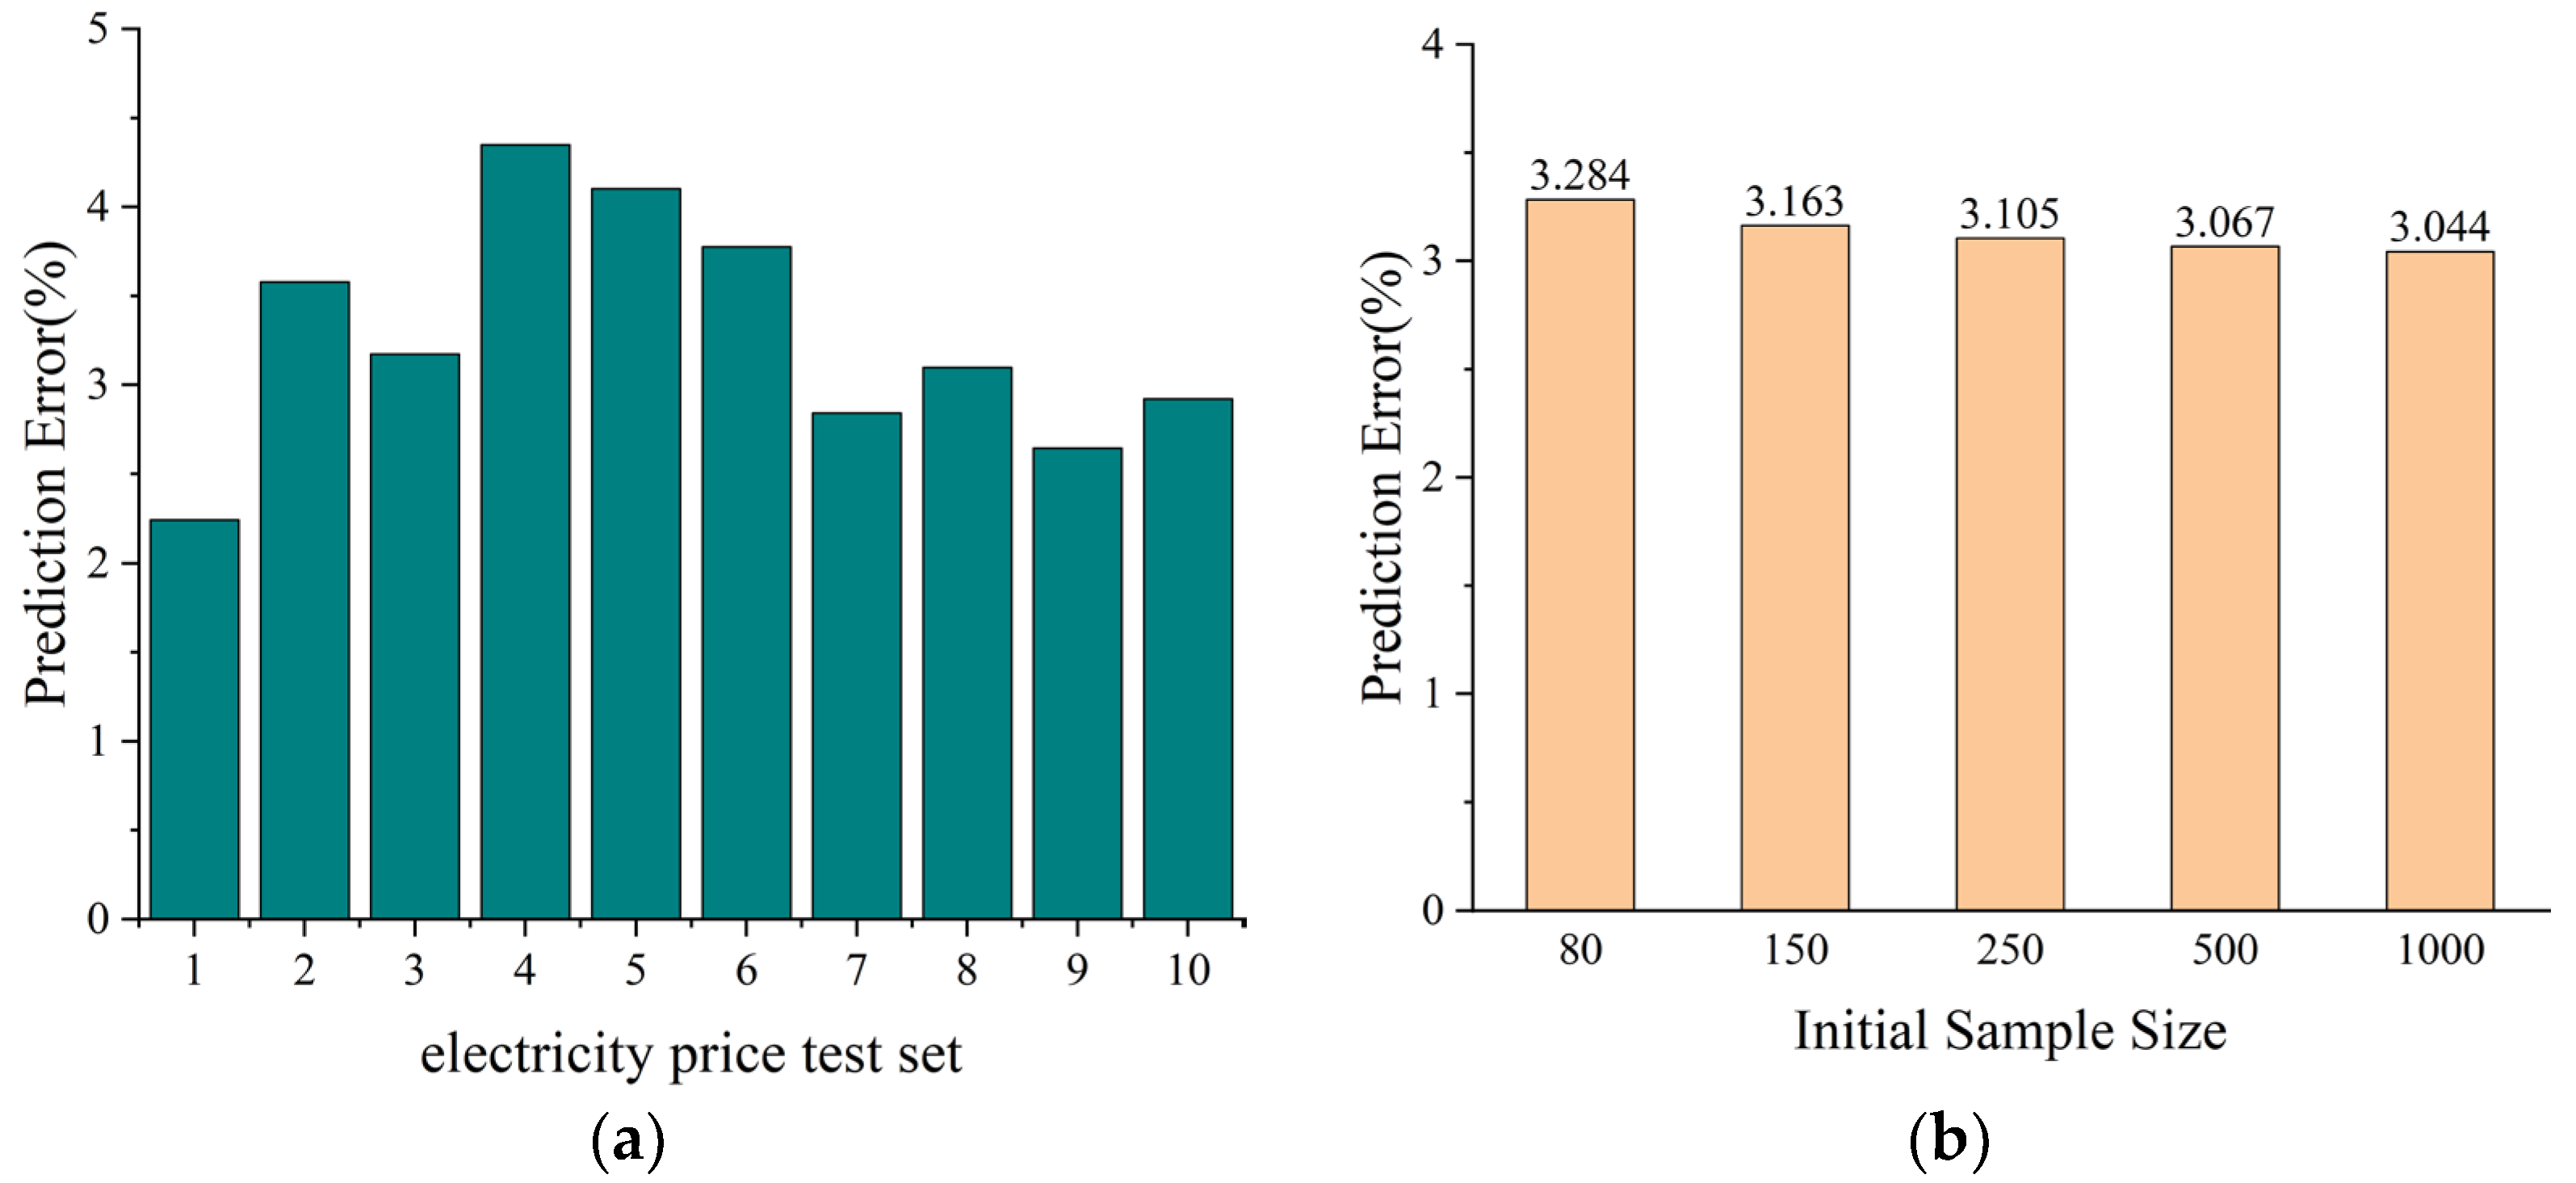
To verify the fitting effect of the Kriging model, we designed two experiments to test its fitting performance, and the test results are shown in
Figure 12.
Taking typical operational data as a reference,
Figure 12a presents the deviations between the predicted and actual power values of prosumers, which are obtained using the Kriging model established in this study based on 10 different sets of electricity price data. The deviation ranges from 2% to 4.5% without extreme outliers, which verifies the accuracy of the model.
Figure 12b analyzes the prediction errors under different initial sample sizes of the electricity price dataset. Simulation results show that the accuracy of the model slightly improves with the increase in sample size, demonstrating the model’s certain robustness.
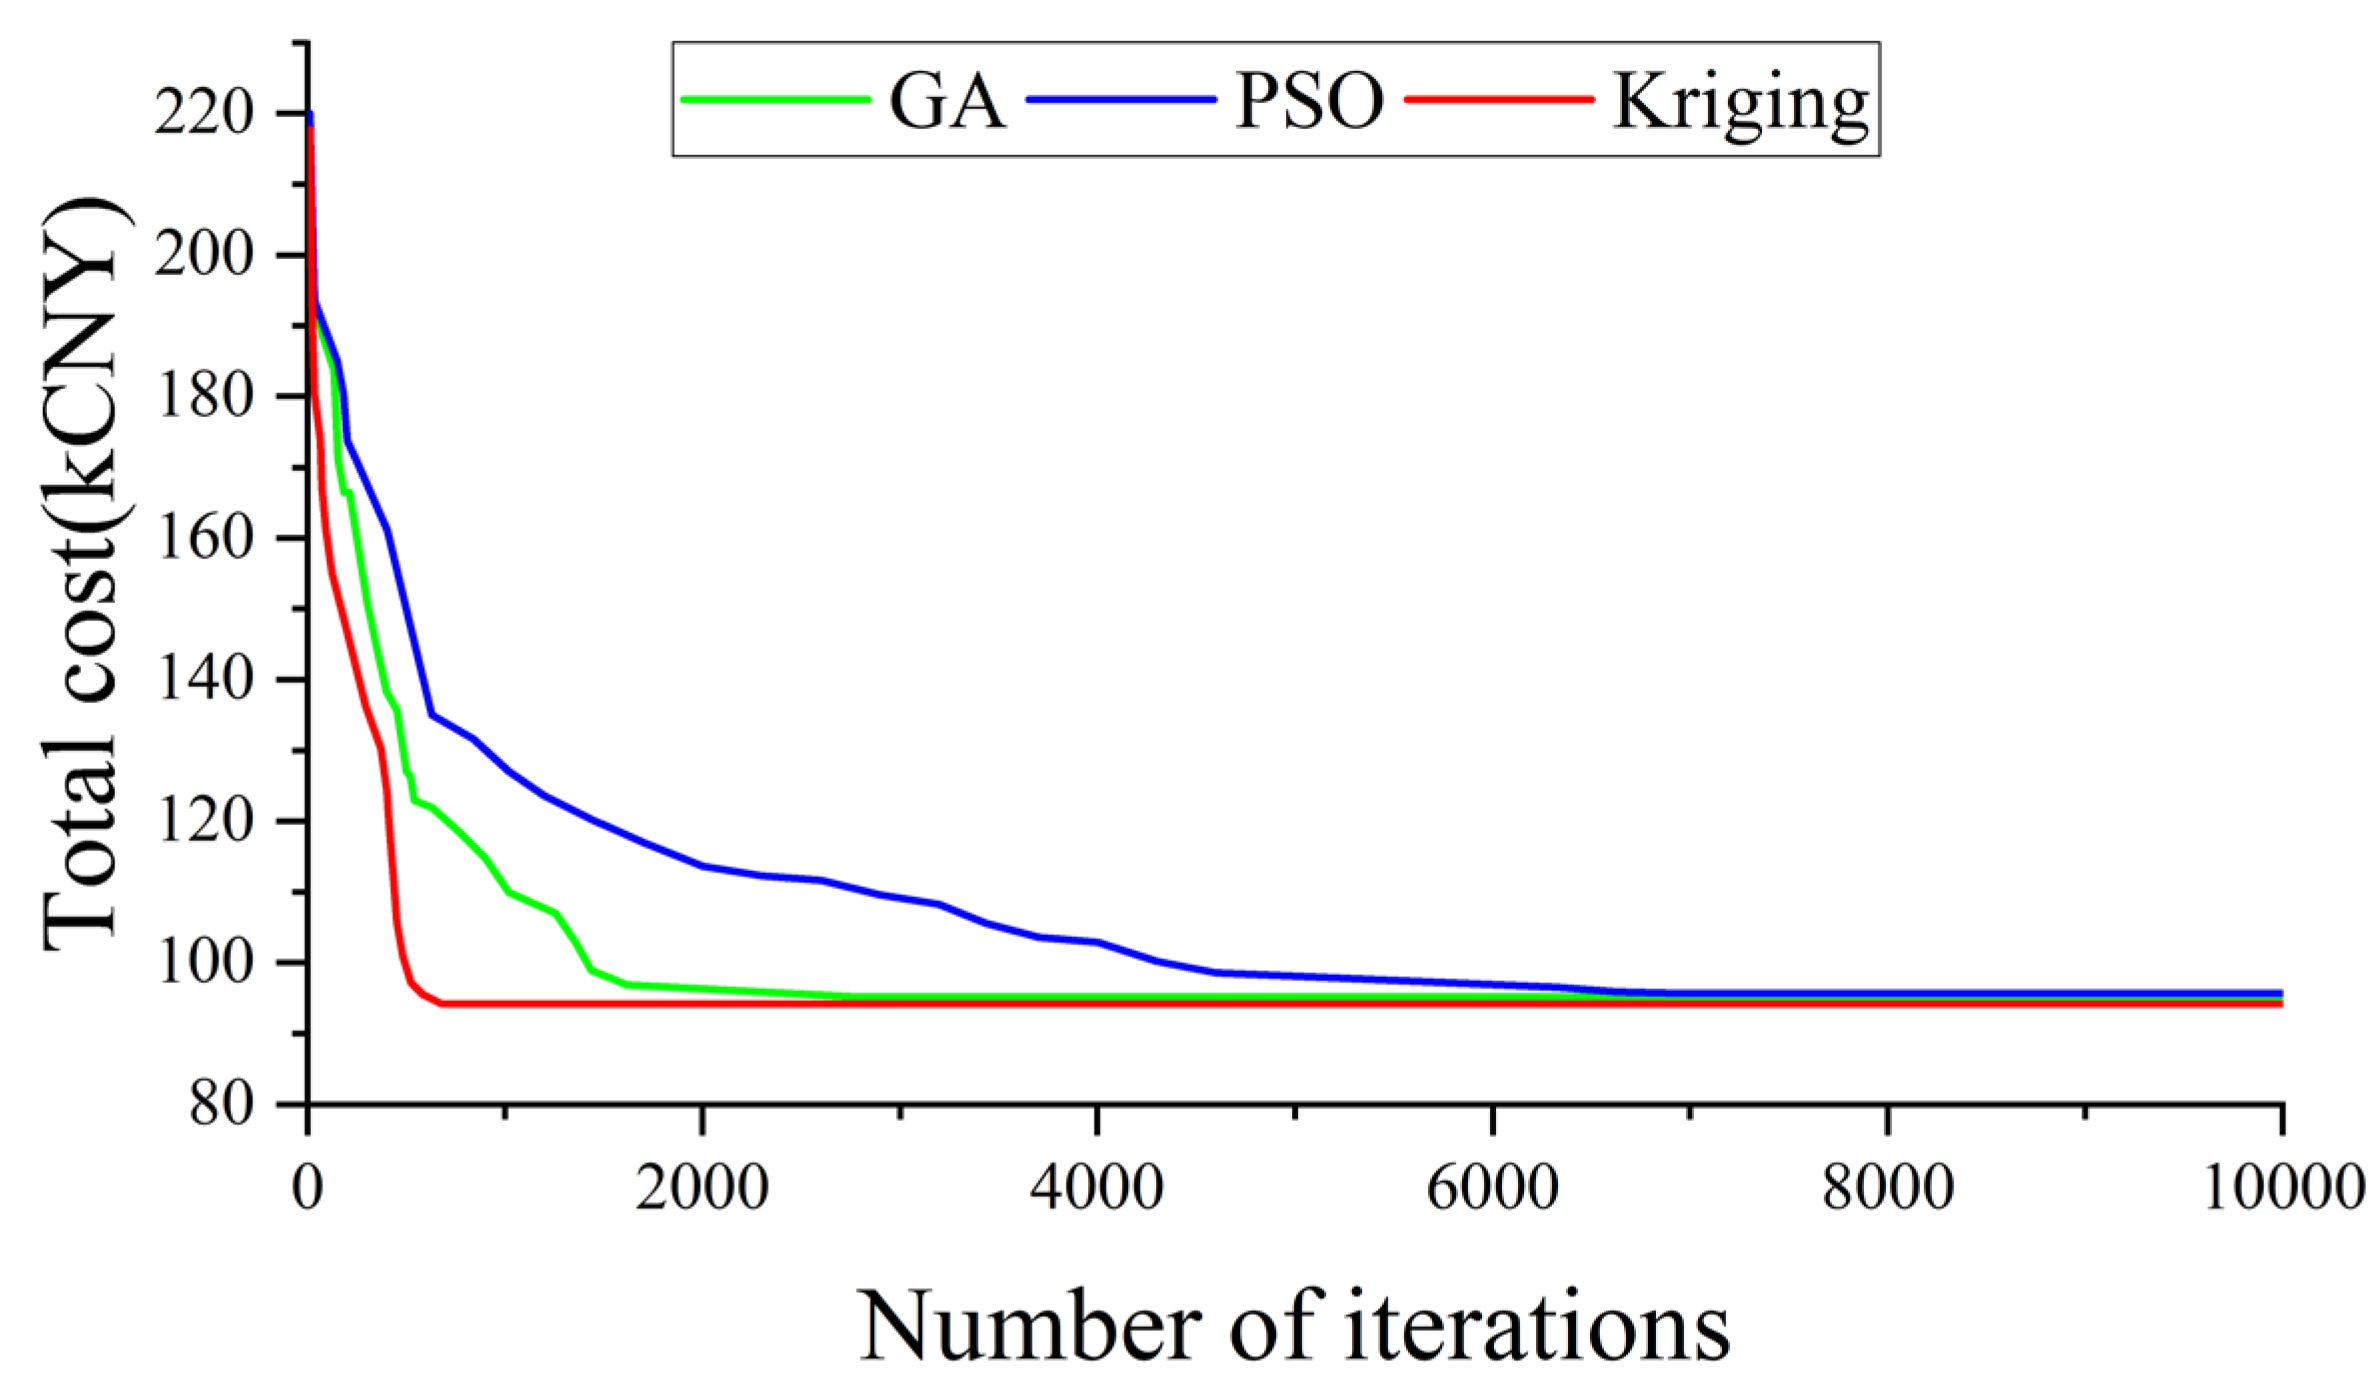
To validate the efficacy of the proposed optimization approach, the developed algorithm, PSO, and Genetic Algorithm (GA) are applied respectively to solve the intraday operational model, and the average values of 10 solution runs are employed as the results. The convergence behavior of each method is presented in
Figure 13, with optimization results tabulated in
Table 3.
Based on the data presented in the table and figure, compared with the traditional PSO, both the iteration count and the number of lower-level calls of the Kriging method exhibit a significant reduction. This phenomenon is primarily attributed to two key advantages of the Kriging model: first, it can replace the lower-level model during the solution process; second, it adopts a dynamic update strategy for the sample set and parameters, which enables timely correction of the Kriging model itself. Consequently, the Kriging model is able to reduce the frequency of lower-level model calls while ensuring optimization accuracy, thereby effectively accelerating solution speed.
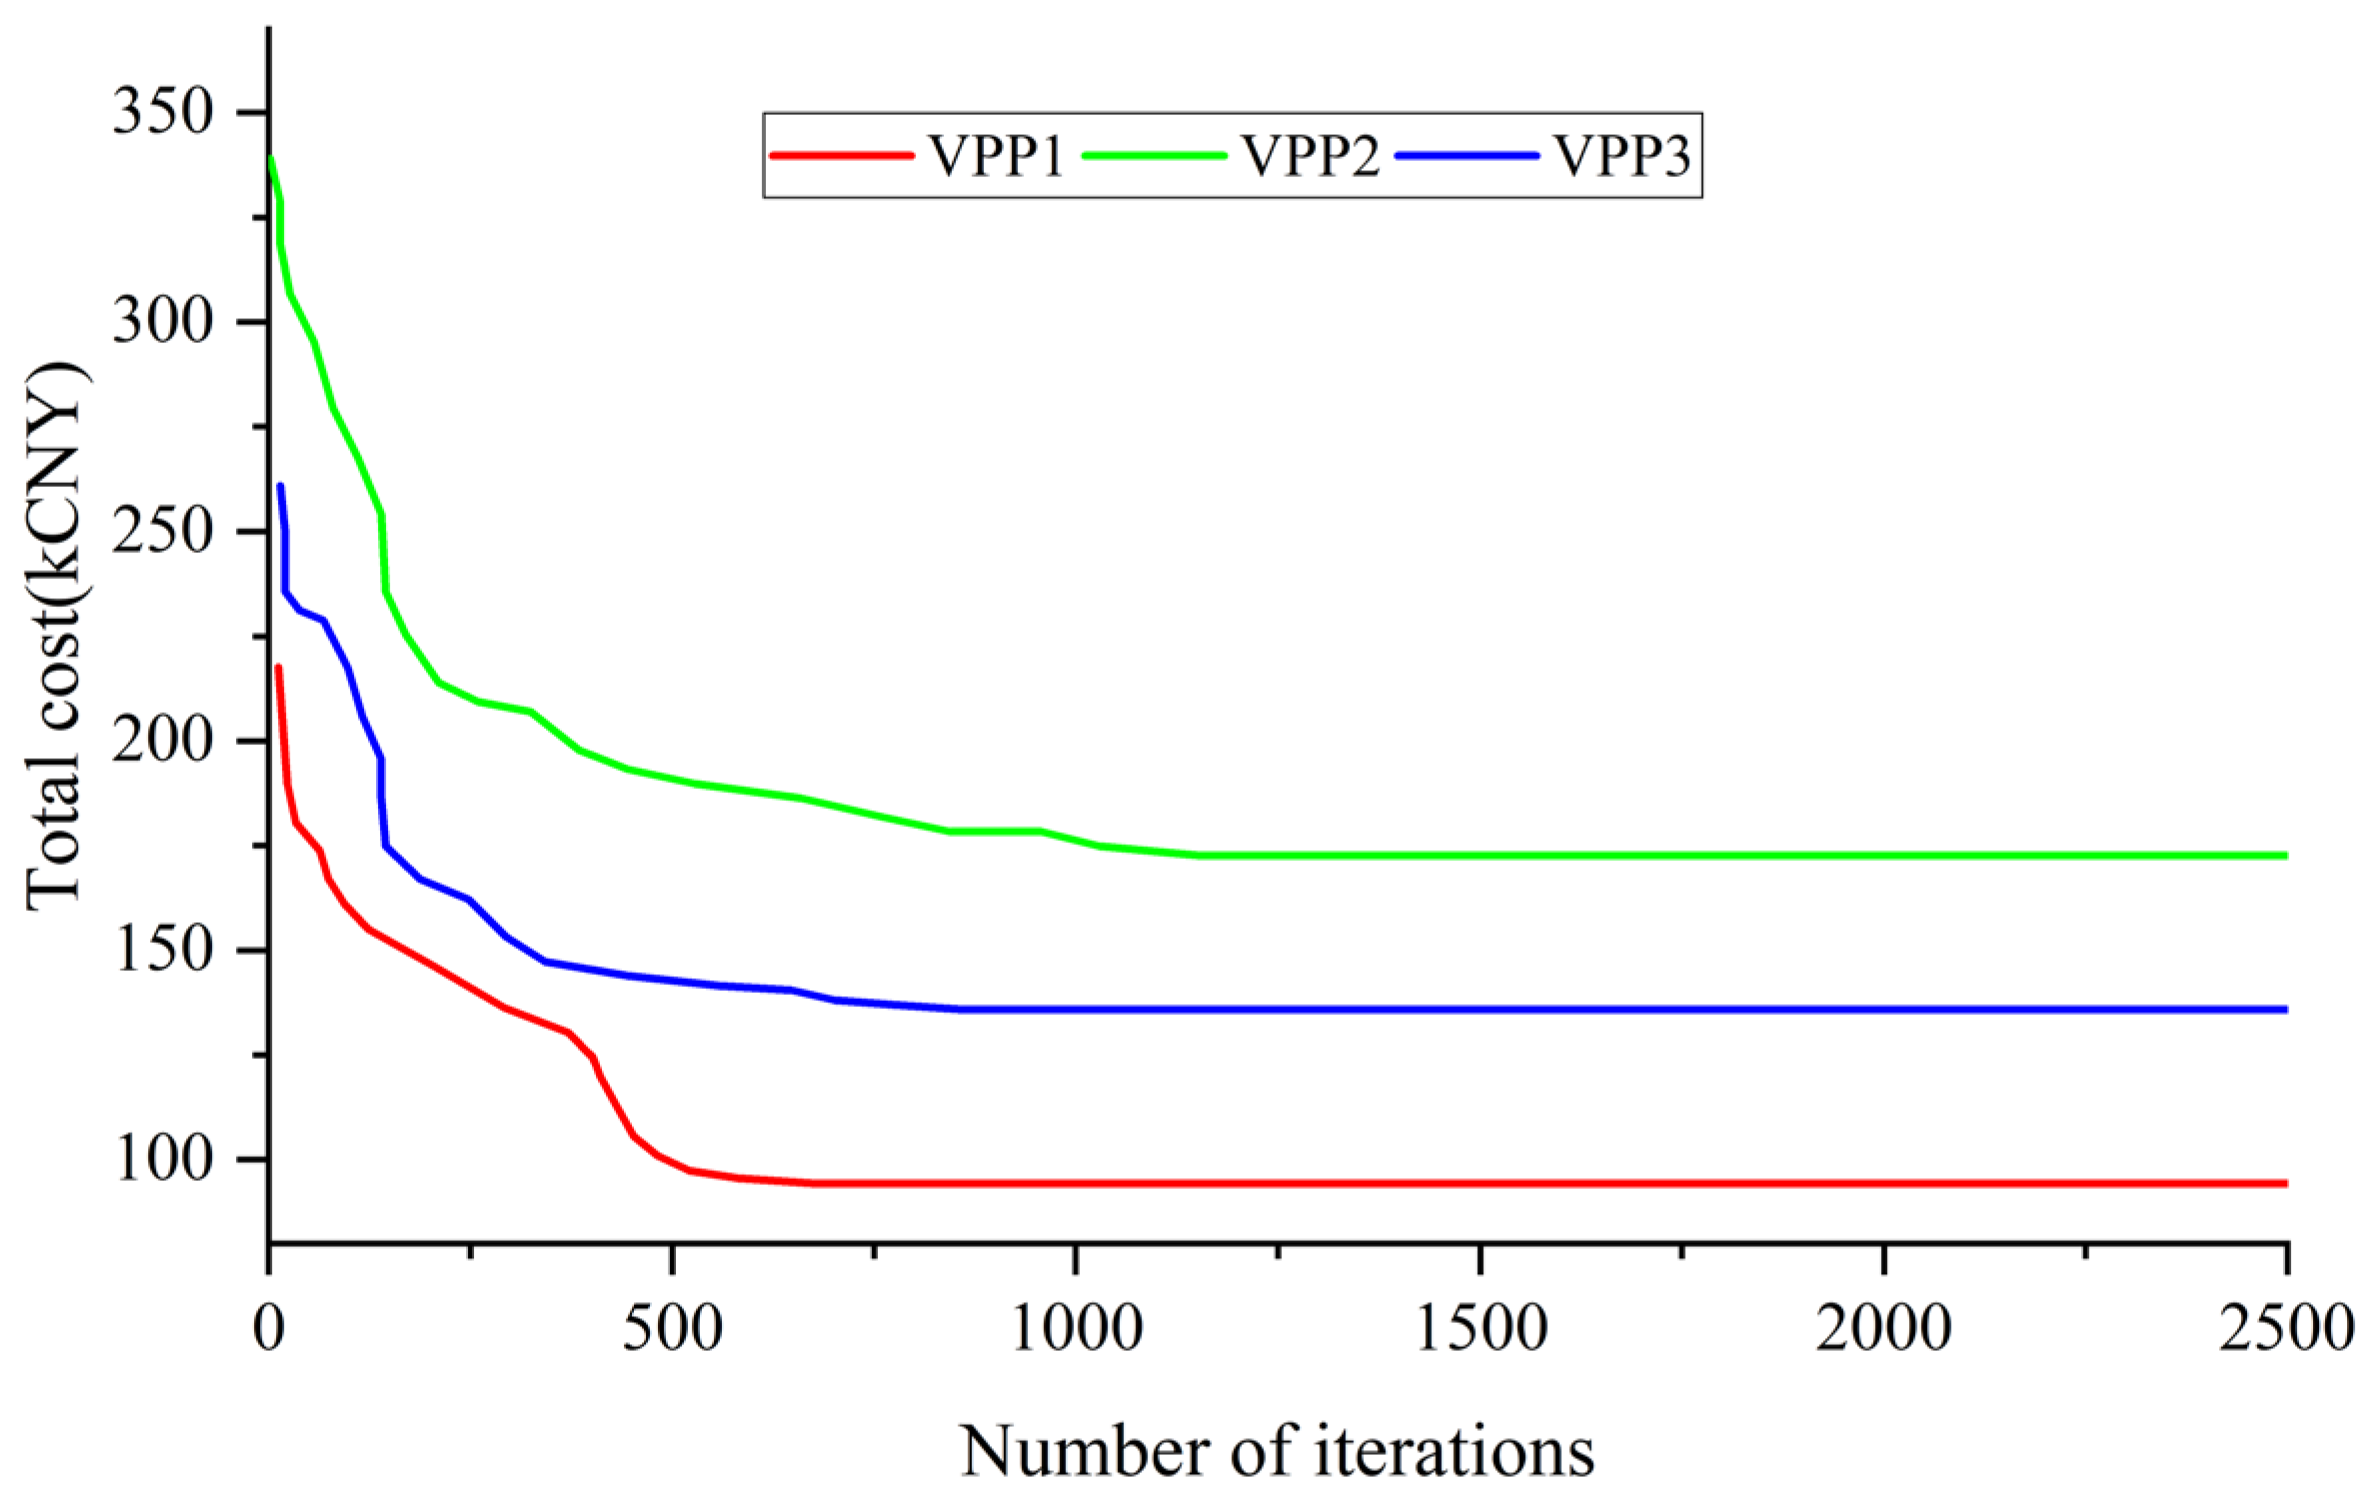
In addition, to verify the impact of the number of prosumers on the model solution algorithm, this paper sets up three VPPs containing 3, 4, and 5 prosumers respectively, and the solution results of the model are shown in
Figure 14 and
Table 4.
The experimental results show that as the number of prosumers increases, the model’s solution time and average number of iterations gradually rise. This is attributed to the expanded dimension of decision variables and strengthened constraint coupling relationship caused by the increased number of prosumers, which increases the computational load of the Stackelberg game. Notably, even when the number of prosumers increases to 5, the solution time is still controlled within 5 min, meeting the real-time requirements of intraday rolling scheduling. This confirms the efficiency and engineering applicability of the hierarchical solution based on the Kriging model.
It should be noted that the range of the number of prosumers in this experiment is relatively small. For large-scale VPP scenarios involving more prosumers, further verification is still needed to evaluate the algorithm’s scalability. Future research can optimize the sample updating strategy and the Kriging fitting method to enhance the adaptability of the algorithm to large-scale scenarios.