Article

Comparative LCA and Mass–Energy Evaluation of Thermal Sewage Sludge Treatment Pathways: Incineration, Gasification, Pyrolysis, and HTC


1
Department of Technologies and Installations for Waste Management, Silesian University of Technology, Konarskiego 18, 44-100 Gliwice, Poland
2
EnergySol Sp. z o.o., Przepiórek 53, 43-100 Tychy, Poland
3
Institute of Energy and Fuel Processing Technology, Zamkowa 1, 41-803 Zabrze, Poland
4
Department of Technical Physics, Faculty of Science, Forestry and Technology, University of Eastern Finland, FI-70211 Kuopio, Finland
*
Author to whom correspondence should be addressed.
Energies 2026, 19(3), 815; https://doi.org/10.3390/en19030815
Submission received: 1 December 2025 / Revised: 18 December 2025 / Accepted: 28 January 2026 / Published: 4 February 2026
(This article belongs to the Special Issue A Circular Economy Perspective: From Waste to Energy)

Abstract

Sewage sludge management is a major challenge in modern wastewater treatment, as sludge contains organic matter, nutrients, pathogens, heavy metals, and emerging contaminants. Increasing wastewater volumes from urbanization and population growth have led to steadily rising global sludge production, emphasizing the need for sustainable and resource-efficient treatment strategies. Conventional methods—such as landfilling, land application, and biological treatment—face limitations due to contaminant risks, regulatory restrictions, and incomplete pollutant removal. Thermal and thermochemical processes offer substantial volume reduction, energy recovery, and resource valorization. Incineration is widely implemented and ensures complete oxidation but requires high energy input and emission control. Gasification and pyrolysis produce syngas, bio-oil, and biochar, supporting circular economy applications, while hydrothermal carbonization (HTC) efficiently converts wet sludge into hydrochar without intensive drying. This study presents a comparative life cycle assessment (LCA) and mass–energy assessment of these four thermal treatment methods, highlighting their environmental impacts, energy efficiencies, and resources’ recovery potential to support more sustainable sludge management.

1. Introduction

Sewage sludge is a byproduct generated during wastewater treatment, comprising a complex matrix of organic matter, nutrients (such as nitrogen and phosphorus), pathogens, heavy metals, and other potentially hazardous constituents. The global production of sewage sludge is substantial and rising. It has been estimated that approximately 45 million tons of dry solids (DS) of sewage sludge are generated annually from municipal wastewater treatment plants worldwide [1]. Within Europe, annual sludge generation is on the order of 9–10 Mt DS [2].
Sewage sludge treatment encompasses a wide range of physical, biological, chemical, and thermal processes designed to reduce volume, stabilize organic matter, remove pathogens, and enable safe disposal or resource recovery [3,4,5]. These methods differ substantially in operating conditions, energy requirements, and environmental performance. The treatment of sewage sludge presents multiple challenges, including its high water content, pathogen load, persistent contaminants (heavy metals, micropollutants, PFAS), odor, and regulatory restrictions on land application or disposal [6,7,8].
Thermal processes have become increasingly important in sewage sludge management due to their ability to solve most of the above-mentioned problems: namely, by reducing volume, destroying pathogens, eliminating organic contaminants, and recovering energy [9,10]. The four major thermal technologies can be distinguished as follows: incineration, gasification, pyrolysis, and hydrothermal carbonization (HTC). These technologies differ significantly in operating conditions, energy performance, emission profiles, and potential for resource recovery [11,12]. Among the above-mentioned, incineration is the most mature technology. Also, it allows for achieving complete oxidation of organic matter and a very high degree of volume (and mass) reduction, yet demands large energy inputs and stringent flue-gas treatment to control emissions. Conversely, gasification and pyrolysis are oxygen-limited thermochemical processes that convert sludge into syngas, bio-oil, and biochar, enabling energy recovery and potential material reuse. HTC, conducted under subcritical aqueous conditions, is particularly attractive because it can process high-moisture sludge without prior drying, converting it into hydrochar with favorable stability and handling characteristics [13,14].
Incineration fully oxidizes sludge at 850–1000 °C in fluidized-bed or multiple-hearth furnaces, achieving up to 90% mass reduction and complete pathogen destruction. Heat recovery is possible, but the process is capital- and energy-intensive, requires advanced flue-gas treatment, and produces ash that must be managed. Gasification converts sludge under limited-oxygen conditions at 800–1000 °C, generating a combustible syngas and a vitrified slag with reduced leachability. It has lower dioxin and NOₓ emissions than incineration, but demands highly dried feedstock, suffers from tar formation, and is less mature for municipal sludge applications. Pyrolysis, carried out at 350–700 °C in the absence of oxygen, yields char, pyrolytic oil, and pyrolytic gas. It produces fewer emissions and offers opportunities for carbon sequestration through biochar use. However, drying is required, heavy metals may concentrate in the char, and pyrolytic oil typically requires upgrading due to instability. Hydrothermal carbonization (HTC) processes wet sludge at 180–250 °C and 2–10 MPa, producing hydrochar without the need for prior drying. It improves dewaterability and reduces pathogens, but heavy metals can accumulate in the hydrochar. HTC is still scaling toward full commercial deployment [14,15,16,17]. Table 1 summarizes the technical specification of each of the analyzed technologies.
In this paper, a comparative LCA and a mass and energy assessment of four thermal sewage sludge treatment technologies—incineration, gasification, pyrolysis, and HTC—is presented. The majority of existing LCA studies on sewage sludge management concentrate on comparisons of conventional treatment routes, including landfilling, agricultural application, composting, anaerobic digestion, and incineration, with incineration typically being considered the sole thermal treatment option. In contrast, advanced and emerging thermal technologies such as gasification, pyrolysis, and hydrothermal carbonization (HTC) are generally evaluated on an individual basis or at a conceptual level, rather than being systematically assessed within a unified and harmonized LCA framework. Consequently, a comparative LCA that simultaneously evaluates incineration, gasification, pyrolysis, and HTC under consistent assumptions, system boundaries, and functional units addresses a significant research gap. The objectives of the study are as follows: to quantify and compare their environmental impacts across key life-cycle categories; analyze mass and energy flows to determine process efficiencies; and assess the potential for resource recovery, such as energy or nutrient recycling. Through this integrated analysis, we contribute to the development of sustainable sludge management solutions that align with circular economy principles.

2. Materials and Methods

2.1. Sewage Sludge Data Set

For the purpose of the calculations, it is assumed that the urban area is served by a wastewater treatment plant (WWTP) with a design capacity of a 100,000 population equivalent (PE). Based on the conducted analyses, the average annual production of sewage sludge, expressed as dry solids (DS), is estimated at approximately 15 kg DS/PE/year. Calculations were restricted to sewage contributions from permanent and temporary residents, excluding industrial discharges and the intermittent input from non-resident populations, due to the high variability associated with these sources. Under these assumptions, the average annual sludge production from the WWTP is estimated at 1500 Mg DS/year. Additionally, the sludge composition is considered as an average derived from both in-house laboratory analyses and publicly available datasets [18].
For the present analysis, selected wastewater treatment methods are considered to be representative for typical WWTP:
  • Crude screening.
  • Primary sedimentation.
  • Biochemical oxidation.
  • Secondary sedimentation.
  • Sludge fermentation.
  • Sludge mechanical dewatering.
The analyzed sewage sludge characteristics are summarized in Table 2.
Sewage sludge is characterized by significantly high moisture content, exceeding 80%, which is common for sewage sludge from typical WWTP. Further dewatering below 80% moisture content very often depends highly on the type of processed wastewater and the source of removed impurities. For sewage sludges with moisture content exceeding 80% w/w, the typical LHV ranges below 1000 kJ/kg, often obtaining negative values. This parameter is very crucial for further sewage sludge thermal treatment, as utilization of such material requires additional input of high-calorific fuel for process stabilization.

2.2. Methodology of Analyses

LCA is a scientifically grounded methodology used to quantify the environmental impacts of a product, process, or service throughout its entire life cycle. It is widely applied in research, policy development, and industrial practice, including the energy, construction, and manufacturing sectors, to support evidence-based sustainability assessments and decision-making [19,20].
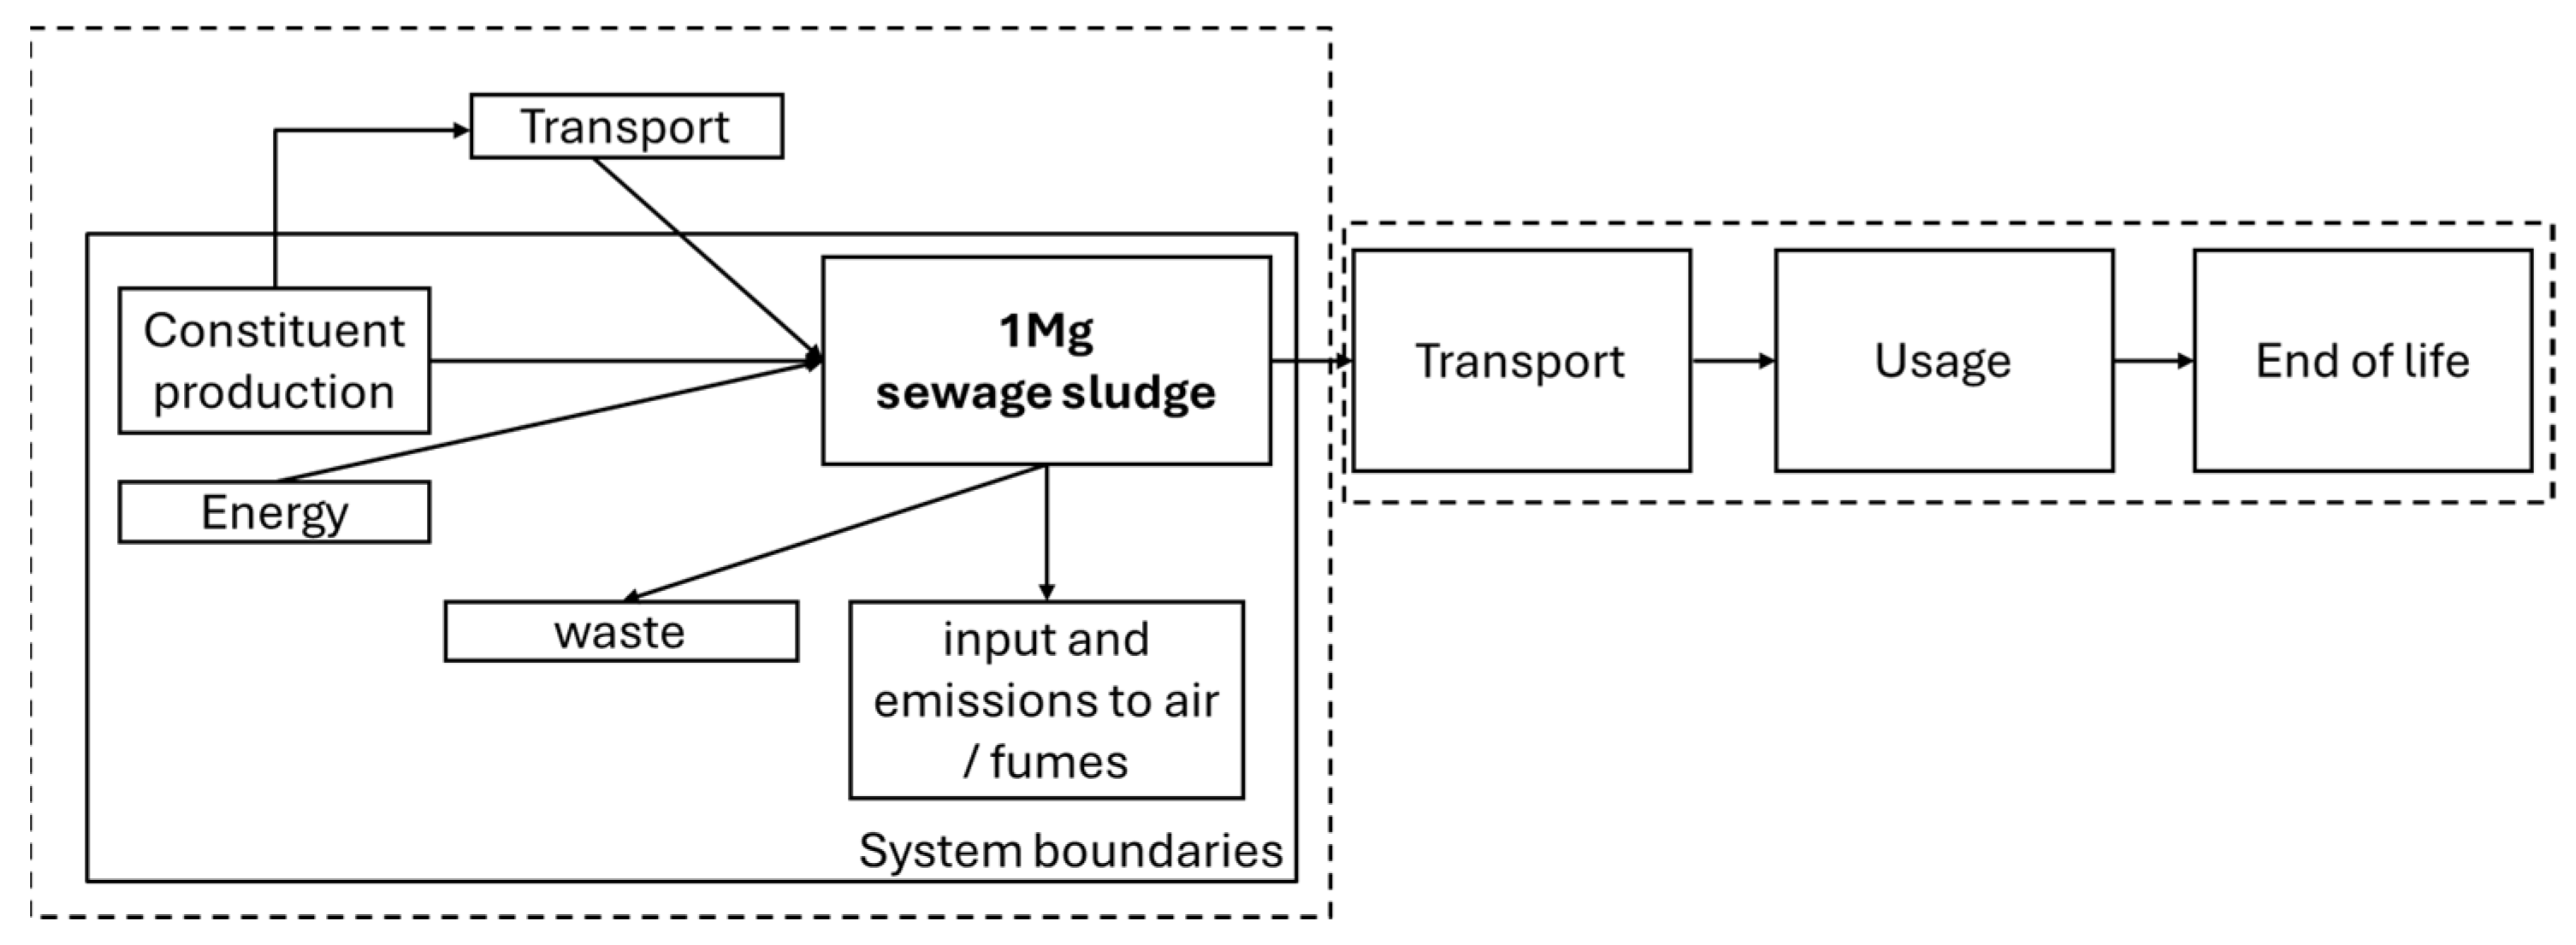
The LCA was conducted to compare environmental impacts across four sludge treatment routes—incineration, gasification, pyrolysis, and hydrothermal carbonization (HTC). Each scenario incorporated system boundaries from sludge to end-product utilization (cradle-to-gate). Inventory data covered material and energy inputs, emissions to air, water, and soil, and recovered products or by-products. The system boundaries are shown in Figure 1.
The LCA was conducted using a cut-off system model. All background and auxiliary processes were modeled according to the cut-off approach, meaning that upstream processes were included up to the point of material and energy supply, while processes beyond the defined system boundary were excluded in accordance with the cut-off criteria.
Electricity consumption was modeled using the Polish electricity mix to reflect country-specific energy conditions. For the remaining background processes and material inputs, datasets with a global scope (GLO) were primarily applied. All life cycle inventory data were sourced consistently to ensure methodological coherence across the system.
The analysis was carried out in a fully consistent manner with respect to data sources, system boundaries, and modeling assumptions. It should be noted that the resulting environmental impacts are sensitive to key assumptions, particularly the electricity mix and geographical scope. Consequently, the results may differ when alternative energy mixes or different regional datasets are applied.
A functional unit (FU) is a key concept used in LCA to provide a reference basis for quantifying the inputs and outputs of a system. It defines what exactly is being analyzed and allows for results to be compared consistently between different systems or scenarios. FU is defined as 1 Mg of sewage sludge, which corresponds to 1 metric ton of sludge. All environmental impacts are therefore calculated and expressed per 1 Mg of sewage sludge treated or processed.
In the assessment of sewage sludge management pathways, the ReCiPe 2016 Midpoint (H) V1.07/World (2010) H method was selected and implemented using the established SimaPro Craft 10.3 software. This ensured methodological consistency and the comparability of the life cycle impact assessment (LCIA) results, minimizing potential discrepancies across the analyzed sludge treatment technologies—incineration, gasification, pyrolysis, and hydrothermal carbonization (HTC).
The ReCiPe methodology, originally developed in 2008 by the Dutch National Institute for Public Health and the Environment (RIVM), in cooperation with Radboud University Nijmegen, Leiden University, and PRé Consultants, and updated in 2016, remains one of the most widely applied LCIA methods globally. It converts life cycle inventory data into quantifiable environmental impact indicators. The hierarchical (H) perspective adopted in this study represents a balance between precautionary and scientific viewpoints in environmental modeling.
At the midpoint level, ReCiPe 2016 quantifies 18 environmental impact categories, capturing specific cause–effect mechanisms before their translation into broader damage indicators. These include the following:
  • Climate change, stratospheric ozone depletion, ionizing radiation, ozone formation (for both human health and terrestrial ecosystems), fine particulate matter formation, acidification, and eutrophication (freshwater and marine).
  • Human toxicity (carcinogenic and non-carcinogenic) and ecotoxicity (terrestrial, freshwater, and marine).
  • Land use, mineral and fossil resource scarcity, and water use.
This midpoint-oriented approach enables the identification of dominant environmental burdens associated with each sludge treatment pathway, providing a problem-oriented perspective that is useful for technology comparison.

3. Results and Discussion

3.1. Incineration

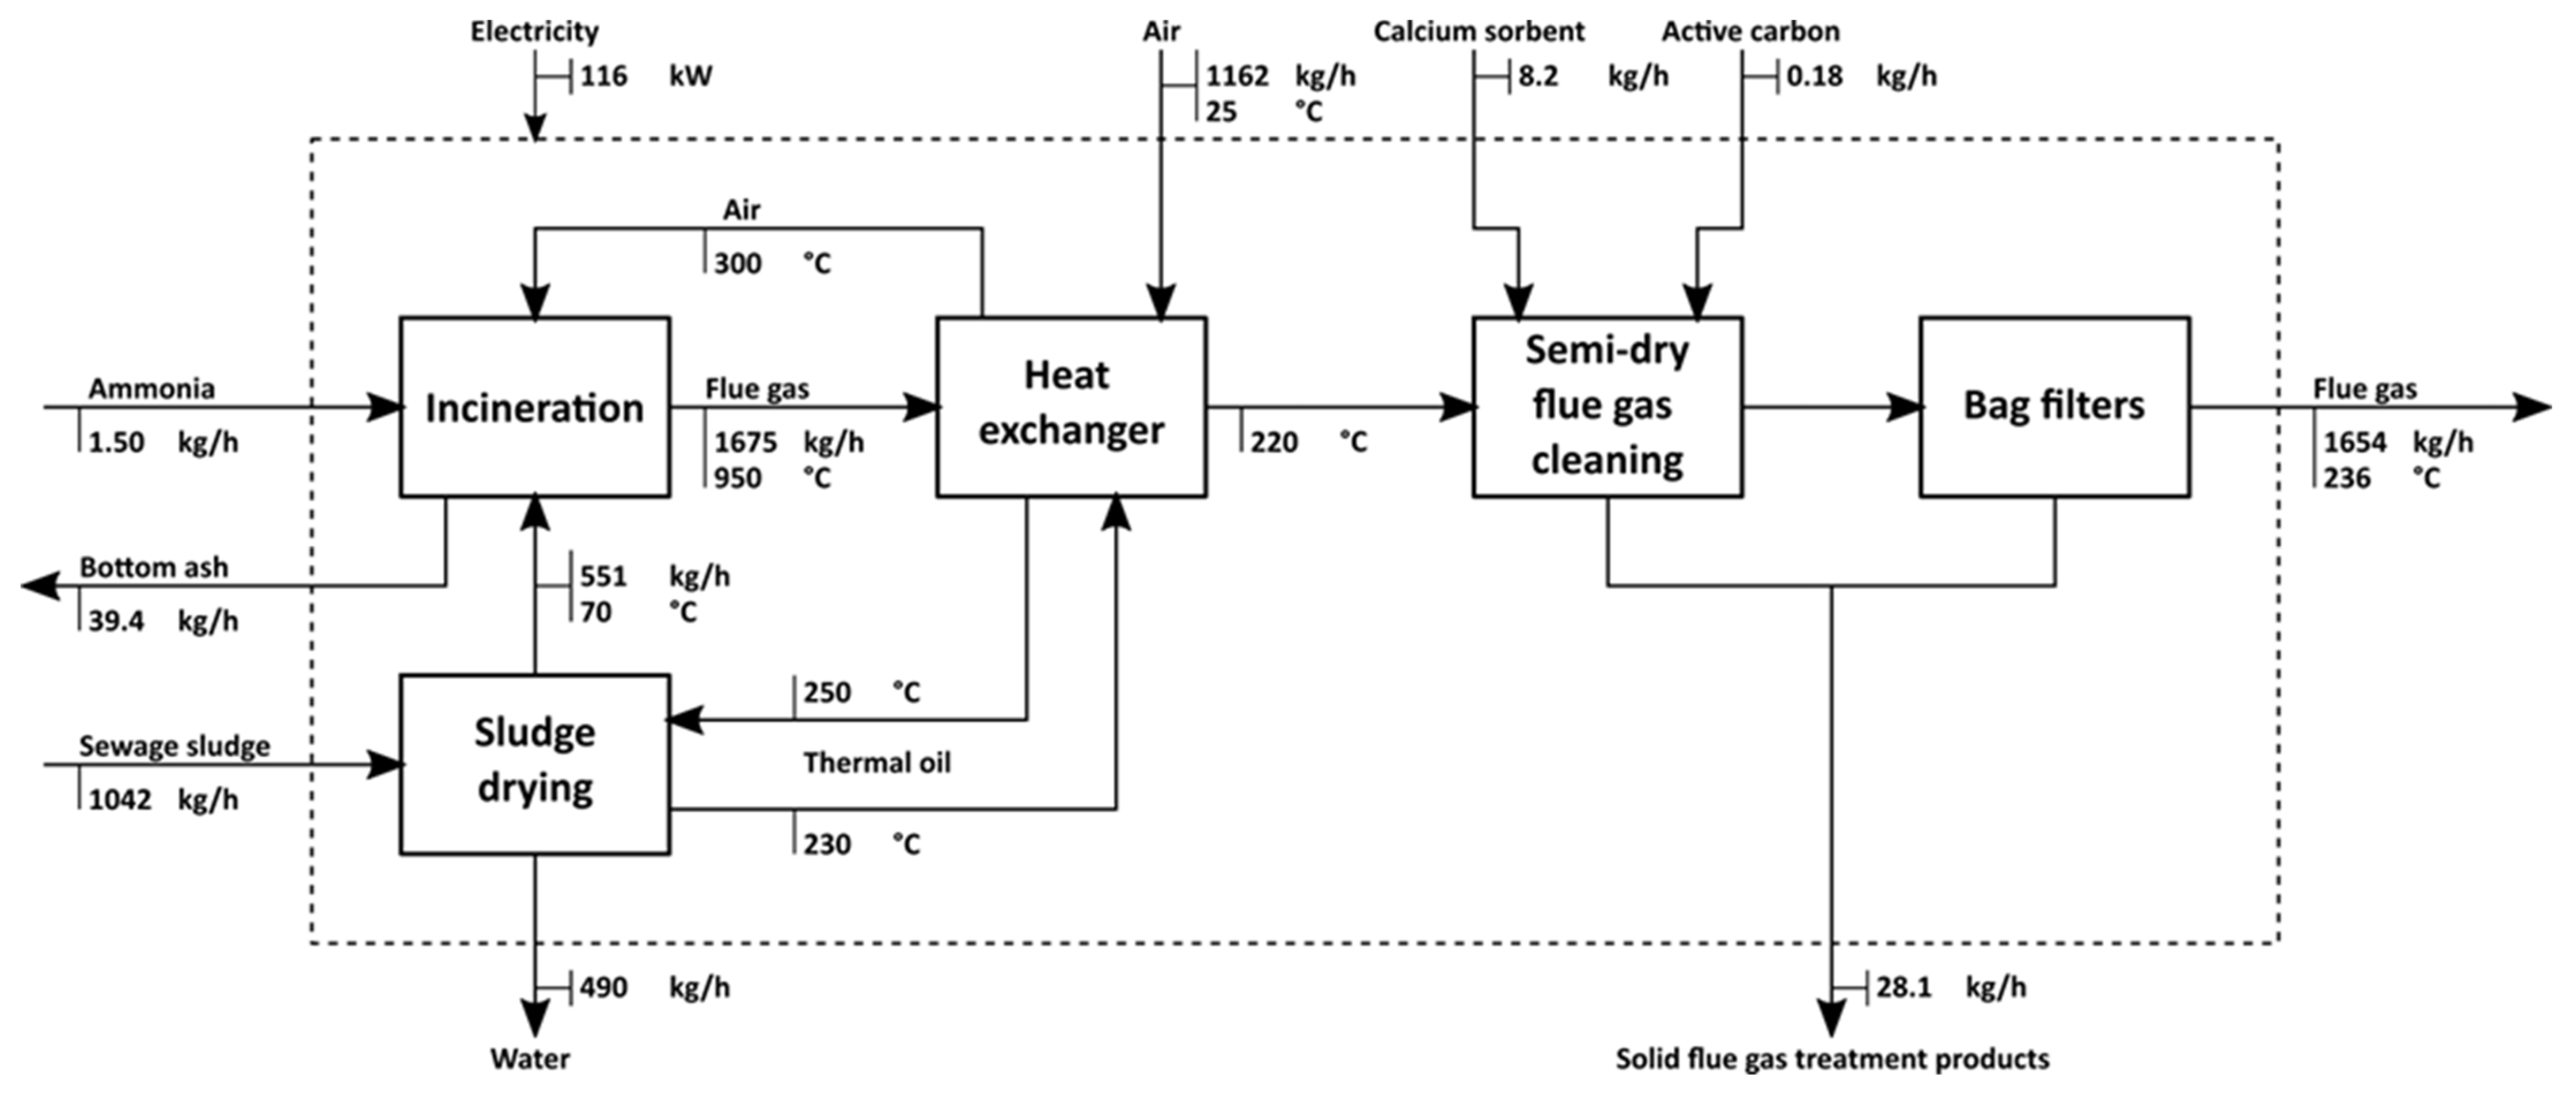
Figure 2 illustrates the schematic diagram of the sewage sludge incineration process.
In the incineration process, sewage sludge is firstly dried in the sewage sludge dryer to a moisture content of around 66%. Drying allows us to increase the LHV of the sludge to around 3800 kJ/kg, which is necessary for autothermal incineration. Dried sludge is fed to the fluidized bed incinerator, where sludge is incinerated using air as an oxidizing agent, at a stable temperature of ~950 °C. Additionally, ammonia water is added as a DeNOx reagent. Hot flue gas is then cooled in the heat exchanger, providing heat for the thermal oil used as a heat source for the dryer. Cooled flue gas is then cleaned in a semi-dry flue gas cleaning system, using calcium sorbent for acid gas removal and activated carbon for heavy metal and organic pollutant removal.
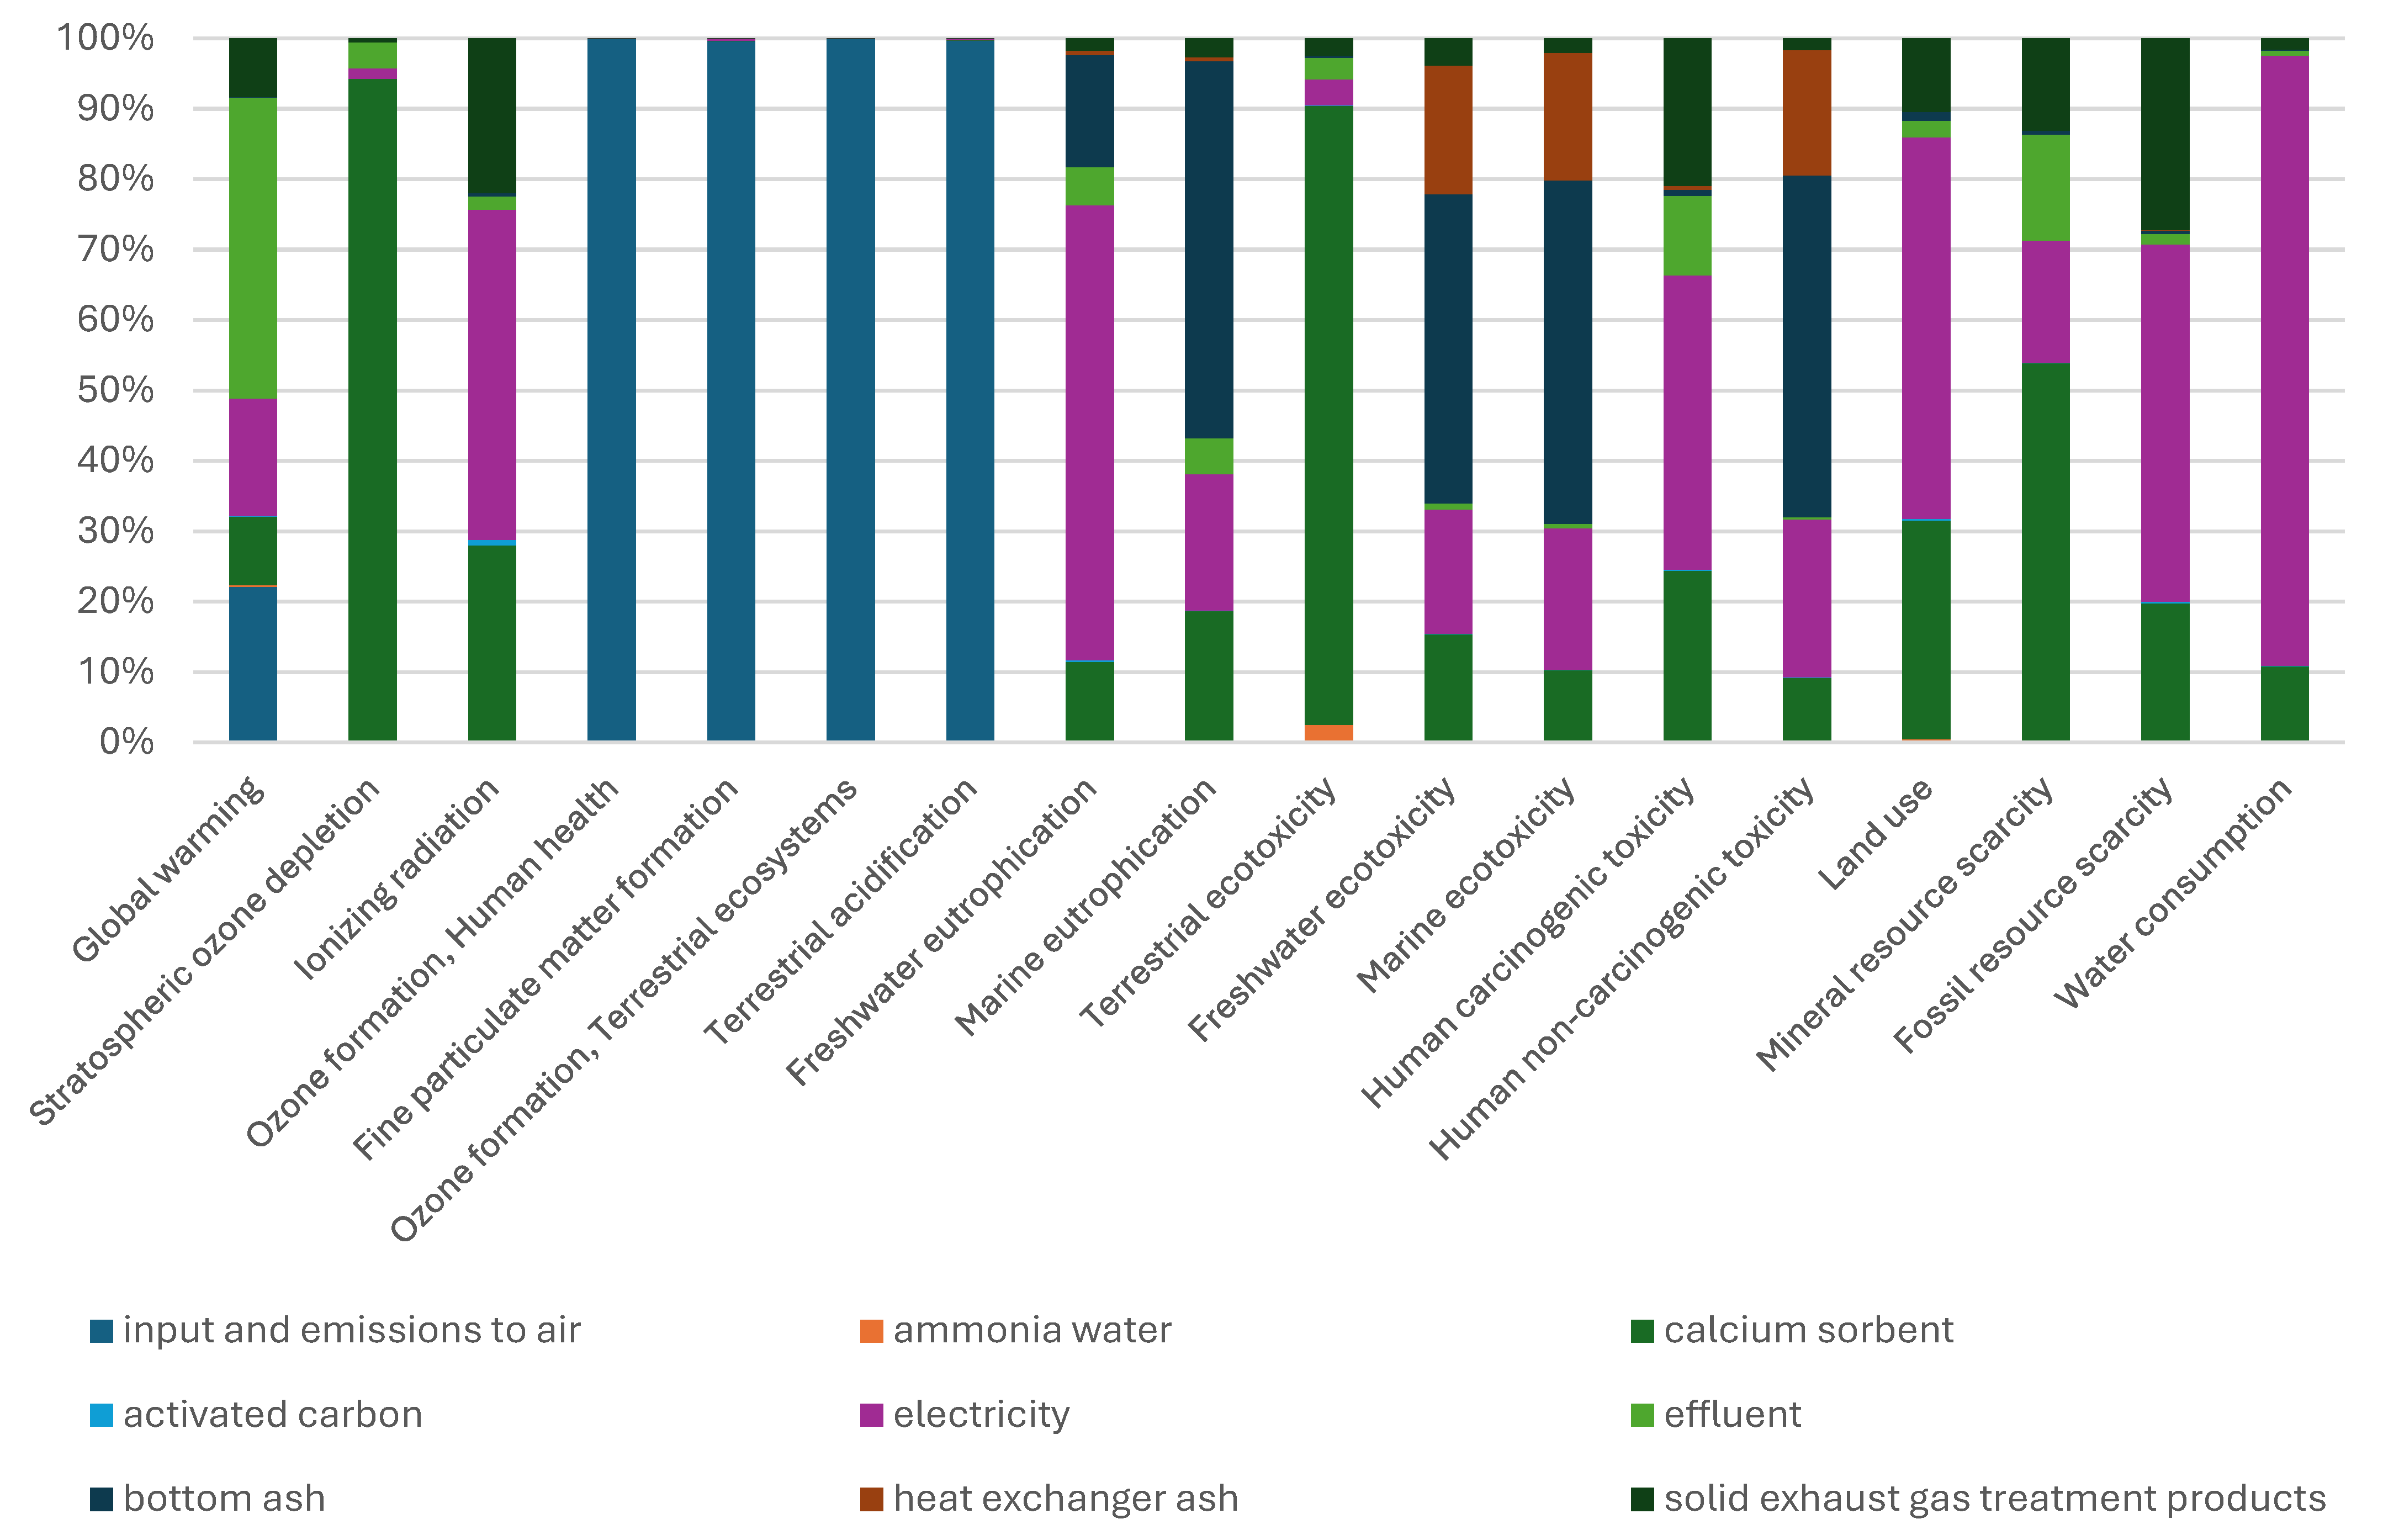
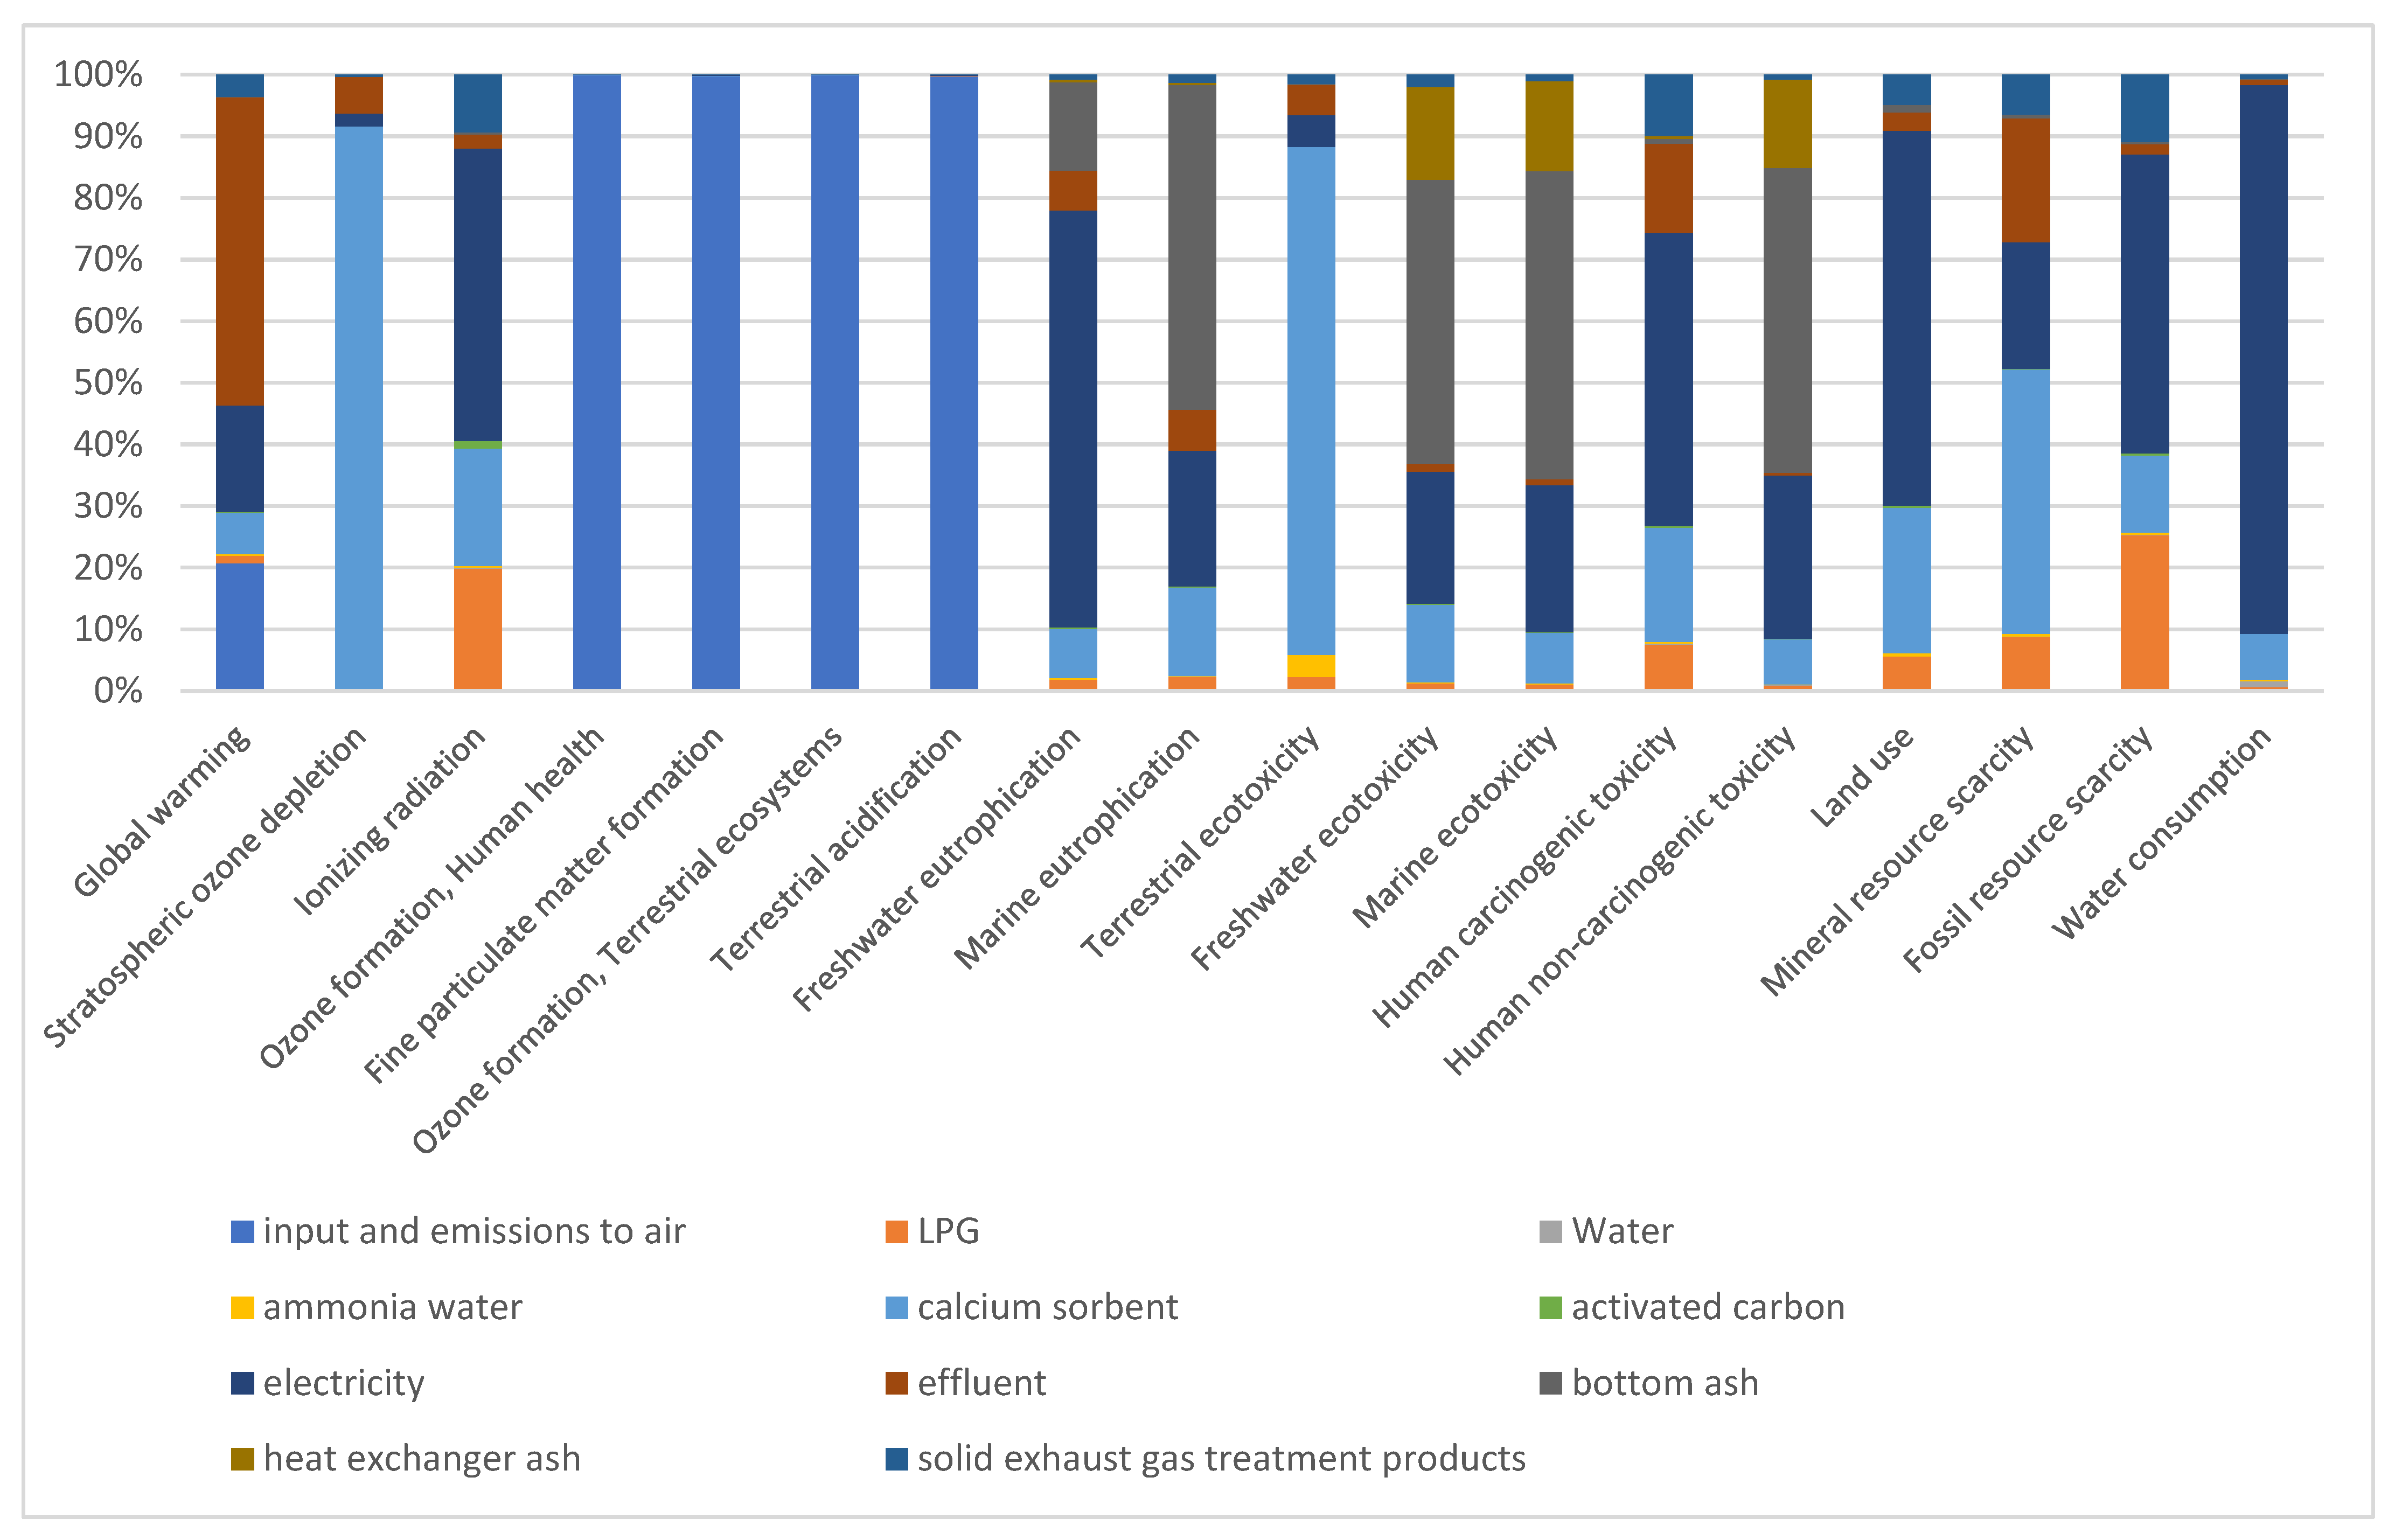
Table 3 presents the characterized LCA results for the sewage sludge incineration process, highlighting the main hotspots identified within each impact category. Figure 3 shows the weighted LCA results for the sewage sludge incineration process, providing an overall perspective on the relative significance of individual environmental impacts.
The LCA of sewage sludge incineration reveals that the process has diverse environmental impacts, with several distinct hotspots across the assessed categories. The total global warming potential amounts to a 0.689 kg CO2 equivalent, with the dominant contributions coming from emissions to air, bottom ash, and electricity consumption. These components account for the majority of greenhouse gas emissions, indicating that both the incineration process itself and the energy demand are key drivers of climate-related impacts. The influence of other inputs, such as calcium sorbent or activated carbon, is comparatively minor in this category.
For stratospheric ozone depletion and ionizing radiation, the main contributors are the calcium sorbent and electricity use. This points to the indirect environmental load associated with upstream processes in material production and power generation, rather than the incineration process itself. Air emissions play a particularly critical role in categories related to air quality. Ozone formation for both human health and terrestrial ecosystems, as well as fine particulate matter formation, are almost entirely caused by emissions to the air, which exceed 99% of the total impact in these categories.
In terms of acidification and eutrophication, terrestrial acidification is mainly driven by sulfur dioxide and nitrogen oxide emissions released into the atmosphere during incineration. Freshwater and marine eutrophication impacts are more closely connected to effluent and bottom ash, suggesting that nutrient releases to water bodies play an important role.
The most significant results are observed in the toxicity-related categories. Marine ecotoxicity reaches a 127 kg 1,4-DCB equivalent, while human non-carcinogenic toxicity and terrestrial ecotoxicity reach 107 and 8.71 kg 1,4-DCB equivalents, respectively. These impacts are primarily associated with the handling of solid residues, such as bottom ash and heat exchanger ash, as well as electricity consumption. The data indicate that the toxic emissions and heavy metal content in incineration residues are major contributors to the overall environmental burden.
Resource-related categories also show relevant contributions. Fossil resource scarcity and mineral resource scarcity are mainly influenced by electricity consumption and calcium sorbent use, reflecting the energy- and material-intensive nature of the process. Water consumption, which totals 5.95 × 10⁻³ m3, is largely related to electricity generation and the use of ammonia water in the process.
The LCA demonstrates that the incineration of sewage sludge is characterized by several environmental hotspots. Emissions to the air dominate the impact on climate change, acidification, and ozone formation, while solid residues such as bottom ash and heat exchanger ash are the main sources of ecotoxicity and human toxicity. Electricity consumption contributes substantially to global warming and resource depletion, whereas calcium sorbent production adds minor but non-negligible impacts. The results highlight the need for emission control, improved ash management, and energy efficiency measures to reduce the overall environmental footprint of sewage sludge incineration.

3.2. Gasification

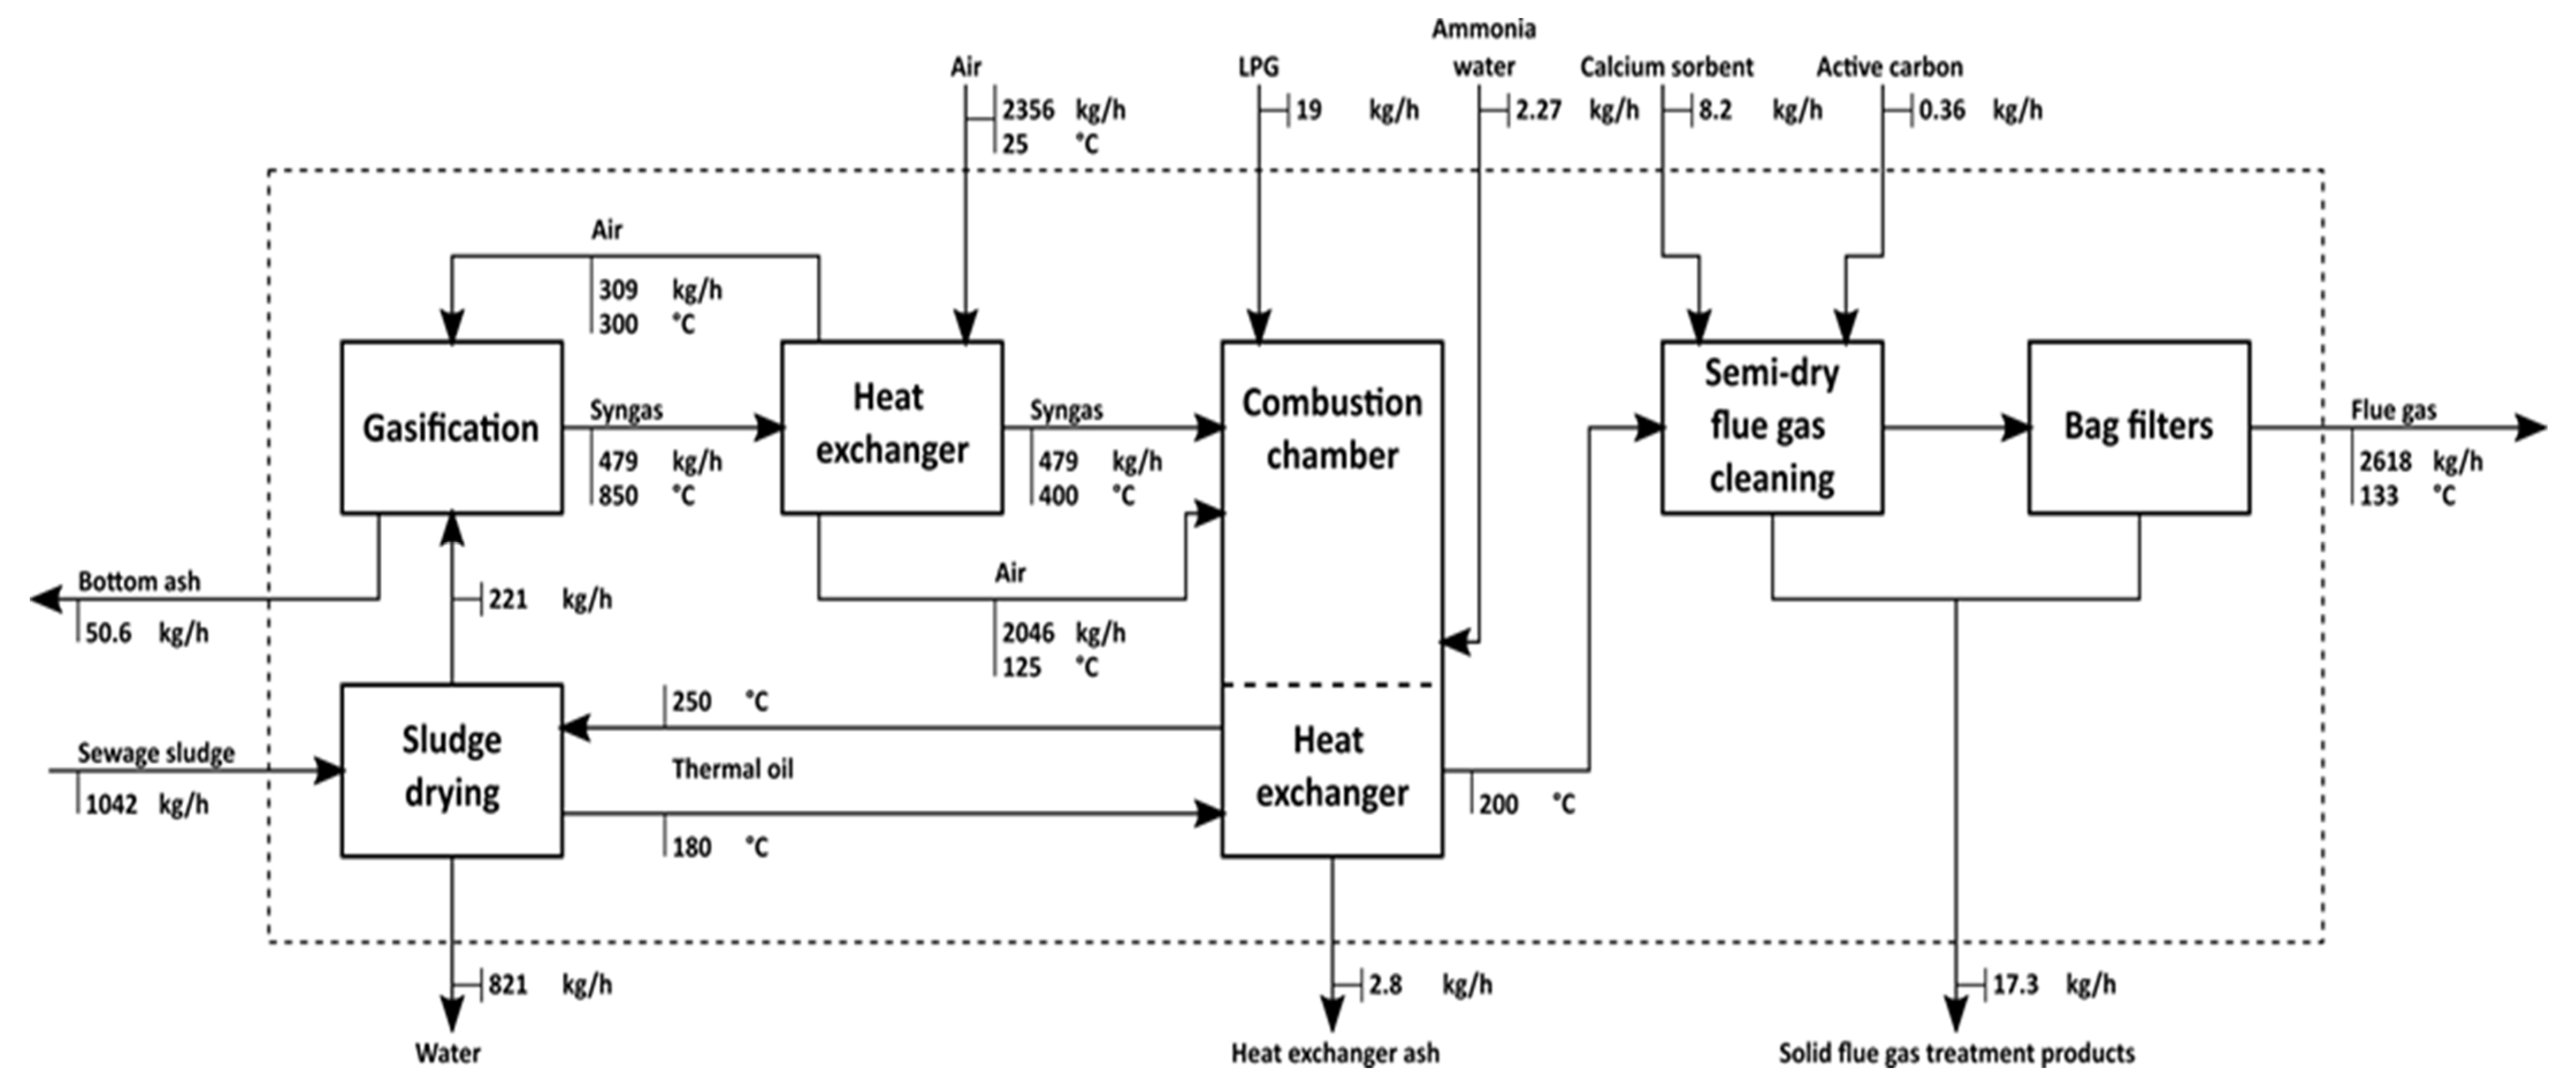
Figure 4 presents the schematic diagram of the sewage sludge gasification process.
In the gasification process, sewage sludge is firstly dried in the dryer to a moisture content of around 15%. Drying is necessary for the gasification process, allowing for autothermal gasification in the reactor. Dried sludge is fed to the fluidized bed gasifier, where the gasification process is carried out at a temperature of around 850 °C, with a λ factor of around 0.3. Hot syngas is cooled in the air cooler, heating the air used for the gasification process, and is then directed to the incineration chamber. Hot flue gas passes through the heat exchanger, heating the thermal oil used as a heat source for the dryer. To provide sufficient heat flow for the dryer, LPG is incinerated in the incineration chamber as additional fuel. Additionally, ammonia water is added as the DeNOx reagent. Cooled flue gas is cleaned in a semi-dry flue gas cleaning system, using calcium sorbent for acid gas removal and activated carbon for heavy metal and organic pollutant removal.
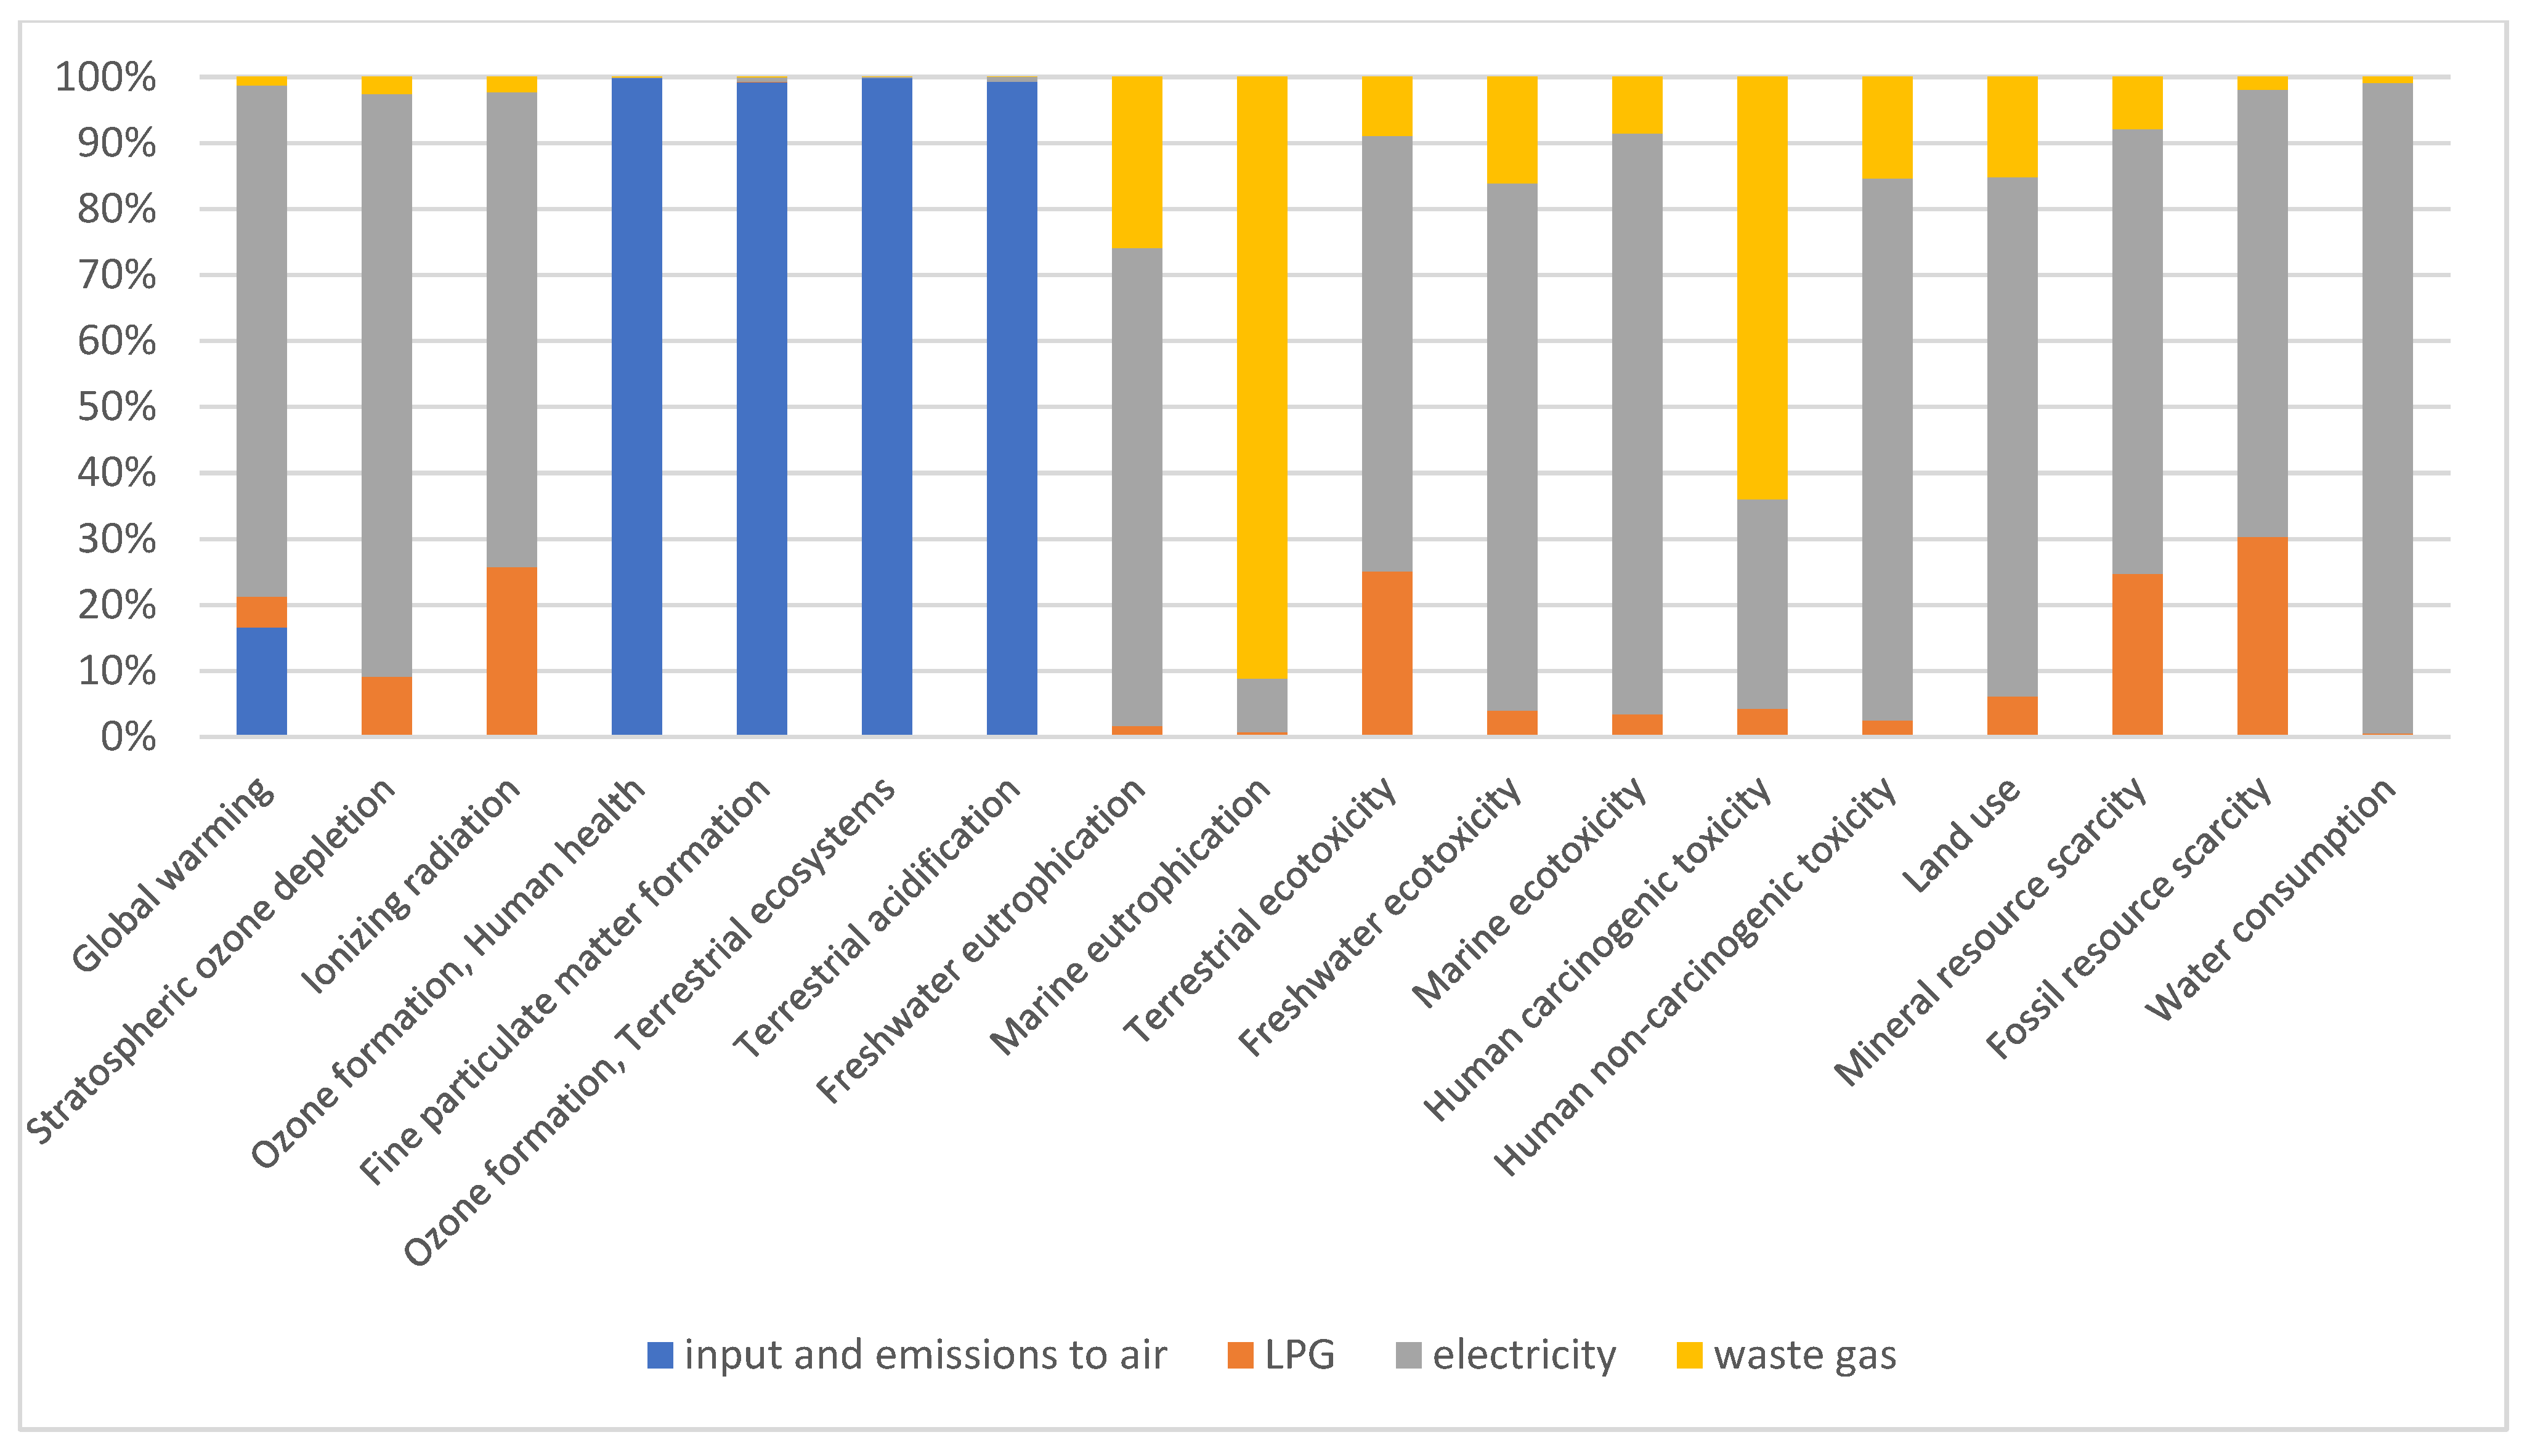
Table 4 presents the characterized LCA results for the sewage sludge gasification process, highlighting the main hotspots identified within each impact category. Figure 5 shows the weighted LCA results for the sewage sludge gasification process, providing an overall perspective on the relative significance of individual environmental impacts.
The LCA of sewage sludge gasification demonstrates a complex environmental profile, with several impact categories showing distinct hotspots associated with specific process stages and inputs. The total global warming potential amounts to a 0.987 kg CO2 equivalent, with the highest contribution coming from the gasification stage itself (0.205 kg CO2 eq) and the treatment of sewage sludge (0.493 kg CO2 eq). Electricity consumption (0.17 kg CO2 eq) and the use of inorganic nitrogen fertilizer and activated carbon also play relevant roles. This indicates that both direct emissions from gasification and the upstream energy inputs are key contributors to climate change impacts.
Stratospheric ozone depletion (2.32 × 10⁻⁶ kg CFC-11 eq) is mainly influenced by the production of activated carbon and electricity, while ionizing radiation (0.00518 kBq Co-60 eq) is primarily related to electricity use and the generation of bottom ash. Airborne emissions have a major impact on ozone formation and particulate matter formation, as reflected in the high results for ozone formation (1.73 kg NOx eq) and fine particulate matter formation (0.191 kg PM2.5 eq). These categories are almost entirely dominated by the gasification process itself, confirming that direct emissions are a critical hotspot affecting air quality and human health.
For terrestrial acidification, with a total impact of 0.625 kg SO2 eq, the gasification process again represents the main contributor, followed by the electricity and sludge treatment. In eutrophication categories, both freshwater and marine eutrophication impacts are relatively low overall, but the main contributions stem from effluent-related components and sludge residues.
The most significant environmental burdens are observed in toxicity-related categories. Terrestrial ecotoxicity reaches a 9.30 kg 1,4-DCB equivalent, mainly due to the use of inorganic nitrogen fertilizer and the gasification process itself. Freshwater and marine ecotoxicity, with 0.021 and 157.9 kg 1,4-DCB equivalents, respectively, are driven primarily by electricity use, sewage sludge treatment, and the management of bottom and fly ash. Similarly, human carcinogenic and non-carcinogenic toxicity (3.29 and 133.7 kg 1,4-DCB eq, respectively) are dominated by electricity generation, bottom ash handling, and emissions associated with activated carbon and sludge residues. These results suggest that waste residue management and the treatment of solid by-products are critical hotspots for toxic emissions.
Resource use and consumption indicators also highlight important environmental pressures. Fossil resource scarcity totals a 0.10 kg oil equivalent, which is mainly driven by electricity and natural gas consumption, while mineral resource scarcity (4.48 × 10⁻⁴ kg Cu eq) is largely linked to the production of activated carbon and electricity. Water consumption (8.54 × 10⁻³ m3) is mostly associated with electricity generation and sludge treatment, with only minor contributions from other inputs such as ammonia water or inorganic fertilizers.
LCA of sewage sludge gasification shows that the gasification stage, sewage sludge treatment, and electricity consumption are the principal environmental hotspots across most impact categories. Direct air emissions dominate the impacts related to climate change and air quality, while ash management and electricity use are the main sources of ecotoxicity and human toxicity. Resource-related impacts are primarily connected to upstream energy and material inputs. These findings underline the importance of improving process efficiency, optimizing energy sources, and enhancing residue management to reduce the overall environmental footprint of sewage sludge gasification.

3.3. Pyrolysis

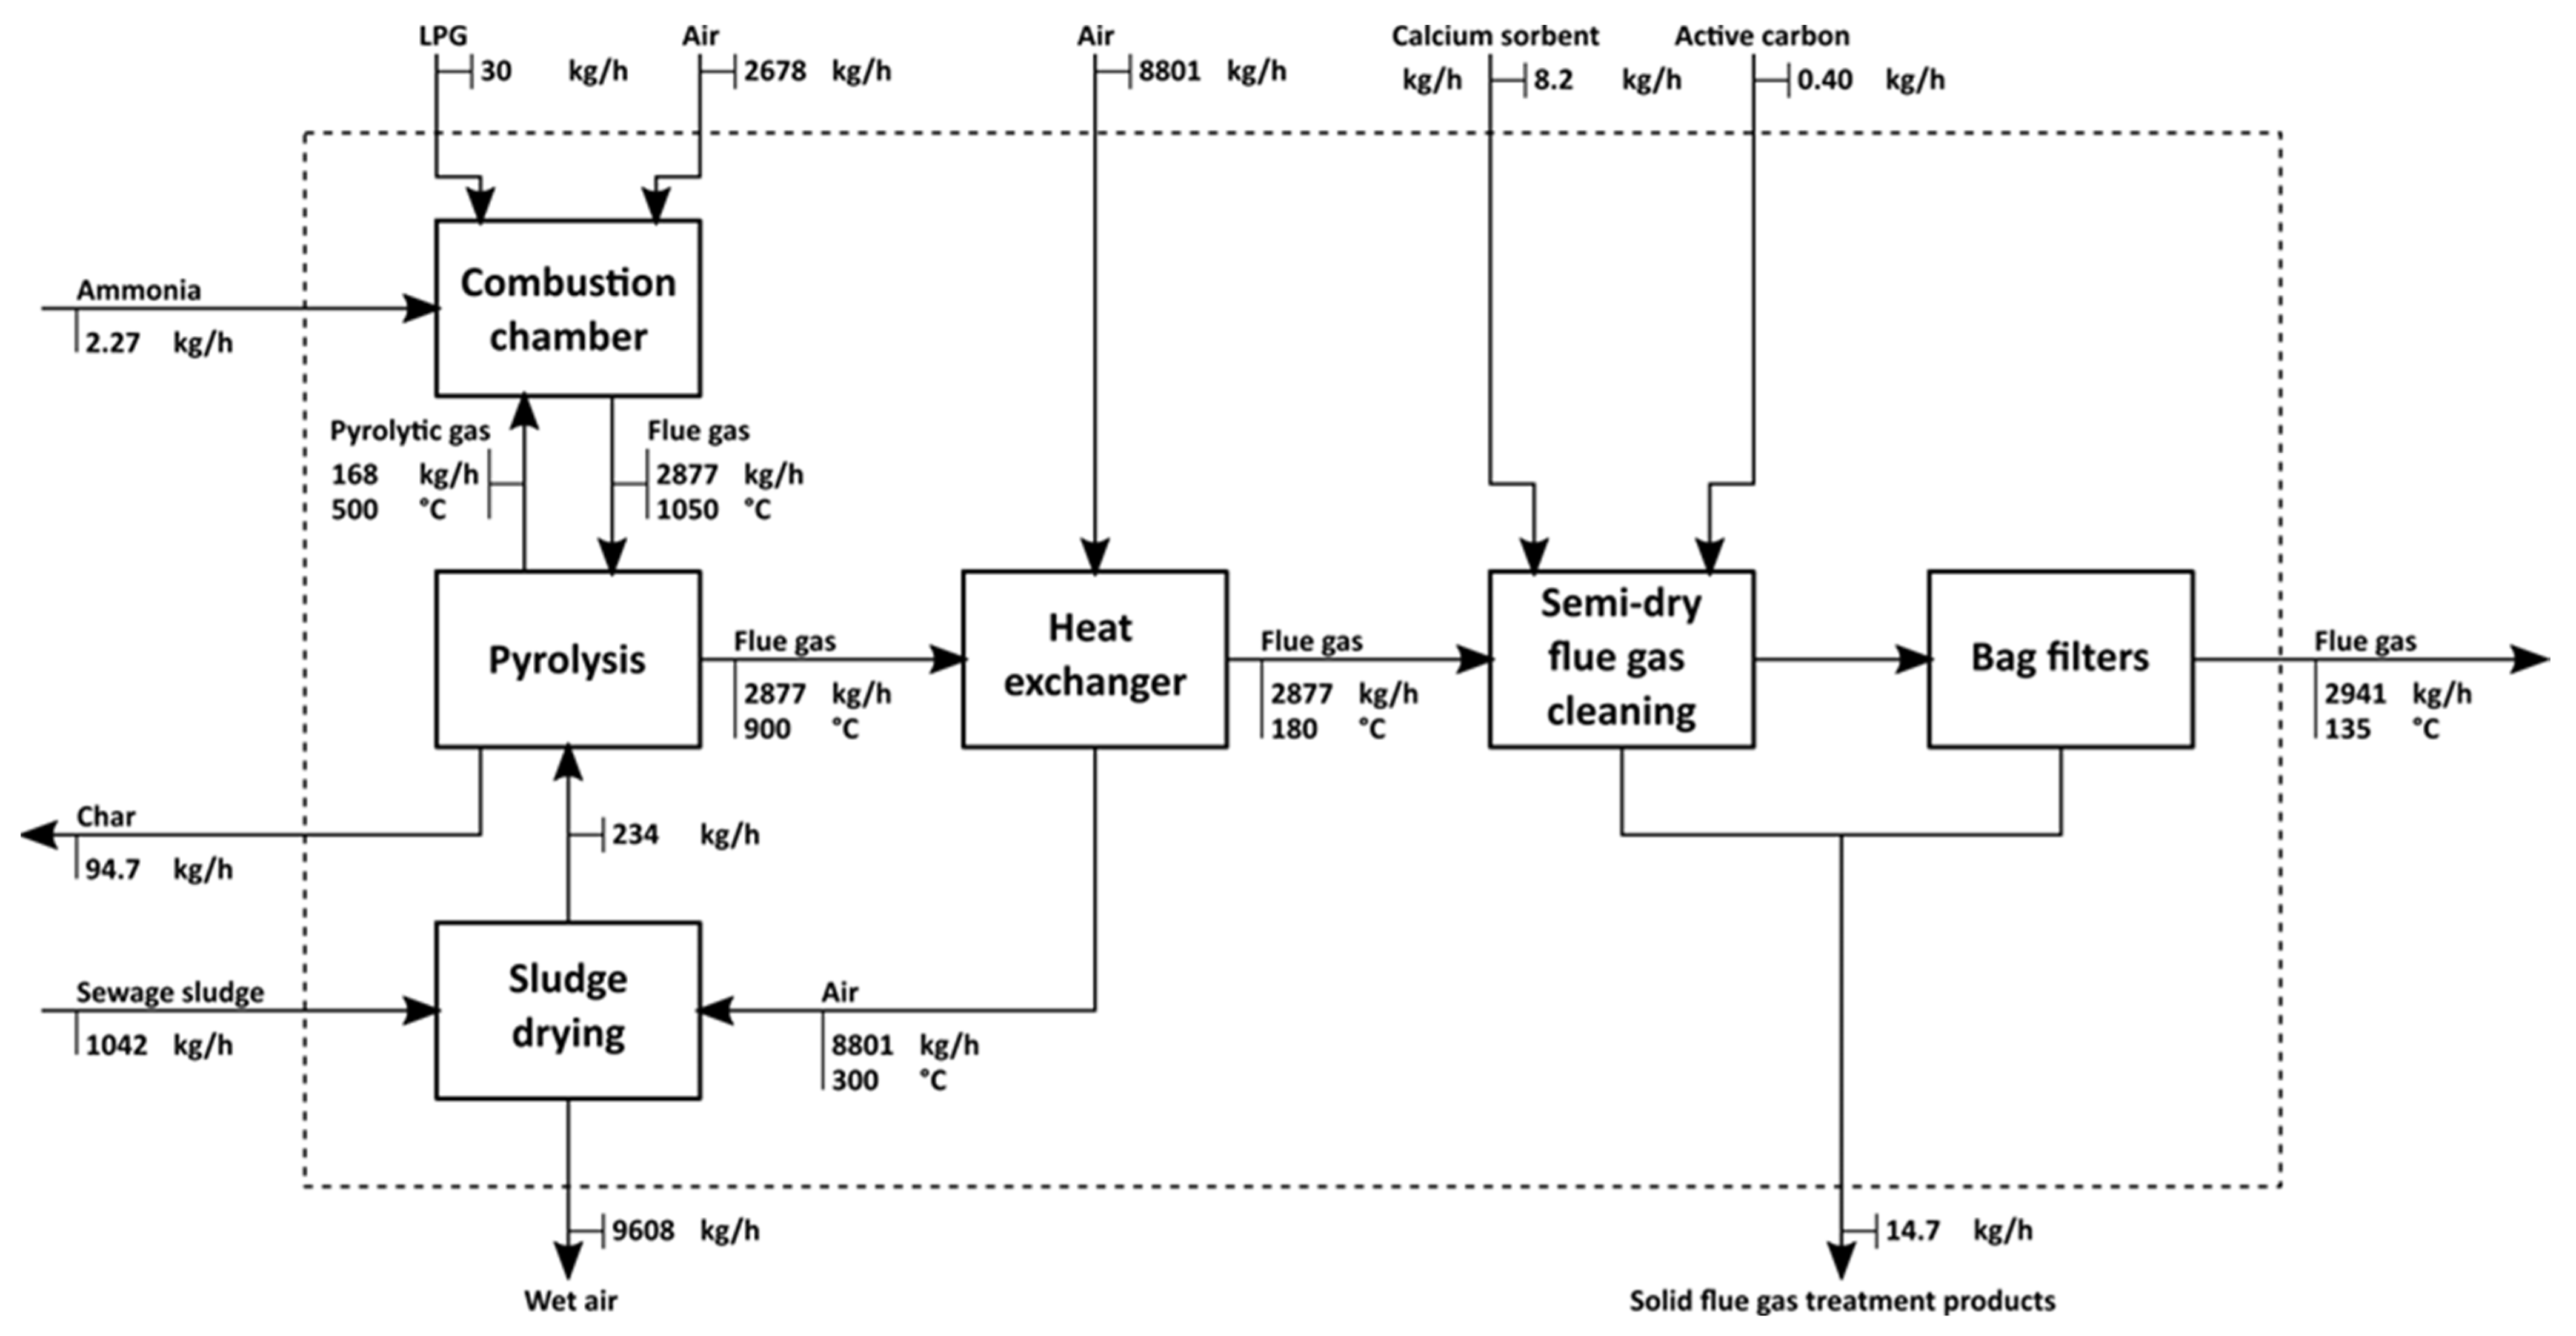
Figure 6 illustrates the schematic diagram of the sewage sludge pyrolysis process.
In the pyrolysis process, sewage sludge is firstly dried in the dryer to a moisture content of around 20%. Lowering the moisture content of the sewage sludge provides extra heating value that is necessary for the stabilization of the pyrolysis. Dried sludge is fed to the rotary drum pyrolysis reactor, producing pyrolytic gas and char in the process temperature of around 500 °C. Hot pyrolytic gas is then combusted in the incineration chamber, producing hot flue gas, which is used as a heat carrier for the pyrolysis process, as well as to heat the air used as a drying medium for the sewage sludge dryer. To provide sufficient heat flow for the dryer, LPG is incinerated in the incineration chamber as additional fuel. Additionally, ammonia water is added as the DeNOx reagent. Cooled flue gas is cleaned in a semi-dry flue gas cleaning system, using calcium sorbent for acid gas removal and activated carbon for heavy metal and organic pollutant removal.
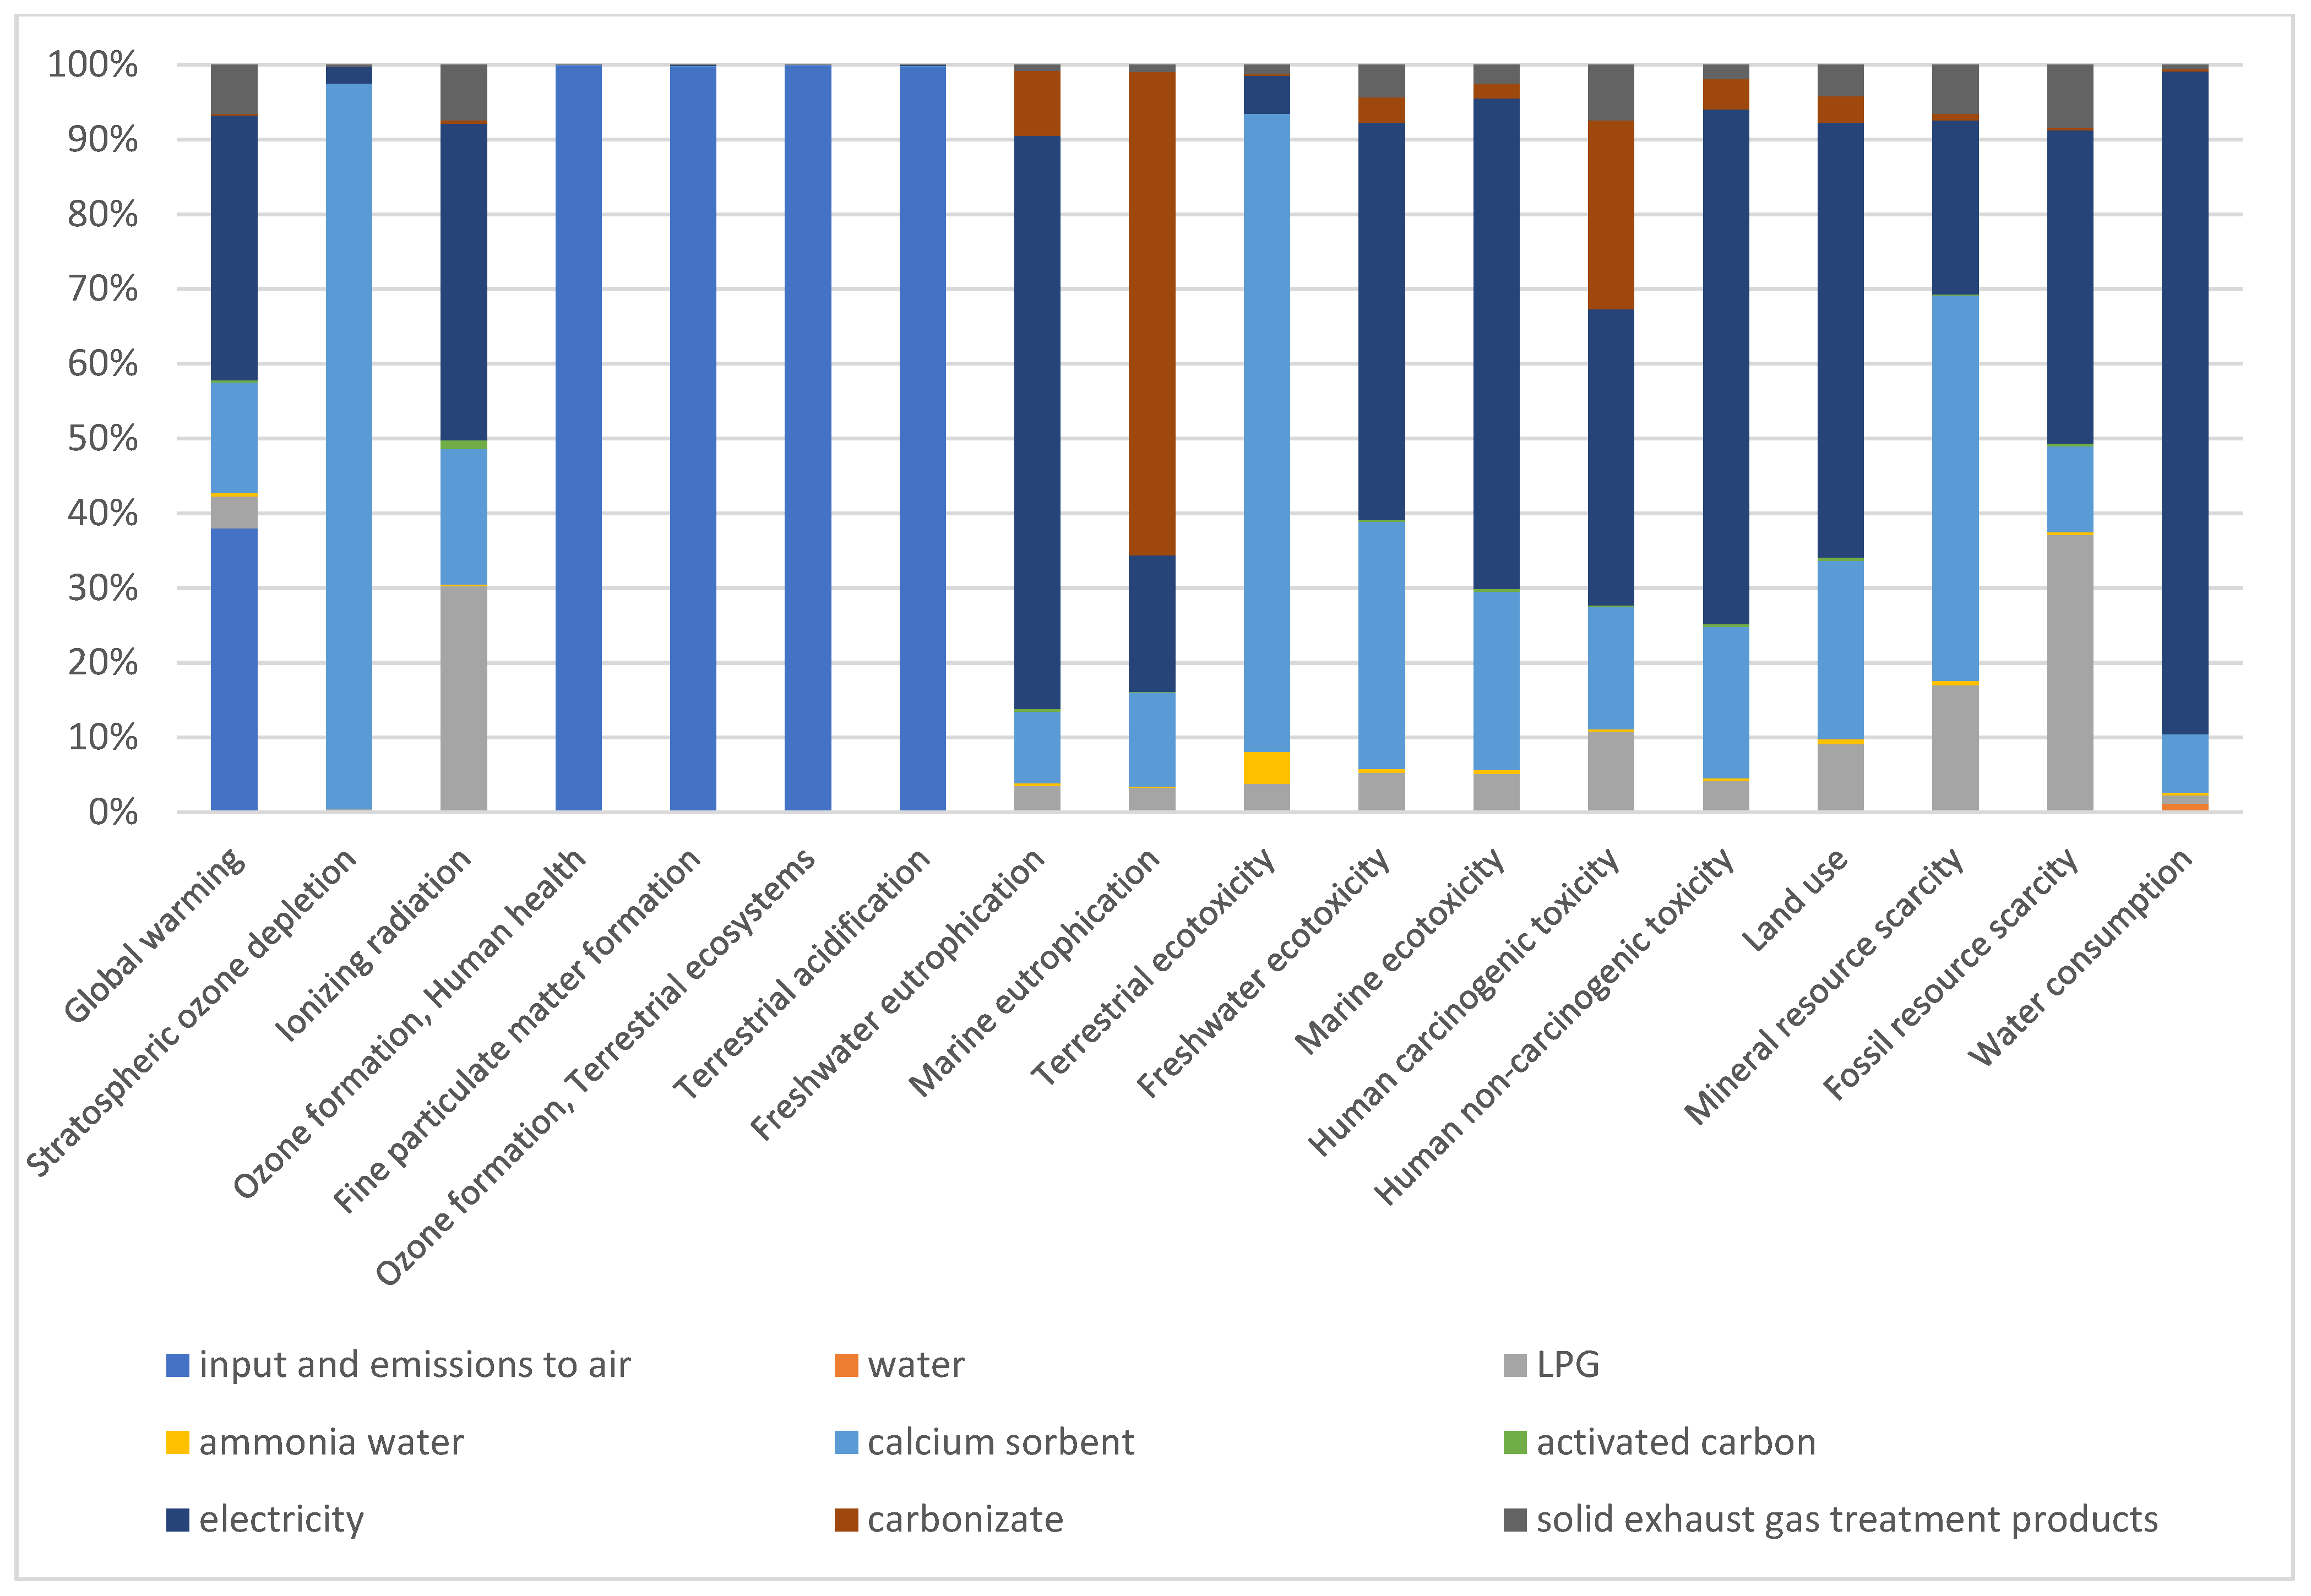
Table 5 presents the characterized LCA results for the sewage sludge pyrolysis process, highlighting the main hotspots identified within each impact category. Figure 7 shows the weighted LCA results for the sewage sludge pyrolysis process, providing an overall perspective on the relative significance of individual environmental impacts.
The LCA results for the sewage sludge pyrolysis process reveal a clear differentiation between impact categories, with distinct environmental hotspots identified across climate change, air pollution, toxicity, and resource use indicators.
The total global warming potential (GWP) amounts to 0.453 kg CO2 equation The main contributors are input and emissions to air (0.172 kg CO2 eq, ~38% of total), electricity consumption (0.160 kg CO2 eq, ~35%), and calcium sorbent production (0.0669 kg CO2 eq, ~15%). Smaller but non-negligible contributions arise from solid exhaust gas treatment products and LPG use. This distribution indicates that both direct process emissions and energy demand are the dominant drivers of climate change impacts on the system.
For stratospheric ozone depletion (2.18 × 10⁻⁶ kg CFC-11 eq), the impact is almost entirely attributable to calcium sorbent production, with a minor contribution from electricity generation. Similarly, ionizing radiation totals 5.48 × 10⁻³ kBq Co-60 eq, which is driven primarily by electricity use (2.32 × 10⁻³ kBq Co-60 eq) and LPG consumption (1.65 × 10⁻³ kBq Co-60 eq), reflecting upstream energy-related burdens.
Air emission-related categories show the most pronounced dominance of a single process. Ozone formation for human health and ozone formation for terrestrial ecosystems both reach 1.93 kg NOₓ eq, while fine particulate matter formation amounts to 0.212 kg PM2.5 equation in all three categories, input and emissions to the air from the pyrolysis process account for nearly 100% of the total impact, clearly identifying direct atmospheric emissions as a critical environmental hotspot. A similar pattern is observed for terrestrial acidification (0.695 kg SO2 eq), where emissions to the air dominate, with only marginal contributions from electricity and calcium sorbent.
In contrast, eutrophication impacts are relatively low. Freshwater eutrophication totals 1.72 × 10⁻⁴ kg P eq and is mainly associated with electricity consumption, calcium sorbent, and carbonizate handling. Marine eutrophication amounts to 3.22 × 10⁻⁵ kg N eq, with the largest share linked to carbonizate, followed by electricity and calcium sorbent. These results indicate that nutrient-related impacts are driven primarily by indirect emissions and residue management, rather than direct air emissions.
The toxicity-related impact categories exhibit the highest absolute values. Terrestrial ecotoxicity reaches 8.98 kg 1,4-DCB eq, dominated by calcium sorbent production, with additional contributions from LPG and electricity. Marine ecotoxicity (54.2 kg 1,4-DCB eq) and human non-carcinogenic toxicity (48.5 kg 1,4-DCB eq) are strongly influenced by electricity consumption, followed by carbonizate and solid exhaust gas treatment products. These results highlight the importance of upstream energy production and by-product management, particularly due to the heavy metal content and resource-intensive treatment processes.
Resource-related impacts are also significant. Fossil resource scarcity amounts to 0.109 kg oil eq and is mainly associated with electricity use, LPG consumption, and calcium sorbent production. Mineral resource scarcity (3.73 × 10⁻⁴ kg Cu eq) is driven primarily by calcium sorbent and electricity. Water consumption, totaling 8.09 × 10⁻³ m3, is dominated by electricity generation, reflecting the water intensity of upstream energy systems.
Overall, the LCA results demonstrate that direct emissions from the pyrolysis process are the main environmental hotspots for air pollution-related categories, while electricity consumption, calcium sorbent production, and residue management play a decisive role in climate change, toxicity, and resource depletion impacts. Mitigation strategies should therefore focus on emission control technologies, improving energy efficiency or sourcing low-carbon electricity and optimizing the management of pyrolysis by-products, which together could substantially reduce the environmental footprint of sewage sludge pyrolysis.

3.4. HTC

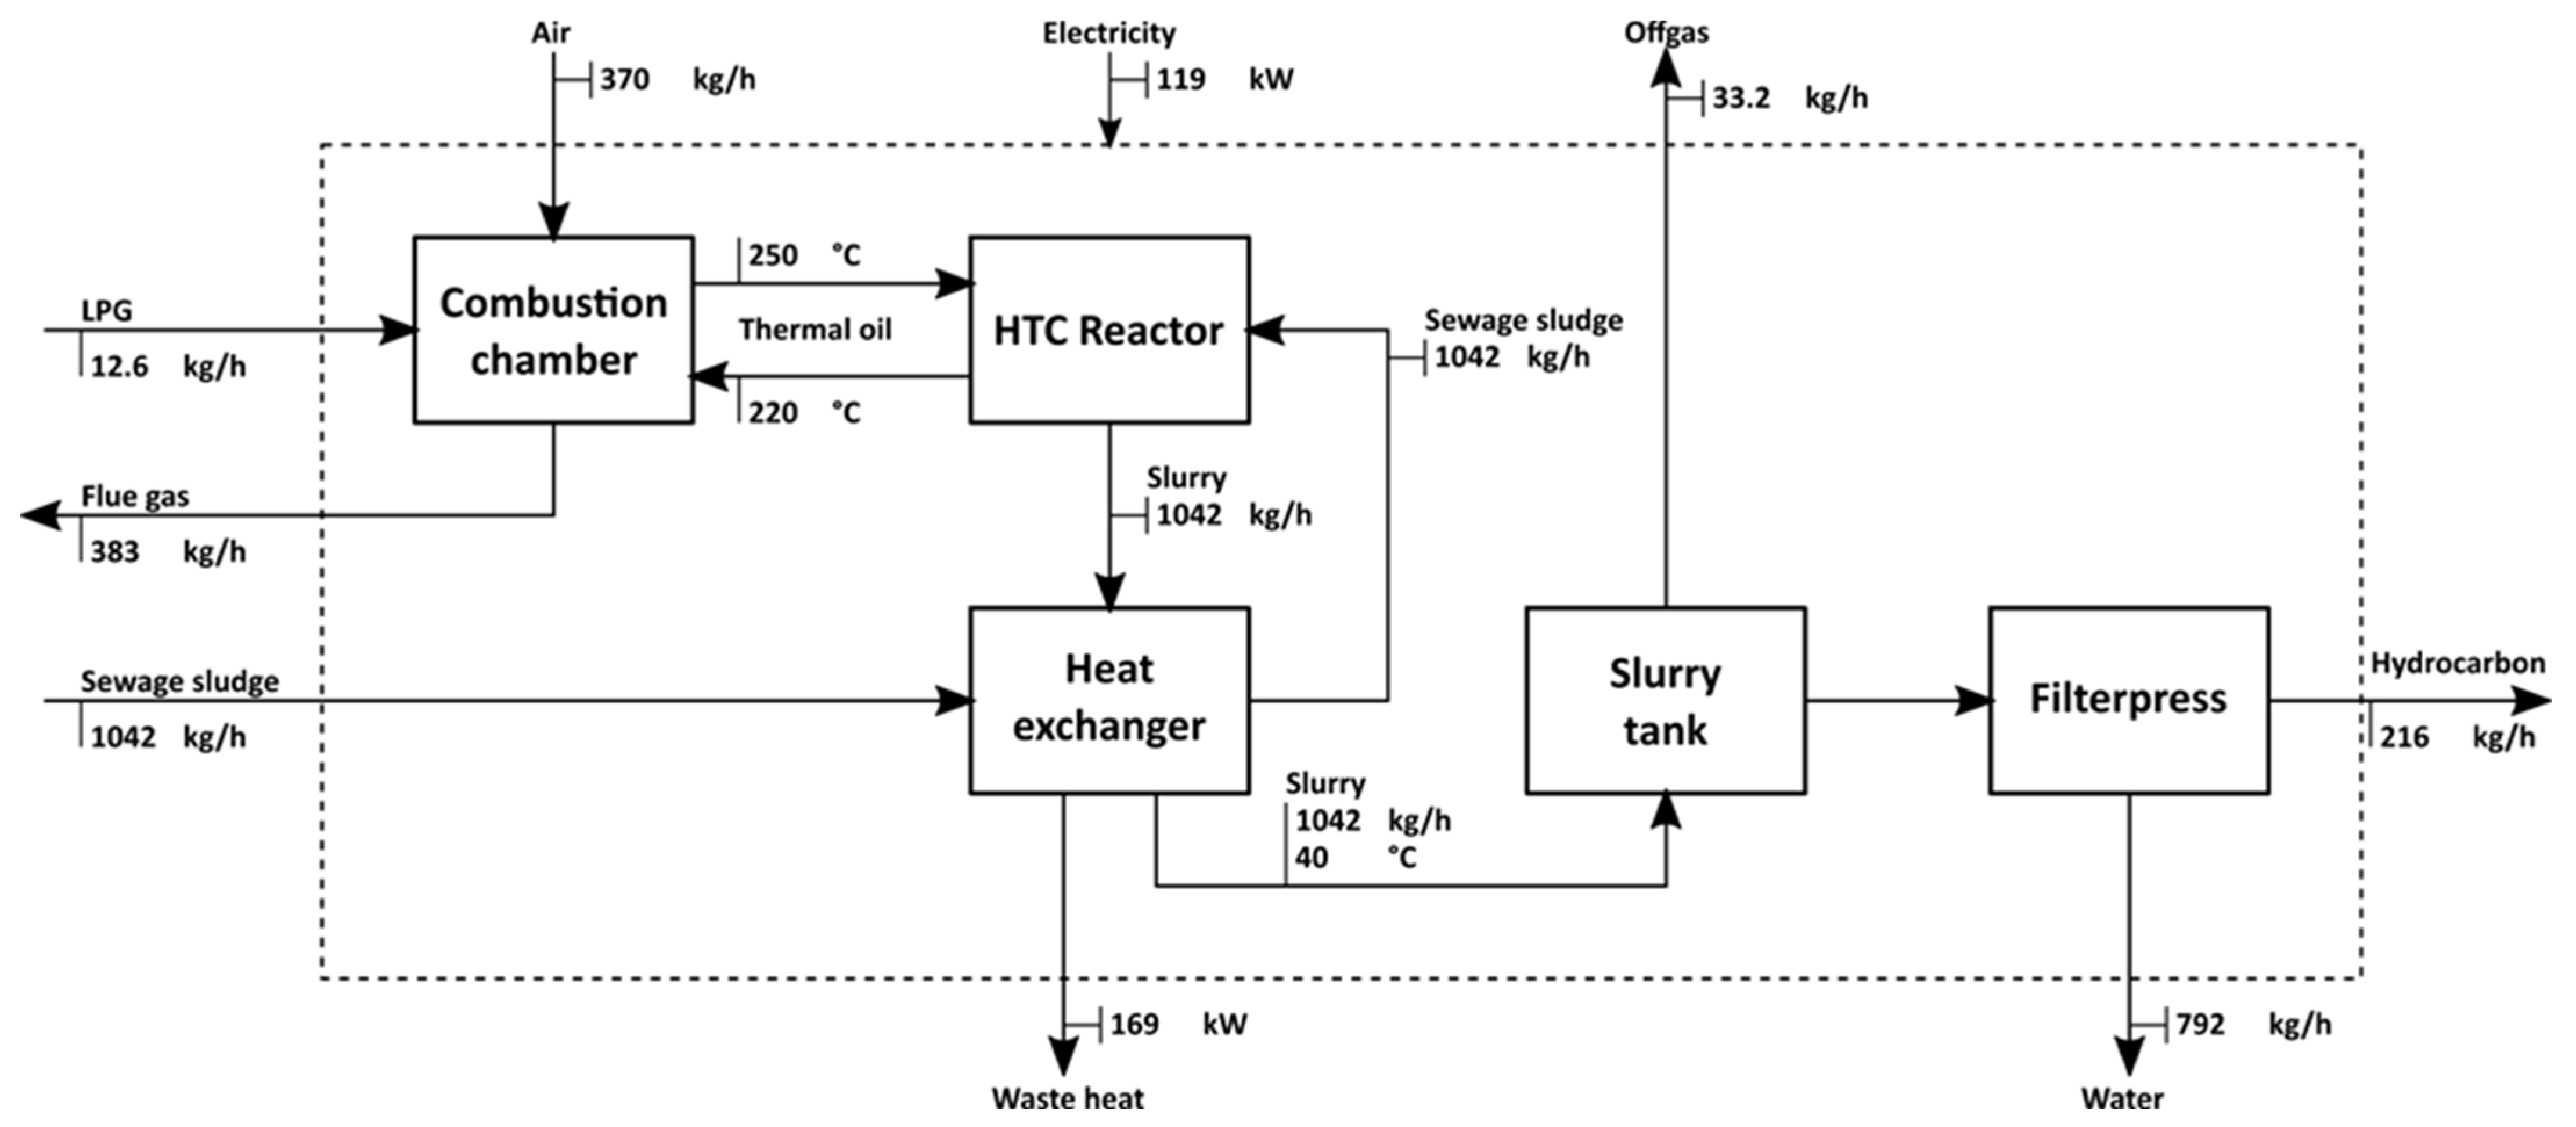
Figure 8 presents the schematic diagram of the sewage sludge HTC process.
In this process, preheated sewage sludge is fed to the HTC reactor, where the hydrothermal carbonization process is carried out at a temperature of 200 °C. Heat for the process is provided using thermal oil as the heating carrier, from the incineration of LPG in the dedicated boiler. Hot slurry is passed through a heat exchanger, preheating sewage sludge for the HTC process. Next, the slurry is cooled down in the output heat exchanger and dewatered in the filter press to a dry matter content of 65%.
Table 6 presents the characterized LCA results for the sewage sludge HTC process, highlighting the main hotspots identified within each impact category. Figure 9 shows the weighted LCA results for the sewage sludge HTC process, providing an overall perspective on the relative significance of individual environmental impacts.
The LCA of hydrothermal carbonization (HTC) of sewage sludge shows a compact but clearly structured footprint with a few pronounced hotspots. The total global warming potential is 1.57 × 10⁻¹ kg CO2 eq, dominated by electricity use (1.21 × 10⁻¹), with smaller shares from direct air emissions (2.60 × 10⁻²) and LPG (7.35 × 10⁻³); waste-gas handling adds only 2.05 × 10⁻³. Ozone-related impacts and fine particulate matter formation are almost entirely explained by emissions to the air from the HTC unit (≈0.286 kg NOx eq for both ozone formation categories and 3.15 × 10⁻² kg PM2.5 eq), while terrestrial acidification (1.04 × 10⁻¹ kg SO2 eq) is likewise driven by those same process emissions, with electricity contributing only marginally. In eutrophication, freshwater (1.37 × 10⁻⁴ kg P eq) is mainly tied to electricity generation (9.94 × 10⁻⁵), with a secondary contribution from waste-gas management (3.56 × 10⁻⁵); conversely, marine eutrophication (5.43 × 10⁻⁵ kg N eq) is dominated by waste gas (4.95 × 10⁻⁵). Toxicity impacts reveal two clear hotspots: electricity and waste gas. Electricity drives terrestrial ecotoxicity (3.41 × 10⁻¹ of 5.17 × 10⁻¹ kg 1,4-DCB), freshwater ecotoxicity (3.28 × 10⁻³ of 4.10 × 10⁻³), and marine ecotoxicity (2.69 × 101 of 3.05 × 101), while waste gas is the leading source of human carcinogenic toxicity (2.24 of 3.51 kg 1,4-DCB) and a major share of human non-carcinogenic toxicity (4.71 of 3.07 × 101 kg 1,4-DCB). Resource indicators confirm the energy hotspot: fossil resource scarcity totals 5.10 × 10⁻² kg oil eq, largely from electricity (3.45 × 10⁻²), with LPG (1.55 × 10⁻²) as a secondary driver; mineral resource scarcity (9.72 × 10⁻⁵ kg Cu eq) and land use (2.98 × 10⁻³ m2a crop eq) are also mostly electricity-related. The water consumption amounts to 5.50 × 10⁻³ m3, again dominated by electricity (5.42 × 10⁻³). In short, the HTC system’s environmental profile is governed by three levers: (i) process air emissions for air-quality categories, (ii) the electricity supply across the climate, toxicity, resource use, and water, and (iii) waste-gas treatment, which particularly affects marine eutrophication and human toxicity. Mitigation should therefore prioritize cleaner or lower-carbon electricity, tighter emission control for the HTC reactor, and optimized waste-gas treatment (and, where feasible, fuel switching or LPG minimization).

3.5. Comparison

Table 7 presents comparative results of mass and energy balance for the incineration, gasification, pyrolysis, and hydrothermal carbonization (HTC) of sewage sludge.
The comparative results of mass and energy balance show significant differences between different technologies.
Incineration, as the only autothermal technology, shows no additional LPG demand. As a result, the process is characterized by lower CO2 emissions than gasification, which, in addition to CO2 emissions from sewage sludge combustion, also generates CO2 emissions from LPG combustion. In the case of pyrolysis, the demand for LPG is the highest, but the production of char containing a high amount of carbon allows for a reduction in direct CO2 emissions in the flue gas compared to gasification. The HTC process is characterized by an average demand for LPG, while the different nature of the process and the mechanical dewatering of the obtained product allows for a significant reduction in CO2 emissions to the environment. A significant part of the carbon from the sewage sludge remains in the hydrocarbon.
Incineration also shows the lowest electricity consumption.
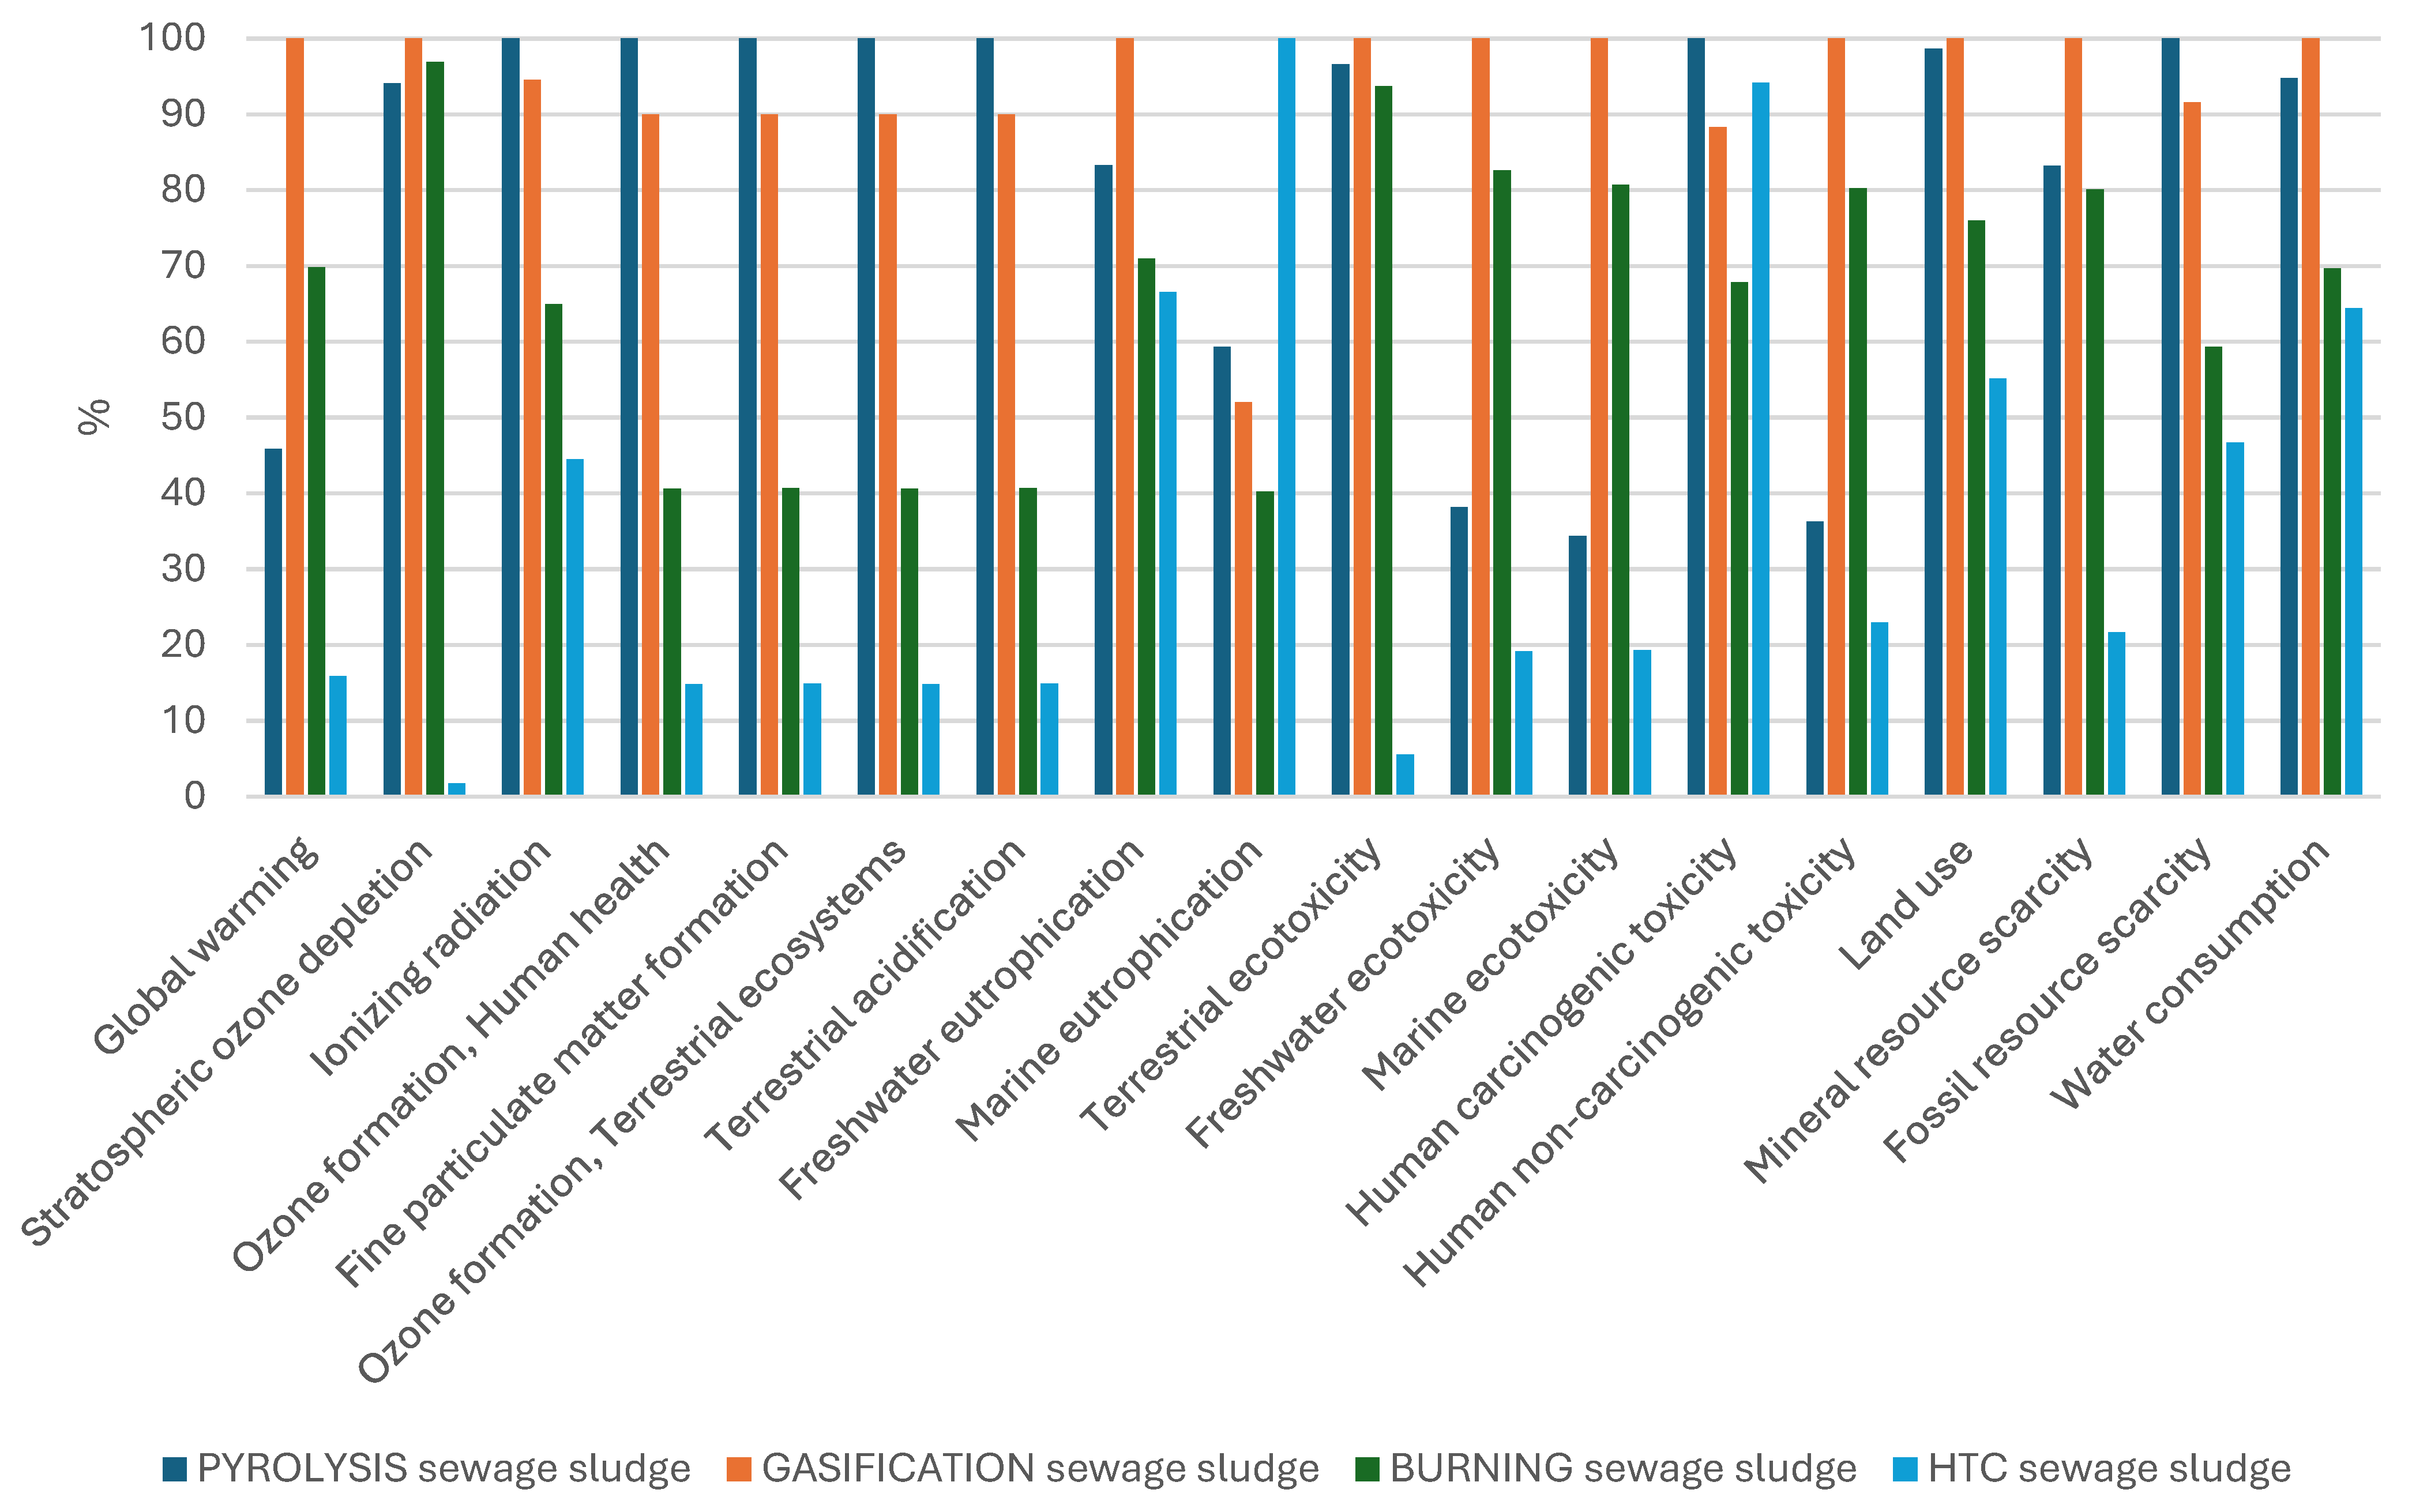
Figure 10 shows the comparative LCA results for the incineration, gasification, pyrolysis, and hydrothermal carbonization (HTC) of sewage sludge.
The comparative LCA results for the pyrolysis, gasification, incineration, and hydrothermal carbonization (HTC) of sewage sludge—expressed as relative percentages normalized to the highest impact (100%)—show distinct environmental performance patterns across processes and impact categories.
Processes that exhibit the highest environmental impact per category act as a reference point (100%), with gasification ending up as the most common reference. It performs worst, particularly in global warming, ionizing radiation, terrestrial and freshwater ecotoxicity, and resource use. This is primarily due to its high energy demand and intensive emissions from gas cleaning and ash management.
Pyrolysis generally performs better than gasification but still shows significant burdens in several categories. It records about 46% of gasification’s global warming potential, indicating lower greenhouse gas emissions. However, it exceeds gasification slightly in ionizing radiation (100%), which is likely due to upstream electricity and material use. Pyrolysis also shows high results for ozone formation and particulate matter formation, indicating a strong influence from air emissions during thermal conversion.
Incineration of sewage sludge demonstrates moderate impacts overall. Its global warming potential (≈70% of gasification) and ozone-related impacts (≈40%) are lower, showing reduced emissions per functional unit. However, incineration still exhibits substantial toxicity-related impacts, with terrestrial and marine ecotoxicity reaching over 80% of the gasification values. This suggests that residue handling and flue-gas cleaning remain important challenges for this process.
The HTC process stands out as the most environmentally favorable technology in most categories, with the lowest relative impacts across almost all indicators. Its global warming potential is only 16% of gasification’s, and air-emission-related categories such as ozone formation and particulate matter formation are below 15%. HTC also performs best in terrestrial and freshwater ecotoxicity, resource scarcity, and fossil depletion, reflecting its lower energy demand and closed-loop aqueous phase operation. The only exceptions are marine eutrophication (100%), where HTC shows higher impacts due to the nutrient-rich effluent, and human carcinogenic toxicity (94%), influenced by by-product management and electricity use.
In summary, the comparative LCA highlights clear environmental trade-offs among the studied technologies. Gasification yields the highest impacts overall, due to its energy intensity; pyrolysis and incineration achieve moderate environmental performance; and HTC demonstrates the lowest overall burden, making it the most sustainable option among the four processes, provided that effluent treatment is properly managed.

4. Conclusions

Across incineration, gasification, pyrolysis, and hydrothermal carbonization (HTC), sewage sludge must first be conditioned—primarily through drying or preheating—to achieve the energy balance required for each thermal conversion route. Incineration relies on high-temperature oxidation and uses recovered heat for drying, with flue-gas cleaning ensuring emission control. Gasification and pyrolysis operate under oxygen-limited conditions, producing syngas or pyrolytic gas that is subsequently combusted to supply process heat, often supplemented with LPG to meet dryer demand. Both processes also incorporate heat recovery and semi-dry flue-gas treatment. HTC, in contrast, converts wet sludge into a carbon-rich product at lower temperatures, using thermal oil heating with internal heat recovery through slurry-to-feed exchangers.
The LCA results confirm that the choice of technology for sewage sludge utilization has a decisive influence on its overall environmental performance. Gasification remains the most harmful option due to its high energy use and emissions, whereas pyrolysis and incineration provide moderate environmental improvements but still carry significant ecotoxicity burdens. Hydrothermal carbonization (HTC) demonstrated the lowest total environmental load, particularly for the climate change and air-quality-related categories, confirming its suitability as a sustainable alternative for sludge valorization.
The analysis results are limited for the treatment of municipal sewage sludge from the typical WWTP in European conditions, and they do not cover the entire sewage sludge market (industrial sewage sludge, different climate zones). Therefore, future analysis should consider a wider range of feedstock, allowing for a more reliable comparison of technologies analyzed in alternative applications.
To maximize its environmental benefits, future research and technological development should focus on integrating renewable energy sources, enhancing energy recovery efficiency, and treating the HTC process water to mitigate nutrient-related impacts. Such improvements will further reinforce HTC’s potential as a circular, low-carbon, and environmentally responsible solution for sewage sludge management.

Author Contributions

Conceptualization, N.P., A.W. and T.B.; methodology, N.P. and T.B.; software, N.P. and K.P.; validation, N.P., K.P., R.L. and T.I.; formal analysis, N.P., T.B., R.L. and A.W.; investigation, N.P., T.B. and A.W.; resources, T.B. and A.W.; data curation, T.B., N.P. and A.W.; writing—original draft preparation, N.P., A.W. and T.B.; writing—review and editing, N.P., R.L., K.P. and T.I.; visualization, T.B. and N.P.; supervision, N.P. and K.P.; project administration, N.P. and K.P.; funding acquisition, N.P. and K.P. All authors have read and agreed to the published version of the manuscript.

Funding

This research was funded by The Silesian University of Technology, grant number 08/030/BK_25/0151 and 08/030/BKM25/0165.

Data Availability Statement

The original contributions presented in this study are included in the article. Further inquiries can be directed to the corresponding author.

Acknowledgments

The authors have reviewed and edited the output and take full responsibility for the content of this publication.

Conflicts of Interest

The authors declare no conflicts of interest.

References

  1. Ghorbani, M.; Konvalina, P.; Walkiewicz, A.; Neugschwandtner, R.W.; Kopecký, M.; Zamanian, K.; Chen, W.-H.; Bucur, D. Feasibility of Biochar Derived from Sewage Sludge to Promote Sustainable Agriculture and Mitigate GHG Emissions—A Review. Int. J. Environ. Res. Public Health 2022, 19, 12983. [Google Scholar] [CrossRef] [PubMed]
  2. Salva, J.; Sečkár, M.; Schwarz, M.; Samešová, D.; Mordáčová, M.; Poništ, J.; Veverková, D. Analysis of the current state of sewage sludge treatment from the perspective of current European directives. Environ. Sci. Eur. 2025, 37, 59. [Google Scholar] [CrossRef]
  3. Przydatek, G.; Wota, A.K. Analysis of the Comprehensive Management of Sewage Sludge in Poland. J. Mater. Cycles Waste Manag. 2020, 22, 80–88. [Google Scholar] [CrossRef]
  4. Kacprzak, M.; Neczaj, E.; Fijałkowski, K.; Grobelak, A.; Grosser, A.; Worwag, M.; Rorat, A.; Brattebo, H.; Almås, Å.; Singh, B.R. Sewage Sludge Disposal Strategies for Sustainable Development. Environ. Res. 2017, 156, 39–46. [Google Scholar] [CrossRef] [PubMed]
  5. Jakubus, M. Current Trends in Sustainable Sewage Sludge Management—A Case Study for Poznań County, Poland. Sustainability 2024, 16, 5056. [Google Scholar] [CrossRef]
  6. Grobelak, A.; Całus-Makowska, K.; Jasińska, A.; Klimasz, M.; Wypart-Pawul, A.; Augustajtys, D.; Baor, E.; Sławczyk, D.; Kowalska, A. Environmental Impacts and Contaminants Management in Sewage Sludge-to-Energy and Fertilizer Technologies: Current Trends and Future Directions. Energies 2024, 17, 4983. [Google Scholar] [CrossRef]
  7. Siedlecka, E.; Siedlecki, J. Influence of Valorization of Sewage Sludge on Energy Consumption in the Drying Process. Energies 2021, 14, 4511. [Google Scholar] [CrossRef]
  8. Myszograj, S.; Płuciennik-Koropczuk, E. Thermal Disintegration of Sewage Sludge as a Method of Improving the Biogas Potential. Energies 2023, 16, 559. [Google Scholar] [CrossRef]
  9. Śpiewak, K. Gasification of Sewage Sludge—A Review. Energies 2024, 17, 4476. [Google Scholar] [CrossRef]
  10. Kowalski, Z.; Makara, A.; Kulczycka, J.; Generowicz, A.; Kwaśnicki, P.; Ciuła, J.; Gronba-Chyła, A. Conversion of Sewage Sludge into Biofuels via Different Pathways and Their Use in Agriculture: A Comprehensive Review. Energies 2024, 17, 1383. [Google Scholar] [CrossRef]
  11. Mukawa, J.; Pająk, T.; Rzepecki, T.; Banaś, M. Energy Potential of Biogas from Sewage Sludge after Thermal Hydrolysis and Digestion. Energies 2022, 15, 5255. [Google Scholar] [CrossRef]
  12. Wiśniewski, K.; Rutkowska, G.; Jeleniewicz, K.; Dąbkowski, N.; Wójt, J.; Chalecki, M.; Siwiński, J. The Impact of Fly Ashes from Thermal Conversion of Sewage Sludge on Properties of Natural Building Materials on the Example of Clay. Sustainability 2022, 14, 6213. [Google Scholar] [CrossRef]
  13. Domini, M.; Bertanza, G.; Vahidzadeh, R.; Pedrazzani, R. Sewage Sludge Quality and Management for Circular Economy Opportunities in Lombardy. Appl. Sci. 2022, 12, 10391. [Google Scholar] [CrossRef]
  14. Đurđević, D.; Žiković, S.; Blecich, P. Sustainable Sewage Sludge Management Technologies Selection Based on Techno-Economic-Environmental Criteria: Case Study of Croatia. Energies 2022, 15, 3941. [Google Scholar] [CrossRef]
  15. Li, L.; Du, G.; Yan, B.; Wang, Y.; Zhao, Y.; Su, J.; Li, H.; Du, Y.; Sun, Y.; Chen, G.; et al. Carbon Footprint Analysis of Sewage Sludge Thermochemical Conversion Technologies. Sustainability 2023, 15, 4170. [Google Scholar] [CrossRef]
  16. Szulc, P.; Kasprzak, J.; Dymaczewski, Z.; Kurczewski, P. Life Cycle Assessment of Municipal Wastewater Treatment Processes Regarding Energy Production from the Sludge Line. Energies 2021, 14, 356. [Google Scholar] [CrossRef]
  17. Smoliński, A.; Karwot, J.; Bondaruk, J.; Bąk, A. The bioconversion of sewage sludge to bio-fuel: The environmental and economic benefits. Materials 2019, 12, 2417. [Google Scholar] [CrossRef] [PubMed]
  18. Available online: https://phyllis.nl/Browse/Standard/ECN-Phyllis (accessed on 4 November 2025).
  19. Poranek, N.; Pikoń, K.; Generowicz-Caba, N.; Mańka, M.; Kulczycka, J.; Marinis, D.; Farsari, E.; Amanatides, E.; Lewandowska, A.; Sajdak, M.; et al. Comparative LCA analysis of selected recycling methods for carbon fibers and socio-economic analysis. Materials 2025, 18, 2660. [Google Scholar] [CrossRef] [PubMed]
  20. Rudolf, R.; Majerič, P.; Pintarič, Z.N.; Horvat, A.; Krajnc, D. Life Cycle Assessment (LCA) of the Impact on the Environment of a Cosmetic Cream with Gold Nanoparticles and Hydroxylated Fullerene Ingredients. Appl. Sci. 2024, 14, 11625. [Google Scholar] [CrossRef]
Figure 1. System boundaries for 1 Mg sewage sludge.
Energies 19 00815 g001
Figure 2. Schematic diagram of the sewage sludge incineration process.
Energies 19 00815 g002
Figure 3. LCA weight results for sewage sludge incineration process.
Energies 19 00815 g003
Figure 4. Schematic diagram of the sewage sludge gasification process.
Energies 19 00815 g004
Figure 5. LCA weight results for sewage sludge gasification process.
Energies 19 00815 g005
Figure 6. Schematic diagram of the sewage sludge pyrolysis process.
Energies 19 00815 g006
Figure 7. LCA weight results for sewage sludge pyrolysis process.
Energies 19 00815 g007
Figure 8. Schematic diagram of the sewage sludge HTC process.
Energies 19 00815 g008
Figure 9. LCA weight results for sewage sludge HTC process.
Energies 19 00815 g009
Figure 10. The comparative LCA results for the pyrolysis, gasification, burning, and hydrothermal carbonization (HTC) of sewage sludge.
Energies 19 00815 g010
Table 1. Comparison of thermal sewage sludge treatment methods—specification.
SpecificationIncinerationGasificationPyrolysisHTC
λ>1<100
Reacting agentAirAir, O2, CO2, steamInert gasWater
Main productsFlue gas, ash,
slag
Syngas, ash,
slag, tar
Pyrolytic gas, pyrolytic
oil, char
Hydrochar, liquid effluent, offgas
Process temperature850 ÷ 1000800 ÷ 1000350 ÷ 700180 ÷ 250
Table 2. Average sewage sludge composition.
ParameterUnitValueParameterUnitValue
Moisture% w/w82.0NH4+-N% w/w0.6
Ash% w/w5.4TN% w/w7.9
C% w/w7.1TP% w/w1.2
H% w/w0.9Mg% w/w0.9
S% w/w0.2Ca% w/w2.2
LHVkJ/kg853
Table 3. Results of LCA analysis for sewage sludge incineration process.
Impact CategoryGlobal WarmingStratospheric Ozone DepletionIonizing RadiationOzone Formation Human HealthFine Particulate Matter FormationOzone Formation Terrestrial EcosystemTerrestrial AcidificationFreshwater EutrophicationMarine Eutrophication
Unitkg CO2 eqkg CFC11 eqkBq Co-60 eqkg NOx eqkg PM2.5 eqkg NOx eqkg SO2 eqkg P eqkg N eq
Total6.89 × 10−12.24 × 10−63.56 × 10−37.83 × 10−18.64 × 10−27.83 × 10−12.83 × 10−11.46 × 10−42.19 × 10−5
Input and emissions to air1.53 × 10−10.000.007.82 × 10−18.61 × 10−27.82 × 10−12.82 × 10−10.000.00
Ammonia water1.26 × 10−31.28 × 10−107.66 × 10−61.62 × 10−61.50 × 10−61.64 × 10−63.57 × 10−63.21 × 10−72.63 × 10⁻⁸
Calcium sorbent6.69 × 10−22.12 × 10−69.89 × 10−41.11 × 10−48.69 × 10−51.14 × 10−42.70 × 10−41.65 × 10−54.06 × 10−6
Activated carbon5.19 × 10−41.65 × 10−102.90 × 10−51.37 × 10−61.03 × 10−61.39 × 10−62.72 × 10−62.84 × 10−71.55 × 10⁻⁸
Electricity1.15 × 10−13.37 × 10−81.67 × 10−33.00 × 10−42.18 × 10−43.03 × 10−46.48 × 10−49.45 × 10−54.23 × 10−6
Effluent2.94 × 10−18.15 × 10−86.88 × 10−55.00 × 10−51.04 × 10−55.05 × 10−52.23 × 10−57.95 × 10−61.12 × 10−6
Bottom ash6.64 × 10−43.28 × 10−101.61 × 10−54.04 × 10−61.05 × 10−64.24 × 10−62.26 × 10−62.34 × 10−51.17 × 10⁻⁵
Heat exchanger ash1.84 × 10−59.88 × 10−126.13 × 10−71.41 × 10−73.83 × 10−81.48 × 10−78.01 × 10−88.79 × 10−71.08 × 10⁻⁷
Impact categoryTerrestrial ecotoxicityFreshwater ecotoxicityMarine ecotoxicityHuman carcinogenic toxicityHuman non-carcinogenic toxicityLand useMineral resource scarcityFossil resource scarcityWater consumption
Unitkg 1,4-DCBkg 1,4-DCBkg 1,4-DCBkg 1,4-DCBkg 1,4-DCBm2a crop eqkg Cu eqkg oil eqm3
Total8.71 × 1001.77 × 10−21.27 × 1022.53 × 1001.07 × 1024.10 × 10−33.59 × 10−46.47 × 10−25.95 × 10⁻³
Input and emissions to air0.000.000.000.000.000.000.000.000.00
Ammonia water2.19 × 10−12.46 × 10−51.61 × 10−15.99 × 10−31.10 × 10−11.98 × 10−51.37 × 10−62.35 × 10−41.68 × 10−5
Calcium sorbent7.66 × 1002.70 × 10−31.29 × 1016.11 × 10−19.80 × 1001.27 × 10−31.92 × 10−41.26 × 10−26.30 × 10⁻⁴
Activated carbon1.68 × 10−31.03 × 10−58.94 × 10−23.58 × 10−37.97 × 10−29.05 × 10−62.86 × 10−71.49 × 10−41.34 × 10−6
Electricity3.24 × 10−13.12 × 10−32.56 × 1011.06 × 1002.40 × 1012.23 × 10−36.22 × 10−53.28 × 10−25.15 × 10⁻³
Effluent2.69 × 10−11.65 × 10−48.45 × 10−12.85 × 10−13.84 × 10−19.45 × 10−55.39 × 10−59.91 × 10−44.29 × 10−5
Bottom ash1.67 × 10−27.77 × 10−36.22 × 1012.20 × 10−25.21 × 1015.24 × 10−51.94 × 10−63.11 × 10−48.95 × 10⁻⁶
Heat exchanger ash2.76 × 10−43.23 × 10−32.31 × 1011.28 × 10−21.91 × 1011.80 × 10−65.55 × 10−81.19 × 10−55.71 × 10⁻⁷
Solid exhaust gas treatment products2.20 × 10−16.85 × 10−42.57 × 1005.30 × 10−11.76 × 1004.27 × 10−44.70 × 10−51.76 × 10−29.35 × 10⁻⁵
Table 4. Results of LCA analysis for sewage sludge gasification process.
Impact CategoryGlobal WarmingStratospheric Ozone DepletionIonizing RadiationOzone Formation Human HealthFine Particulate Matter FormationOzone Formation Terrestrial EcosystemTerrestrial AcidificationFreshwater EutrophicationMarine Eutrophication
Unitkg CO2 eqkg CFC11 eqkBq Co-60 eqkg NOx eqkg PM2.5 eqkg NOx eqkg SO2 eqkg P eqkg N eq
Total9.87 × 10−12.32 × 10−65.18 × 10−31.73 × 1001.91 × 10−11.73 × 1006.25 × 10−12.06 × 10−42.83 × 10−5
Input and emissions to air2.05 × 10−10.000.001.73 × 1001.91 × 10−11.73 × 1006.24 × 10−10.000.00
LPG1.20 × 10−26.04 × 10−91.03 × 10−34.55 × 10−51.76 × 10−55.51 × 10−53.38 × 10−53.79 × 10−66.60 × 10−7
Water2.20 × 10−51.34 × 10−111.11 × 10−55.50 × 10−83.80 × 10−85.68 × 10−88.58 × 10−81.62 × 10−81.58 × 10⁻⁹
Ammonia water1.91 × 10−31.94 × 10−101.16 × 10−52.45 × 10−62.27 × 10−62.48 × 10−65.41 × 10−64.87 × 10−73.99 × 10⁻⁸
Calcium sorbent6.69 × 10−22.12 × 10−69.89 × 10−41.11 × 10−48.69 × 10−51.14 × 10−42.70 × 10−41.65 × 10−54.06 × 10−6
Activated carbon1.07 × 10−33.39 × 10−105.97 × 10−52.81 × 10−62.13 × 10−62.87 × 10−65.60 × 10−65.85 × 10−73.20 × 10⁻⁸
Electricity1.70 × 10−14.97 × 10−82.46 × 10−34.43 × 10−43.21 × 10−44.48 × 10−49.56 × 10−41.39 × 10−46.24 × 10−6
Effluent4.93 × 10−11.37 × 10−71.15 × 10−48.39 × 10−51.74 × 10−58.47 × 10−53.74 × 10−51.33 × 10−51.88 × 10−6
Bottom ash8.43 × 10−44.17 × 10−102.04 × 10−55.13 × 10−61.34 × 10−65.39 × 10−62.87 × 10−62.97 × 10−51.49 × 10⁻⁵
Heat exchanger ash1.84 × 10−59.88 × 10−126.13 × 10−71.41 × 10−73.83 × 10−81.48 × 10−78.01 × 10−88.79 × 10−71.08 × 10⁻⁷
Impact categoryTerrestrial ecotoxicityFreshwater ecotoxicityMarine ecotoxicityHuman carcinogenic toxicityHuman non-carcinogenic toxicityLand useMineral resource scarcityFossil resource scarcityWater consumption
Unitkg 1,4-DCBkg 1,4-DCBkg 1,4-DCBkg 1,4-DCBkg 1,4-DCBm2a crop eqkg Cu eqkg oil eqm3
Total9.30 × 1002.14 × 10−21.58 × 1023.29 × 1001.34 × 1025.40 × 10−34.48 × 10−41.00 × 10−18.54 × 10⁻³
Input and emissions to air0.000.000.000.000.000.000.000.000.00
LPG2.13 × 10−12.69 × 10−41.74 × 1002.48 × 10−11.26 × 1003.03 × 10−43.93 × 10−52.53 × 10−25.71 × 10⁻⁵
Water1.86 × 10−32.03 × 10−61.04 × 10−25.62 × 10−35.75 × 10−38.58 × 10−72.95 × 10−76.42 × 10−67.93 × 10−5
Ammonia water3.31 × 10−13.72 × 10−52.43 × 10−19.06 × 10−31.67 × 10−13.00 × 10−52.07 × 10−63.55 × 10−42.54 × 10−5
Calcium sorbent7.66 × 1002.70 × 10−31.29 × 1016.11 × 10−19.80 × 1001.27 × 10−31.92 × 10−41.26 × 10−26.30 × 10⁻⁴
Activated carbon3.47 × 10−32.12 × 10−51.84 × 10−17.36 × 10−31.64 × 10−11.86 × 10−55.88 × 10−73.08 × 10−42.77 × 10−6
Electricity4.78 × 10−14.60 × 10−33.77 × 1011.56 × 1003.54 × 1013.28 × 10−39.18 × 10−54.84 × 10−27.60 × 10⁻³
Effluent4.51 × 10−12.76 × 10−41.42 × 1004.78 × 10−16.44 × 10−11.58 × 10−49.03 × 10−51.66 × 10−37.20 × 10⁻⁵
Bottom ash2.12 × 10−29.86 × 10−37.90 × 1012.79 × 10−26.61 × 1016.66 × 10−52.47 × 10−63.95 × 10−41.14 × 10⁻⁵
Heat exchanger ash2.76 × 10−43.23 × 10−32.31 × 1011.28 × 10−21.91 × 1011.80 × 10−65.55 × 10−81.19 × 10−55.71 × 10⁻⁷
Table 5. Results of LCA analysis for sewage sludge pyrolysis process.
Impact CategoryGlobal WarmingStratospheric Ozone DepletionIonizing RadiationOzone Formation, Human HealthFine Particulate Matter FormationOzone Formation, Terrestrial EcosystemsTerrestrial AcidificationFreshwater EutrophicationMarine Eutrophication
Unitkg CO2 eqkg CFC11 eqkBq Co-60 eqkg NOx eqkg PM2.5 eqkg NOx eqkg SO2 eqkg P eqkg N eq
Total4.53 × 10−12.18 × 10−65.48 × 10−31.93 × 1002.12 × 10−11.93 × 1006.95 × 10−11.72 × 10−43.22 × 10−5
Input and emissions to air1.72 × 10−10.000.001.93 × 1002.12 × 10−11.93 × 1006.94 × 10−10.000.00
Water2.56 × 10−51.56 × 10−111.29 × 10−56.41 × 10−84.42 × 10−86.61 × 10−89.99 × 10−81.88 × 10−81.84 × 10⁻⁹
LPG1.92 × 10−29.66 × 10−91.65 × 10−37.27 × 10−52.81 × 10−58.82 × 10−55.41 × 10−56.07 × 10−61.06 × 10−6
Ammonia water2.24 × 10−32.27 × 10−101.36 × 10−52.87 × 10−62.65 × 10−62.90 × 10−66.33 × 10−65.69 × 10−74.67 × 10⁻⁸
Calcium sorbent6.69 × 10−22.12 × 10−69.89 × 10−41.11 × 10−48.69 × 10−51.14 × 10−42.70 × 10−41.65 × 10−54.06 × 10−6
Activated carbon1.16 × 10−33.68 × 10−106.48 × 10−53.06 × 10−62.31 × 10−63.11 × 10−66.08 × 10−66.35 × 10−73.47 × 10⁻⁸
Electricity1.60 × 10−14.69 × 10−82.32 × 10−34.18 × 10−43.03 × 10−44.23 × 10−49.02 × 10−41.32 × 10−45.89 × 10−6
Carbonizate8.64 × 10−44.27 × 10−102.37 × 10−56.44 × 10−61.66 × 10−66.71 × 10−63.50 × 10−61.50 × 10−52.08 × 10⁻⁵
Solid exhaust gas treatment products2.97 × 10−26.42 × 10−94.06 × 10−43.55 × 10−51.33 × 10−54.21 × 10−53.76 × 10−51.32 × 10−63.06 × 10−7
Impact categoryTerrestrial ecotoxicityFreshwater ecotoxicityMarine ecotoxicityHuman carcinogenic toxicityHuman non-carcinogenic toxicityLand useMineral resource scarcityFossil resource scarcityWater consumption
Unitkg 1,4-DCBkg 1,4-DCBkg 1,4-DCBkg 1,4-DCBkg 1,4-DCBm2a crop eqkg Cu eqkg oil eqm3
Total8.98 × 1008.18 × 10−35.42 × 1013.73 × 1004.85 × 1015.33 × 10−33.73 × 10−41.09 × 10−18.09 × 10⁻³
Input and emissions to air0.000.000.000.000.000.000.000.000.00
Water2.16 × 10−32.36 × 10−61.21 × 10−26.54 × 10−36.70 × 10−39.99 × 10−73.44 × 10−77.48 × 10−69.23 × 10−5
LPG3.40 × 10−14.30 × 10−42.78 × 1003.96 × 10−12.01 × 1004.84 × 10−46.29 × 10−54.05 × 10−29.14 × 10⁻⁵
Ammonia water3.87 × 10−14.36 × 10−52.84 × 10−11.06 × 10−21.95 × 10−13.51 × 10−52.42 × 10−64.15 × 10−42.98 × 10−5
Calcium sorbent7.66 × 1002.70 × 10−31.29 × 1016.11 × 10−19.80 × 1001.27 × 10−31.92 × 10−41.26 × 10−26.30 × 10⁻⁴
Activated carbon3.76 × 10−32.30 × 10−52.00 × 10−17.99 × 10−31.78 × 10−12.02 × 10−56.38 × 10−73.34 × 10−43.00 × 10−6
Electricity4.51 × 10−14.34 × 10−33.56 × 1011.48 × 1003.34 × 1013.10 × 10−38.67 × 10−54.57 × 10−27.17 × 10⁻³
Carbonizate1.95 × 10−22.78 × 10−41.09 × 1009.44 × 10−11.98 × 1001.90 × 10−43.24 × 10−64.18 × 10−42.04 × 10⁻⁵
Solid exhaust gas treatment products1.14 × 10−13.56 × 10−41.34 × 1002.76 × 10−19.16 × 10−12.22 × 10−42.44 × 10−59.16 × 10−34.86 × 10⁻⁵
Table 6. Results of LCA analysis for sewage sludge HTC process.
Impact CategoryGlobal WarmingStratospheric Ozone DepletionIonizing RadiationOzone Formation Human HealthFine Particulate Matter FormationOzone Formation Terrestrial EcosystemTerrestrial AcidificationFreshwater EutrophicationMarine Eutrophication
Unitkg CO2 eqkg CFC11 eqkBq Co-60 eqkg NOx eqkg PM2.5 eqkg NOx eqkg SO2 eqkg P eqkg N eq
Total1.57 × 10−14.01 × 10−82.44 × 10−32.86 × 10−13.17 × 10−22.86 × 10−11.04 × 10−11.37 × 10−45.43 × 10−5
Input and emissions to air2.60 × 10−20.000.002.86 × 10−13.15 × 10−22.86 × 10−11.03 × 10−10.000.00
LPG7.35 × 10−33.69 × 10−96.29 × 10−42.78 × 10−51.07 × 10−53.37 × 10−52.07 × 10−52.32 × 10−64.03 × 10−7
Electricity1.21 × 10−13.54 × 10−81.75 × 10−33.16 × 10−42.29 × 10−43.19 × 10−46.81 × 10−49.94 × 10−54.44 × 10−6
Waste gas2.05 × 10−31.02 × 10−95.64 × 10−51.53 × 10−53.94 × 10−61.60 × 10−58.31 × 10−63.56 × 10−54.95 × 10−5
Impact categoryTerrestrial ecotoxicityFreshwater ecotoxicityMarine ecotoxicityHuman carcinogenic toxicityHuman non-carcinogenic toxicityLand useMineral resource scarcityFossil resource scarcityWater consumption
Unitkg 1,4-DCBkg 1,4-DCBkg 1,4-DCBkg 1,4-DCBkg 1,4-DCBm2a crop eqkg Cu eqkg oil eqm3
Total5.17 × 10−14.10 × 10−33.05 × 1013.51 × 1003.07 × 1012.98 × 10−39.72 × 10−55.10 × 10−25.50 × 10⁻³
Input and emissions to air0.000.000.000.000.000.000.000.000.00
LPG1.30 × 10−11.64 × 10−41.06 × 1001.51 × 10−17.69 × 10−11.85 × 10−42.40 × 10−51.55 × 10−23.49 × 10⁻⁵
Electricity3.41 × 10−13.28 × 10−32.69 × 1011.11 × 1002.52 × 1012.34 × 10−36.54 × 10−53.45 × 10−25.42 × 10⁻³
Waste gas4.63 × 10−26.61 × 10−42.60 × 1002.24 × 1004.71 × 1004.51 × 10−47.71 × 10−69.93 × 10−44.84 × 10⁻⁵
Table 7. Comparison of main process parameters and results for sewage sludge treatment methods.
ParameterUnitIncinerationGasificationPyrolysisHTC
Wet sewage sludge
  • Flow
kg/h1041.71041.71041.71041.7
  • Chemical enthalpy
kW246.8246.8246.8246.8
LPG
  • Flow
kg/h-193012.6
  • Chemical enthalpy
kW-242.8383.3160.7
Flue gas cleaning sorbents
  • Ammonia flow
kg/h1.502.272.66-
  • Calcium sorbent flow
kg/h8.198.198.19-
  • Active carbon flow
kg/h0.180.360.40-
Solid products
  • Bottom ash flow
kg/h39.450.6--
  • Solid flue gas treatment product flow
kg/h28.117.314.7-
  • Char flow
kg/h--94.7-
  • Char chemical enthalpy
kW--198.9-
  • Hydrocarbon flow
kg/h---216.4
  • Hydrocarbon chemical enthalpy
kW---661.3
Other parameters
  • Electricity consumption
kW116164161119
  • CO2 emission in flue gas/offgas
kg/h271.9332.7283.132.8
  • Carbon content in char/hydrocarbon
kg/h--19.765.0
Disclaimer/Publisher’s Note: The statements, opinions and data contained in all publications are solely those of the individual author(s) and contributor(s) and not of MDPI and/or the editor(s). MDPI and/or the editor(s) disclaim responsibility for any injury to people or property resulting from any ideas, methods, instructions or products referred to in the content.