1. Introduction
Building a modern power supply service system is a key initiative for power grid companies to enhance customers’ sense of access and well-being in electricity consumption, and to promote the co-development of core and value-added services [
1,
2,
3]. With the advancement of constructing a new-type power system dominated by renewable energy and deepening electricity market reforms in China [
4,
5,
6,
7], connection application service as well as operation and maintenance activities for photovoltaic systems, energy storage systems, and electric vehicle (EV) charging facilities have expanded substantially in engineering practice. Consequently, demand for customer services—such as customer inquiries, fault reporting, and complaints—has surged. Moreover, factors such as weather conditions and emergencies have intensified the uncertainty in call volume fluctuations. When staffing is insufficient, customer requests cannot be addressed in a timely manner, which can readily trigger online public opinion risk [
8]. Conversely, redundant staffing results in excessively high labor costs, undermining the operational economic efficiency of power supply enterprises. Against this backdrop, ECSS faces significant challenges; the efficient and practical ECSS is critical to ensuring smooth and reliable energy use for electricity customers. Therefore, it is imperative to model and optimize ECSS under the heightened uncertainty of the new-type power system, which is of substantial theoretical and engineering significance.
Current research on ECSS has largely focused on optimization from the service side. References [
9,
10,
11] improve the scheduling system by considering, respectively, indicators such as agents’ satisfaction, fatigue, and competency. However, model and algorithm improvements limited to the service side have inherent constraints in enhancing the overall staffing supply system, as they often overlook the role of customer energy demand (CED) within the power supply service system in shaping ECSS, thereby weakening the applicability of these approaches. In existing CED-oriented ECSS studies, big-data analytics is widely used. References [
12,
13] leverage power big data to develop methods for obtaining accurate customer profiles, providing a data foundation for scheduling research. Reference [
14] develops a data-mining-driven AI customer service system, improving the service acceptance rate and operational efficiency. Although these CED-related studies can identify customer needs through big-data mining, they provide insufficient linkage between demand identification and scheduling decisions. For example, reference [
15] establishes a relatively complete mechanism for power customer demand analysis and feedback, but it does not further connect customer demand with ECSS. In addition, agents’ skill level is an important factor affecting ECSS service quality; nevertheless, research on this aspect remains limited. Reference [
16] mainly focuses on skill evaluation methods, without considering how user demand influences skill evaluation.
In summary, the existing ECSS literature has two main limitations: (1) it neglects the influence of customer demand within the power supply service system on agent scheduling; (2) studies on skill level are largely confined to evaluation models, with insufficient matching between skills and heterogeneous CED; and (3) scheduling relies on specialist experience but not data. From the viewpoint of power companies, customer service skills should be more closely integrated with CED. For demands such as electricity connection applications, electricity bill services, and emergency repair and restoration, how to achieve demand–skill matching and incorporate it into ECSS remains a research gap. Therefore, integrating user-side CED and service-side skill level into the agent scheduling model is important for improving the operational efficiency of customer service centers and electricity customers’ call service satisfaction.
To address these gaps, this paper proposes a data-driven ECSS optimization model based on demand analysis and demand–skill matching. First, a CED model and a skill matching model are established, including analyses of electricity customers’ energy-use behavior, agent skill evaluation, and a mathematical method for demand–skill matching. Next, because PSO offers fast convergence, simple implementation, and relatively few parameters, and is more likely to identify a global optimum, it is well suited to ECSS problems characterized by large-scale data and short computation time. Accordingly, by incorporating user- and agent-related constraints and the ECSS objective function, a PSO-based scheduling optimization algorithm is developed to obtain the optimal agent scheduling solution [
17]. Finally, simulation cases are used to verify the effectiveness and practicality of the proposed method.
2. Technical Framework
The assumptions made in this article are as follows:
- (1)
The total number of personnel employed by the customer service center is sufficient.
- (2)
The expert’s evaluation of each indicator is based on engineering experience and rationality.
- (3)
There is a correlation between users’ energy consumption needs and their energy consumption data.
Considering that ECSS is influenced by both the user side and the service side, the relevant behaviors and parameters of electricity customers and customer service agents are modeled and analyzed separately [
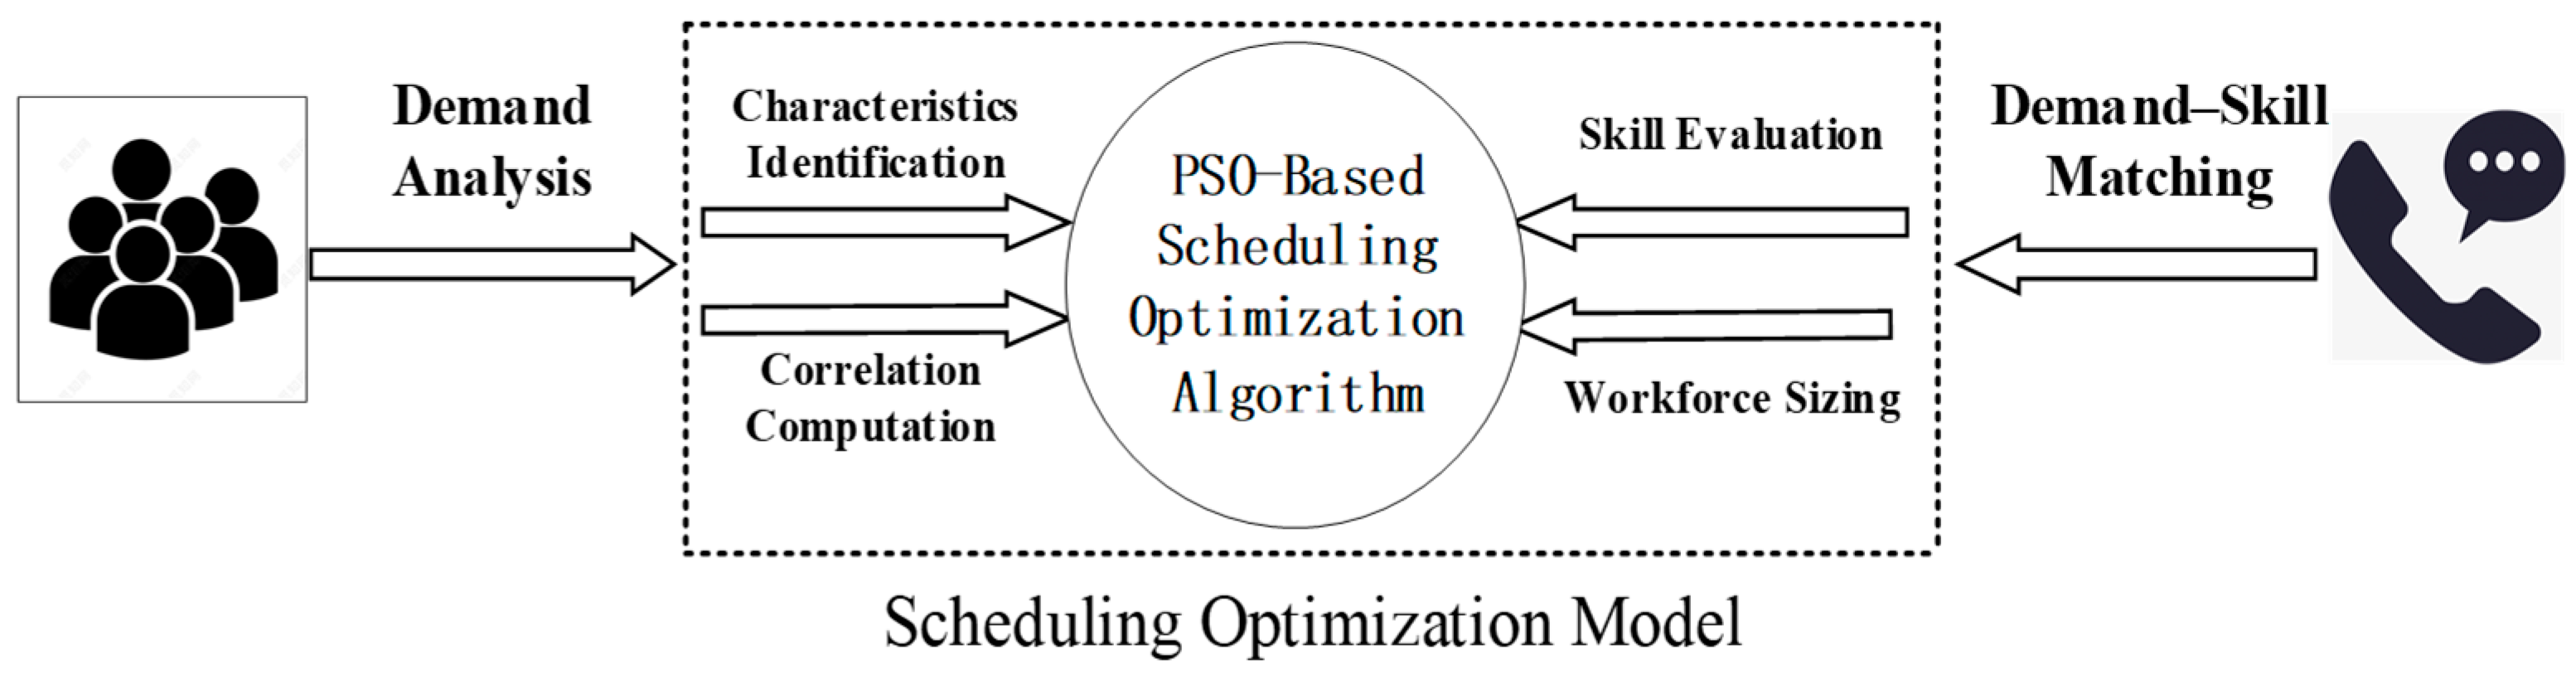
18]. Based on this, this paper proposes a scheduling framework termed “dual-driven optimization of customers and customer service agents”, as illustrated in
Figure 1. Electricity customers and customer service agents serve as the demand-side and service-side entities in agent scheduling, respectively. They not only provide the input data that drive the intelligent optimization process but also form the foundation of the proposed scheduling optimization model. By integrating data from both sides and applying mathematical modeling methods, the framework specifies the key components required for optimized scheduling and dispatch, including constraints, the objective function, and the intelligent algorithm. On the user side, energy-use characteristics are identified through demand analysis, and potential demands are further mined via correlation computation. On the service side, differentiated assessments are conducted according to skill categories based on agents’ historical service performance, and workforce sizing is performed in conjunction with the given call volume.
The dual-driven optimized scheduling and dispatch framework is implemented as follows: (1) analyze the energy-use behavior data of target customers to identify their energy-use characteristics; (2) establish a behavior–demand correlation computation model to quantify the correlation between energy-use characteristics and demand categories across different customers, thereby mining potential service demands; (3) in conjunction with the predicted call volume for each time period, the corresponding time span, and per-agent workload/capacity parameters, develop a weighting model for workforce sizing to determine the staffing level for that period; (4) for the planned workforce, perform skill scoring and evaluation based on historical call-handling time, such that agents with higher scores for a given skill are prioritized in call routing to serve customers with corresponding demands; and (5) integrate the models and parameters derived from demand analysis and demand–skill matching to specify the constraints and objective function, and then develop a PSO-based ECSS scheduling optimization algorithm to achieve the goals of improving customer satisfaction and enhancing the operational efficiency of the customer service center. The technical framework proposed in this paper is not only applicable to power grid service centers; its demand analysis and skill matching technology is also applicable to other service centers with diverse service demands.
3. ECSS Planning Formulation
Mining CED and incorporating agents’ skills constitute the basis for establishing an ECSS scheduling optimization model. Accordingly, this study conducts modeling and analysis using customers’ energy-use behavior data and agents’ historical call logs. Specifically, parameters of customers’ energy-use behavior and the average handling time (AHT) are taken as inputs, while the skill scoring results are imposed as the main constraints. The historical AHT for staffs serving different demand points has a complete data source and can truly reflect the proficiency of staffs in serving this type of demand from a probabilistic perspective; hence, it is chosen as the indicator of skill level. The staffing level planned for each time period is treated as the decision variable. With customer satisfaction and AHT considered, the objective function is formulated, thereby establishing the ECSS planning formulation.
3.1. A CED Analysis Model Based on Energy-Use Behavior
3.1.1. Energy-Use Characteristics’ Identification
Perceiving electricity customers’ energy-use characteristics is fundamental to analyzing CED. Against the backdrop of the rapid development of a new-type power system dominated by renewable energy, customer behaviors have become increasingly diverse and complex, making sequence-based modeling more suitable for identifying energy-use characteristics. Specifically, a user behavior sequence matrix is used as the input, in which each element represents a customer’s energy-use parameter. The matrix comprises eight categories of energy-use data, such as the daily load factor, peak-to-valley ratio, and day-to-night load ratio:
where
bi_d,n denotes the value of the
i_d-th category parameter for customer
n.
Then, based on the parameter thresholds set according to expert opinions and practical experience, a user behavior parameter decision-threshold matrix (
Uc) is established:
where
uc,i_c denotes the threshold of the
i_c-th category parameter.
The matrix
B is subjected to threshold-based decision calculations to obtain the energy-use characteristics matrix
C, under the following simplifying assumptions:
where
ci_t,n is the ground-truth value of customer
n for the
i_t-th feature. An element value of 1 indicates that the user possesses this feature, whereas 0 indicates otherwise. All elements are initialized to 0.
3.1.2. Correlation Computation Between Energy-Use Characteristics and CED
Based on the identified energy-use characteristics, the potential service demands of target customers are mined to guide ECSS agent scheduling optimization. The MIC method can capture the linear and nonlinear relationships between data, and it has been developed quite maturely. The similar approach of setting expert thresholds is widely adopted in engineering and data-driven research. Accordingly, a correlation computation method is developed to map characteristics to demand categories. Considering that customers may exhibit multiple demand targets, the maximal information coefficient (MIC) method [
19] is adopted for the computation:
where
I(
X1,
X2) denotes the information coefficient between
X1 and
X2. Here,
X1 represents an identified existing energy-use characteristic, and
X2 represents the demand category for which correlation determination is required.
P(
X1,
X2) is the joint probability density of
X1 and
X2;
P(
X1) and
P(X2) are the marginal probability density distributions of
X1 and
X2, respectively.
M(
X1,
X2) denotes the correlation between them, and
a and
b denote the numbers of partitions of the value ranges of
X1 and
X2, respectively.
The simplifying assumptions for
M are as follows:
Since the results of calculating correlation using the MIC method fall within the range [0, 1], when the correlation coefficient is greater than 0.5, its position within this range indicates a higher potential demand. Therefore, from an engineering practice perspective, the default MIC threshold in this paper is set to 0.5. The selection of this threshold is not fixed but rather considers the actual production needs of customer service center engineering and the experience of scheduling staff, allowing for flexible adjustments, thereby reducing the impact of the threshold on the model’s output. A value of 0.5 is a commonly used threshold for correlation determination, which can be adjusted and optimized according to different practical scenarios and the requirements of the power grid. To simplify modeling, this paper considers the demand type with the highest correlation as the user’s latent demand and does not, for the time being, take into account the matching problem between users with multiple demands and service staff with various skills. Select the one with the highest information coefficient among potential demand as the user’s most likely potential demand, and subsequently match it with the staffs’ service requests. When a real-time call comes in, the user will proactively select the desired demand category, and the scheduling results will provide the user with sufficient and matched staff to complete the service.
3.2. Agent Skill Evaluation and Workforce Sizing Model
3.2.1. Agent Skill Evaluation
This paper assumes a one-to-one correspondence between customer service skill categories and customers’ demand categories. However, as demand categories become more diverse and power service tasks more complex, a single agent can hardly satisfy all service requirements. Therefore, during ECSS optimization, it is necessary to manage agents’ tasks in a more refined manner—namely, assigning agents who are proficient in a given task to serve customers with the corresponding demand category. This process depends on a robust skill evaluation algorithm.
The skill evaluation scheme adopted in this paper is developed based on each agent’s historical AHT. In power customer service practice, it is generally accepted that, for the same service skill, a shorter historical AHT is more likely to indicate higher proficiency in that skill. Accordingly, the skill evaluation model is formulated as follows:
where
S denotes the scoring matrix of agent
k over skill
l.
pi_k,m is the percentile rank of the historical handling time of agent
i_k on service task
l.
N is the total number of agents, and
ri_k,l is the ranking of agent
i_k in terms of historical handling time for service task
l. The evaluation results are simplified into skill scores, under the following simplifying assumptions:
That is, based on the percentile rank, agents’ service capability is categorized into three levels, assigned scores of 100, 80, and 60, respectively.
3.2.2. Workforce Sizing
Workforce sizing is an important component of the ECSS problem, and it requires a comprehensive consideration of how factors such as service operations, labor costs, and agent fatigue affect the staffing level in each time period. In this paper, a weighting indicator
is designed, which includes the proportion of the call volume within a time period to the total daily call volume
, the average per-agent workload
, and the working duration
. In this indicator,
reflects the workload or busyness level within the corresponding shift time period;
, as the base of the weighting indicator, is kept identical across all time periods for balance and human-centric considerations; and
reflects the effects of fatigue and agent satisfaction. Under otherwise identical conditions, a longer shift duration should be associated with a moderately increased staffing level to alleviate agents’ work pressure. Finally, the planned staffing level for time period
i_range is obtained as follows:
where
c1,
c2 and
c3 are the coefficients of the weighting terms, which can be obtained from expert opinions or practical iterative experience using the AHP–fuzzy comprehensive evaluation method [
20,
21]. Due to management experts’ greater familiarity with engineering scenarios and richer scheduling experience, this paper chooses to use the weighted coefficients determined by real customer service center management experts for application in the constructed model. Furthermore, the weighted coefficients can be adjusted according to the actual situation of the customer service center, achieving a balance between corporate economy and service quality, and enhancing the flexibility of the algorithm and the engineering stability of the results.
The three quantities
,
and
differ in dimensions and physical meanings, which reduces the comparability of the data
during the computation process. Therefore, when constructing the above function, these quantities need to be transformed onto the same numerical scale. In this paper, the Z-score standardization method is applied to process the data, and the specific procedure is as follows:
where
denotes the data sample.
hi_h,j is the
i_h-th data entry of the
j-th category (waiting time, handling time, and skill scoring),
gi_h,j is the standardized value,
is the mean of the
j-th category data, and
Scj is the standard deviation of the
j-th category data.
Finally, a curve is fitted between the call volume and the planned staffing level using the gradient descent method:
where
is the hypothesis function, i.e., the staffing level;
xi_x denotes the call-volume group; and
is the loss function.
is obtained from the call volume.
Finally, by referring to the weight distribution of each time period, the total number of agents deployed per day is obtained as
4. Intelligent Optimization Algorithm
4.1. Demand–Skill Matching Algorithm
First, a workforce working-state matrix
W for the current time period is constructed, where the element
wm denotes the working status of agent
m: 1 indicates an occupied state, and 0 indicates an idle state. All elements are initialized to 0. Meanwhile, a customer information matrix
E is established to record the demand
Ed, queuing time
Eqt, and handling time
Est:
Incoming calls are traversed minute by minute. For each call, its corresponding skill type is identified, and idle agents are ranked according to their skill scores, where the higher-scoring agents are prioritized for demand–skill matching. Once matched, the selected agent starts serving the call and the handling time is recorded. If all agents are busy during a given minute, the call waits until the next minute and the queuing time is recorded:
where
Est,i_e denotes the queuing time of customer
i_e,
Eqt,i_e denotes the handling time of customer
i_e,
wm denotes the working status of agent m, and
n_t denotes the number of agents on duty in the current time period. In addition, once a call service is completed, the corresponding handling time will no longer be updated, and the working status of the serving agent is set to 0.
4.2. Objective Function and Constraints
When constructing the scheduling objective function, in addition to the influence of agents’ working time, the effects of demand–skill matching also need to be considered. Accordingly, a customer satisfaction function is designed, which mainly accounts for the queuing time and the skill score of the matched agent. By integrating this satisfaction function with the agents’ handling time, the objective function for ECSS dispatch optimization is formulated as follows:
where
goal denotes the objective function, and
represents the weighting coefficients, obtained using the fuzzy comprehensive evaluation method based on expert opinions and practical iterative experience.
Fav denotes customer satisfaction,
Ttotal denotes the total working time of agents,
denotes the average queuing time of customers, and
denotes the average skill score of agents. The objective function is computed after applying Z-score standardization to
Ttotal,
, and
. When the demand cannot be perfectly matched with staff skilled in that skill, the model will preferentially match the user to staff with a higher average skill level to improve user satisfaction.
In addition, the optimization model is subject to the following constraints:
where
Tma denotes the maximum allowable waiting time;
Sav denotes the average skill level of agents serving answered calls;
t denotes the number of minutes traversed within a day; and
Fmin denotes the minimum allowable customer satisfaction. When the predicted call volume is lower than the actual volume, the algorithm can handle an excessive number of incoming calls by appropriately extending the waiting time.
4.3. Workflow of the Skill-Matching-Aware PSO-Based Scheduling Optimization Algorithm
Since the established model involves nonlinear computation of variables and encompasses multiple objectives, it is suitable for solving using the relatively mature PSO heuristic algorithm [
22]. By integrating the modeling data on customers’ demands and agents’ skills discussed above, the formulated model is solved using particle swarm optimization (PSO). The procedure is as follows:
- (1)
Establish a user behavior analysis platform to analyze customers’ CED, and store customer tags as well as potential call demands.
- (2)
Based on the given call volume, the per-agent hourly workload requirement, and the length of each time period, perform workforce sizing for each time period.
- (3)
For the planned workforce, categorize agents by service skill categories and conduct multi-skill scoring for each agent according to the historical handling time of calls in the corresponding category.
- (4)
Compute the initial objective function using the initial data.
- (5)
Input the indicators and apply PSO to optimize the objective function; iterate within the decision-variable bounds until convergence is achieved.
5. Simulation Analysis
Due to the sensitivity of enterprise data, this paper selects the average values of historical work order data from the customer service center of a power grid in a southern province in China from 2021 to 2022 to verify the practical effectiveness of the proposed algorithm model in long-term engineering applications. The population size of PSO is set to 1000, the maximum number of iterations is set to 300, the convergence error is set to 0.01, Tma is set to 30 s, a1 and a2 are set to 0.68 and 0.32, respectively, and γ1 and γ2 are set to 0.33 and 0.66, respectively. The simulation results are analyzed from four aspects: the correlation results between energy-use characteristics and customer demands, workforce sizing performance, the objective function, and economic benefits. The model proposed in this paper has been applied in a customer service center of a power grid in a certain region of South China since 2023, with an average solution time of up to 57 s and a convergence rate of over 99%. However, it primarily focuses on the scenario of personnel scheduling planning before a day or a period and does not consider real-time deployment of the algorithm.
5.1. Correlation Results Between Energy-Use Characteristics and Customer Demands
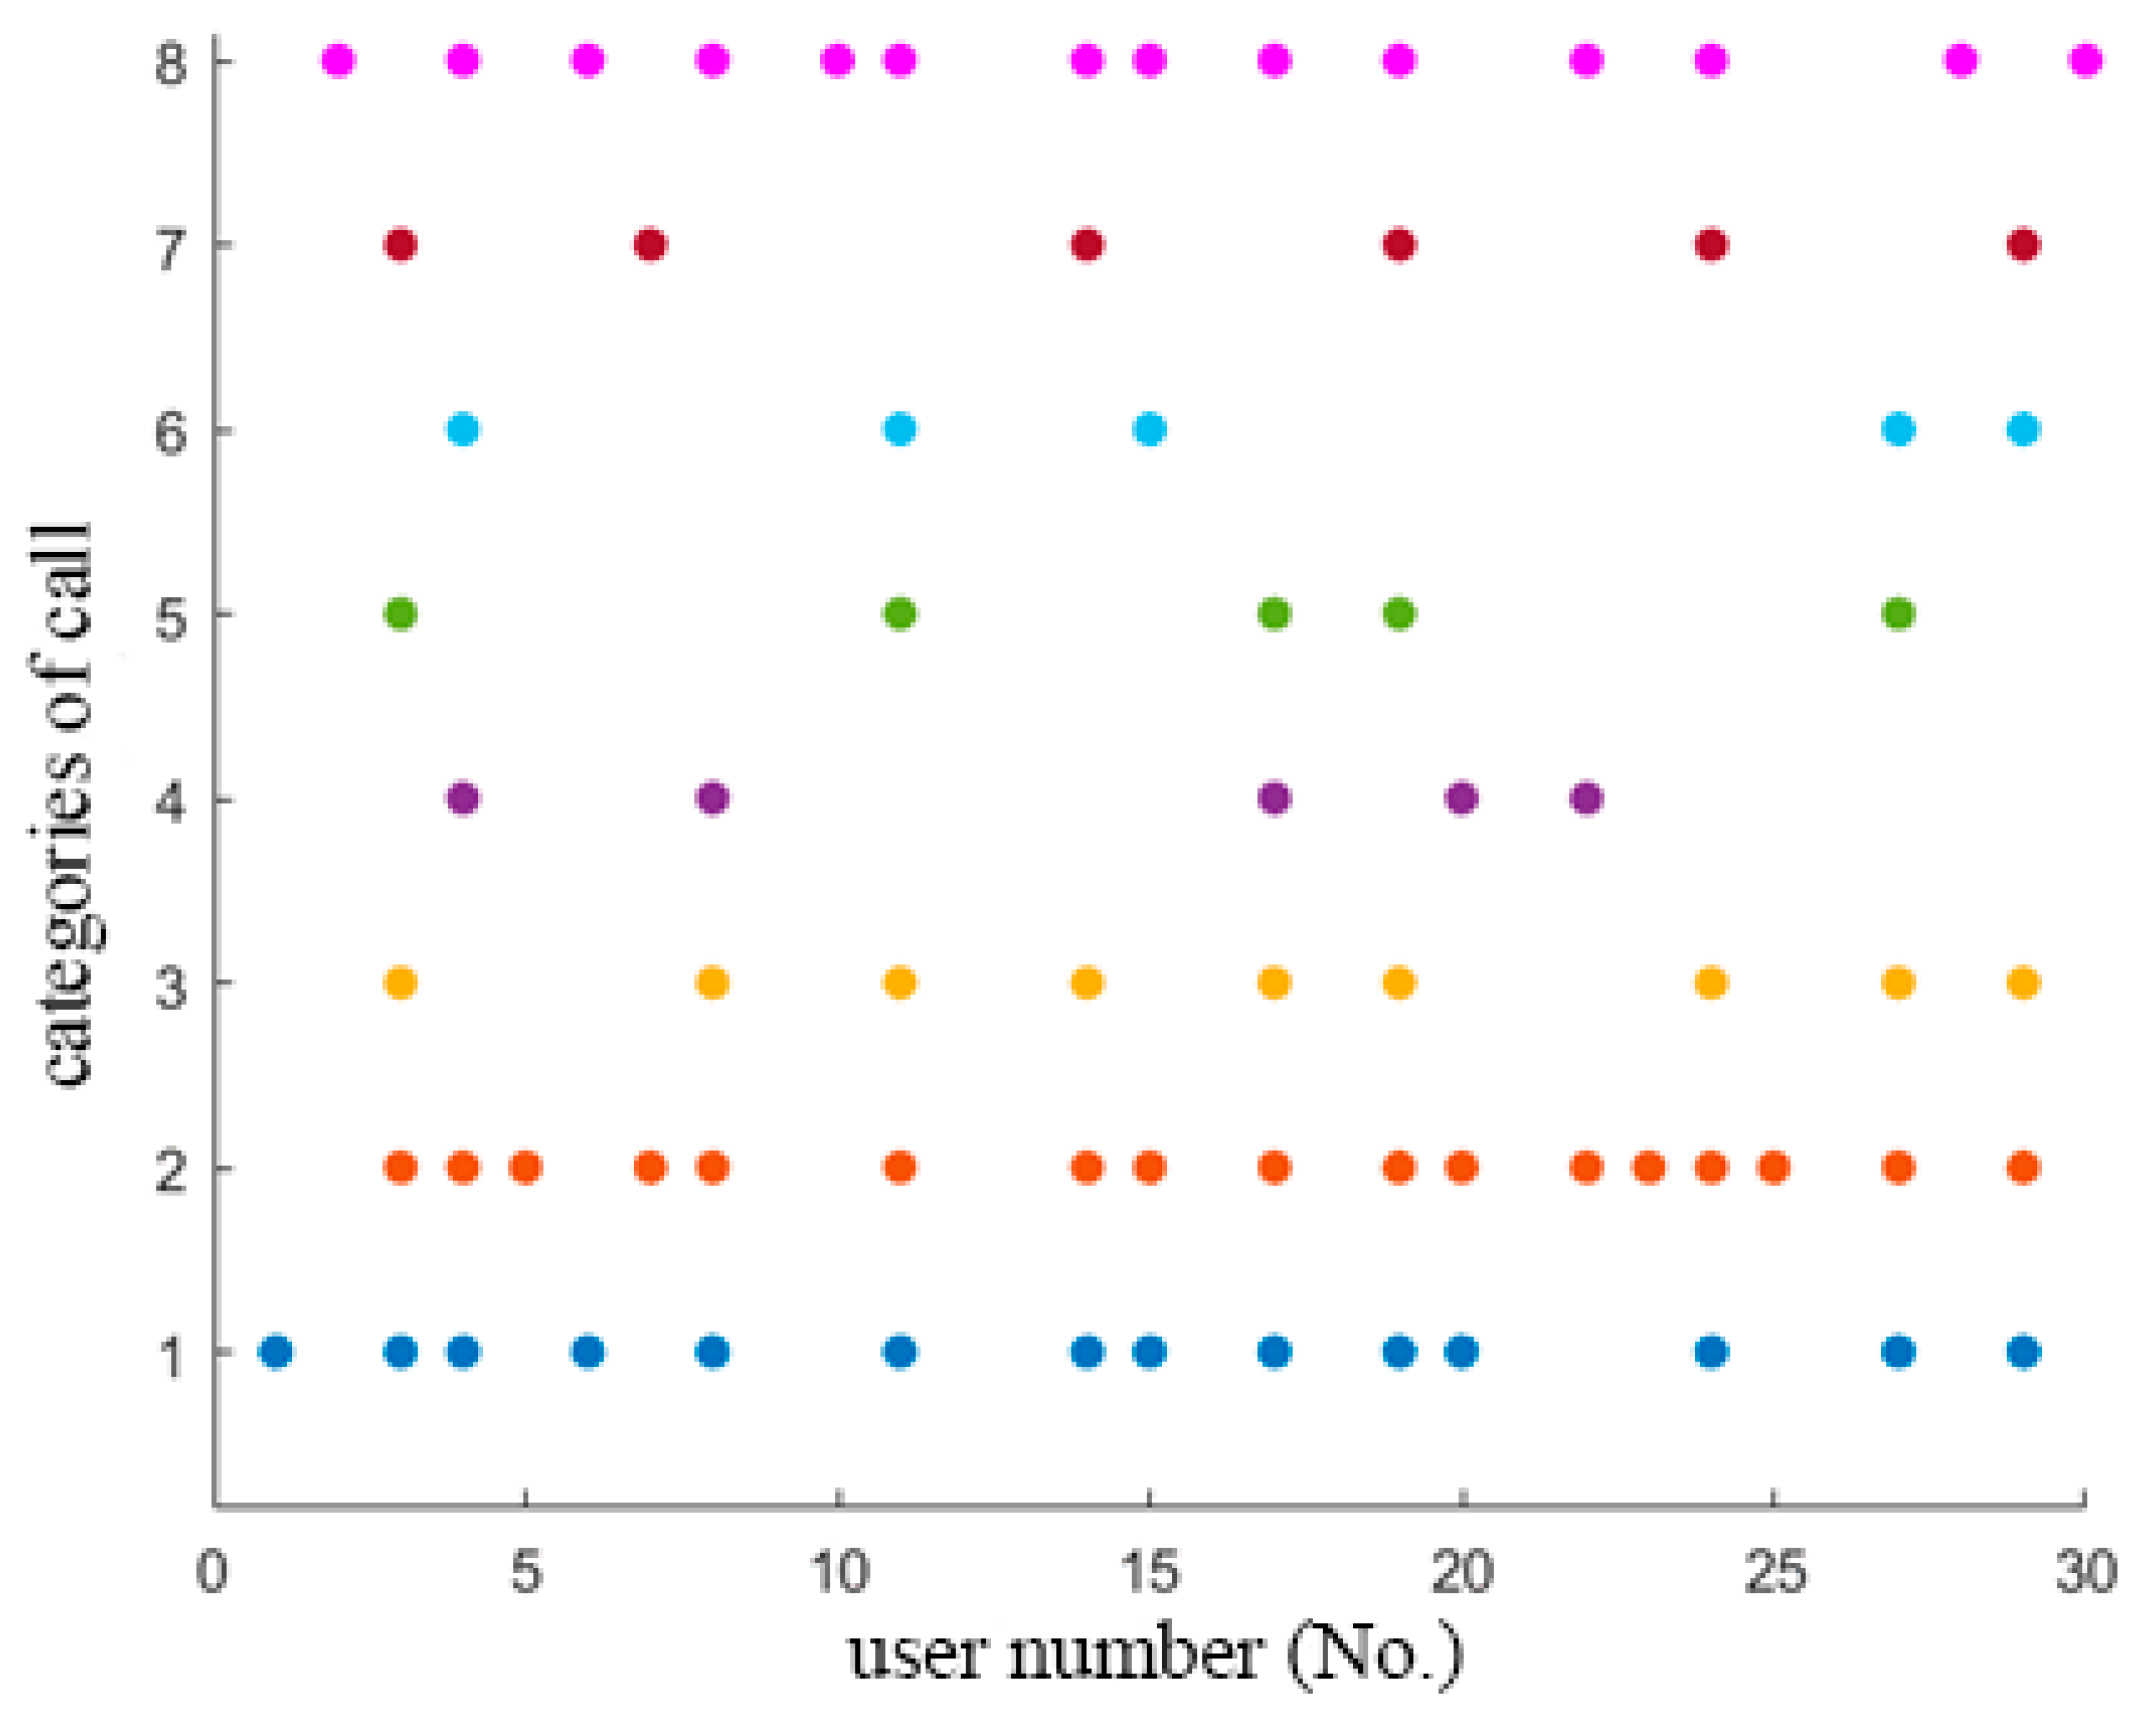
Thirty target customers are randomly selected. By applying energy-use behavior parameters to energy-use characteristics’ identification and correlation computation, the correlation results between energy-use characteristics and service demand categories are obtained, as shown in
Figure 2. In
Figure 2, the categories of call from 1 to 8 are represented by different colors, corresponding to the following eight energy-use characteristics: suggestions, maintenance, reporting, complaints, opinions, electricity services, inquiries, and others. Because service demand categories are numerous and continue to expand, eight representative categories with relatively high request frequency are considered here, namely electricity connection application, electricity bill service, electricity-use contract change, power quality service, intelligent electricity regulation, emergency repair and restoration, facility operation and maintenance, and EV charging pile connection.
According to
Figure 2, customers’ demands for electricity connection application, electricity bill service, and EV charging pile connection are more prevalent; therefore, more agents proficient in handling these requests can be scheduled. In contrast, demands related to power quality service and intelligent electricity regulation are relatively limited, and the number of agents assigned to such requests can be appropriately reduced.
Five representative customers are further selected, and their energy-use behavior data are described as follows: customer #1 is an EV charging station and has shown a continuously increasing load factor in the recent period; customer #2 is a residential user with historical records of electricity bill inquiries; customer #3 is a commercial center involving multiple-meter services; customer #4 is a long-established mechanical manufacturing plant; and customer #5 has multiple historical records of fault repair. By analyzing the energy-use characteristics of these five customers, the correlation matrix is obtained, as shown in
Table 1.
In
Table 1, 1–8 denote the indices of demand categories, and #1–#5 represent different customers. The correlation results reasonably reflect the behavior characteristics of the selected customers. For example, the machinery in the plant of customer 4 requires relatively high power quality, and its long service life may also increase the likelihood of electrical equipment failures; therefore, this customer is associated with demands related to power quality and facility operation and maintenance. Overall,
Table 1 further demonstrates the effectiveness of the established CED model.
5.2. Workforce Sizing Performance Analysis
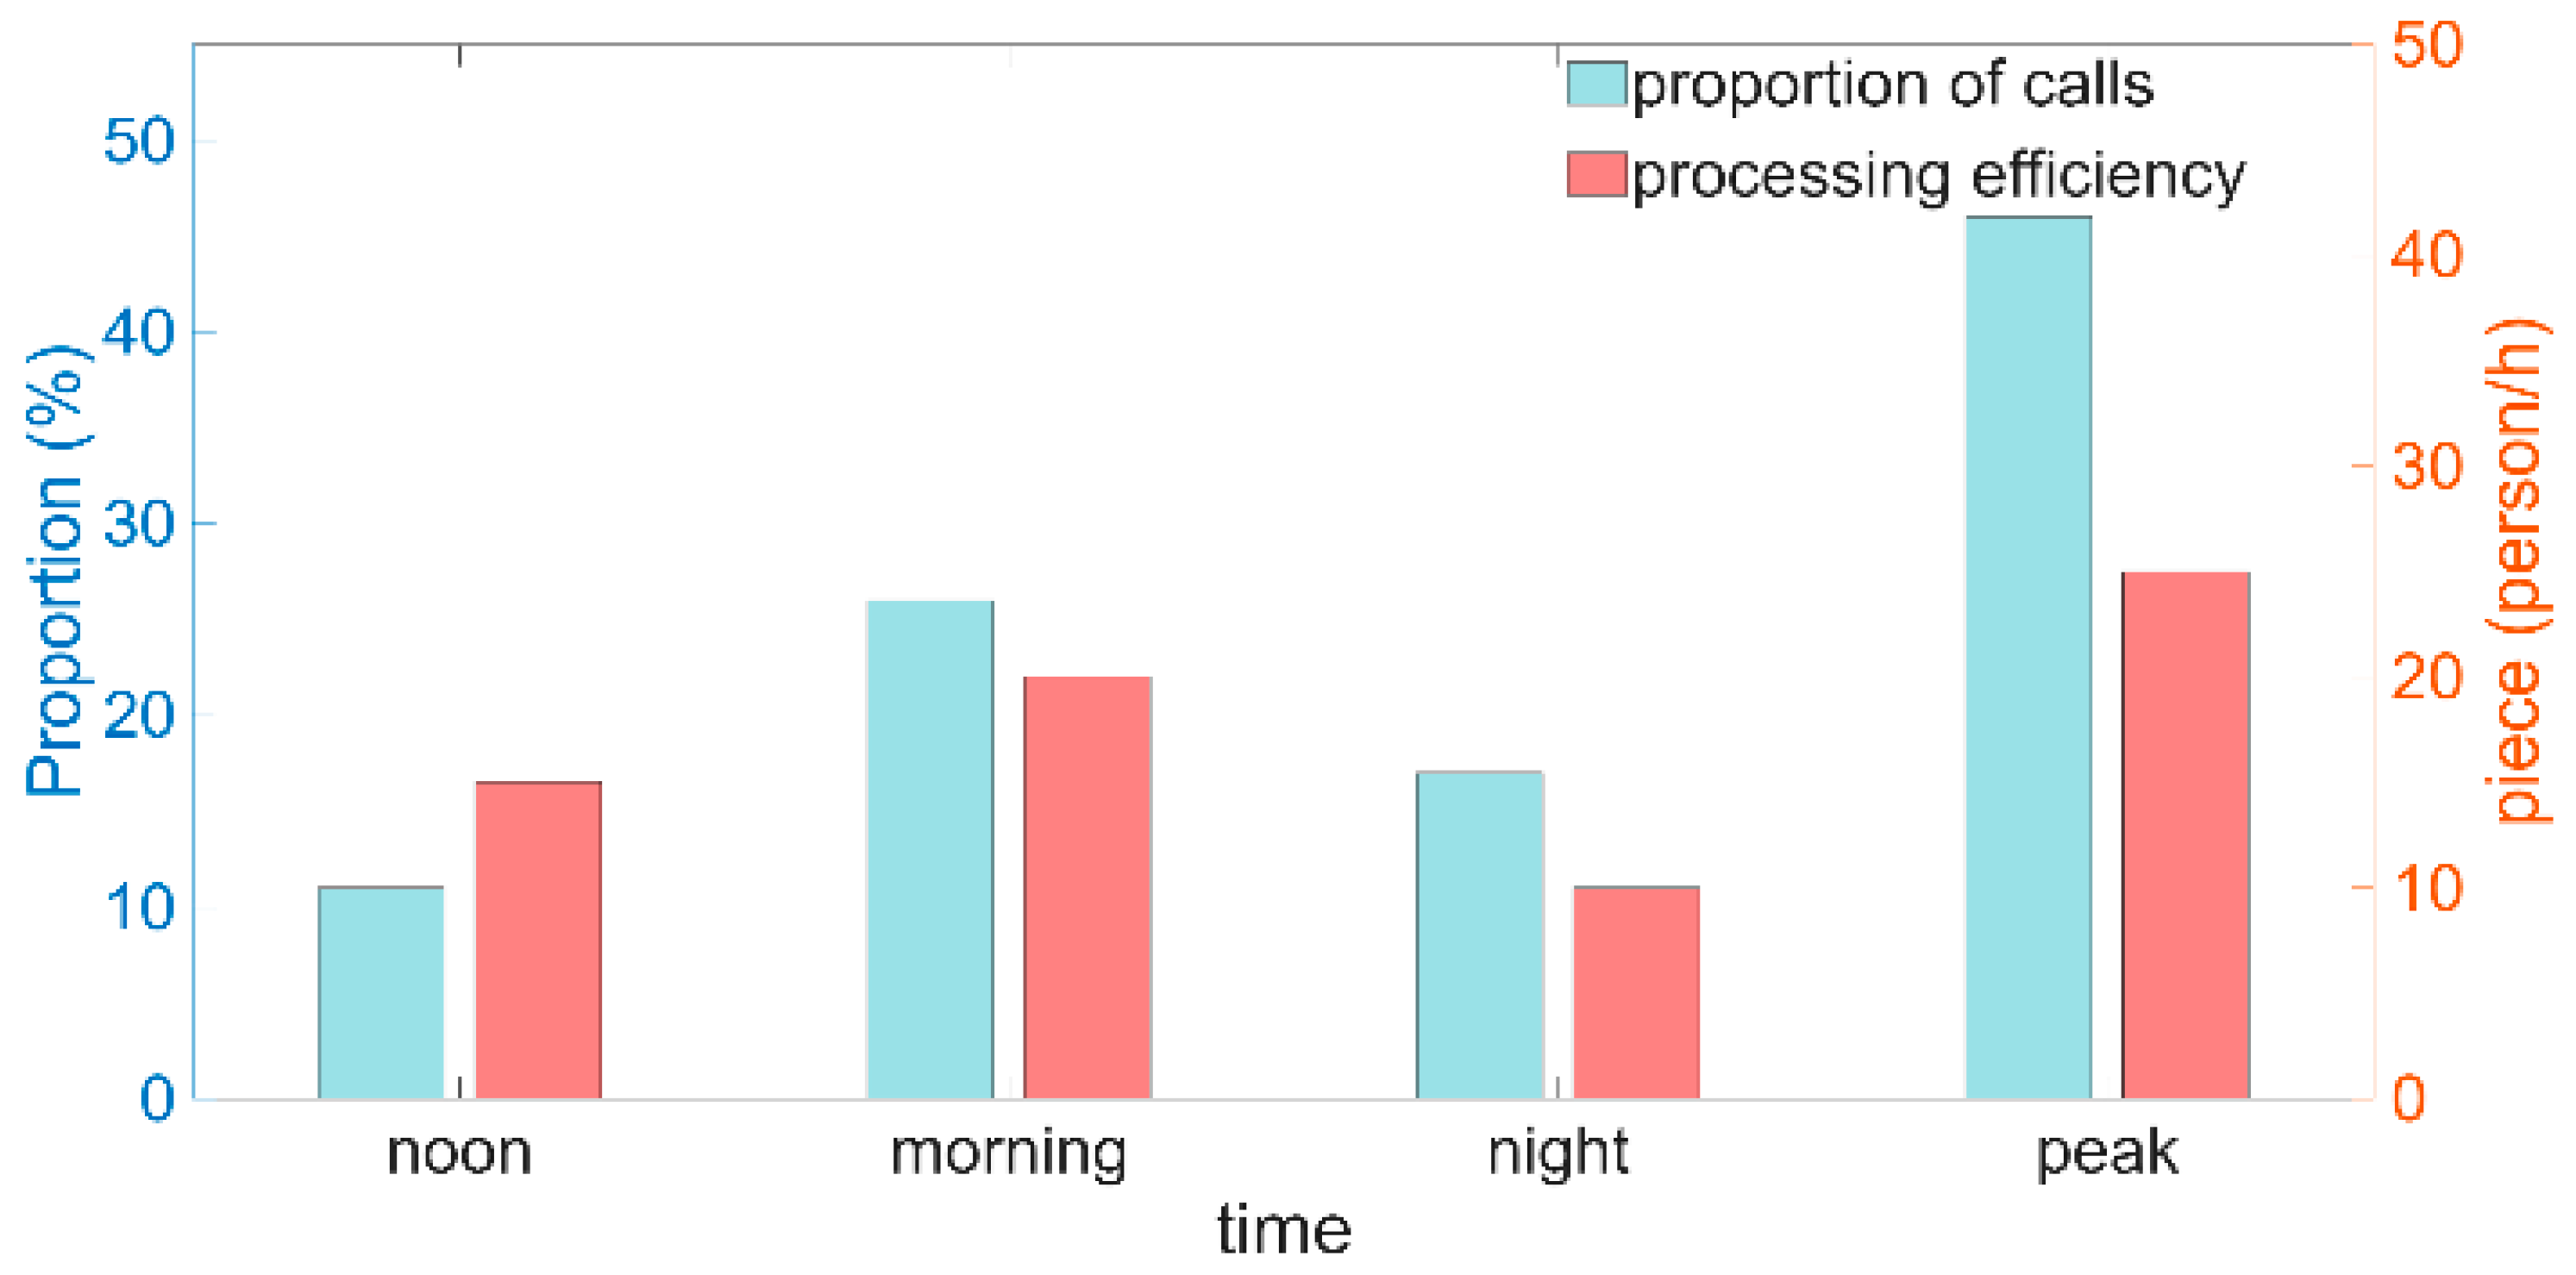
During the simulation of the scheduling and dispatch model, each day is divided into four time periods based on time and call volume: morning, peak, noon, and evening. The corresponding time lengths are 3 h, 6 h, 2 h, and 13 h, respectively, indexed from 1 to 4. The call volume proportion of each time period and the per-agent hourly call-handling volume are shown in
Figure 3:
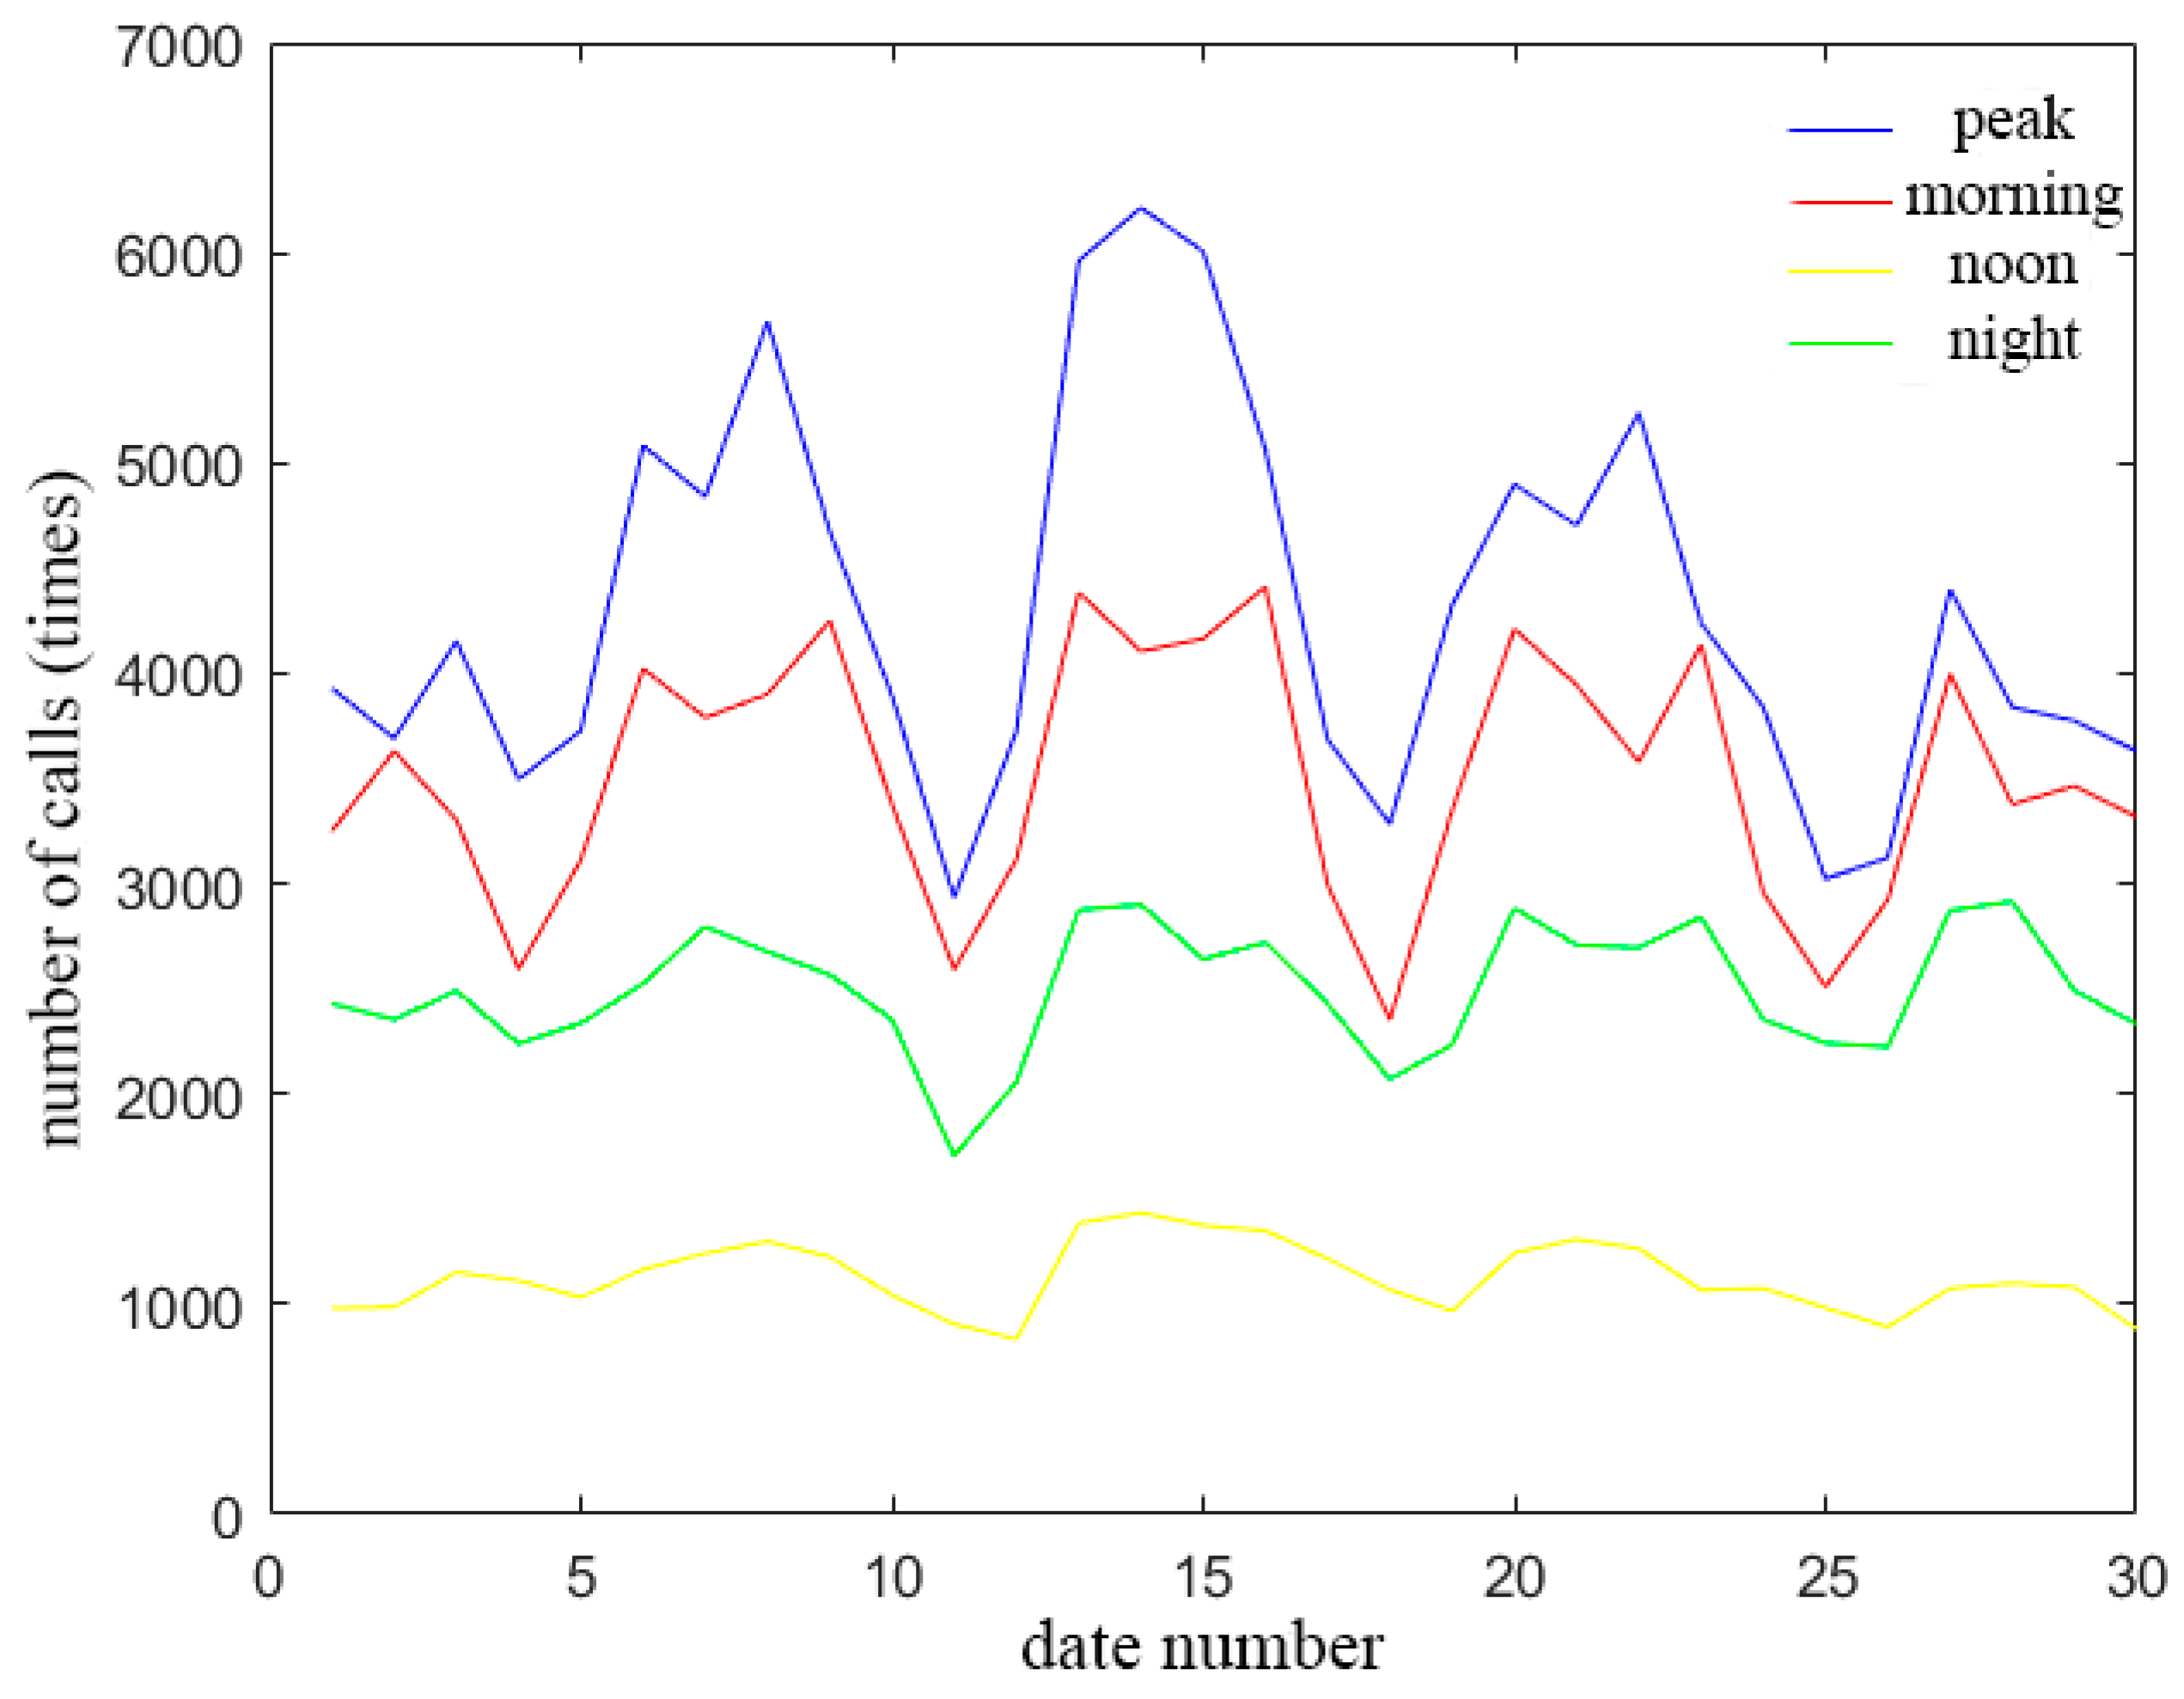
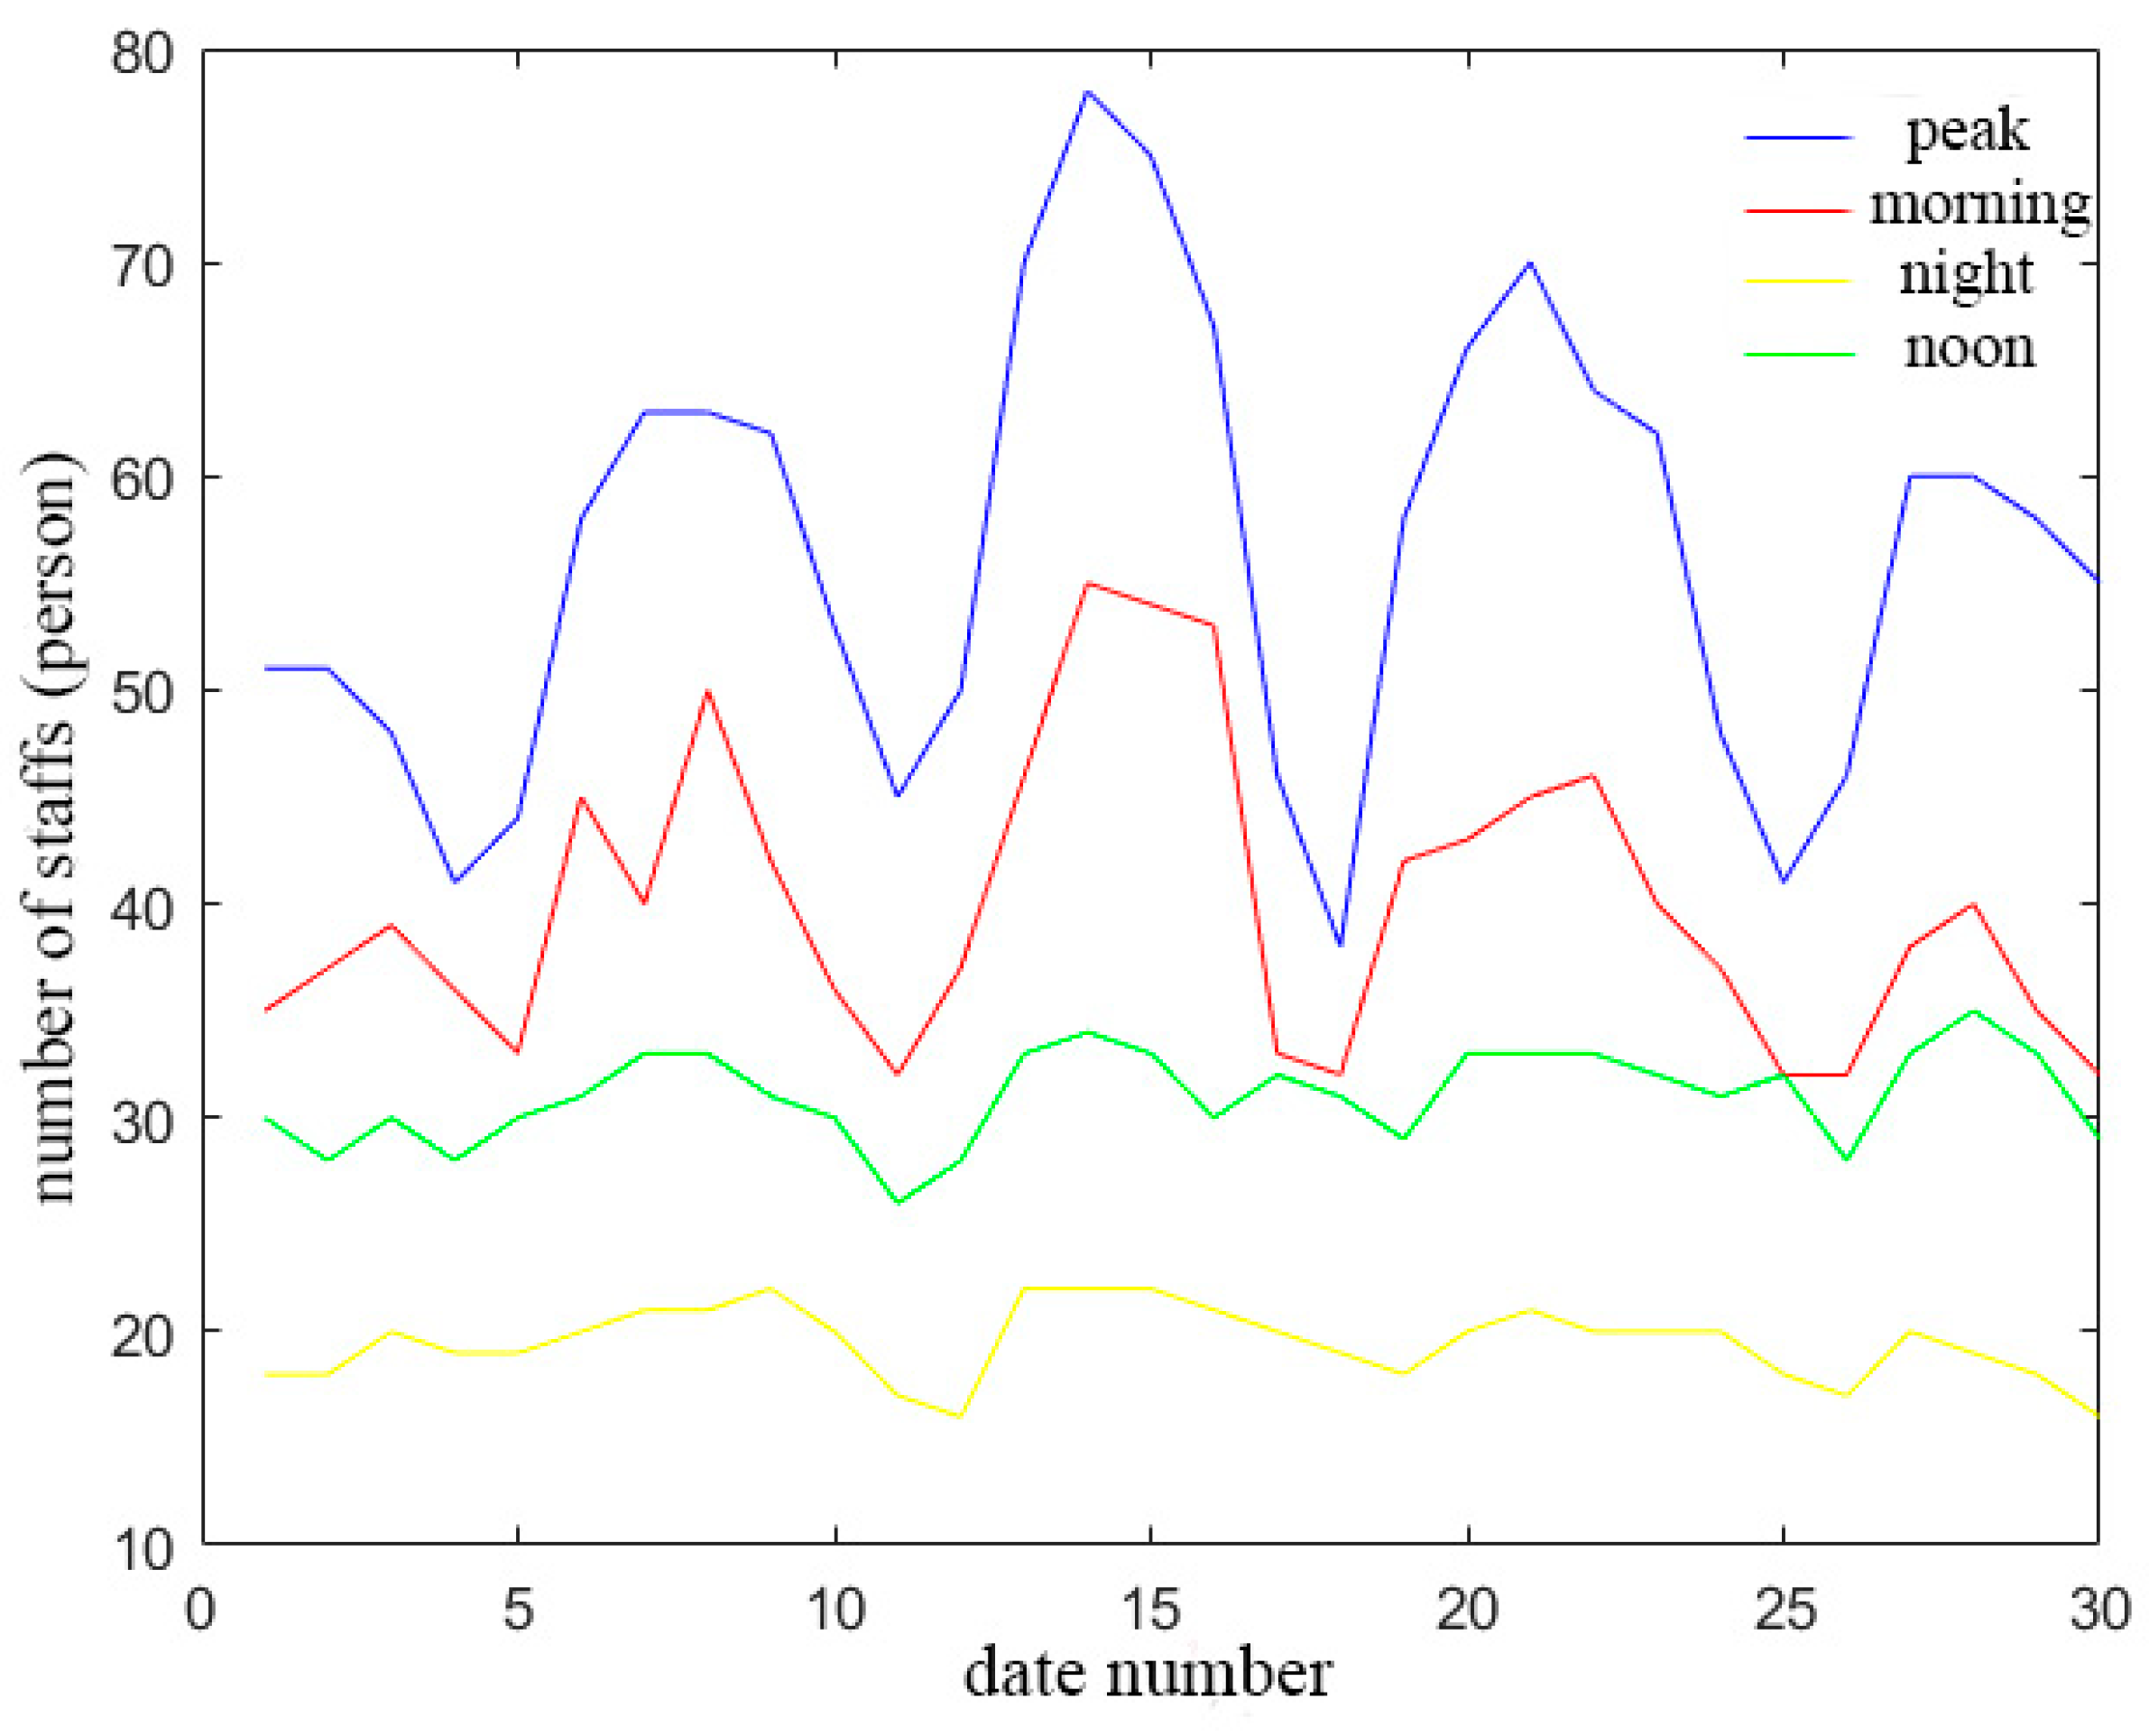
The call volume scales of the above four time periods are shown in
Figure 4, and the workforce sizing results obtained using the proposed scheduling algorithm are shown in
Figure 5. Although the peak period lasts only 6 h, it accounts for approximately 45% of the total daily call volume, and the per-agent hourly call-handling volume is also higher than that in other periods. Therefore, the demand for agents in this period is substantial. This is reflected in the workforce sizing results derived by comprehensively considering
,
and
, where the peak period is allocated the largest staffing level, reaching up to 78 agents. In contrast, the noon period requires fewer agents, and the planned staffing level is the smallest among all periods, at approximately 20 agents per day. Overall, the workforce sizing results are consistent with the predefined model settings and demonstrate practical value.
In addition,
Table 2 reports time-period-based scoring for a specific skill of 35 on-duty agents scheduled in a given time period to verify the reliability of the scoring model. The historical handling time of calls corresponding to the demand category of this skill within the selected time period is used as the input, and the resulting skill scores are summarized in
Table 2:
The skill scoring results provide matching constraints for the service dispatch model that incorporates agents’ skills; specifically, agents with higher scores are prioritized for incoming calls, thereby reducing handling time and improving customer satisfaction and service efficiency.
5.3. Comparison of Results Across Different Models
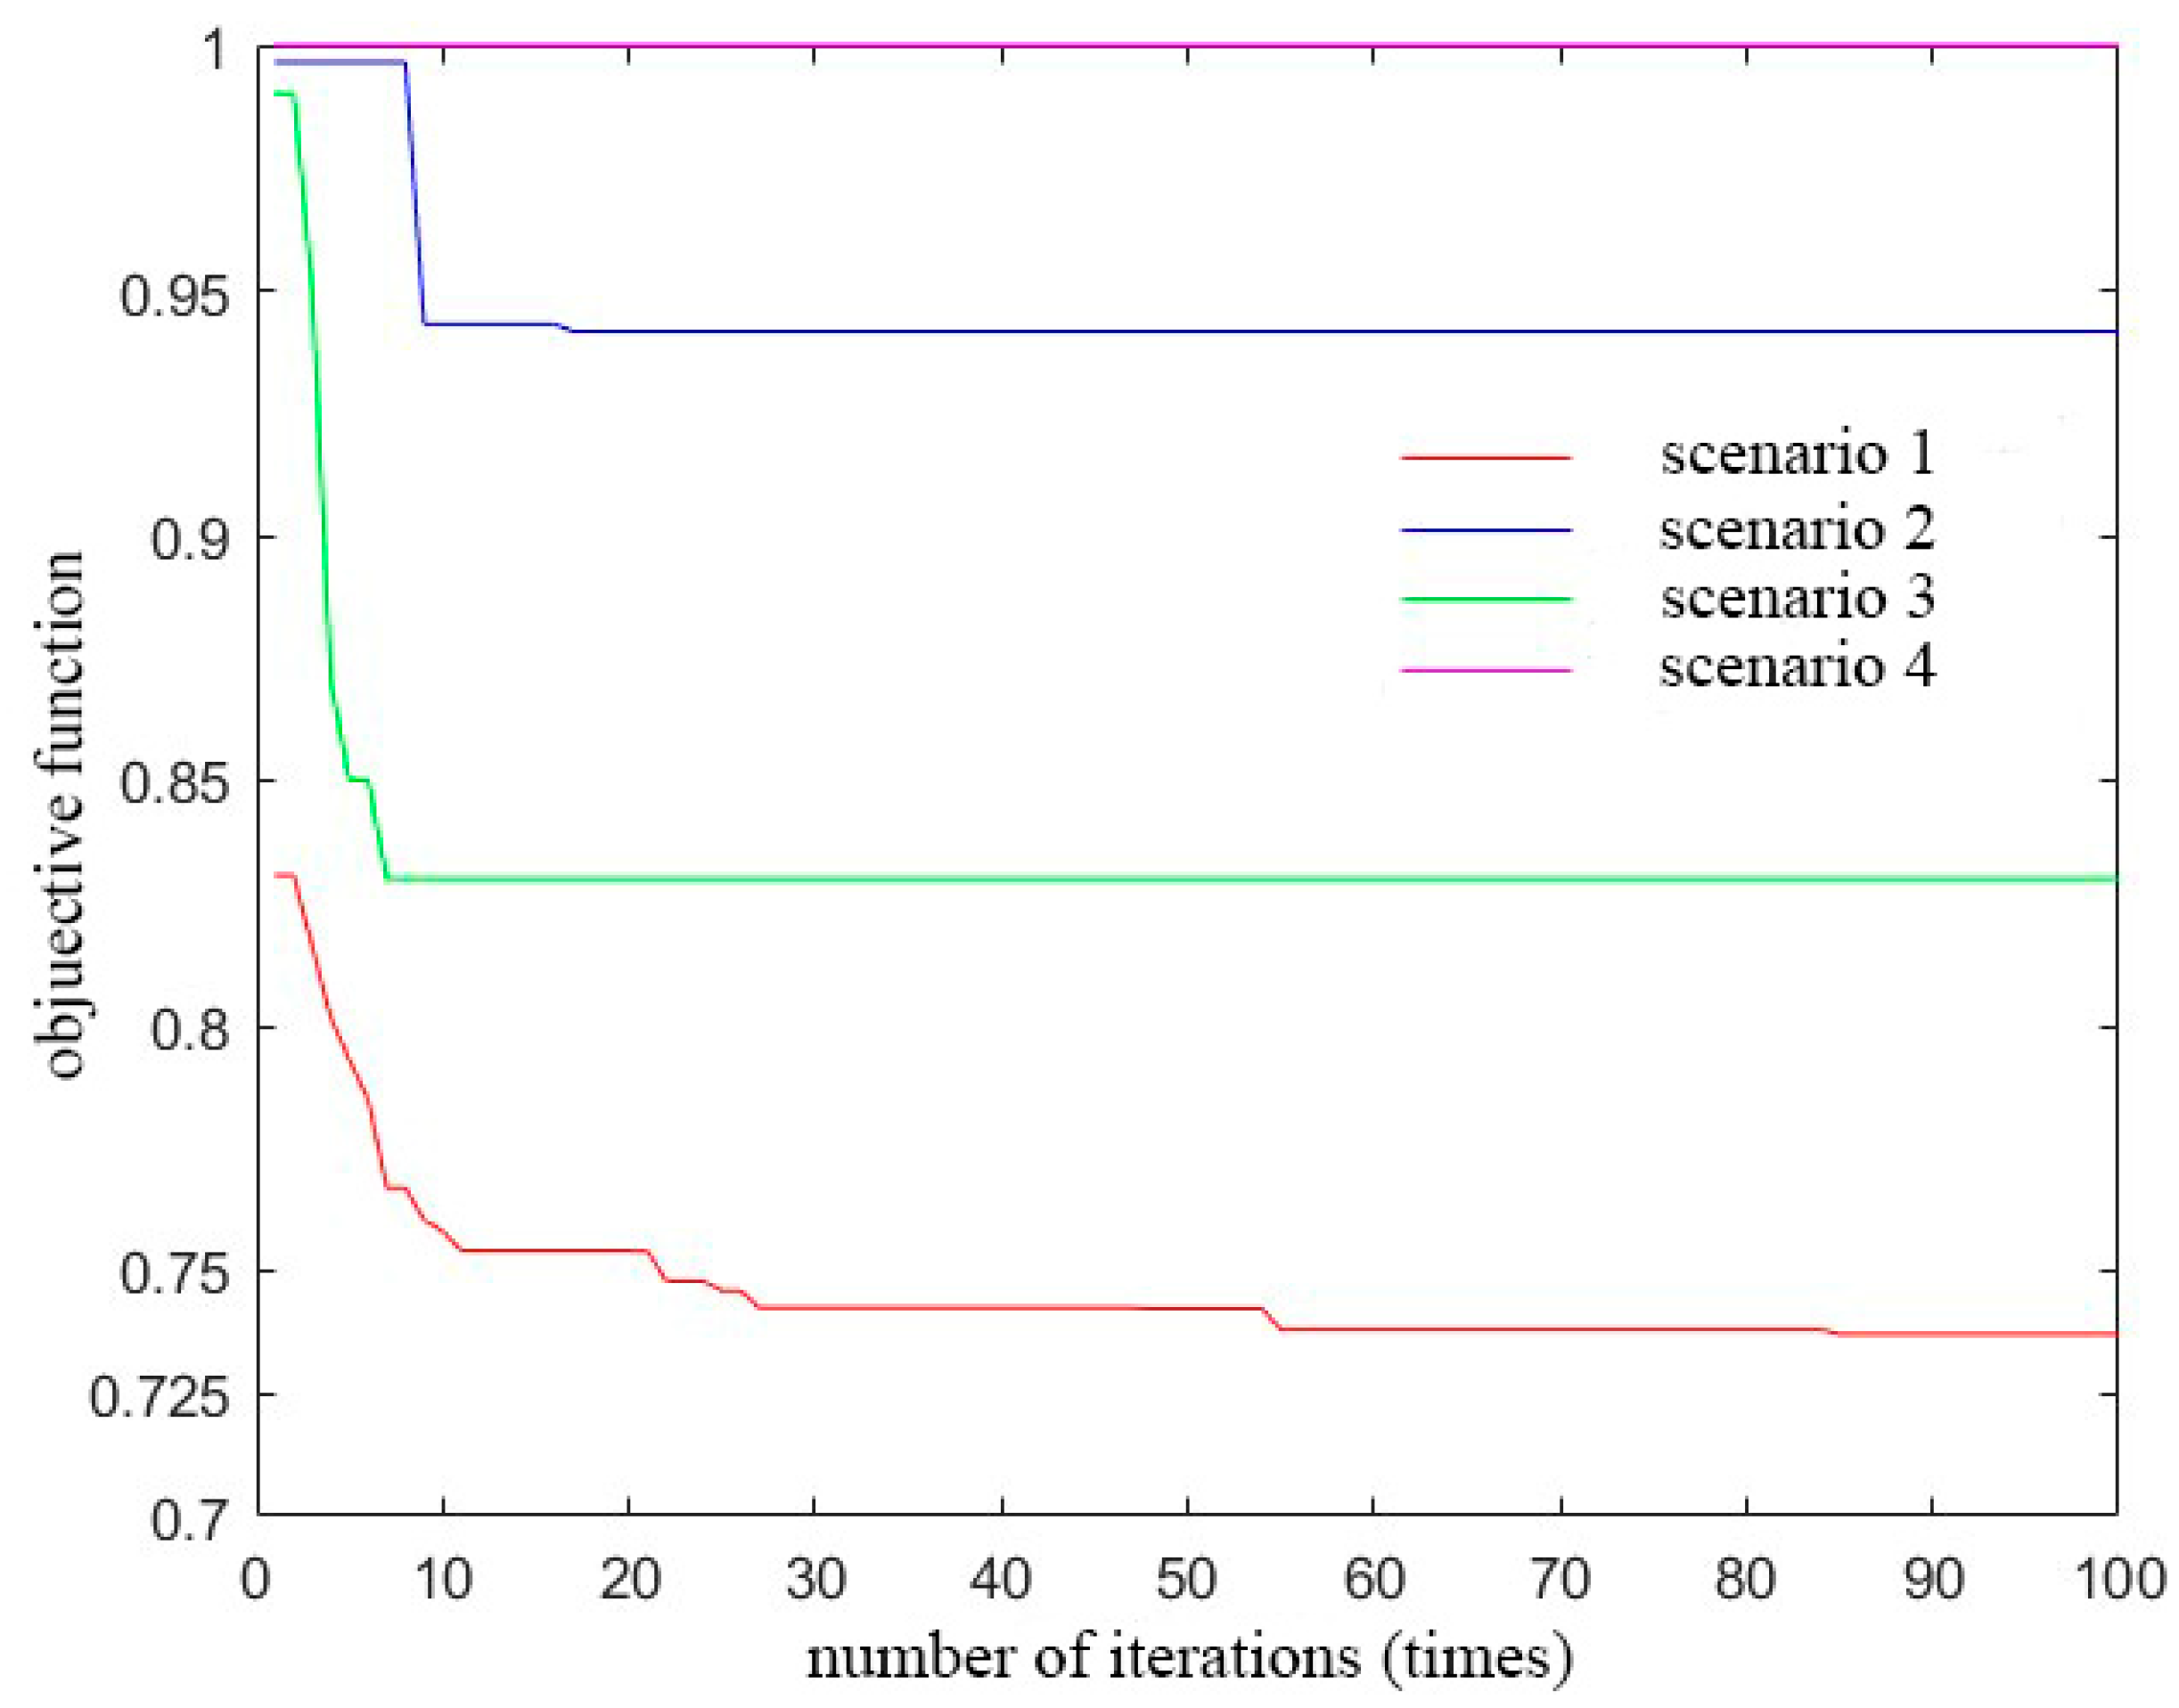
The convergence behavior of the objective function is obtained using the PSO algorithm. To further evaluate the optimization performance of the proposed method, four scenarios are designed: Scenario 1 considers both demand and skills; Scenario 2 considers only electricity-customer demand; Scenario 3 considers only agent skills; and Scenario 4 serves as the baseline. The baseline scenario neglects both demand and skills, and its objective function is taken as the reference, with the converged value fixed at 1. The results for the four scenarios are converted into per-unit values, as shown in
Figure 6.
Although the maximum number of iterations is set to 300 to ensure convergence, the convergence curve indicates that the objective function has already converged within 60 iterations. The converged objective values for each model, together with the optimization performance of the proposed method under the current settings, are reported in
Table 3:
The simulation results show that, relative to the baseline with a converged reference value of 1, the proposed scheduling optimization model that jointly considers customer demand and demand–skill matching achieves a 26.28% improvement. By comparison, the model considering only customer demand achieves a 5.84% improvement, whereas the model considering only agent skills achieves a 17% improvement. These results indicate that both demand analysis and demand–skill matching have practical value and make meaningful contributions to optimization.
5.4. Economic Benefits
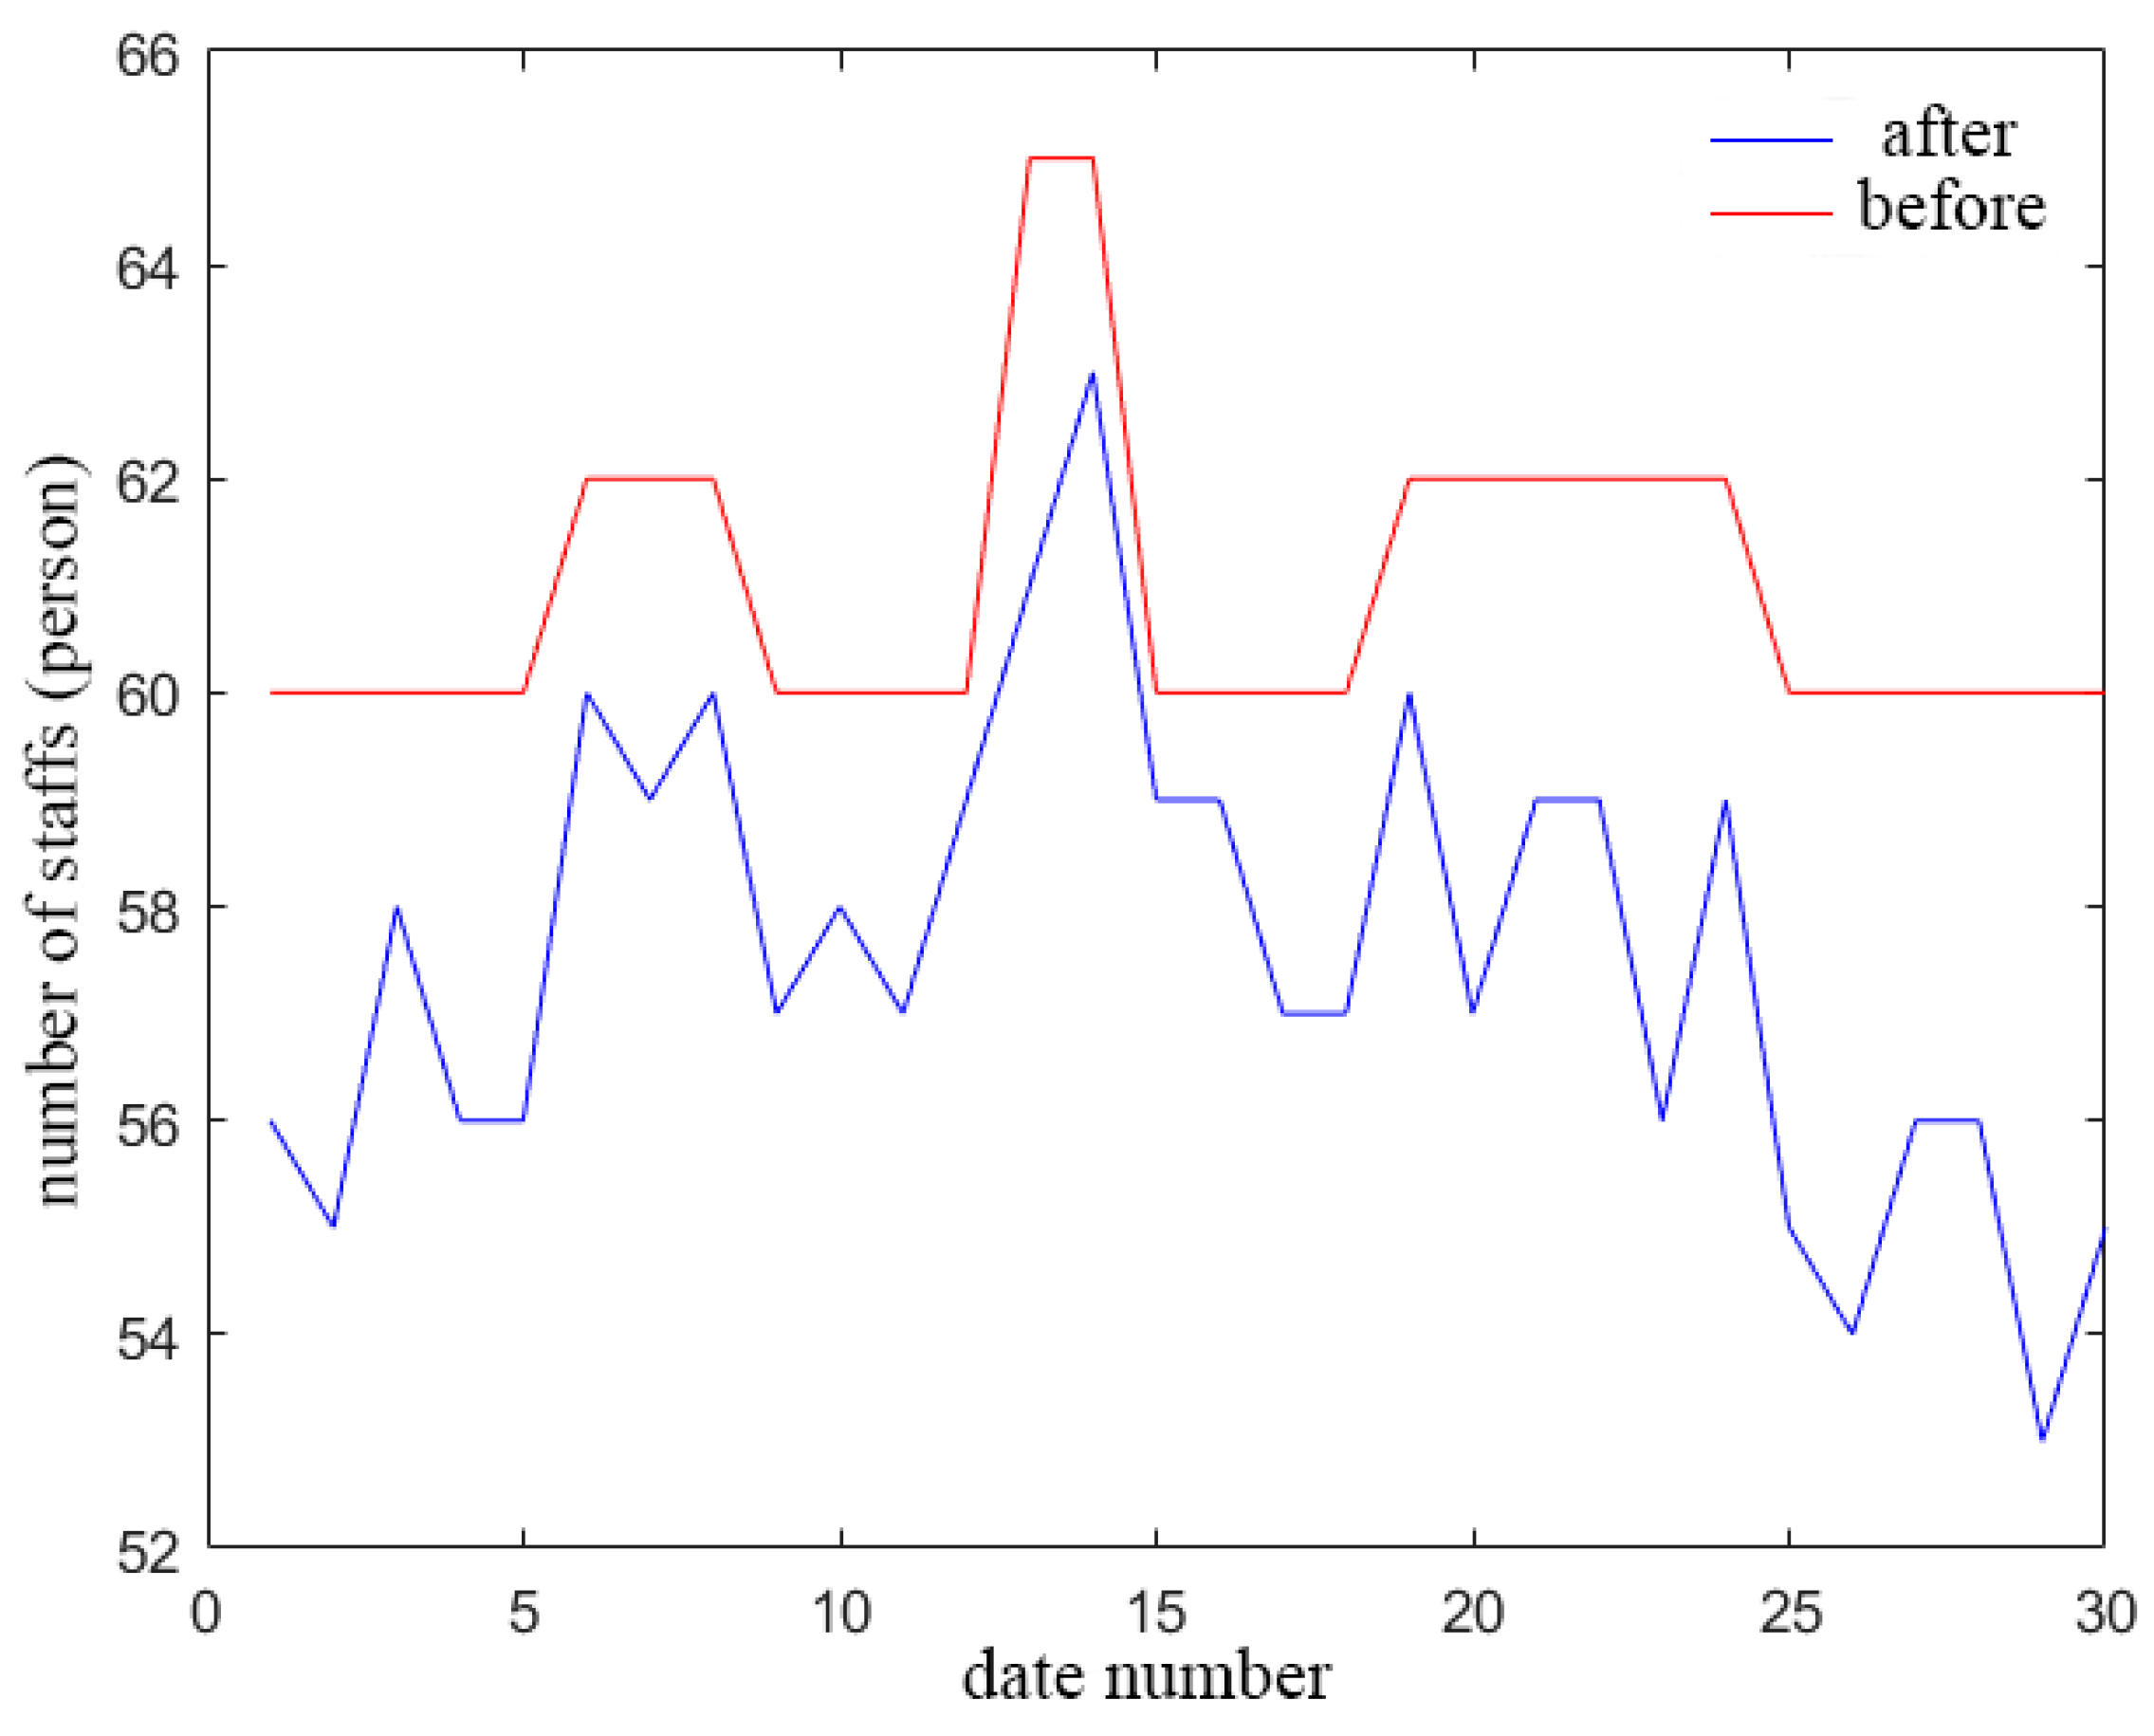
In terms of economic benefits, when the peak staffing level from the workforce sizing simulation results is used as the pre-planning staffing level, the comparison before and after workforce sizing is shown in
Figure 7:
The calculation shows that, over 30 days of peak periods, the proposed workforce sizing method saves a total of 112 agent-shifts relative to the pre-planning baseline, i.e., an average saving of 3.73 agent-shifts per day in the peak period. Given that the peak-period call volume accounts for approximately 30% of the total daily call volume, the average daily saving is estimated to be 12.43 agent-shifts. Assuming 8 working hours per agent-shift and a minimum hourly wage of CNY 30, the daily labor cost saving is CNY 2983.2, and the annual labor cost saving is approximately CNY 1.09 million. This corresponds to an estimated 6.13% reduction in labor costs, demonstrating that the proposed method delivers significant economic benefits for ECSS.
6. Conclusions
This paper develops an optimization formulation for the ECSS problem by incorporating customer demand and agents’ skill levels and proposes a PSO algorithm tailored to the formulated model. Simulation experiments indicate that
- (1)
The proposed ECSS dispatch framework, mathematical model, and PSO algorithm—covering both the user side and the service side—effectively satisfy diversified customer demands, alleviate the agent scheduling pressure caused by rapid growth in service tasks, and balance multiple stakeholder requirements. The proposed approach shows good applicability under the construction framework of a new-type power system dominated by renewable energy.
- (2)
By accounting for scenario variations in the application of agents’ skills, the proposed method performs skill scoring that maps agents’ skill levels to corresponding service demand categories and establishes a time-period-based workforce sizing method. While improving the operational efficiency of the customer service center, it reduces labor costs, thereby supporting the operational economic efficiency of power grid enterprises.
The existing research has certain limitations in terms of model parameter setting and the approach to demand–skill matching. In the future, the project will continue to conduct in-depth research on the quantitative impact of MIC threshold selection, multi-skill scenarios, and multi-objective function weights on the trade-off between service quality and operational efficiency.
Author Contributions
Conceptualization, H.Q. and Z.X.; methodology, Y.Y.; software, Z.X.; validation, H.Q., S.W. and Y.X.; formal analysis, Y.Y.; investigation, H.Q.; resources, H.Q.; data curation, S.W.; writing—original draft preparation, Z.X. and H.Q.; writing—review and editing, S.W. and H.Q.; visualization, Y.X.; supervision, Z.X.; project administration, H.Q.; funding acquisition, H.Q. All authors have read and agreed to the published version of the manuscript.
Funding
This research was funded by research on knowledge-driven service scheduling optimization model under modern power supply service system, grant number 036800KK52220003.
Data Availability Statement
The raw data supporting the conclusions of this article will be made available by the authors on request.
Conflicts of Interest
Author Hao Qin was employed by the company Customer Service Center of Guangdong Power Grid Co., Ltd. The remaining authors declare that the research was conducted in the absence of any commercial or financial relationships that could be construed as a potential conflict of interest.
Abbreviations
The following abbreviations are used in this manuscript:
| ECSS | Electricity Customer Service Scheduling |
| MIC | Maximal Information Coefficient |
| PSO | Particle Swarm Optimization |
| EV | Electric Vehicle |
| CED | Customer Energy Demand |
| AHT | Average Handling Time |
References
- Saldaña-González, A.E.; Aragüés-Peñalba, M.; Gadelha, V.; Sumper, A. Review of Active Distribution Network Planning: Elements in Optimization Models and Generative AI Applications. Energies 2026, 19, 116. [Google Scholar] [CrossRef]
- Azzam, S.M.; Elshabrawy, T.; Ashour, M. A Bi-Level Framework for Supply and Demand Side Energy Management in an Islanded Microgrid. IEEE Trans. Ind. Inform. 2023, 19, 220–231. [Google Scholar] [CrossRef]
- Fesakis, N.; Megagiannis, C.; Lazaridou, G.E.; Sarafoglou, E.; Tzouvaras, A.; Karlis, A. Energy Management in Multi-Source Electric Vehicles Through Multi-Objective Whale Particle Swarm Optimization Considering Aging Effects. Energies 2026, 19, 154. [Google Scholar] [CrossRef]
- Zhang, Y.; Yi, Y.; Li, L.; Zhong, K.; Li, Q.; Liu, S.; Xiao, H. Prospect of New Low-Voltage Distribution System Technology Driven by Carbon Emission Peakand Carbon Neutrality Targets. Autom. Electr. Power Syst. 2022, 46, 1–12. [Google Scholar]
- Qin, H.; Su, L.; Wu, G.; Jiang, C.; Xu, Z.; Kang, F.; Tan, H.; Zhang, Y. Short-Term Telephone-Traffic Prediction of Power Grid Customer Service Based on Adaboost-CNN. J. Shanghai Jiao Tong Univ. 2025, 59, 266–273. [Google Scholar]
- Shi, M.; Wang, H.; Xie, P.; Lyu, C.; Jian, L.; Jia, Y. Distributed Energy Scheduling for Integrated Energy System Clusters with Peer-to-Peer Energy Transaction. IEEE Trans. Smart Grid 2023, 14, 142–156. [Google Scholar] [CrossRef]
- Yang, W.; Tan, W.; Zeng, Z.; Li, R.; Qin, J.; Xie, Y.; Zhang, Y.; Cheng, R.; Xiao, D. A Two-Stage Feature Extraction Approach for Green Energy Consumers in Retail Electricity Markets Using Clustering and TF–IDF Algorithms. Energy Eng. 2025, 122, 1697–1713. [Google Scholar] [CrossRef]
- Some Urban Villages in Shenzhen Experience Power Outages at Night. 2 June 2023. Available online: https://baijiahao.baidu.com/s?id=1767553601432346250&wfr=spider&for=pc (accessed on 29 December 2025). (In Chinese)
- Niu, B.; Xue, B.; Zhou, T.; Kustudic, M. Aviation maintenance technician scheduling with personnel satisfaction based on interactive multi-swarm bacterial foraging optimization. Int. J. Intell. Syst. 2022, 37, 723–747. [Google Scholar] [CrossRef]
- Xu, S.; Hall, N.G. Fatigue, personnel scheduling and operations: Review and research opportunities. Eur. J. Oper. Res. 2021, 295, 807–822. [Google Scholar] [CrossRef]
- Bocewicz, G.; Szwarc, E.; Wikarek, J.; Nielsen, P.; Banaszak, Z. A competency-driven staff assignment approach to improving employee scheduling robustness. Eksploat. Niezawodn. 2021, 23, 117–131. [Google Scholar] [CrossRef]
- Kang, F.; Tan, H.; Su, L.; Jian, D.; Wang, S.; Qin, H.; Zhang, Y. Energy Services Demand Forecasting Combined with Feature Preferences and Bidirectional Long and Short Term Memory Networks. J. Shanghai Jiao Tong Univ. 2025, 59, 1007–1018. [Google Scholar]
- Miraftabzadeh, S.M.; Colombo, C.G.; Longo, M.; Foiadelli, F. K-Means and Alternative Clustering Methods in Modern Power Systems. IEEE Access 2023, 11, 119596–119633. [Google Scholar] [CrossRef]
- Zheng, S.; Yuan, R.; Zhou, L.; Qi, C.; Wang, K. Design of power grid AI customer service support system based on big data mining. Electron. Des. Eng. 2021, 29, 15–18+23. [Google Scholar]
- Zhang, C.; Qin, H.; Zhang, Y.; Jiang, C.; Zhang, D.; Deng, W. Augmenting time series data: An interpretable approach with metric learning and variational autoencoders. Int. J. Electr. Power Energy 2024, 161, 110190. [Google Scholar] [CrossRef]
- Shahnazari-Shahrezaei, P.; Zabihi, S.; Kia, R. Solving a multi-objective mathematical model for a multi-skilled project scheduling problem by particle swarm optimization and differential evolution algorithms. Ind. Eng. Manag. Syst. 2017, 16, 288–306. [Google Scholar] [CrossRef]
- Gong, Y.J.; Li, J.; Zhou, Y.; Li, Y.; Chung, H.; Shi, Y.H.; Zhang, J. Genetic learning particle swarm optimization. IEEE Trans. Cybern. 2015, 46, 2277–2290. [Google Scholar] [CrossRef]
- Hashmi, S.A.; Ali, C.F.; Zafar, S. Internet of things and cloud computing-based energy management system for demand side management in smart grid. Int. J. Energy Res. 2021, 45, 1007–1022. [Google Scholar] [CrossRef]
- Lin, G.; Lin, A.; Gu, D. Using support vector regression and K-nearest neighbors for short-term traffic flow prediction based on maximal information coefficient. Inf. Sci. 2022, 608, 517–531. [Google Scholar] [CrossRef]
- Mathew, M.; Chakrabortty, R.K.; Ryan, M.J. Selection of an Optimal Maintenance Strategy Under Uncertain Conditions: An Interval Type-2 Fuzzy AHP-TOPSIS Method. IEEE Trans. Eng. Manag. 2022, 69, 1121–1134. [Google Scholar] [CrossRef]
- Zhu, L. Research and application of AHP-fuzzy comprehensive evaluation model. Evol. Intell. 2022, 15, 2403–2409. [Google Scholar] [CrossRef]
- Atoccsa, B.A.; Puma, D.W.; Mendoza, D.; Urday, E.; Ronceros, C.; Palma, M.T. Optimization of Ampacity in High-Voltage Underground Cables with Thermal Backfill Using Dynamic PSO and Adaptive Strategies. Energies 2024, 17, 1023. [Google Scholar] [CrossRef]
| Disclaimer/Publisher’s Note: The statements, opinions and data contained in all publications are solely those of the individual author(s) and contributor(s) and not of MDPI and/or the editor(s). MDPI and/or the editor(s) disclaim responsibility for any injury to people or property resulting from any ideas, methods, instructions or products referred to in the content. |