1. Introduction
Even in regions with a low-carbon electricity grid like Newfoundland and Labrador, the total emissions from the numerous transformers in use can still be significant. When these losses are summed up across an entire grid, they can significantly obstruct efforts to achieve international climate goals like those outlined in the Paris Agreement [
1,
2]. As electricity demand continues to rise, driven by the electrification of heating, transport, and industrial processes. The efficiency and environmental performance of grid infrastructure have become increasingly important. Though often perceived as passive devices, transformers are essential for enabling long-distance transmission and local distribution by stepping voltage levels up and down through electromagnetic induction, as defined in IEEE and IEC standards [
3,
4]. Their performance characteristics, especially energy losses during operation, directly influence the carbon intensity of electricity systems over decades. Their continuous operation means that even modest efficiency improvements can yield significant long-term environmental benefits.
Transformers are essential in modern grids, and their global deployment has expanded steadily due to rising demand, renewable energy integration, and system modernization [
5]. As shown in recent market analyses, the global transformer market is expected to exceed USD 49 billion by 2030, with medium-voltage and distribution transformers constituting a significant share of installations worldwide [
6]. Although the contribution of a single transformer to total system emissions may appear small, a vast number of transformers and their continuous operation make their cumulative impact substantial. Studies estimate that transformers represent roughly 4% of annual CO
2-equivalent (CO
2e) emissions in global electricity infrastructure, amounting to hundreds of millions of tons per year [
7,
8]. The environmental footprint arises from all stages of the life cycle, including material extraction, manufacturing, logistics, and especially operational losses, making transformers an important target for climate-aligned procurement and design [
9].
Different studies find a consistent result that the operational phase dominates the life-cycle carbon footprint of transformers. Several studies report that 94–98% of total emissions come from no-load and load losses accumulated over decades of continuous service [
10,
11]. Guo et al. found that more than 96% of life-cycle emissions originate from transformer energy losses [
12]. It has been shown that even with improvements in efficiency standards, the core must remain energized 24/7, and copper losses increase with loading, causing the operational carbon footprint to exceed manufacturing-related emissions within just a few years. Moreover, another study shows that an even higher share of approximately 98% of emissions is associated with transformer operation [
13]. Different analyses, including cradle-to-gate assessments for medium-voltage units, show that while material production, especially electrical steel, structural steel, copper, and insulating fluid, contributes significantly to the manufacturing footprint, these impacts remain small relative to the cumulative emissions from decades of power losses [
14].
Different studies reinforce that continuous operation over a lifespan of more than 40 years is the main driver of emissions. Because transformers run every hour of every day, electricity consumed during use far outweighs emissions from manufacturing, transporting materials, or delivering the unit to the site. For example, Jorge et al. [
15] estimated that a 500 MVA transformer operating under the European grid mix could emit up to 90,000 tons of CO
2e over its lifetime. Cradle-to-gate studies also show substantial manufacturing impact, reporting carbon footprints of 4.6–6.7 t CO
2e for 400–630 kVA oil-immersed transformers in Croatia, driven largely by magnetic steel, aluminum windings, and transformer oil [
8]. At a larger industrial scale, Güldurek and Esenboğa [
16] found that Beta Energy in Türkiye produced a total footprint of 1.8 million tons CO
2e in 2023, averaging about 300 tons per transformer sold. Another study [
17] observed similar patterns in China, with operational losses contributing more than 11,000 kg CO
2 during use, which is far exceeding manufacturing and transport emissions. Together, these studies show that while production impacts vary by region and materials, the operational phase consistently dominates transformer life-cycle emissions.
Although many studies emphasize similar findings, most are conducted in countries or regions with carbon-intensive electricity mixes, such as Poland, China, India, and parts of Southeast Asia. In these systems, coal-fired generation amplifies the carbon impact of operational losses [
8,
10,
14]. However, the relationship between manufacturing emissions and use-phase emissions changes significantly in low-carbon electricity grids. Newfoundland and Labrador (NL) offers a valuable contrast because of its predominantly hydroelectric generation and very low grid emission factor, one of the lowest in Canada [
1,
18,
19]. This raises key questions: How does transformer life-cycle performance change when the electricity supply is nearly carbon-free? Do manufacturing emissions become comparatively more important? And how should utilities in clean grids prioritize transformer specifications to minimize life-cycle emissions?
Our research addresses these questions by conducting a detailed Life Cycle Assessment (LCA) of a 75 kVA oil-immersed distribution transformer manufactured in Newfoundland in 2025. Unlike many LCA studies that rely heavily on generic secondary data, this work uses primary, high-resolution information from the manufacturer, including bill-of-materials mass for all components, measured no-load and load losses, transportation distances, and manufacturing electricity consumption. Following ISO 14040 and ISO 14044 standards [
20,
21], the study adopts a cradle-to-use system boundary, encompassing raw material extraction, component transportation, factory energy use, transformer delivery, and operational energy losses over a 40-year service life [
22,
23,
24]. While end-of-life processes are excluded from the main boundary, this paper also discusses their potential influence, given emerging circular-economy practices such as remanufacturing and refurbishment.
A key contribution in this study is the integration of a time-varying grid carbon-intensity projection for Newfoundland and Labrador. Previous transformer LCA studies typically assume a static electricity emission factor, an assumption that overestimates or underestimates future operational impacts depending on the trajectory of grid decarbonization. In contrast, our analysis develops a linear regression model based on historical grid data and provincial decarbonization commitments, indicating that NL is likely to achieve net-zero grid emissions by around 2037 [
25]. This dynamic modeling provides a more realistic representation of lifetime emissions, capturing how the carbon intensity of operational losses declines over time. It also allows comparison with fossil-intensive grids such as Nova Scotia’s, where emission factors remain above 700 g CO
2/kWh, nearly 40 times higher than Newfoundland’s present values.
This study further extends transformer LCA by incorporating short-term overloading scenarios. Although distribution transformers typically operate between 20% and 70% of rated load, brief overloads are common during peak demand events. These load excursions temporarily increase copper losses, affecting lifetime emissions depending on frequency and duration. By quantifying this effect under different grid mixes, the analysis provides utilities with insight into whether operating practices or loading profiles meaningfully influence transformer sustainability metrics.
Table 1 below offers a comparative summary of notable life-cycle assessment research on power and distribution transformers, emphasizing variations in system boundaries, grid contexts, and key emission factors. The analysis reveals that, in carbon-intensive grids, operational losses consistently prevail, whereas manufacturing emissions gain significance in low-carbon environments. This synthesis situates the current study within the existing body of literature and highlights its contribution in the context of hydro-dominated grid conditions.
By addressing key gaps in current knowledge, the study offers several novel methods and critical insights that will significantly improve the practice of Life Cycle Assessment (LCA) for distribution infrastructure
This study presents the first comprehensive, cradle-to-use LCA of a distribution transformer developed using primary, measured experimental data (no-load and load losses) and precise bill-of-materials mass data for all components (core steel, copper, oil, etc.) from the Newfoundland-based manufacturer. This rigorous, high-fidelity approach significantly reduces the uncertainty associated with typical LCA studies that rely on generalized secondary data. The research integrates this detailed material and operational profile with a linear regression-based, time-dependent grid carbon intensity forecast. This forecast projects Newfoundland and Labrador’s net-zero milestone in 2037, moving beyond static grid intensity assumptions to accurately model the entire 40-year service life in a rapidly evolving, low-carbon electricity mix.
This research establishes an authoritative, comparative benchmark by analyzing the transformer’s full life-cycle performance across Canada’s most diverse provincial grids (from 18 g CO2e/kWh in Newfoundland to around 700 g CO2e/kWh in Nova Scotia). This analysis provides quantifiable, policy-relevant evidence on the dominant role of the generation mix in shaping life-cycle emissions, guiding utilities on regional investment priorities.
Another key novelty lies in integrating overloading impact modelling within the LCA boundary, quantifying how short-term load excursions influence long-term emissions under different grid conditions. The study extends beyond traditional LCA boundaries by evaluating sustainability trade-offs at the asset’s end-of-life stage. A potential reduction of 30% to 50% in cradle-to-gate emissions is quantified through the remanufacturing and refurbishment of transformers, providing a framework for integrating circular economy principles into future grid procurement and design standards. It also analyzed regional grid conditions, incorporating the St. John’s case study and trade-off evaluation.
The remainder of the research is organized as follows.
Section 2 describes the life-cycle assessment methodology, including the functional unit, system boundary, data sources, and modelling assumptions.
Section 3 presents the case-study transformer, detailing manufacturing data, material composition, loss measurements, and transportation parameters.
Section 4 introduces the grid carbon-intensity datasets and the time-varying decarbonization scenarios applied for Newfoundland and Labrador and comparative Canadian provinces.
Section 5 reports the life-cycle assessment results under different loading conditions, overloading scenarios, and regional grid contexts, including the St. John’s case study and trade-off analysis.
Section 6 discusses the implications of the findings for transformer asset management, grid decarbonization, and circular-economy strategies. Finally,
Section 7 summarizes the main conclusions and outlines directions for future research.
Overall, this research advances the methodological frontier by merging life-cycle carbon accounting, grid decarbonization modelling, and circular economy principles into a unified decision-making framework. This enables policymakers, utilities, and manufacturers to evaluate transformer sustainability not as a static property, but as a dynamic function of evolving grid emissions, operational conditions, and refurbishment pathways.
3. Methodology and Material Analysis
3.1. Life Cycle Analysis
Life Cycle Analysis (LCA) is a structured method used to measure the environmental impacts associated with each phase of a product’s life cycle, from raw material extraction and production through transportation, use, and disposal. In the case of power distribution equipment, such as transformers, LCA provides in-depth insights into energy usage and greenhouse gas (GHG) emissions, enabling utilities to make environmentally conscious choices.
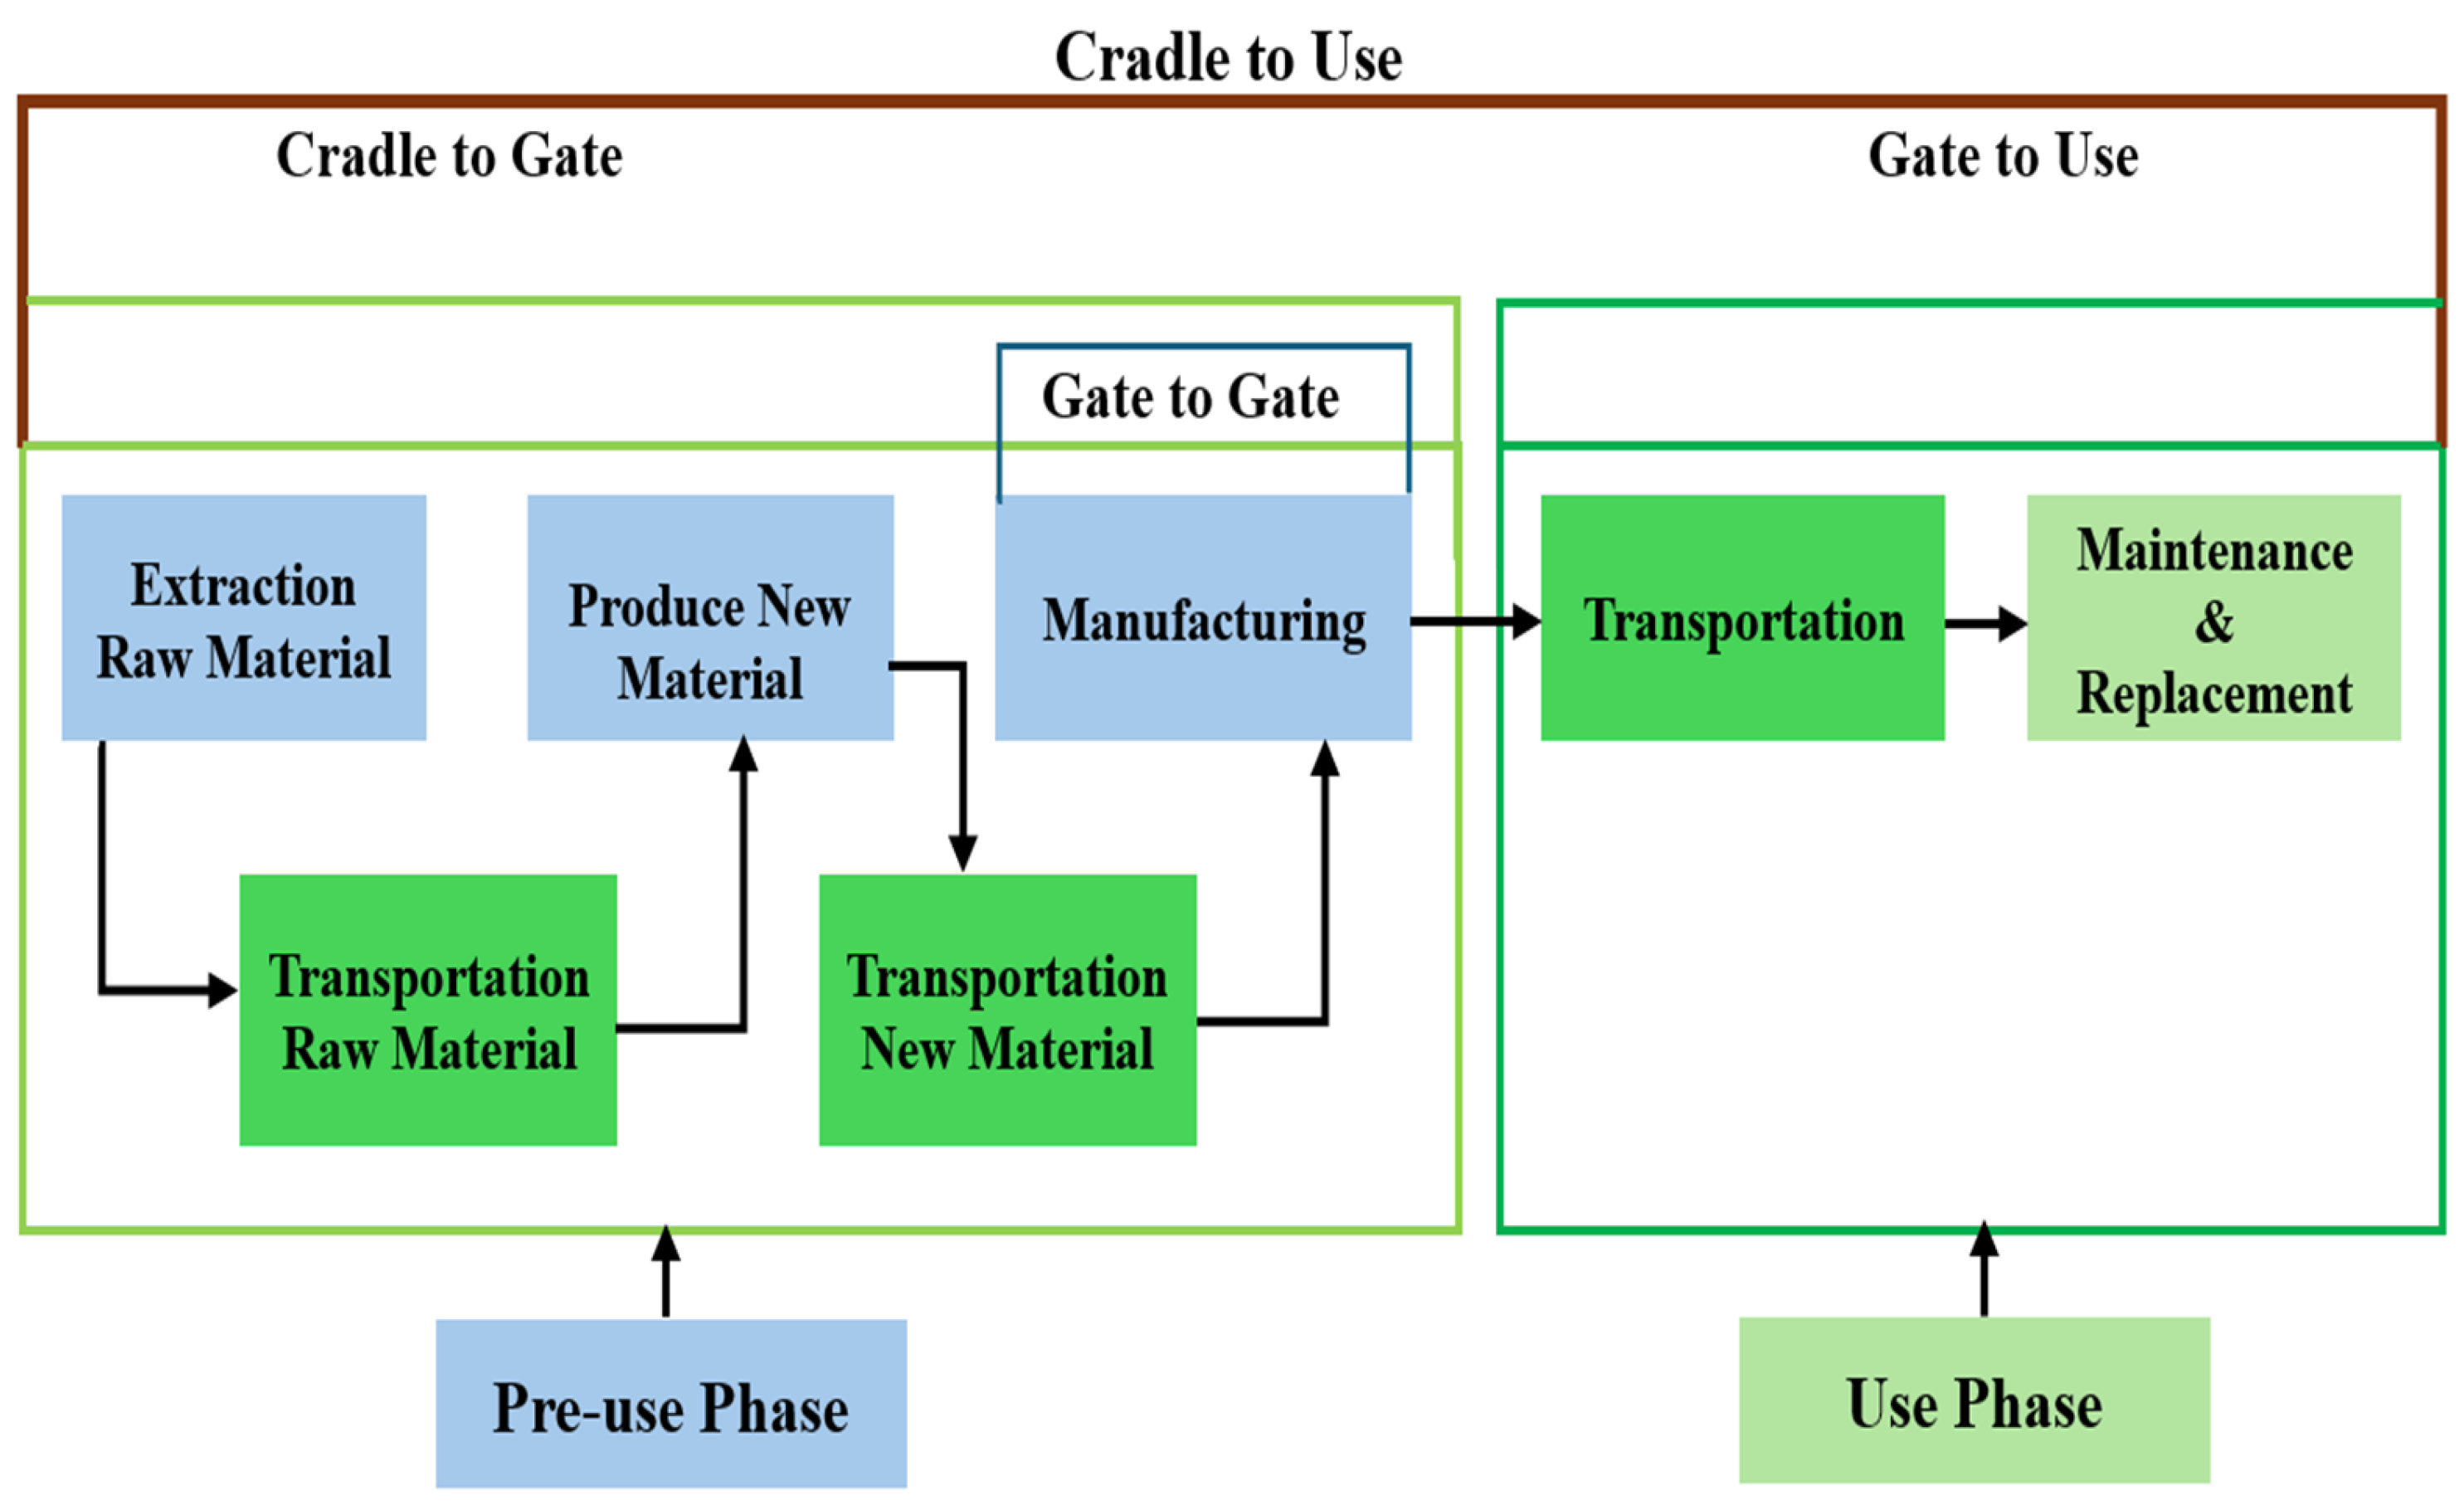
Figure 2 above shows a block diagram that depicts the entire life cycle of a distribution transformer, starting with raw material extraction and continuing through manufacturing, transportation, operation, and end-of-life management. The diagram emphasizes the role of each phase in shaping the total environmental impact accounted for in the life-cycle assessment.
The life cycle analysis was executed in strict adherence to international standards, specifically ISO 14040 (Principles and Framework) [
20] and ISO 14044 (Requirements and Guidelines) [
21]. ISO 14040 defines the general principles and framework for life-cycle assessment, including goal and scope definition, life-cycle inventory analysis, impact assessment, and interpretation. ISO 14044 specifies detailed methodological requirements related to data quality, system boundary selection, allocation procedures, and result interpretation, ensuring transparency and reproducibility.
LCA studies permit the application of various system boundary approaches, such as “cradle to cradle,” “cradle to gate,” and “cradle to grave”. For this investigation, the “cradle to use” system boundary was adopted. This approach comprehensively tracks the transformer’s environmental impacts across its entire lifespan, encompassing raw material extraction, transportation to the manufacturing facility, the manufacturing process itself, transportation to the installation site, and the entire operational phase. Notably, the current scope deliberately excludes the end-of-life (EOL) stage.
The end-of-life (EOL) stage was excluded to maintain a cradle-to-use system boundary and to minimize uncertainty arising from highly variable transformer retirement practices. In Newfoundland and Labrador, EOL pathways differ widely depending on asset condition and utility policy, encompassing refurbishment, oil reclamation, component reuse, and material recycling. Incorporating these pathways without consistent, region-specific data could obscure the primary objective of this study, which is to quantify the impact of grid decarbonization on transformer life-cycle emissions. The potential influence of EOL strategies is therefore discussed qualitatively, and future work will extend the analysis to a full cradle-to-grave framework once reliable EOL datasets become available. Future research is planned to extend this analysis by evaluating various EOL scenarios to accurately assess their distinct environmental impacts and to identify optimal recycling or disposal strategies.
Life Cycle Assessment Methodology
The LCIA of the oil-immersed transformer was conducted using the carbon footprint methodology. The total carbon footprint was calculated using Equation (1):
where CF, total carbon footprint of the transformer [t CO
2e], activity, data (e.g., electricity consumption in kWh), and EFCO
2e represent the emission factor.
3.2. Characteristics and Material Analysis of the Single-Phase Oil-Immersed Transformer
The 75 kVA distribution transformer, manufactured in 2025, has a total mass of 388 kg and employs an ON-AN cooling system supported by 88 L of mineral oil.
From
Table 3, it can be observed that the transformer is rated for 7200 V on the high-voltage side and 240 V on the low-voltage side, with a design impedance of 2.10% to regulate short-circuit currents.
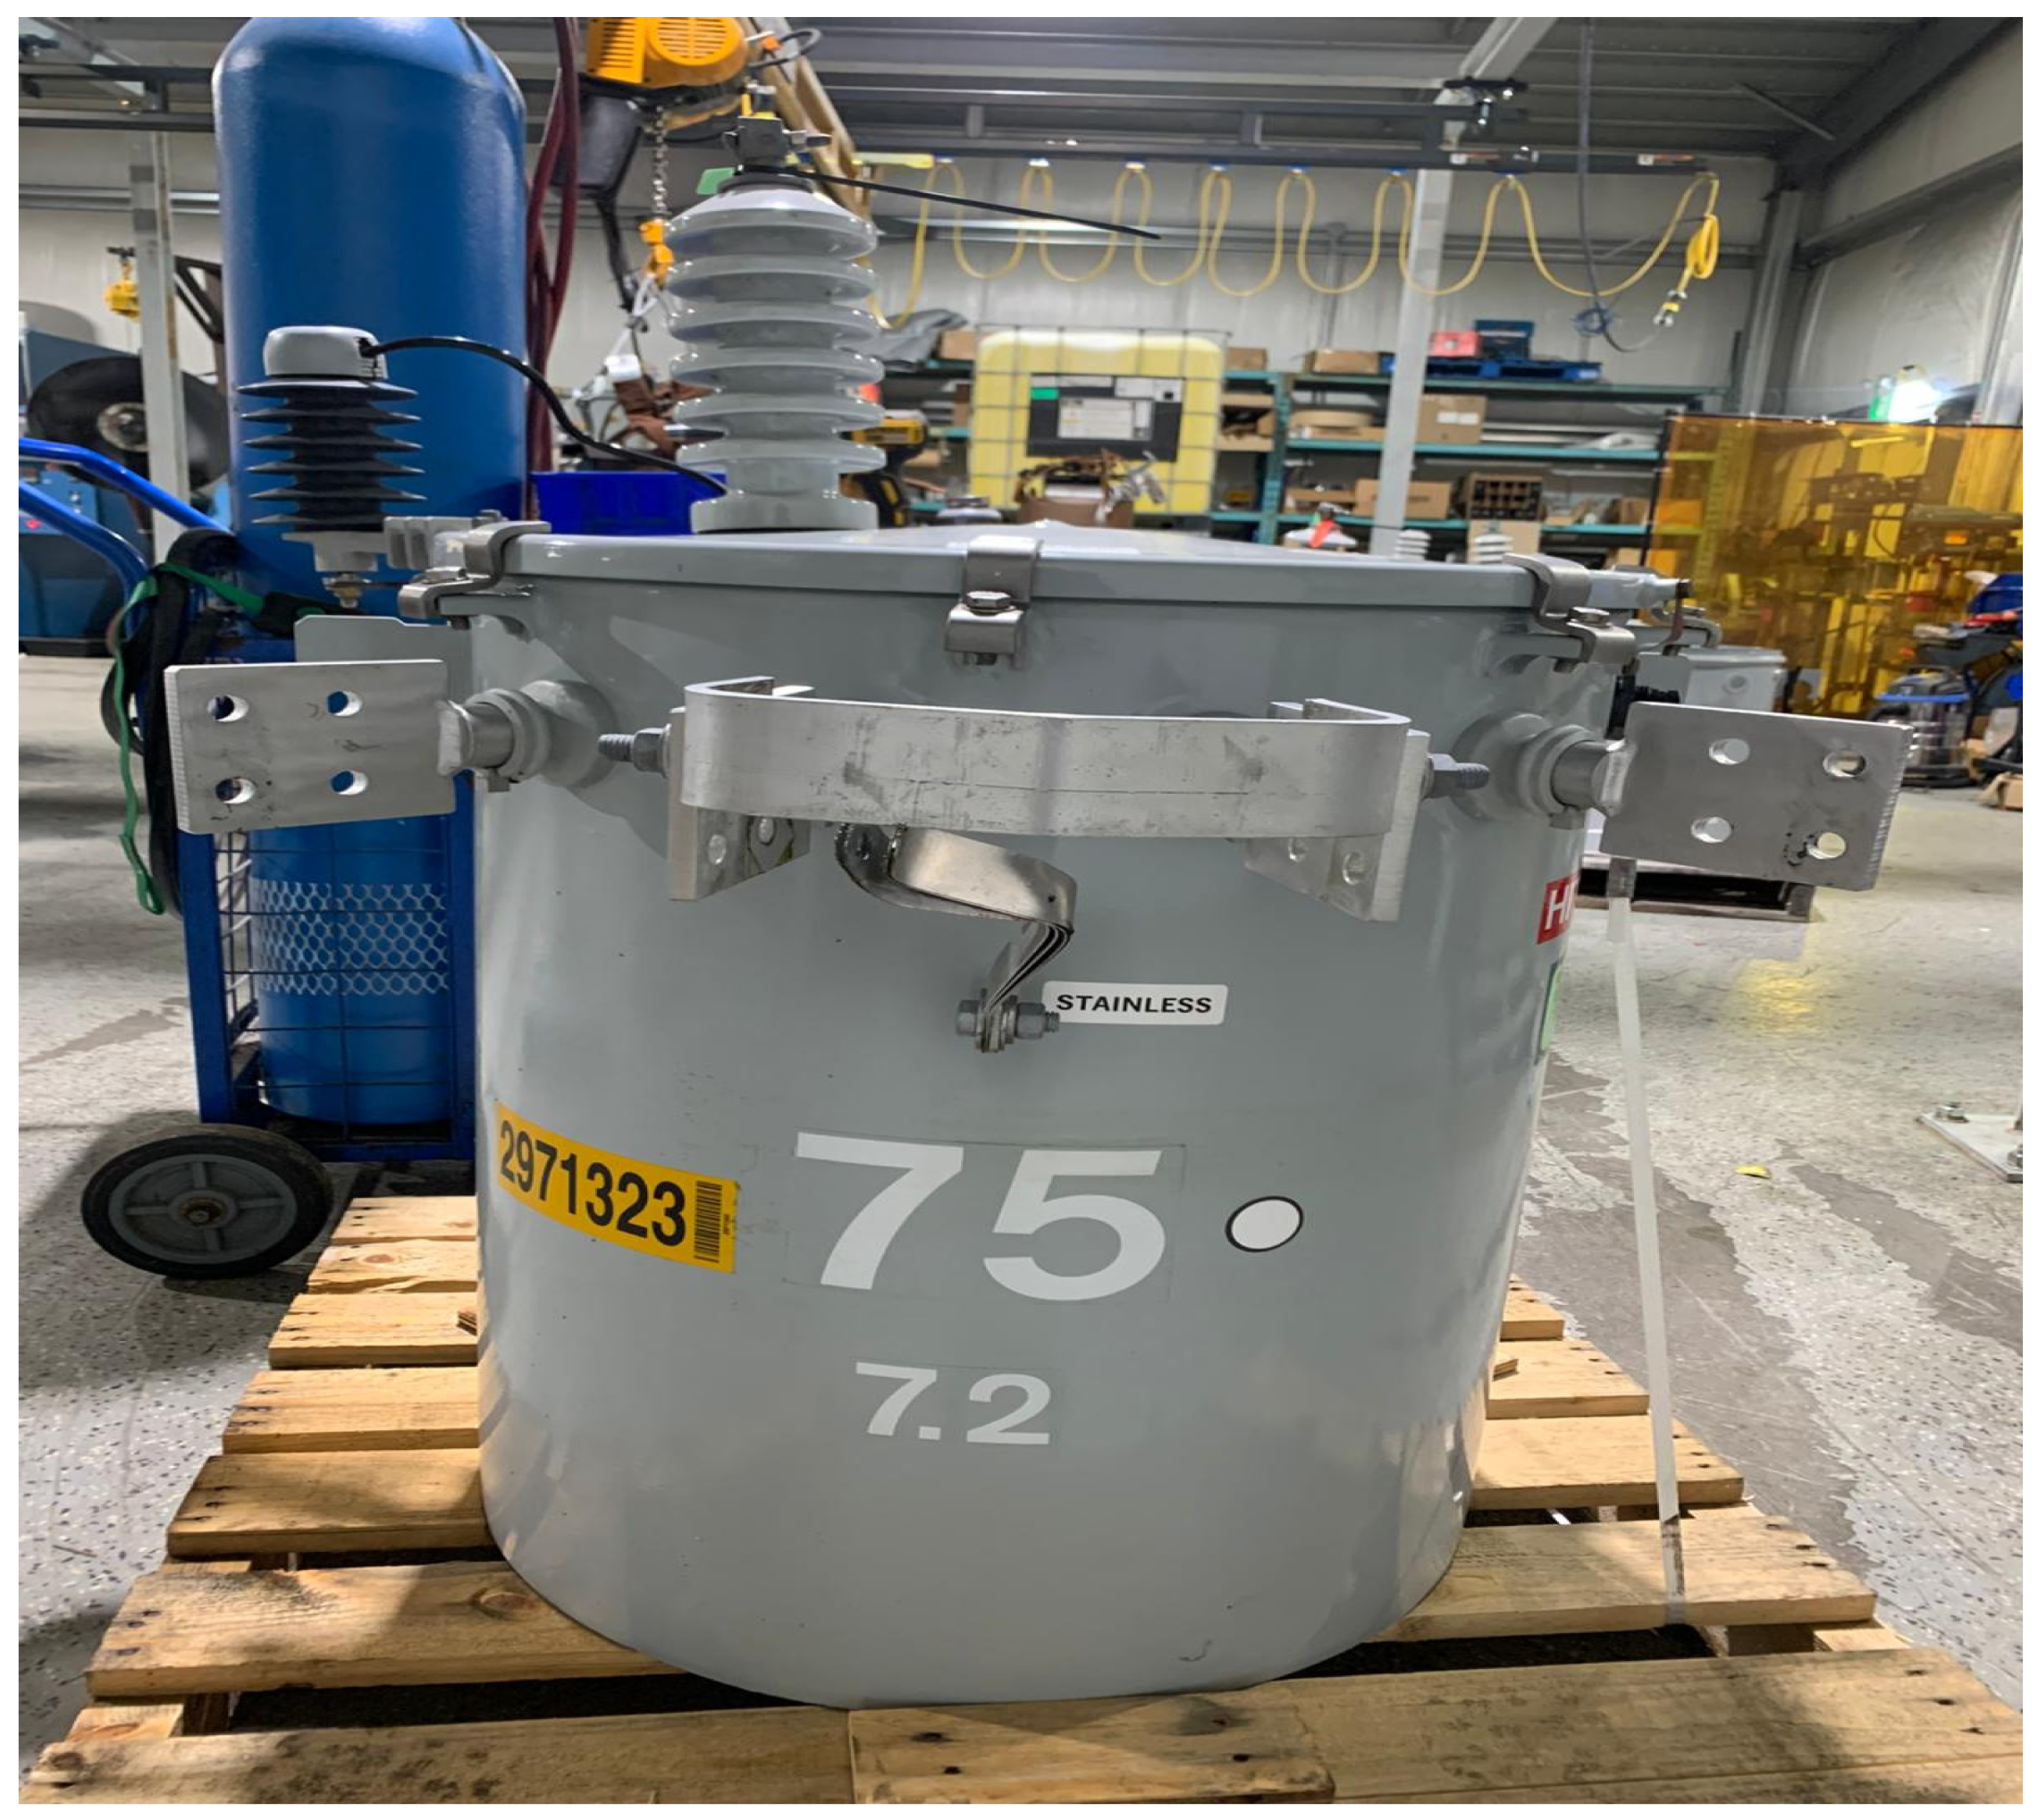
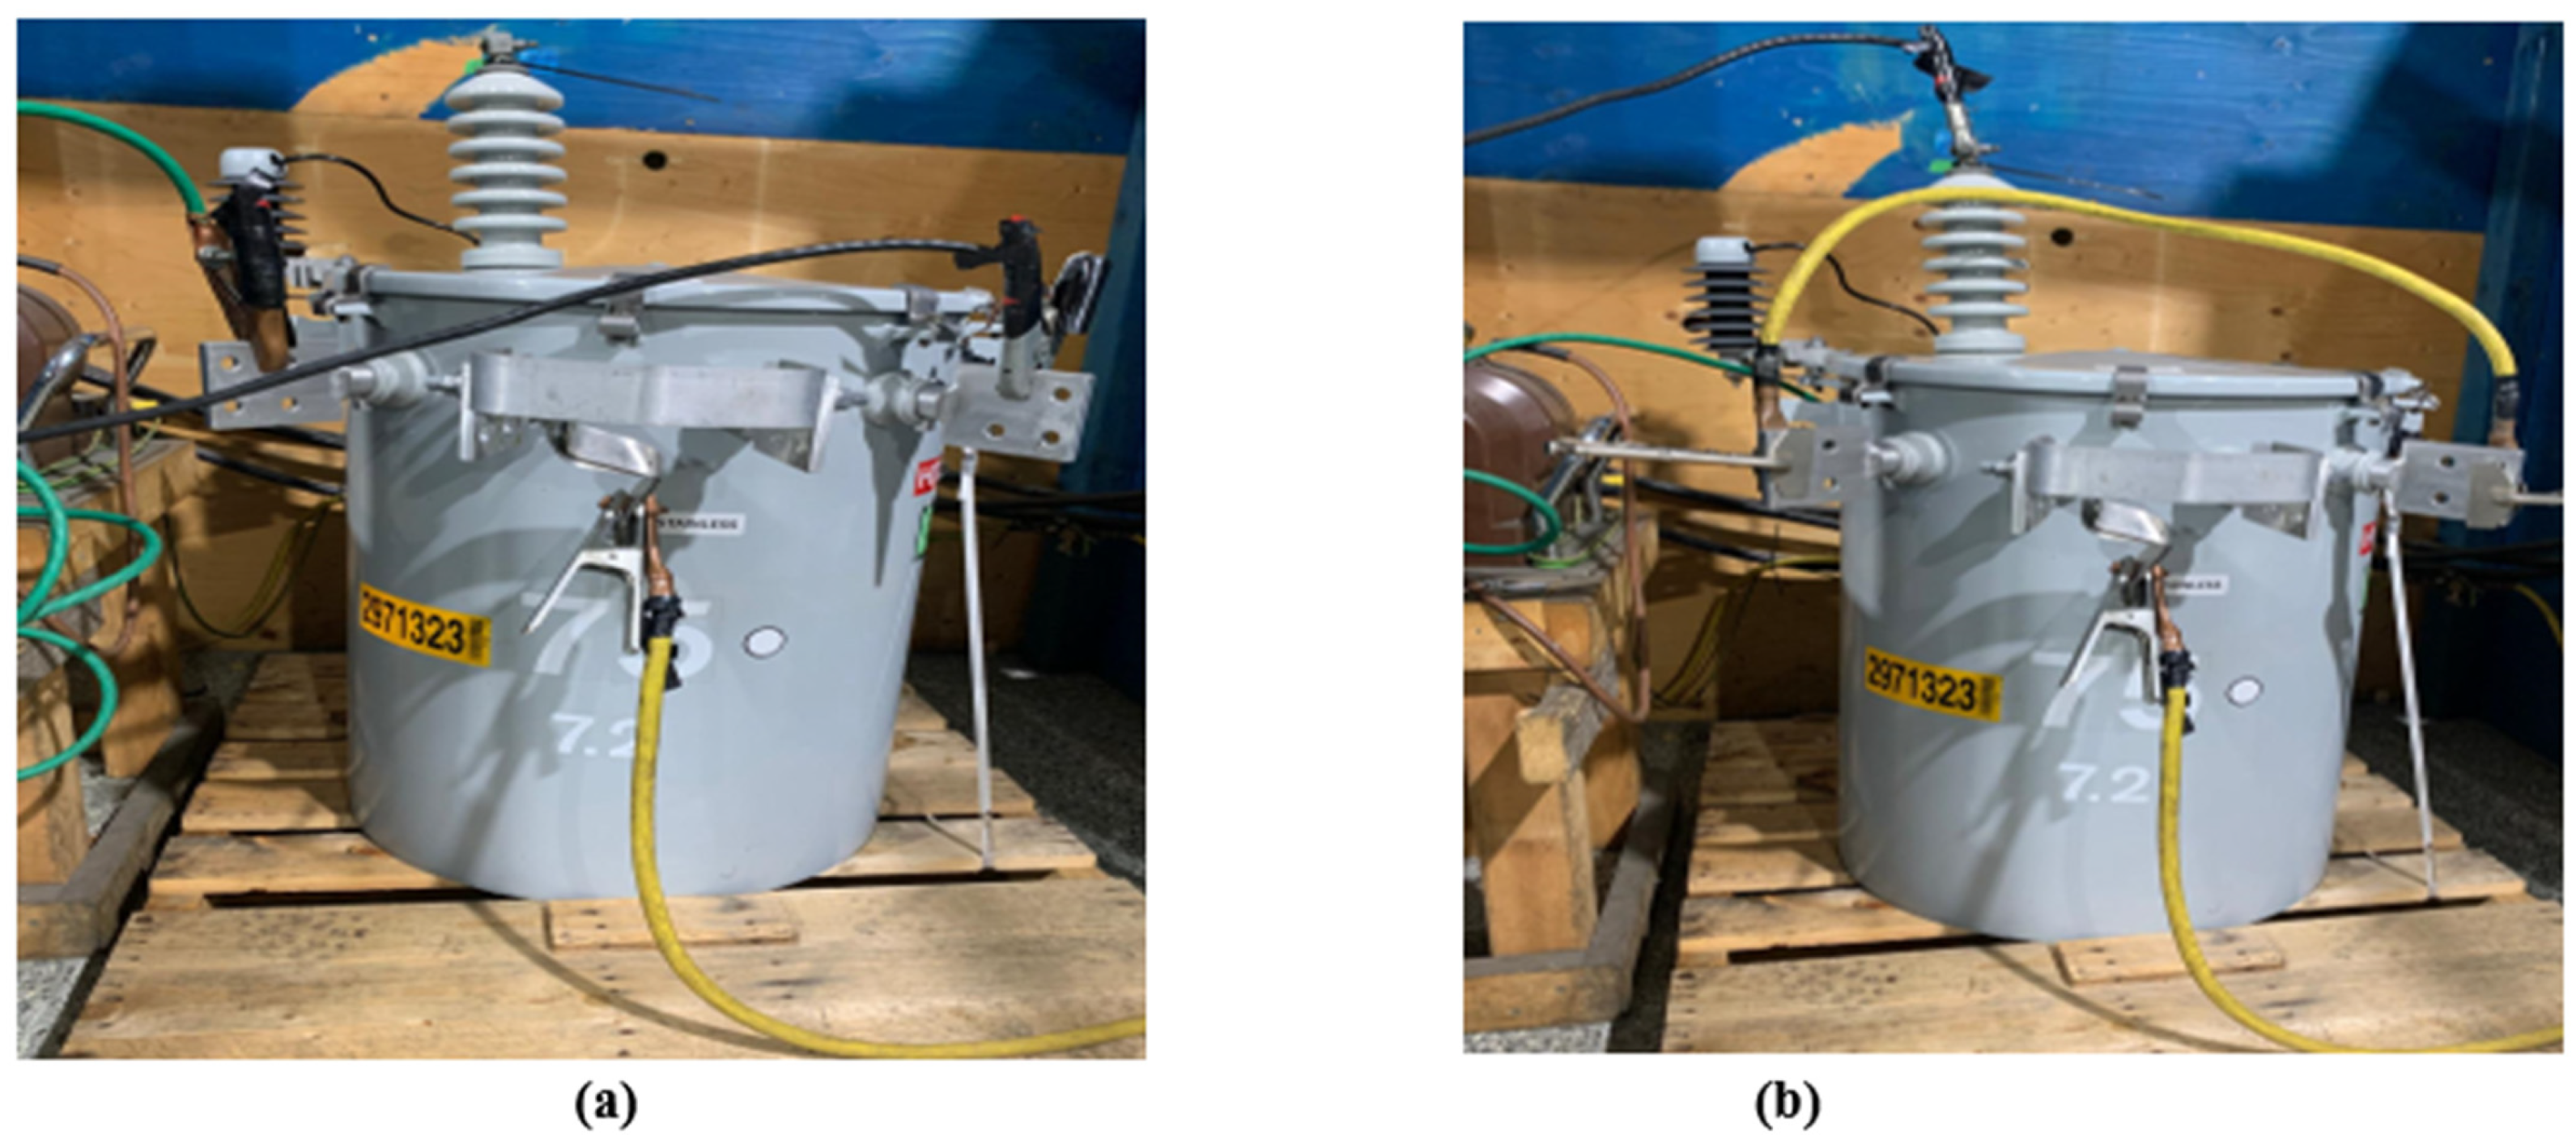
Figure 3 below shows a 75 KVA transformer.
The unit shown below in
Figure 3 is designed with a Basic Insulation Level (BIL) of 95 kV, ensuring reliability against electrical surges and disturbances. Together, these specifications highlight its suitability for medium-voltage distribution networks, combining robust insulation, efficient cooling, and modern safety standards.
Figure 3.
The 75 kVA Distribution Transformer used for testing.
Figure 3.
The 75 kVA Distribution Transformer used for testing.
Figure 4 below displays the insulated winding assembly of a typical 75 kVA distribution transformer. The copper wires are closely coiled and wrapped in several layers of cellulose-based insulation to avert electrical failure and improve thermal resilience. This insulation system ensures dielectric reliability, mechanical stability, and effective heat dissipation during the transformer’s operation, making it a crucial component of its internal structure.
3.3. Test Results of the Transformer
All tests were performed in accordance with IEEE Std. C57.12.90-2015 [
3] and IEEE Std. C57.12.00-2015 [
4], which outline the standard test code and general requirements for distribution transformers, as demonstrated in
Table 4.
According to IEEE Std C57.12.90, distribution transformer no-load and load losses must fall within specified tolerance bands relative to rated values, typically ±10% for individual loss components and ±5% for total losses. For the tested 75 kVA oil-immersed transformer, the measured no-load loss of 29.8 W and load loss of 640 W fall within these allowable IEEE tolerance limits when compared to the manufacturer’s rated values, thereby confirming compliance with IEEE testing specifications.
The measured values of no-load and load losses, turns ratio, insulation resistance, and winding resistance are within acceptable limits prescribed by the standards. This confirms that the 75 kVA unit satisfies both performance and diagnostic criteria for reliable operation in distribution networks.
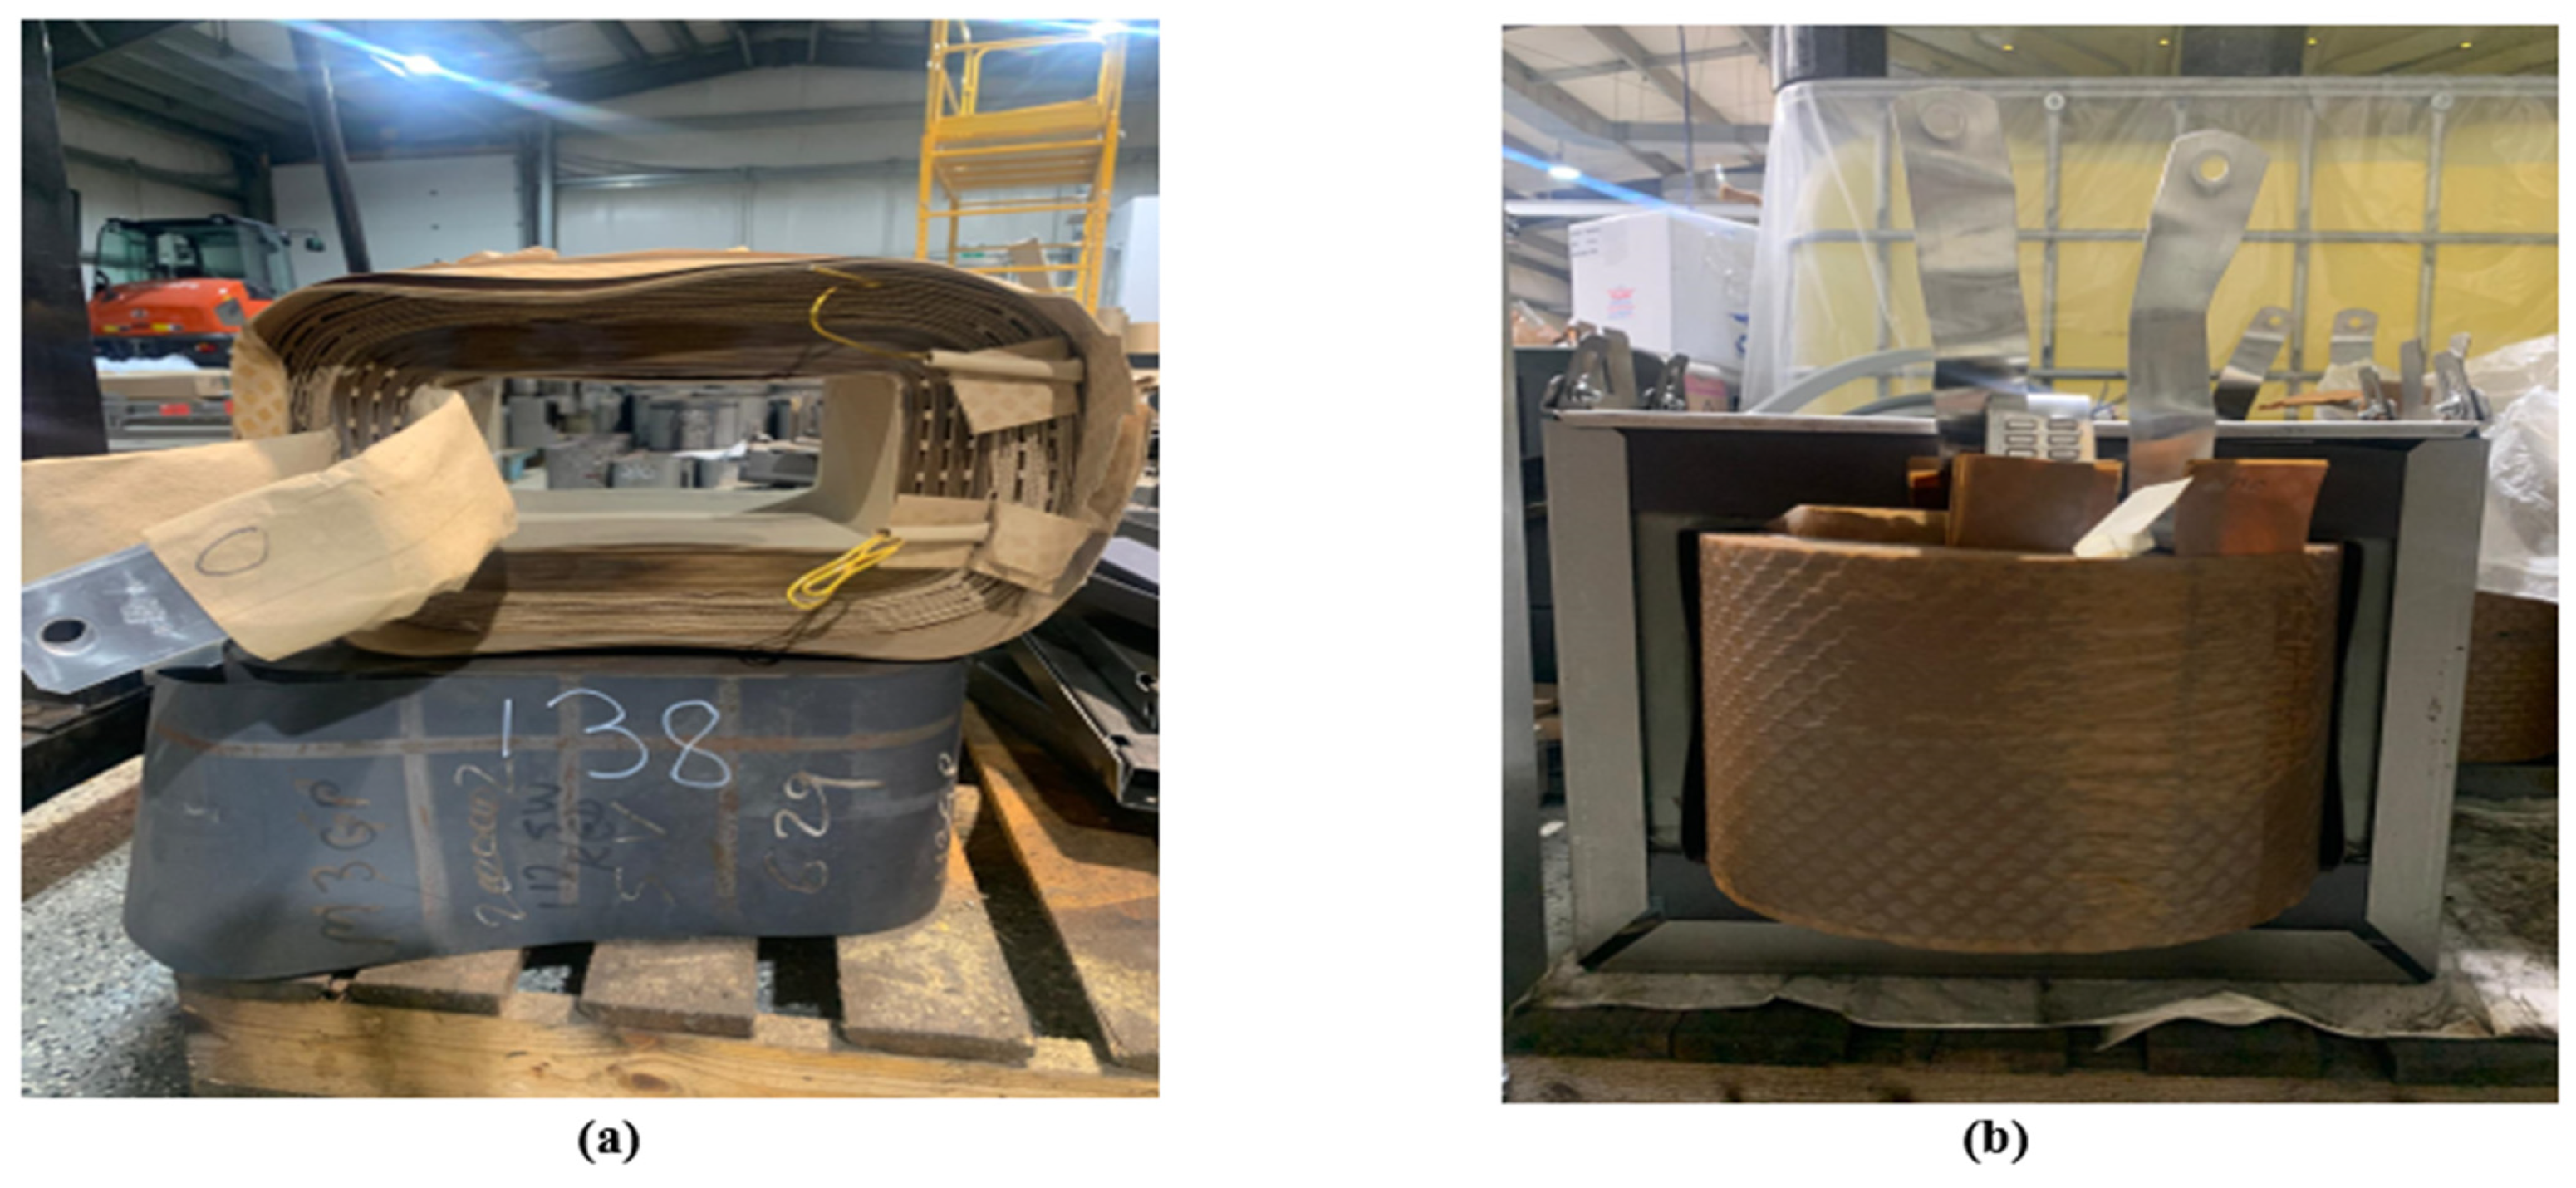
Figure 5 depicts the laboratory test setups for a 75 kVA distribution transformer. The no-load test (a) assesses core losses at rated voltage while the secondary is left open, whereas the full-load test (b) evaluates copper losses under conditions of rated current. These evaluations confirm the efficiency, thermal behavior, and adherence to IEEE testing specifications for the transformer.
3.4. Transformer Efficiency
The efficiency of distribution transformers is highly dependent on both loading conditions and power factor. Understanding this relationship is crucial for accurate loss modelling, system optimization, and life-cycle emission assessments.
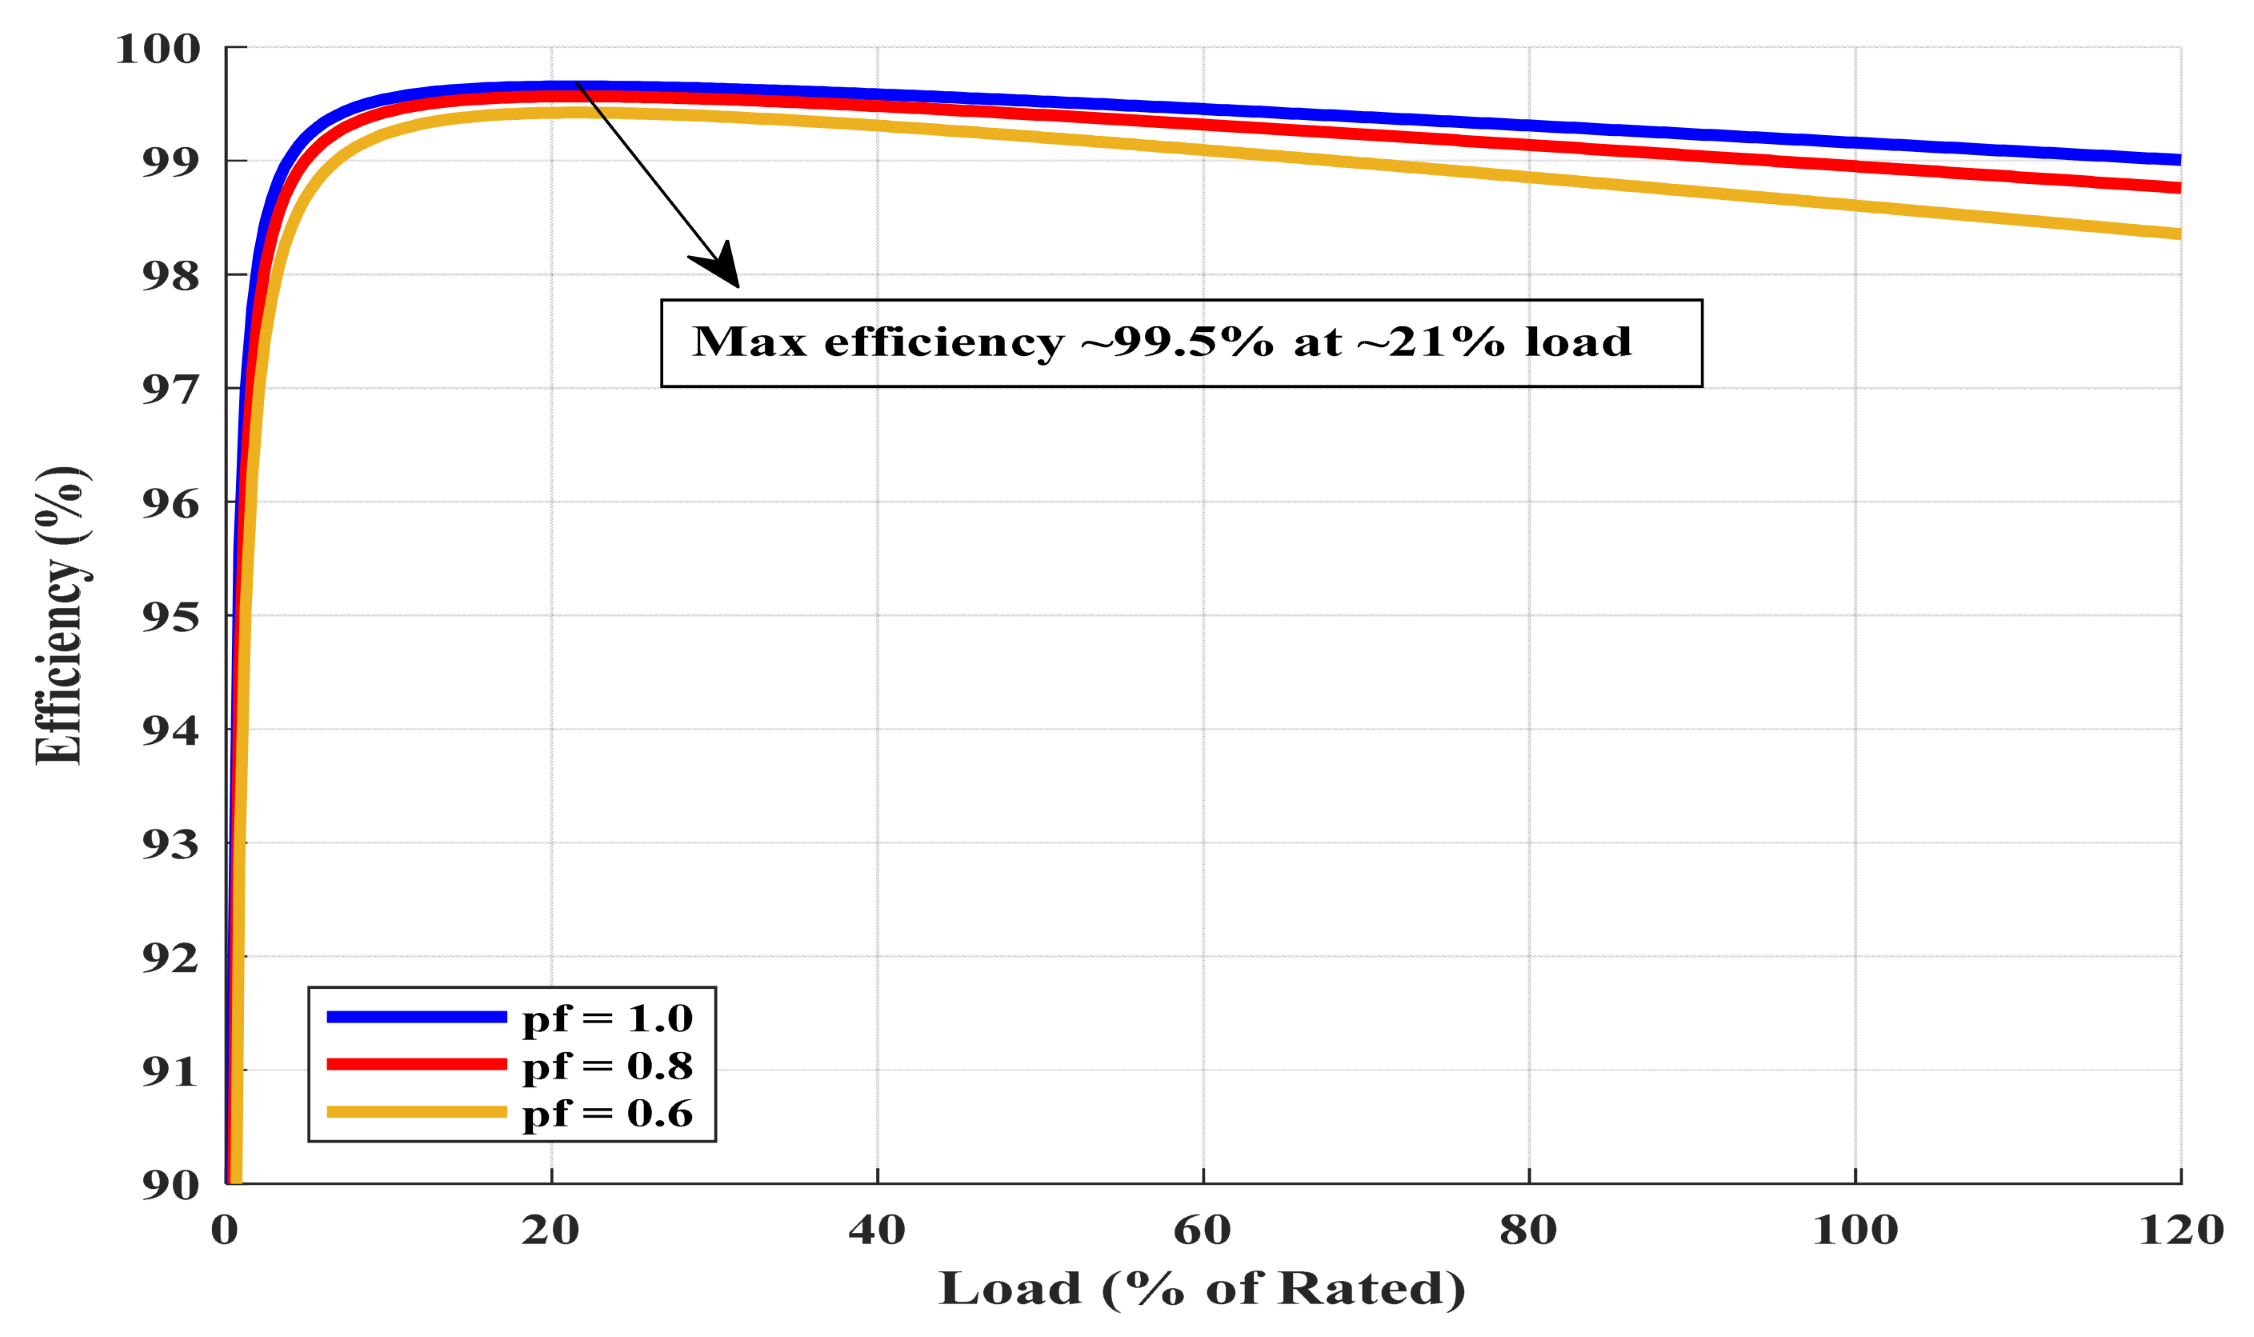
Figure 6 below shows the experimental data, illustrating the efficiency variation of the 75 kVA transformer under three operating conditions: unity power factor (pf = 1.0), 0.8 lagging, and 0.6 lagging. Based on experimental test data, using MATLAB, it was found that the transformer achieves its maximum efficiency of approximately 99.5% at around 21% of rated load. At lower power factors, efficiency slightly decreases due to increased copper losses associated with higher current flow.
3.5. Manufacturing Phase Study
The inventory data for the 75 kVA distribution transformer were collected in 2025 from a manufacturing company based in St. John’s, Newfoundland, Canada. The dataset includes all relevant materials, consumables, transportation, and electricity consumption throughout the manufacturing process. As presented in
Table 5,
Table 6 and
Table 7, this information forms the foundation of the life cycle inventory (LCI). The data collection process was one of the most time-intensive stages of the LCA, but it had a significant influence on the accuracy and reliability of the results. Ensuring comprehensive coverage of the transformer’s bill of materials, component-level weights, and supply chain sources was therefore crucial to accurately assessing the unit’s environmental performance.
The inventory data were collected directly from a Newfoundland-based transformer manufacturer in 2025. Materials used in the transformer, including steel, copper windings, cellulose-based insulation, a steel tank/frame, and mineral oil, were tracked from source to site. Transportation was primarily via semi-trailer diesel trucks. For instance, core steel and copper were sourced from Ontario and transported over 3000 km, while mineral oil arrived from Montreal (~2500 km). The transformer was delivered to its final installation site in Gander, approximately 300 km away from the manufacturing location.
Emission factors for freight were applied using Canada’s Federal Greenhouse Gas Offset System reference tables [
2], accounting for both distance and truck type. Where specific sourcing locations were uncertain, average transportation distances were assumed in accordance with LCA best practices [
21].
For major materials such as core steel, copper windings, mineral oil, and tank steel, supplier-specific sourcing locations and transportation distances were obtained directly from the manufacturer and are explicitly reported in
Table 6. Average transportation distances were applied only to minor components (e.g., bushings, auxiliary insulation materials, and fittings) where precise supplier information was unavailable, in accordance with ISO 14044 guidance. These minor components represent a small fraction of the total transformer mass and therefore have a negligible influence on overall transportation-related emissions.
The essential components of a transformer are composed of steel, used for the tank, cover, and radiators, and electrical steel, which forms the core. The current-carrying parts rely on copper for the windings. For electrical performance and longevity, mineral oil serves as a vital insulation, cooling, and impregnating medium [
5,
26], supplemented by cellulose insulation (such as paper and pressboard) to provide mechanical support and electrical isolation for the windings. Finally, materials categorized as “other” include items such as the on-load tap changer and its drive mechanism, as well as minor mass components like varnishes, rubber, glass, silica gel, porcelain, and aluminum, whose specific masses are difficult to reliably estimate.
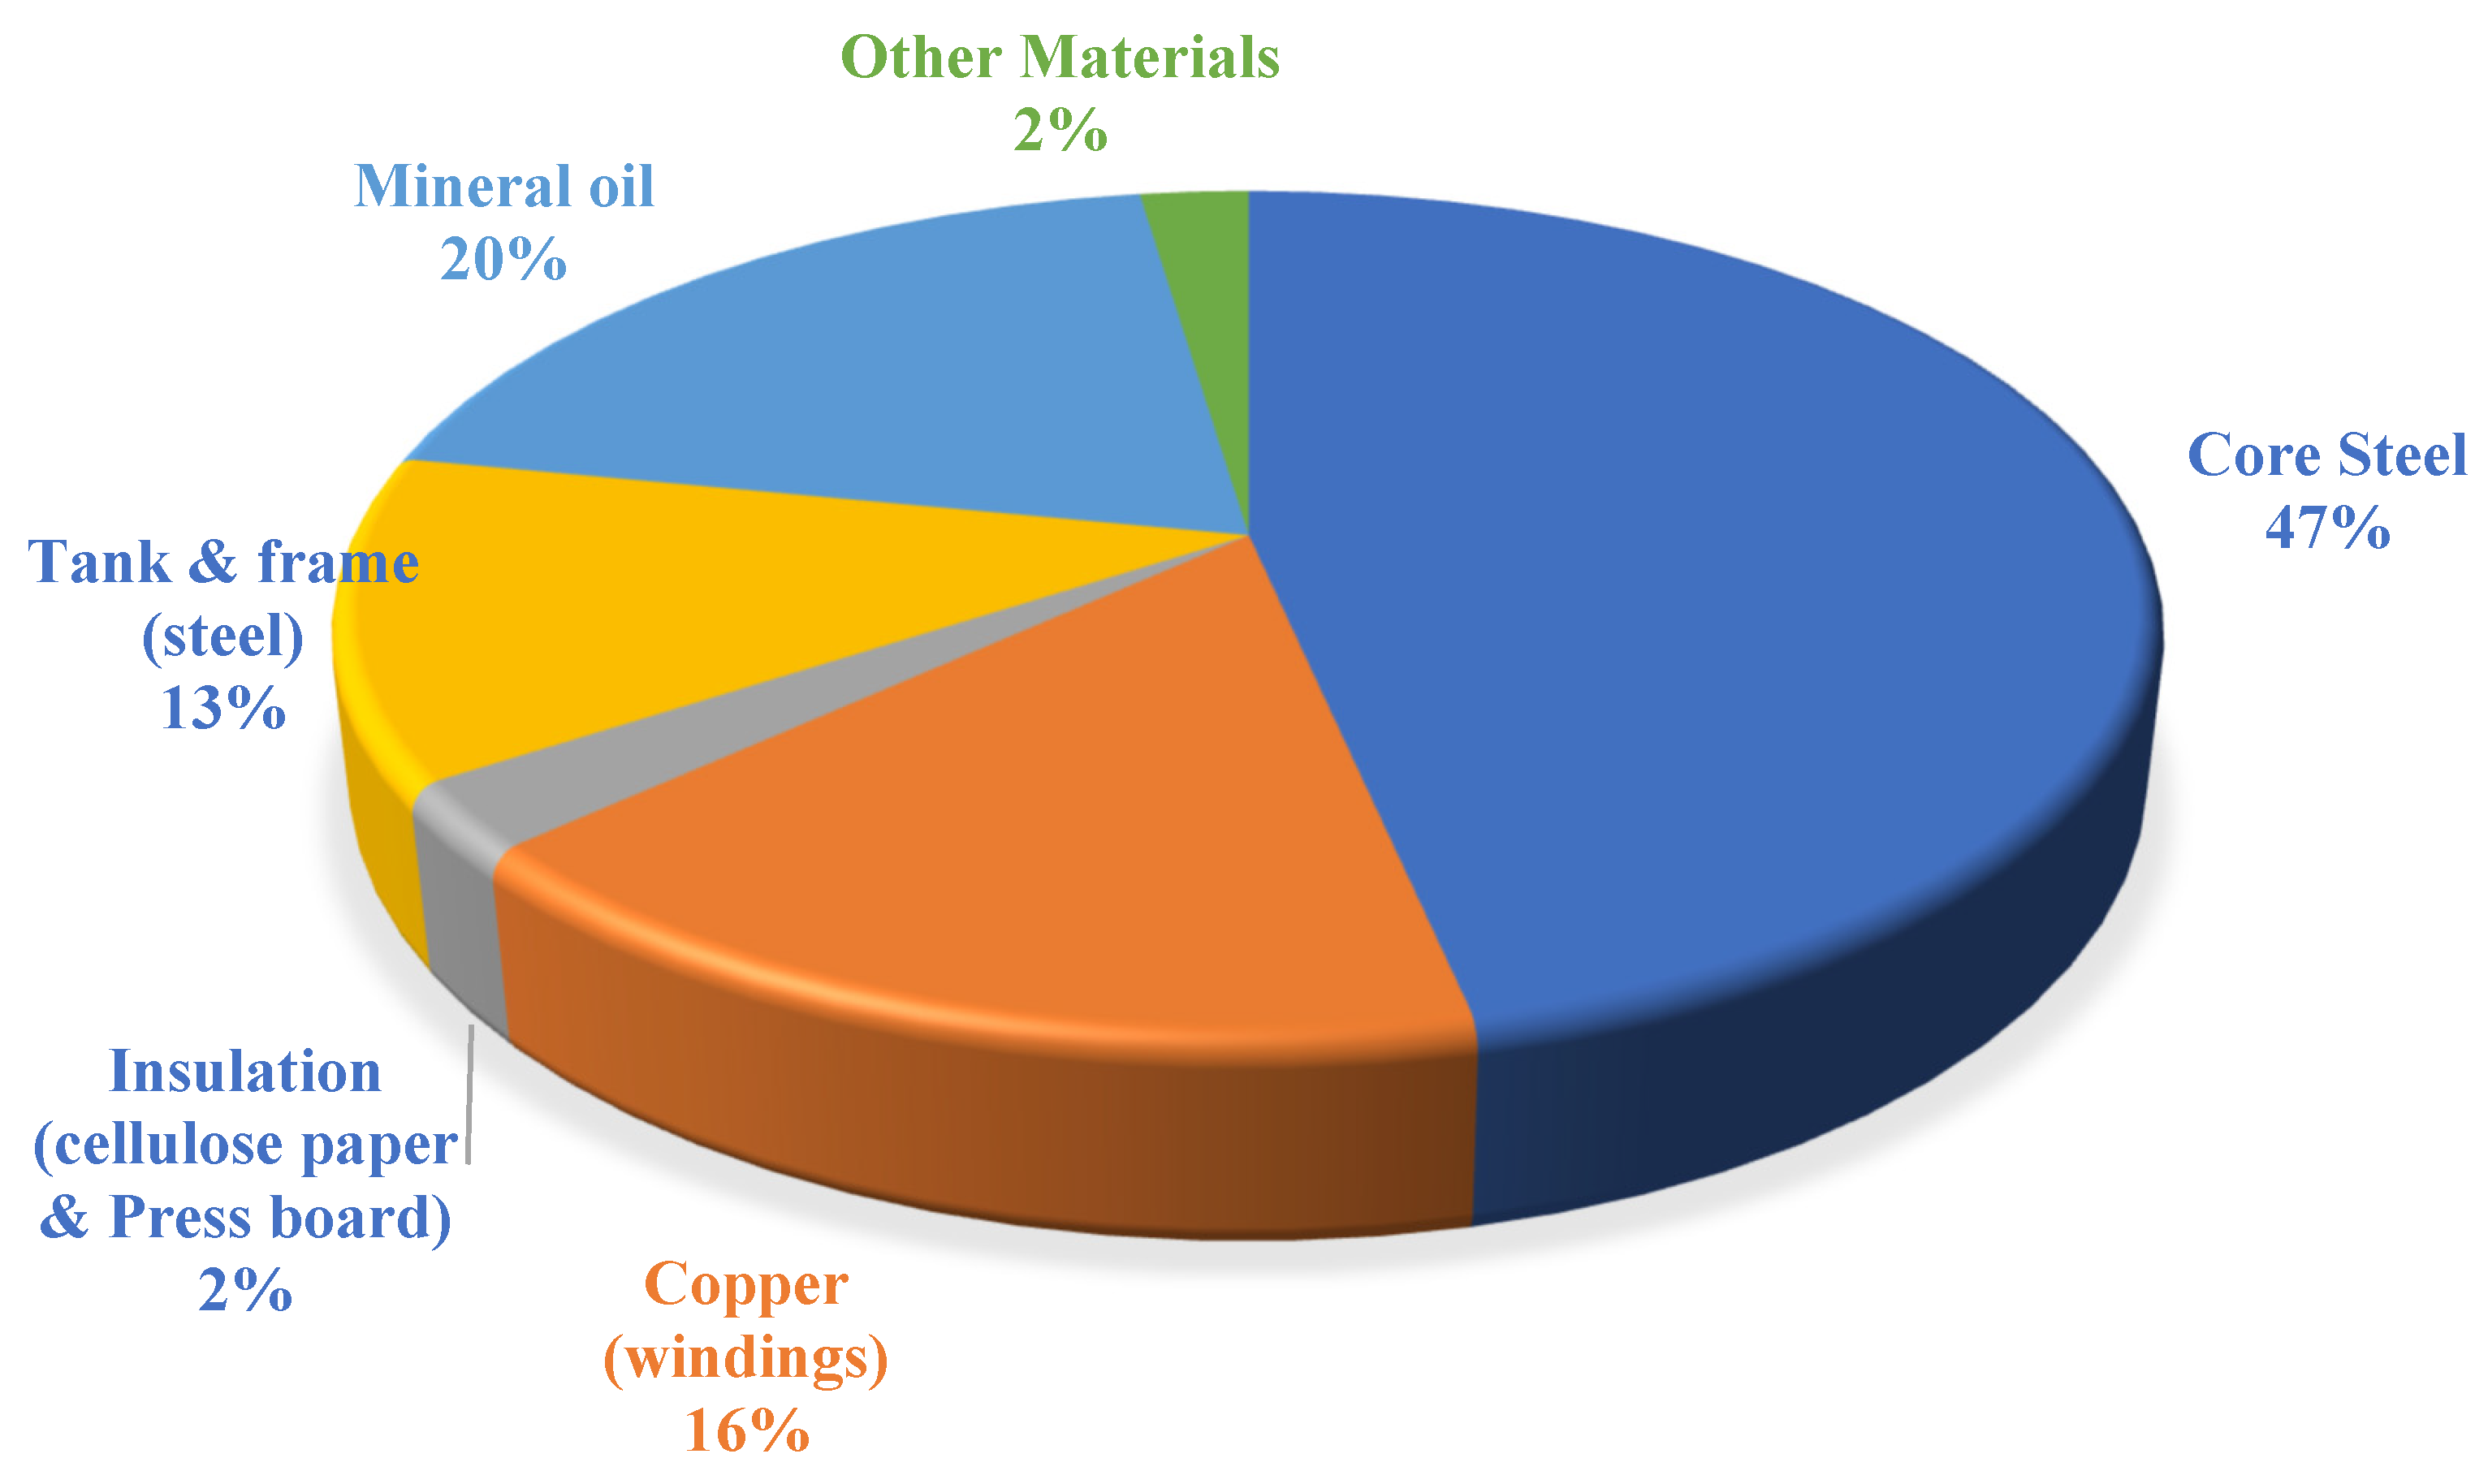
The material inventory of the transformer shows that core steel is the dominant component, accounting for nearly half of the total mass. Copper windings represent 16%, while mineral oil and the tank contribute 20% and 12%, respectively. Insulation materials and other minor components form the remaining 5%. This distribution highlights the material-intensive nature of core steel and copper, which are critical drivers of both performance and environmental impacts throughout their life cycle. The percentage contribution of raw materials in the total mass of the 75 kVA distribution transformer is shown in
Figure 7 below.
The transportation inventory for the 75 kVA transformer materials was analyzed considering semi-trailer truck routes across Canada. Distances ranged from 1500 km to 3200 km, depending on the material source, with a total transported mass of 0.388 t. This dataset highlights the contribution of logistics to the overall life cycle emissions of the transformer, as shown in
Table 6 below.
Table 6.
Inventory analysis of material transportation to the factory.
Table 6.
Inventory analysis of material transportation to the factory.
| Geography | Type of Transport | Distance [km] | Mass [t] |
|---|
| Ontario (Core steel) | Semi-trailer trucks | 3000 | 0.181 |
| Ontario (Copper) | Semi-trailer trucks | 3200 | 0.064 |
| Ontario (Insulation, Bushing) | Semi-trailer trucks | 3000 | 0.019 |
| Montreal (Oil) | Semi-trailer trucks | 2500 | 0.048 |
| New Brunswick (Tank) | Semi-trailer trucks | 1500 | 0.076 |
On the other hand,
Table 7 below shows selected emission factors (EFCO
2e) for transformer construction materials, taken from a variety of literature sources [
7,
8,
9,
10,
11,
12,
13,
14,
27,
28], and environmental databases, especially Ecoinvent 3.11 [
29], published by the Ecoinvent Centre in St. Gallen, Switzerland. These factors were selected as representative values for calculating the carbon footprint during the material stage of the life cycle assessment.
Table 7.
Emission factors related to the production of specific construction materials.
Table 7.
Emission factors related to the production of specific construction materials.
| Material | Quantity (t) | Emission Factor (CO2e/t) | Reference |
|---|
| Core steel (Electrical) | 0.181 | 3 | [7,8,9,10,11,12,13,14,27,28,29] |
| Copper (windings) | 0.064 | 4.738 | [7,8,9,10,11,12,13,14,27,28,29] |
| Insulation (cellulose & pressboard) | 0.007 | 1.5 | [12,27,28] |
| Steel (Tank and Frame) | 0.051 | 2.5 | [7,8,9,10,11,12,13,14,27,28,29] |
| Mineral oil | 0.076 | 1.210 | [7,9,27,28] |
As detailed in the table, multiple emission factor (EF) values can exist for a single material due to variations in composition (e.g., carbon steel vs. stainless steel), manufacturing methods (such as blast furnace or electric arc furnace), the proportion of recycled inputs, and differences in energy sources used during production. For materials grouped as “other,” the weighted-average emission factor for transformer materials was calculated using a mass-weight approach, whereby the emission factor of each material was multiplied by its respective mass contribution and normalized by the total transformer mass. This yielded an average value of 2.84 t CO
2e/t, representative of the combined embodied carbon intensity of the transformer materials. For example, the weighted-average emission factor for the transformer materials was calculated as 2.84 t CO
2e/t, based on the mass-weighted emission factors listed in
Table 7.
Again,
Table 8 outlines the emission factors related to transporting materials to the manufacturing site. These values reflect Well-to-Wheel (WTW) emissions, which encompass the entire life cycle of the fuel consumed during transportation. In this analysis, “tkm” (ton-kilometres) is used as the functional unit to assess the impacts of freight transportation, calculated by multiplying the cargo mass by the distance travelled. All inbound material transportation was assumed to occur via diesel-powered semi-trailer trucks, and emissions were calculated using a Well-to-Wheel emission factor expressed in t CO
2e per ton-kilometre (t·km).
3.6. Manufacturing Energy Use
The carbon footprint associated with the manufacturing phase of distribution transformers is primarily determined by the electricity consumed during production. The assessment of electricity-related carbon emissions during transformer manufacturing and operation requires the identification of the CO
2-equivalent emission factor per unit of electricity generated (kg CO
2e/kWh). This parameter integrates the proportional contribution of different generation sources within the regional electricity mix. Emission factor data for the years 2018–2025 were utilized for the present calculation and are summarized in
Table 9 below.
To estimate this, transformer manufacturers apply an Electricity Consumption Factor (ECF), which represents the average amount of electrical energy required to produce one megavolt-ampere (MVA) of transformer capacity. This value encompasses energy used by essential equipment such as winding machines, overhead cranes, blowers, lighting, and sandblasting units, as well as auxiliary operations including inter-process testing, physico-chemical laboratories, and final acceptance tests. Furthermore, ECF also includes energy consumption attributed to design, administration, and commercial departments. Based on industry-wide data from 2023, the ECF for transformer manufacturing is 768 kWh/MVA, which can be scaled proportionally for distribution transformers of smaller capacities, such as 75 kVA units [
24].
The electricity consumption factor (ECF) of 768 kWh/MVA is adopted from [
28], where it is reported for a specific transformer manufacturing facility in Poland for the year 2023. In the absence of facility-specific metered data, this value is used as a representative approximation of manufacturing electricity consumption. The electricity consumed during manufacturing was estimated to use an Electricity Consumption Factor (ECF) of 768 kWh/MVA, which reflects the average electrical energy required to produce 1 MVA of transformer capacity. For a 75 kVA distribution transformer, the total electricity consumption during manufacturing is estimated at 57.6 kWh, and 0.00104 t CO
2e of emissions when applying the 2025 grid emission factor of 18 g CO
2e per kWh for Newfoundland and Labrador. This ECF encompasses the energy consumption of winding machines, cranes, lighting, chemical laboratories, and administrative buildings.
3.7. Use-Phase Study
This part employs a use-phase comprehensive life cycle assessment (LCA) approach to quantify the environmental impact of a 75 kVA distribution transformer manufactured in St. John’s, Newfoundland and Labrador, Canada. The analysis aligns with international standards, such as ISO 14040 and ISO 14044, and closely follows methodologies and emission factor datasets outlined by Environment and Climate Change Canada [
1,
2].
Use-Phase Operational Emissions
The dominant source of lifecycle emissions arises during the operational phase, due to electricity losses caused by no-load (iron/core) and load (copper) losses. The 75 kVA unit is naturally cooled (ON-AN) with no fans or pumps, and heater and tap changer consumption were excluded due to their intermittent or negligible use. Maintenance emissions are also outside the scope of this assessment. A reference service life (RSL) of 40 years was assumed.
To accurately quantify the carbon footprint associated with electricity consumption during transformer manufacturing or operational use, it is essential to apply a CO2-equivalent emission factor per kilowatt-hour (kWh). This emission factor must be derived from the weighted contributions of various primary energy sources within the regional electricity generation mix (e.g., coal, natural gas, hydro, wind, nuclear), accounting for upstream emissions and generation efficiencies in accordance with a Well-to-Wheel or cradle-to-gate LCA boundary framework.
As mentioned before, Newfoundland and Labrador exhibits one of the lowest grid electricity emission intensities in Canada, reflecting its predominantly hydroelectric generation mix. According to federal carbon intensity statistics [
2], the provincial grid averaged 17 g CO
2e/kWh over the 2023–2024 period, with a projected marginal rise to 18 g CO
2e/kWh for 2025. with Newfoundland’s low-carbon grid intensity of 18 g CO
2e/kWh.
To capture realistic operational conditions, varying load approaches were considered to represent actual loading scenarios.
Energy loss over the 40-year lifetime was calculated using:
where
represents the measured no-load (core) losses of the transformer (W),
denotes the rated load (copper) losses (W),
is the average load factor (dimensionless),
is the annual operating time (h/year, assumed as 8760 h), and
is the reference service life of the transformer (assumed as 40 years). The term
reflects the quadratic dependence of copper losses on load current. The resulting lifetime energy was multiplied by Newfoundland’s grid intensity (0.018 kg CO
2e/kWh) to determine operational emissions.
5. Discussion
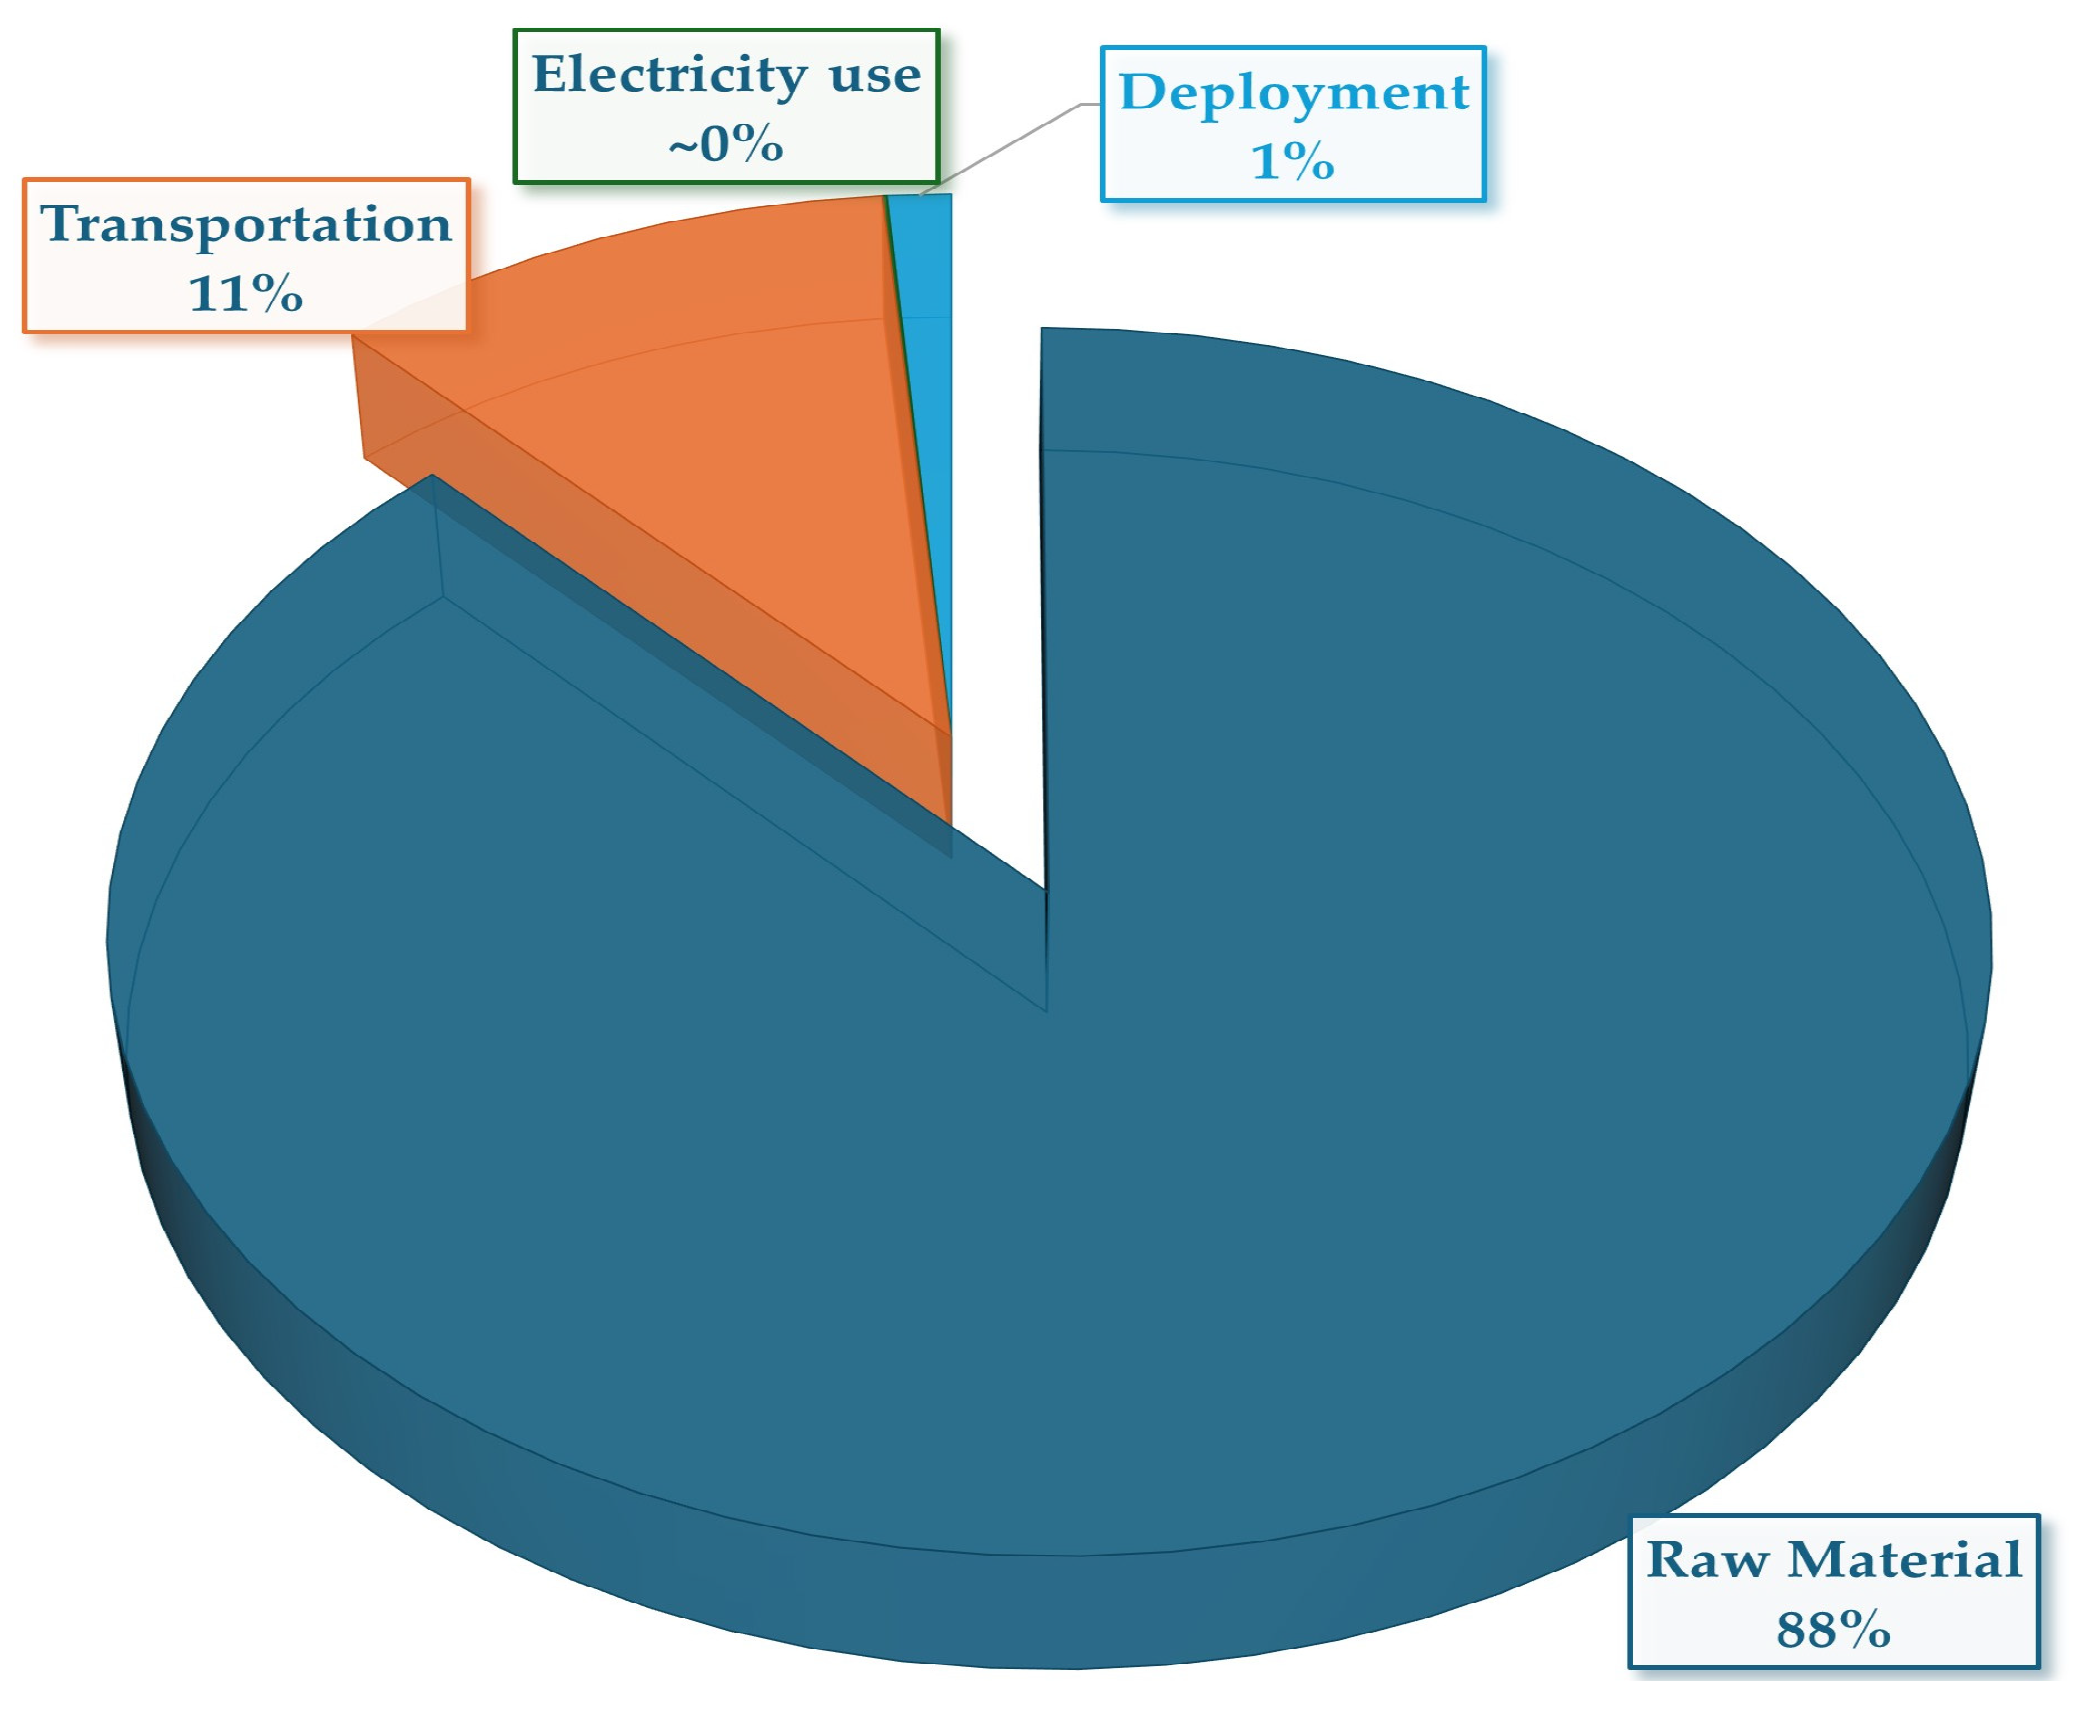
This lifecycle analysis highlights that the emissions associated with the manufacturing and logistics stages of a 75 kVA oil-immersed distribution transformer comprise raw material sourcing (1.1025 t CO
2e), interprovincial transportation of materials (0.135 t CO
2e), manufacturing electricity use (0.00104 t CO
2e) and final deployment to the site (0.0151 t CO
2e), which sum up to approximately 1.2536 metric tons of CO
2-equivalent (t CO
2e). The carbon-intensive production of amorphous core steel and copper windings primarily drives these cradle-to-site emissions. While transportation emissions are comparatively minor, regional sourcing and improved supply chain coordination could yield measurable reductions in this category.
Figure 9 below illustrates the proportional contributions from material production, material transportation to the factory, and electricity usage associated with transformer production.
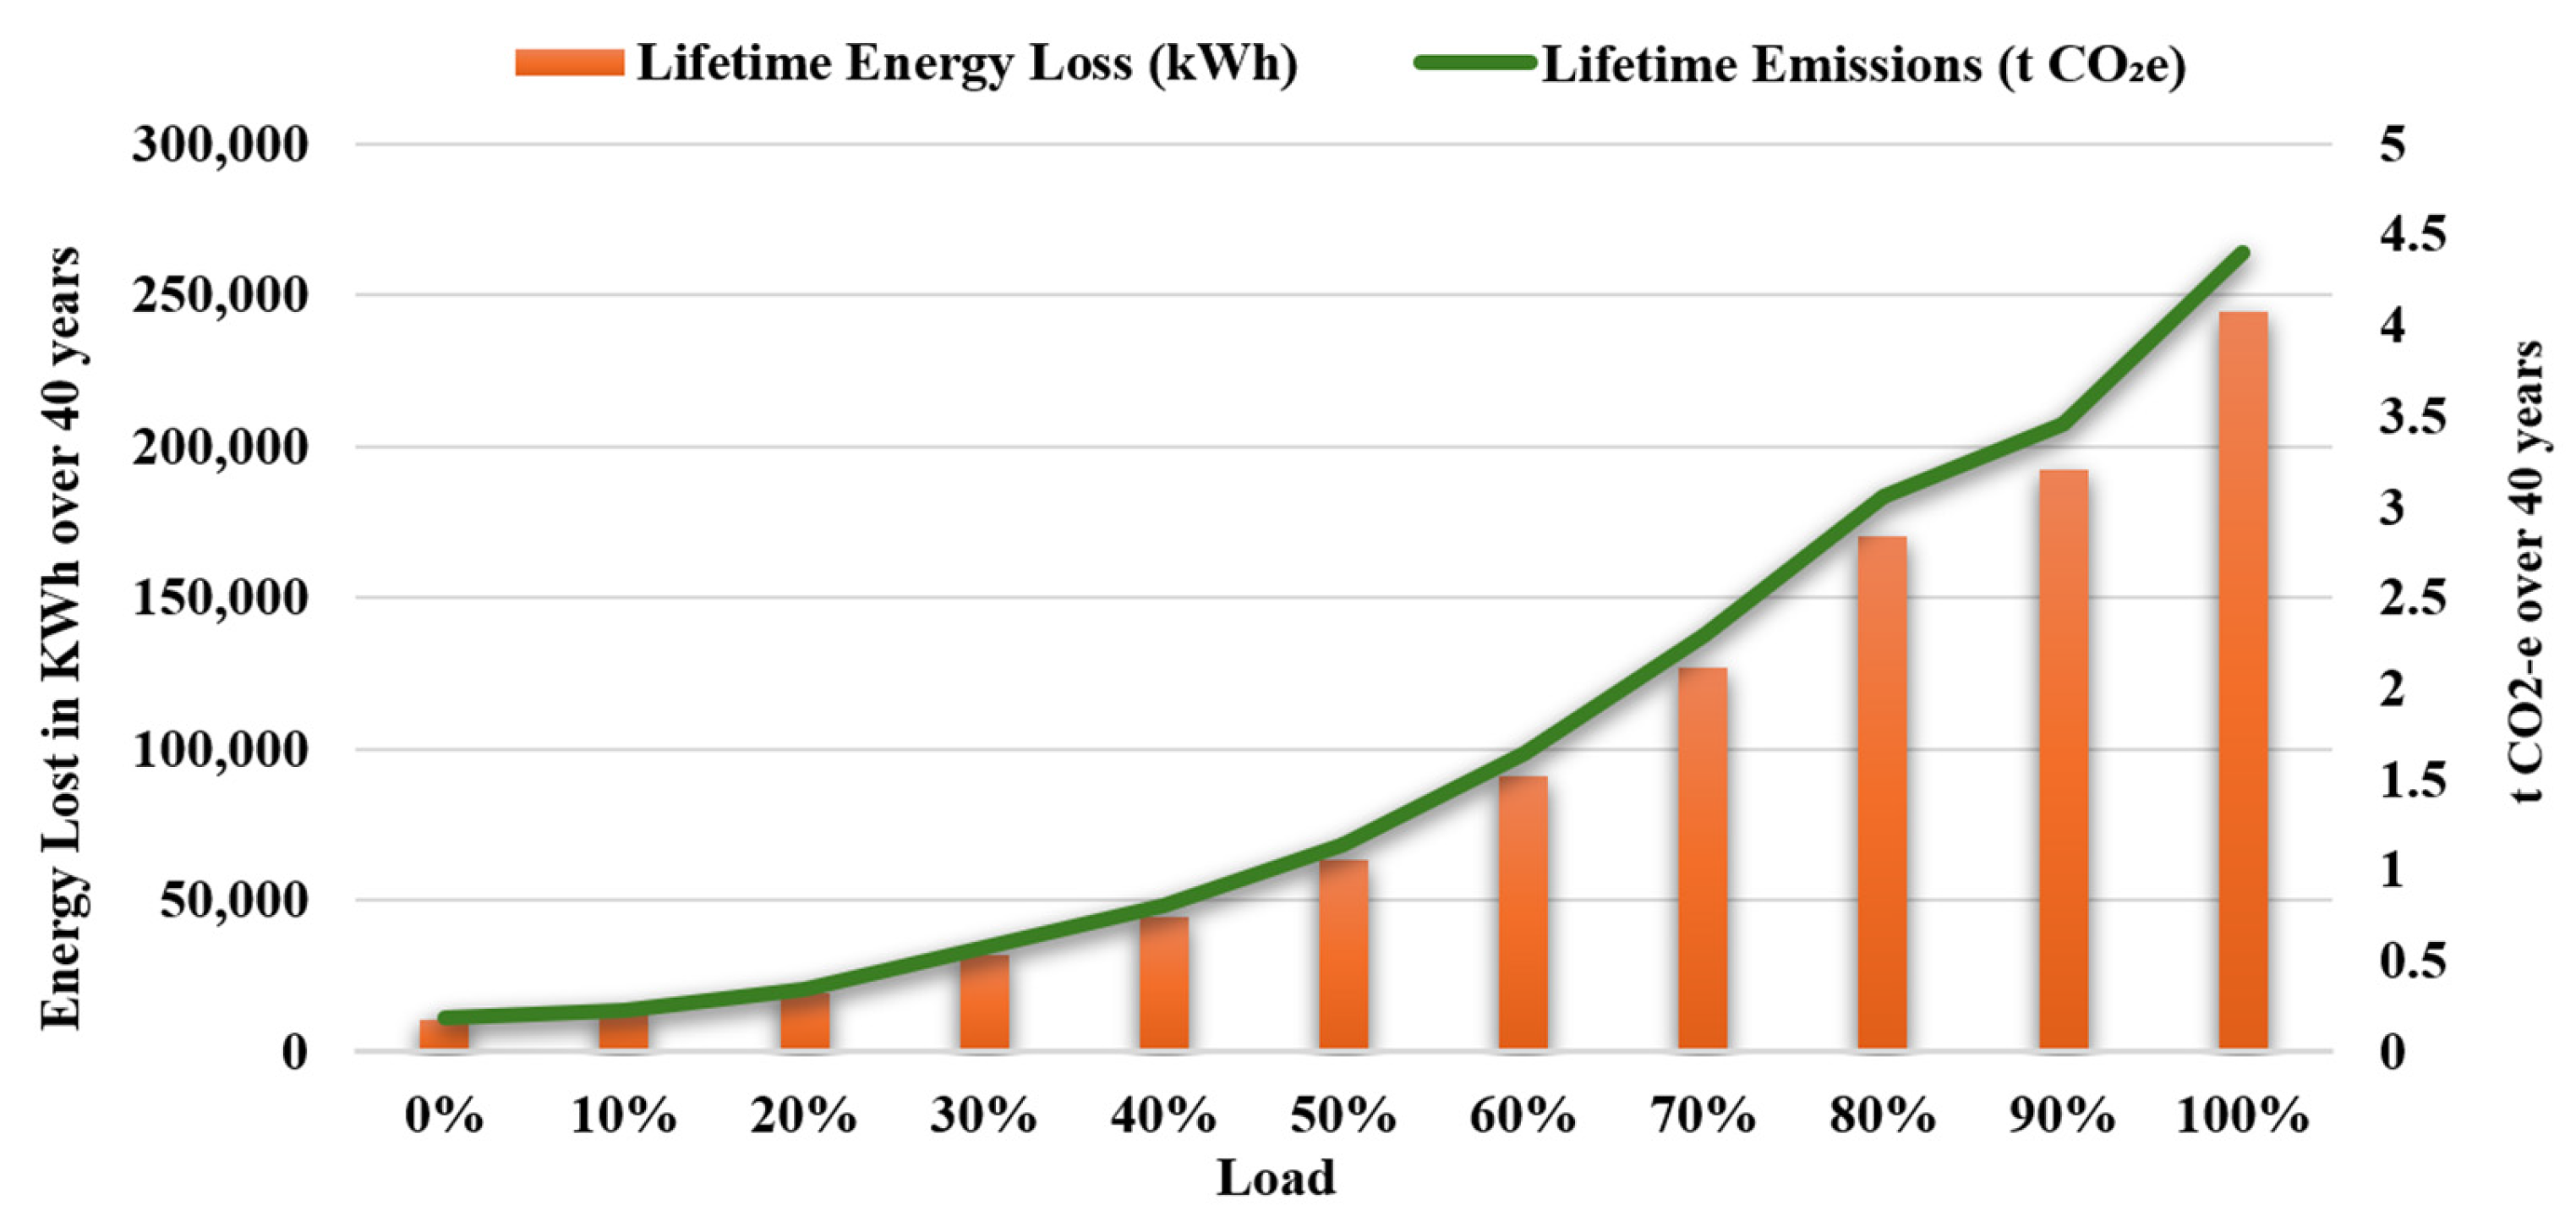
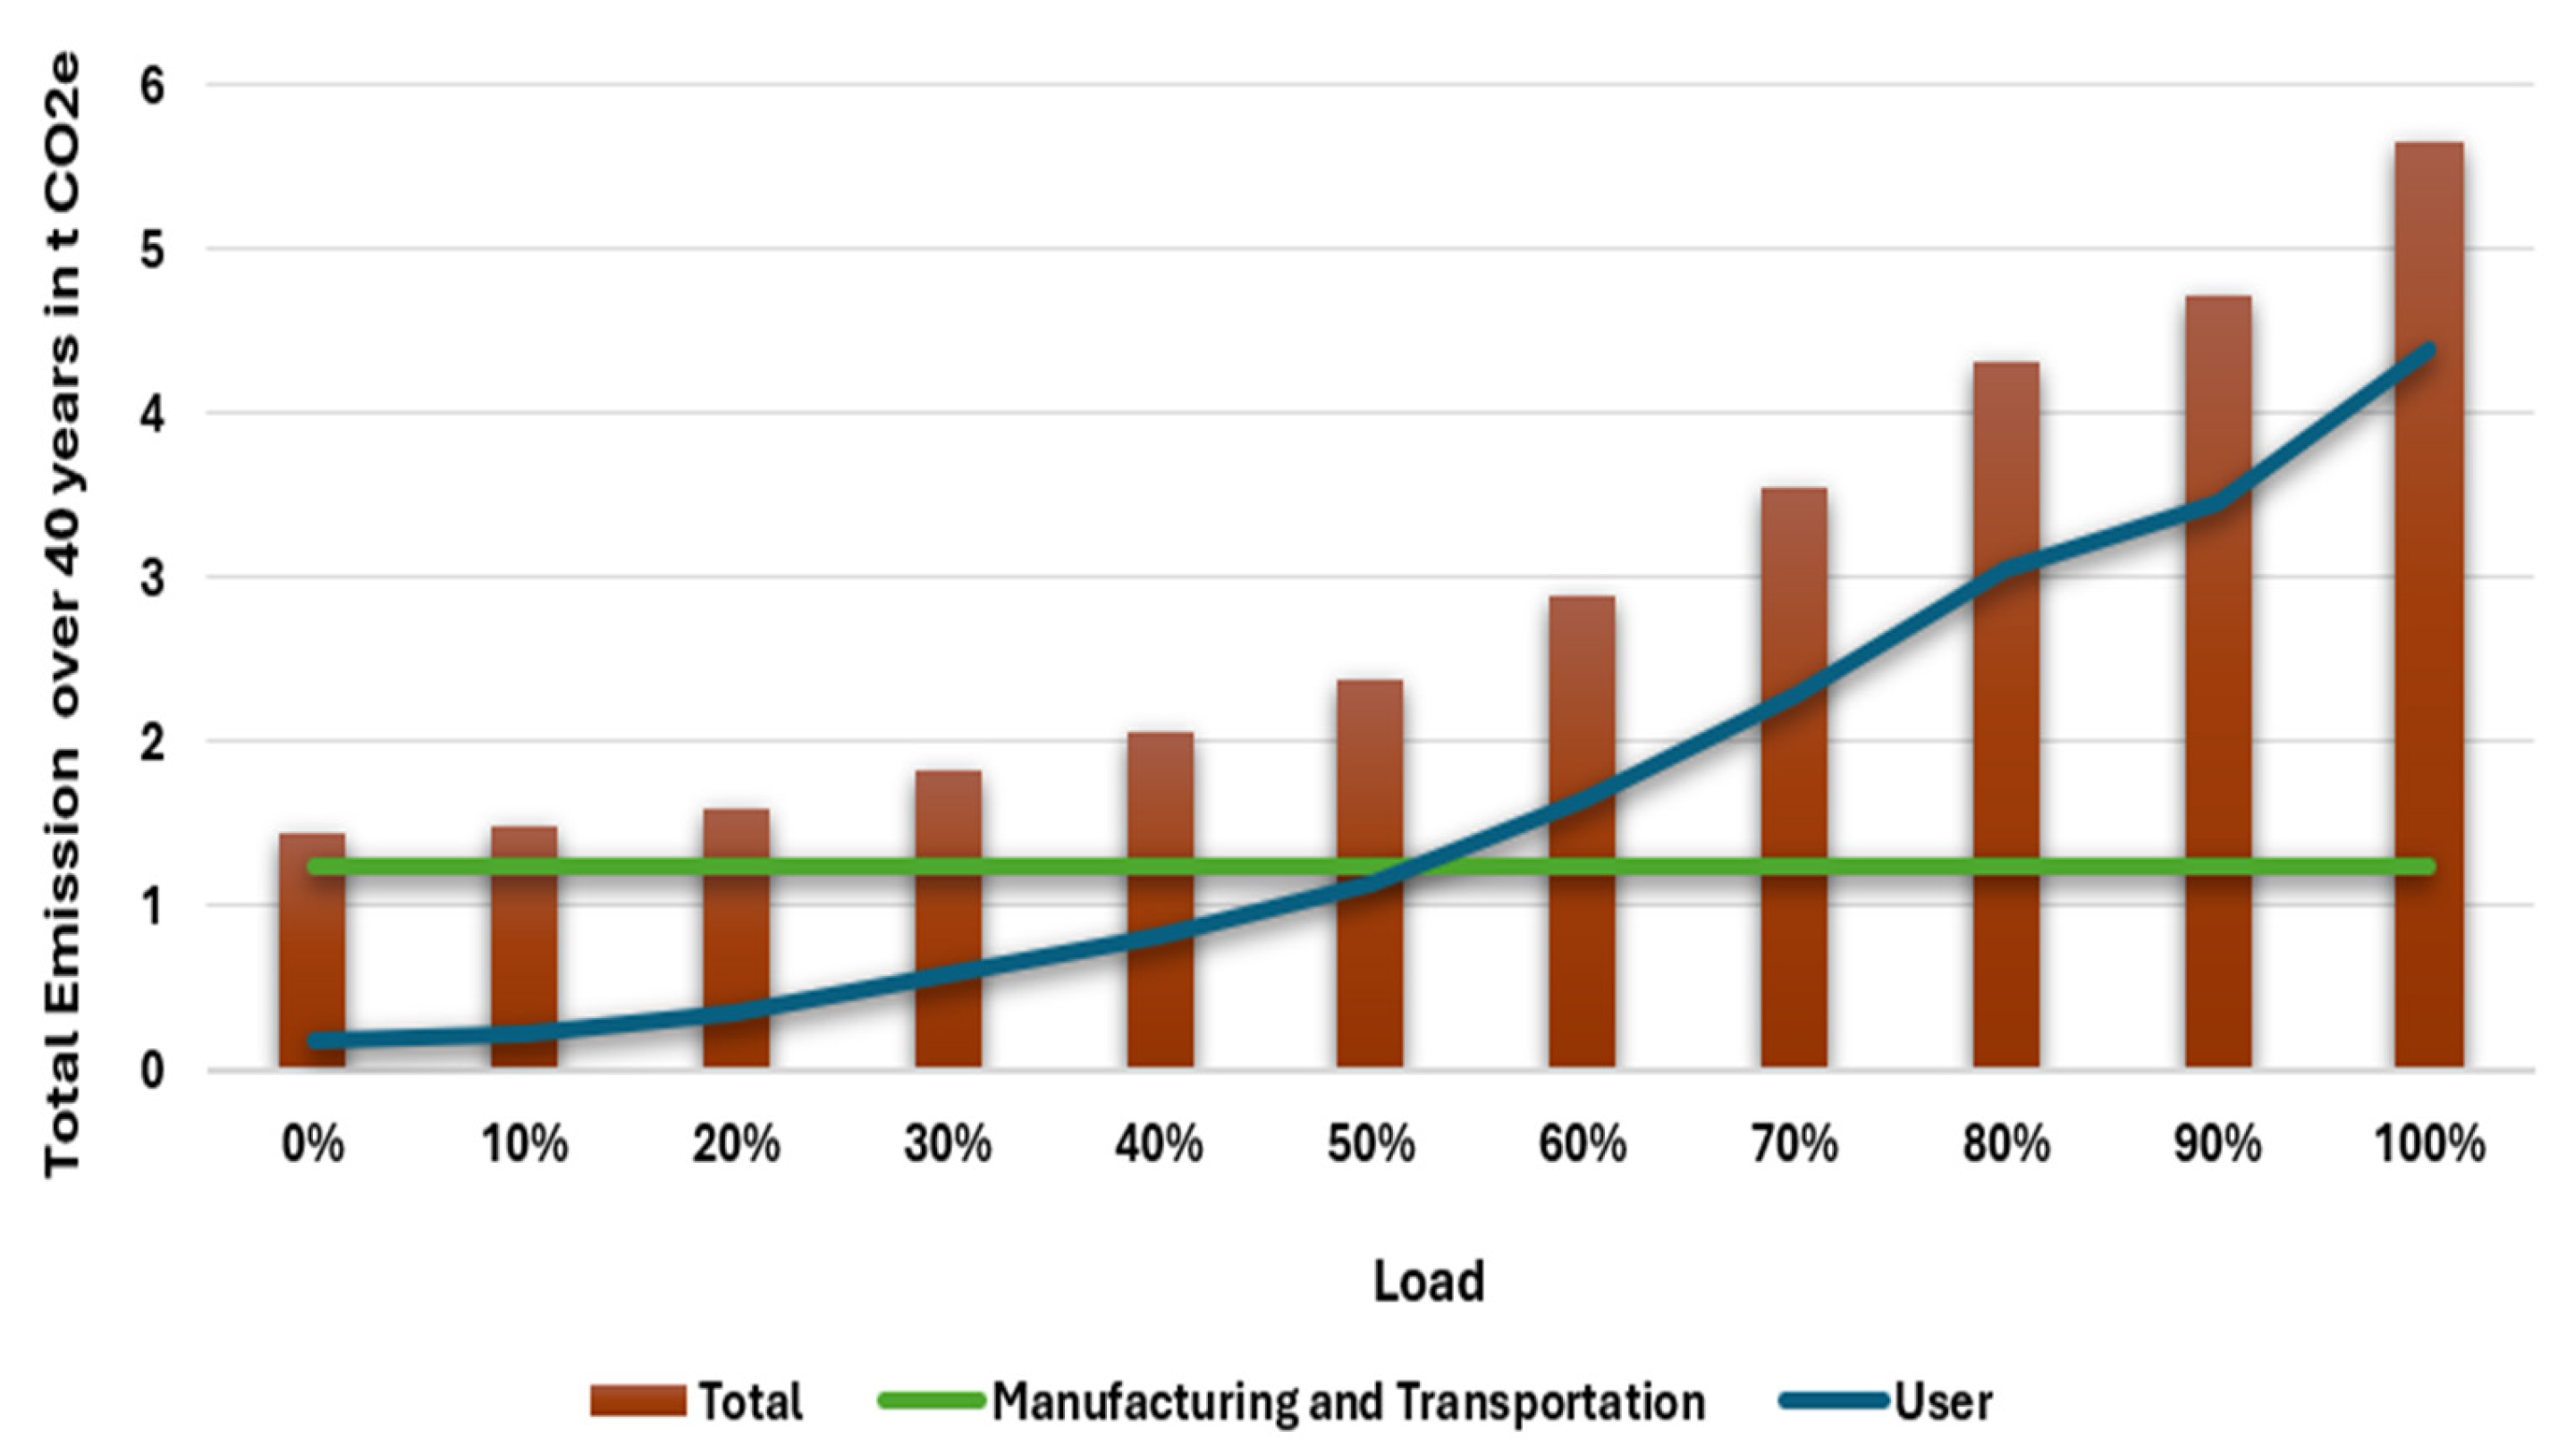
More significantly, use-phase emissions spanning a 40-year operational lifespan account for the majority of the transformer’s environmental footprint. Overall,
Figure 10 below shows that manufacturing and transportation emissions remain constant across all scenarios, contributing approximately 1.2536 t CO
2e regardless of loading, since these stages are independent of transformer utilization. In contrast, user-stage emissions increase sharply with higher loading, driven by escalating energy losses under load. At lower utilization levels, operational emissions remain modest, but they dominate the life-cycle profile as loading approaches rated capacity, reaching more than 4 t CO
2e at full loading.
The life-cycle CO
2-equivalent emissions of a 75 kVA oil-immersed distribution transformer under two operational loading scenarios, 30% and 60% evaluated over a 40-year service period, are summarized in
Table 13. Emissions are disaggregated into key life-cycle stages, including raw material extraction, transportation of materials to the manufacturing facility, manufacturing processes, transportation to the installation site, and in-service operational use.
The findings indicate that embodied emissions, encompassing material extraction (1.1025 t CO2e), upstream transportation (0.135 t CO2e), manufacturing (0.00104 t CO2e), and delivery to the site (0.0151 t CO2e), remain constant across both scenarios, yielding approximately 1.25 t CO2e in total. These stages are independent of transformer loading and therefore do not vary with operational demand.
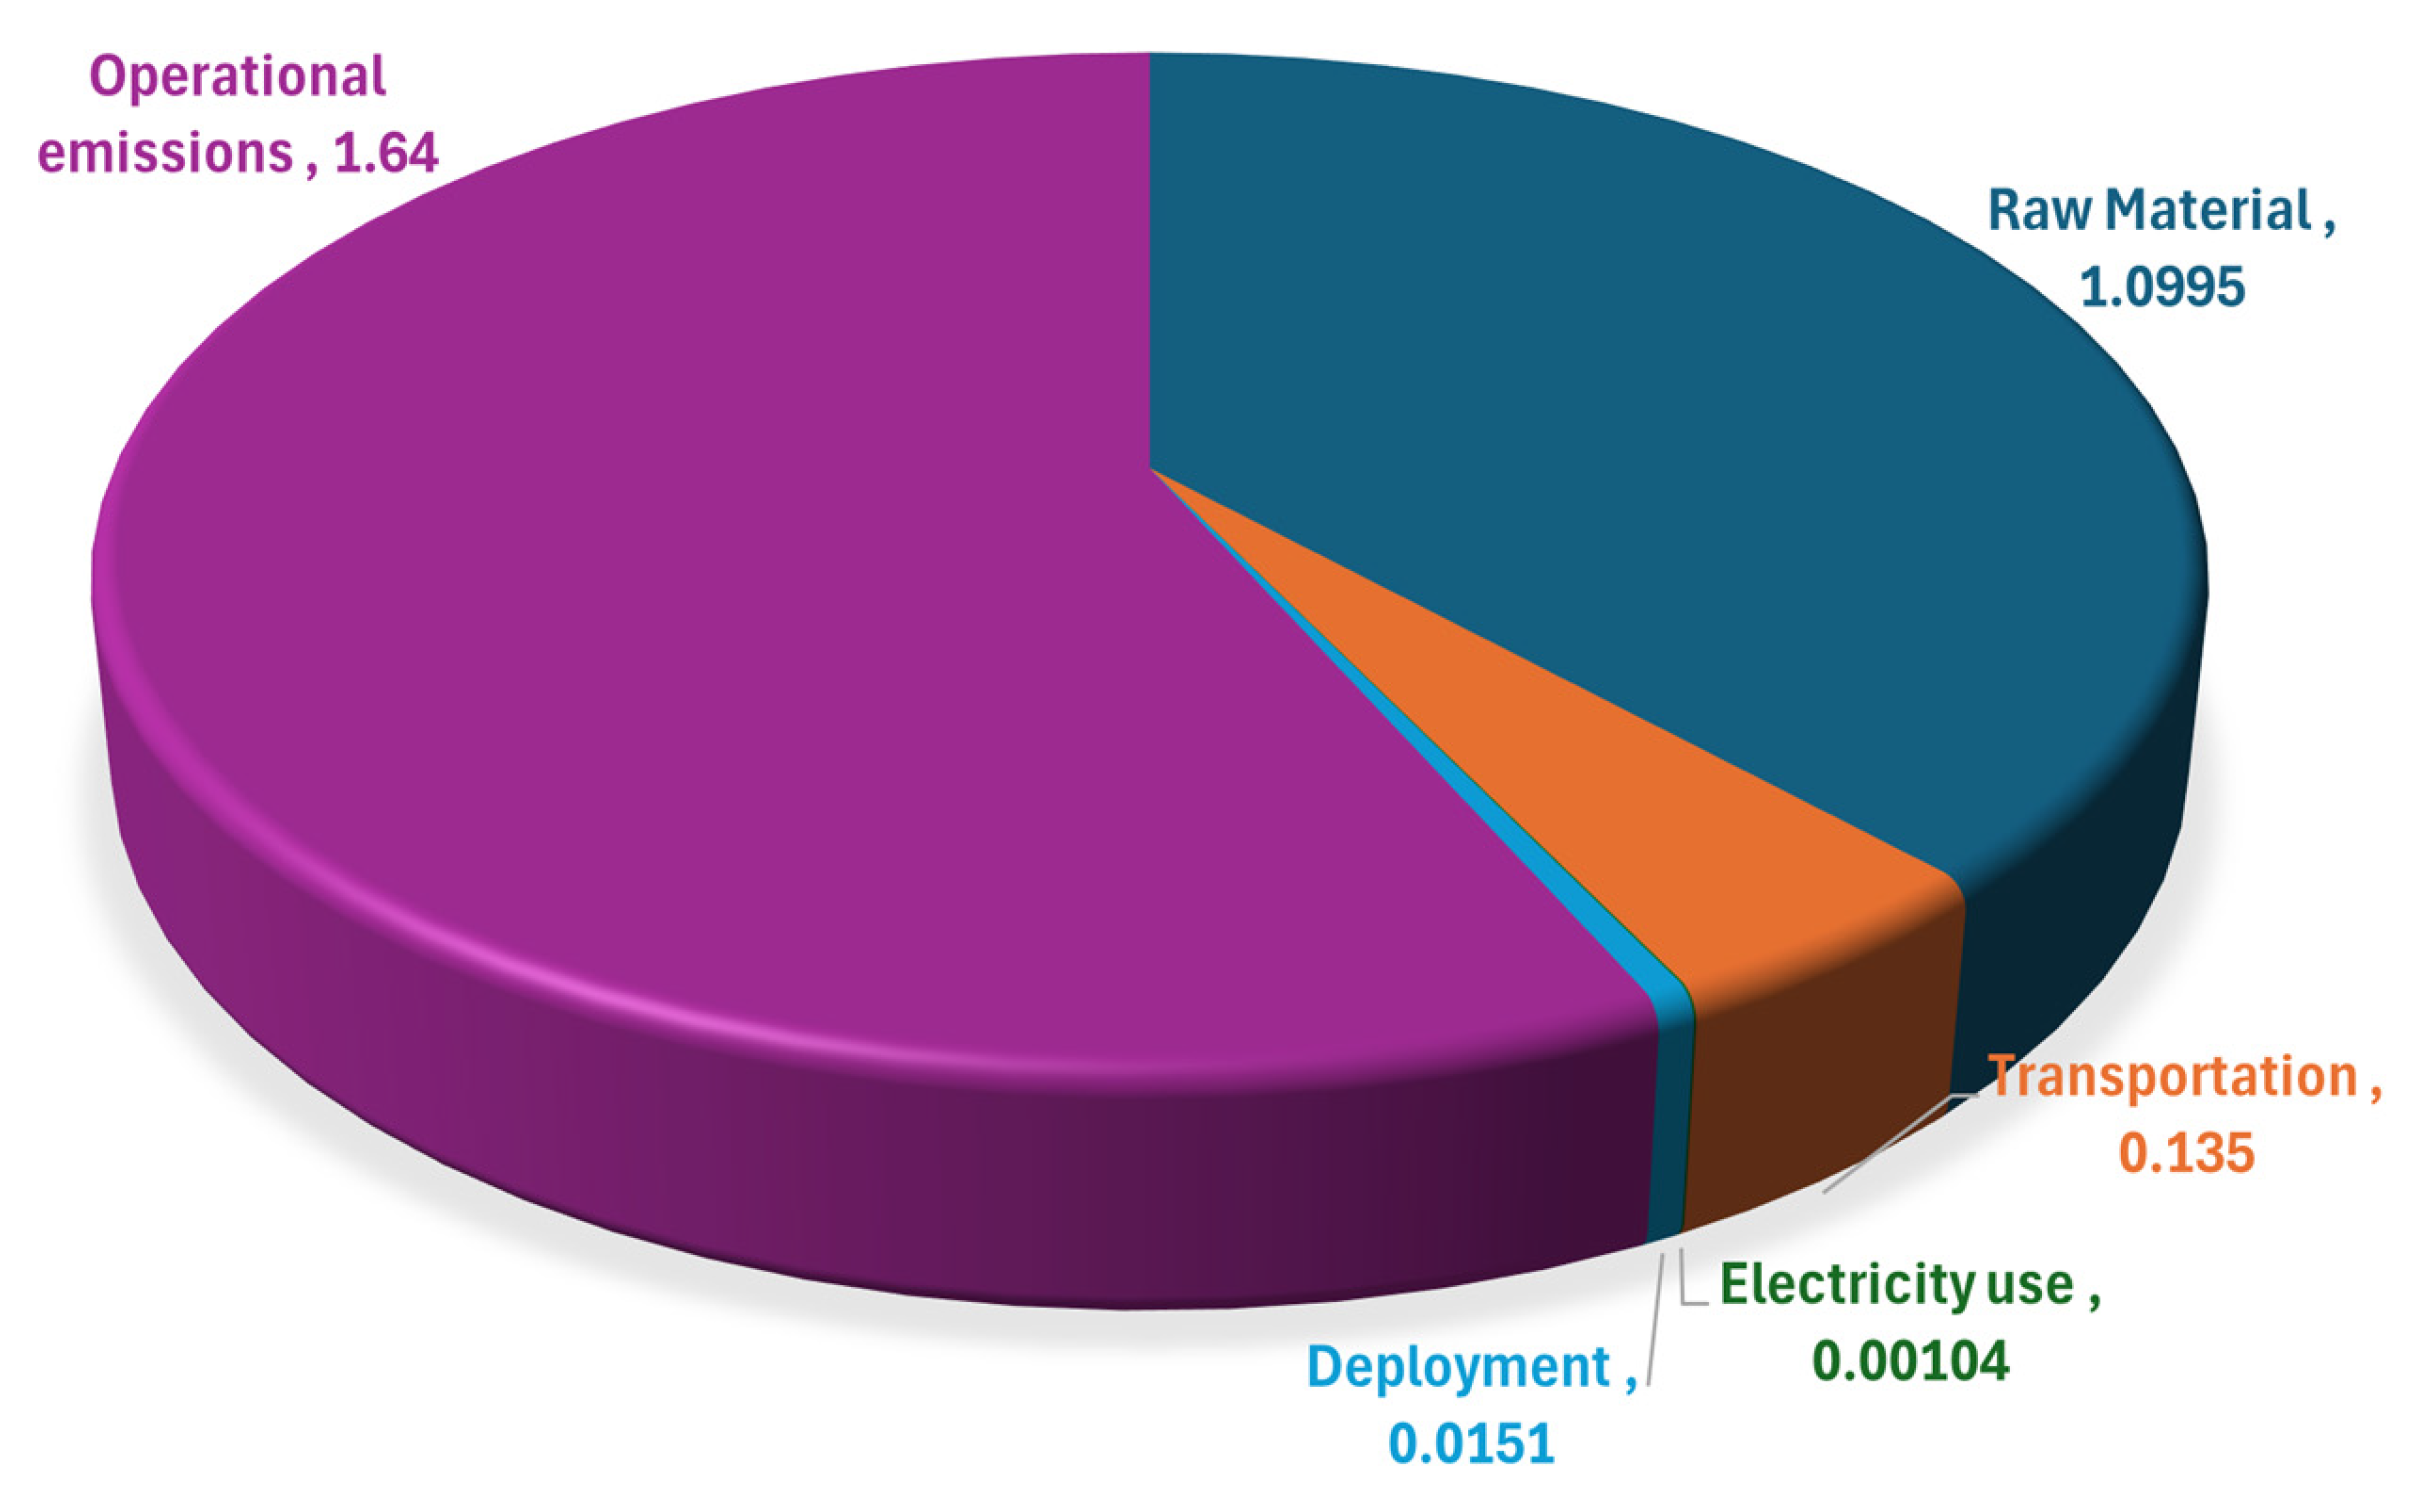
In contrast, operational emissions exhibit substantial sensitivity to loading level. At 30% load (Scenario 1), usage-related emissions are estimated at 0.58 t CO
2e, whereas at 60% load (Scenario 2), they increase to 1.64 t CO
2e, reflecting the nonlinear rise in copper losses with higher load currents. Consequently, total life-cycle emissions increase markedly from 1.83 t CO
2e to 2.89 t CO
2e between the two scenarios. This highlights the dominant influence of in-service energy losses on overall environmental impact and underscores the critical importance of appropriately sizing and managing transformer loading to minimize long-term carbon emissions.
Figure 11 below compares the total contributions from the material production phase to operational emission phases for 60% load scenario.
Although distribution transformers are mostly evaluated at the asset level in this study, it is crucial to understand that transformers function as essential nodes in interconnected systems of transportation and electricity infrastructure. Transport and decentralized load electrification can change transformer loading patterns, overloading frequency, and usage profiles, which can impact long-term environmental performance and operational losses. The results reported here offer crucial input data for such system-level studies, even though resilience-oriented, decentralized restoration solutions in coupled electricity–transportation networks are outside the scope of this work [
30].
6. Forecasting Grid Emission Intensity in Newfoundland and Labrador and Its Impact on Transformer Lifecycle Emission Scenarios
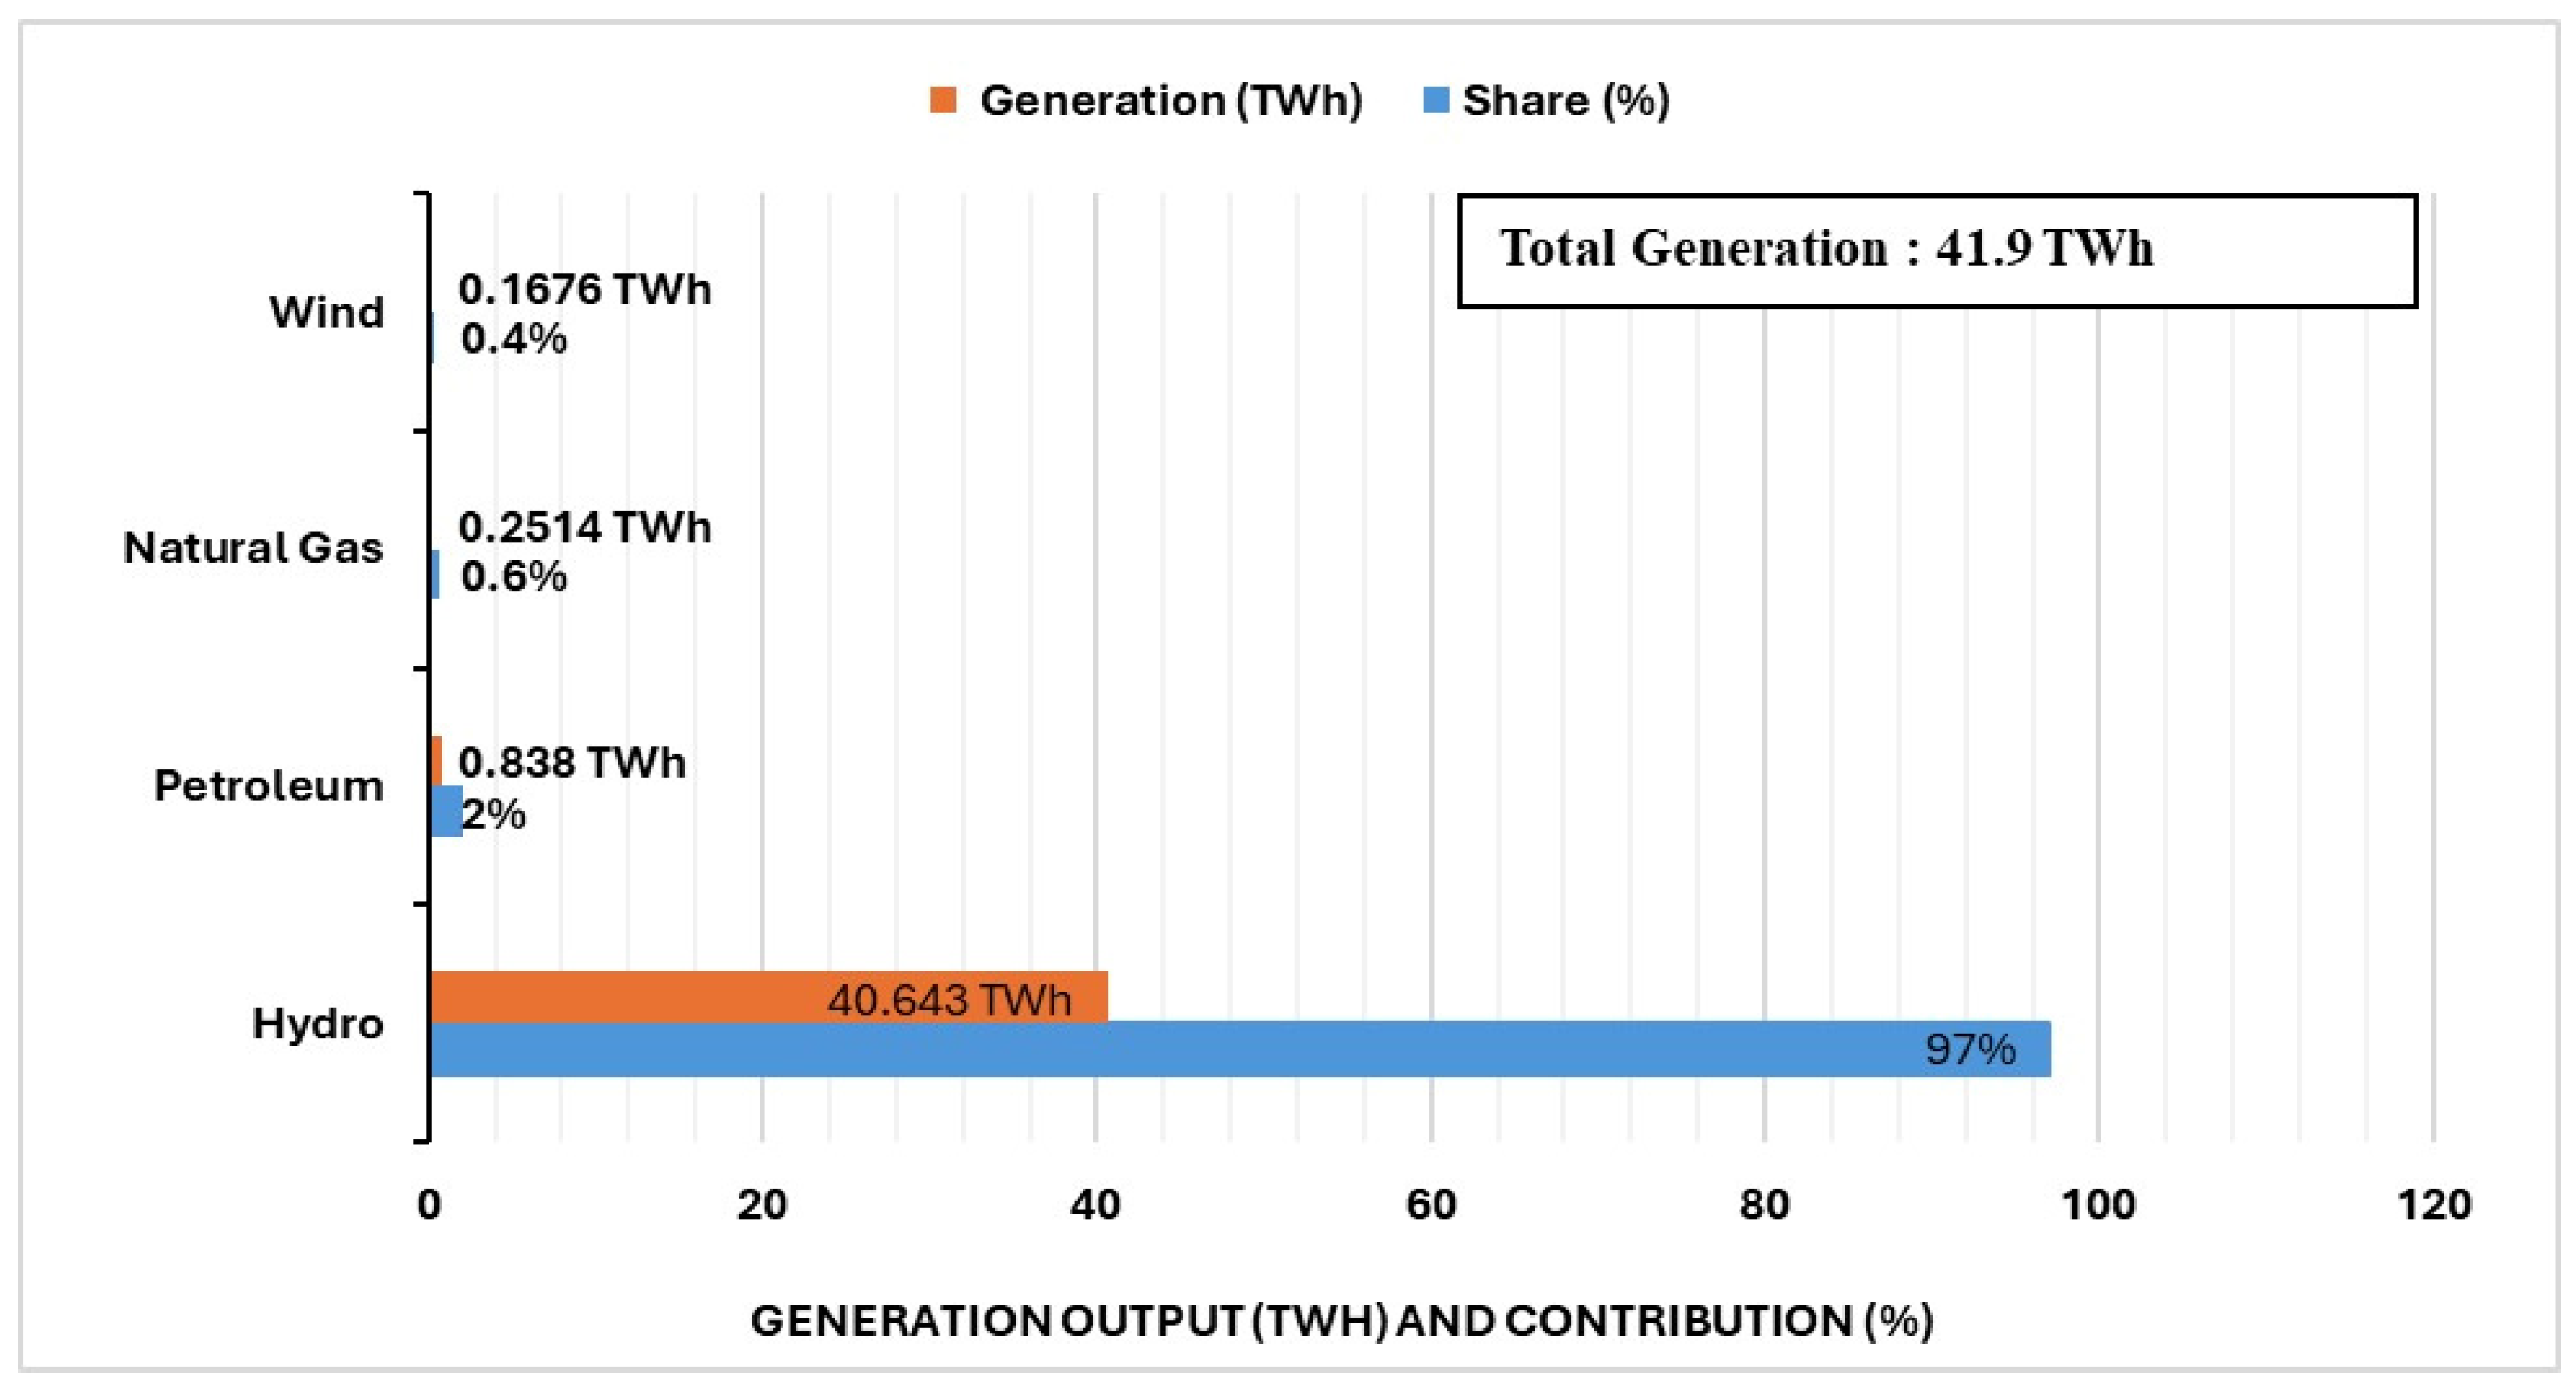
Newfoundland and Labrador possesses one of the cleanest electricity grids in Canada, with over 97% of generation derived from hydroelectric resources. The province has committed to achieving net-zero electricity-related greenhouse gas (GHG) emissions by 2035 [
18], consistent with Canada’s national decarbonization framework [
25]. In this study, two emission scenarios were analyzed to evaluate the long-term operational carbon footprint of a 75 kVA oil-immersed distribution transformer in Newfoundland and Labrador. In the first scenario, it was assumed that the CO
2-equivalent emission factor associated with the production of 1 kWh of electricity remained constant throughout the transformer’s operational lifetime. The adopted value corresponds to the grid emission factor for Newfoundland and Labrador in 2025, 18 g CO
2e/kWh, representing the baseline condition under which transformers entering service in 2025 are expected to operate over their 40-year service period.
In the second scenario, the CO
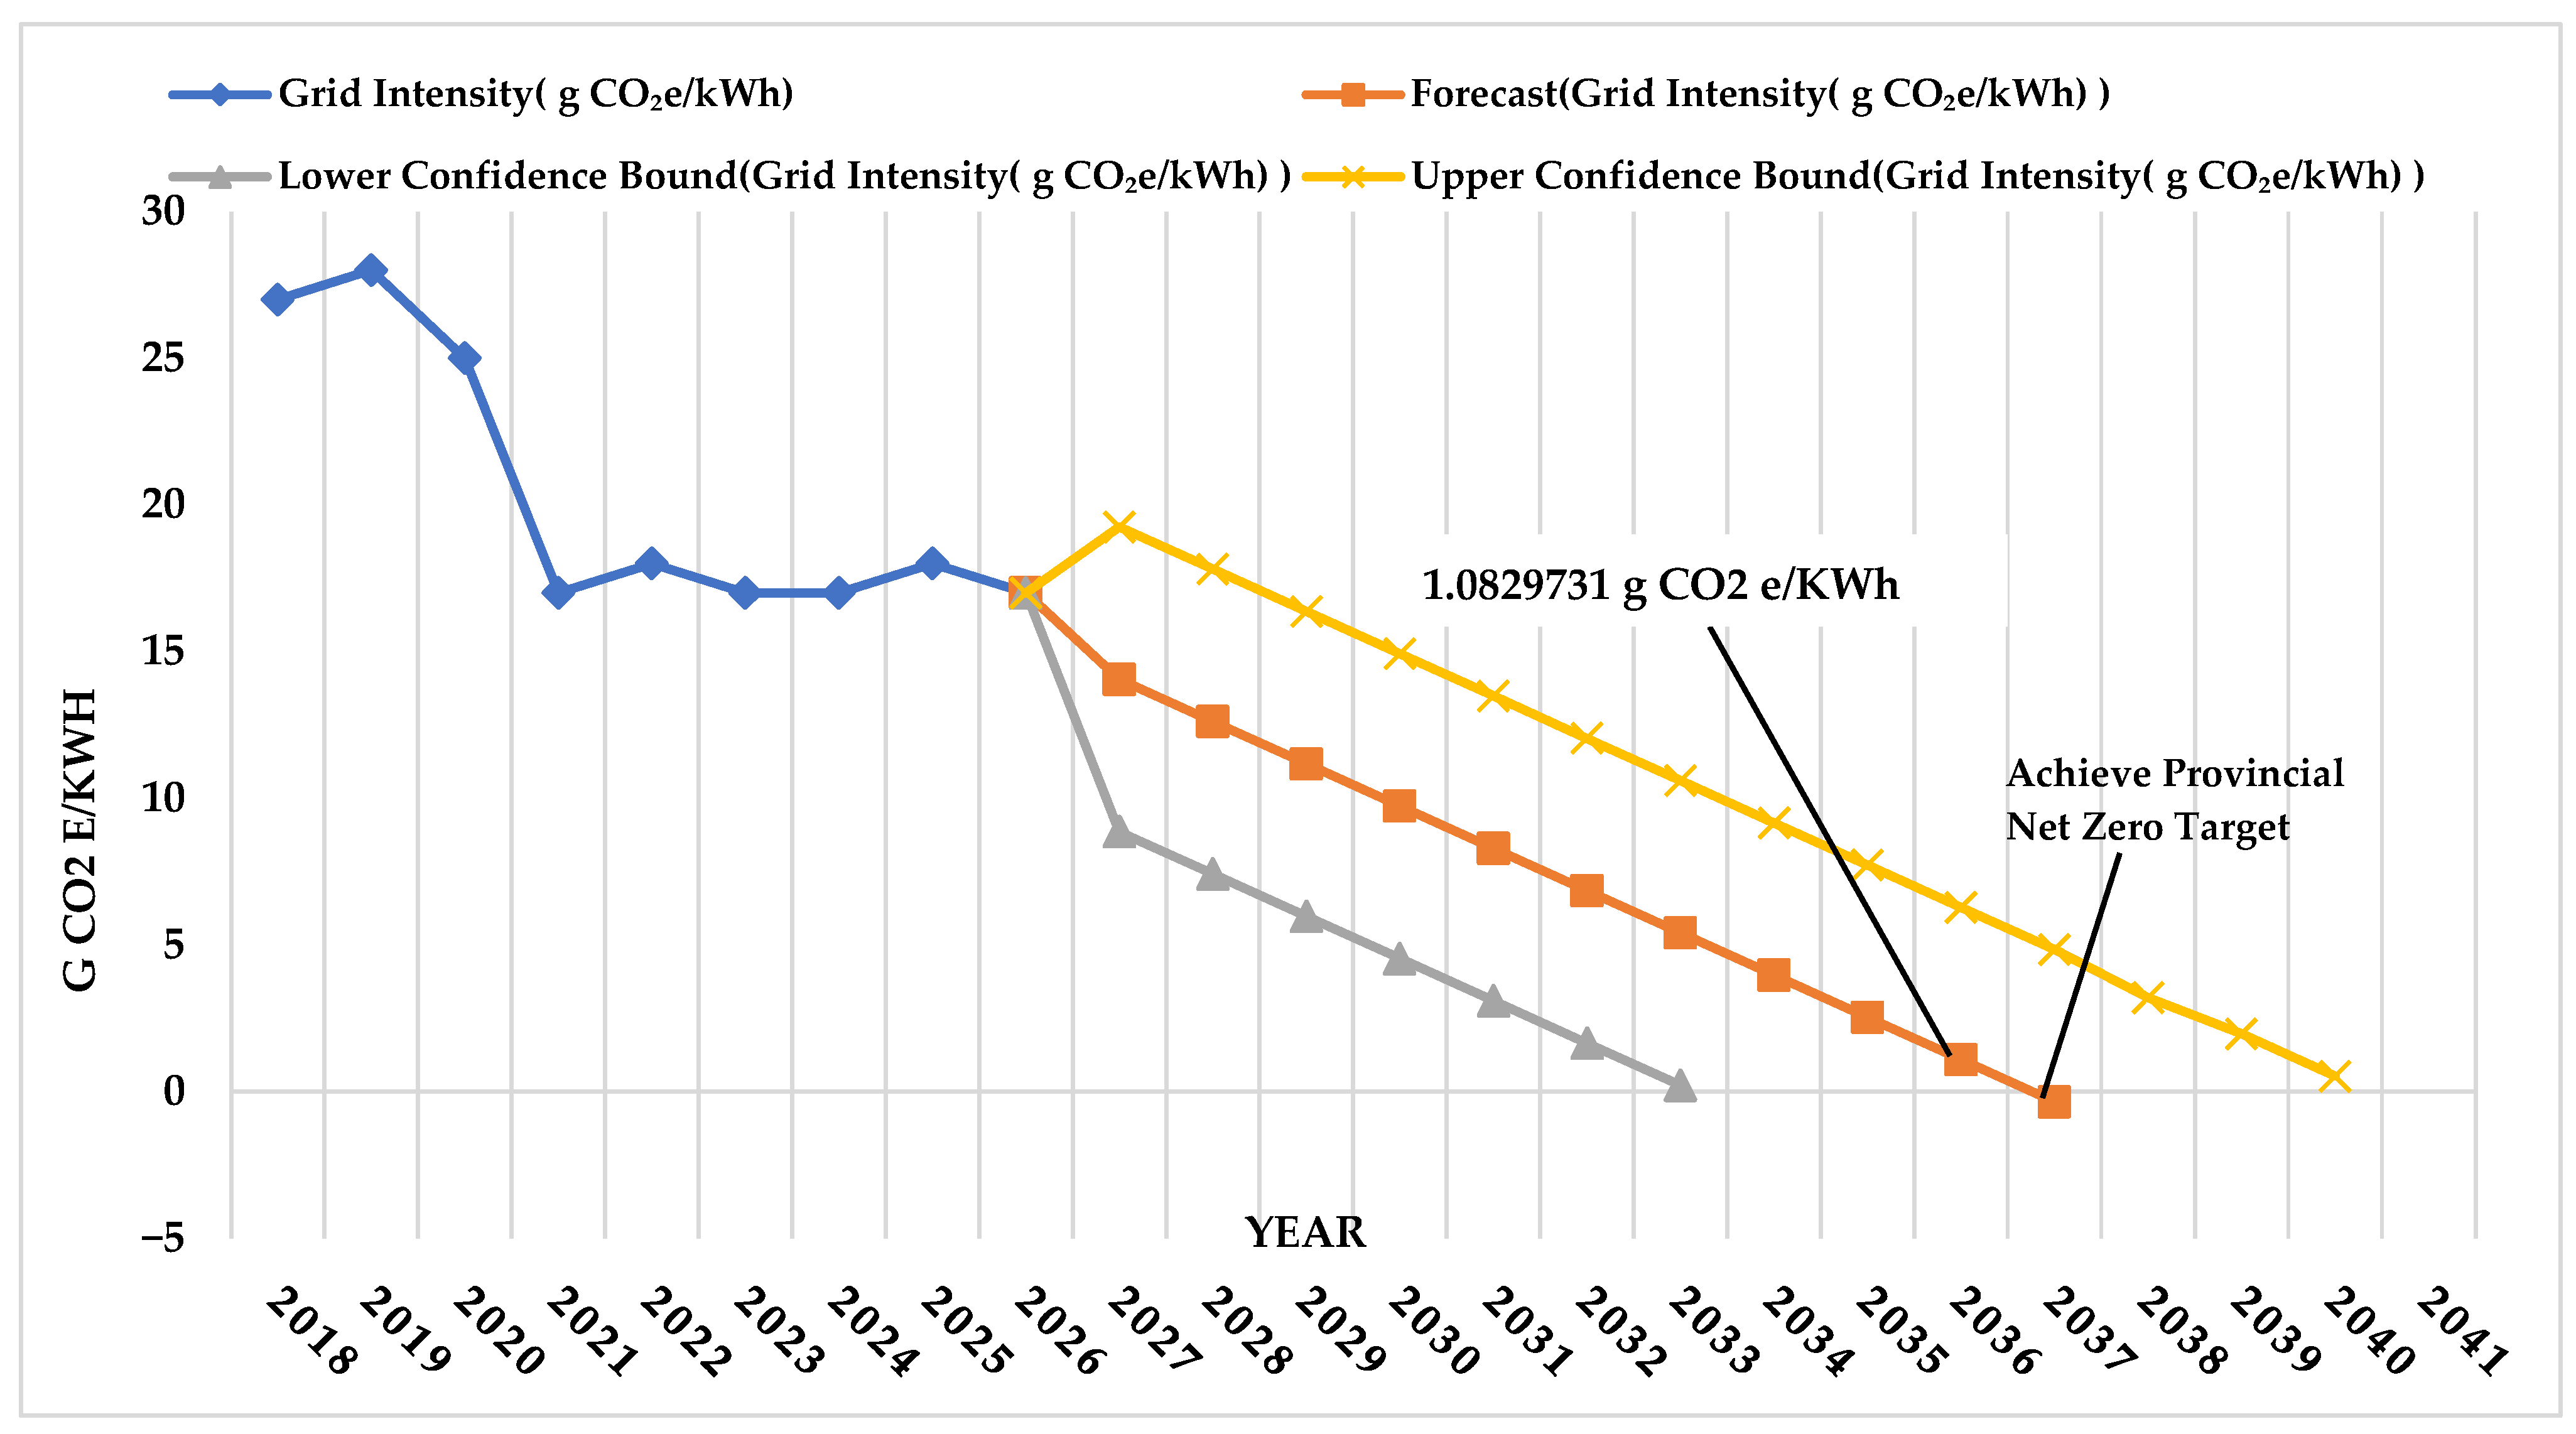
2-equivalent emission factor was assumed to vary annually in line with the province’s decarbonization trajectory. A time series of historical grid carbon intensity data for 2018–2025 was compiled from the Government of Newfoundland and Labrador and the Canada Energy Regulator databases, as demonstrated in
Table 9. Based on the available dataset, the trend in CO
2-equivalent emissions per kWh was observed to be approximately linear, reflecting steady hydroelectric expansion and renewable integration. Consequently, a linear regression model was applied to forecast changes in grid intensity for the period 2026–2065, directly linked to the province’s energy transition pathway.
The forecast was generated using Microsoft Excel’s regression tool, assuming a non-seasonal dataset and a consistent annual rate of decline in grid carbon intensity. To assess forecast reliability, 95% confidence interval bounds were calculated and plotted to reflect potential fluctuations in decarbonization rates.
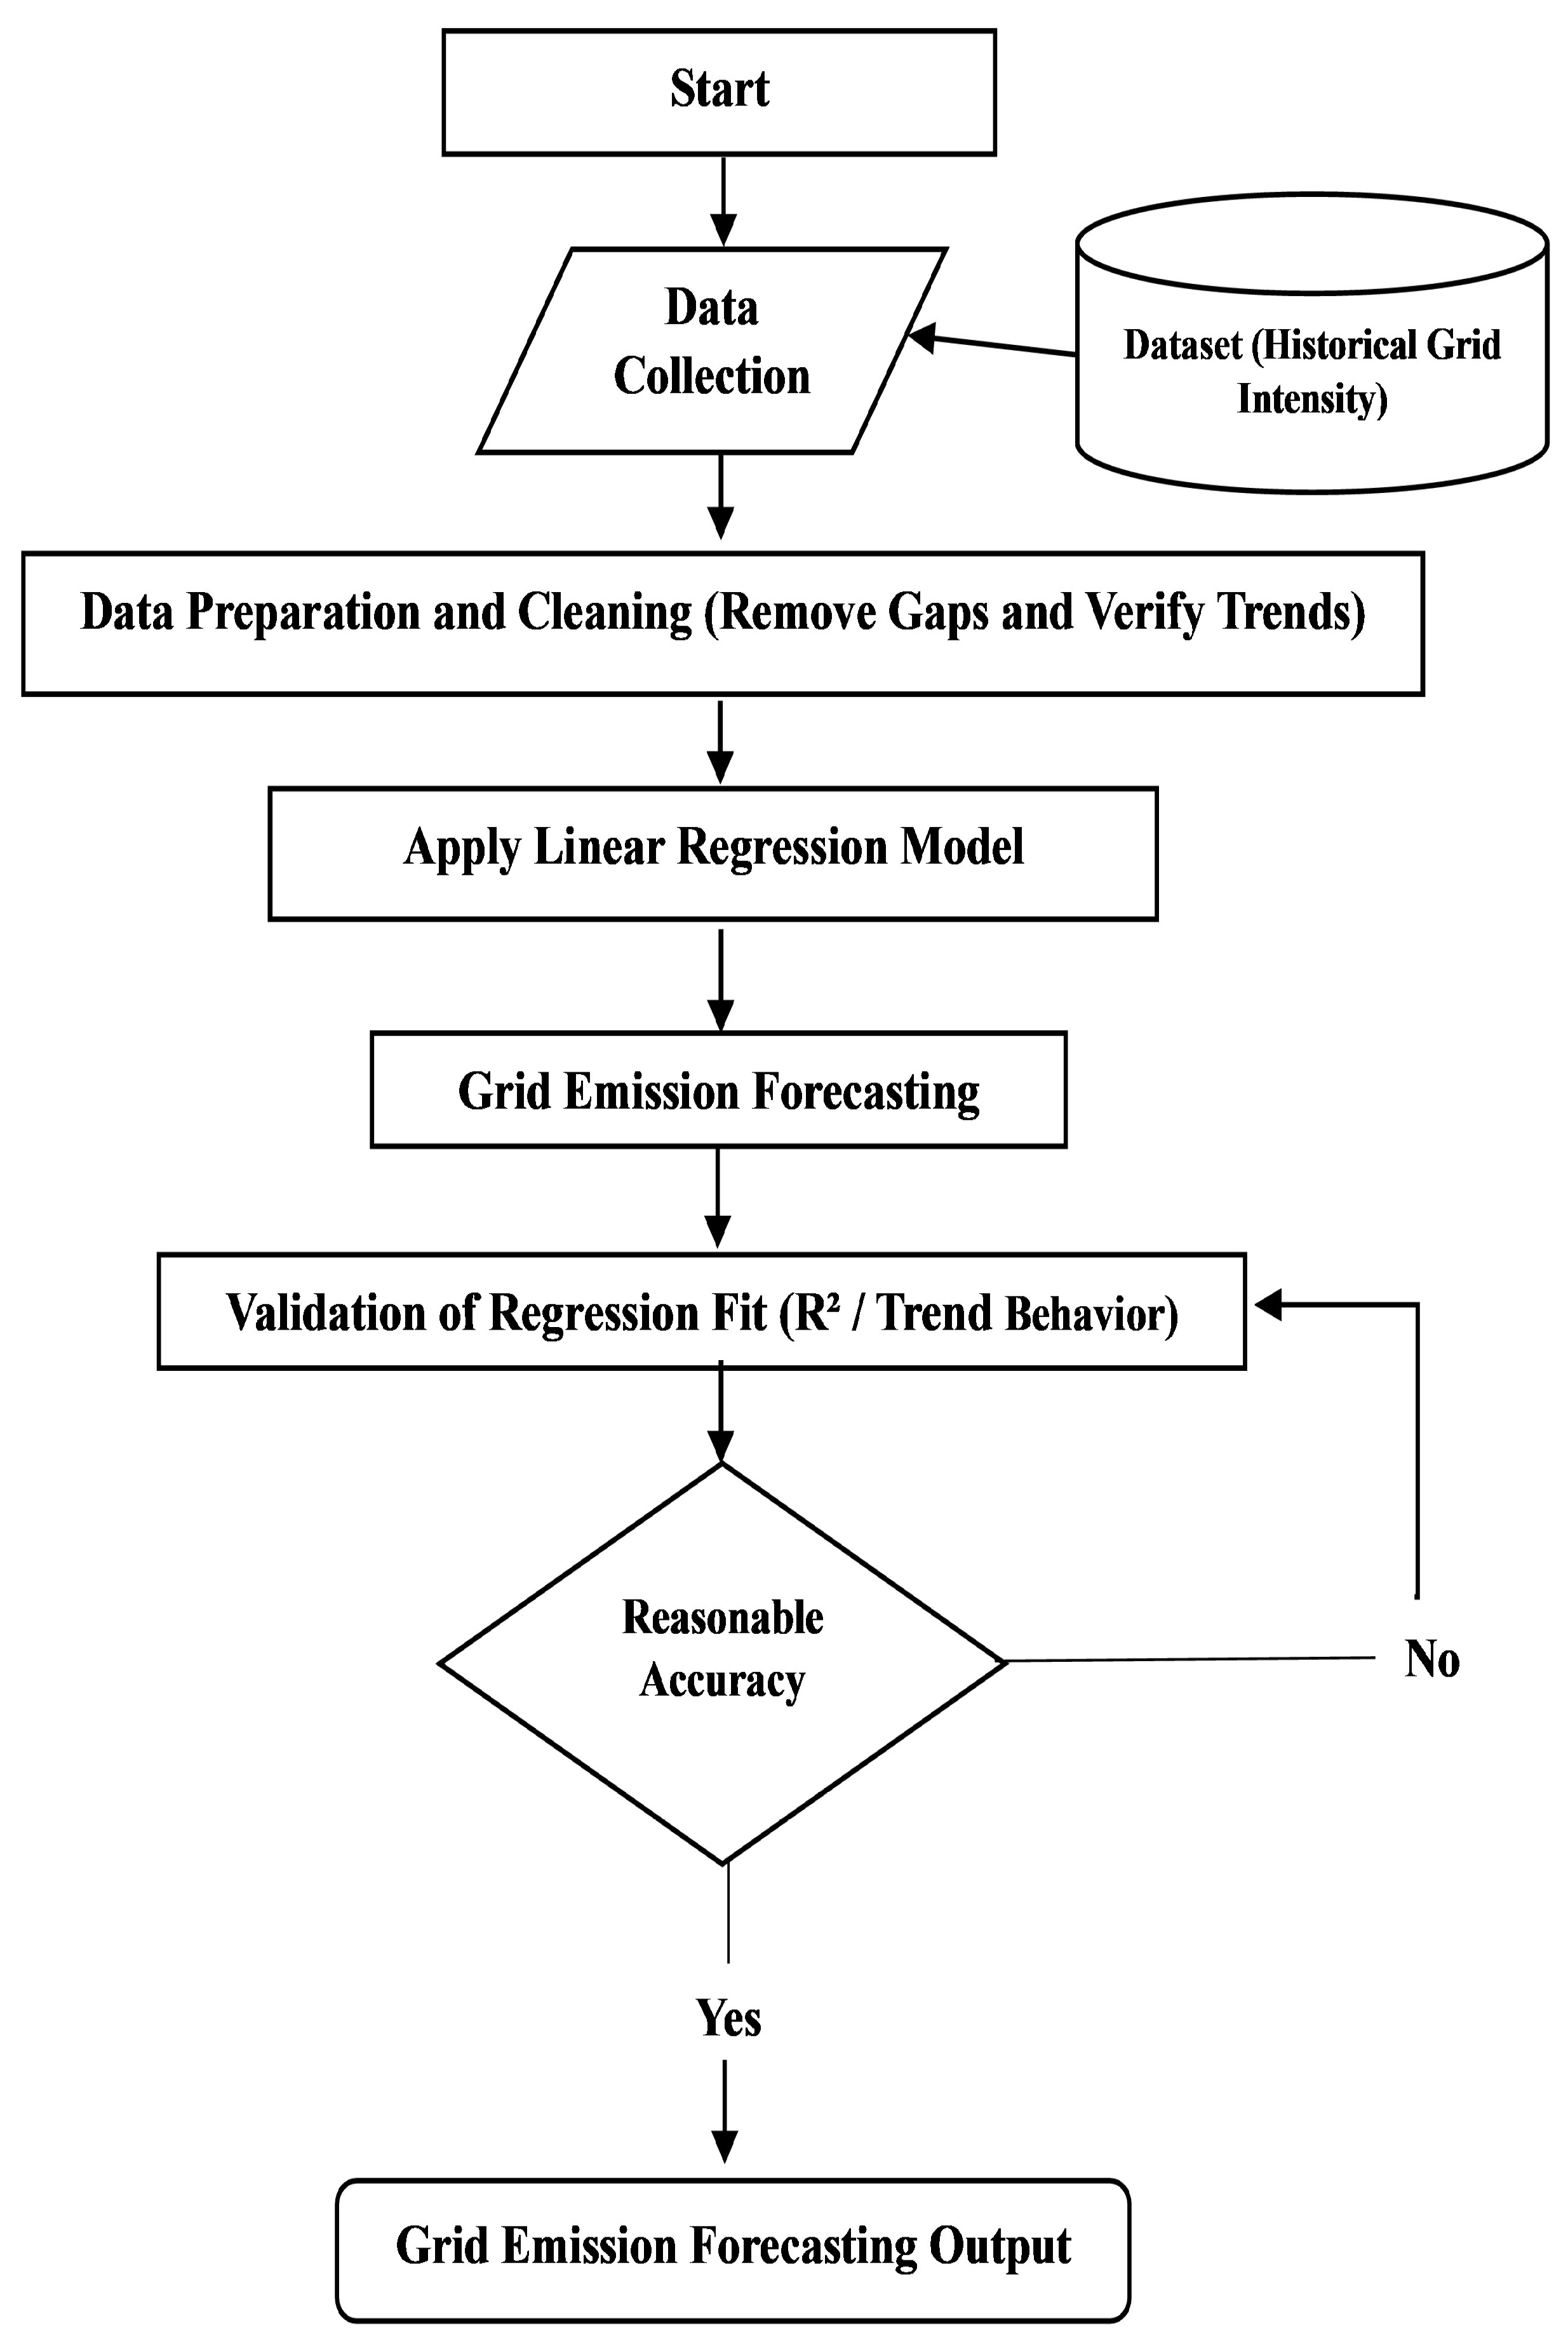
The forecasting technique illustrated in
Figure 12 begins with data collection, where historical grid-intensity data are compiled [
2]. The dataset then undergoes data preparation and cleaning, including removal of gaps and verification of temporal trends to ensure data consistency. Next, a linear regression model using Microsoft Excel is applied to the cleaned dataset to generate the initial grid emission forecasting output. The resulting regression fit is evaluated through validation checks, including analysis of the coefficient of determination (R
2) and examination of the trend behavior. If the model does not meet the required accuracy threshold, the procedure loops back for reassessment and adjustment. Once reasonable accuracy is confirmed, the final grid emission forecasting output is produced. This flowchart summarizes the systematic workflow implemented using Microsoft Excel’s forecasting tool.
The results, illustrated in
Figure 13, project a gradual decrease in grid emissions from 18 g CO
2e/kWh in 2025 to nearly zero by 2036, aligning closely with Newfoundland and Labrador’s official target of achieving net-zero electricity emissions by 2035 [
18]. However, the model indicates a minor lag of approximately two years, predicting net-zero by 2037, which is likely attributable to uncertainties in hydroelectric output variability, renewable energy commissioning schedules, and interprovincial power exchanges. Although linear regression is used to project the decarbonization trend, grid emission intensity is conservatively capped at zero beyond the projected year of net-zero emissions to avoid non-physical negative emission values.
Even after Newfoundland and Labrador reaches net-zero grid emissions, transformer losses persist; however, the carbon intensity of electricity becomes zero, meaning that operational losses no longer produce CO
2e. Thus, post-2035 operational emissions are assumed to be negligible, and lifecycle impacts are driven primarily by embodied factors [
25]. The analysis confirms that Newfoundland and Labrador’s grid will maintain one of the lowest carbon intensities in North America over the forecast horizon, ensuring an ultra-clean electricity supply that significantly mitigates transformer operational emissions in both industrial and residential applications
To complement this,
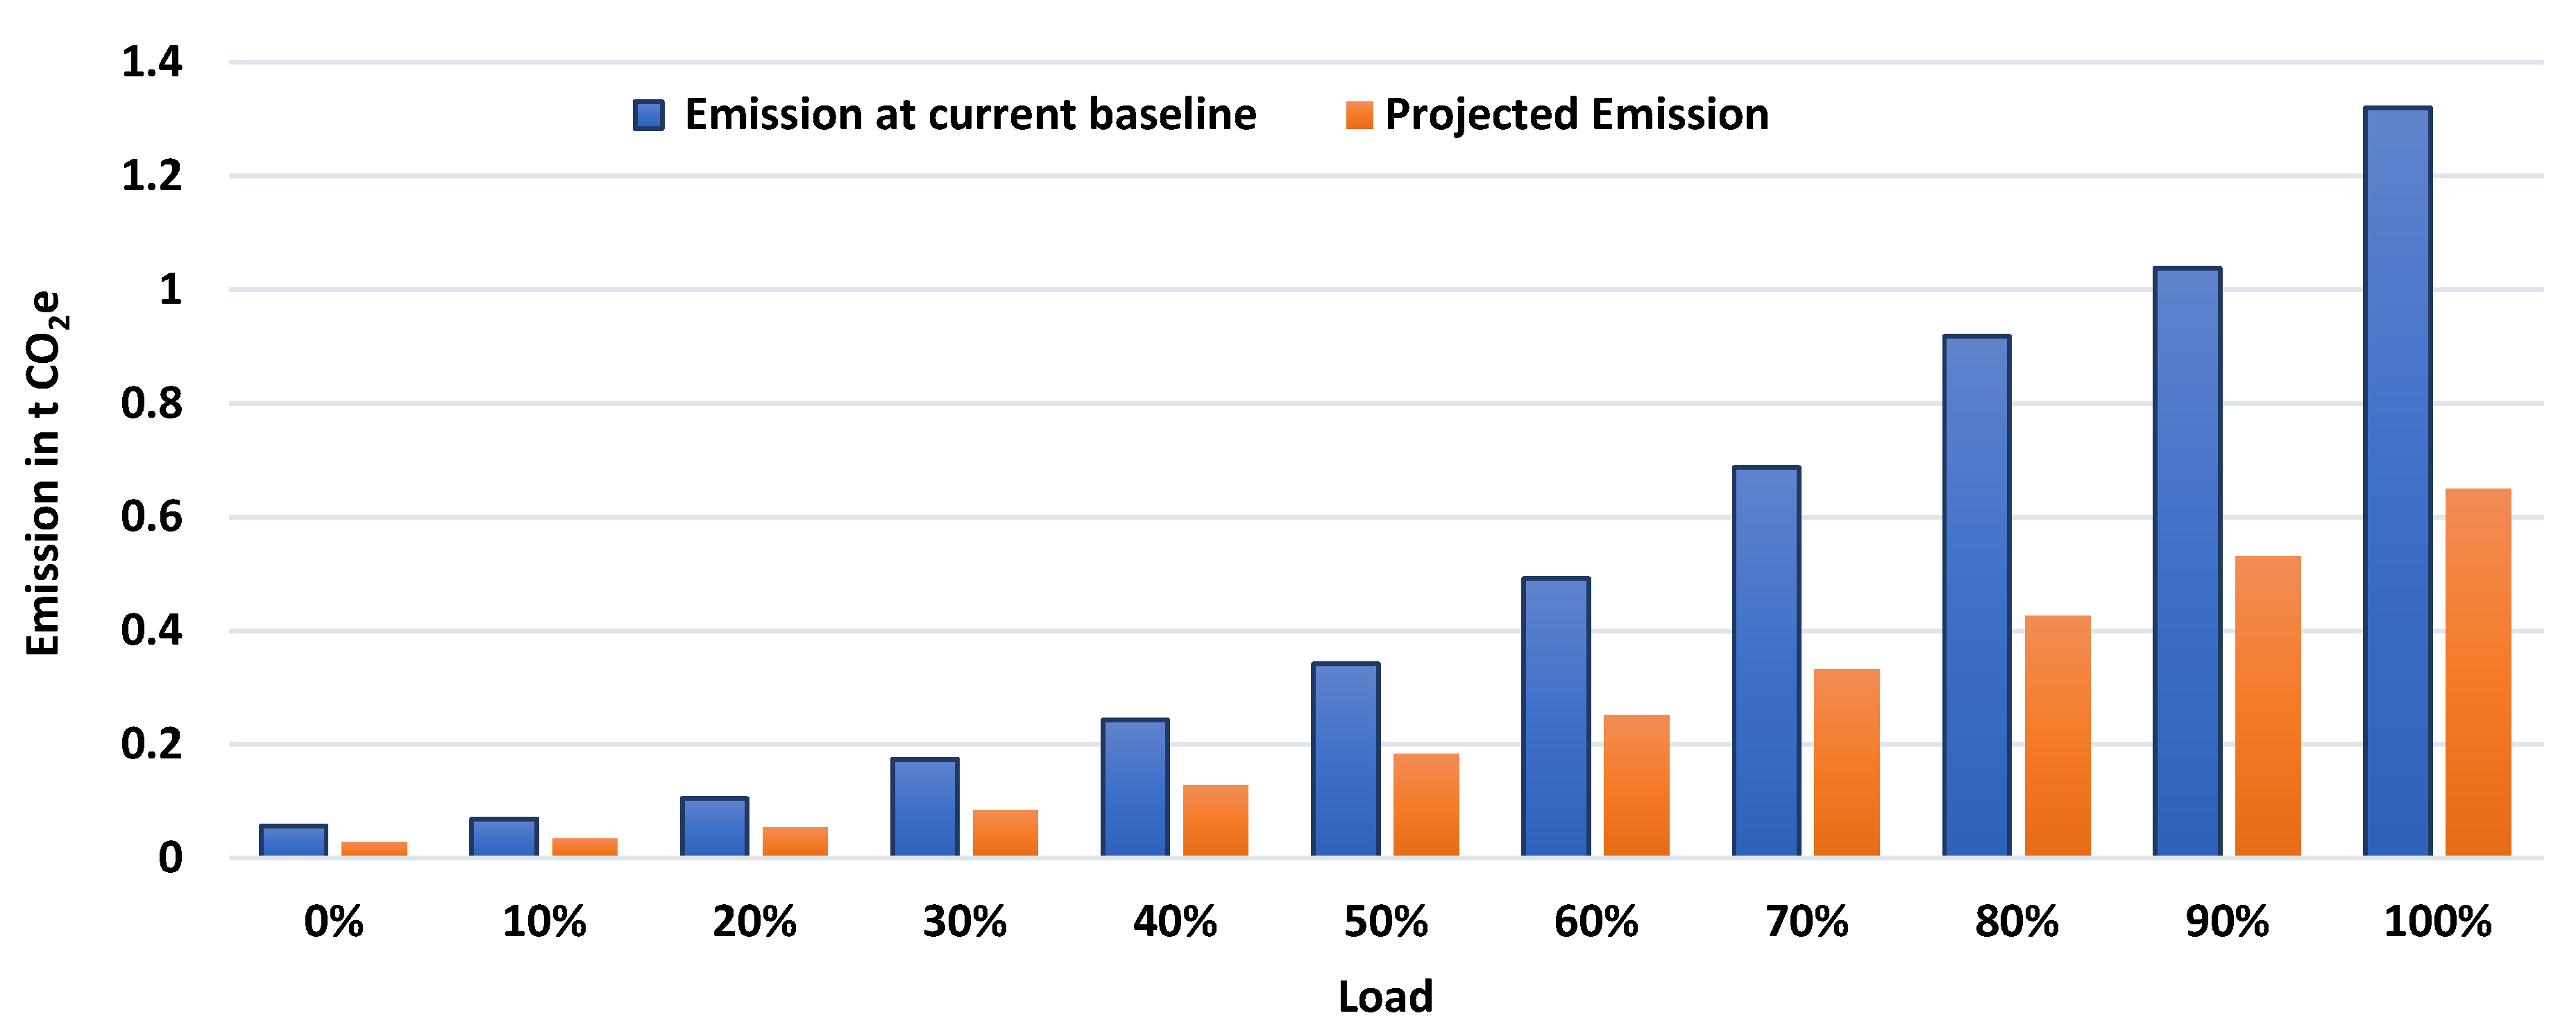
Figure 14 compares two operational scenarios under varying load for the 75 kVA transformer:
Case 1 (Fixed Emission Scenario): constant grid intensity (18 g CO2e/kWh) over the next 12 years (2025–2036) until the Newfoundland grid achieves Net-Zero in 2037.
Case 2 (Dynamic Emission Scenario): incorporating the time-varying grid intensity forecast, showing a sharp decline in operational emissions over 12 years (2025–2036).
The emissions under the current grid baseline reflect today’s carbon intensity of approximately 18 g CO2e/kWh. Under this condition, emissions increase steadily with loading, rising from 0.057 t CO2e at no load to 1.32 t CO2e at full load over the next 12-year (2025–2036) operating period.
The corresponding emissions are projected using forecasted grid-intensity values for 2025–2036, which decline significantly due to increased penetration of clean hydroelectricity. With this decarbonized grid, emissions are substantially reduced at all loading levels, from 0.029 t CO2e at no load to 0.649 t CO2e at full load, representing roughly a 45–55% reduction in operational carbon impact.
These findings show that as the provincial grid moves closer to net-zero electricity, the focus of sustainability planning must shift toward reducing embodied emissions. Efforts such as adopting lower-carbon materials, improving recyclability, expanding refurbishment practices, and encouraging more localized manufacturing will become increasingly important. Such measures not only support Newfoundland and Labrador’s clean-energy transition but also contribute meaningfully to Canada’s broader objective of reaching a net-zero economy by 2050 [
18].
8. Comparative Assessment of Carbon Intensity Between Newfoundland’s Hydro-Dominated Grid and Fossil Fuel Dependent Provinces: Alberta, Saskatchewan, and Nova Scotia
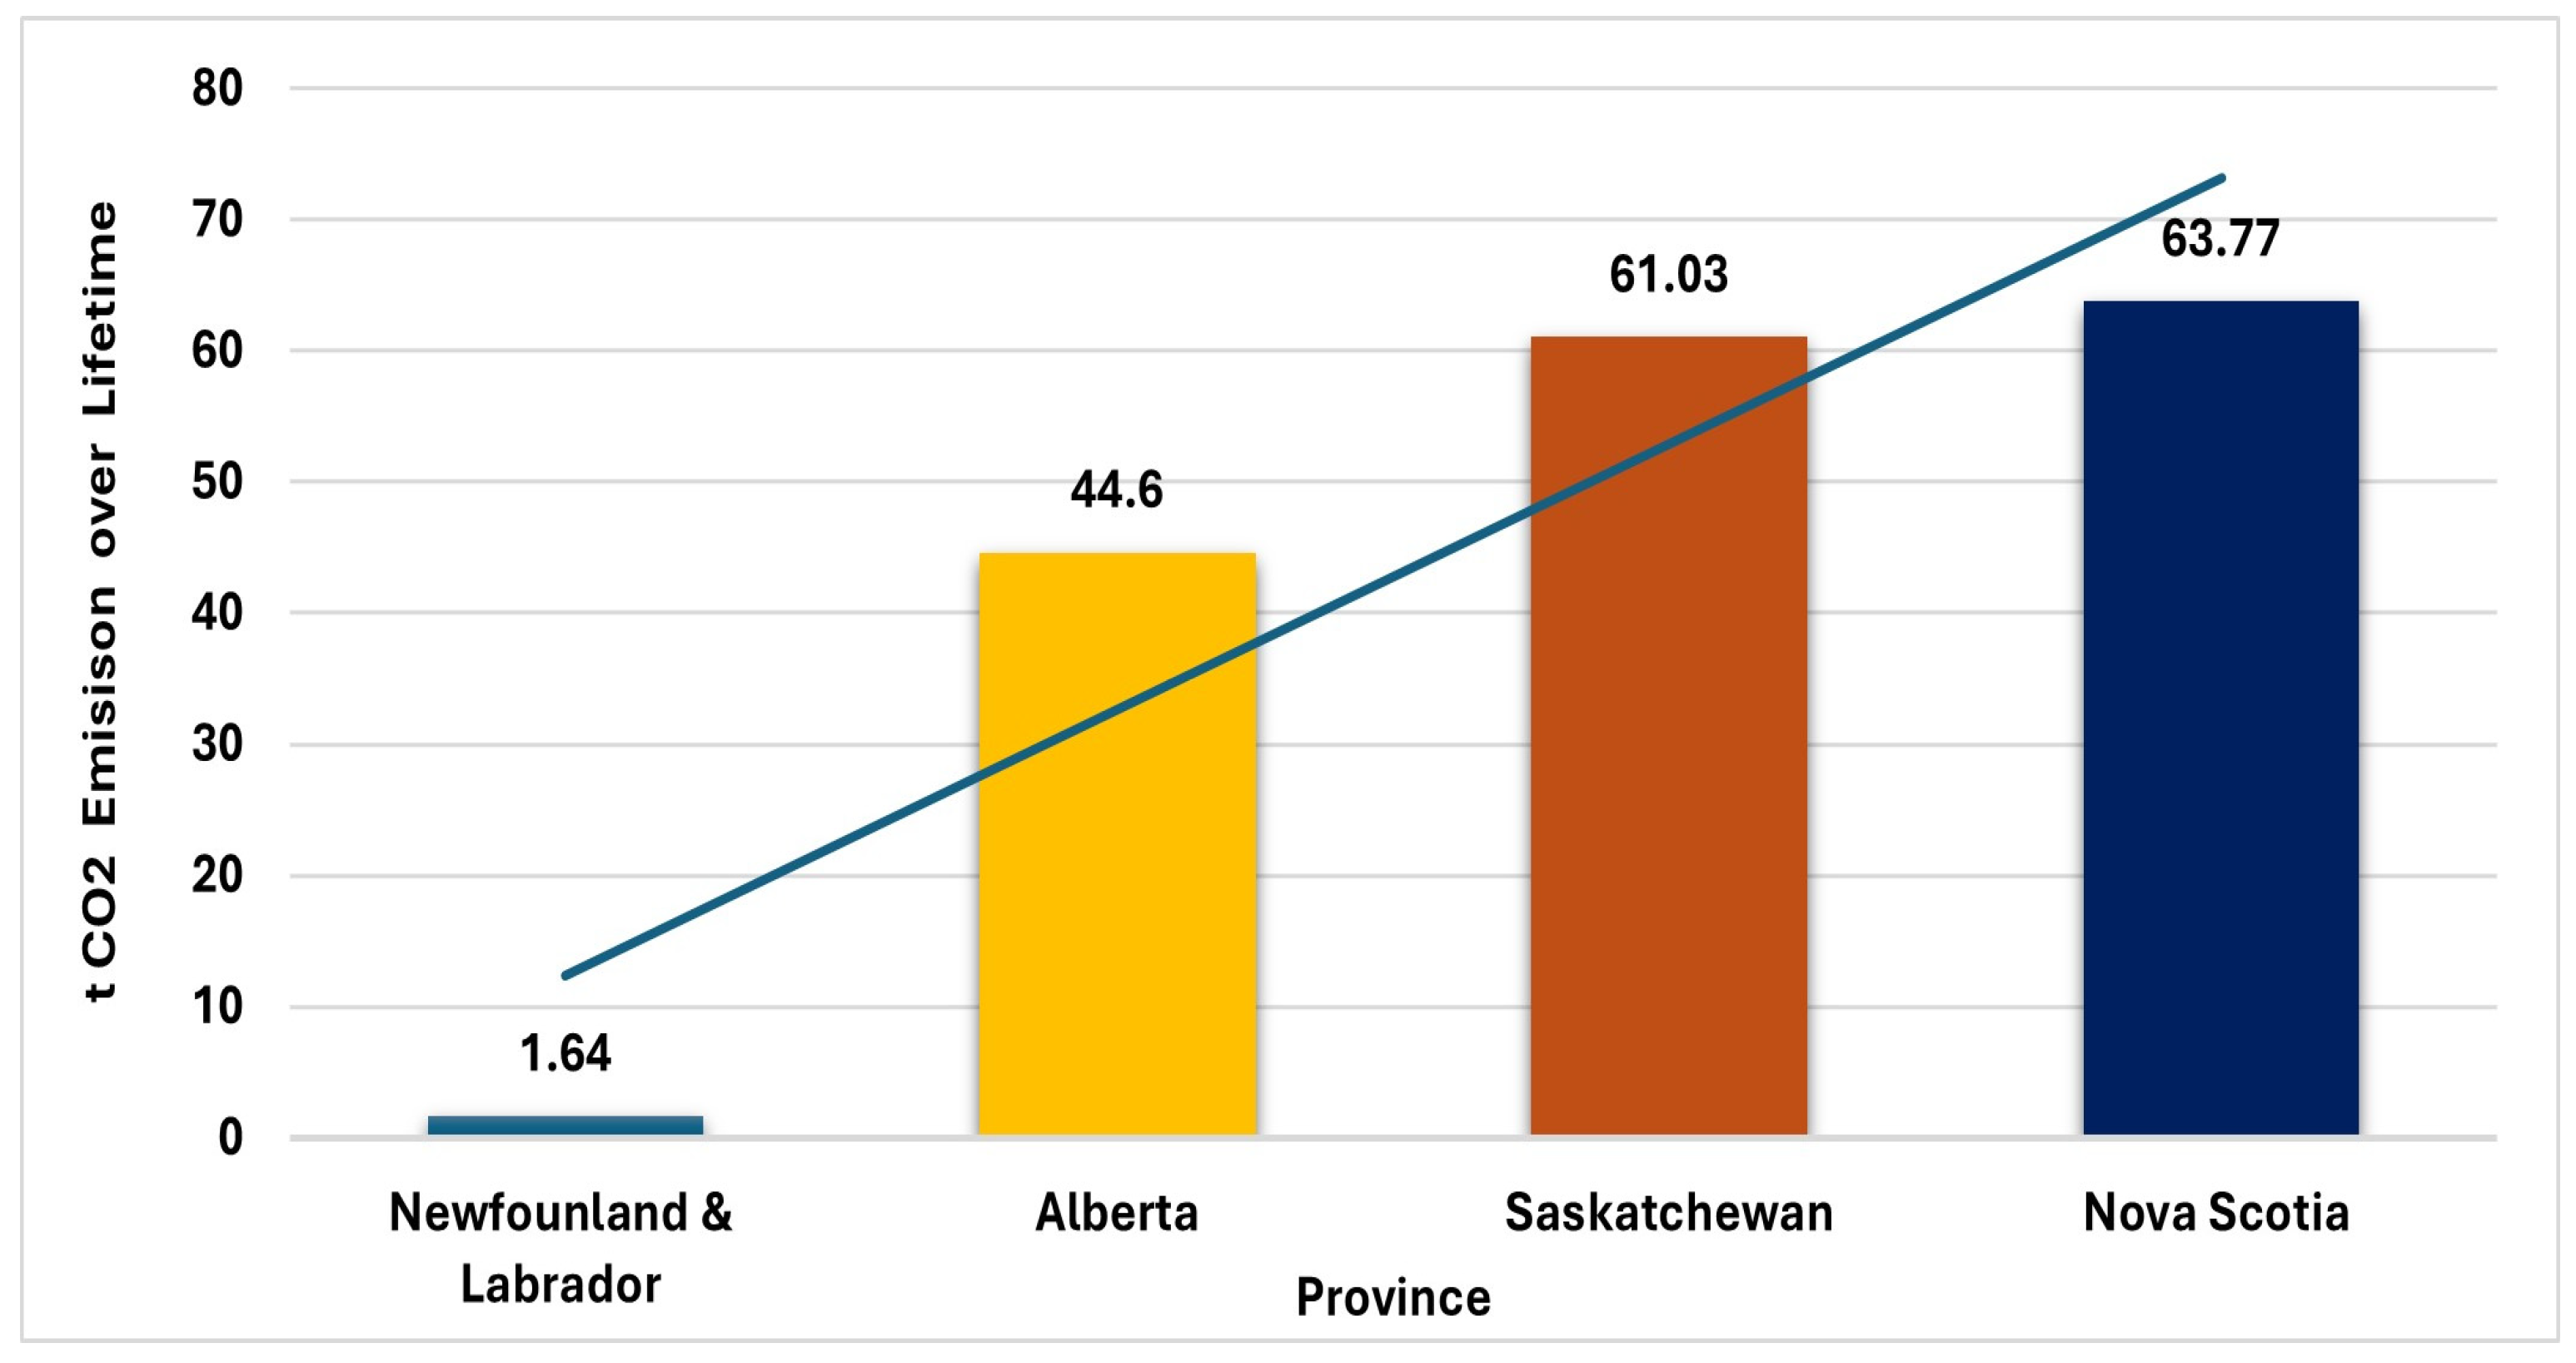
Newfoundland and Labrador’s power grid remains one of the cleanest in Canada, primarily due to its hydroelectric dominance, which supplies over 97% of the province’s total electricity generation. This renewable foundation yields an exceptionally low grid emission intensity of approximately 18 g CO2e/kWh in 2025, ranking among the lowest in the country. Under such conditions, a 75 kVA oil-immersed distribution transformer operating at a typical load factor of 0.6 over a 40-year lifespan emits only 1.64 t CO2e at the user end. In contrast, fossil-fuel-dependent provinces such as Alberta, Saskatchewan, and Nova Scotia exhibit substantially higher grid intensities, primarily due to continued reliance on coal and natural gas.
Alberta’s grid intensity, at 490 g CO
2e/kWh in 2025 [
2], results in a lifetime user-end emission of 44.6 t CO
2e, which is around 27 times higher than Newfoundland’s, as demonstrated in
Figure 15. Saskatchewan, with a grid intensity of 670 g CO
2e/kWh, generates 61.03 t CO
2e, while Nova Scotia’s even higher intensity of 700 g CO
2e/kWh leads to 63.77 t CO
2e over the same operating period [
2]. These comparisons reveal the profound influence of regional grid composition on the carbon performance of electrical infrastructure. Even high-efficiency transformers produce significantly larger emissions when powered by carbon-intensive grids. Therefore, accelerating renewable energy adoption, implementing coal phase-outs, and investing in carbon capture and storage technologies across these fossil-reliant provinces are vital steps toward narrowing Canada’s interprovincial decarbonization gap and achieving equitable progress toward a net-zero electricity system.
9. Case Study: Transformer Losses and Annual CO2 Emissions in St. John’s, Newfoundland
Understanding the real-world impact of transformer losses requires looking beyond a single unit and examining how losses accumulate across an entire city. For this study, measured data from a 75 kVA distribution transformer are used as a representative example. The unit exhibits a core (no-load) loss of 29.4 W, a full-load copper loss of 640 W, and load-dependent copper losses defined by = 640 × x2, where x is the per-unit load.
The St. John’s Census Metropolitan Area (CMA) has a population of approximately 219,119 people and 92,941 households, according to provincial data [
31]. Utilities in Newfoundland typically plan for one transformer per 6–10 homes, so using a conservative average of eight homes per transformer, the St. John’s CMA would operate approximately 11,600 distribution transformers.
At a typical 80% load factor, total losses for a single transformer reach approximately 439 W. When scaled across all units in the region, total continuous losses equal:
Over a full year, this corresponds to:
At a residential electricity rate of 13.5¢/kWh, the annual financial cost of these losses is:
As Newfoundland and Labrador’s electricity grid is one of the cleanest in Canada, with an emission intensity of about 18 g CO
2e/kWh, the corresponding emissions remain relatively low compared to fossil-fuel-dominated grids. Even so, the cumulative CO
2 impact is:
While modest on a per-transformer basis, these emissions underscore the importance of efficiency improvements, proper sizing, and modern transformer specifications, particularly as grids transition toward net-zero targets.
10. Trade-Off Analysis
A key trade-off in transformer lifecycle sustainability lies between material efficiency, operational performance, and end-of-life circularity.
A key sustainability trade-off exists between refurbishing existing transformers and producing new ones. Refurbishment offers clear environmental benefits by extending equipment life and reusing valuable materials, such as core steel, copper, and insulating oil, thereby lowering the demand for virgin resources and reducing embodied carbon. Studies have shown that remanufactured transformers can cut cradle-to-gate emissions by 30–50%, depending on material recovery and asset condition [
11,
32]. By prioritizing the circularity of critical transformer components such as core steel, the main tank, and the frame (subject to rigorous condition assessment) and implementing an effective mineral oil reclamation process, substantial reductions in environmental impact can be achieved. This lifecycle approach to end-of-life management for the 75 kVA single-phase distribution transformer is estimated to reduce manufacturing-stage CO
2 emissions by up to 67%, providing both significant ecological benefits and demonstrable cost savings.
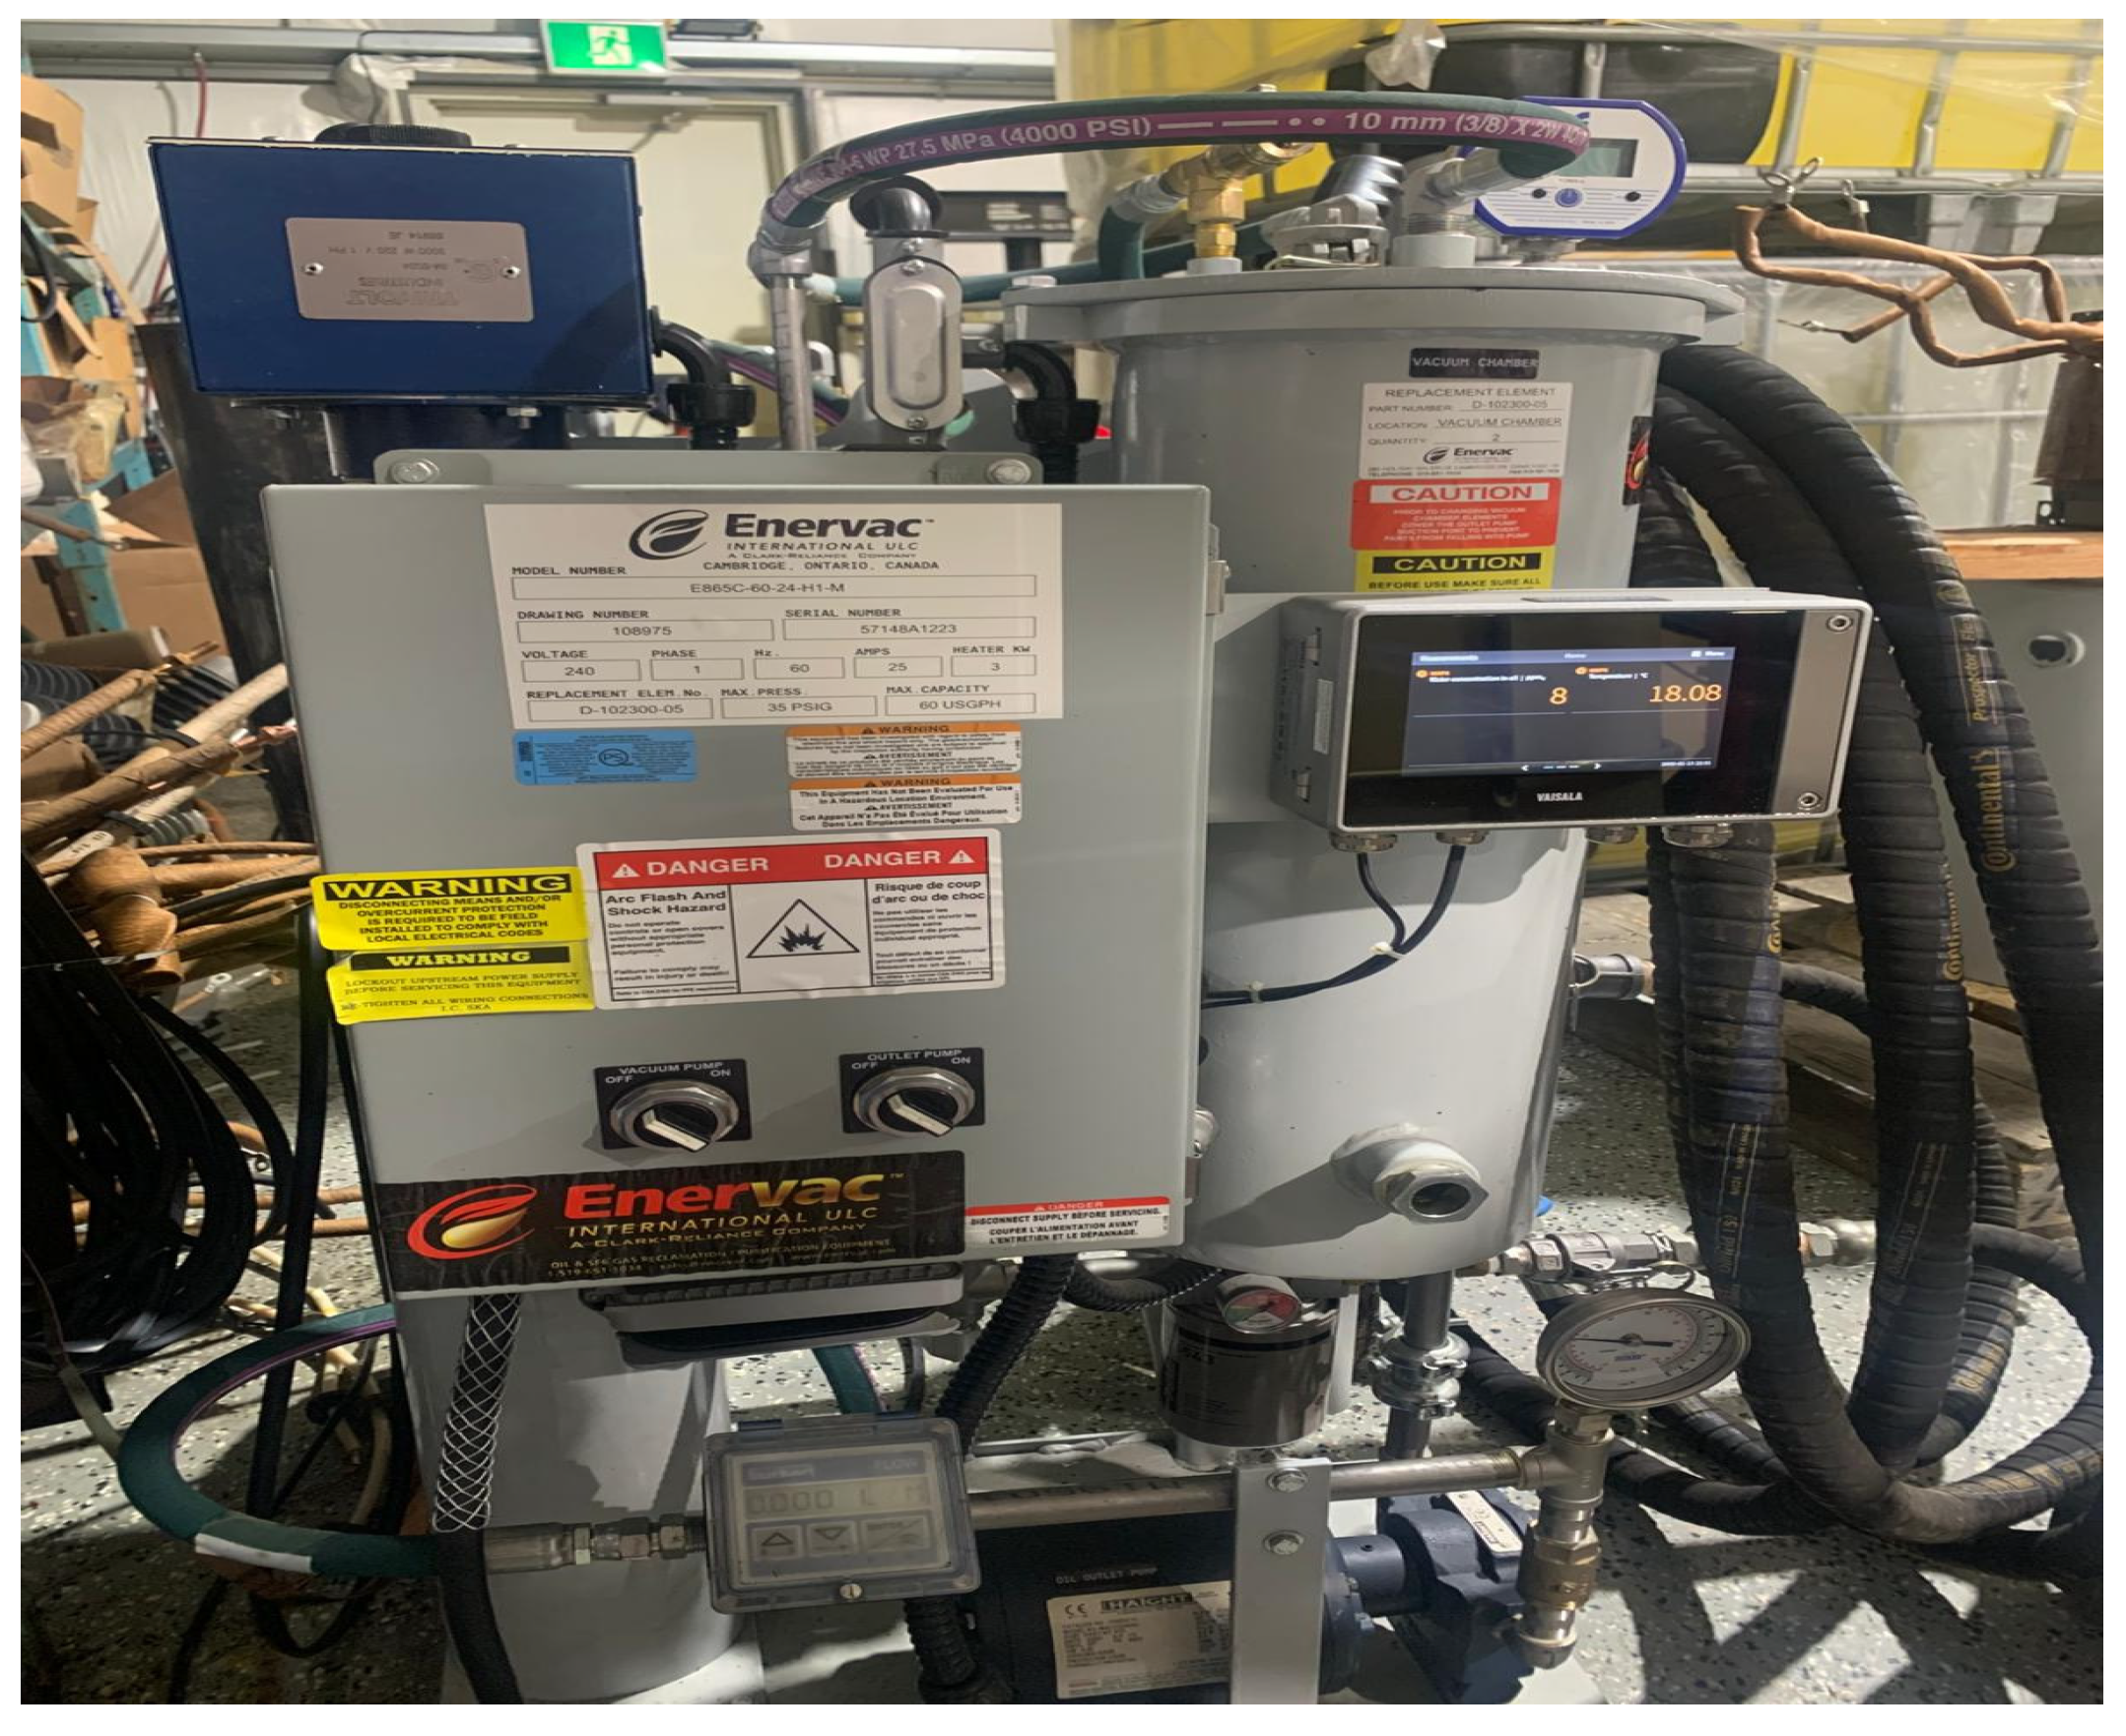
The system removes moisture, dissolved gases, and particulate contaminants to restore dielectric strength and chemical stability, enabling the reuse of reclaimed oil in refurbished transformer units and reducing the overall environmental footprint associated with new oil production. One Enervac Transformer Oil Reclamation Unit used for purification and reuse of insulating oil in distribution transformers is shown in
Figure 16 below.
However, refurbished units may fall short of newer efficiency standards, such as IEC 60076 [
33] and DOE 2016 [
34]. In contrast, new transformers achieve superior energy performance but incur higher manufacturing emissions from advanced materials, including amorphous steel and synthetic esters. This creates a balance between immediate carbon savings and long-term operational efficiency. A modular refurbishment approach, replacing only degraded components, can bridge this gap. Embedding remanufacturing and oil reclamation into utility procurement policies supports circular economy principles and moves the power sector closer to net-zero emission goals.
- 2.
Material Efficiency vs. Manufacturing Emissions
The use of amorphous steel significantly reduces no-load losses, thereby lowering long-term operational emissions; however, its production is energy-intensive and contributes to higher embodied carbon at the manufacturing stage. This presents a balance between front-loaded manufacturing emissions and downstream operational savings, especially in low-carbon grids like Newfoundland and Labrador, where the relative contribution of manufacturing becomes more dominant.
- 3.
Transformer Sizing vs. Lifecycle Carbon Performance
Transformer sizing and loading conditions also present an operational trade-off. Oversized units minimize copper losses but lead to underutilization and higher embodied carbon per unit of delivered energy, while undersized units suffer from elevated thermal stress and shorter service life. Optimal sizing strategies should therefore consider both carbon intensity and service reliability.
- 4.
Local Manufacturing vs. Supply Chain Emissions
The findings indicate that the long-distance interprovincial transportation of raw materials, often exceeding 3000 km, significantly adds to the transformer’s embodied emissions. This creates a clear trade-off between centralized manufacturing, which ensures production efficiency, quality control, and economies of scale, and localized production, which minimizes logistics-related emissions and promotes circularity through regional sourcing and recycling. Balancing these factors requires a strategic approach that optimizes both environmental performance and industrial efficiency by integrating sustainable supply chain planning with low-carbon manufacturing practices.
- 5.
Oil vs. Alternative Insulating Fluids
Mineral oil offers the advantage of relatively low production-related emissions and proven dielectric performance; however, it carries environmental drawbacks, including the risk of leakage, soil contamination, and complex end-of-life management. In contrast, synthetic and biodegradable ester-based insulating fluids enhance fire safety, biodegradability, and overall environmental resilience; however, they entail higher initial emissions and costs due to energy-intensive production processes. Thus, the selection between these insulation media involves balancing short-term manufacturing impacts with long-term ecological and operational benefits, emphasizing the importance of context-specific sustainability trade-offs in transformer design.
11. Constraints and Future Work
This study provides a strong foundation for understanding the lifecycle emissions of distribution transformers; however, several areas warrant further exploration. Future work should focus on developing a dynamic emission model that accounts for seasonal temperature variations, evolving grid intensity, and real-time transformer loading conditions. Integrating field data through digital twins or IoT-based monitoring systems could help capture operational nuances more accurately and refine emission predictions across diverse grid environments. Another key direction lies in evaluating remanufacturing and circular economy strategies, including core steel reuse, oil reclamation, and component refurbishment, to better quantify their long-term carbon benefits. Further comparative analysis between synthetic ester-based and biodegradable insulating oils, as well as emerging nanocrystalline or amorphous core materials, could help identify optimal trade-offs between performance, cost, and sustainability. Manufacturing electricity consumption was estimated using a representative ECF derived from the literature; future studies should prioritize facility-specific metered manufacturing energy data to further reduce uncertainty in manufacturing-stage emissions.
The overloading scenario considered in this study (120% of rated load for a limited daily duration) is intended as a representative stress case to examine the sensitivity of life-cycle energy losses and emissions, rather than to replicate statistically derived seasonal or daily load profiles. Furthermore, for ON-AN cooled transformers, the analysis does not specifically model insulation aging, thermal hotspot temperature, or loss-of-life impacts. Future studies should focus on using combined thermal-electrical ageing models to measure the effects of recurrent overload events on transformer service life and life-cycle emissions. Future work should also integrate transformer life-cycle assessment with uncertainty-aware operational strategies developed for low-carbon energy systems in remote and extreme environments, enabling more resilient asset planning under variable demand, climate, and grid conditions [
35]. Although end-of-life recycling processes involve emissions from dismantling, transportation, and material reprocessing, these impacts are often offset by avoiding emissions from substituting recycled metals for primary raw materials. Quantifying these net effects requires detailed recycling inventories and allocation assumptions, which are beyond the scope of the present cradle-to-use analysis and are identified as an important area for future research.
Lastly, machine learning and predictive analytics could be leveraged to anticipate overloading patterns, transformer ageing, and emission behaviour under future grid decarbonization scenarios. By coupling these models with Canada’s evolving clean electricity policies, future studies can provide more realistic pathways for achieving net-zero distribution infrastructure while balancing reliability, efficiency, and sustainability goals.
12. Concluding Remarks
This study presented a comprehensive life-cycle assessment of a 75 kVA oil-immersed distribution transformer manufactured and operated in Newfoundland and Labrador, one of Canada’s cleanest electricity jurisdictions. By integrating material inventory data, transportation emissions, manufacturing energy use, and operational losses over a 40-year lifespan, the analysis provides a deep understanding of the transformer’s environmental footprint under evolving grid conditions. The analysis revealed that the manufacturing and logistics stages contribute approximately 1.2535 t CO2e, including raw material production (1.1025 t CO2e), interprovincial transportation (0.135 t CO2e), manufacturing electricity (0.001 t CO2e), and deployment logistics (0.015 t CO2e). Among the materials, core steel and copper windings account for nearly 75% of total embodied emissions, reflecting the carbon intensity of magnetic and conductive materials.
At the user end, operational emissions over a 40-year service life were found to range from 0.19 t CO2e at no load operation to 4.4 t CO2e under full load operation, resulting in total lifecycle emissions of 1.44–5.65 t CO2e, depending on loading conditions. Sensitivity analysis showed that grid carbon intensity is a major determinant of lifecycle impact. For instance, under Newfoundland’s hydro-dominated grid (18 g CO2e/kWh in 2025), lifetime user-end emissions remain below 2 t CO2e, whereas the same transformer operating in Alberta’s fossil-fuel-intensive grid (490 g CO2e/kWh) would emit 44.6 t CO2e, over 27 times higher. Similarly, Saskatchewan (670 g CO2e/kWh) and Nova Scotia (700 g CO2e/kWh) would yield 61.0 t and 63.8 t CO2e, respectively.
The study further highlights the trade-offs inherent in transformer design and lifecycle management from material selection and manufacturing localization to refurbishment and integration into the circular economy. As grids across Canada transition toward net-zero electricity, the environmental profile of transformers will progressively shift from operational emissions to embodied impacts, making low-carbon materials, modular refurbishment, and remanufacturing critical to future sustainability. Ultimately, this work provides both methodological and practical insights for utilities, manufacturers, and policymakers, guiding data-driven decisions that balance technical performance, cost, and carbon responsibility in the path toward a climate-neutral power distribution network.




 ,
,