Article

Integration Optimization and Annual Performance of a Coal-Fired Power System Retrofitted with a Solar Tower


1
Jiangsu Provincial Key Laboratory of Multi-Energy Integration and Flexible Power Generation Technology, Nanjing Institute of Technology, Nanjing 211167, China
2
School of Energy and Power Engineering, Nanjing Institute of Technology, Nanjing 211167, China
*
Author to whom correspondence should be addressed.
Energies 2026, 19(3), 620; https://doi.org/10.3390/en19030620
Submission received: 22 November 2025 / Revised: 19 January 2026 / Accepted: 21 January 2026 / Published: 25 January 2026
(This article belongs to the Special Issue Solar Energy Conversion and Storage Technologies)

Abstract

Solar-aided power generation offers a pathway to reduce the carbon dioxide emissions from existing coal-fired plants. This study addresses the gap in comparing different solar integration modes by conducting a thermo-economic analysis of a 600 MW coal-fired system retrofitted with a solar tower. Four integration modes were designed and rigorously compared, encompassing series and parallel configurations at either the high-exergy reheater or the lower-exergy economizer. A detailed thermodynamic model was developed to simulate its off-design and annual performance. The results showed that integration at the primary reheater outperformed the economizer integration. Specifically, the parallel configuration at the primary reheater (Mode II) achieved the highest annual solar-to-electricity efficiency of 18.43% at a thermodynamically optimal heliostat field area of 125,025.6 m2. Economic analysis revealed a trade-off, with the minimum levelized cost of energy (LCOE) of −0.00929 USD/kWh for Mode II occurring at the economically optimal area of 321,494 m2 due to greater coal and emission savings. Sensitivity analysis across two other locations confirmed that the annual solar-to-electricity efficiency and LCOE are directly influenced by solar resource quality, but the thermodynamically optimal and economically optimal heliostat field area remain consistent. This work demonstrates that parallel integration with the primary reheater presents a favorable and practical configuration, balancing high solar-to-electricity conversion efficiency with favorable economics for hybrid solar–coal power plants.

1. Introduction

Global industrial development has led to a continuous rise in energy demand, with fossil fuels still dominating electricity generation and contributing significantly to greenhouse gas emissions and environmental degradation. In response, the transition towards renewable energy sources has become a global imperative. Solar energy, in particular, offers a clean and abundant alternative, yet its intermittent and unstable nature poses challenges for grid integration and reliable power supply.
To overcome the intermittency of solar energy, the concept of solar-aided power generation (SAPG) was introduced, wherein solar thermal energy is integrated into existing coal-fired power plants to displace part of the fossil fuel consumption [1]. This hybrid approach leverages the stability of conventional power plants while enhancing the utilization efficiency of solar heat, thereby reducing both fuel costs and emissions [2]. The foundational work by Zoschak and Wu first proposed the integration of solar heat into fossil-fueled power stations, establishing the conceptual framework for SAPG [3]. Ying and Hu [4] presented the advantages of using solar energy as an auxiliary source in a regenerative Rankine plant from a thermodynamic viewpoint. Yang et al. [5] later advanced the field by proposing integration schemes based on working fluid and energy flow matching. In summary, early research into SAPG provides a pragmatic pathway to decarbonize coal-fired power generation by effectively utilizing solar heat.
As parabolic trough collectors have been widely adopted in commercial concentrating solar power (CSP) plants, extensive research has been conducted on systems utilizing parabolic trough collectors in the later research of SAPG, demonstrating their potential to improve energy, exergy, environmental, and economic performance. Suresh et al. [6] conducted a comprehensive 4E (Energy, Exergy, Environment, and Economic) analysis, revealing that solar integration could enhance both exergetic efficiency and environmental outcomes. Pierce et al. [7] showed that SAPG systems could achieve over 25% higher annual electricity output than stand-alone concentrating solar power plants under the same solar field size. Bakos and Tsechelidou [8] demonstrated a 3.7% boost in overall system efficiency by integrating a parabolic trough field with a 300 MW lignite plant. Wu et al. [9] further investigated annual performance, solar field sizing, and thermal energy storage (TES), highlighting the importance of optimizing integration points and operational strategies. Zhai et al. [10] quantified lifecycle environmental benefits, showing that SAPG with TES offers substantial reductions in emissions and primary energy consumption. Hong et al. [11] investigated the effective utilization of medium- and low-temperature solar heat, and demonstrated that using approximately 300 °C solar thermal energy to preheat feedwater could increase power output by about 11.1%, achieving a net annual solar-to-electric efficiency of 15.03%. Huang et al. [12] investigated the role of TES, showing that an active control strategy could enhance system energy efficiency by 2.5%. Wang et al. [13] developed a system with direct steam generation and active composite sun-tracking, which achieved a high annual solar efficiency of 17.07% and a low levelized cost of energy (LCOE) of 0.129 EUR/kWh. Yan et al. [14] improved the feedforward control strategy to enhance the peak-shaving flexibility and operational safety of an SAPG system under DNI fluctuation, which increased the maximum load cycling rate from 3.3 MW/min to up to 13.2 MW/min and reduced reheat steam temperature deviations from as high as 18.6 °C to 4.0 °C. Based on the first and the second laws of thermodynamics, Reddy et al. [15] analyzed a hypothetical case of an SAPG system. Peng et al. [16] analyzed exergy destructions of a 330 MW SAPG system. In summary, CSPs with parabolic trough collectors were typically integrated to preheat the feedwater with the advantages of higher net annual solar-generated electricity and annual solar-to-electricity efficiency compared with a standalone CSP system. Despite these advances, CSPs with parabolic trough collectors are typically limited to medium-temperature applications (below 400 °C), which restricts their ability to supply high-exergy heat for superheating and reheating processes, thereby limiting the improvement of overall solar-to-electricity efficiency.
To overcome the temperature limitations of parabolic trough collectors, solar tower technology has emerged as a promising alternative for SAPG, capable of delivering high-temperature heat (over 500 °C) suitable for superheating and reheating. However, there has been limited research on tower-based integrations. Zhu et al. [17] carried out a comparison study and found that the solar-to-electricity exergy efficiency of tower-based SAPG is 1.83% higher than standalone solar tower CSP, indicating superior annual performance. Li et al. [18] designed a solar tower that could be used to reheat the exhaust steam from the immediate turbine, reducing the standard coal consumption rate to 35.98 g/kWh (power-boosting mode) and 34.99 g/kWh (fuel-saving mode), showing the thermodynamic advantages of tower-based SAPG. Jiang et al. [19,20] undertook an off-design analysis and optimization study on a solar tower aided double reheat system. It demonstrated that the integration of the solar tower improves boiler exergy efficiency and system flexibility, with the standard coal consumption rates decreased by 4.85 g/kWh (100% THA), 8.79 g/kWh (80% THA) and 18.55 g/kWh (60% THA). Wang et al. [21] evaluated a solar-tower-aided coal-fired power system with a TES system, demonstrating that it can achieve a high solar coupling capacity of 339.5 MWth, supplying 24.28% of power from solar. The aforementioned studies have affirmed the thermodynamic potential and operational advantages of integrating coal-fired power systems retrofitted with solar towers by confirming their superiority in solar-to-electricity efficiency over standalone CSP plants, with reductions in coal consumption and CO2 emissions across various load conditions by optimizations of system design and control strategies. However, notable limitations persist in the existing literature, involving the following aspects.
Firstly, a significant portion of the research has focused on double-reheat cycles. Some have proposed retrofitting solar towers to produce double-reheated steam without corresponding modifications to the low-pressure (LP) turbine section. This raises concerns about practical applicability and operational safety. Other studies were based on double-reheat units, which are less representative of the predominant fleet of single-reheat units still in widespread operation globally, and particularly in China. Consequently, the integration strategy and performance of solar towers with mainstream single-reheat plants remain underexplored.
Secondly, a common simplification in system-level studies is to treat the boiler as a black box, based on energy balance between coal combustion and working fluid. This approach cannot resolve the internal thermodynamic and heat transfer interactions within individual heat exchangers. As a result, there is a lack of mechanistic studies on how to integrate a solar tower into the boiler’s heat exchanger network, or to determine the optimal integration location or configuration.
To address these research gaps, this study analyzes a 600 MW single-reheat coal-fired unit retrofitted with a solar tower. The core novelty and contributions of this work are outlined as follows:
(1)
A comprehensive thermodynamic model of the hybrid system is developed. Notably, the boiler is modeled in detail as a series of heat exchangers. This approach enables the calculation of thermodynamic and heat transfer performance for each individual component, thereby facilitating the design of internal solar integration within the boiler. It further allows for the investigation of the impact of integration on key parameters of flue gas, particularly the exhaust temperature.
(2)
Based on the above model, the integration point and configuration are systematically investigated. Four distinct integration modes are designed and rigorously compared, encompassing both series and parallel configurations for solar heat addition at either the primary reheater (RH) or the economizer.
(3)
Furthermore, the model is employed to simulate the system’s thermodynamic and annual performance using hourly meteorological data. The evaluation extends beyond conventional metrics like solar-generated electricity and solar conversion efficiency to include an assessment of economic viability via LCOE. This integrated analysis identifies the trade-offs between the thermodynamically optimal and economically optimal aperture areas of the heliostat field.
(4)
Finally, a sensitivity analysis based on other representative locations is conducted. This assesses the robustness of the identified thermodynamically and economically optimal heliostat field sizes under different meteorological data, thereby enhancing the practical relevance and generalizability of the findings.

2. System Description

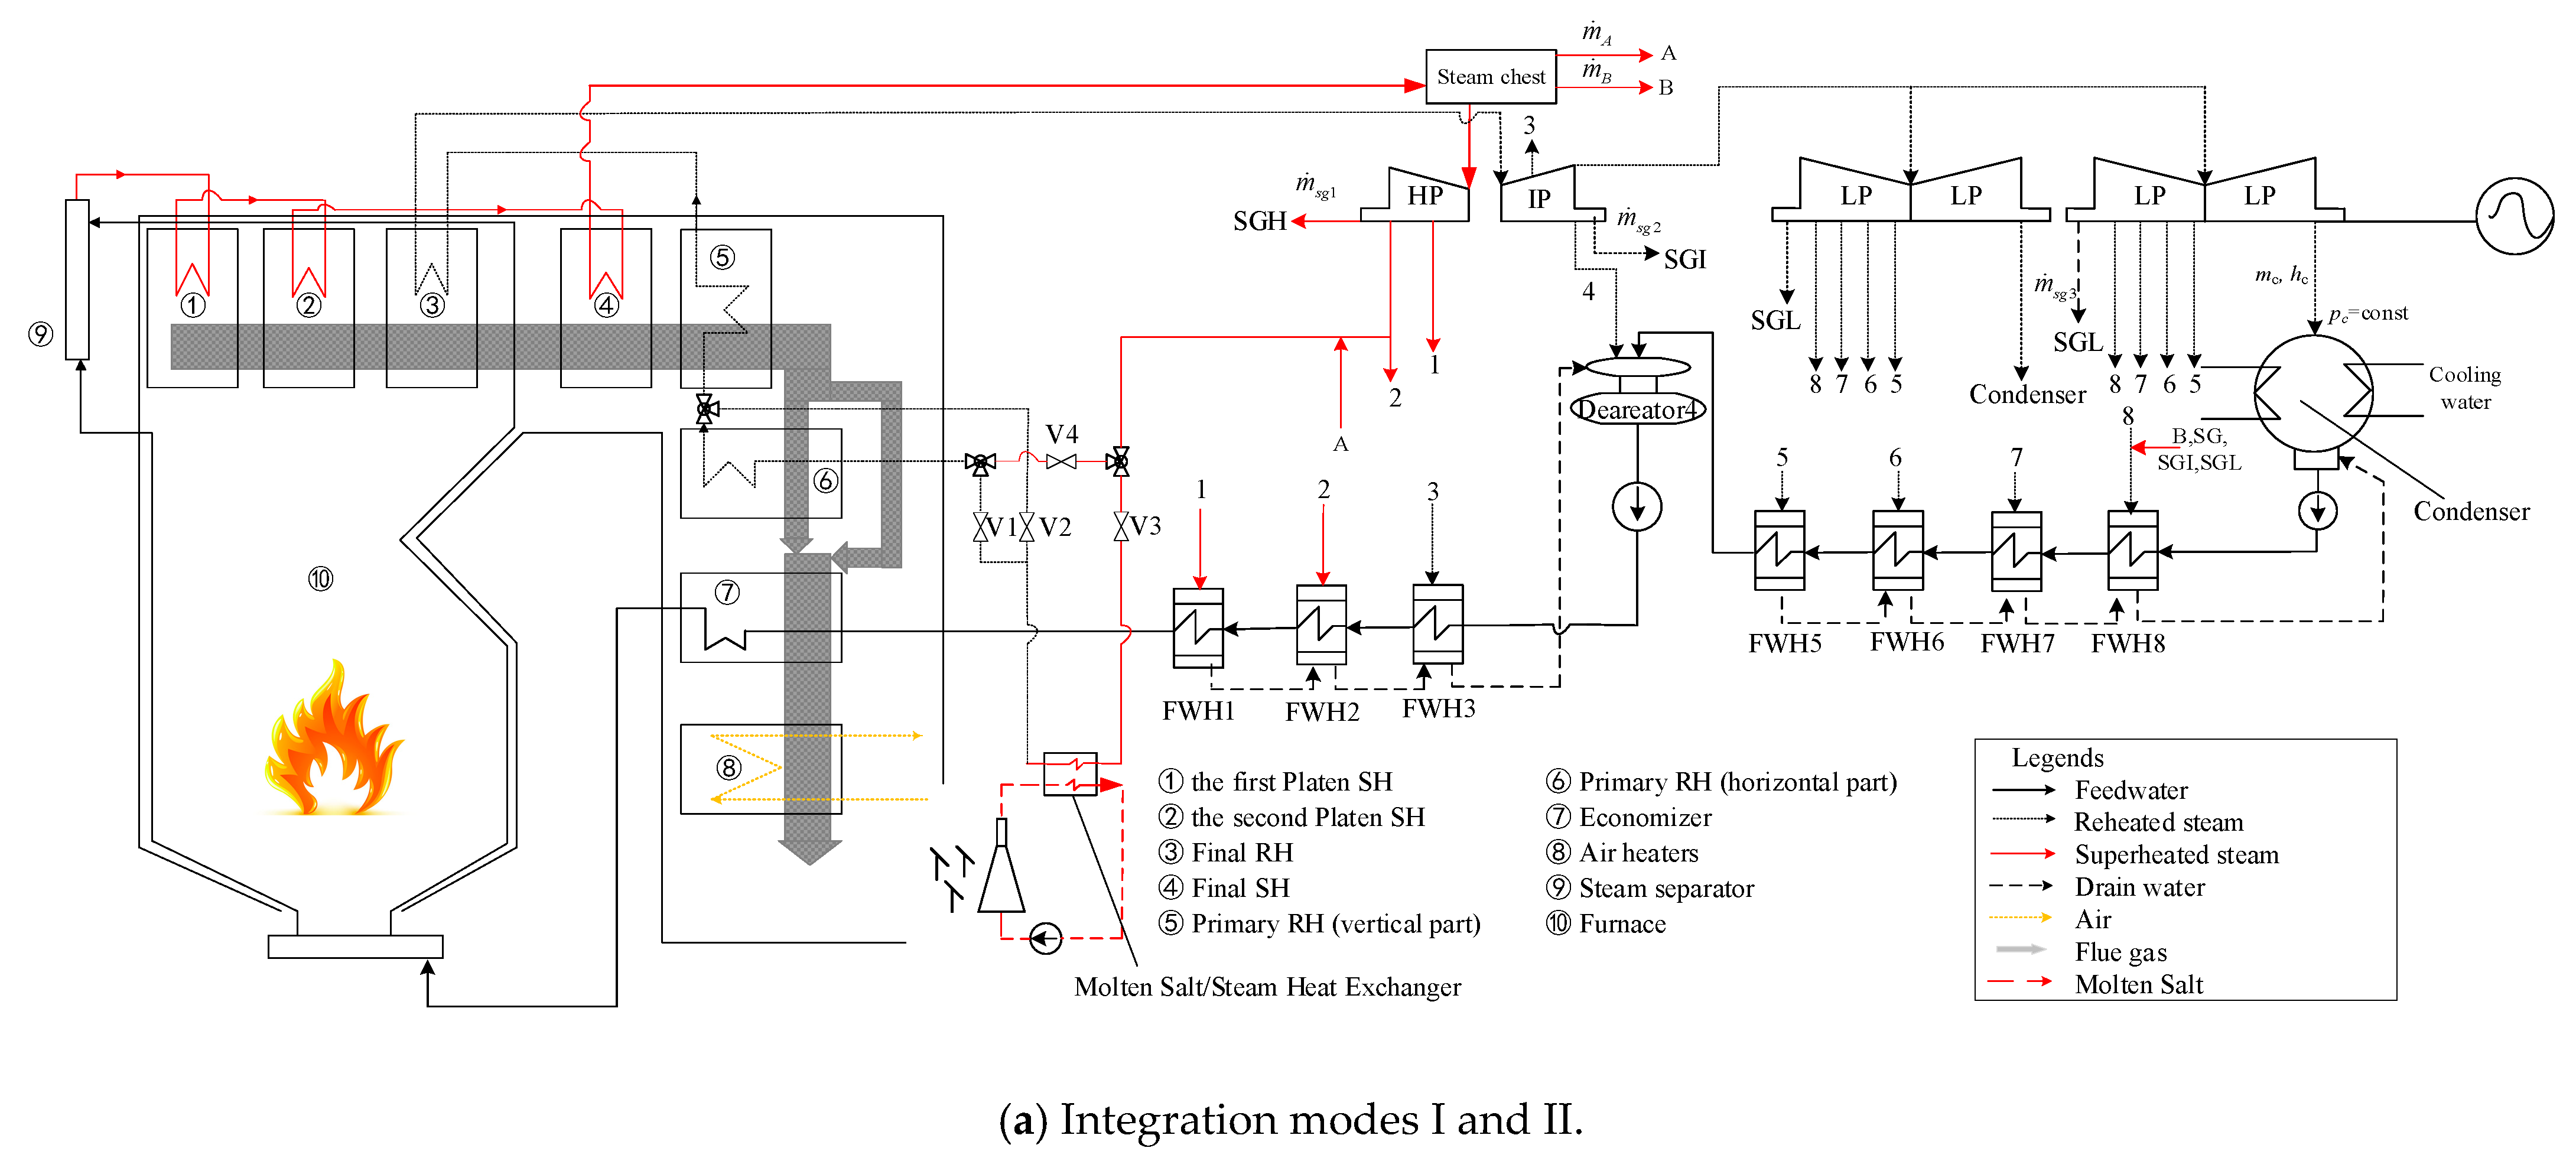
A solar-aided coal-fired power generation system comprises three subsystems, namely the steam turbine and regeneration subsystem, the boiler subsystem, and the solar subsystem. In the steam turbine and regeneration subsystem, the exhaust steam from the LP cylinder first enters the condenser, and then passes through multiple feedwater heaters (FWHs) before entering the boiler subsystem. The feedwater is heated and converted to superheated steam with high temperature and high pressure, and then enters the high-pressure (HP) cylinder to generate work. The exhaust steam from the HP cylinder is directed to the boiler reheater, where it is reheated and then supplied to the intermediate-pressure (IP) and LP cylinders for generating further work. Finally, the exhaust steam from the LP cylinder returns to the condenser, completing the cycle. To increase the temperature of the feedwater, steam from eight stages (numbered from 1 to 8) is extracted to provide heat in the corresponding FWHs. In addition, valve lever leakage steam from the steam chest (marked as A and B) is, respectively, recycled at the outlet sides of HP and FWH-8. The shaft seal leakage steams of HP, IP and LP (marked as SGH, SGI and SHL, respectively) are recycled in FWH-8.
The boiler subsystem in the original power generation system includes a series of heat exchangers. The flue gas is generated from the combustion in the furnace, then sequentially passes through the first and second platen superheaters (SHs), the final reheater (RH), the final SH, the primary RH (including the vertical and horizontal parts), the economizer, and the air heaters. The outlet feedwater from FWH-1 is first heated in the economizer and then passes through the furnace to the steam separator. The separated steam is subsequently superheated in the first and second platen SHs, and the final SH. Platen SH is a kind of radiant SH located in the upper furnace or at the furnace exit, absorbing both direct radiative heat from the furnace and convective heat from the flue gas to preliminarily superheat the steam. The resulting superheated steam is then directed to the HP cylinder. The exhaust steam from the HP cylinder is heated in the primary and final RHs. The outlet reheated steam is then directed to the IP cylinder. Meanwhile, air from the environment is preheated in the air heater to enhance the combustion temperature within the furnace.
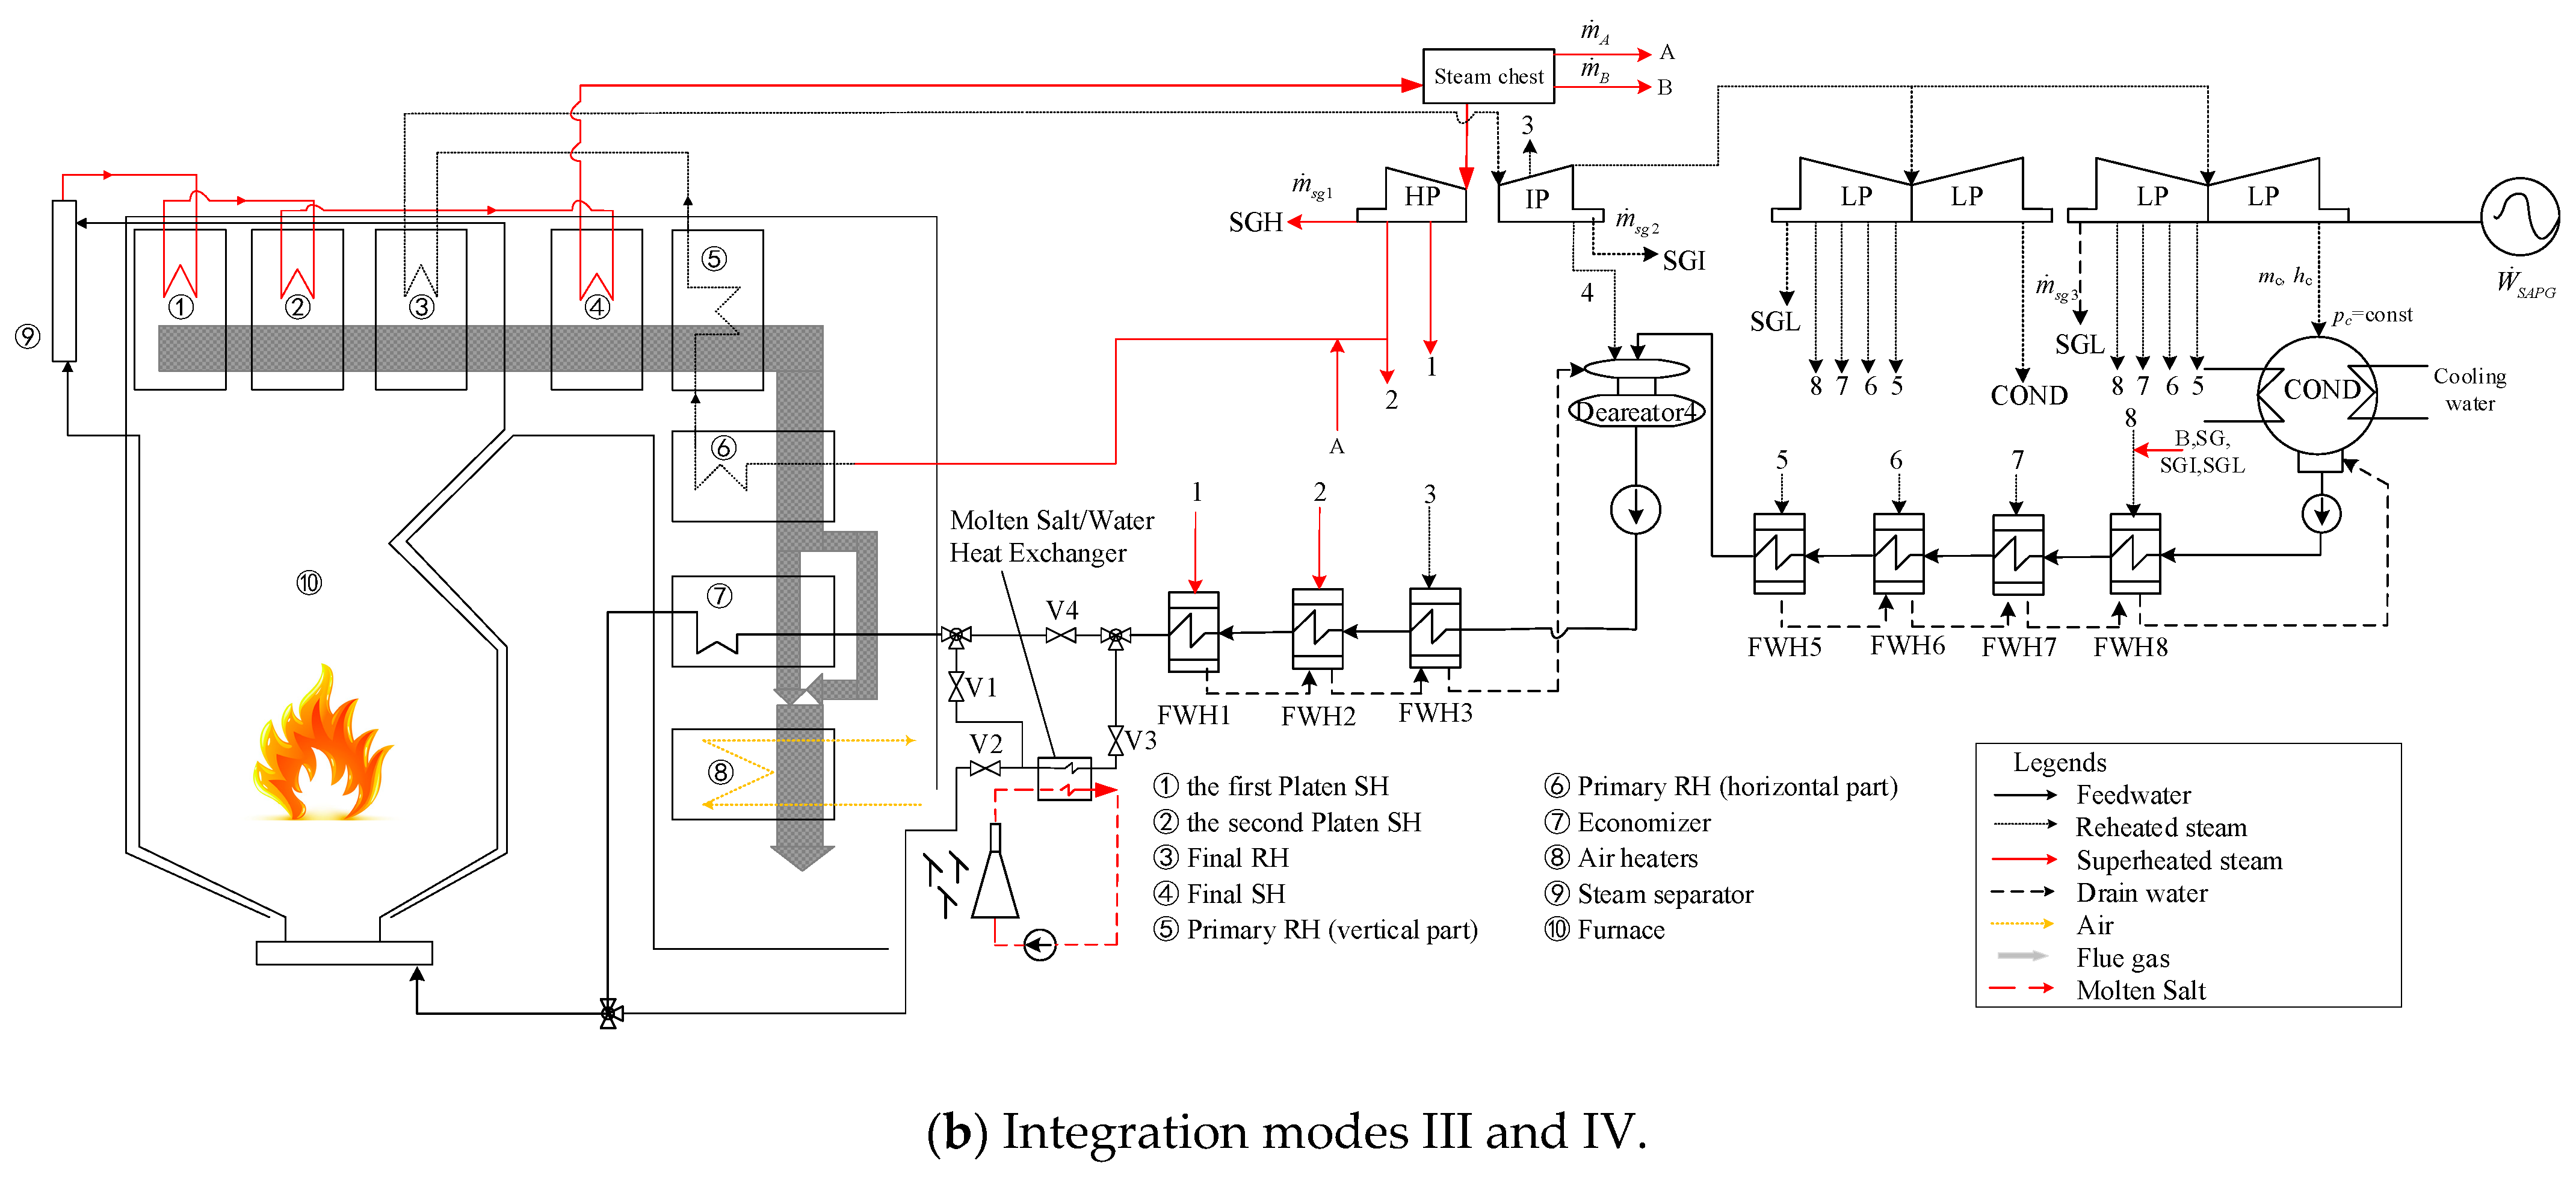
The added solar subsystem compromises a molten salt/steam heat exchanger or molten salt/water heat exchanger, solar tower, and heliostat field. This paper provides designs for four integration modes. The economizer and the primary RH (horizontal part) were selected as integration points for both practical and thermodynamic reasons. Structurally, they are located near the boiler tail and are less invasive to retrofit. Thermodynamically, the primary RH (horizontal part) temperature matches the high-grade heat from solar towers, while the economizer provides a baseline for lower-exergy integration. For each location, both series and parallel configurations—the two fundamental coupling methods in SAPG—are investigated. This approach provides a systematic framework to evaluate how integration level and thermal arrangement jointly affect system performance.
For integration mode I, the solar tower is arranged in series at the inlet side of the primary RH (horizontal part), as shown in Figure 1a. In this configuration, valves V1 and V3 are open, while valves V2 and V4 are closed. The entire exhaust steam from the HP cylinder is preheated in the molten salt/steam heat exchanger before being further heated in each RH in boiler subsystem. To avoid the temperature of reheated steam overheating, the flue gas is bypassed before entering the economizer: one portion enters the primary reheater (horizontal part) to heat the steam, while the other bypasses it directly to its outlet. These two portions of flue gas streams are mixed at the inlet of the economizer.
For integration mode II, the solar tower is arranged in parallel with the primary RH (horizontal part), as shown in Figure 1a. In this configuration, valves V2, V3, and V4 are open, and valve V1 is closed. The extracted reheated steam from the HP cylinder is split into two parts: one part is heated in the molten salt/steam heat exchanger, and the other part is heated directly in the primary RH (horizontal part). The outlet temperature of both streams is the same and mixed at the inlet of the primary RH (horizontal part). Similarly, to avoid the temperature of reheated steam overheating, the flue gas should be bypassed with the same method as for integration mode I.
For integration mode III, the solar tower is arranged in series at the inlet of the economizer, as shown in Figure 1b. In this configuration, valves V1 and V3 are open, while valves V2 and V4 are closed. All feedwater is preheated in the molten salt/water heat exchanger before entering the economizer. To avoid the temperature of superheated steam overheating, the flue gas is bypassed before entering the air heaters: one portion enters the economizer to heat the feedwater, and the other bypasses it directly to its outlet. These two portions of flue gas streams are mixed at the inlet of air heaters.
For integration mode IV, the solar tower is arranged in parallel with the economizer, as shown in Figure 1b. In this configuration, valves V2, V3, and V4 are open, while valve V1 is closed. The feedwater is split into two parts: one part is preheated in the molten salt/water heat exchanger, and the other part is heated in the economizer. The outlet temperature of both streams is the same and mixed at the outlet of economizer. Similarly, to avoid the temperature of superheated steam overheating, the flue gas should be bypassed with the same method as for integration mode III.

3. Modeling and Evaluation Criteria

3.1. Turbine and Feedwater Preheating Subsystem

In each FWH, feedwater is mainly pre-heated by extraction steam and drain water (if existing) to raise the inlet temperature of the economizer, as shown in Equations (1)–(8),
m ˙ F W τ 1 = m ˙ e x , 1 q 1 ,
m ˙ F W τ 2 = m ˙ e x , 1 γ 2 + m ˙ e x , 2 q 2 ,
m ˙ F W τ 3 = γ 3 i = 1 2 m ˙ e x , i + m ˙ e x , 3 q 3 + m ˙ A q A ,
m ˙ F W m ˙ A i = 1 4 m ˙ e x , i τ 4 = γ 4 i = 1 3 m ˙ e x , i + m ˙ e x , 4 q 4 ,
m ˙ F W m ˙ A i = 1 4 m ˙ e x , i τ 5 = m ˙ e x , 5 q 5 ,
m ˙ F W m ˙ A i = 1 4 m ˙ e x , i τ 6 = m ˙ e x , 5 γ 6 + m ˙ e x , 6 q 6 ,
m ˙ F W m ˙ A i = 1 4 m ˙ e x , i τ 7 = γ 7 i = 5 6 m ˙ e x , i + m ˙ e x , 7 q 7 ,
m ˙ F W m ˙ A i = 1 4 m ˙ e x , i τ 8 = γ 8 i = 5 7 m ˙ e x , i + m ˙ e x , 8 q 8 + m ˙ B q B + i = 1 3 m ˙ s g , i q s g , i ,
where m ˙ e x , i is the mass flow rate of the ith-stage extraction steam; m ˙ A and m ˙ B present the mass flow rate of valve lever leakage steam from the steam chest; m ˙ s g , i is the mass flow rate of the ith shaft seal leakage steam in the turbine; τi represents the specific enthalpy increase in feedwater in FWHi; qi represents the specific enthalpy drop of the ith-stage extraction steam; qA and qB represent the specific enthalpy drop of the valve lever leakage steam A (to FWH3) and steam B (to FWH8); qsg,I represents the specific enthalpy drop of the ith shaft seal leakage steam; and γ represents the specific enthalpy drop of drain water in FWHi.
Based on Equations (1)–(8), Equation (9) illustrates the energy balance in each FWH in matrix form,
q 1 γ 2 q 2 γ 3 γ 3 q 3 γ 4 γ 4 γ 4 q 4 τ 5 τ 5 τ 5 τ 5 q 5 τ 6 τ 6 τ 6 τ 6 γ 6 q 6 τ 7 τ 7 τ 7 τ 7 γ 7 γ 7 q 7 τ 8 τ 8 τ 8 τ 8 γ 8 γ 8 γ 8 q 8 m ˙ e x , 1 m ˙ e x , 2 m ˙ e x , 3 m ˙ e x , 4 m ˙ e x , 5 m ˙ e x , 6 m ˙ e x , 7 m ˙ e x , 8 + 0 0 0 0 q A 0 γ 4 0 τ 5 0 τ 6 0 τ 7 0 τ 8 q B m ˙ A m ˙ B + 0 0 0 0 0 0 0 i = 1 3 m ˙ s g , i q s g , i = m ˙ F W τ 1 τ 2 τ 3 τ 4 τ 5 τ 6 τ 7 τ 8 ,

3.2. Boiler Subsystem

The energy balance between the combustion of coal and the heating of the working fluid is described by Equation (4).
Q ˙ b = m ˙ 0 ( h s h o u t h s h i n ) + m ˙ r h ( h r h o u t h r h i n ) = m ˙ c η b Q r 1 η u b ,
where h denotes the specific enthalpy; Qr represents the lower heating value of standard coal (equal to 29,270 kJ/kg); and ηub is the heat loss rate caused by unburned solid combustibles.
Within the furnace, the radiative heat transfer from the flame to the water-cooled walls is governed by the energy balance expressed in Equation (11), which is equivalent to the enthalpy drop of the flue gas [22,23].
Q ˙ f u r = 10 3 α x t A f u r σ ( T f l a m e 4 T f u r , w 4 ) = φ m ˙ f l u e v g c g ¯ ( T a T f u r o u t ) ,
where φ is the heat retention factor, which is 0.998 for the selected boiler; v g c g ¯ is the mean net heat capacity rate of the combustion products; T is temperature (in Kelvin unit); αxt is the system emissivity; σ is Stefan–Boltzmann constant; Tfur,w is the surface area of water-cooled walls; Tflame is the temperature of flame; Afur is the surface area of water-cooled walls; Ta is the adiabatic combustion temperature; and m ˙ f l u e is the mass flow rate of the flue gas.
After the furnace stage in the original boiler, the working fluid is heated through a series of heat exchanges, with the heat derived principally from the convective action of the flue gas and direct radiation emitted by the flame. Each heat exchanger is modeled based on an energy balance, expressed by Equation (12),
Q ˙ f u r o u t + Q ˙ f l u e = Q ˙ w f ,
where Q ˙ f u r o u t denotes the incident radiative energy originated from the flame; Q ˙ f l u e represents the heat released by the flue gas, calculated via Equation (13); and Q ˙ w f represents the specific enthalpy increase in the working fluid, given by Equation (14).
Q ˙ f l u e = m ˙ f l u e φ ( h f l u e i n h f l u e o u t ) = k c o n Δ t L M T D A c o n ,
where kcon is the convective heat transfer coefficient, following the method from [24]; Acon represents the effective convective heat transfer area; and ΔtLMTD represents the logarithmic mean temperature difference (LMTD) between the flue gas and the working fluid.
Q ˙ w f = m ˙ w f ( h w f o u t h w f i n ) ,
During the bypass operation, practical factors such as heat exchanger fouling, slagging, and detailed flue gas flow redistribution are neglected. For integration mode I, the molten salt/steam heat exchanger is arranged in series at the inlet side of the primary RH (horizontal part). By doing so, the inlet specific enthalpy of working fluid in the primary RH (horizontal part) increases from h r h i n to h w f , r h 1 i n , as shown in Equation (15).
Q ˙ s o l a r = m ˙ r h ( h w f , r h 1 i n h r h i n ) .
As no direct radiative heat transfer from the flame can be received in the primary RH (horizontal part), the heat balance of this heat exchanger is shown in Equation (16),
m ˙ f l u e ( 1 s f l u e ) φ ( h f l u e , r h 1 i n h f l u e , r h 1 o u t ) = m ˙ r h ( h w f , r h 1 o u t h w f , r h 1 i n ) ,
where sflue is the share of the bypassed flue gas.
For integration mode II, the molten salt/steam heat exchanger is arranged in parallel with the primary RH (horizontal part). By doing so, a part of the working fluid is heated in the molten salt/steam heat exchanger, as shown in Equation (17).
Q ˙ s o l a r = m ˙ r h s w f ( h w f , r h 1 o u t h r h i n ) ,
where swf is the share of working fluid heated in the molten salt/steam heat exchanger.
Therefore, the heat balance of the primary RH (horizontal part) is shown in Equation (18),
m ˙ f l u e ( 1 s f l u e ) φ ( h f l u e , r h 1 i n h f l u e , r h 1 o u t ) = m ˙ r h ( 1 s w f ) ( h w f , r h 1 o u t h r h i n ) .
For integration mode III, the molten salt/water heat exchanger is arranged in series at the inlet side of the economizer. By doing so, the inlet specific enthalpy of the working fluid in the economizer increases from h s h i n to h w f , E c o i n , as shown in Equation (19),
Q ˙ s o l a r = m ˙ 0 ( h w f , E c o i n h s h i n ) .
Therefore, the heat balance of the economizer is shown in Equation (20):
m ˙ f l u e ( 1 s f l u e ) φ ( h f l u e , E c o i n h f l u e , E c o o u t ) = m ˙ 0 ( h w f , E c o o u t h w f , E c o i n ) .
For integration mode IV, the molten salt/steam heat exchanger is arranged in parallel with the economizer. By doing so, a part of the working fluid is heated in the molten salt/steam heat exchanger, as shown in Equation (21).
Q ˙ s o l a r = m ˙ 0 s w f ( h w f , E c o o u t h f w 1 i n ) .
Therefore, the heat balance of the economizer is shown in Equation (22):
m ˙ f l u e ( 1 s f l u e ) φ ( h f l u e , E c o i n h f l u e , E c o o u t ) = m ˙ 0 ( 1 s w f ) ( h w f , E c o o u t h w f , E c o i n ) .

3.3. Solar Subsystem

The solar heat absorbed by working fluid via the molten salt/steam heat exchanger or molten salt/water heat exchanger can be calculated through Equation (23),
Q ˙ s o l a r , a b s = 10 3 η S H G b n A s f ,
where Gbn represents direct normal irradiation (DNI); Asf represents the aperture area of the heliostat field; and ηSH represents solar-to-solar heat efficiency, which will be simulated through the Solar Advisor Model (SAM) software (version 2025.4.16) developed by the National Renewable Energy Laboratory (NREL).

3.4. Evaluation Criteria

3.4.1. Solar-Generated Electricity

The solar exergy absorbed by the working fluid for integration modes I, II, III and IV can be calculated using Equations (24), (25), (26) and (27), respectively [25,26]:
E s o l a r = m ˙ r h ( e w f , r h 1 i n e r h i n ) ,
E s o l a r = m ˙ r h s w f ( e w f , r h 1 o u t e r h i n ) ,
E s o l a r = m ˙ 0 ( e w f , E c o i n e s h i n ) ,
E s o l a r = m ˙ 0 s w f ( e w f , E c o o u t e f w 1 i n ) .
Correspondingly, the coal exergy absorbed by working fluid for integration modes I, II, III and IV is given by Equations (28), (29), (30) and (31), respectively:
E c o a l = m ˙ 0 ( e s h o u t e s h i n ) + m ˙ r h ( e r h o u t e w f , r h 1 i n ) ,
E c o a l = m ˙ 0 ( e s h o u t e s h i n ) + m ˙ r h e r h o u t e r h i n s w f ( e w f , r h 1 o u t e r h i n ) ,
E c o a l = m ˙ 0 ( e s h o u t e w f , E c o i n ) + m ˙ r h ( e r h o u t e r h i n ) ,
E c o a l = m ˙ 0 e s h o u t e s h i n s w f ( e w f , E c o i n e s h i n ) + m ˙ r h ( e r h o u t e r h i n ) .
Consequently, the solar-generated electricity output is determined by aggregating the solar exergy contributions from both solar and coal sources, as defined in Equation (32):
P s o l a r = E s o l a r E c o a l + E s o l a r P t o t a l .
The annual solar-generated electricity is the cumulative sum of the hourly solar-generated electricity over the year, as shown in Equation (33):
P s o l a r , a n n u a l = i = 1 8760 P t o t a l , i .

3.4.2. Energy Conversion Efficiency

Solar heat-to-electricity efficiency is utilized to evaluate the instantaneous performance of the system in converting absorbed solar heat into electrical power, as shown in Equation (34):
η c = P s o l a r Q ˙ s o l a r , a b s × 100 % .
Correspondingly, the annual solar-to-electricity efficiency is utilized to evaluate the overall conversion performance from solar to solar-generated electricity over a year, as shown in Equation (35):
η S E E , a n n u a l = P s o l a r , a n n u a l 10 3 A s f j = 1 8760 G b n , j × 100 % .

3.4.3. LCOE

LCOE is used to investigate the economic performance of the system, as shown in Equation (36) [27,28],
LCOE = ( C C C R F ) + O & M c c o a l Δ m c o a l , a n n u a l c CO 2 Δ m CO 2 , a n n u a l 10 3 P n e t , s o l a r , a n n u a l .
where CC is the increased total capital cost after the introduction of solar heat into the system; CRF is the capital recovery factor defined in Equation (37); O&M is the annual operating and maintenance expenditure; ccoal is the unit price of standard coal; Δmcoal,annual is the mass of annual saved standard coal compared to the system without solar integration; c CO 2 is the unit price of CO2 reduction; and Δ m CO 2 , a n n u a l is the annual incremental mass of CO2 reduction compared to the system without solar integration.
C R F = r ( r + 1 ) D ( r + 1 ) D 1 .
where r is the discount rate, which is taken as 5% in this paper; and D is the lifetime of the power station, which takes 25 years in this paper.

4. Case Study

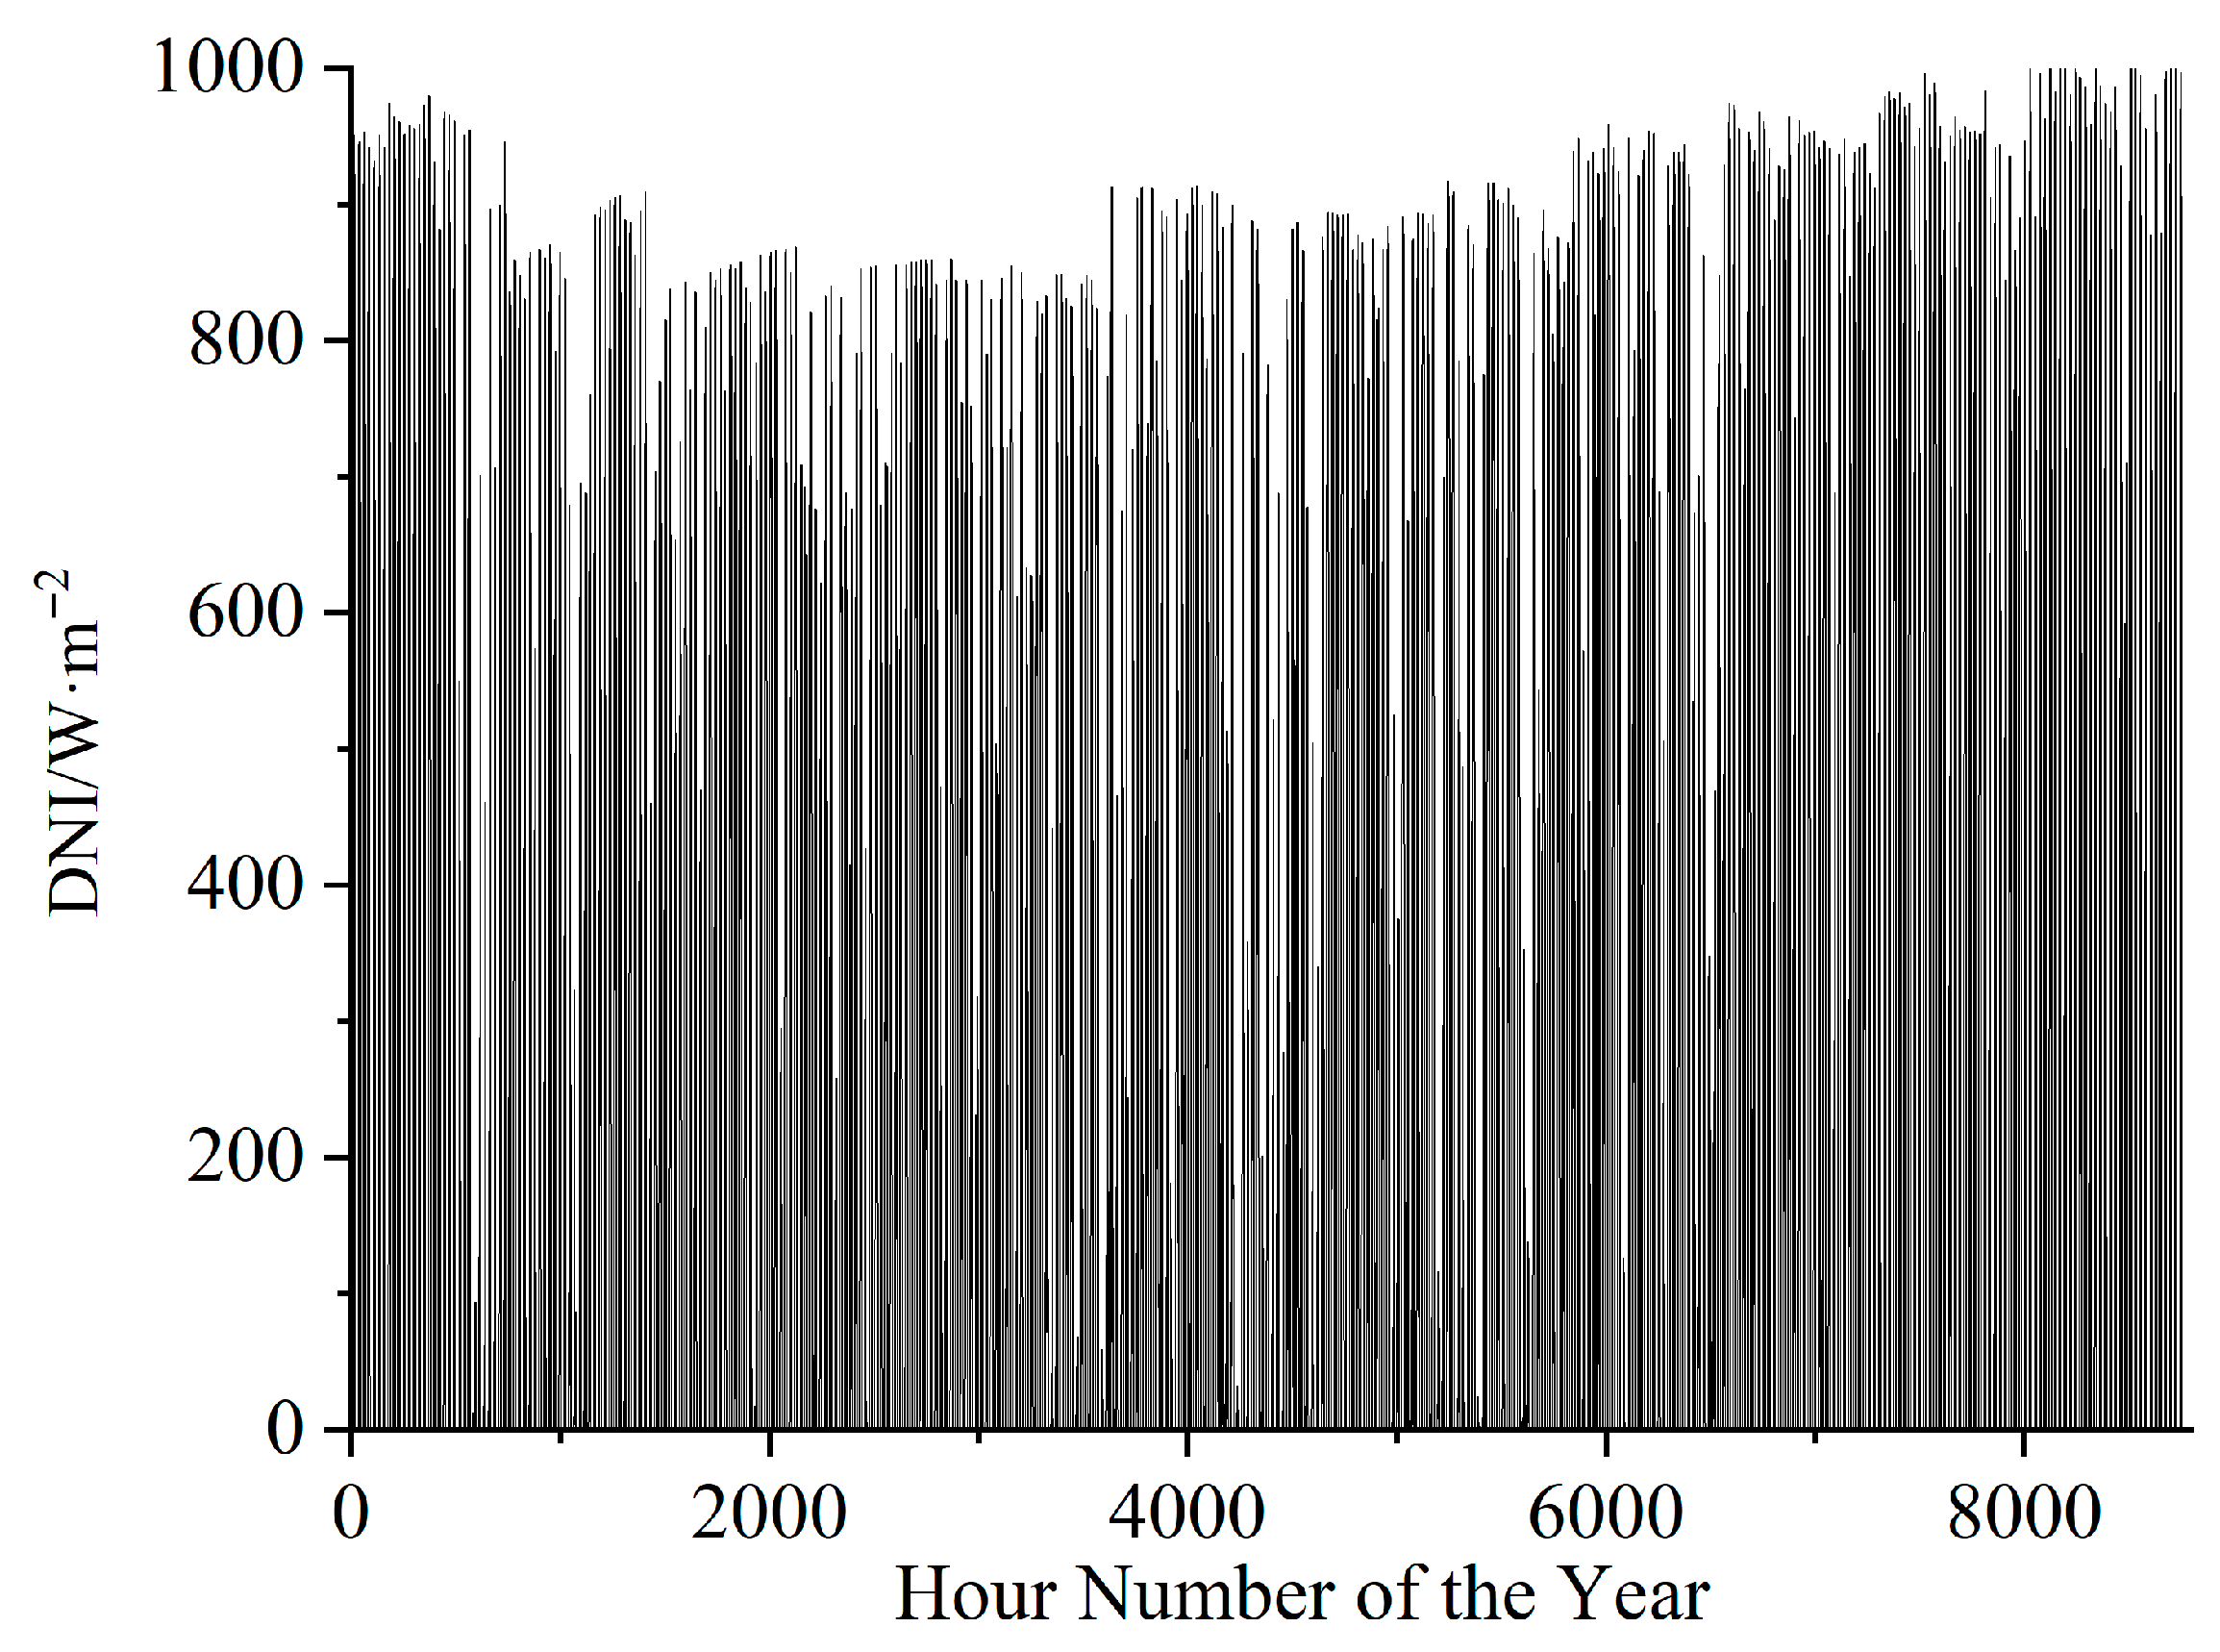
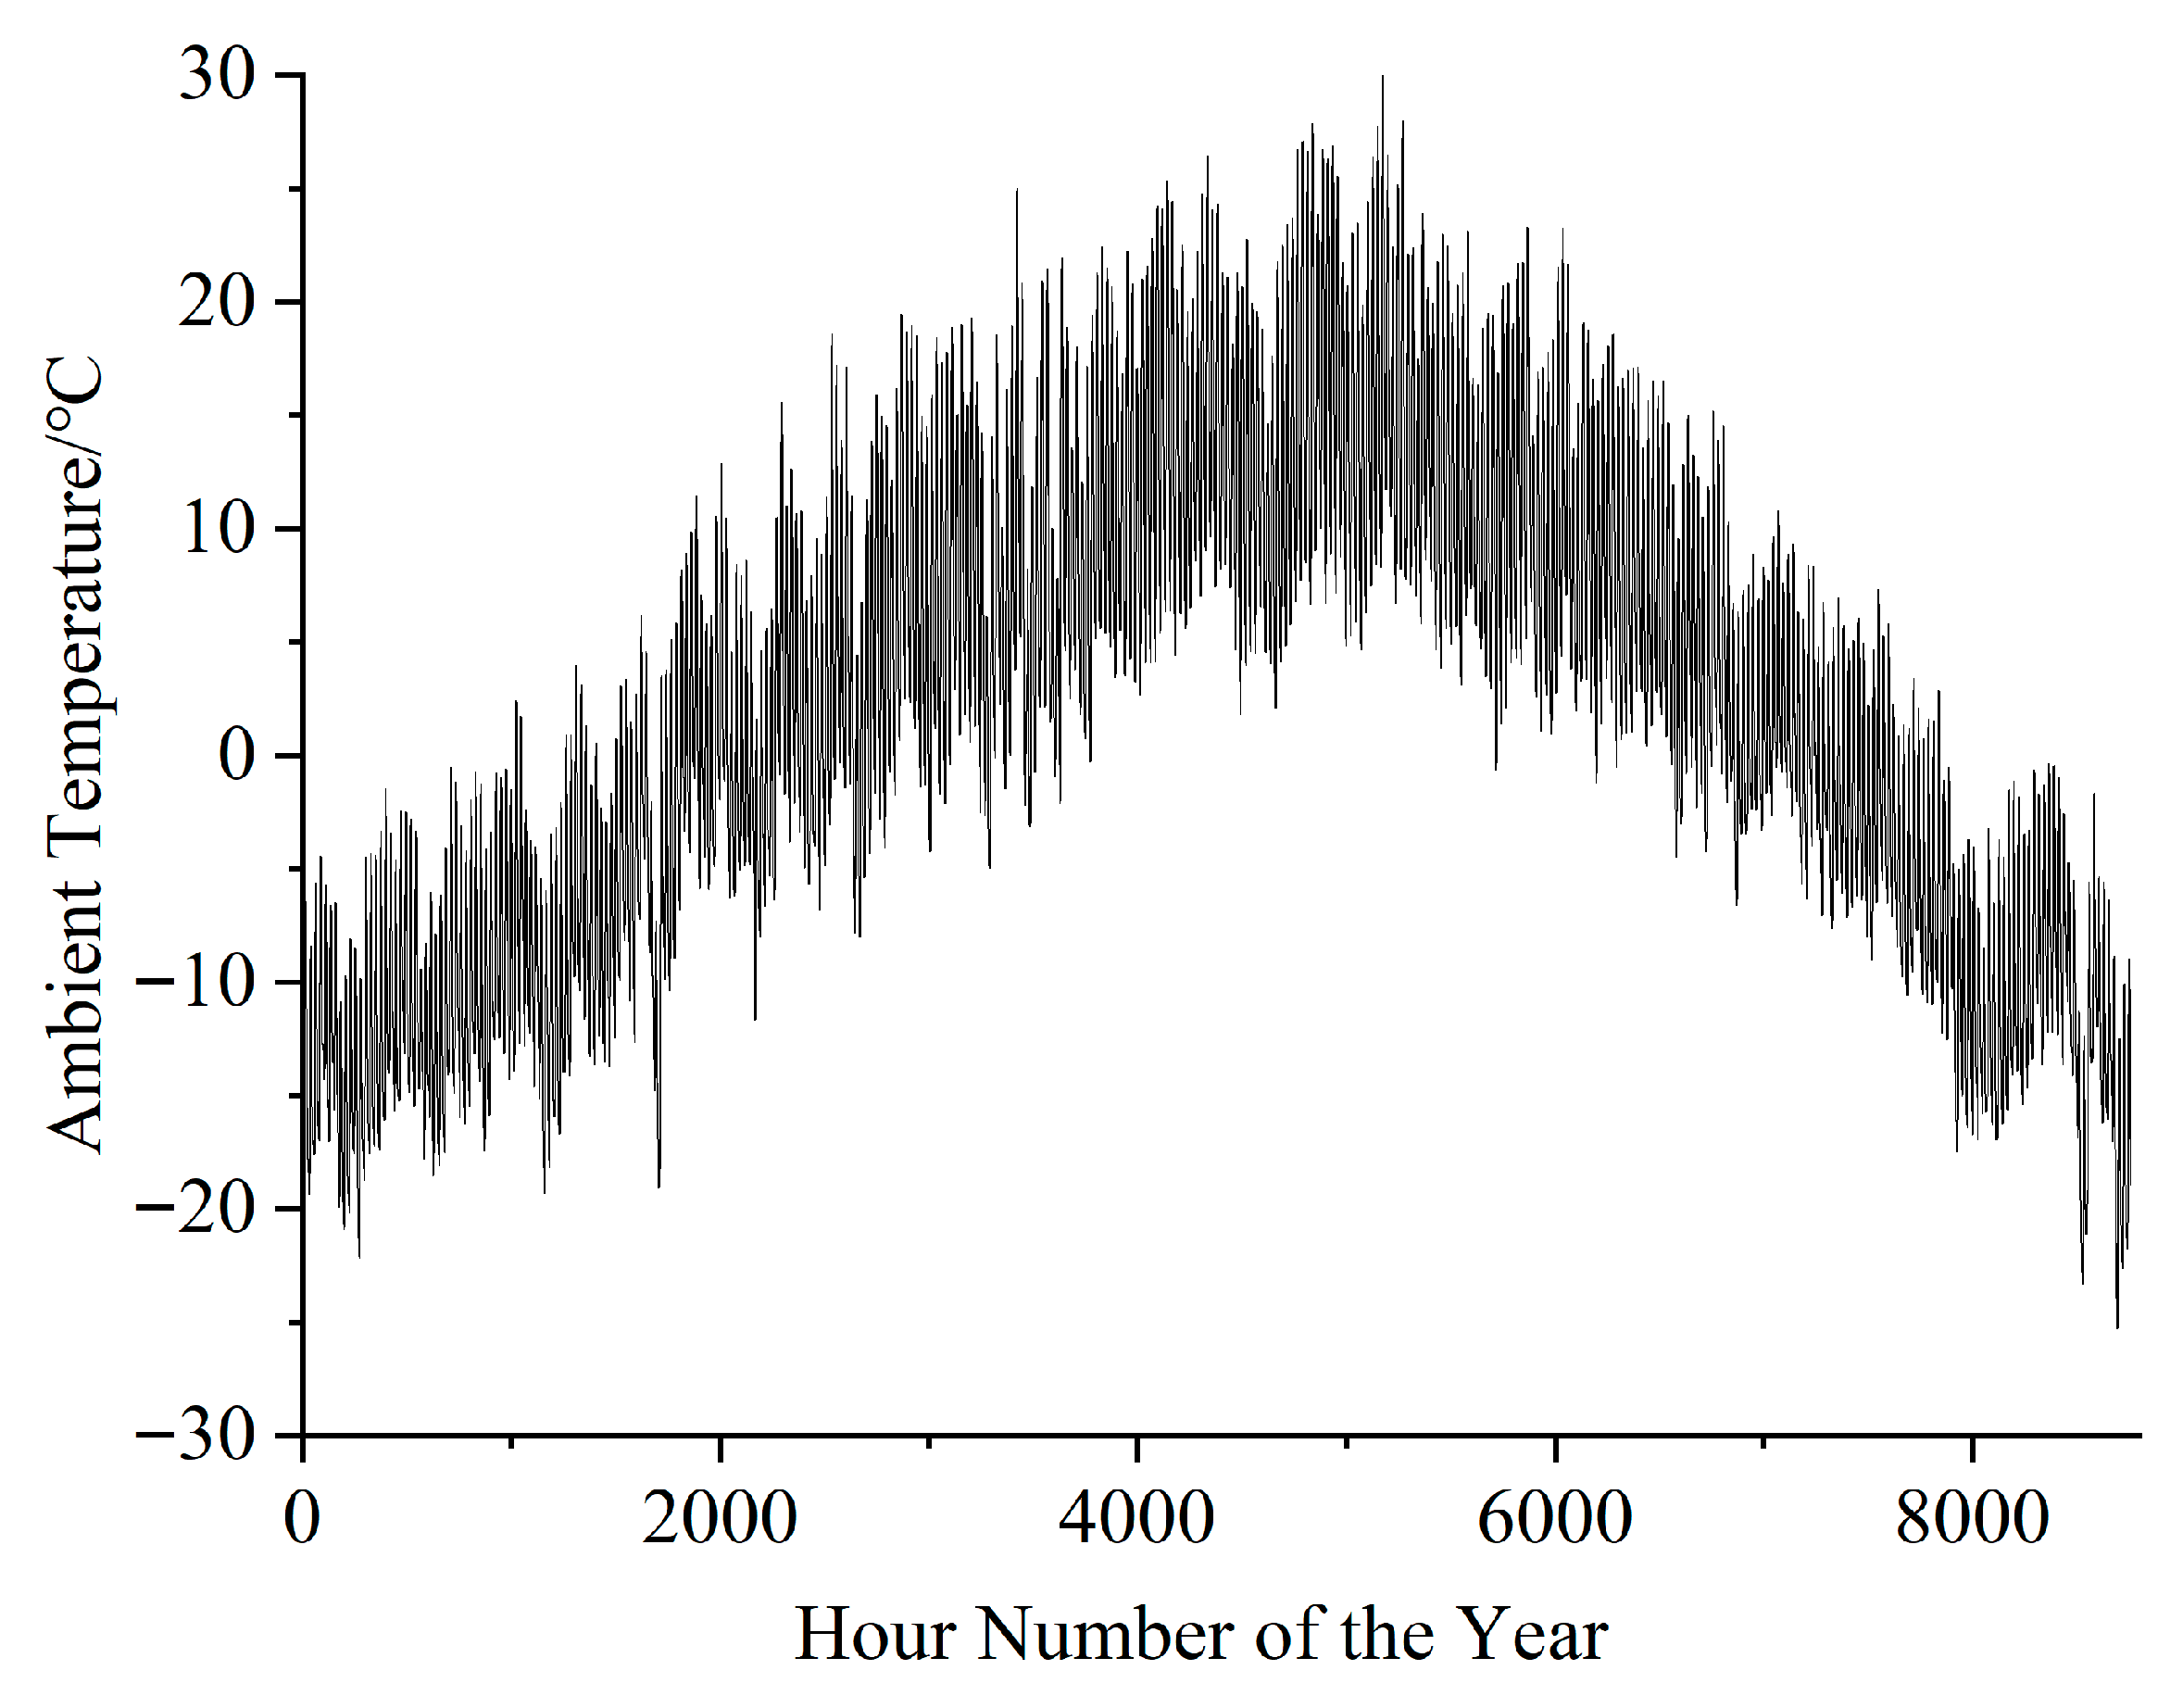
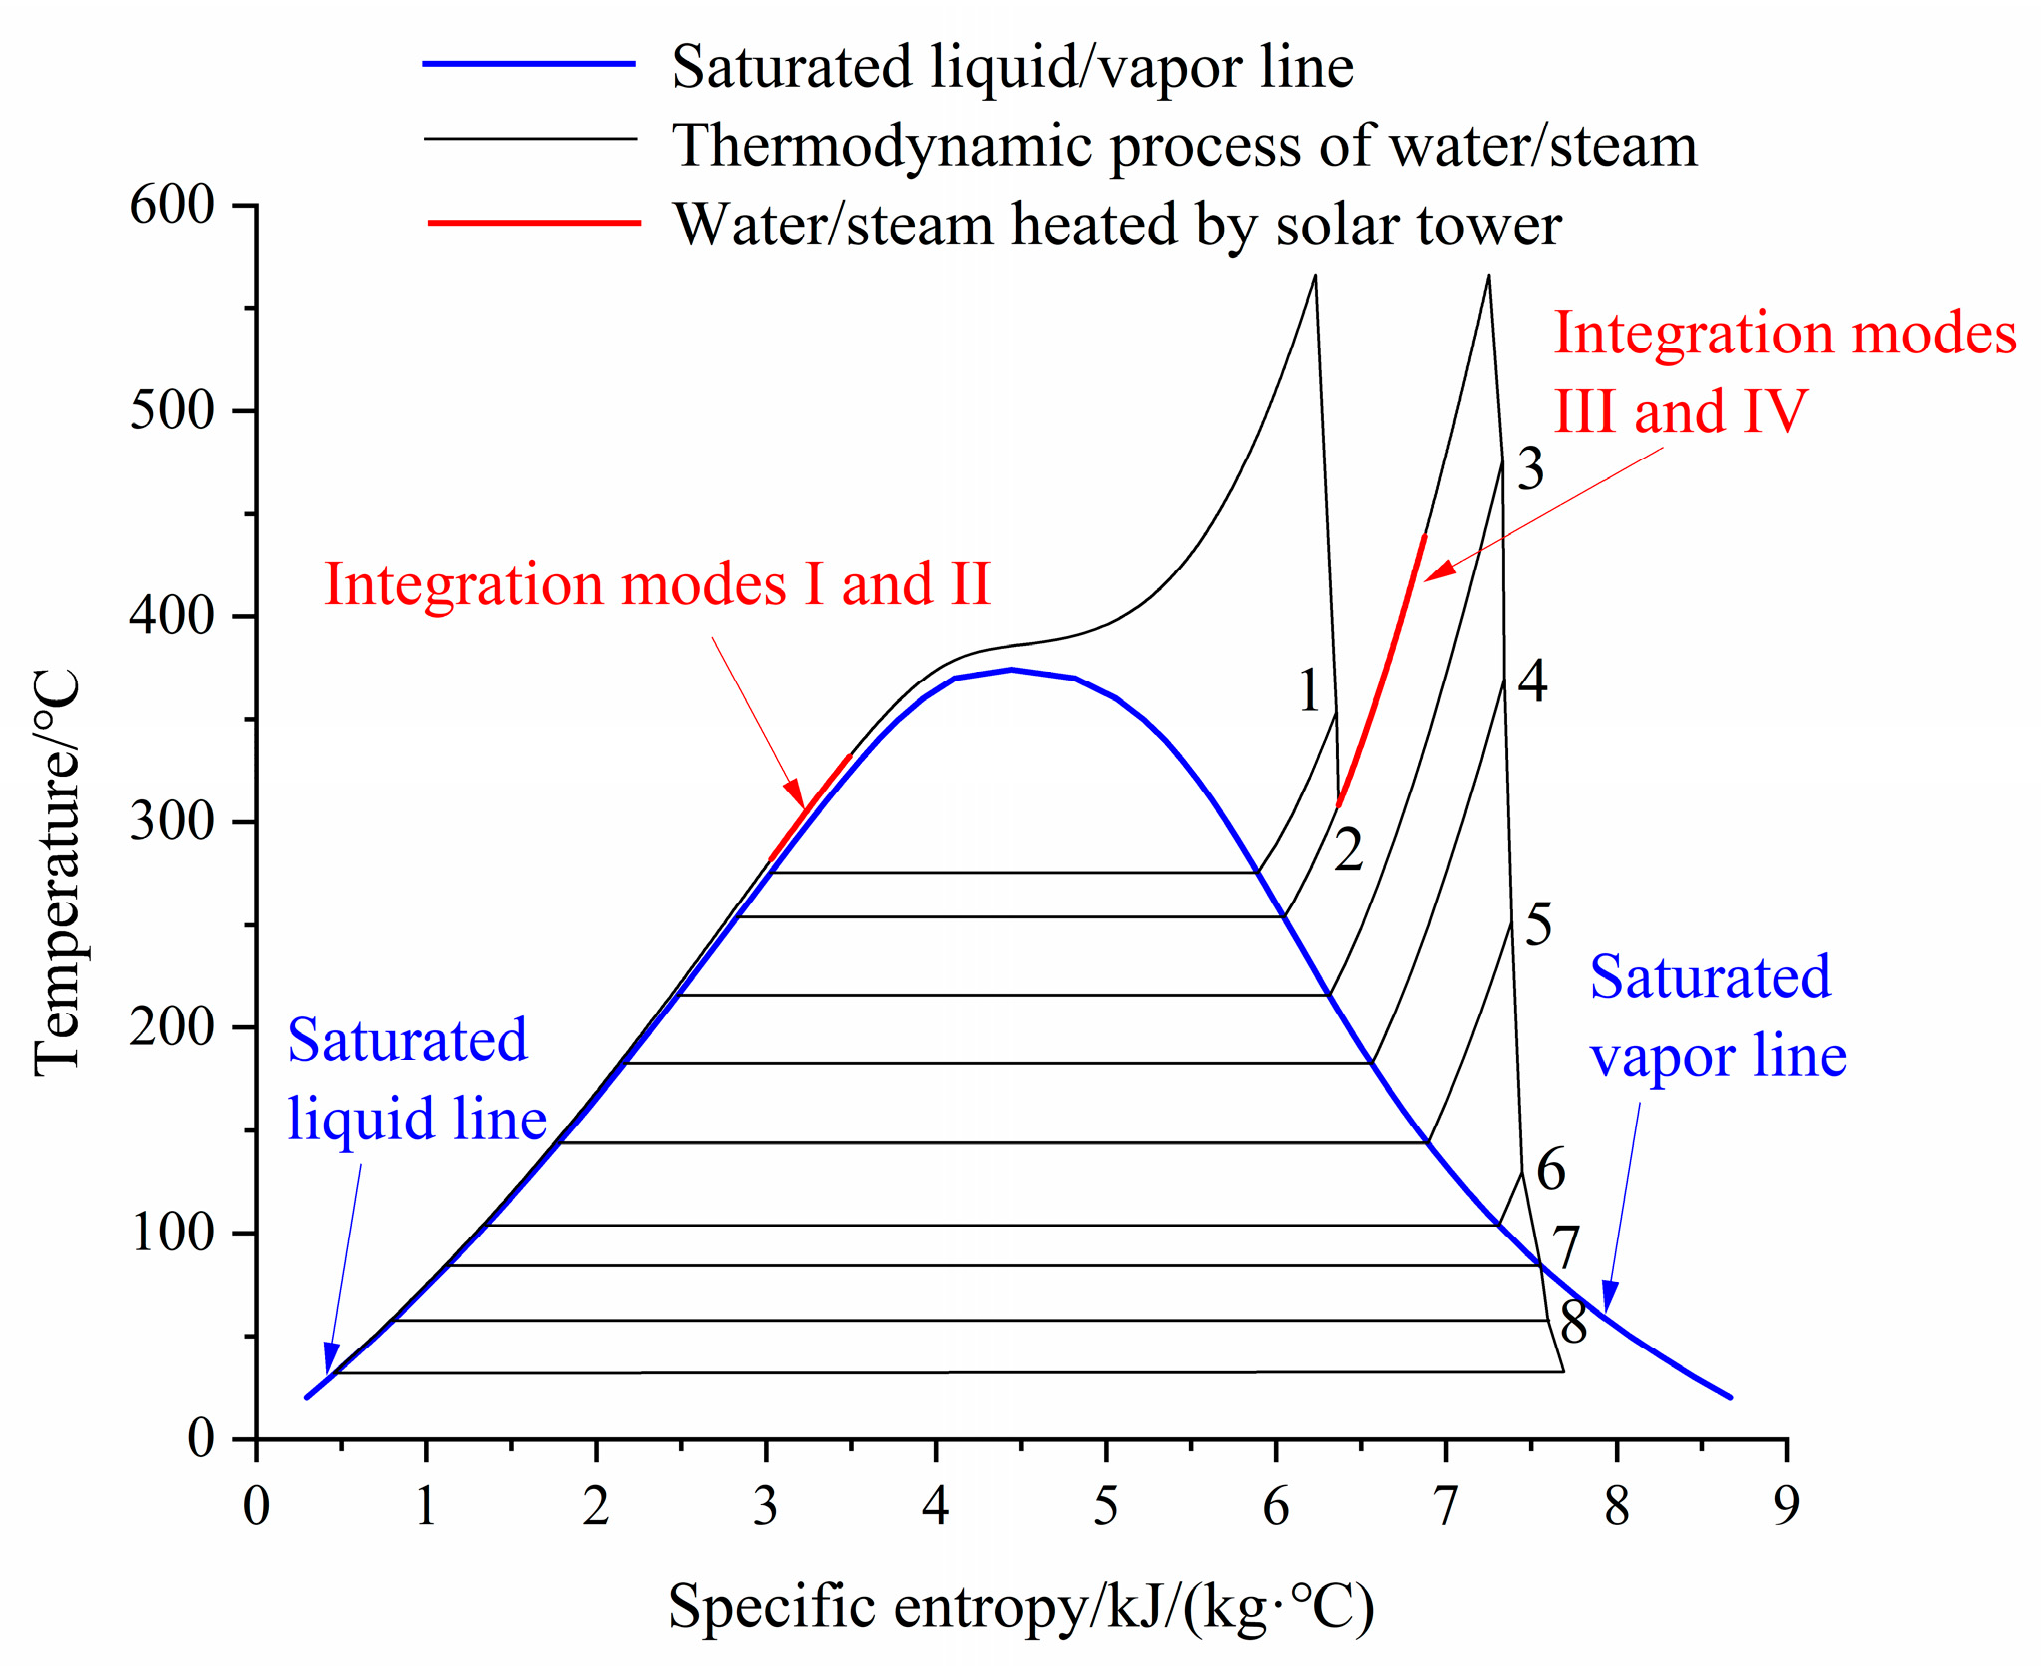
This study selects a 600 MW unit as the original coal-fired system. The key design parameters of the reference coal-fired power generation system are summarized in Table 1. The key design parameters in each regenerative heat exchanger are summarized in Table 2. The major structural parameters of the boiler are provided in Table 3. The simulation model is validated against design-point data from our previous study to ensure its accuracy [29]. Delingha, Qinghai Province of China (37.37° N, 97.36° E), is selected as the location for simulation. Figure 2 and Figure 3, respectively, show the annual hourly DNI and ambient temperature distribution [30]. Figure 4 shows the temperature-specific entropy diagram among various integration modes. The modelings of the turbine and feedwater preheating subsystem and the boiler subsystem are implemented and solved within the MATLAB 2025b programming environment. The integrated solar heat from the solar subsystem is calculated by SAM software (version 2025.4.16) developed by NREL.

4.1. Thermodynamic Performance of the System

4.1.1. Bypassed Flue Gas and Exhaust Temperature

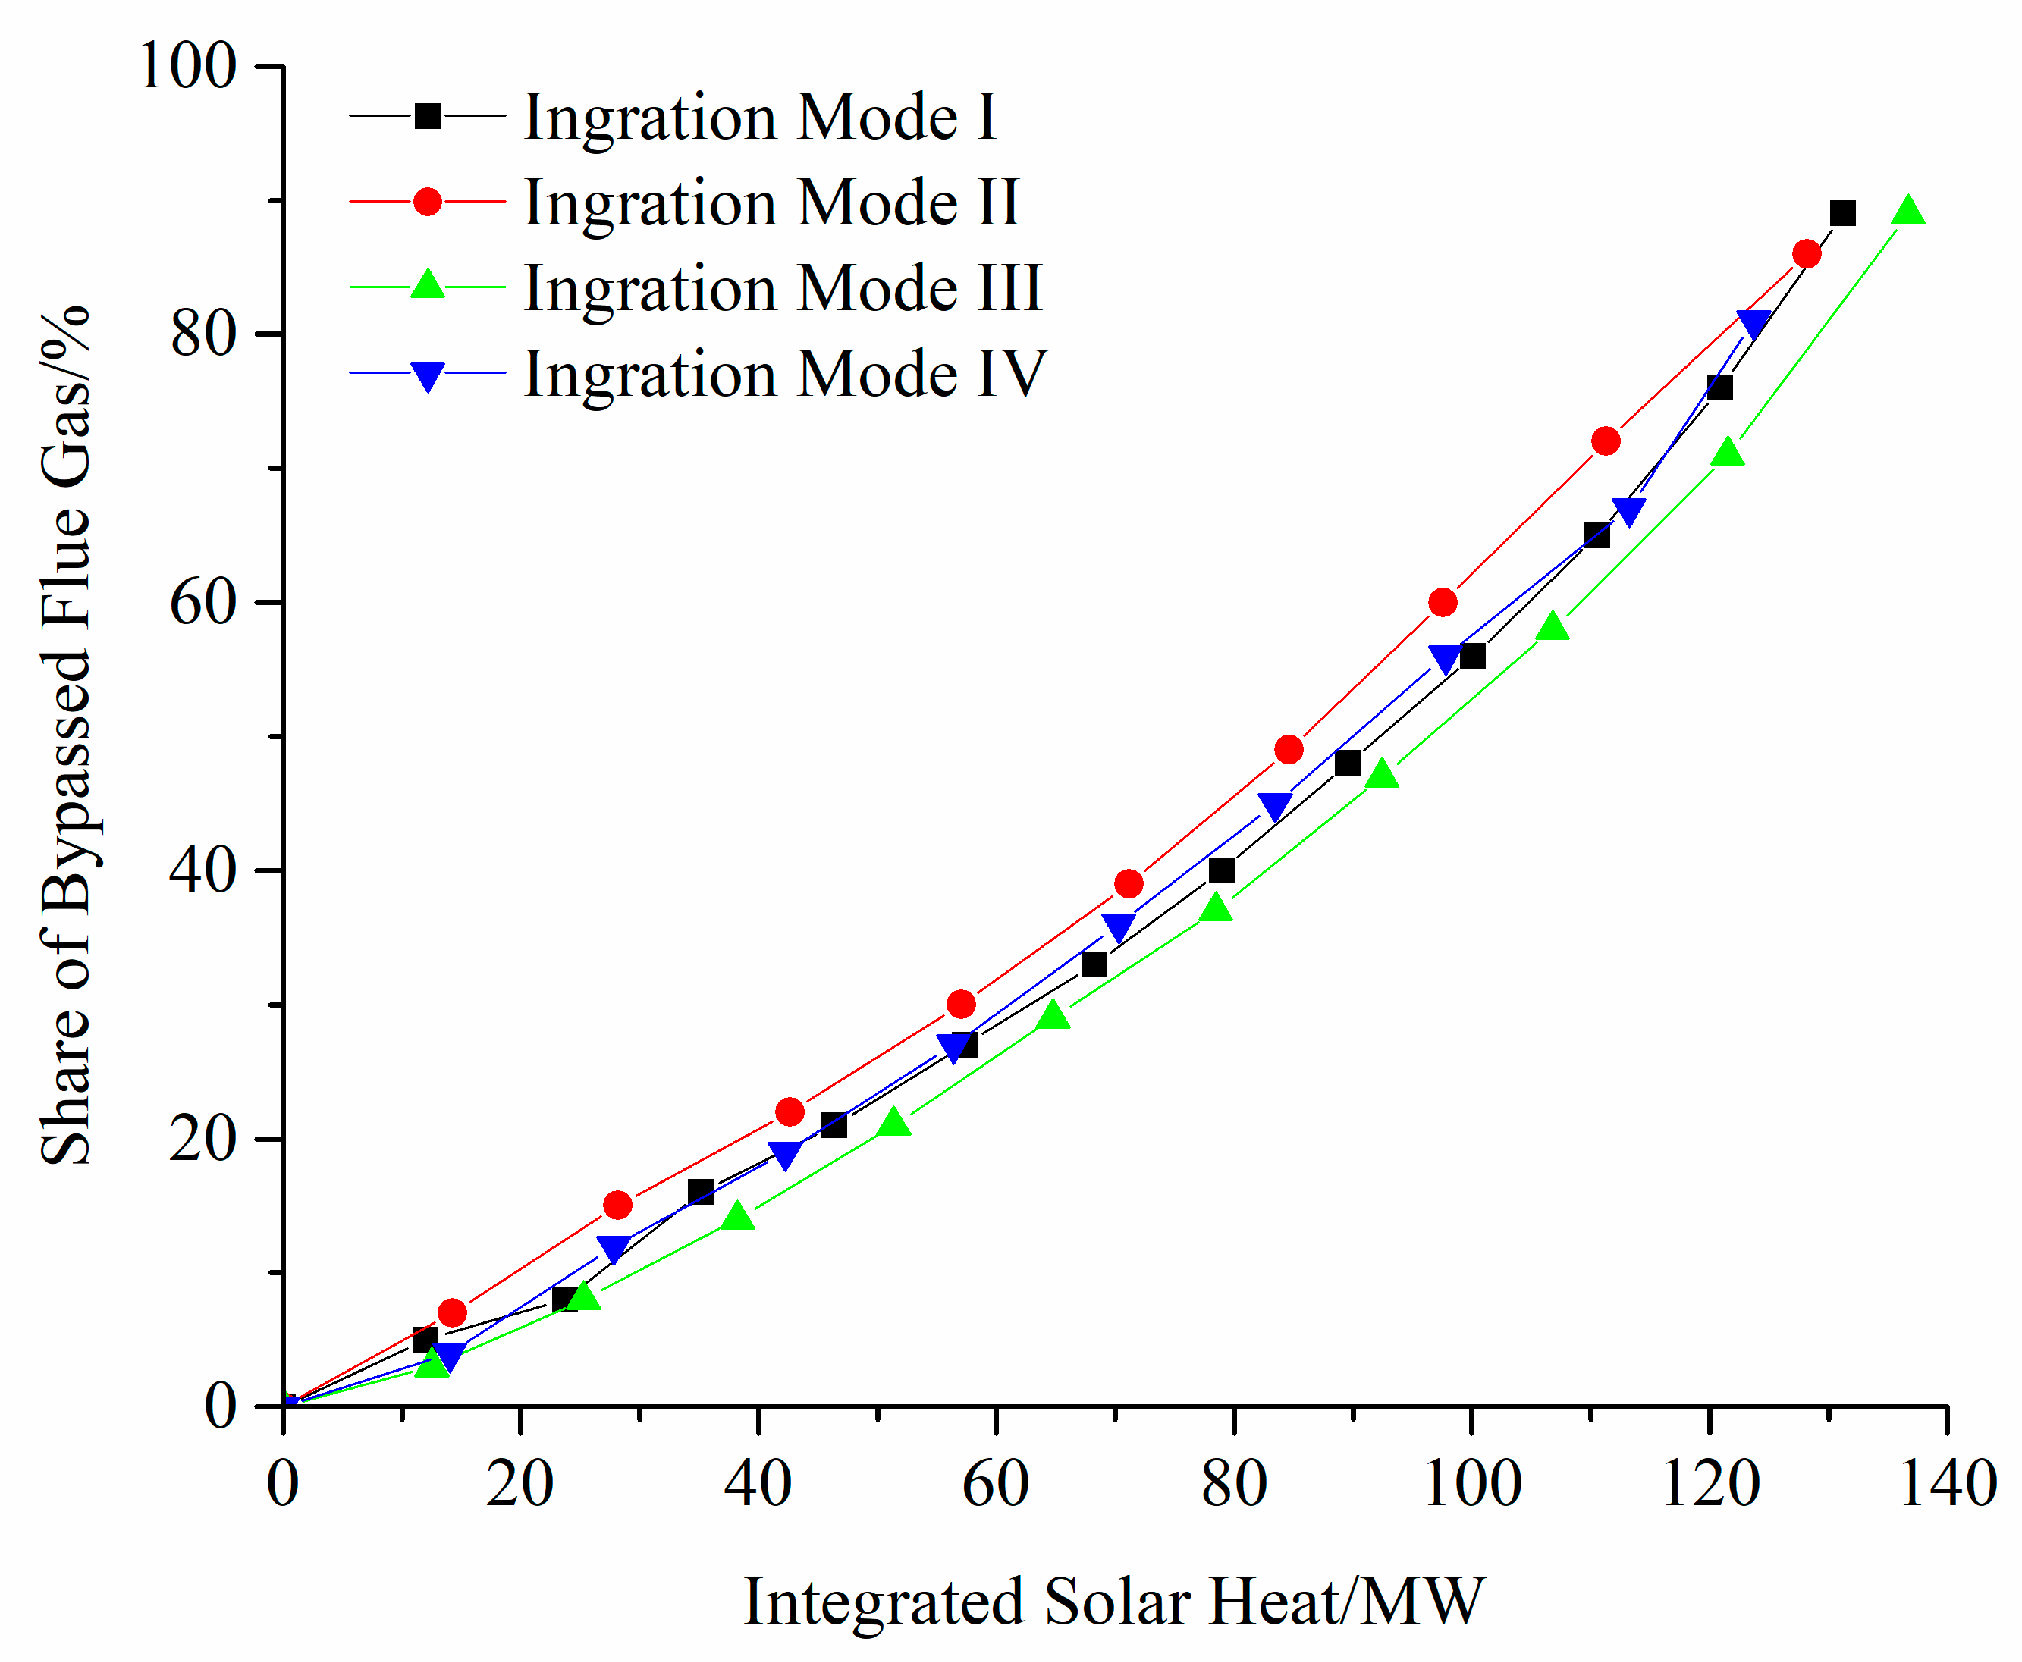
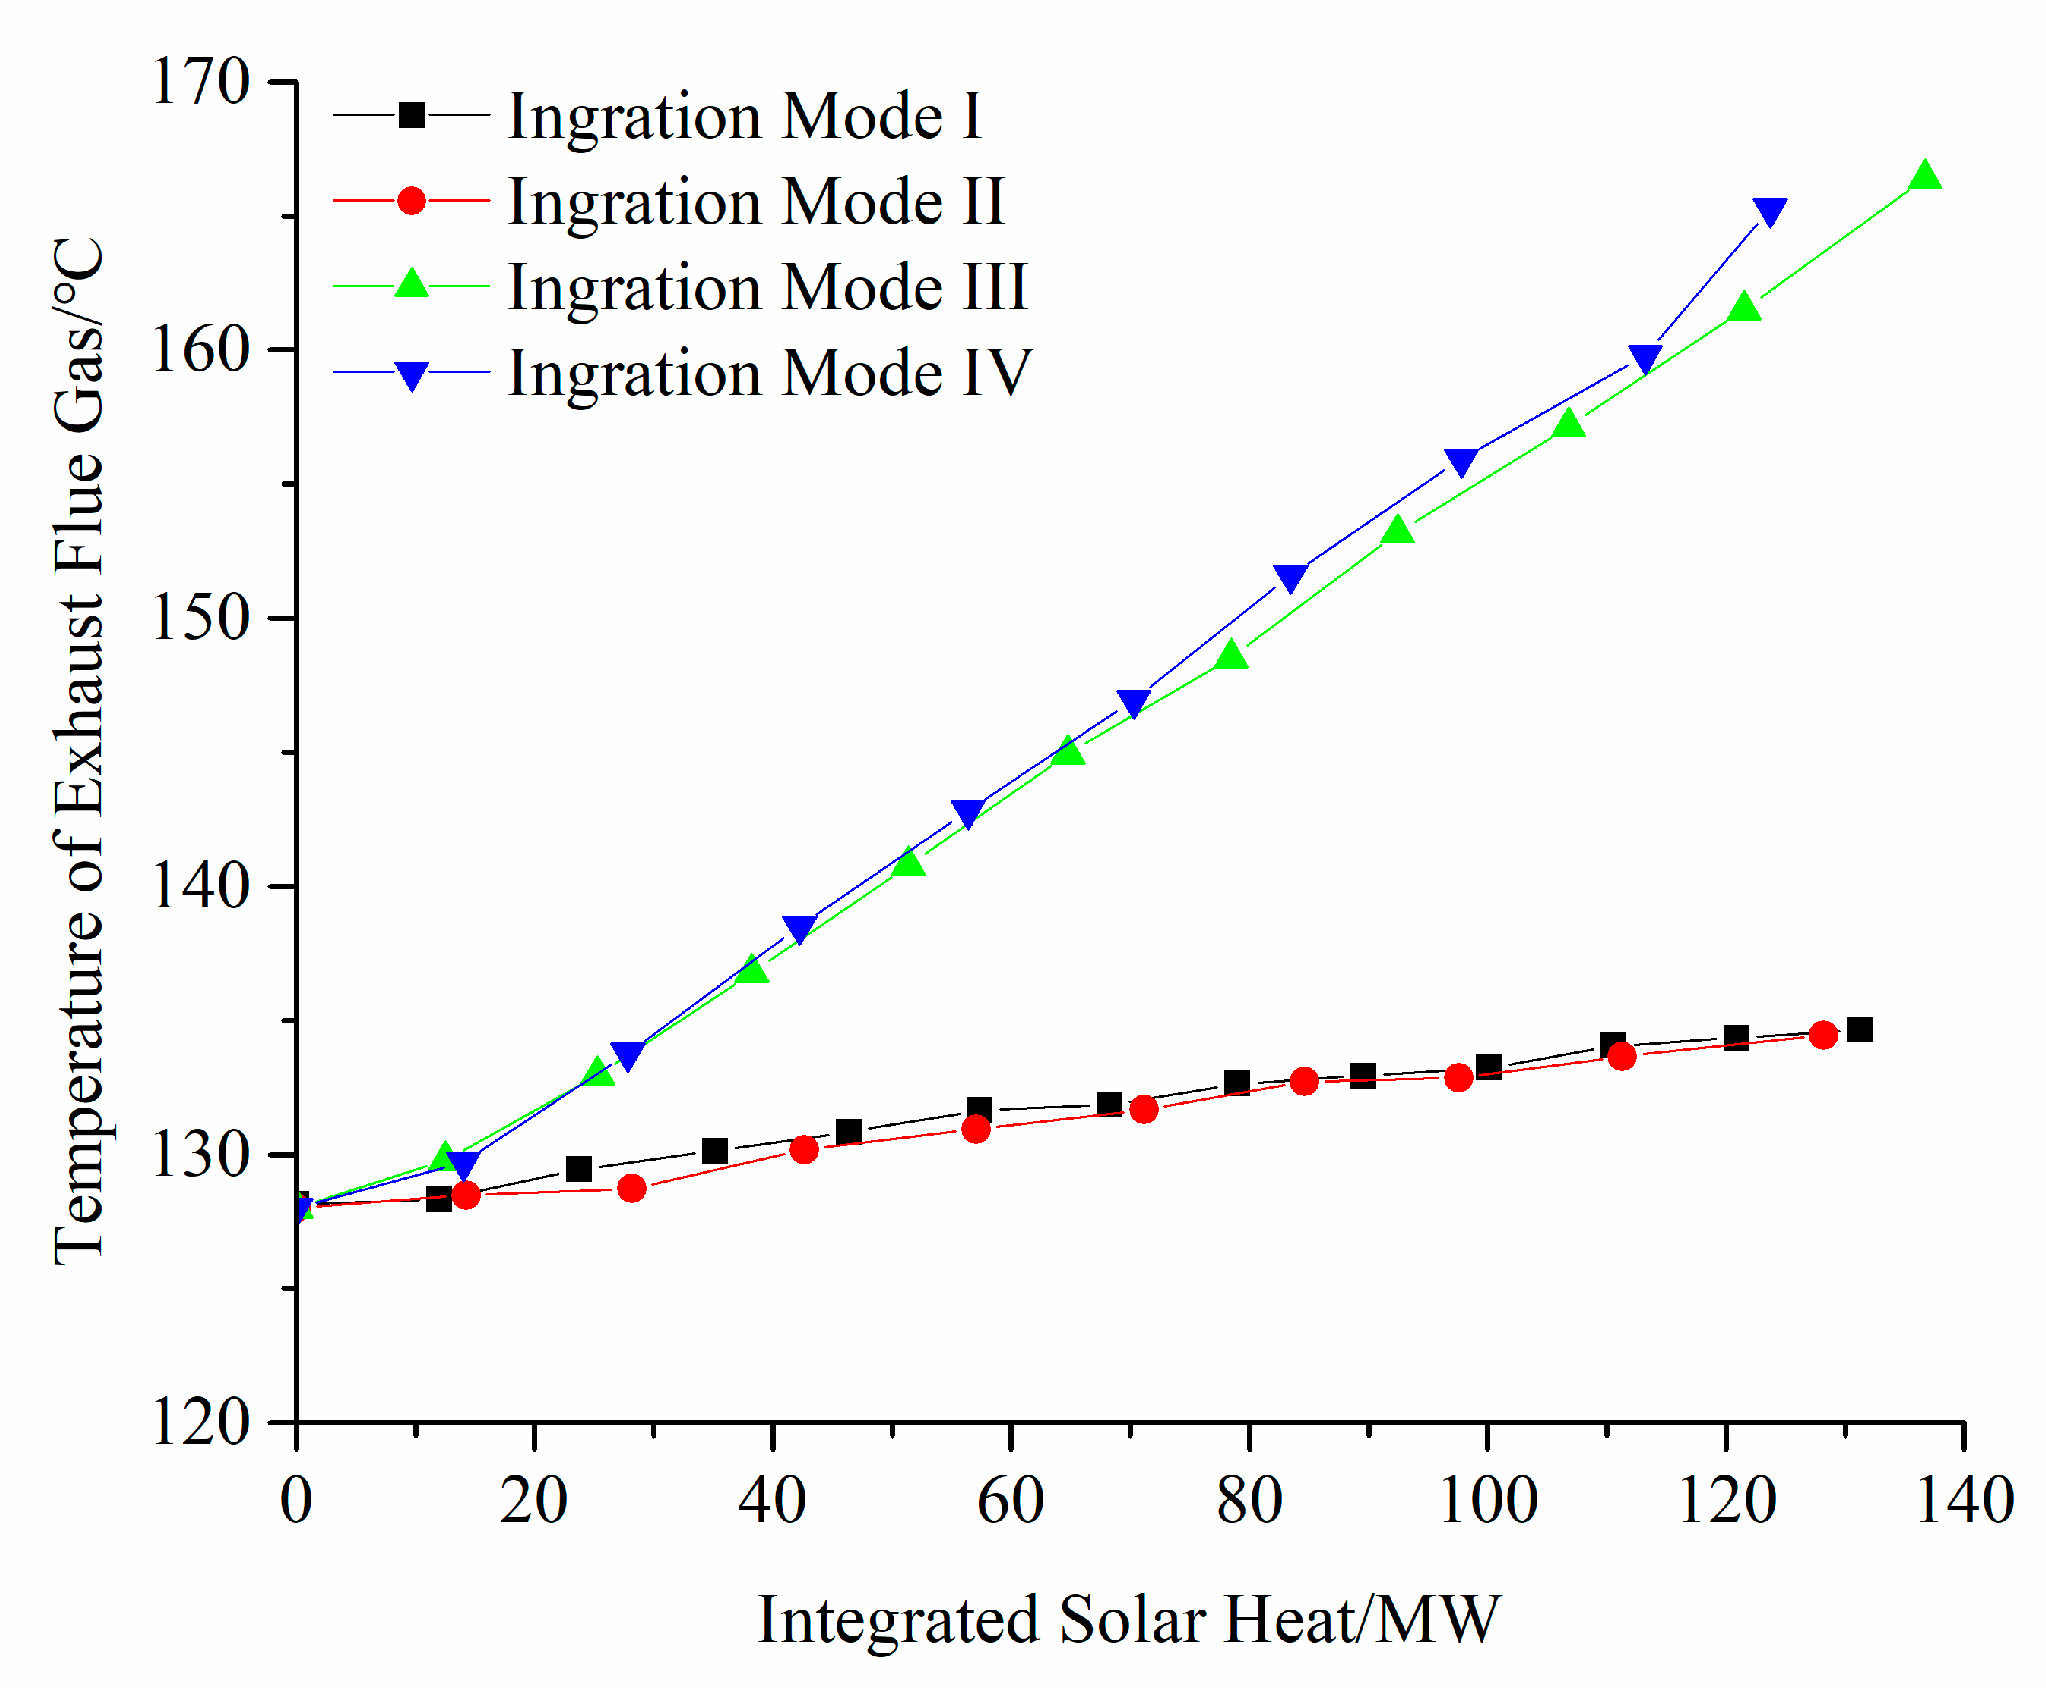
Figure 5 and Figure 6, respectively, illustrate the variation in share of the bypassed flue gas and the temperature of the exhaust flue gas with integrated solar heat under different integration modes. The results indicate that the share of the bypassed flue gas increases with the integrated solar heat for all integration modes. This is a direct control strategy to maintain the designated steam temperatures at the boiler outlet when integrated solar heat displaces a portion of heat originally provided by the flue gas.
Furthermore, a distinct difference is observed in the exhaust flue gas temperature. The temperature exhibits a significant increase with solar heat input for integration modes III and IV, whereas it remains almost unchanged for integration modes I and II. This divergence stems from the different locations of solar integration and their impact on the boiler’s heat exchange. In integration modes III and IV, solar heat is integrated to preheat the feedwater at the economizer inlet. This directly reduces the heat absorption from the flue gas in the economizer. Consequently, the flue gas enters the subsequent air heaters at a higher temperature, leading to an overall rise in the exhaust temperature. In contrast, for integration modes I and II, solar heat is added at the primary RH (horizontal part). The reduced thermal load in the reheater section is compensated by bypassing a portion of the flue gas, which effectively modulates the heat transfer without significantly altering the temperature of the remaining flue gas that continues through the economizer and air heaters. Thus, the final exhaust temperature remains relatively stable.

4.1.2. Solar-Generated Electricity Influenced by Integrated

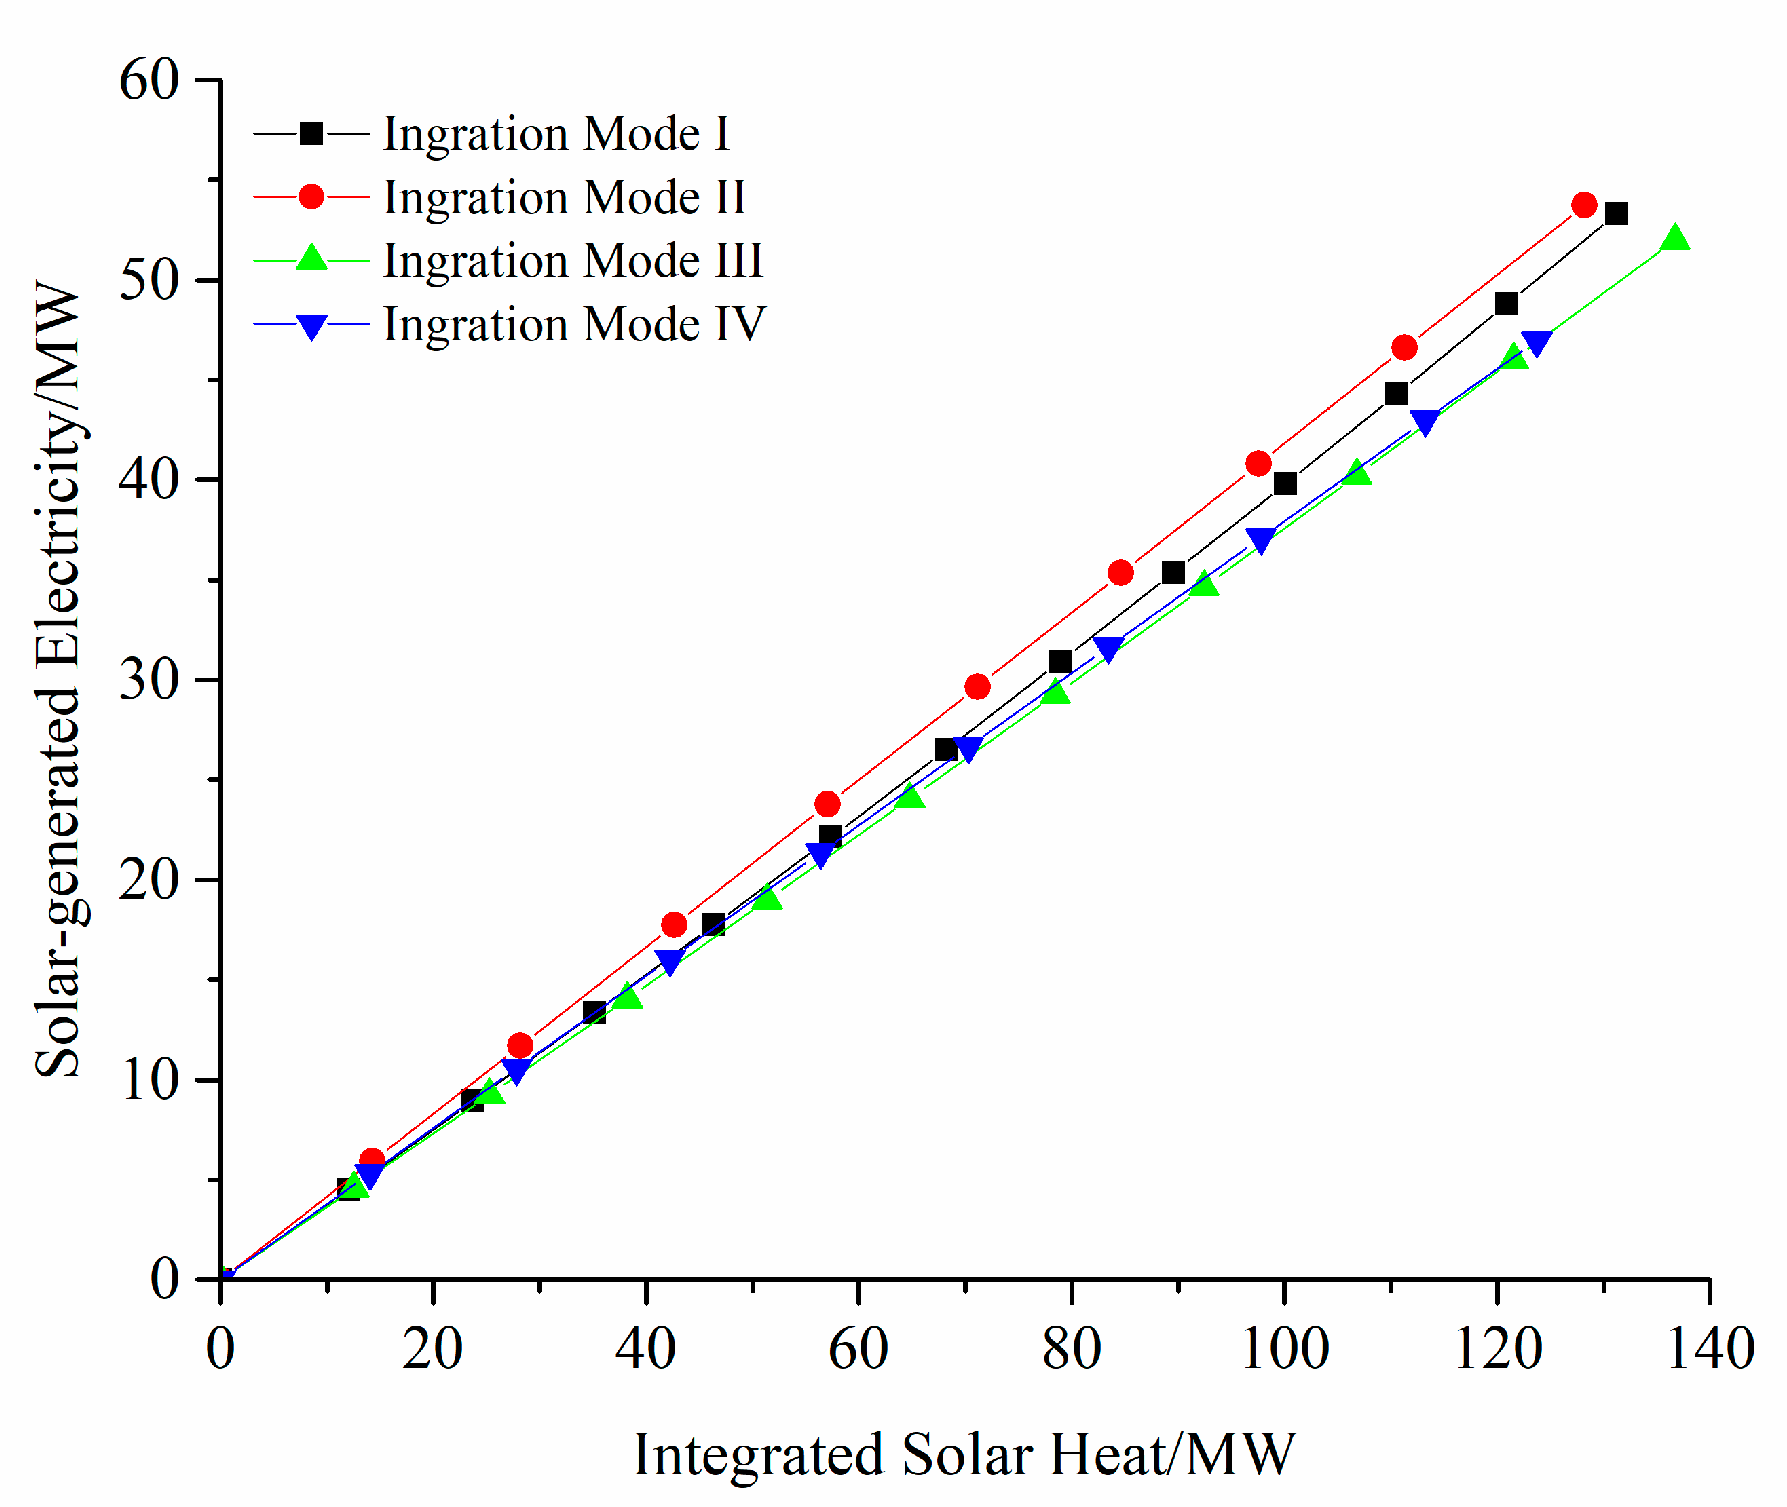
Figure 7 illustrates the variation in solar-generated electricity with integrated solar heat under different integration modes. The results indicate that solar-generated electricity increases with the integrated solar heat for all integration modes. Integration modes I and II yield higher solar-generated electricity than modes III and IV under the same solar heat input. This difference is due to the higher operating temperature of the primary RH (horizontal part) compared to the economizer. Therefore, integration modes I and II with high-exergy solar heat addition generate more solar-generated electricity compared to modes III and IV.
Furthermore, integration mode II generates more solar-generated electricity than that mode I. This is because mode II uses a parallel arrangement with the primary RH (horizontal part), and the parallel configuration allows the solar field to operate at a higher temperature. This higher operation temperature enhances the energy quality of the solar heat.

4.1.3. Solar Heat-to-Electricity Efficiency

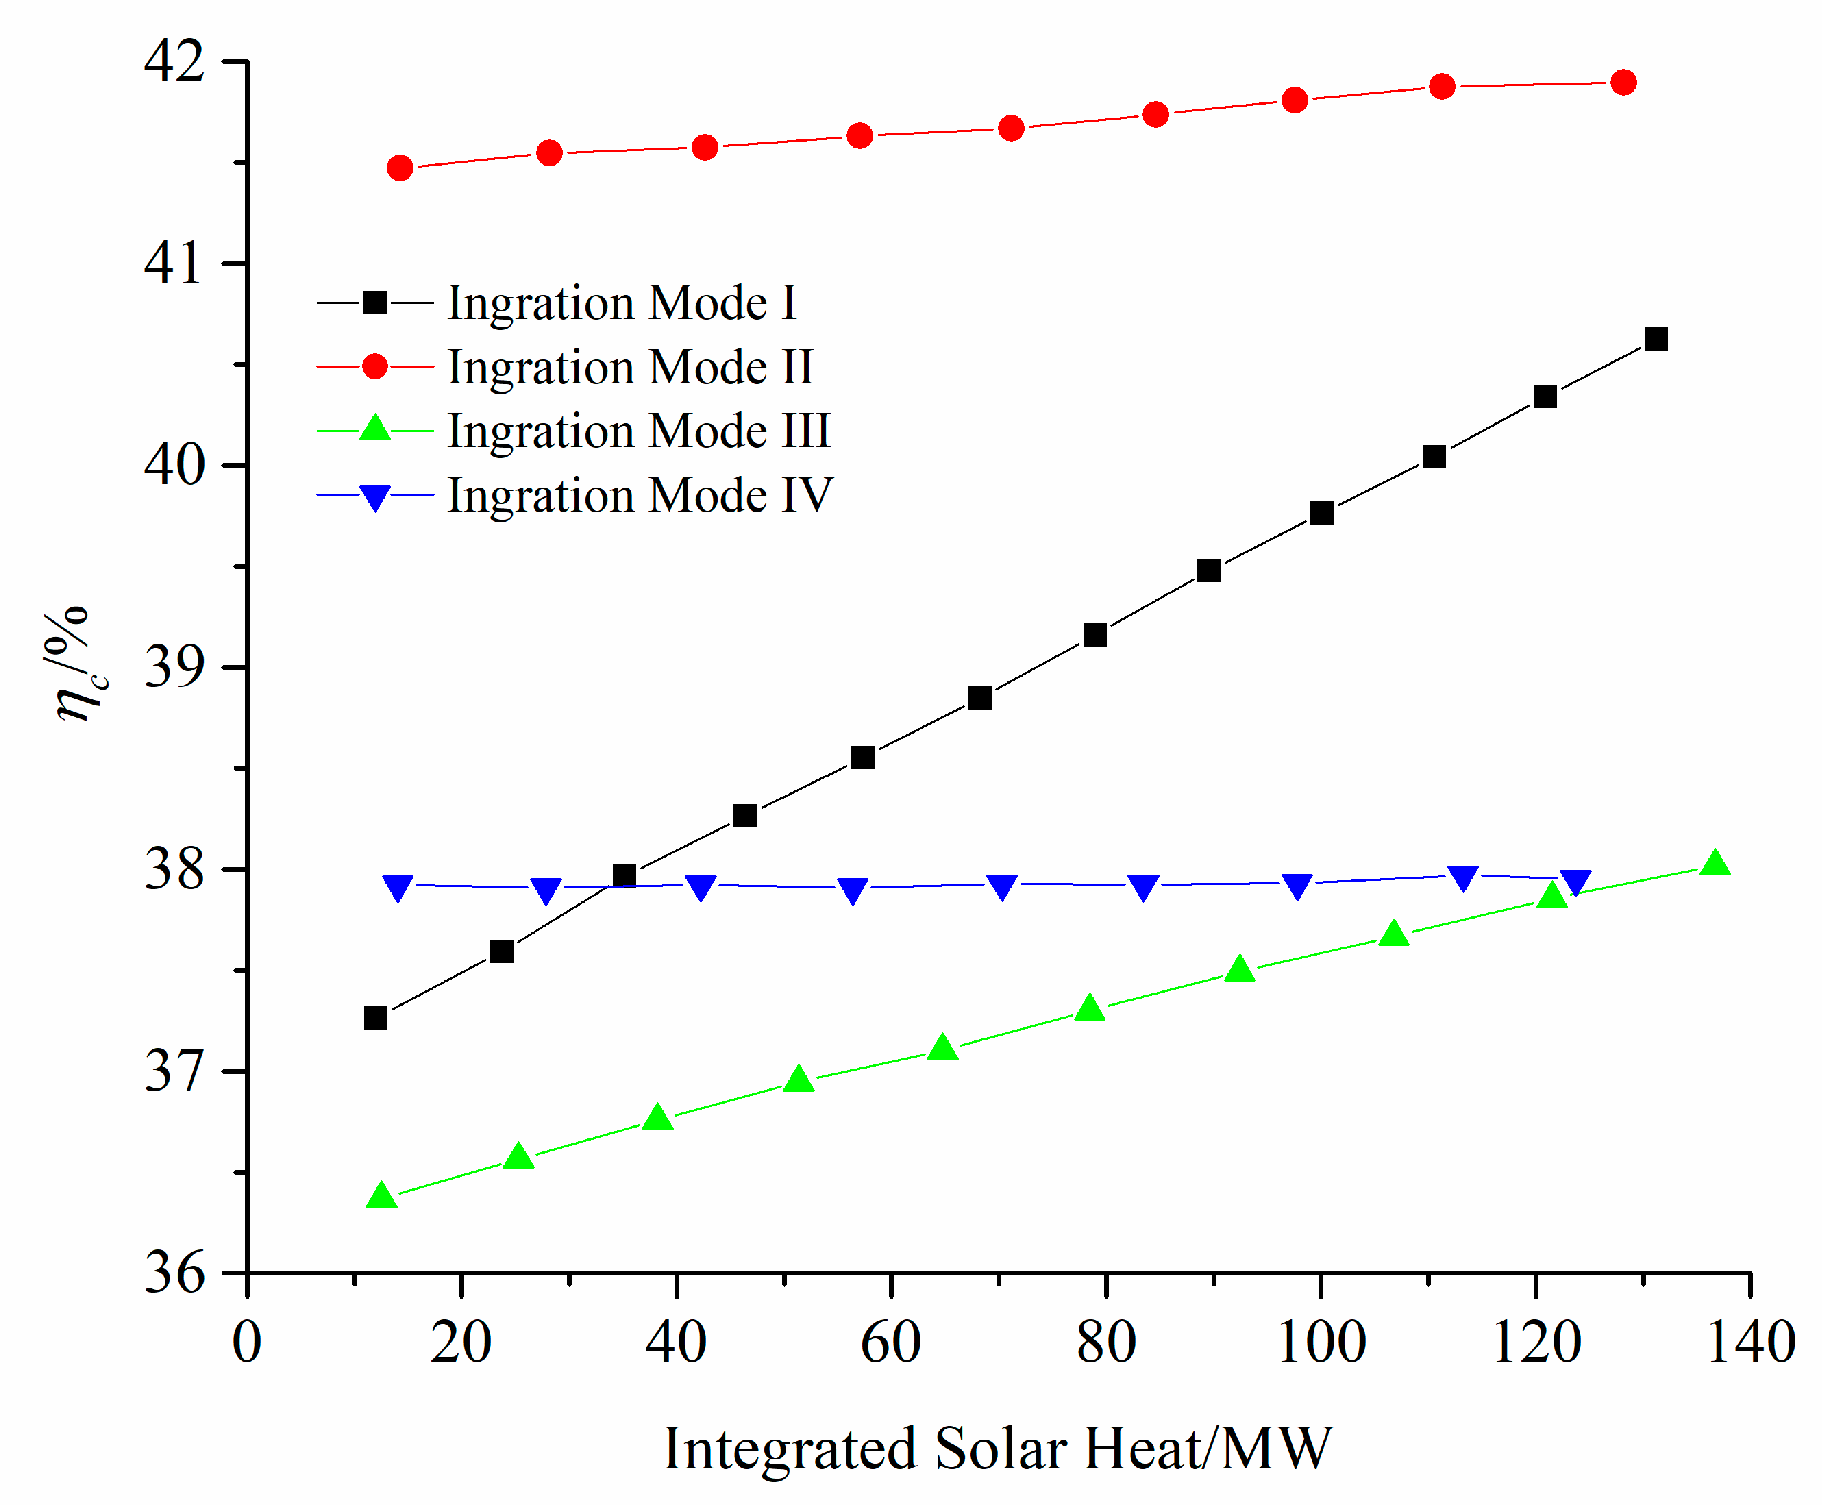
Figure 8 shows the variations in solar heat-to-electricity efficiencies with integrated solar heat under different integration modes. The results reveal two distinct trends, which are fundamentally determined by how each integration mode affects the exergy quality of the solar input.
For the series configurations (integration modes I and III), the efficiency increases linearly with solar heat input. This is a direct result of the series arrangement: as more solar heat is added, the operating temperature of the solar field rises correspondingly, which enhances the exergy grade of the solar energy, thereby improving its conversion efficiency within the power cycle.
In contrast, for the parallel configurations (integration modes II and IV), the efficiency remains largely constant. In these modes, the solar field operates at a fixed temperature, decoupled from the main fluid stream’s temperature glide. Consequently, the exergy per unit of solar heat remains unchanged regardless of input quantity, leading to stable efficiency.
Consequently, integration mode II achieves the highest solar heat-to-electricity efficiency among all modes, because it combines the advantage of higher temperature rise with integration at the higher exergy location compared to other integration modes.

4.2. Annual Performance Analysis

4.2.1. Annual Solar-Generated Electricity

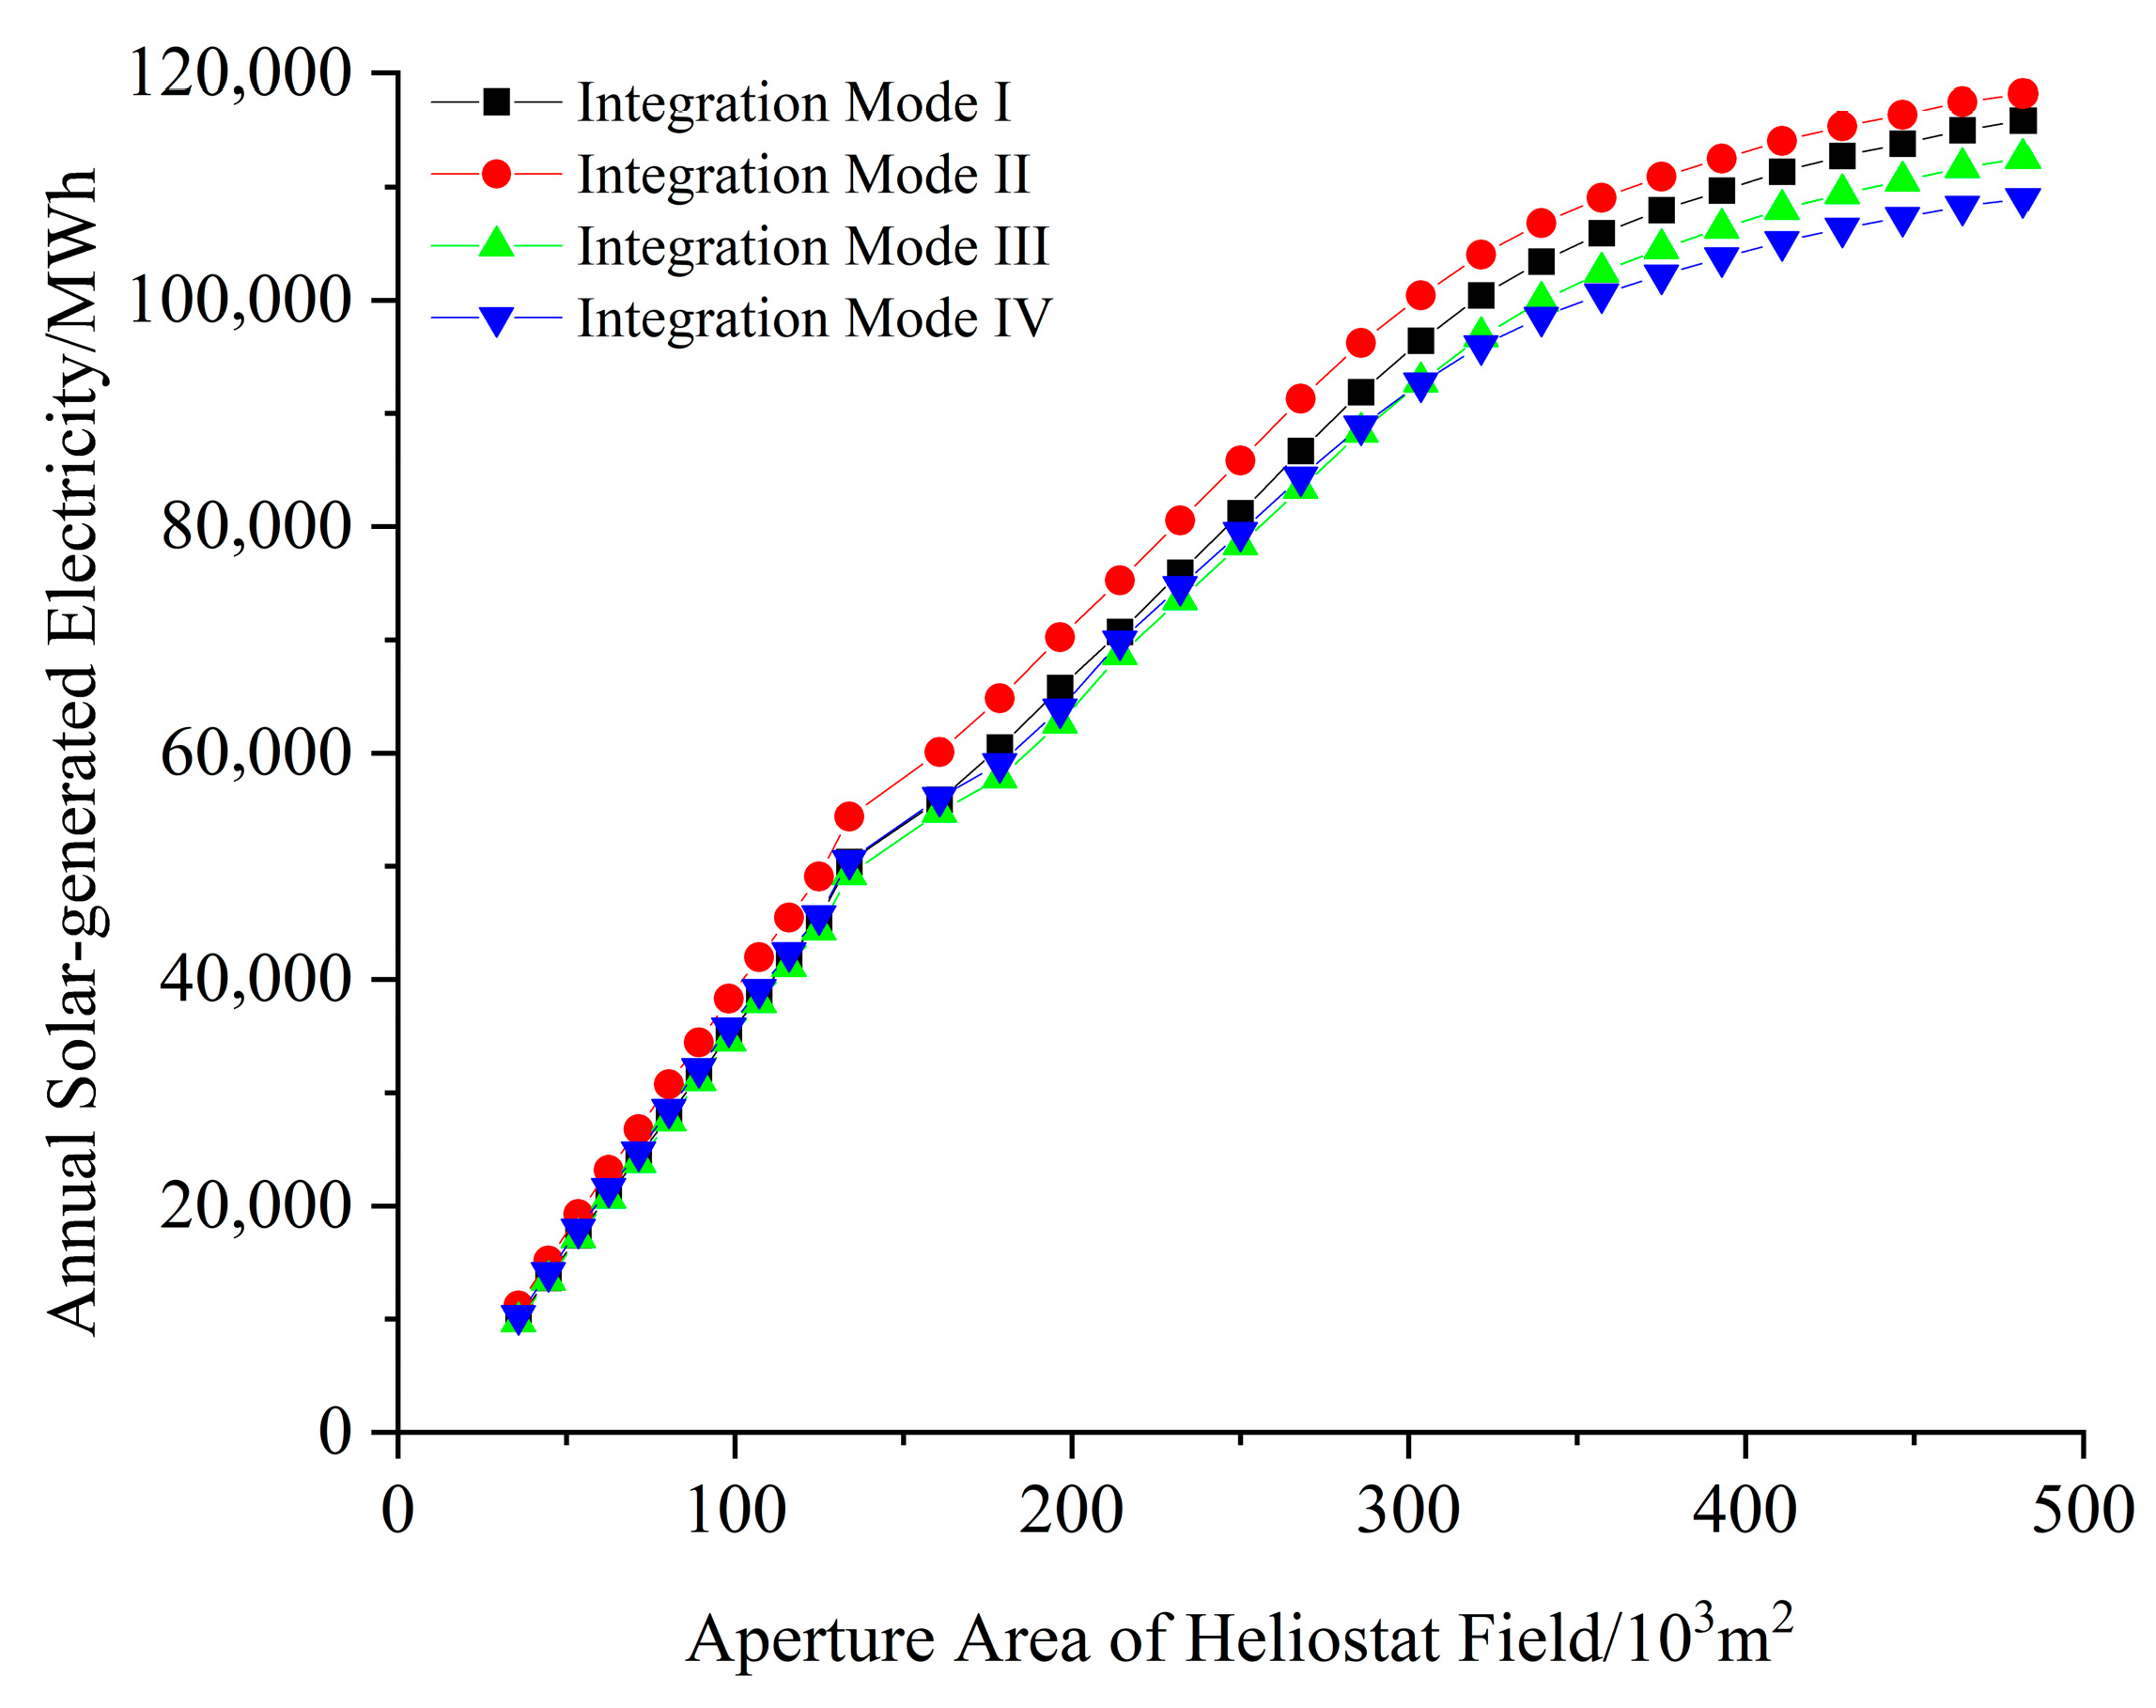
Figure 9 illustrates the variations in annual solar-generated electricity in the heliostat field aperture area for different integration modes. The results demonstrate that the annual solar electricity output increases with the aperture area for all integration modes. However, a distinct change in the growth rate is observed at a critical aperture area of approximately 125,025.6 m2. The increase is nearly linear below this threshold, and diminishes progressively above this threshold.
The diminished increase trend can be attributed to two primary factors. Firstly, as the heliostat field expands, a greater proportion of heliostats are positioned farther from the central receiver. This leads to a decline in the average efficiencies of atmospheric and optical attenuation. Furthermore, it reduces the integrated solar heat per unit of added aperture area. Secondly, the original coal-fired power unit has a limited capacity to integrate solar heat. Exceeding this integration limit results in the dumping of surplus solar heat. This occurs more frequently with larger aperture areas, rendering part of them unproductive for power generation. Consequently, an excessively large heliostat field is not thermodynamically optimal.
Furthermore, integration modes I and II, where the solar field is coupled with the primary RH (horizontal part), achieve a higher annual solar electricity output than integration modes III and IV (integrated with the economizer) under the same aperture area of the heliostat field. This performance advantage stems from the higher operating temperature, which allows for the conversion of higher-exergy solar heat into electricity.
Similarly, the parallel configurations (integration modes II and IV) outperform their series counterparts (integration modes I and III, respectively). This is because the parallel arrangement enables the solar field to operate at a higher and more thermally efficient operation temperature. Among all the designs, integration mode II yields the highest annual solar-generated electricity, as it benefits from both the high-exergy integration at the primary RH (horizontal part) and the parallel configuration.

4.2.2. Annual Solar-to-Electricity Efficiency

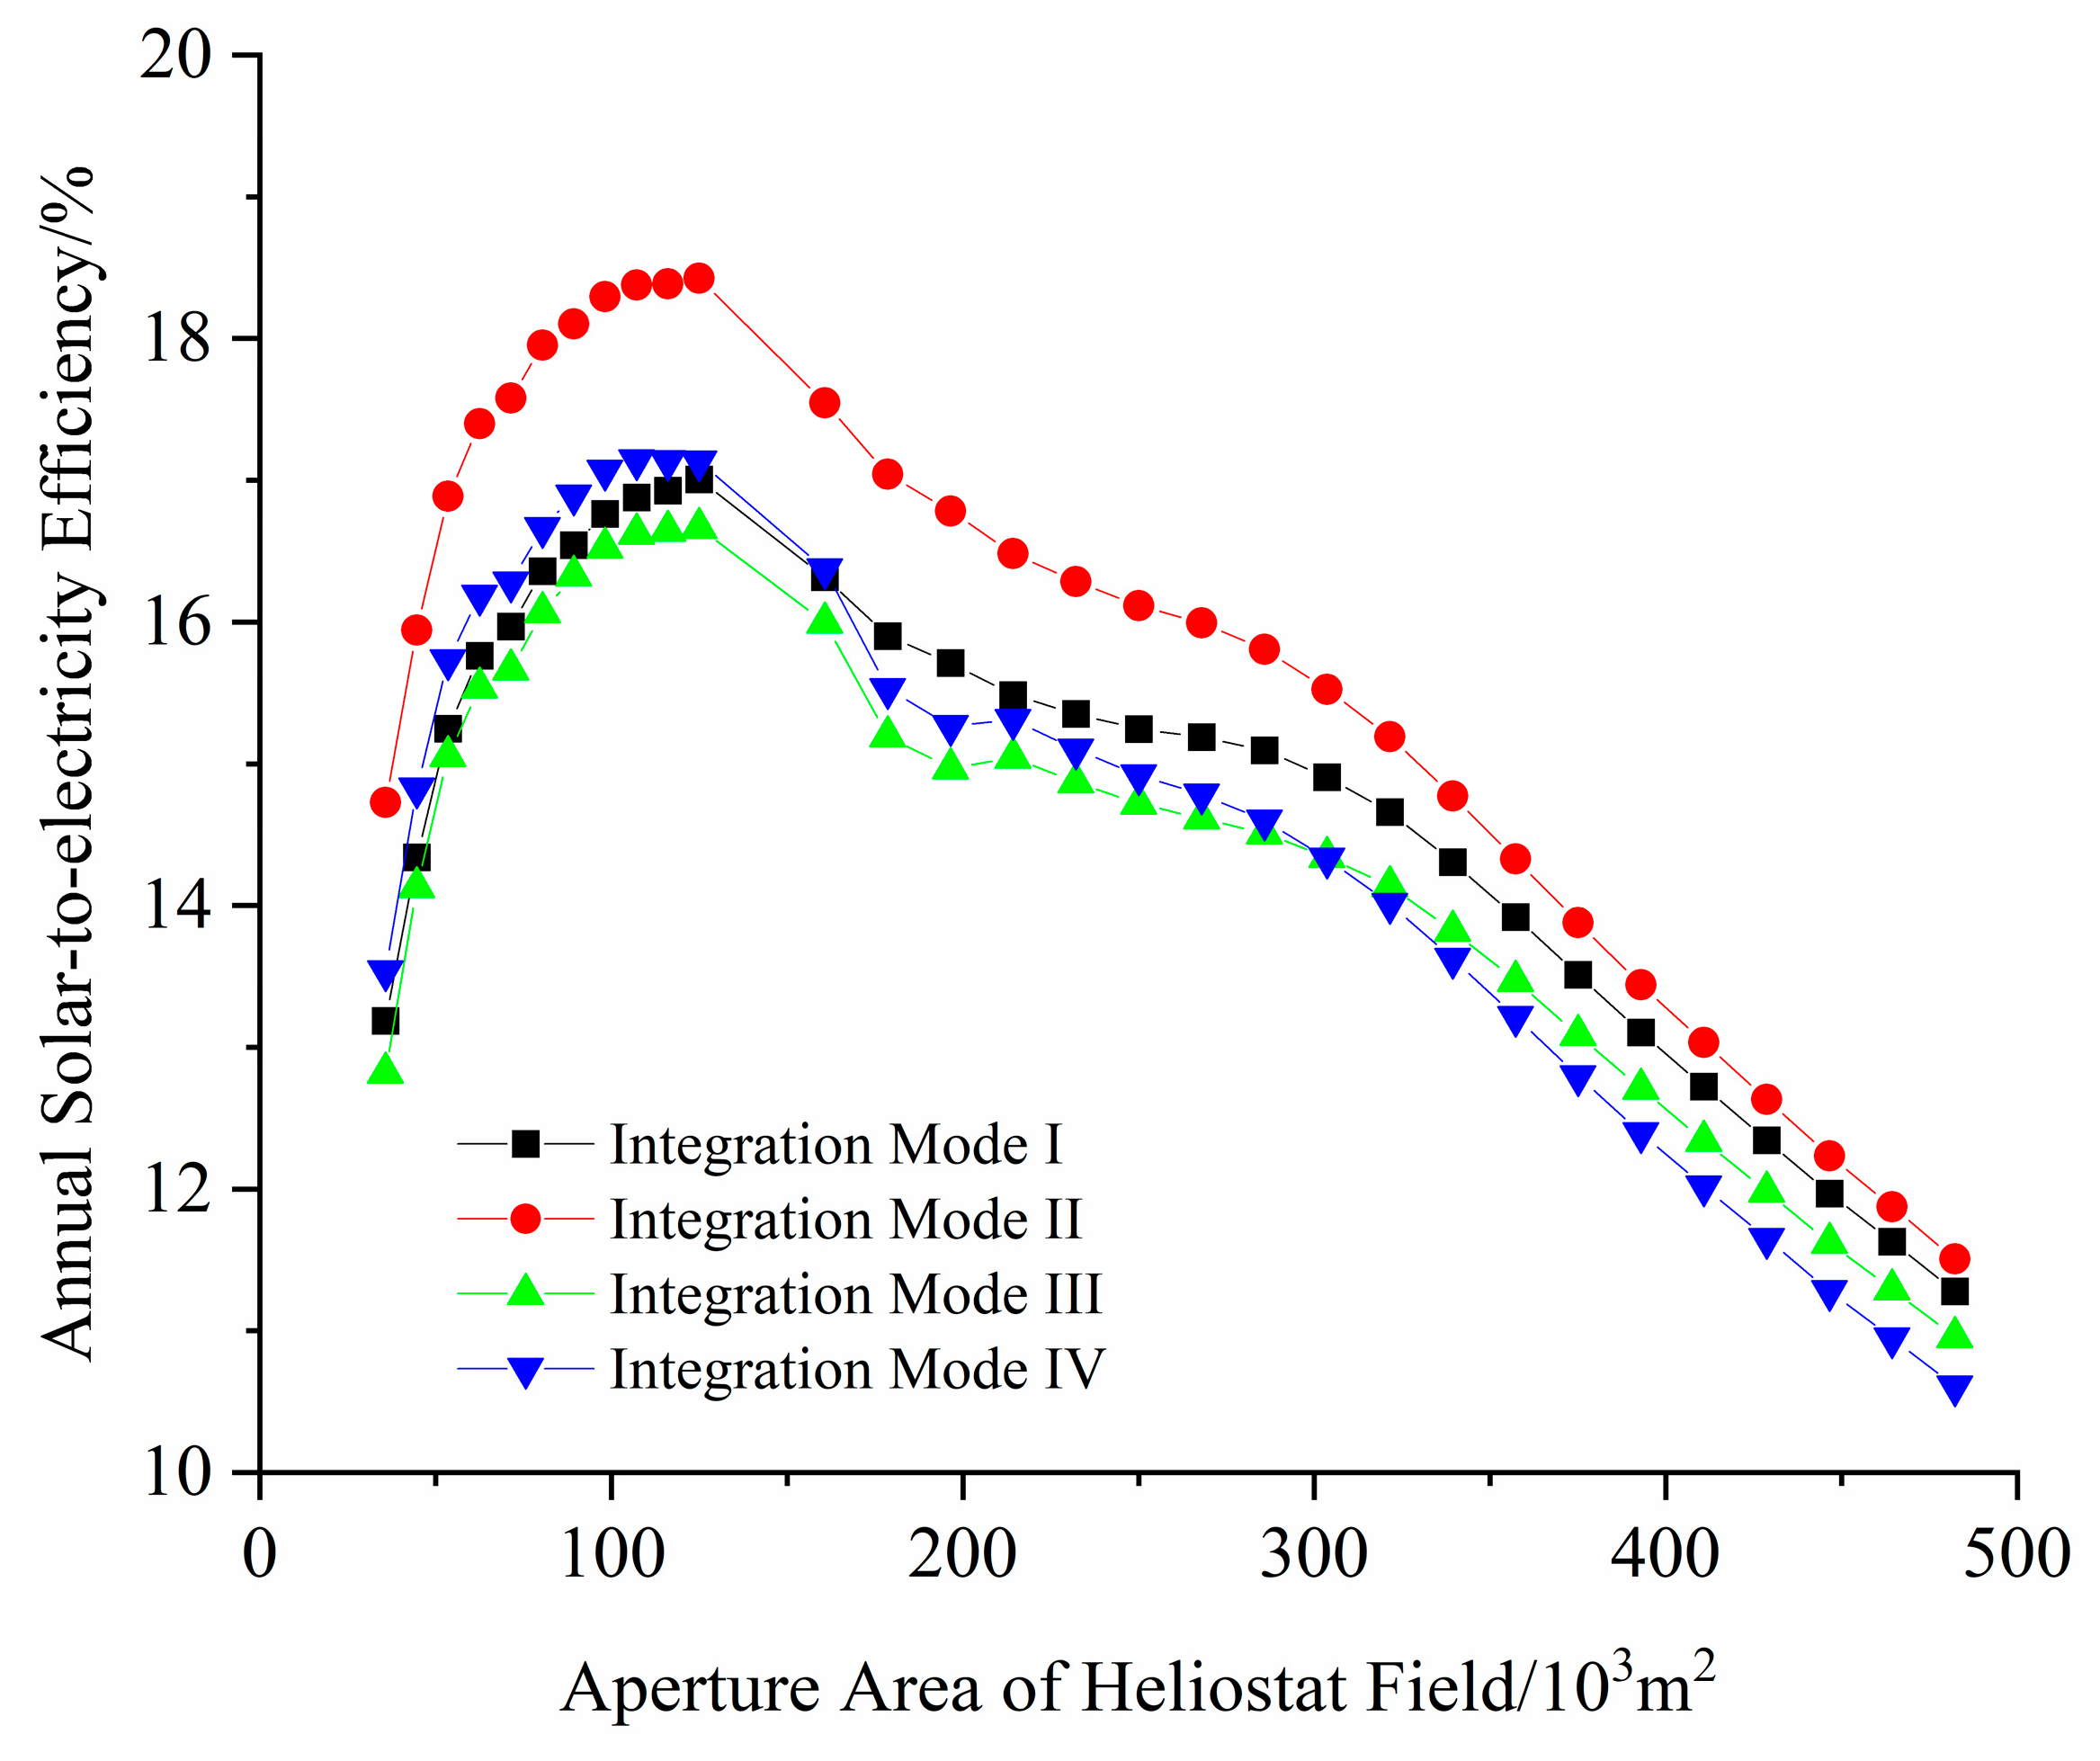
Figure 10 shows the variations in annual solar-to-electricity efficiency with heliostat field aperture area under various integration modes. The results indicate that for all modes, the annual efficiency first increases, peaks at an aperture area of approximately 125,025.6 m2, and subsequently decreases. This non-monotonic trend is primarily attributed to the competing effects of optical and integration limits of solar heat. Initially, increasing the aperture area improves the system’s capacity factor, leading to higher annual solar-to-electricity efficiency. However, beyond the optimal point, the optical efficiency of the heliostat field decreases and the periods during which the integrated solar heat exceeds the integration limit increase. Therefore, these two factors cause the annual solar-to-electricity efficiency to decline.
Among all the integration modes, integration mode II achieves the highest annual solar-to-electricity efficiency, followed by integration modes IV, I, and III. The corresponding optimal solar-to-electricity efficiency reaches 18.43% for integration mode II. This ranking can be explained by the combined effect of the integration temperature and the configuration type. The corresponding optimal solar-to-electricity efficiencies for each mode, which occur at the specific aperture area of approximately 125,025.6 m2, are 18.43% for integration mode II, 17.13% for integration mode IV, 17.00% for integration mode I, and 16.67% for integration mode III. Integration mode II benefits from both the high-exergy integration at the primary RH (horizontal part) and the parallel arrangement, which allows its solar field to operate at a higher and more stable temperature.

4.2.3. LCOE Influenced by Heliostat Field Aperture Area

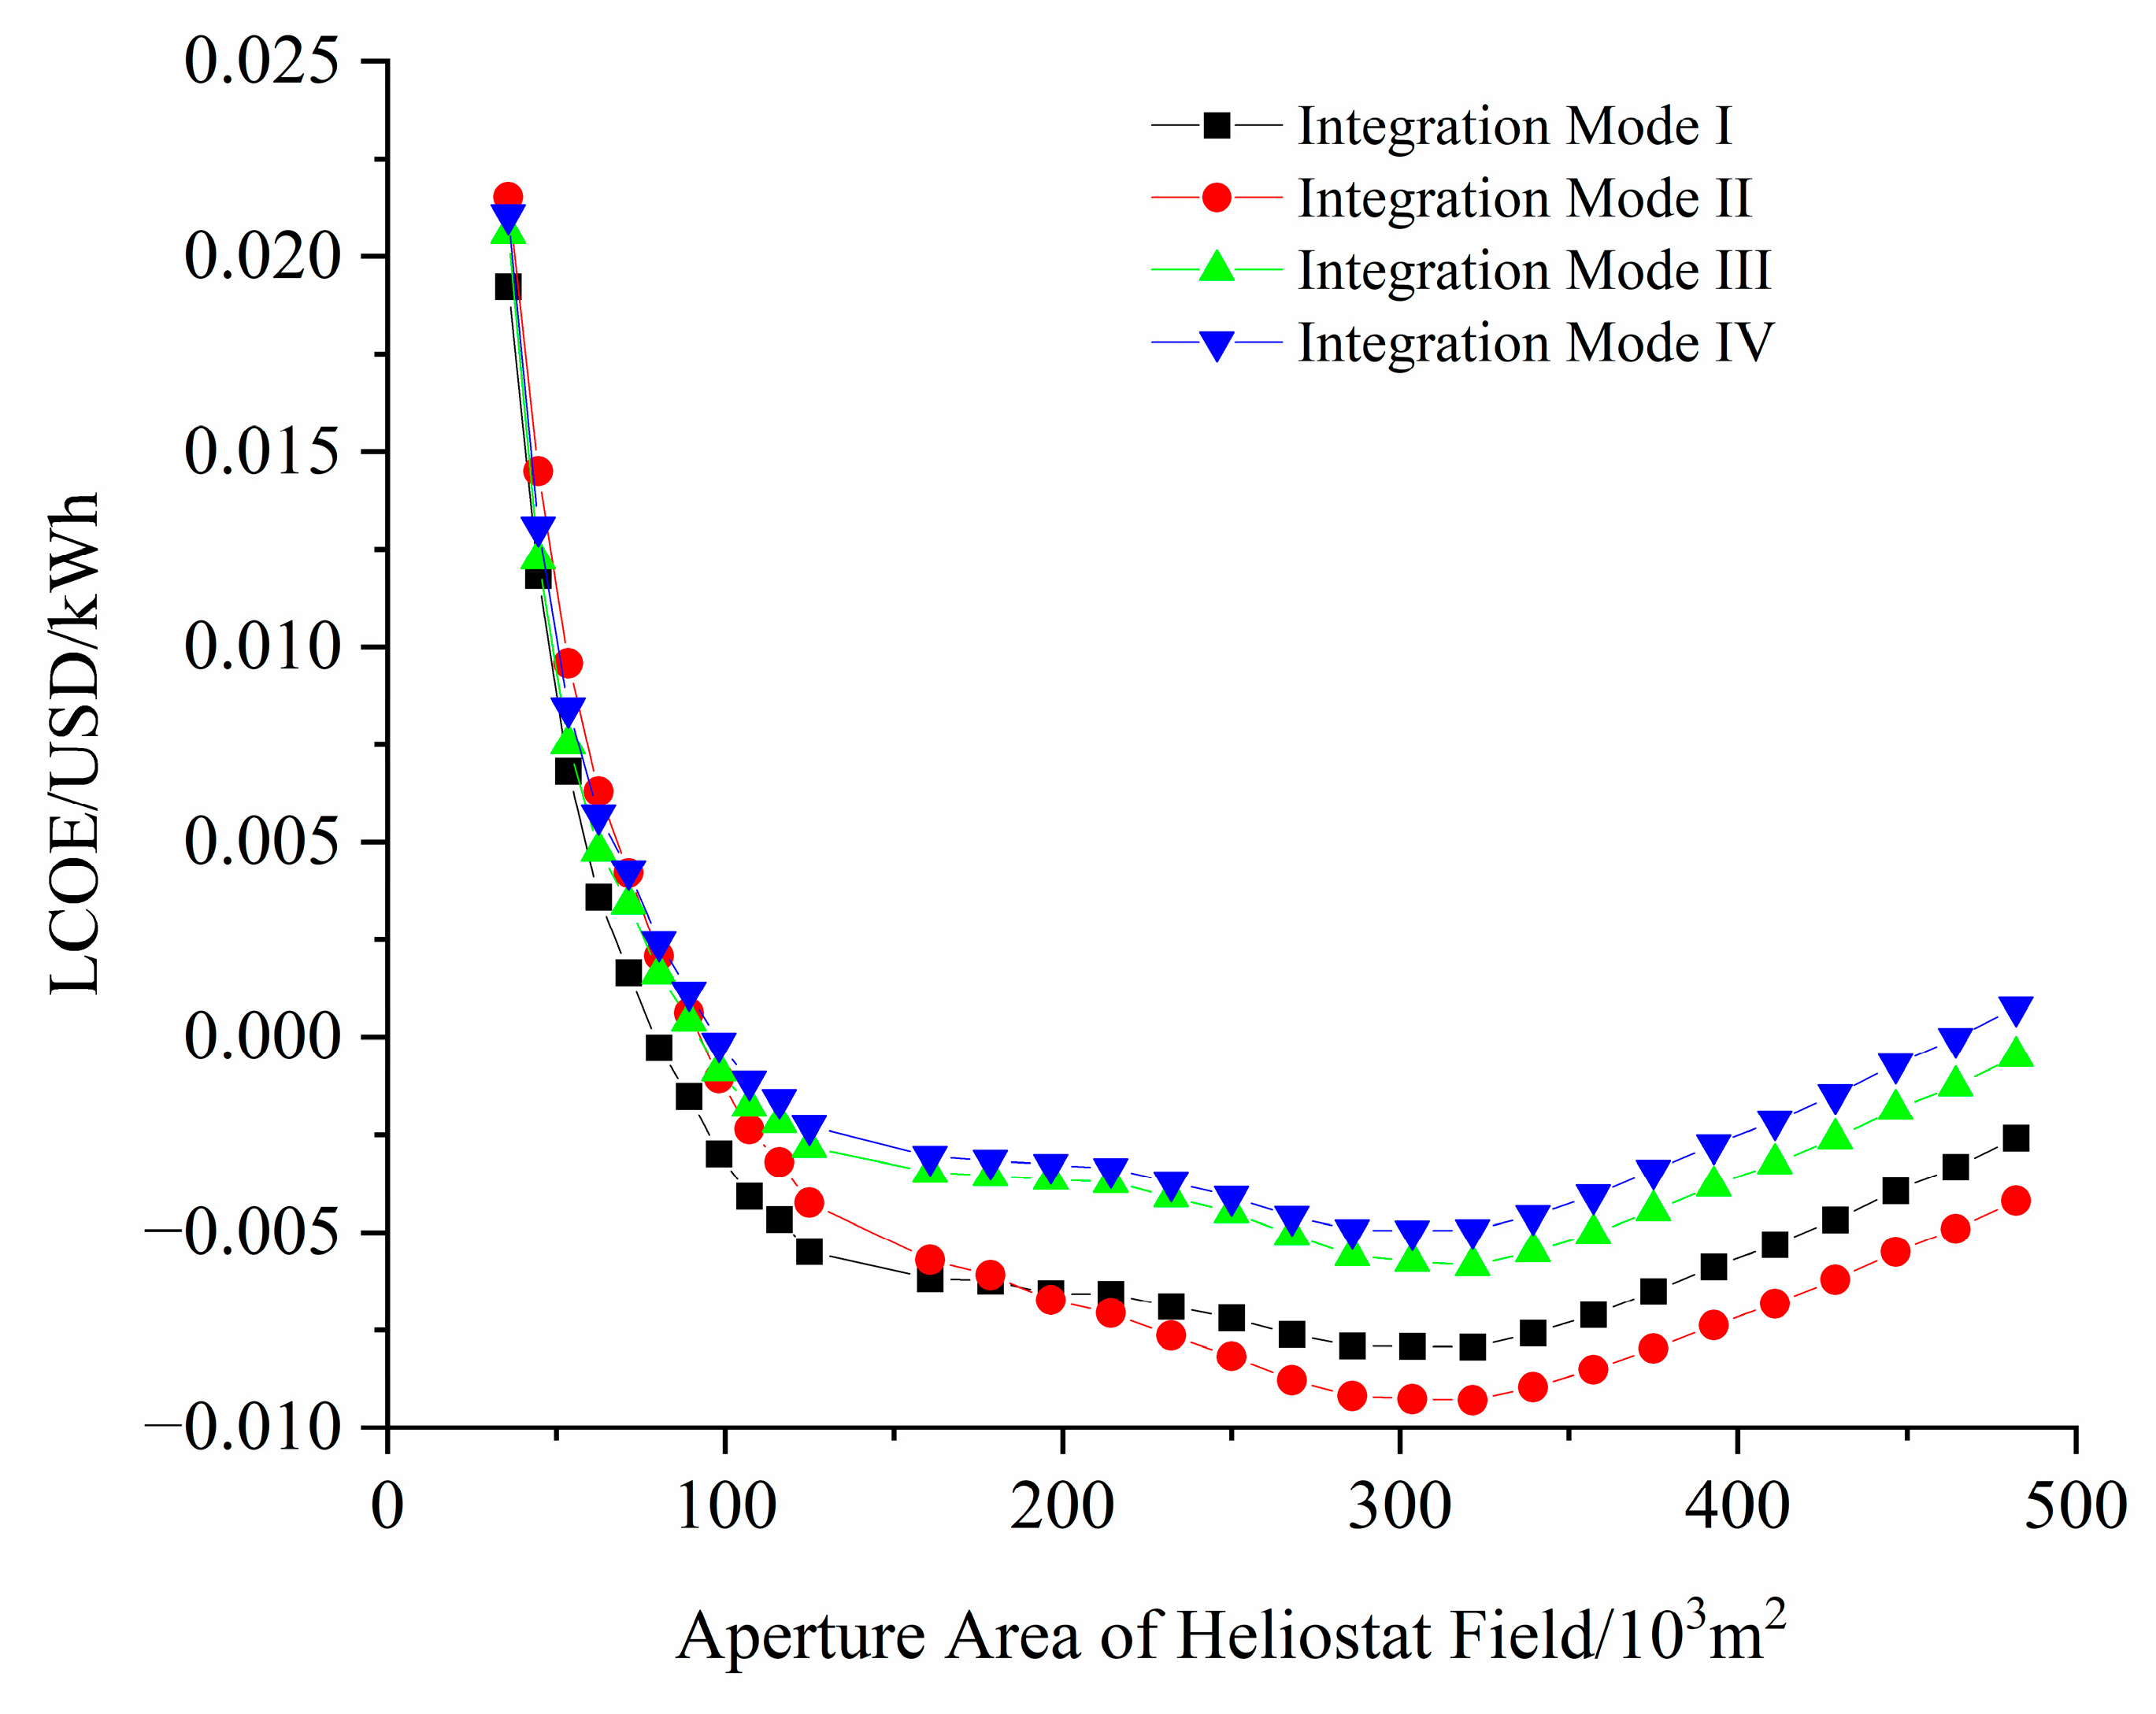
Table 4 summarizes the investment costs of major equipment and the cost–benefit parameters. Figure 11 illustrates the variation in the LCOE with heliostat field aperture area for different integration modes. A negative LCOE indicates that the investment cost is lower than the combined economic benefits from coal savings and CO2 emission reductions. The LCOE initially decreases and then increases with aperture area, resulting in a minimum value for each mode. The minimum LCOEs are −0.00793 USD/kWh for integration mode I, −0.00929 USD/kWh for mode II, −0.00584 USD/kWh for mode III, and −0.00497 USD/kWh for mode IV. The corresponding economically optimal aperture areas are approximately 321,494 m2. It is evident that the economically optimal heliostat field size does not coincide with the thermodynamically optimal aperture area. This reveals an inherent trade-off between the thermodynamic performance and the economic viability of the system. The thermodynamically optimal area aims to maximize the annual solar-to-electricity efficiency. In contrast, a larger heliostat field (approximately 321,494 m2), despite introducing greater optical losses and potential solar heat dumping—which reduces thermodynamic efficiency—generates significantly higher overall coal savings and carbon emission reduction benefits through economies of scale. Under current coal and carbon prices, these incremental benefits are sufficient to offset the levelized costs arising from reduced efficiency and additional investment, making the larger field size economically preferable.
Table 4 summarizes the investment of major equipment and price catalog of benefits.

4.3. Sensitivity Analysis Based on Locations

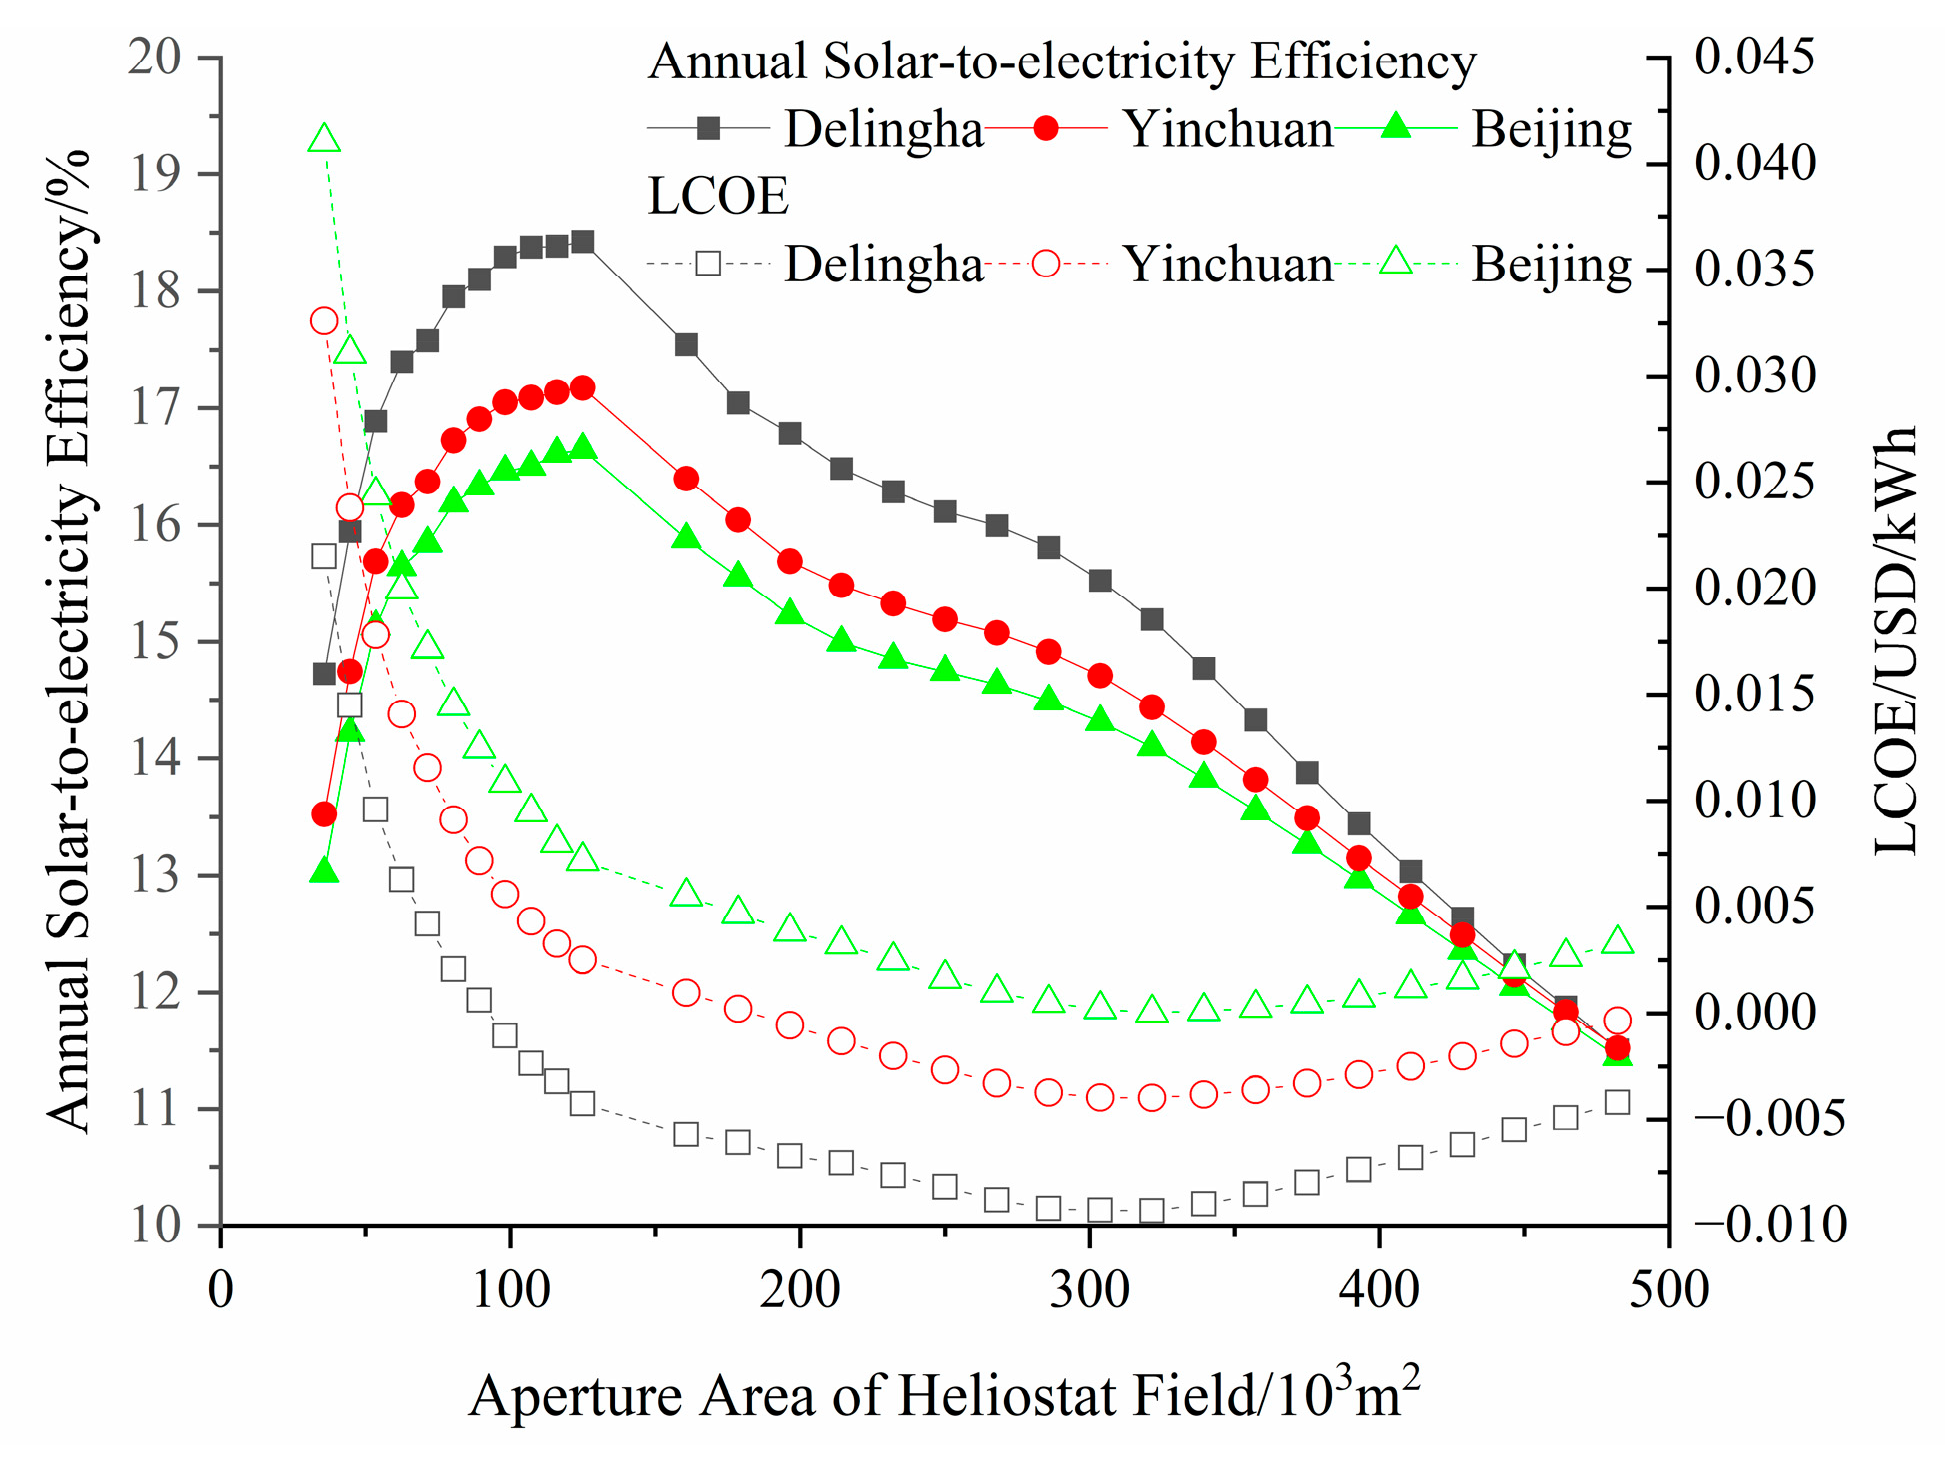
A sensitivity analysis is conducted by applying the same methodology to two additional locations in China, Yinchuan (38.48° N, 106.23° E) and Beijing (39.9° N, 116.39° E), with Delingha serving as the base case for comparison. The 600 MW system with Integration Mode II was simulated for each location across various heliostat field aperture areas. The annual accumulated DNI values are 2130.34 kWh/m2 for Delingha, 1948.85 kWh/m2 for Yinchuan, and 1796.34 kWh/m2 for Beijing [30]. Figure 12 presents the variations in annual solar-to-electricity efficiency and LCOE with heliostat field aperture area across these locations. Although the absolute values differ by location, the variation trends are consistent: the annual solar-to-electricity efficiency first increases and then decreases, while the LCOE first decreases and then increases. Consequently, a thermodynamically optimal aperture area exists, corresponding to the peak solar-to-electricity efficiency. The thermodynamically optimal aperture area is 125,026 m2, with peak efficiencies of 18.43% (Delingha), 17.17% (Yinchuan) and 16.65% (Beijing). The economically optimal aperture area is 321,494 m2, yielding minimum LCOEs of −0.00929 USD/kWh (Delingha), −0.00396 USD/kWh (Yinchuan) and 0.00002 USD/kWh (Beijing). From the sensitivity analysis, it can be concluded that although the annual accumulated DNI values differ across the three locations, both the thermodynamically optimal and economically optimal heliostat field aperture areas remain consistent. Specifically, an increase in the annual accumulated DNI leads to a higher maximum annual solar-to-electricity efficiency and a lower minimum LCOE.

5. Conclusions

This study conducted a thermo-economic analysis of a 600 MW coal-fired power generation system retrofitted with a solar tower. Four distinct integration modes were proposed: integration mode I (solar field arranged in series with the reheater), integration mode II (solar field arranged in parallel with the reheater), integration mode III (solar field arranged in series with the economizer), and integration mode IV (solar field arranged in parallel with the economizer). The key findings are summarized as follows:
(1)
The share of bypassed flue gas increases with solar heat input for all integration modes to maintain rated steam temperatures. However, the exhaust flue gas temperature shows distinctly different trends: it increases significantly for integration modes III and IV, while remaining almost unchanged for integration modes I and II.
(2)
The integration performance is critically determined by the integration location and configuration. Integration modes I and II, leveraging high-exergy solar heat at the reheater, outperform integration modes III and IV in both solar-generated electricity and solar heat-to-electricity efficiency. Series configurations (integration modes I and III) show a linear increase in solar heat-to-electricity efficiency with integrated solar heat, while parallel configurations (integration modes II and IV) maintain a relatively constant efficiency due to integrated solar heat with a fixed temperature.
(3)
The annual performance analysis based on meteorological data from Delingha reveals that with increasing heliostat field aperture area, the annual solar-generated electricity increases monotonically, whereas the annual solar-to-electricity efficiency first increases and then decreases, and the levelized cost of energy (LCOE) first decreases and then increases. The peak annual solar-to-electricity efficiency of 18.43% is achieved by integration mode II at an aperture area of approximately 125,025.6 m2. In contrast, the minimum LCOE (−0.00929 USD/kWh) also occurs with mode II, but at a larger optimal area of about 321,494 m2. This distinct divergence between the thermodynamic optimum and the economic optimum highlights a fundamental design trade-off; although a larger solar field incurs greater optical losses and may operate at a lower average conversion efficiency, the substantially increased annual coal savings and CO2 emission reductions under current energy and carbon prices can offset the higher initial investment, resulting in a lower net cost of energy.
(4)
Sensitivity analysis across two other locations in China (Yinchuan and Beijing) confirmed that although the peak annual solar-to-electricity efficiency and minimum LCOE values are directly influenced by the local annual accumulated direct normal irradiation, the thermodynamically and economically optimal aperture areas remain consistent. Higher annual accumulated direct normal irradiation leads to improved maximum efficiency and lower minimum LCOE. The peak annual solar-to-electricity efficiencies are 17.17% (Yinchuan) and 16.65% (Beijing). The minimum LCOEs are −0.00396 USD/kWh (Yinchuan) and 0.00002 USD/kWh (Beijing).

Author Contributions

Conceptualization, J.W.; methodology, J.W.; software, J.W.; validation, X.W.; formal analysis, J.W.; resources, J.W.; data curation, J.W.; writing—original draft preparation, J.W., X.W. and Y.L.; writing—review and editing, J.L. and Y.H.; supervision, J.W.; project administration, J.W.; funding acquisition, J.W. All authors have read and agreed to the published version of the manuscript.

Funding

This research was funded by National Natural Science Foundation of China, grant number 52106012; the Qinglan Project of Jiangsu Province of China; and the Open Research Fund of Jiangsu Provincial Key Laboratory of Multi-energy Integration and Flexible Power Generation Technology, Nanjing Institute of Technology, grant number MEIP202507. The APC was funded by Nanjing Institute of Technology.

Data Availability Statement

Additional data are available on request by contacting the corresponding author of this manuscript.

Conflicts of Interest

The authors declare no conflict of interest.

Abbreviations

SAPGSolar-aided power generation
CSPConcentrating solar power
TESThermal energy storage
HPHigh-pressure
LPLow-pressure
FWHsFeedwater heaters
RHReheater
SHSuperheater
IPIntermediate-pressure
DNIDirect normal irradiation
SAMSolar Advisor Model
NRELNational Renewable Energy Laboratory
LMTDLogarithmic mean temperature difference
LCOELevelized cost of energy

References

  1. Hu, E.J.; Mills, D.R.; Morrison, G.L.; Lievre, P.L. Solar power boosting of fossil fuelled power plants. In Proceedings of the ISES Solar World Congress, Goteborg, Swede, 14–19 June 2003. [Google Scholar]
  2. Li, J.; Yu, X.; Wang, J.; Huang, S. Coupling performance analysis of a solar aided coal-fired power plant. Appl. Therm. Eng. 2016, 106, 613–624. [Google Scholar] [CrossRef]
  3. Zoschak, R.J.; Wu, S.F. Studies of the direct input of solar energy to a fossil-fueled central station steam power plant. Sol. Energy 1975, 17, 297–305. [Google Scholar] [CrossRef]
  4. Ying, Y.; Hu, E.J. Thermodynamic advantages of using solar energy in the regenerative Rankine power plant. Appl. Therm. Eng. 1999, 19, 1173–1180. [Google Scholar] [CrossRef]
  5. Yang, Y.; Cui, Y.; Hou, H.; Guo, X.; Yang, Z.; Wang, N. Research on solar aided coal-fired power generation system and performance analysis. Sci. China 2008, 51, 1211–1221. [Google Scholar] [CrossRef]
  6. Suresh, M.V.J.J.; Reddy, K.S.; Kolar, A.K. 4-E (Energy, Exergy, Environment, and Economic) analysis of solar thermal aided coal-fired power plants. Energy Sustain. Dev. 2010, 14, 267–279. [Google Scholar] [CrossRef]
  7. Pierce, W.; Gauché, P.; von Backström, T.; Brent, A.C.; Tadros, A. A comparison of solar aided power generation (SAPG) and stand-alone concentrating solar power (CSP): A South African case study. Appl. Therm. Eng. 2013, 61, 657–662. [Google Scholar] [CrossRef]
  8. Bakos, G.C.; Tsechelidou, C. Solar aided power generation of a 300 MW lignite fired power plant combined with line-focus parabolic trough collectors field. Renew. Energy 2013, 60, 540–547. [Google Scholar] [CrossRef]
  9. Wu, J.; Hou, H.; Yang, Y.; Hu, E. Annual performance of a solar aided coal-fired power generation system (SACPG) with various solar field areas and thermal energy storage capacity. Appl. Energy 2015, 157, 123–133. [Google Scholar] [CrossRef]
  10. Zhai, R.; Li, C.; Chen, Y.; Yang, Y.; Patchigolla, K.; Oakey, J.E. Life cycle assessment of solar aided coal-fired power system with and without heat storage. Energy Convers. Manag. 2016, 111, 453–465. [Google Scholar] [CrossRef]
  11. Hong, H.; Zhao, Y.; Jin, H. Proposed Partial Repowering of a Coal-Fired Power Plant Using Low-Grade Solar Thermal Energy. Int. J. Thermodyn. 2011, 14, 21–28. [Google Scholar]
  12. Huang, C.; Madonski, R.; Zhang, Q.; Yan, Y.; Zhang, N.; Yang, Y. On the use of thermal energy storage in solar-aided power generation systems. Appl. Energy 2022, 310, 118532. [Google Scholar] [CrossRef]
  13. Wang, R.L.; Sun, J.; Hong, H. Proposal of solar-aided coal-fired power generation system with direct steam generation and active composite sun-tracking. Renew. Energy 2019, 141, 596–612. [Google Scholar] [CrossRef]
  14. Yan, H.; Wang, Z.; Ding, Y.; Liu, M.; Otitoju, O.; Wang, M.; Chong, D. Efficiency enhancement of solar-aided coal-fired power plant integrated with thermal energy storage under varying power loads and solar irradiances. J. Energy Storage 2024, 94, 112372. [Google Scholar] [CrossRef]
  15. Siva Reddy, V.; Kaushik, S.C.; Tyagi, S.K. Exergetic analysis of solar concentrator aided natural gas fired combined cycle power plant. Renew. Energy 2012, 39, 114–125. [Google Scholar] [CrossRef]
  16. Peng, S.; Wang, Z.; Hong, H.; Xu, D.; Jin, H. Exergy evaluation of a typical 330MW solar-hybrid coal-fired power plant in China. Energy Convers. Manag. 2014, 85, 848–855. [Google Scholar] [CrossRef]
  17. Zhu, Y.; Zhai, R.R.; Qi, J.W.; Yang, Y.P.; Reyes-Belmonte, M.A.; Romero, M.; Yan, Q. Annual performance of solar tower aided coal-fired power generation system. Energy 2017, 119, 662–674. [Google Scholar] [CrossRef]
  18. Li, C.; Zhai, R.; Zhang, B.; Chen, W. Thermodynamic performance of a novel solar tower aided coal-fired power system. Appl. Therm. Eng. 2020, 171, 115127. [Google Scholar] [CrossRef]
  19. Jiang, Y.; Duan, L.; Pang, L.; Song, J. Thermal performance study of tower solar aided double reheat coal-fired power generation system. Energy 2021, 230, 120857. [Google Scholar] [CrossRef]
  20. Jiang, Y.; Duan, L.; Yang, M.; Tong, Y.; Pang, L. Performance analysis of tower solar aided coal-fired power plant with thermal energy storage. Appl. Therm. Eng. 2022, 206, 118101. [Google Scholar] [CrossRef]
  21. Wang, Y.; Duan, L.; Ji, S.; Guo, J.; Zhang, H.; Yang, M.; Ding, X. Optimization study of a high-proportion of solar tower aided coal-fired power generation system integrated with thermal energy storage. Energy 2024, 307, 132724. [Google Scholar]
  22. Blokh, A.G.; Viskanta, R. Heat Transfer in Steam Boiler Furnaces; Hemisphere Publishing Corp: Washington, DC, USA, 1987. [Google Scholar]
  23. Kuznetsov, N.V.; Mitor, V.V.; Dubovsky, I.E. Thermal Calculaton of Boler Units. The Normative Method; Energiya Press: Moscow, Russia, 1973. [Google Scholar]
  24. Che, D. Boilers—Theory, Design and Operation; Xi’an Jiaotong University Press: Xi’an, China, 2008. [Google Scholar]
  25. Wu, J.; Han, Y. Solar contribution allocation method in heat and power in a solar-aided CHP system by tracing exergy flows. J. Renew. Sustain. Energy 2021, 13, 036301. [Google Scholar] [CrossRef]
  26. Wu, J.; Han, Y.; Hou, H. A new solar share evaluation method of solar aided power generation (SAPG) system by tracing exergy flows and allocating exergy destruction. Sol. Energy 2020, 198, 542–554. [Google Scholar] [CrossRef]
  27. Wu, J.; Li, Y.; Han, Y. A novel solar-aided lignite-fired power generation system with calcium looping CO2 capture, lignite pre-drying and feedwater preheating. Energy 2024, 296, 131228. [Google Scholar] [CrossRef]
  28. Qiao, Y.; Sun, J.; Zhang, C.B.; Wei, J.J. Energy, exergy, economic and environmental (4E) analysis of a solar-coal hybrid system with calcium-looping thermochemical energy storage and carbon capture for power and methanol coproduction. Energy 2025, 334, 137563. [Google Scholar] [CrossRef]
  29. Wu, J.; Hou, H.; Hu, E.; Yang, Y. Performance improvement of coal-fired power generation system integrating solar to preheat feedwater and reheated steam. Sol. Energy 2018, 163, 461–470. [Google Scholar] [CrossRef]
  30. Rockies, T.N.L.o.t. National Solar Radiation Database. Available online: https://nsrdb.nrel.gov/ (accessed on 1 November 2025).
  31. Wu, J.; Hou, H.; Yang, Y. Annual economic performance of a solar-aided 600 MW coal-fired power generation system under different tracking modes, aperture areas, and storage capacities. Appl. Therm. Eng. 2016, 104, 319–332. [Google Scholar] [CrossRef]
  32. Carro, A.; Chacartegui, R.; Ortiz, C.; Becerra, J.A. Analysis of a thermochemical energy storage system based on the reversible Ca(OH)2/CaO reaction. Energy 2022, 261, 125064. [Google Scholar] [CrossRef]
  33. Teng, S.; Wang, M.; Xi, H.; Wen, S. Energy, exergy, economic (3E) analysis, optimization and comparison of different ORC based CHP systems for waste heat recovery. Case Stud. Therm. Eng. 2021, 28, 101444. [Google Scholar] [CrossRef]
Figure 1. Schematic diagram of the system.
Energies 19 00620 g001aEnergies 19 00620 g001b
Figure 2. Hourly DNI distribution of the year.
Energies 19 00620 g002
Figure 3. Hourly ambient temperature distribution of the year.
Energies 19 00620 g003
Figure 4. Temperature-specific entropy diagram among various integration modes.
Energies 19 00620 g004
Figure 5. Variations in share of bypassed flue gas with integrated solar heat under various integration modes.
Energies 19 00620 g005
Figure 6. Variations in temperature of exhaust flue gas with integrated solar heat under various integration modes.
Energies 19 00620 g006
Figure 7. Variations in solar-generated electricity with integrated solar heat under various integration modes.
Energies 19 00620 g007
Figure 8. Variations in solar heat-to-electricity efficiencies with integrated solar heat under various integration modes.
Energies 19 00620 g008
Figure 9. Variations in annual solar-generated electricity with heliostat field aperture area under various integration modes.
Energies 19 00620 g009
Figure 10. Variations in annual solar-to-electricity efficiency with heliostat field aperture area under various integration modes.
Energies 19 00620 g010
Figure 11. Variations in LCOE with heliostat field aperture area under various integration modes.
Energies 19 00620 g011
Figure 12. Variations in annual solar-to-electricity efficiency and LCOE with heliostat field aperture area in different locations.
Energies 19 00620 g012
Table 1. Key design parameters of the reference coal-fired power generation system [31].
ItemUnitDesigned Data
PowerMW600
Temperature of Superheated Steam°C566
Specific Enthalpy of Superheated SteamkJ/kg3396.0
Mass Flow Rate of Superheated Steamkg/s461.32
Reheated Steam Temperature°C566
Mass Flow Rate of Reheated Steamkg/s392.80
Specific Enthalpy of Reheated SteamkJ/kg3596.8
Pressure of Exhausted SteamMPa0.0049
Table 2. Key design parameters in each regenerative heat exchanger [31].
ItemUnitFWH1FWH2FWH3FWH4FWH5FWH 6FWH 7FWH 8
Extraction PressureMPa5.9804.2302.1401.0600.4020.1160.0560.022
Extraction Temperature°C353.6308.1475.9369.8251.7129.984.361.7
Mass Flow Rate of Extraction Steamkg/s26.2436.1619.1324.4523.6511.3812.813.33
Outlet Temperature of Feedwater°C275.1251.8214.3180.3139.299.680.257.8
Drain Water Temperature°C257.4220.0191.3-105.285.863.438.9
Table 3. Main structure parameters of heat exchanger in boiler [29].
ItemHeat Exchanger Area (m2)
Furnace3395.81
First Platen SH1220.40
Second Platen SH1304.40
Final RH2173.58
Final SH3466.26
Primary SH (vertical part)1134.91
Primary SH (horizontal part)9146.80
Economizer17,590.33
Air Heaters95,441.64
Table 4. Investment of major equipment and cost–benefit parameters.
ItemsUnitValueRemark
Heliostat fieldUSD C h e l = 3856   A s f 0.7024 [32]Asf is the aperture area of heliostat field (m2)
Solar towerUSD C s t = 57.07   Q d e s i g n [32]Qdesign is the designed heat load of solar tower (kW)
Operation and maintenance cost%1.5 [33]Calculated as a percentage of capital costs
Unit price of standard coalUSD/t83.34 [28]Based on a calorific value equivalent basis
Unit price of CO2 reductionUSD/t11.8065 [28]
Disclaimer/Publisher’s Note: The statements, opinions and data contained in all publications are solely those of the individual author(s) and contributor(s) and not of MDPI and/or the editor(s). MDPI and/or the editor(s) disclaim responsibility for any injury to people or property resulting from any ideas, methods, instructions or products referred to in the content.