Article

Thermodynamic Matching of a Transcritical CO2 Heat Pump for 300 °C Industrial Steam Generation Using Low-Grade Waste Heat from Compressed Air Energy Storage

1
Zhan Tianyou College, Dalian Jiaotong University, Dalian 116024, China
2
Shengu Group Co., Ltd., Shenyang 110000, China
3
School of Energy and Power Engineering, Xi’an Jiaotong University, Xi’an 710049, China
*
Author to whom correspondence should be addressed.
Energies 2026, 19(18), 4459; https://doi.org/10.3390/en19184459 (registering DOI)
Submission received: 19 August 2026 / Revised: 17 September 2026 / Accepted: 18 September 2026 / Published: 20 September 2026

Abstract

Recovering the low-temperature heat released during compressed air energy storage (CAES) charging for industrial steam generation requires a heat pump that can provide both the required steam temperature and sufficient heating capacity. This study applies a previously reported recuperated transcritical CO2 configuration to the 11.64 MW cooling-water circuit of a 100 MW CAES plant, with water entering the evaporator at 50 °C and returning at 25 °C. The steam-generation circuit recycles saturated liquid from the flash separator and mixes it with pressurized make-up water, after which the mixture is heated at high pressure, throttled to generate steam and separated before steam superheating. At a compressor suction temperature of 97.5 °C and discharge pressure of 26.0 MPa, the system supplies 31.96 MW of heat and produces 10.79 kg s−1 of steam at 0.40 MPa and 303.33 °C, with a cycle COP of 1.533, excluding pumping. Increasing the suction temperature from 94.5 to 100.5 °C raises the discharge temperature by 7.81 K but reduces COP from 1.550 to 1.520, because the compressor power increases while the expander power decreases. Although more steam is produced, its delivery temperature decreases because the fixed superheater duty supplies less heat per kilogram. Furthermore, the baseline temperature profiles identify an internal minimum temperature difference of approximately 12 K in gas cooler B, which is smaller than either terminal difference. These findings indicate that CAES cooling water can be used for 300 °C steam generation through staged CO2 heat release, while the effects of recuperation on power consumption and heat distribution must be considered together when selecting the cycle operating conditions.

1. Introduction

Industrial steam is widely used for drying, evaporation, sterilization and chemical processing, and its production is, therefore, an important application for electrification in industrial heating [1,2,3]. Heat pumps offer a means of recovering low-temperature heat for steam production by using electrical work to increase the temperature at which heat is supplied. When steam is required near 300 °C, however, the large temperature lift places demanding operating conditions on the refrigerant, compressor and heat exchangers, while the associated power consumption determines whether the process uses electricity efficiently. Evaluating a heat pump for this application, therefore, requires consideration of the delivered steam temperature and flow together with the electrical power input, rather than the compressor discharge temperature alone [2,4].
Heat-pump steam generation generally involves either heating pressurized water before flashing or combining a heat pump with additional steam compression [3,5,6,7,8]. The first arrangement avoids a steam compressor, although the steam conditions that it can achieve depend on the refrigerant temperature and the temperature differences available in the heat exchangers; the second arrangement uses additional compression work to increase steam pressure and temperature. For example, Kang et al. [5] investigated a steam-generating heat pump with an internal heat exchanger at approximately 120 °C, whereas hybrid systems produce steam at higher temperatures by compressing the steam generated using the heat pump [7,8]. Since these studies use different heat-source temperatures, steam conditions and definitions of electrical power input, Table 1 compares their configurations and operating conditions without ranking their reported COP values as if they were obtained under identical conditions.
Above its critical pressure, CO2 releases heat over a continuous temperature range, so the high-temperature part of its cooling process can be used for steam superheating and the remaining heat for pressurized water heating. Li et al. [9] used this arrangement with internal recuperation to investigate steam generation near 300 °C from an ambient heat source; their configuration, including the two gas coolers and recuperative heating before compression, is adopted in the present study. Related research has considered data-center heat recovery combined with steam compression [10] and heat-pump technologies above 250 °C [4], while transcritical heat-exchanger calculations [11] address the temperature differences that constrain heat transfer within these systems. At the component level, studies of internal heat exchangers and mechanical subcooling [12,13,14] examine how cycle modifications affect performance, and advanced exergy analysis [15] identifies the processes responsible for thermodynamic losses. Direct steam-generation experiments [16] provide a further basis for evaluating the performance of operating equipment. These studies establish the configurations and analysis methods relevant to high-temperature steam generation, although the heat-source conditions must be specified before their application to CAES heat recovery can be assessed.
For a heat pump supplied with industrial cooling water, the recoverable heat is determined by both the water flow and its supply and return temperatures. These quantities specify the heat available to the evaporator and the temperature differences between the source water and CO2, which must remain sufficient throughout heat transfer. An ambient-air source requires a different evaporator design and varies with weather; consequently, a comparison between cooling-water and air-source systems would need consistent CO2-cycle assumptions and identical steam-delivery conditions to isolate the effect of the heat source.
CAES charging provides a potential cooling-water heat source because the air must be cooled between compression stages and before entering storage [17,18,19,20,21]. Research on CAES heat recovery has primarily considered storing higher-temperature compression heat for discharge or using it in a power cycle [17,18,19,20,21], whereas the use of lower-temperature cooling water for steam generation above 300 °C has received less attention. Meanwhile, studies of transcritical CO2 steam generation have examined cycle configurations under heat-source conditions that differ from those of a CAES charging process [4,9,10]. Applying such a cycle to CAES, therefore, requires quantifying the recoverable cooling-water heat and determining how it is transferred through the evaporator, recuperator and gas coolers to produce steam at the required conditions.
This study evaluates a recuperated transcritical CO2 heat pump supplied by the low-temperature cooling-water circuit of a CAES plant, using the staged water-heating and steam-superheating configuration proposed by Li et al. [9]. The steam circuit includes a flash separator, a recycle pump and a mixer, through which the separated saturated liquid is returned to the water heater together with pressurized make-up water. With this configuration, a steady-state model is used to calculate steam production, electrical power consumption and COP, while temperature profiles and component exergy balances are evaluated to identify heat-transfer constraints and the principal sources of irreversibility. The parametric analysis then examines how compressor suction temperature, discharge pressure, make-up water temperature and circulating-water flow affect heat distribution, compressor and expander powers, and the temperature and flow of the delivered steam. In this way, the study assesses the use of low-temperature CAES heat for industrial steam generation and explains why operating conditions that increase CO2 discharge temperature do not necessarily improve COP or steam delivery temperature.
The reported COP values use different heat-source temperatures, steam conditions and definitions of power input, and, therefore, should not be compared as efficiencies under identical conditions. The examples from Refs. [5,7,8] are also discussed in Ref. [9]. For the present cycle, pumping is excluded and the expander power is subtracted from the compressor power.
Table 1. Representative pathways for heat-pump steam generation.
Route/StudySource (°C)Steam (°C)Pressure (MPa)COPSteam Compressor
IHX heat pump [5,9]Not specified in this comparison120Saturated steam3.24No
Heat pump + steam compression [7,9]Ambient 5–35120 to >160Different delivery casesDifferent power-input definitionsYes
Waste-heat hybrid [8,9]60–80160Source-specific3.1 (R601)Yes
Staged CO2 cycle [9]Ambient airAbout 3000.10–0.70 investigatedUp to 1.85, configuration-specificNo
CAES-coupled baselineWater 50→25303.330.401.533 (pumps excluded)No

2. System Configuration and Methodology

2.1. System Configuration and Operating Principle

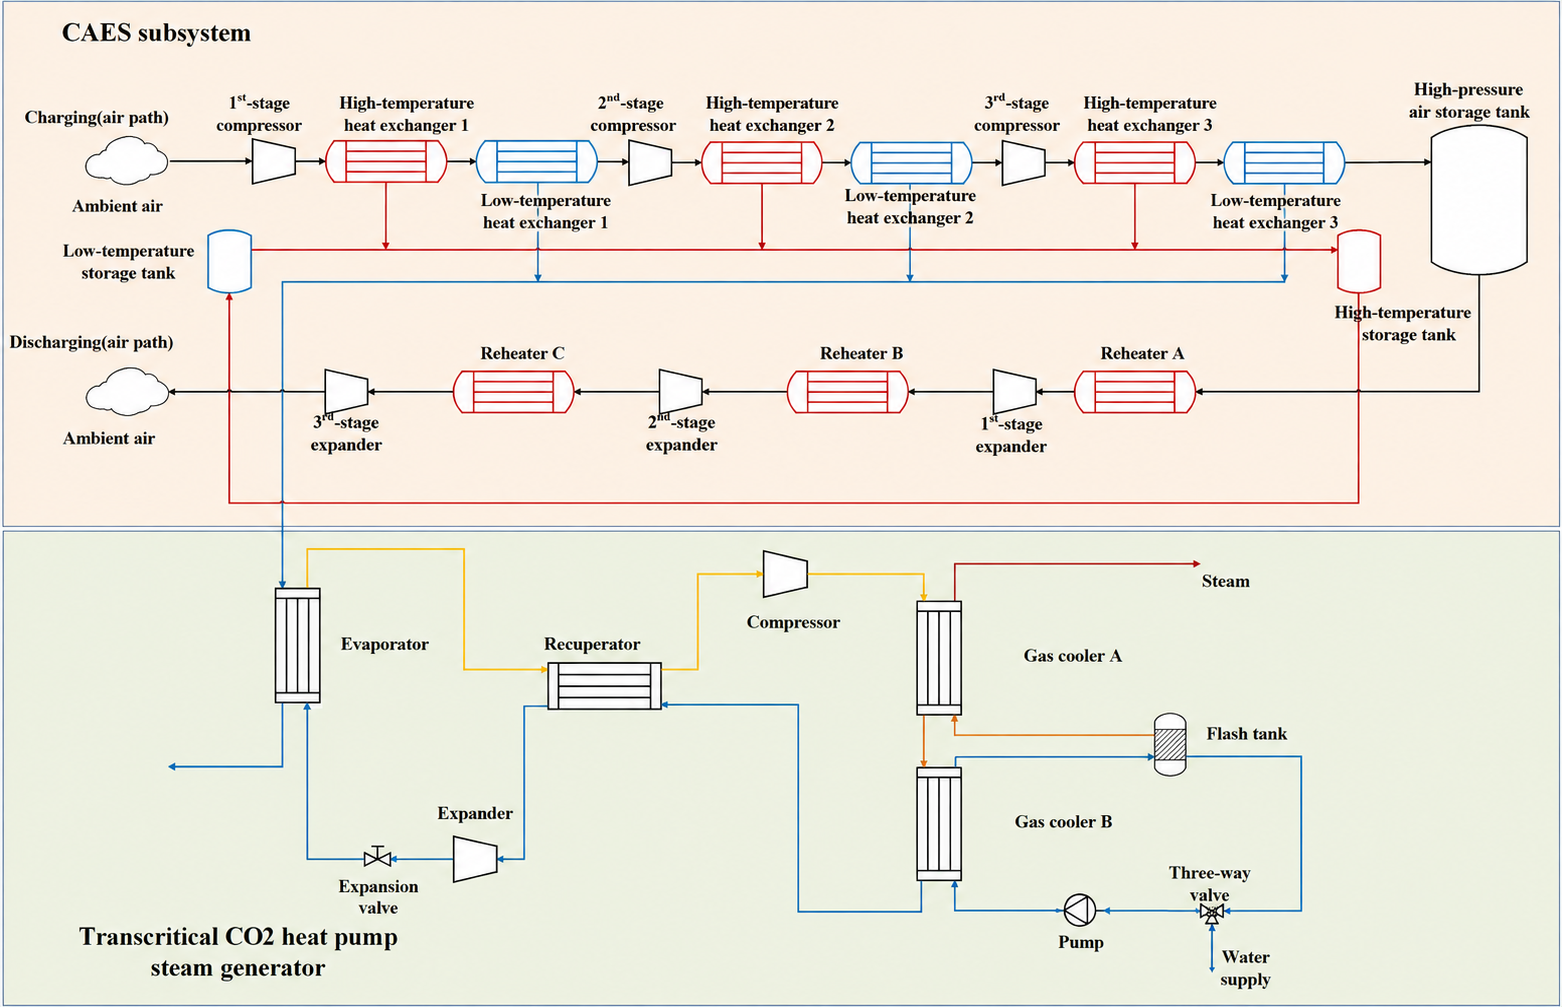
As shown in Figure 1, the system comprises the CAES cooling-water circuit, a recuperated transcritical CO2 heat pump, and a pressurized-water and steam circuit. Heat released by the CAES cooling water is transferred to CO2 in the evaporator, after which the CO2 is further heated in the recuperator before compression. The compressed CO2 then releases heat successively in gas coolers A and B, with gas cooler A using the highest-temperature CO2 to superheat steam and gas cooler B heating pressurized water. This sequence allows the steam superheater and water heater to use different parts of the CO2 cooling process according to their respective temperature requirements.
On the water side, the saturated liquid leaving the flash separator is pressurized by the recycle pump and mixed with pressurized make-up water before entering gas cooler B. Since no liquid purge is included, the make-up water replaces only the steam delivered to the user, and the two mass flows are equal at steady state. After heating in gas cooler B, the pressurized liquid is throttled to the separator pressure, where the resulting steam and liquid are separated. The steam is subsequently superheated in gas cooler A, while the liquid returns through the recycle pump to the mixer without additional cooling, thereby reducing the external water demand and raising the water-heater inlet temperature above the make-up water temperature.

2.2. CAES Waste-Heat Boundary

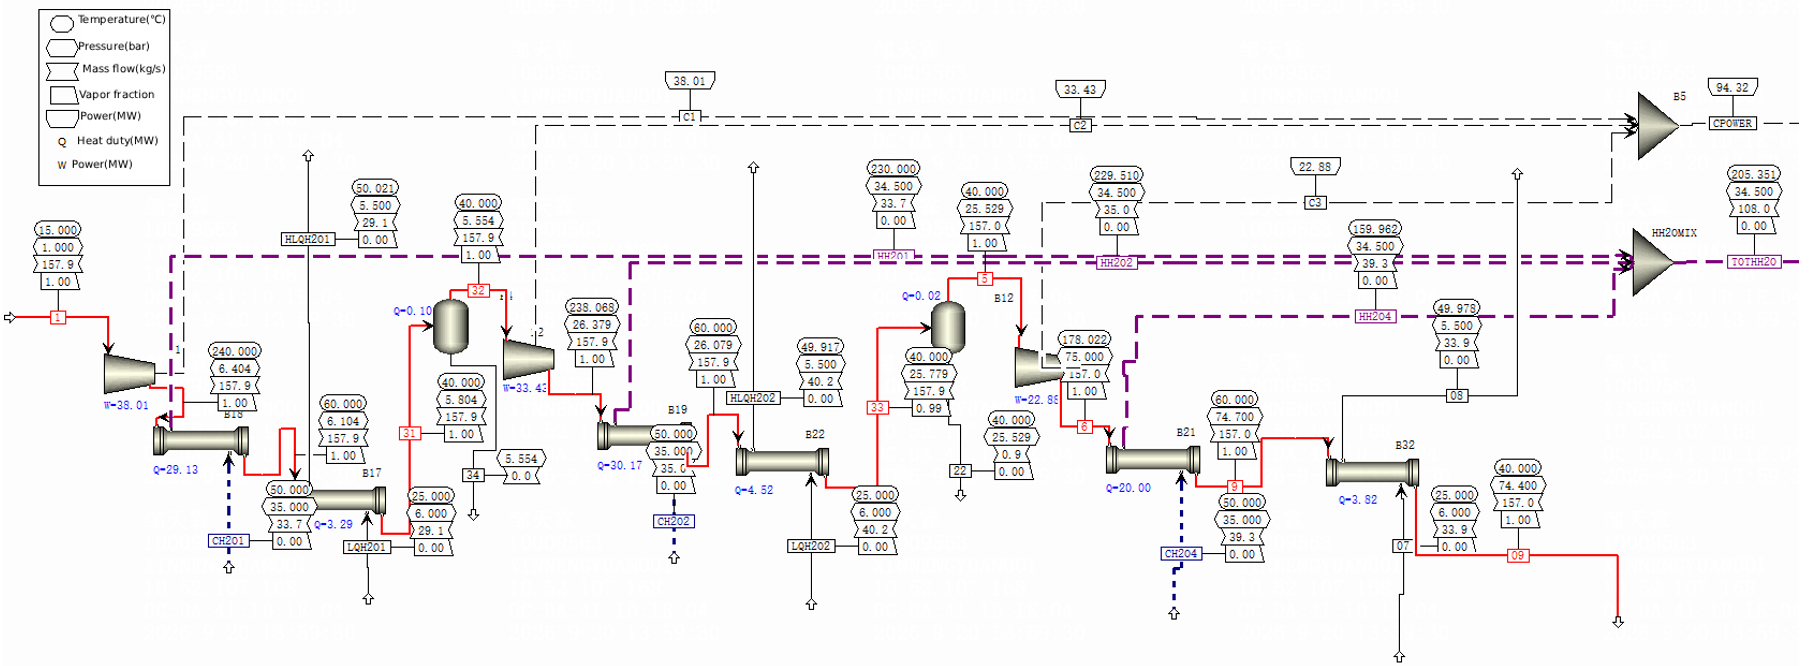
Figure 2 shows the charging model of the 100 MW CAES plant, for which the nominal charging and discharging periods are 6 and 4 h, respectively. Air entering at 15 °C and 0.10 MPa is compressed in three stages, each followed by high- and low-temperature cooling, with stage powers of 38.01, 33.43 and 22.88 MW. The corresponding high-temperature coolers release 29.13, 30.17 and 20.00 MW, while the low-temperature coolers release 3.29, 4.53 and 3.82 MW, producing a total cooling duty of 90.94 MW. Of this heat, only the low-temperature portion is supplied to the heat pump, so higher-temperature heat recovery is excluded from the present heat-pump analysis.
Together, the three low-temperature coolers release 11.64 MW, which represents 12.8% of the total CAES cooling duty. Recovering this heat with water that enters the evaporator at 50 °C and leaves at 25 °C requires approximately 111.4 kg s−1 of source water, calculated using a specific heat capacity of 4.18 kJ kg−1 K−1. The source-water temperatures and the available heat-transfer rate are used as the evaporator boundary conditions, as summarized in Table 2.

2.3. CO2 Heat-Pump and Steam-Generation Model

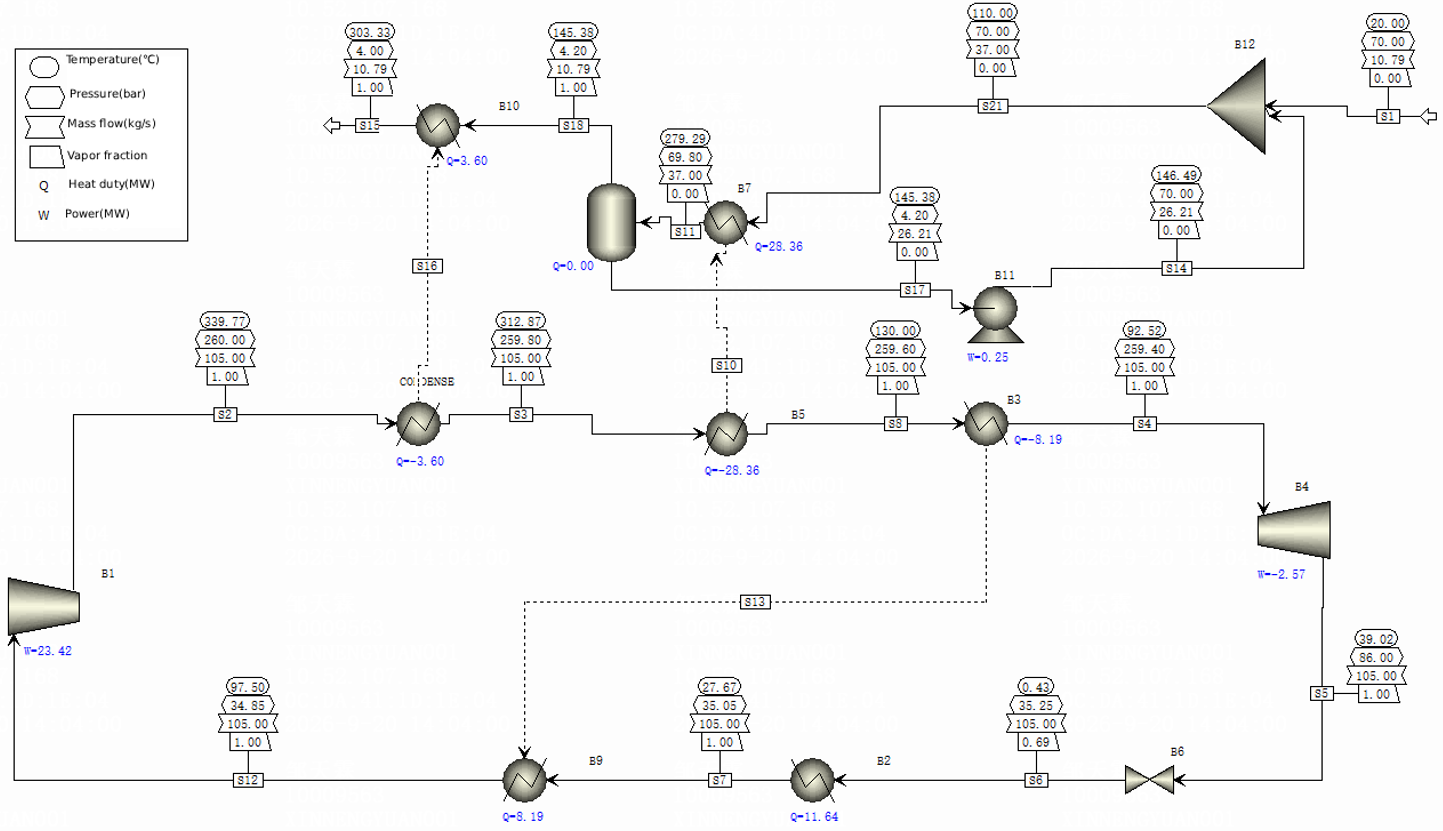
The process shown in Figure 3 is modeled in Aspen Plus V14 using NIST REFPROP thermophysical properties [23], with separate calculations for compression, heat release, recuperation, expansion, throttling and evaporation. The calculated CO2 states and their corresponding Aspen stream labels are listed in Table 3, while the water and steam states are listed in Table 4. To check the thermodynamic balances independently, enthalpy, entropy and physical exergy are also evaluated using REFPROP 9.1 [22], with temperature and pressure specifying single-phase states and separator pressure specifying saturated steam and liquid states. At the CO2 throttling-valve outlet, enthalpy is set equal to the inlet value to satisfy isenthalpic throttling, rather than calculated from the rounded vapor mass fraction displayed in the flowsheet.
The Aspen block types and prescribed numerical settings are summarized in Table A7. Gas coolers A and B and the recuperator are represented by paired HEATER blocks connected through heat streams, so the heat released by one fluid is supplied to the other without specifying the exchanger area. The CO2 valve is represented by a VALVE block, while an adiabatic FLASH2 block calculates the water-side steam and liquid flows at the separator pressure. The compressor and expander block iterations use a relative tolerance of 0.0001 and a maximum of 30 iterations; the same tolerance and iteration limit are used for the heat-exchanger calculations. These solver settings are distinct from the independently calculated mass and energy differences reported in Section 3.1.
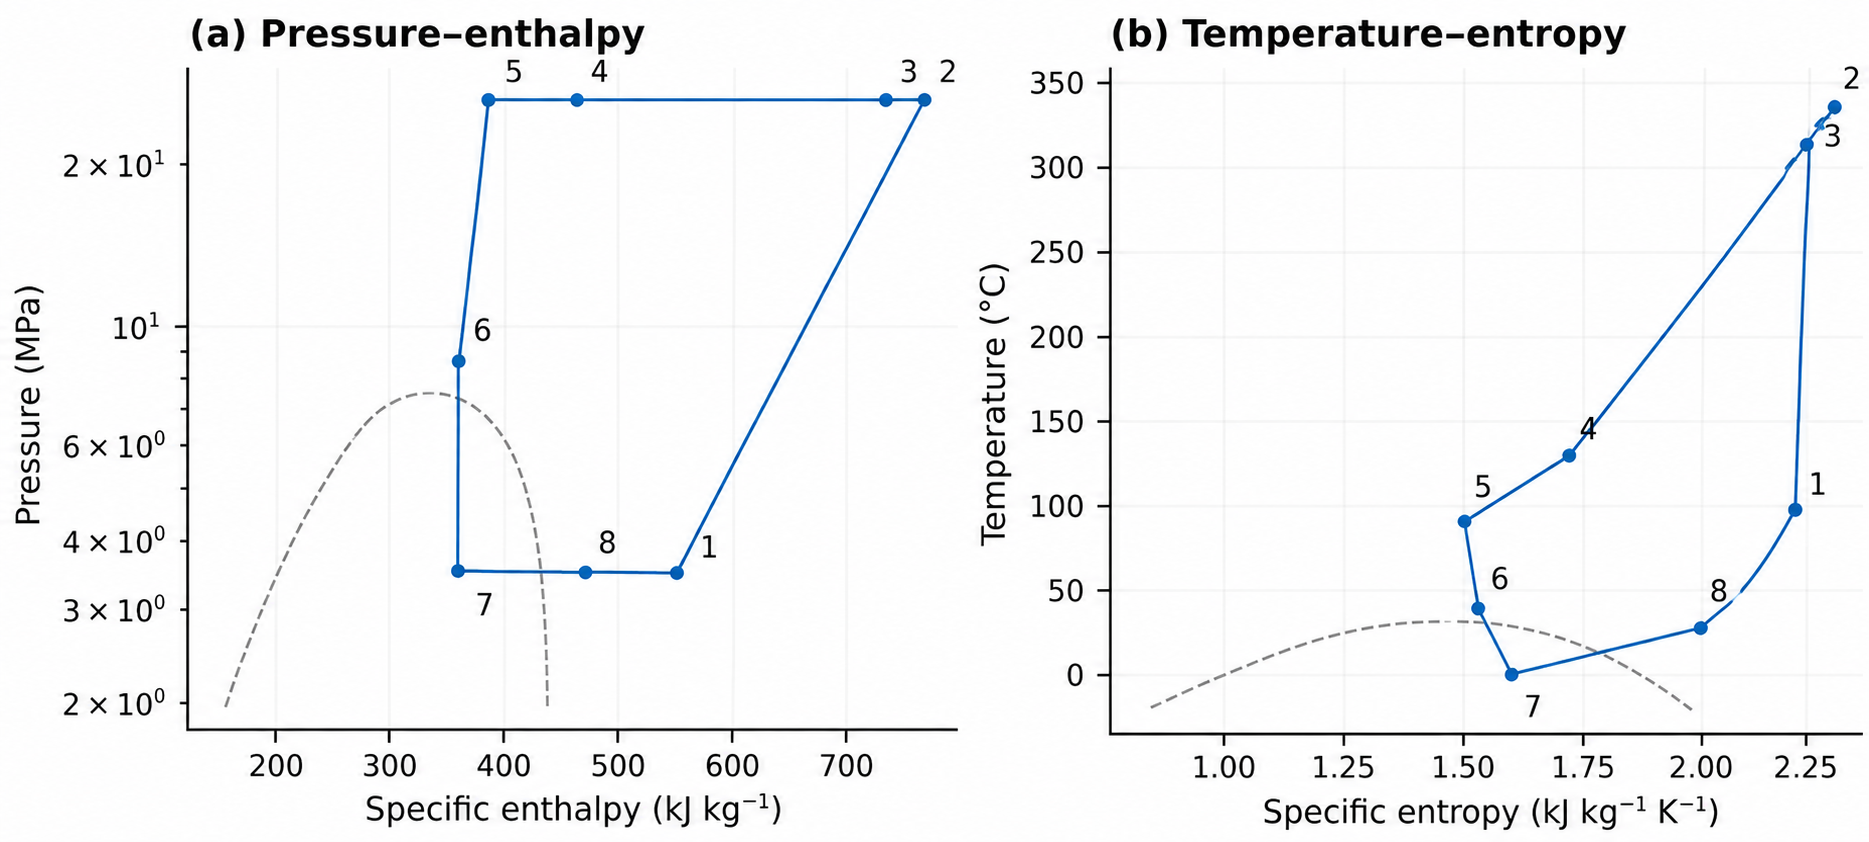
The CO2 pressure increases from 3.485 to 26.0 MPa in the compressor after internal recuperation has raised the suction temperature. Following compression, the CO2 releases heat in gas cooler A, gas cooler B and the recuperator before the expander reduces its pressure to 8.60 MPa. The expander outlet is above both the critical pressure and critical temperature, so the CO2 remains single-phase during expansion; a separate throttling valve then reduces the pressure to 3.525 MPa and produces the two-phase mixture entering the evaporator. Figure 4 shows the thermodynamic states corresponding to these processes.
Make-up water at 20 °C and 7.00 MPa is mixed with the pressurized liquid returning from the flash separator, producing the 110.00 °C water stream that enters gas cooler B. During heating, the water temperature rises to 279.29 °C, while the +-*/+pressure decreases to 6.98 MPa, at which the saturation temperature is approximately 285.64 °C. The outlet water, therefore, remains subcooled by 6.35 K before it is throttled to 0.42 MPa and separated into saturated steam and liquid. The separated steam is subsequently heated in gas cooler A and delivered at 0.40 MPa, with the baseline states and parameter-study conditions specified in Table 3, Table 4 and Table 5.

2.4. Thermodynamic Models and Performance Criteria

The steady-flow mass and energy balances neglect changes in kinetic and potential energy, with heat taken as positive into a control volume and shaft work as positive out of it. When compressor and pump powers are used in the performance indicators, however, they are expressed as positive input magnitudes. The compressor and expander enthalpy changes are calculated using their respective isentropic efficiencies, while mechanical efficiencies of 0.98 account for the differences between shaft power and the rate of energy transfer to or from the CO2. The associated mechanical losses are dissipated into the environment, and the mass, energy and performance relations are given by Equations (1)–(5).
Σ i n = Σ o u t
Q ˙ W ˙ + Σ i n   h i n Σ o u t   h o u t = 0
η c = ( h 2 s h 1 ) / ( h 2 h 1 )
η e = ( h i n h o u t ) / ( h i n h o u t , s )
C O P = ( Q G C , A ˙ + Q G C , B ˙ ) / ( W c ˙ W e ˙ )
The cycle heating COP is defined as the total heat supplied by gas coolers A and B divided by compressor power minus expander power. Although this definition excludes pumping, the 0.25 MW recycle-pump input, equivalent to approximately 1.1% of the baseline compressor input of 23.42 MW, is included in the water-side energy and component exergy balances. Make-up water is specified at the mixer inlet pressure, so its upstream pressurization is also excluded from COP, as are source-water circulation and water-treatment electricity. The reported COP, therefore, describes the CO2 heat-pump cycle without the electricity consumption of these auxiliary processes.
e ph = ( h h 0 ) T 0 ( s s 0 )
Ė D , k = Σ Ė i n Σ Ė o u t + Σ ( 1 T 0 / T b ) Q b ˙ W k ˙
η e x = Ė p r o d u c t / Ė f u e l
At steady state, the total flow entering the flash separator equals the sum of the make-up water and recycled-liquid flows, while the make-up water flow equals the delivered steam flow because no purge is included. The two liquid streams mix adiabatically at the water-heater inlet pressure, so the mixed-water enthalpy is determined from their mass flows and specific enthalpies using Equation (9).
f w = m a k e u p + r e c ; m a k e u p = s ; f w   h W 1 = m a k e u p   h M + r e c   h W 6  
The flash fraction is defined as the separated steam mass flow divided by the total water mass flow entering the throttling valve. For the combined adiabatic valve and separator, Equation (10) relates this fraction to the inlet-water enthalpy and the saturated steam and liquid enthalpies at the separator pressure. The flash fraction, therefore, describes the proportion of water converted to steam after throttling, whereas the phase fraction at the water-heater outlet describes the state before throttling, and CO2 vapor quality refers to a separate fluid circuit.
y f l a s h = s / f w = ( h W 2 h f ) / ( h g h f )  
Physical exergy is calculated relative to T0 = 298.15 K and p0 = 0.1013 MPa, with T_b in Equation (7) denoting the absolute temperature at which heat Q˙_b crosses the control-volume boundary. For a heat exchanger whose control volume contains both streams and is externally adiabatic, this external heat-transfer term is zero because heat passes between the enclosed streams rather than through the control-volume boundary. The water throttling valve and flash separator are treated as one control volume extending from inlet W2 to outlets W3 and W5, so the exergy destruction includes pressure reduction rather than being assigned to ideal phase separation alone. The control volumes used for the other components are specified in Table 5.
Ė F = W c ˙ W e ˙ + W p ˙ + s o u r c e ( e s o u r c e , i n e s o u r c e , o u t ) ; Ė P = s ( e W 4 e M )  
The effect of compressor isentropic efficiency on electrical power input is estimated using Equation (12), which retains the baseline isentropic compression requirement and scales the compressor input according to the specified efficiency. In this equation, subscript b denotes baseline values; the gas-cooler duties and expander power are held constant when the corresponding COP is calculated using Equation (5). Thus, the calculation isolates the effect of compressor power on COP and does not recalculate the discharge temperature or heat transfer in the rest of the cycle.
W c ˙ ( η c ) = W c , b ˙   η c , b   /   η c
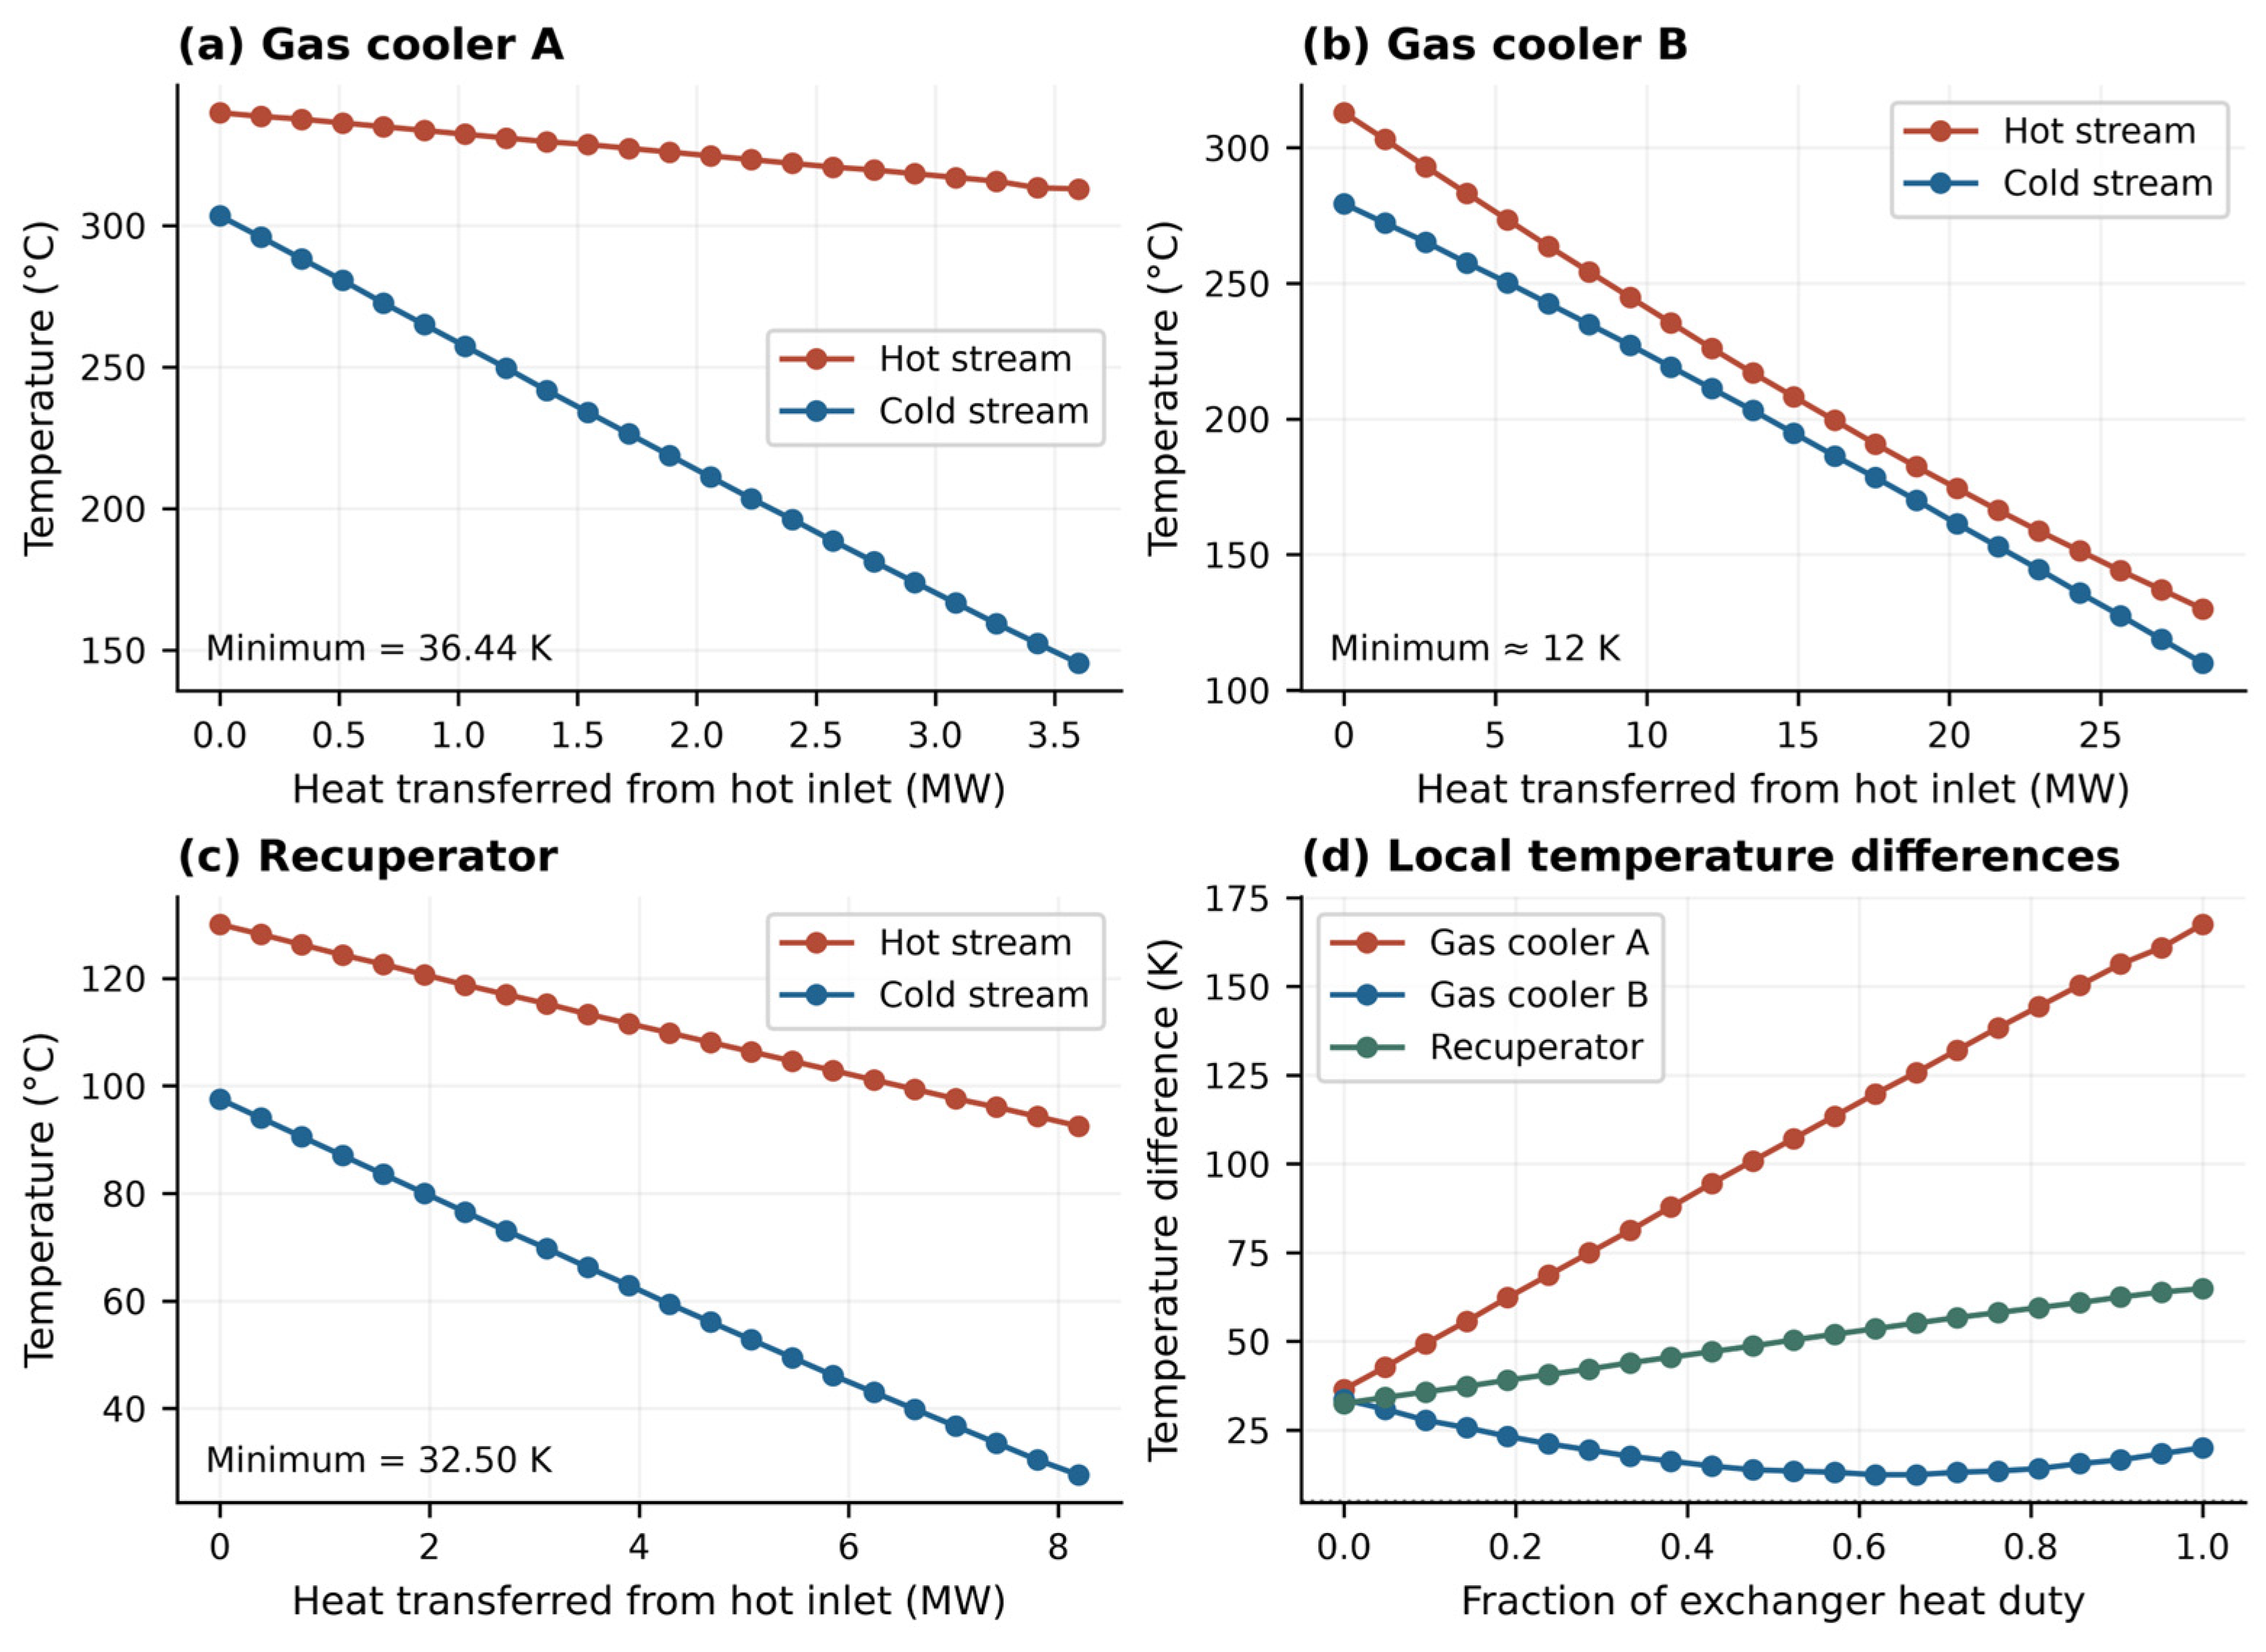
Temperature differences in the counterflow heat exchangers are evaluated between the hot and cold streams at corresponding positions, following the local temperature-difference approach in Refs. [11,24]. The cumulative heat-transfer coordinate starts at the hot-stream inlet, opposite the cold-stream outlet, and ends at the hot-stream outlet, opposite the cold-stream inlet. Figure 5 uses this coordinate to reproduce the 22 points displayed in each Aspen temperature–heat-duty profile for gas coolers A and B and the recuperator. The smallest temperature difference among these points is calculated using Equation (13), with interior temperatures read from the graphical output and, therefore, reported approximately; the reference minimum temperature difference is 5 K.
Δ T m i n , s a m p l e d = m i n j [ T h o t ( Q j ) T c o l d ( Q j ) ] ; r e f e r e n c e   c r i t e r i o n :   Δ T m i n     5   K
A reference minimum temperature difference of 5 K is adopted because this study examines thermodynamic performance without specifying heat-exchanger area, allowing for smaller temperature differences to be considered than under a 10 K reference. For a given local heat-transfer rate and overall heat-transfer coefficient, a smaller positive temperature difference requires a larger heat-transfer area [25]; therefore, the reference value is used to compare the calculated cases rather than to establish an equipment-design limit.
The internal temperature profiles are examined for the baseline gas coolers and recuperator, while the evaporator is assessed at its two terminals. For a source-water inlet and outlet of 50 and 25 °C and a CO2 inlet and outlet of approximately 0.43 and 27.67 °C, the counterflow terminal differences are 22.33 and 24.57 K, respectively. The difference at the source-water inlet uses the superheated CO2 outlet temperature rather than the evaporation temperature, because the CO2 continues to receive heat after evaporation is complete.

2.5. Published Model Comparison and Parametric Analysis

Published comparisons between experimental and predicted CO2 heat-pump performance are examined to describe the validation reported for the modeling approach used in Ref. [9]. The absolute relative deviations in heating duty and COP are calculated using Equation (14), and Appendix B identifies the source of each experimental and predicted value.
δ Y = | ( Y p r e d Y e x p ) / Y e x p | × 100 %
Li et al. [9] compared their CO2 heat-pump predictions with the experimental results of Wolscht et al. [26], and the first five comparisons in their Table 2 are reproduced in Appendix B. Recalculation from the published rounded values gives maximum absolute relative deviations of 4.82% for heating duty and 4.59% for COP. These results describe the agreement obtained in Ref. [9] under the experimental conditions of Ref. [26]; they are not new simulations or experimental validation of the present CAES-coupled system at 300 °C. The present calculations are, instead, checked for thermodynamic consistency using the baseline state properties, conservation balances and heat-exchanger temperature profiles.
The parametric analysis comprises four independent series of five cases each, with the varied parameters and fixed conditions listed in Table 6. In the CO2 series, the compressor suction temperature is varied from 94.5 to 100.5 °C or the discharge pressure from 25.6 to 26.4 MPa, while the CO2 flow, evaporator duty and steam-superheater duty remain at 105 kg s−1, 11.64 MW and 3.60 MW, respectively. In the water-side series, either the make-up water temperature or total circulating-water flow is varied, while the baseline CO2 states are retained. For each case, heat duties, powers and steam conditions are obtained from the same Aspen simulation, and COP is calculated using Equation (5). Since component efficiencies are prescribed and the heat-exchanger area is not fixed, the analysis evaluates the effects of these thermodynamic parameters rather than predicting the off-design performance of specified equipment.
Table 6. Parameter-study matrix. Pressures are absolute. The water-heater inlet and outlet pressures are 7.00 and 6.98 MPa, respectively, in all parameter cases. The baseline is specified independently in Table 3 and Table 4.
SeriesVariableLevelsFixed/Stated Conditions
CO2 suctionT_in (°C)94.5, 96.0, 97.5, 99.0, 100.5p_in 3.485 MPa; p_out 26.0 MPa; ṁ_CO2 105 kg s−1
CO2 pressurep_out (MPa)25.6, 25.8, 26.0, 26.2, 26.4T_in 97.5 °C; p_in 3.485 MPa; ṁ_CO2 105 kg s−1
Shared CO2 conditionsQ_source/Q_GC,A11.64/3.60 MWPrescribed duties; component efficiencies fixed; heat-exchanger area not specified
Water temperatureMake-up water T (°C)16, 18, 20, 22, 24Total flow 37 kg s−1; 7.00 MPa water inlet; baseline CO2 states
Water circulationTotal flash feed (kg s−1)36, 40, 44, 48, 52Make-up water 20 °C; water inlet/outlet 7.00/6.98 MPa; baseline CO2 states

3. Results and Discussion

3.1. Baseline Thermodynamic Performance

At the baseline, gas coolers A and B supply a combined 31.96 MW, while the compressor consumes 23.42 MW and the expander produces 2.57 MW, producing a net cycle power input of 20.85 MW and a COP of 1.533. Under these conditions, the system produces 10.79 kg s−1 of steam at 303.33 °C and 0.40 MPa, with an equal make-up water flow replacing the steam delivered to the user. The remaining 26.21 kg s−1 of the separated liquid is recycled and mixed with the make-up water, raising the water-heater inlet temperature to 110.00 °C and making the total circulating-water flow 3.43 times the steam flow. Most of the water heated in gas cooler B, thus, remains in the circuit, retaining the sensible heat of the separated liquid for the next heating process.
Including mechanical losses of approximately 0.468 MW in the compressor and 0.052 MW in the expander, the difference between the CO2-cycle energy input and output is approximately 0.009 MW, equivalent to 0.029% of the total gas-cooler duty. Independent REFPROP calculations also give water-side heat-transfer rates of 3.600 and 28.357 MW for gas coolers A and B, respectively, which agree with the Aspen results to the reported precision. For the mixer, the combined enthalpy flow of make-up water and recycled liquid differs from that of the mixed stream by less than 0.001 MW; the difference between the enthalpy flow entering the water throttling valve and the combined steam and liquid enthalpy flows leaving the separator is likewise below 0.001 MW. These comparisons support the consistency of the reported states with the cycle and water-circuit energy balances.
Gas cooler B supplies 88.7% of the total heating duty because it heats the entire 37 kg s−1 circulating-water stream, whereas gas cooler A supplies the remaining 11.3% to the separated steam. At the specified water flow and separator pressure, the heat transferred in gas cooler B determines the water enthalpy before throttling and, hence, the amount of steam generated, while the approximately 334 kJ kg−1 transferred in gas cooler A determines the subsequent steam-temperature increase. In addition to these external heating duties, the recuperator transfers 8.19 MW between the high- and low-pressure CO2 streams, equivalent to 25.6% of the total gas-cooler duty. Since this heat is transferred internally rather than supplied from an additional source, the effect of recuperation on COP depends on the associated changes in compressor and expander powers, which are examined in Section 3.2.

3.2. Effects of Compressor Suction Temperature and Discharge Pressure

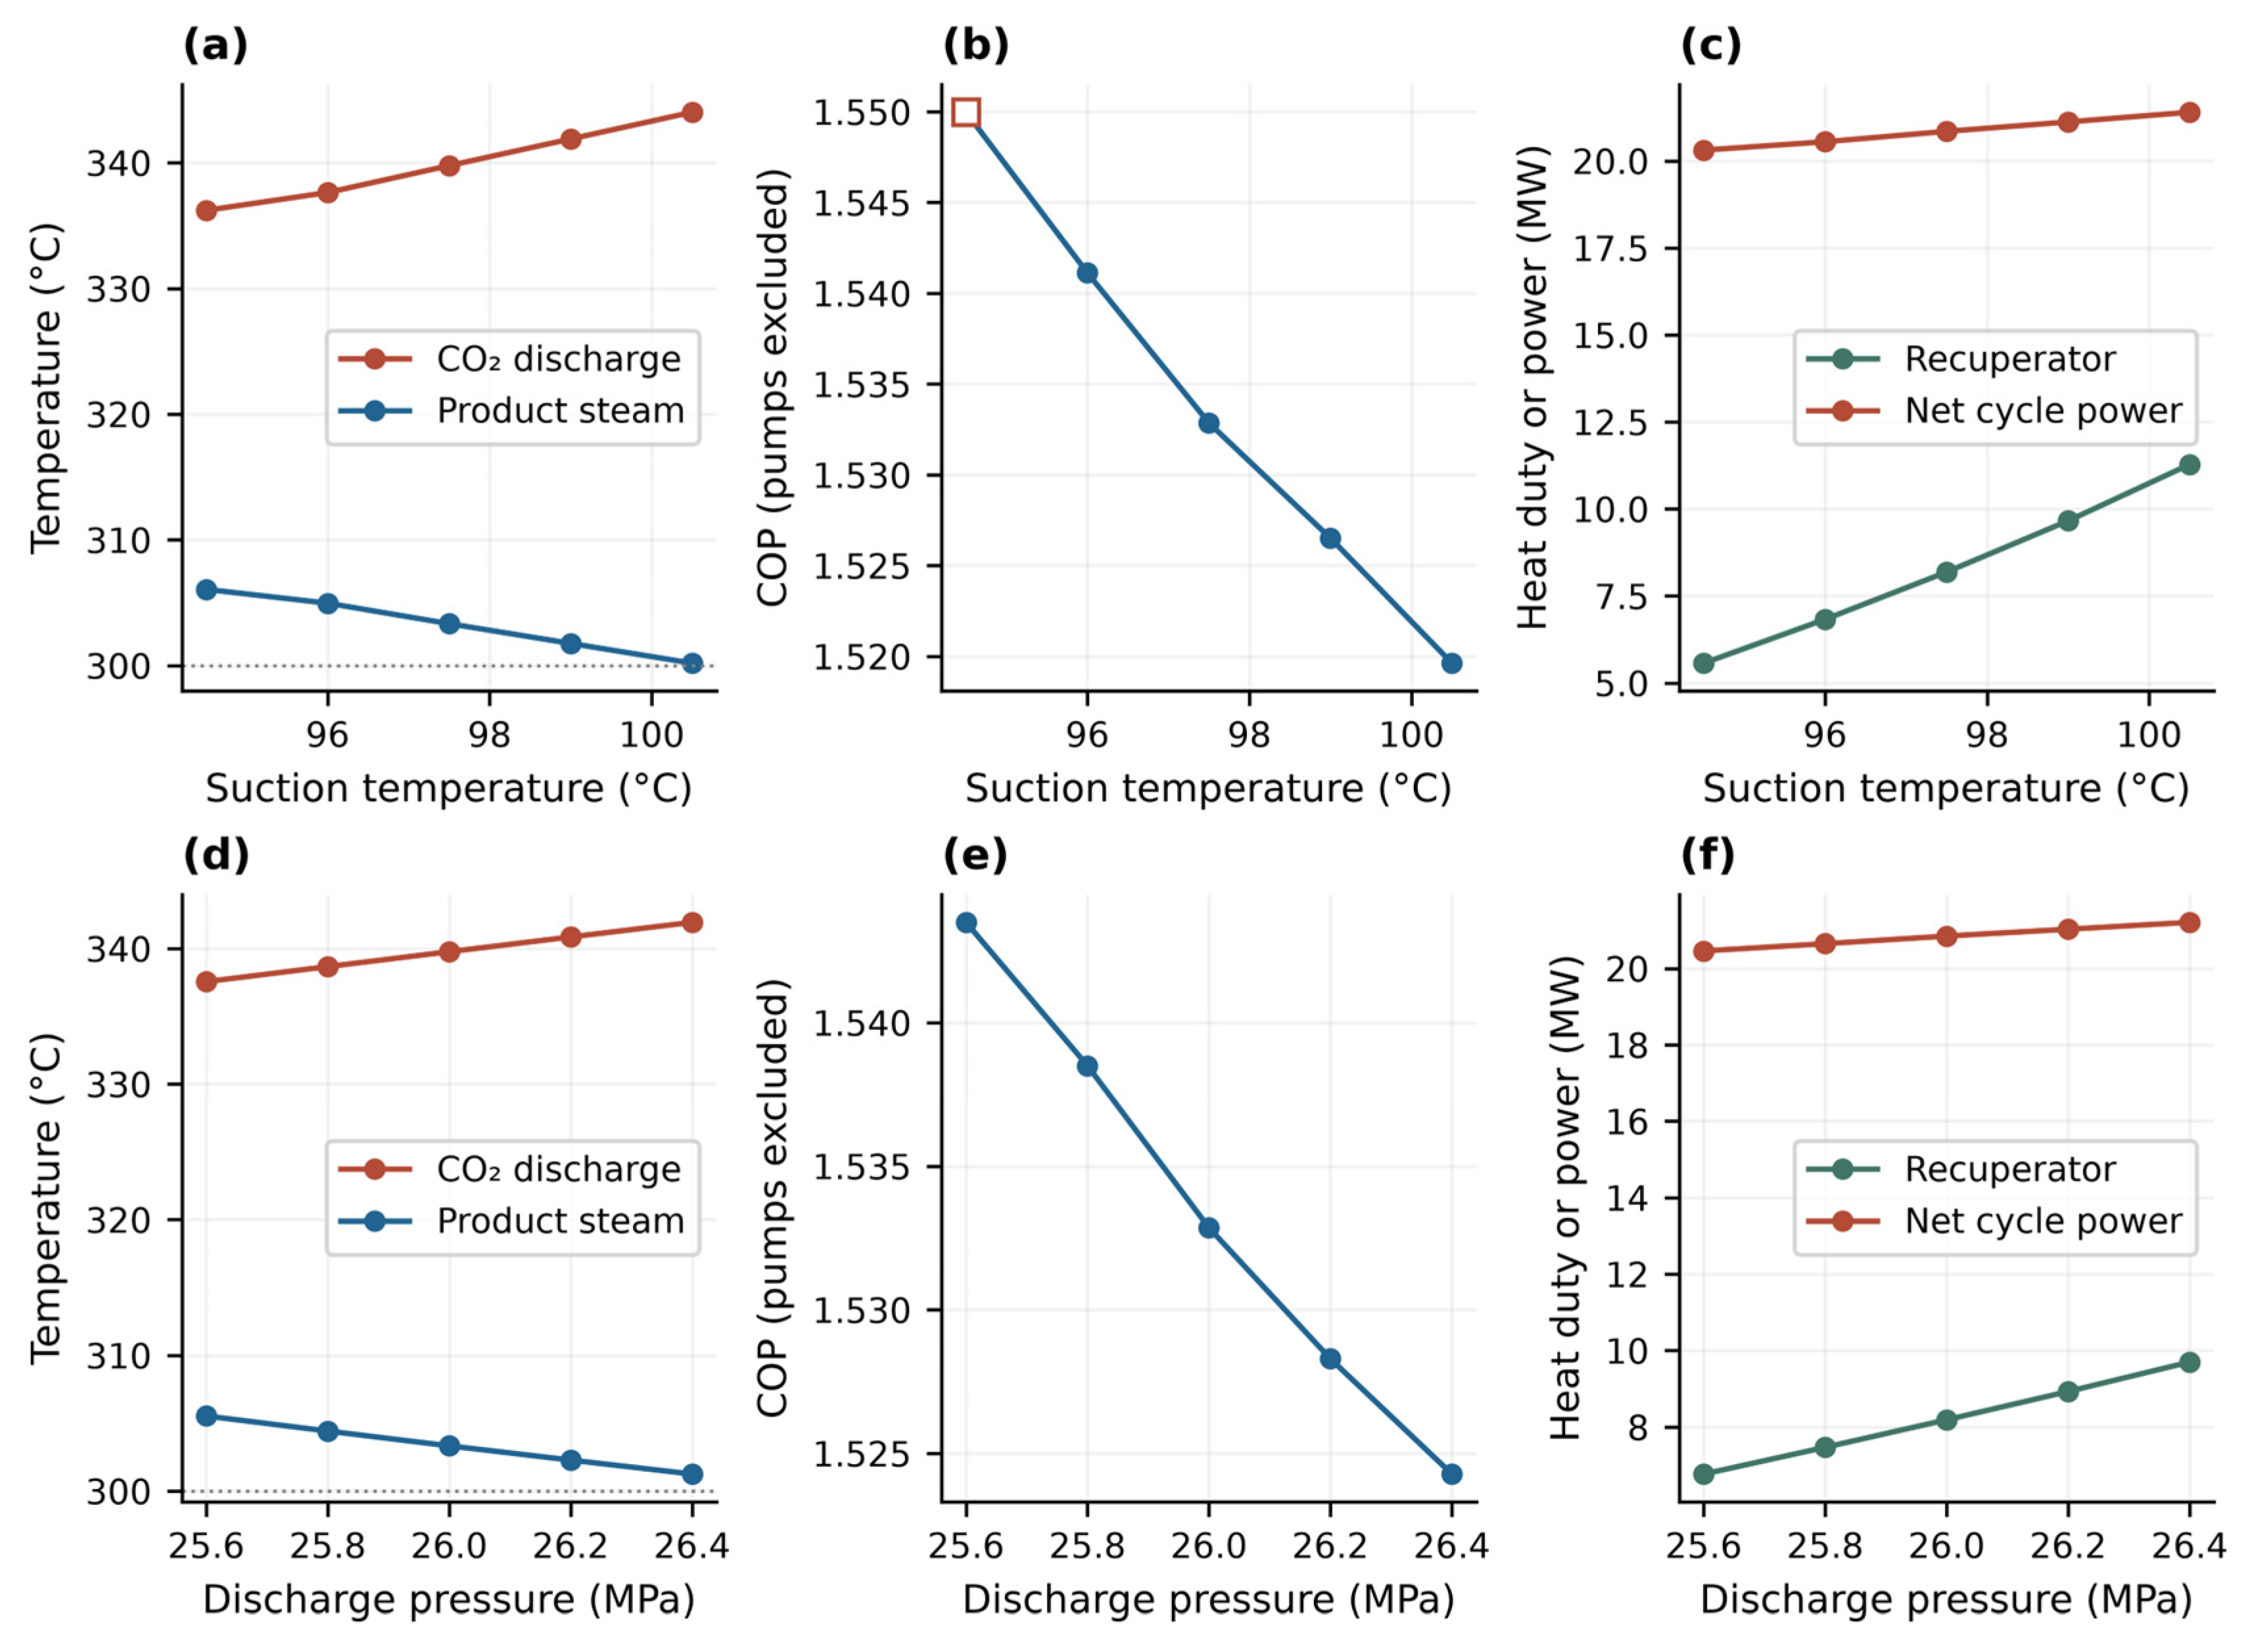
Increasing compressor suction temperature from 94.5 to 100.5 °C raises discharge temperature from 336.21 to 344.02 °C, as shown in Figure 6a–c, while the required recuperator duty increases from 5.57 to 11.28 MW. This additional heat is supplied by the high-pressure CO2, whose recuperator outlet temperature decreases from 104.00 to 79.20 °C, thereby reducing the energy available for recovery in the expander. Over the same range, compressor power increases from 23.21 to 23.65 MW and expander power decreases from 2.90 to 2.25 MW, so the net power input rises by 5.4%, compared with a 3.3% increase in heating duty. COP, therefore, decreases from 1.550 to 1.520, demonstrating that the increase in discharge temperature obtained through stronger recuperation is accompanied by a greater proportional increase in electrical power consumption than in useful heat output.
Steam flow increases from 10.61 to 11.00 kg s−1 over this suction-temperature range, although steam delivery temperature decreases from 306.06 to 300.19 °C. Because the superheater duty is fixed at 3.60 MW, the additional steam receives less heat per kilogram, which explains why the steam temperature falls even as the CO2 discharge temperature rises. The evaporator temperature difference also decreases as the suction temperature is reduced: at 94.5 °C suction, the CO2 outlet temperature is 45.93 °C, producing a terminal difference of 4.07 K from the 50 °C source-water inlet. Although this value is below the 5 K reference, a positive temperature difference of approximately 4 K can still support heat transfer if sufficient heat-transfer area is provided. The 94.5 °C case is, therefore, retained in the thermodynamic analysis and identified by an open square in Figure 6, while the other four cases exceed 5 K at both evaporator terminals. Because the present analysis examines thermodynamic potential rather than selecting exchanger dimensions, retaining this case does not imply that a particular exchanger design has been demonstrated.
Increasing compressor discharge pressure from 25.6 to 26.4 MPa also increases both the heating duty and net power input, as shown in Figure 6d–f. Although the discharge temperature rises by 4.38 K and the total heating duty increases from 31.58 to 32.33 MW, the larger proportional increase in net power input, from 20.46 to 21.21 MW, reduces COP from 1.543 to 1.524. The additional heat supplied to the water circuit increases steam production from 10.65 to 10.93 kg s−1; however, the fixed superheater duty then supplies less heat per kilogram, lowering steam delivery temperature by 4.28 K. Within the investigated pressure range, a higher discharge pressure, therefore, increases steam production at the expense of COP and steam temperature, so its selection requires considering the required steam flow and temperature together.

3.3. Effects of Make-Up Water Temperature and Circulating-Water Flow

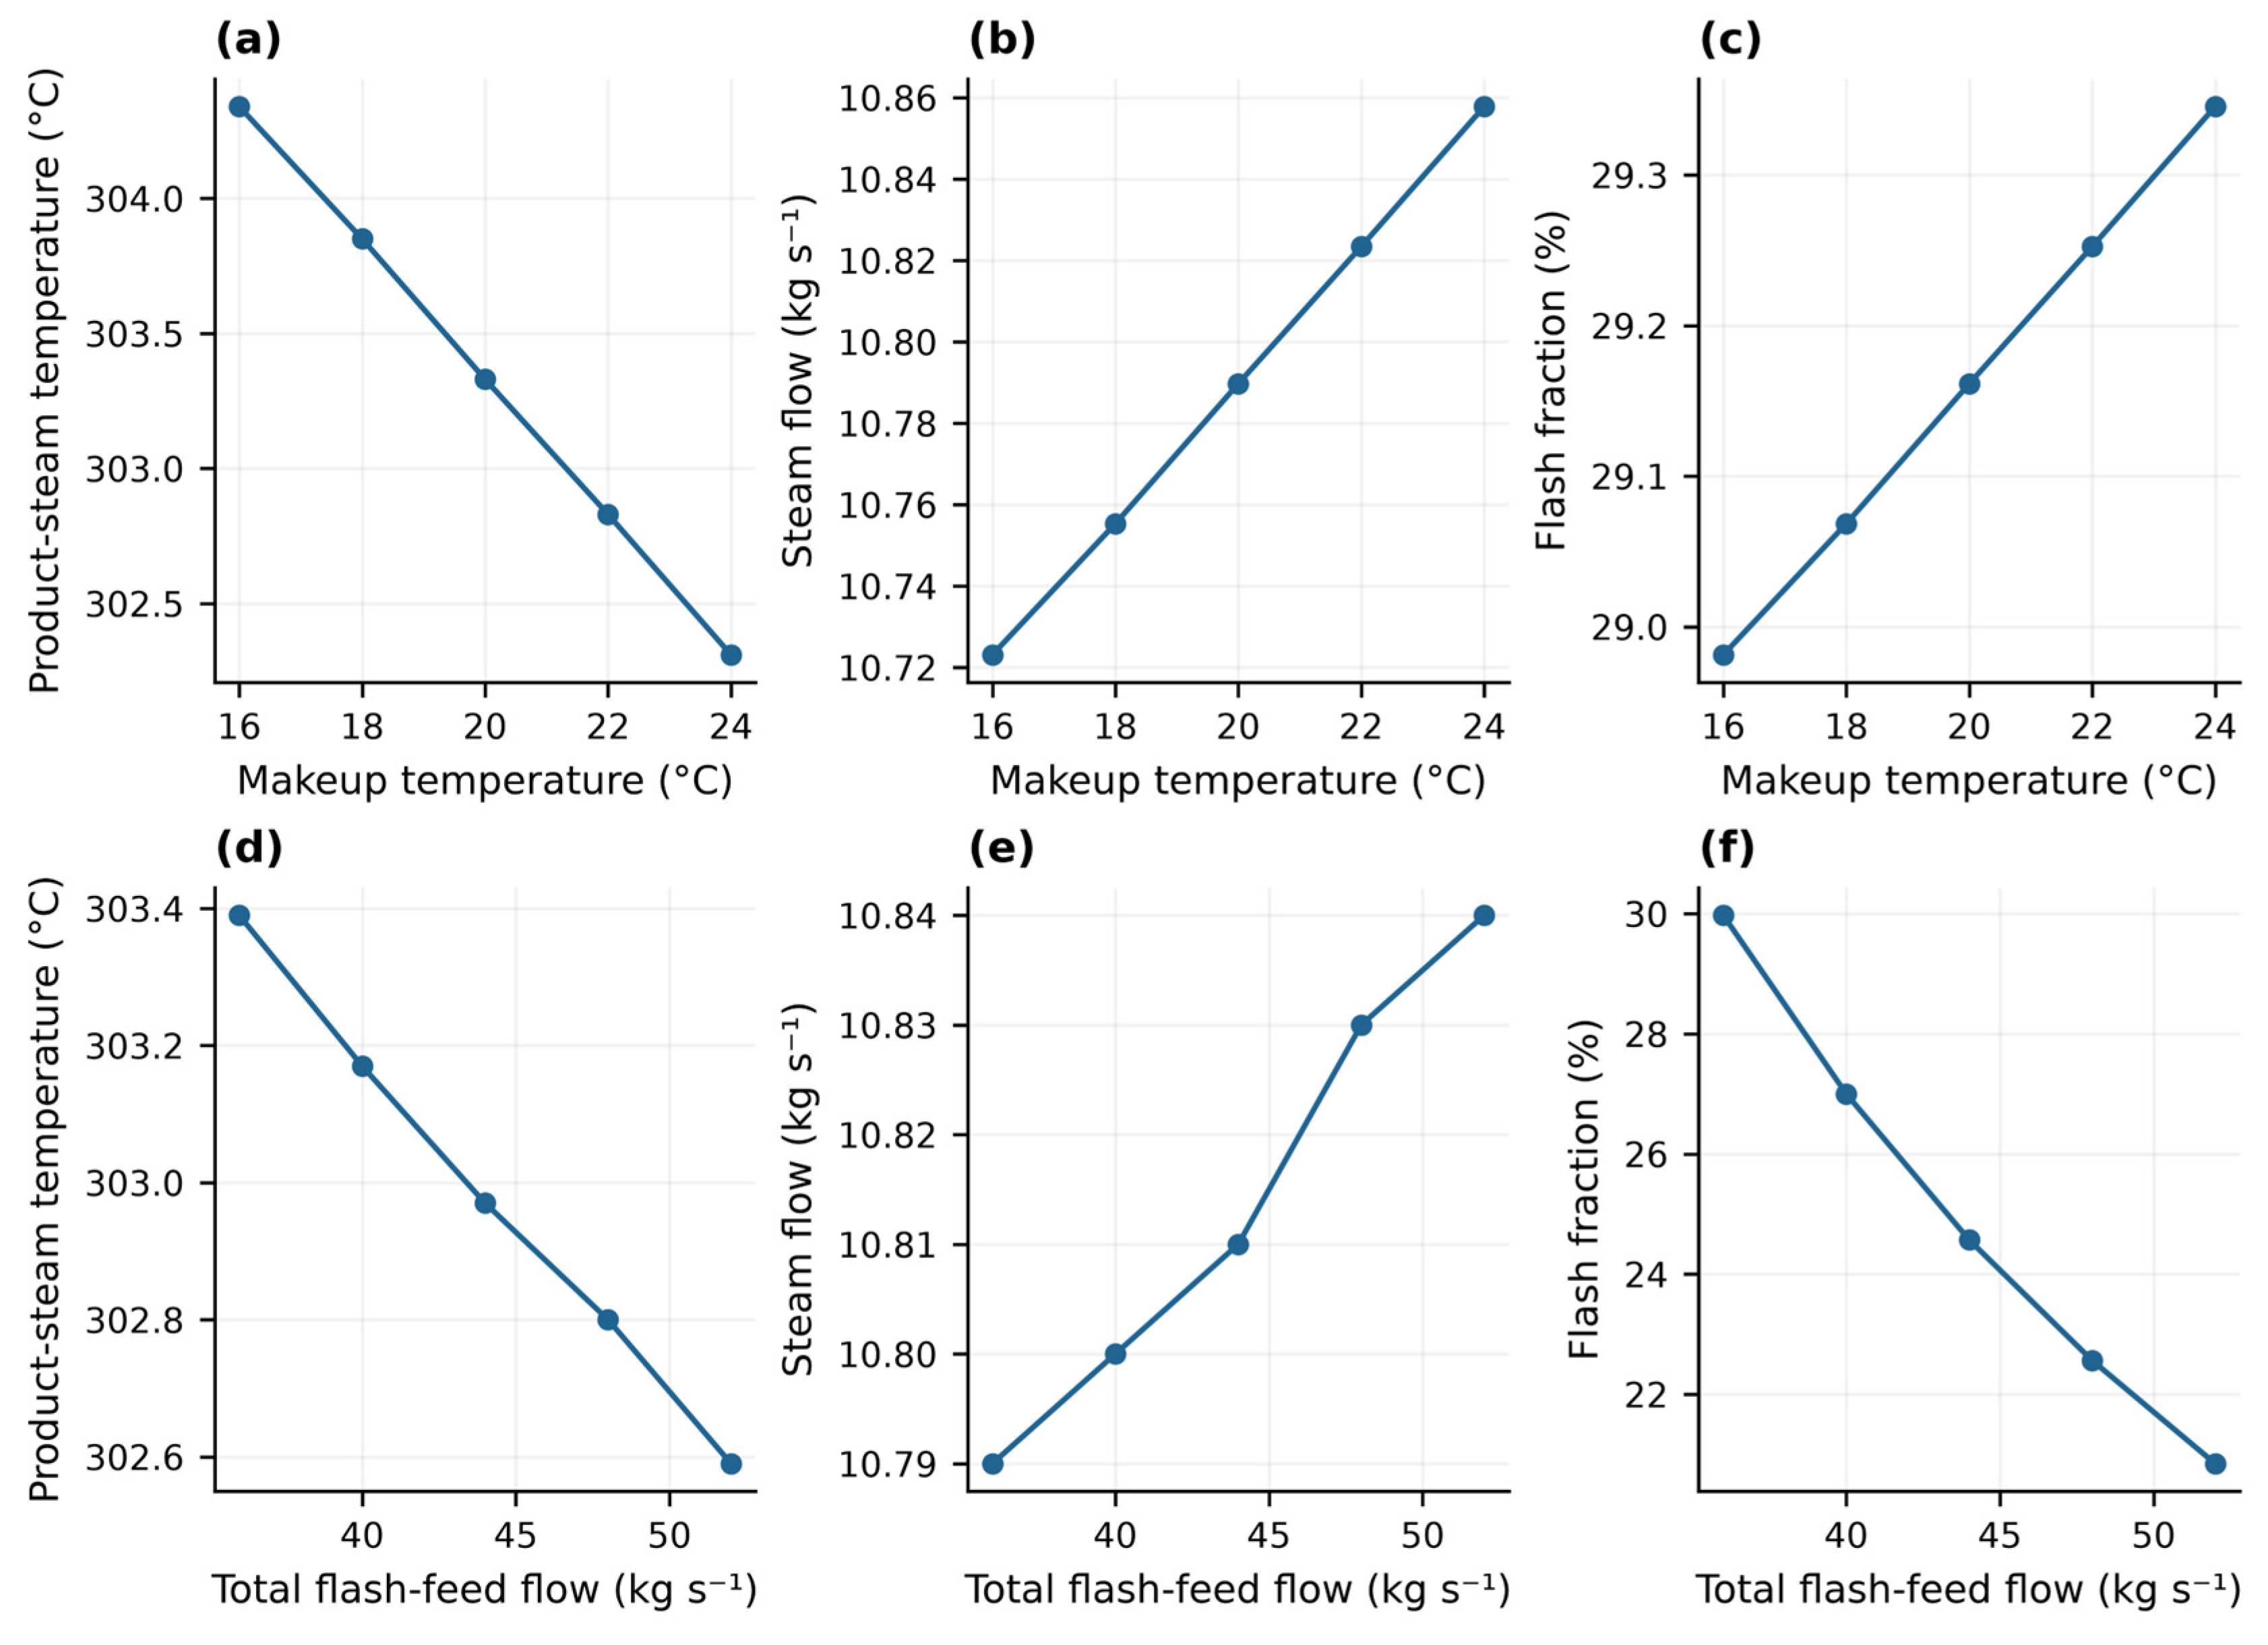
The water-side cases retain the baseline CO2 states and approximately the same gas-cooler duties, so Figure 7 shows how water temperature and circulation affect steam production without changing the CO2-cycle conditions. Increasing the make-up water temperature from 16 to 24 °C raises the mixed-water inlet temperature from 109.09 to 110.93 °C and the gas-cooler-B outlet temperature from 278.56 to 280.03 °C. The higher outlet-water enthalpy increases the fraction converted to steam at the fixed separator pressure, raising steam flow from approximately 10.72 to 10.86 kg s−1. Since the superheater still supplies 3.60 MW, however, the heat supplied per kilogram of steam decreases and the delivery temperature falls by 2.03 K. Thus, under the specified gas-cooler duties, preheating the make-up water increases steam production rather than the final steam temperature.
Increasing the total circulating-water flow from 36 to 52 kg s−1 changes steam production by only approximately 0.05 kg s−1, while the flash fraction decreases from 29.97% to 20.85%. Most of the additional water, therefore, remains liquid after flashing and returns to the water heater. As approximately the same gas-cooler-B duty is distributed over a larger mass flow, the enthalpy increase per kilogram decreases and the outlet temperature falls from 282.50 to 243.77 °C. The greater proportion of hot recycled liquid also raises the mixed-water inlet temperature from 108.98 to 120.45 °C, so the temperature rise across the heater becomes smaller. A higher circulation rate, consequently, increases the degree of subcooling at the heater outlet but provides little additional steam, indicating that circulation should be selected with regard to the liquid state before throttling and the temperature differences within the heater.
Water pressure and circulation affect the liquid state through different mechanisms, since higher pressure raises the saturation temperature, whereas higher flow reduces the enthalpy increase per kilogram at a fixed heating duty. At an outlet pressure of 6.98 MPa, the lowest-flow case of 36 kg s−1 reaches 282.50 °C and remains approximately 3.14 K below saturation; the larger flows provide greater subcooling without a comparable increase in steam production. To check the relationship between water heating and flashing, the separated steam flow is also calculated from the water enthalpy before throttling and the saturated-state enthalpies at the separator pressure. Using independent REFPROP properties, this calculation agrees with the reported steam flows within 0.005 kg s−1 for all 20 cases.

3.4. Heat-Exchanger Temperature Differences and Exergy Destruction

The baseline profiles in Figure 5 identify a minimum temperature difference of approximately 12 K inside gas cooler B, at about 18 MW of cumulative heat transfer, or approximately three-fifths of the total duty. This value is smaller than the terminal differences of 33.58 and 20.00 K because the temperatures of high-pressure CO2 and liquid water change at different rates along the exchanger. A check based only on the terminal temperatures would, therefore, overestimate the smallest temperature difference available for heat transfer, even when the total duty satisfies the overall energy balance. Gas cooler B, thus, requires an internal temperature-profile assessment in addition to the inlet and outlet state calculations.
Gas cooler A and the recuperator differ from gas cooler B in that their smallest displayed temperature differences occur at the hot-inlet/cold-outlet end, with values of 36.44 and 32.50 K, respectively. All displayed points in the three baseline profiles, therefore, exceed the 5 K reference value. For the parameter cases, the evaporator checks are based on terminal temperatures, whereas the internal temperature profiles of the gas coolers and recuperator are evaluated for the baseline.
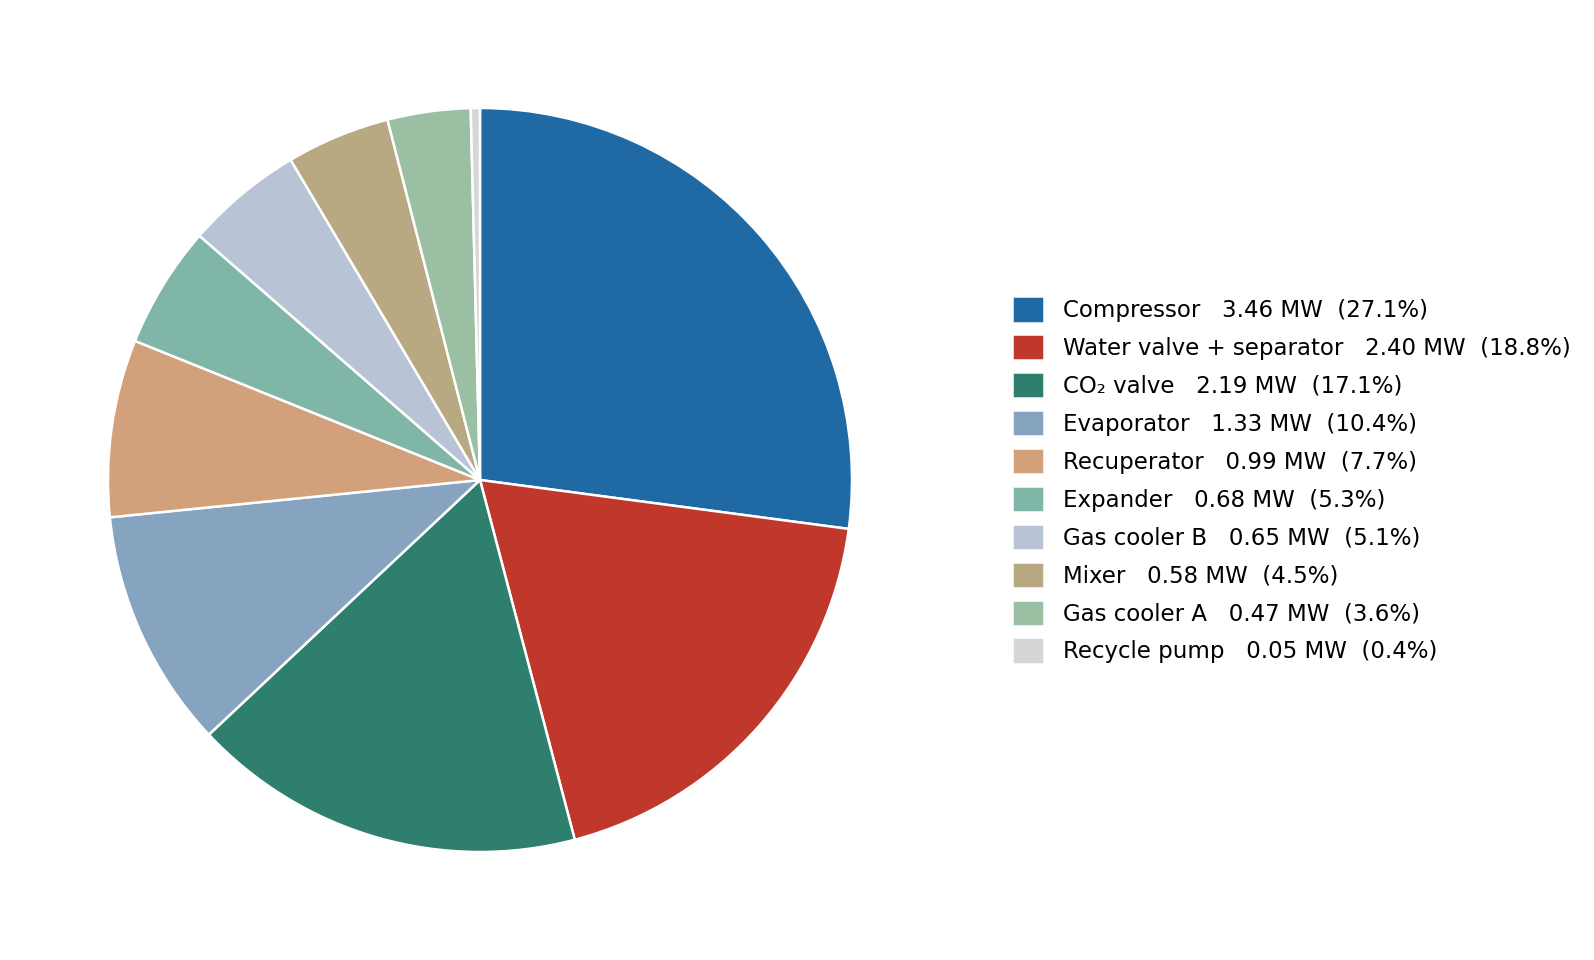
Non-isentropic compression accounts for approximately 27.0% of the estimated total exergy destruction of 12.81 MW, followed by the water throttling valve and flash separator at 18.7% and the CO2 valve at 17.1%, as shown in Figure 8. The compressor requires more work than an isentropic process, whereas the valves reduce pressure without recovering work; improving compressor efficiency and reducing throttling losses, therefore, address different sources of irreversibility. Changes to the water- or CO2-pressure levels would, nevertheless, need to preserve the required steam-generation conditions and the single-phase expander outlet. The recuperator, which accounts for approximately 7.7% of total exergy destruction, also affects the work of both machines, as demonstrated by the suction-temperature analysis in Section 3.2. Its performance must, consequently, be assessed through the resulting cycle power consumption, as well as the exergy destroyed within the exchanger itself.
Although the source water releases 11.64 MW of heat, its temperature is close to the 25 °C reference environment, resulting in a thermal exergy decrease of only approximately 0.46 MW. Electrical work, consequently, provides most of the total exergy input of 21.56 MW, which includes compressor power minus expander power, recycle-pump power and the source-water exergy decrease. The net increase in exergy from make-up water to delivered steam is approximately 8.76 MW, corresponding to an exergy efficiency of 40.6%. Since source-water pumping and make-up water pressurization are excluded, a comparison with another system would require the same treatment of auxiliary electricity and identical steam-delivery conditions.

4. Engineering Considerations and Study Limitations

4.1. Equipment Considerations

The baseline compressor operates at a pressure ratio of 7.46 and discharges CO2 at approximately 26 MPa and 340 °C, while the inlet density of approximately 54.4 kg m−3 corresponds to a suction volumetric flow of approximately 1.93 m3 s−1. Selecting a compression arrangement for these conditions requires considering the temperature needed for steam superheating, because intercooling between compression stages would change the discharge temperature available to gas cooler A. Compressor efficiency also has a substantial effect on electricity consumption. Using Equation (12), the calculated COP increases from 1.424 to 1.643 when isentropic efficiency increases from 0.735 to 0.835, with heating duty and expander power held constant. This estimate accounts only for the change in compressor power; evaluating an actual compressor would additionally require recalculating discharge temperature and the resulting heat transfer.
Operation at the specified compressor pressure and temperature requires suitable casing and rotor materials, seals and lubrication, with oil-free compression or separation of the lubricant from hot CO2 considered during equipment selection. The gas coolers must also withstand high CO2 pressure, but the recuperator has a lower maximum temperature because its high-pressure inlet is approximately 130 °C rather than the compressor discharge temperature. Materials, joints and allowable differential pressures must, therefore, be selected for the operating conditions of each component, while pressure losses and deposits on heat-transfer surfaces must be included when estimating the performance of the installed system.

4.2. Scope and Limitations

The CAES cooling-water heat is available during the six-hour charging period, over which the baseline heat pump receives 69.84 MWh of source heat and produces approximately 233 t of steam. Thermal storage can shift the time at which this heat is used [27], although it cannot increase the daily energy supply. If CAES charging is the only daily heat source, ideal redistribution over 24 h would, therefore, provide an average source heat-transfer rate of 2.91 MW and approximately 2.70 kg s−1 of steam, assuming unchanged performance per unit output. Maintaining the full baseline steam-production rate continuously would instead require another heat source outside the charging period.
The results are obtained from a steady-state thermodynamic model with prescribed component efficiencies and do not represent measurements of a complete installation. Equipment testing is, therefore, needed to determine actual compressor performance and auxiliary electricity consumption, followed by a techno-economic assessment of the resulting operating costs. These requirements are consistent with the distinction between calculated heat-pump performance and performance in engineering applications discussed in Ref. [28].

5. Conclusions

This study evaluates the use of low-temperature CAES cooling water in a recuperated CO2 heat pump for industrial steam generation near 300 °C. The steady-state calculations lead to the following findings:
Cooling water supplied at 50 °C and returned at 25 °C provides 11.64 MW, equivalent to 12.8% of the CAES cooling duty. With saturated-liquid recycling, the baseline produces 10.79 kg s−1 of steam at 0.40 MPa and 303.33 °C and supplies 31.96 MW of heat, giving a COP of 1.533 at a net cycle power input of 20.85 MW, excluding pumping. The water-heater outlet remains 6.35 K below saturation and the CO2 expander outlet remains single-phase, so water flashing and formation of the two-phase CO2 mixture occur in their respective downstream throttling processes.
Increasing compressor suction temperature from 94.5 to 100.5 °C raises discharge temperature by 7.81 K but reduces COP from 1.550 to 1.520, because net power input increases proportionally more than heating duty as compressor power rises and expander power falls. Although steam production increases, the fixed superheater duty supplies less heat per kilogram, causing steam delivery temperature to decrease despite the higher CO2 discharge temperature. Recuperation must, therefore, be evaluated by its combined effects on heat output and machine powers, rather than the discharge-temperature increase alone.
An increase in the discharge pressure from 25.6 to 26.4 MPa increases steam production but reduces COP, from 1.543 to 1.524, and lowers the steam temperature by 4.28 K at the fixed superheater duty. In the separate water-circulation analysis, increasing the flow from 36 to 52 kg s−1 reduces the flash fraction from 29.97% to 20.85% while producing only approximately 0.05 kg s−1 of additional steam. Since most of the additional circulating water is recycled as liquid, circulation should be selected to maintain subcooled heating and sufficient heat-transfer temperature differences rather than increased solely to raise steam output.
All displayed points in the three baseline counterflow profiles exceed the 5 K reference value, although the internal minimum of approximately 12 K in gas cooler B is smaller than either terminal temperature difference. Compression and water throttling with flash separation account for approximately 27.0% and 18.7% of total exergy destruction, respectively, identifying compressor efficiency and pressure reduction as important considerations alongside heat-exchanger temperature matching. Together, these results support the thermodynamic assessment of CAES waste-heat recovery for industrial steam generation, while equipment testing and dynamic validation remain necessary before implementation.


Author Contributions

Conceptualization, W.L., T.Z., J.T. and Y.L.; methodology, W.L. and J.T.; software, J.T.; validation, W.L. and T.Z.; formal analysis, W.L., T.Z. and F.B.; investigation, W.L., T.Z. and F.B.; resources, W.L.; data curation, W.L.; writing—original draft preparation, W.L., T.Z. and J.T.; writing—review and editing, Y.L. and J.F.; visualization, F.B.; supervision, Y.L. and J.F.; project administration, Y.L. and J.F.; funding acquisition, Y.L. All authors have read and agreed to the published version of the manuscript.

Funding

This research received no external funding.

Data Availability Statement

The numerical results of the parameter studies and the sources of the published experimental comparisons are provided in Appendix A and Appendix B. The Aspen block definitions and principal numerical settings are summarized in Table A7. Public release of the native Aspen model and associated post-processing files is restricted under third-party licensing conditions; the numerical data and modeling details reported in this article remain available for assessment of the calculations.

Conflicts of Interest

Author Wanqing Liu, Tianlin Zou and Jiajian Tan were employed by the company Shengu Group Co., Ltd., which is focuses on industry–university–research cooperation. It provided industrial-engineering application background, practical engineering data, and equipment operation verification support for the theoretical research and experimental testing in this paper. The remaining authors declare that the research was conducted in the absence of any commercial or financial relationships that could be construed as potential conflicts of interest.

Nomenclature

SymbolDefinitionSubscriptDefinition
COPCoefficient of performance0Environmental reference state
eSpecific exergycCompressor
ĖDExergy-destruction rateeExpander
hSpecific enthalpyevapEvaporator
Mass-flow ratefwFeedwater
pPressureGCGas cooler
QHeat-transfer ratehHeating
sSpecific entropyin/outInlet/outlet
TTemperaturepPump
PowerrecRecuperator
xRefrigerant vapor mass fractionsSteam
ηEfficiency
ΔTminMinimum local temperature difference
y_flashSeparated steam/total flash-feed mass

Appendix A. Parametric Results and Baseline Energy and Exergy Balances

Table A1. Aspen CO2 parameter states, recuperator heat duty and component powers. S1–S5 identify the suction-temperature cases and P1–P5 the discharge-pressure cases; these case identifiers are distinct from the Aspen stream labels.
CaseT_in (°C)p_out (MPa)T_out (°C)Q_rec (MW)W_c (MW)W_e (MW)
S194.5026.00336.215.5723.212.90
S296.0026.00337.636.8323.292.74
S397.5026.00339.778.1923.422.57
S499.0026.00341.899.6623.532.41
S5100.5026.00344.0211.2823.652.25
P197.5025.60337.566.7723.182.72
P297.5025.80338.677.4723.302.65
P397.5026.00339.778.1923.422.57
P497.5026.20340.868.9323.532.50
P597.5026.40341.949.7023.652.44
Table A2. Heating and steam outputs corresponding to Table A1. COP is calculated from the reported total heating duty divided by compressor input minus recovered expander power; pumping is excluded.
CaseQ_GC,B (MW)Q_GC,total (MW)Steam (kg s−1)Steam T (°C)COP
S127.8831.4810.61306.061.5500
S228.0731.6710.68304.961.5411
S328.3631.9610.79303.331.5329
S428.6432.2410.90301.761.5265
S528.9232.5211.00300.191.5196
P127.9831.5810.65305.531.5435
P228.1731.7710.72304.421.5385
P328.3631.9610.79303.331.5329
P428.5432.1410.86302.281.5283
P528.7332.3310.93301.251.5243
Table A3. Separate make-up water temperature (T1–T5) and circulating-water flow (F1–F5) series, with steam delivered at 0.40 MPa. Water pressures are specified in Table 6. Flash fraction is the ratio of separated steam flow to total water flow entering the throttling valve.
CaseMake-Up Water T (°C)Total Flow (kg s−1)Heater Outlet (°C)Steam T (°C)Steam (kg s−1)Flash (%)
T11637278.56304.3410.7228.98
T21837278.91303.8510.7629.07
T32037279.29303.3310.7929.16
T42237279.65302.8310.8229.25
T52437280.03302.3110.8629.35
F12036282.50303.3910.7929.97
F22040270.40303.1710.8027.00
F32044260.13302.9710.8124.57
F42048251.33302.8010.8322.56
F52052243.77302.5910.8420.85
Table A4. Baseline heat-transfer rates, powers and exergy inputs and outputs. Mechanical losses are dissipated into the environment, and the difference between energy input and output is calculated using the reported rounded values.
QuantityValueBoundary/Interpretation
Source heat11.64 MWExternal heat input
Compressor input23.42 MWReported input power
Expander output2.57 MWPower recovered by expansion
Recycle-pump input0.25 MWIncluded in water-side energy and exergy balances; excluded from COP
Gas cooler A/B3.60/28.36 MWSum 31.96 MW
Net cycle work20.85 MW23.42 − 2.57; pumps excluded
Cycle COP1.53331.96/20.85
Compressor mechanical loss0.4684 MW23.42 × (1 − 0.98)
Expander mechanical loss0.0524 MW2.57 × (1/0.98 − 1)
CO2-cycle energy input minus output0.0092 MW11.64 + 23.42 × 0.98 − 2.57/0.98 − 31.96
Make-up water/recycled liquid/steam10.79/26.21/10.79 kg s−137.00 kg s−1 total flash feed; no purge
Source-water and make-up water auxiliary equipmentExcludedOutside detailed cycle model
Exergy input/net steam exergy increase21.56/8.76 MWIndependent REFPROP estimate; η_ex ≈ 40.6%

Appendix B. Sources of the Published Experimental and Predicted Results

Table A5. Experimental and predicted values reproduced from the first five columns of Table 2 in Li et al. [9]. Predictions are those published by Li et al.; absolute relative deviations are recalculated from the rounded values shown.
CaseQ Experiment (MW)Q Published Prediction (MW)|ΔQ| (%)COP ExperimentCOP Published Prediction|ΔCOP| (%)
136.2037.694.123.323.464.22
225.6125.410.783.693.813.25
330.6031.904.253.363.462.98
431.1032.604.822.832.964.59
518.5919.082.644.554.672.64
Table A6. Correspondence with the primary experimental study [26]. The OP entries give evaporation pressure, whereas CP1 gives compressor suction pressure. Reported supply temperatures refer to heat delivery; the CP1 discharge temperature refers to the compressor outlet.
CasePrimary LocationLow-Side p (MPa)Suction T (°C)High-Side p (MPa)Reported Temperature (°C)Qualification
1Table 1, OP13.7123.312.50Supply 77.0Q 36.200 MW; COP 3.32
2Table 1, OP23.173.29.91Supply 52.9Q 25.608 MW; rounded to 25.61 in [9]
3Table 1, OP34.5918.314.31Supply 98.6Q 30.600 MW; COP 3.36
4Table 1, OP44.0933.114.21Supply 108.3Q 31.100 MW; COP 2.83
5Table 2, CP13.9357.598.738Discharge 73.09COP 4.55; Q 18.59 MW from [9], not listed in Table 2 of [26]
The experimental COP values in Table A5 use motor active power as reported in Ref. [26], whereas the present cycle COP uses compressor power minus expander power. The published comparison, therefore, describes the agreement between the experimental results and the predictions in Ref. [9] under their original conditions; it does not independently validate the present integrated system at 300 °C.

Appendix C. Aspen Implementation and Numerical Settings

Table A7. Aspen block definitions, prescribed variables and numerical settings.
Process or SettingAspen ImplementationPrescribed Variables or Numerical Setting
Thermophysical propertiesREFPROP property methodCO2 and water properties; independent REFPROP 9.1 checks remain separate from the Aspen calculations.
CompressorB1/COMPRDischarge pressure 26.0 MPa; isentropic efficiency 0.785; mechanical efficiency 0.98.
ExpanderB4/COMPR, TURBINEISENTROPIC; outlet pressure 8.60 MPa; SEFF = 0.80; MEFF = 0.98.
Gas cooler ACONDENSE and B10/HEATER; heat stream S16CONDENSE duty −3.60 MW; the released heat is supplied to the separated steam in B10.
Gas cooler BB5 and B7/HEATER; heat stream S10B5 CO2 outlet temperature 130 °C; the released heat is supplied to the pressurized water in B7.
RecuperatorB3 and B9/HEATER; heat stream S13B3 high-pressure outlet temperature 92.52 °C at baseline; the released heat is supplied to the low-pressure CO2 in B9.
EvaporatorB2/HEATERSpecified heat input 11.63,687 MW, reported as 11.64 MW.
Heat-exchanger pressure lossesHEATER blocksPRES = −0.2 bar in each listed HEATER block, corresponding to a pressure decrease of 0.02 MPa.
CO2 throttling valveB6/VALVEOutlet pressure 3.525 MPa; adiabatic pressure reduction.
Water throttling and separationB8/FLASH2Specified pressure 0.42 MPa and zero heat duty.
Recycle pumpB11/PUMPOutlet pressure 7.00 MPa; EFF = 0.80; DEFF = 0.95.
Make-up water and mixingS1 and B12/MIXERS1: 20 °C, 7.00 MPa and 10.79 kg s−1; B12: 7.00 MPa, liquid phase and TOL = 0.001.
Water-heater inletMixed-water stream S21Closed water circuit with saturated-liquid recycling and make-up water; mixed-water inlet: 110 °C, 7.00 MPa and 37.00 kg s−1 at baseline.
Block convergenceCompressor, expander and heat-exchanger calculationsMaximum 30 iterations; relative tolerance 0.0001. For B1 and B4 the input keywords are SB-MAXIT and SB-TOL.
Parametric inputsFour independent case seriesVaried and fixed quantities are listed in Table 6; this is a thermodynamic parameter study, not a fixed-area equipment calculation.

References

  1. International Energy Agency. Renewable Energy for Industry; IEA: Paris, France, 2017; Available online: https://www.iea.org/reports/renewable-energy-for-industry (accessed on 17 September 2026).
  2. Jiang, J.; Hu, B.; Wang, R.Z.; Deng, N.; Cao, F.; Wang, C.C. A review and perspective on industry high-temperature heat pumps. Renew. Sustain. Energy Rev. 2022, 161, 112106. [Google Scholar] [CrossRef] [Scilit]
  3. Klute, S.; Budt, M.; van Beek, M.; Doetsch, C. Steam generating heat pumps—Overview, classification, economics, and basic modeling principles. Energy Convers. Manag. 2024, 299, 117882. [Google Scholar] [CrossRef] [Scilit]
  4. Yoo, J.; Estrada-Perez, C.E.; Choi, B.H. Investigation of heat pump technologies for high-temperature applications above 250 °C. Appl. Energy 2025, 384, 125384. [Google Scholar] [CrossRef] [Scilit]
  5. Kang, D.H.; Na, S.I.; Yoo, J.W.; Lee, J.H.; Kim, M.S. Experimental study on the performance of a steam generation heat pump with the internal heat exchanging effect. Int. J. Refrig. 2019, 108, 154–162. [Google Scholar] [CrossRef] [Scilit]
  6. Ma, X.; Du, Y.; Lei, B.; Wu, Y. Energy, exergy, economic, and environmental analysis of a high-temperature heat pump steam system. Int. J. Refrig. 2024, 160, 423–436. [Google Scholar] [CrossRef] [Scilit]
  7. Yan, H.; Hu, B.; Wang, R. Air-source heat pump heating based water vapor compression for localized steam sterilization applications during the COVID-19 pandemic. Renew. Sustain. Energy Rev. 2021, 145, 111026. [Google Scholar] [CrossRef] [Scilit]
  8. Yin, H.; Ying, S.; Liu, G.; Yang, Q.; Zhao, Y.; Li, L. Energy, exergy, economic, and environmental analysis of waste heat source heat pump industrial steam generation system. Energy Convers. Manag. 2025, 330, 119662. [Google Scholar] [CrossRef] [Scilit]
  9. Li, S.; Song, Y.; Chang, T.; Yu, Q.; Zhang, Y.; Cao, F. Revolutionizing 300 °C industrial steam with a novel transcritical carbon dioxide heat pump system: Thermodynamic and configuration analyses. Energy Convers. Manag. 2025, 346, 120556. [Google Scholar] [CrossRef] [Scilit]
  10. Chen, J.; Guo, C.; Feng, C.; Qu, X.; Tan, S.; Jiang, Y. Research of CO2 high temperature heat pump for industrial steam generation with data center heat source. Int. J. Refrig. 2025, 173, 185–200. [Google Scholar] [CrossRef] [Scilit]
  11. Zhao, A.; Pecnik, R.; Peeters, J.W.R. Thermodynamic analysis and heat exchanger calculations of transcritical high-temperature heat pumps. Energy Convers. Manag. 2024, 303, 118172. [Google Scholar] [CrossRef] [Scilit]
  12. Mateu-Royo, C.; Arpagaus, C.; Mota-Babiloni, A.; Navarro-Esbrí, J.; Bertsch, S.S. Advanced high temperature heat pump configurations using low GWP refrigerants for industrial waste heat recovery: A comprehensive study. Energy Convers. Manag. 2021, 229, 113752. [Google Scholar] [CrossRef] [Scilit]
  13. Zou, Y.; Liu, F.; He, J.; Mao, S.; Jiao, Q.; Zhao, X.; Yin, Y. Comprehensive evaluation and optimization of IHX in a modified double-evaporator transcritical CO2 heat pump with ejector. Energy 2025, 335, 137815. [Google Scholar] [CrossRef] [Scilit]
  14. Dai, B.; Qi, H.; Liu, S.; Ma, M.; Zhong, Z.; Li, H.; Song, M.; Sun, Z. Evaluation of transcritical CO2 heat pump system integrated with mechanical subcooling by utilizing energy, exergy and economic methodologies for residential heating. Energy Convers. Manag. 2019, 192, 202–220. [Google Scholar] [CrossRef] [Scilit]
  15. Ma, X.; Du, Y.; Li, B.; Zhang, C.; Wu, Y. Enhancing the performance of autocascade steam generating heat pumps through advanced exergy methods. Energy Convers. Manag. 2025, 332, 119705. [Google Scholar] [CrossRef] [Scilit]
  16. Hu, B.; Xu, L.; Xiang, B.; Shi, L.; Jiang, S.; Jia, J.; Lv, Y.; Tan, M.; Si, P. Experimental study on a direct steam generation unit of high temperature air source heat pump. Energy 2025, 330, 136886. [Google Scholar] [CrossRef] [Scilit]
  17. Guo, C.; Xu, Y.; Zhang, X.; Guo, H.; Zhou, X.; Liu, C.; Qin, W.; Li, W.; Dou, B.; Chen, H. Performance analysis of compressed air energy storage systems considering dynamic characteristics of compressed air storage. Energy 2017, 135, 876–888. [Google Scholar] [CrossRef] [Scilit]
  18. Zhou, Q.; Du, D.; Lu, C.; He, Q.; Liu, W. A review of thermal energy storage in compressed air energy storage system. Energy 2019, 188, 115993. [Google Scholar] [CrossRef] [Scilit]
  19. Chen, X.; Li, J.; Zhang, Y.; Yu, M.; Zhang, Y.; Chen, X.; Shen, J. Design of optimal waste heat recovery system for compressed air energy storage considering various system layouts and working fluid types. Case Stud. Therm. Eng. 2025, 73, 106549. [Google Scholar] [CrossRef] [Scilit]
  20. Ge, Z.; Zhai, Y.; Li, J.; Xie, J.; Xie, Z.; Yang, F. Optimal dual-pressure evaporation organic Rankine cycle for recovering waste heat from compressed air energy storage (CAES). Case Stud. Therm. Eng. 2024, 61, 105160. [Google Scholar] [CrossRef] [Scilit]
  21. Gouda, E.M.; Benaouicha, M.; Neu, T.; Fan, Y.; Luo, L. Flow and heat transfer characteristics of air compression in a liquid piston for compressed air energy storage. Energy 2022, 254, 124305. [Google Scholar] [CrossRef] [Scilit]
  22. Lemmon, E.W.; Huber, M.L.; McLinden, M.O. NIST Standard Reference Database 23: Reference Fluid Thermodynamic and Transport Properties—REFPROP, version 9.1; Gaithersburg, MD, USA. Available online: https://www.nist.gov/publications/nist-standard-reference-database-23-reference-fluid-thermodynamic-and-transportNIST, 2013; (accessed on 17 September 2026).
  23. Lemmon, E.W.; Bell, I.H.; Huber, M.L.; McLinden, M.O. NIST Standard Reference Database 23: REFPROP, Version 10.0; NIST: Gaithersburg, MD, USA, 2018. [Google Scholar]
  24. Kim, K.H.; Ko, H.J.; Kim, K. Assessment of pinch point characteristics in heat exchangers and condensers of ammonia–water based power cycles. Appl. Energy 2014, 113, 970–981. [Google Scholar] [CrossRef] [Scilit]
  25. ASHRAE. Heat Transfer. In 2025 ASHRAE Handbook—Fundamentals, SI ed.; Chapter 4; ASHRAE: Atlanta, GA, USA, 2025; Available online: https://handbook.ashrae.org/Handbooks/F25/SI/f25_ch04/f25_ch04_si.aspx (accessed on 17 September 2026).
  26. Wolscht, L.; Kleynhans, G.; Somaini, R.; Baumann, U. Full Scale Testing of a 36 MW CO2 Heat Pump in Two-Phase Flow Condition. In Proceedings of the 52nd Turbomachinery Symposium, Houston, TX, USA, 26–28 September 2023; Available online: https://www.researchgate.net/publication/375074462_Full_Scale_Testing_of_a_36MW_Heat_Pump_in_Two-Phase_Condition (accessed on 17 September 2026).
  27. Liang, T.; Vecchi, A.; Knobloch, K.; Sciacovelli, A.; Engelbrecht, K.; Li, Y.; Ding, Y. Key components for Carnot Battery: Technology review, technical barriers and selection criteria. Renew. Sustain. Energy Rev. 2022, 163, 112478. [Google Scholar] [CrossRef] [Scilit]
  28. Stanytsina, V.; Horskyi, V.; Danyliv, S.; Zaporozhets, A.; Kovtun, S.; Maevsky, O.; Garbuz, I.; Artemchuk, V. Comparative Analysis of Levelized Cost of Heat in Implemented and Calculated Heat Supply Systems with Heat Pumps in Ukraine. Energies 2025, 18, 1110. [Google Scholar] [CrossRef] [Scilit]
Figure 1. Integrated CO2 heat-pump and steam-generation system supplied by CAES cooling water. Saturated liquid from the flash separator is pumped and mixed with make-up water before entering gas cooler B.
Energies 19 04459 g001
Figure 2. Aspen charging flowsheet of the CAES system and its cooling-water circuits. Labels identify temperature, absolute pressure, mass flow and heat duty; pressure is displayed in bar.
Energies 19 04459 g002
Figure 3. Aspen baseline flowsheet showing saturated-liquid recycling and mixing with pressurized make-up water. Stream labels report temperature (°C), absolute pressure (bar), mass flow (kg s−1) and phase fraction. S21 is the mixed-water stream; S11 is the water-heater outlet at 279.29 °C and 69.80 bar; S5 is the expander outlet at 39.02 °C and 86.00 bar.
Energies 19 04459 g003
Figure 4. Baseline state-point representations from Table 3: (a) pressure–enthalpy diagram with a logarithmic pressure axis and (b) temperature–entropy diagram. Lines connect listed states rather than resolving the individual compression and heat-transfer paths. Dashed curves denote the REFPROP CO2 saturation boundaries.
Energies 19 04459 g004
Figure 5. Baseline counterflow profiles for (a) gas cooler A, (b) gas cooler B and (c) the recuperator, with (d) the corresponding sampled temperature differences. The heat coordinate starts at the hot inlet/cold outlet. Markers represent the 22 nodes displayed in each Aspen profile. Interior temperatures are read from the graphical output and reported approximately; endpoint values follow Figure 3.
Energies 19 04459 g005
Figure 6. Effects of (ac) compressor suction temperature at a 26.0 MPa discharge pressure and (df) discharge pressure at a 97.5 °C suction temperature. The CO2 flow is 105 kg s−1, with an evaporator duty of 11.64 MW and a steam-superheater duty of 3.60 MW. The heat duties, powers and temperatures are Aspen outputs, and COP excludes pumping. The open square identifies the 94.5 °C suction case, whose evaporator terminal temperature difference is 4.07 K. Lines connect the calculated cases without smoothing.
Energies 19 04459 g006
Figure 7. Effects of the water-side parameters: panels (ac) vary the make-up water temperature at a total flow of 37 kg s−1, while panels (df) vary the total flow at a make-up water temperature of 20 °C. Steam is delivered at 0.40 MPa, and the flash fraction is the separated steam flow divided by the total water flow entering the throttling valve. All five cases in each series are shown, with the water pressures specified in Table 6.
Energies 19 04459 g007
Figure 8. Estimated baseline component exergy-destruction distribution evaluated from the nominal states using REFPROP. Sector areas represent the normalized shares, and the legend displays MW and percentages. Water throttling and flash separation share one control volume; mixing and recycle pumping are treated separately.
Energies 19 04459 g008
Table 2. CAES boundary, model assumptions and principal baseline inputs.
CategoryParameter or AssumptionBaseline Value
CAES boundaryRated plant power/charge/discharge duration100 MW/6 h/4 h
CAES air pathCharging-air inlet15 °C/0.10 MPa/157.9 kg s−1
CAES air pathStorage-side air stateabout 40 °C/7.44 MPa/157.0 kg s−1
CAES compressorsStage powers/total power38.01/33.43/22.88 MW; total 94.32 MW
CAES coolersHigh-temperature duties29.13/30.17/20.00 MW
CAES coolersLow-temperature duties3.29/4.53/3.82 MW
Source-water loopEvaporator inlet/outlet temperature50/25 °C
Source-water loopEvaporator duty/calculated water flow11.64 MW/approximately 111.4 kg s−1
Heat-source allocationLow-temperature share of total CAES cooling duty12.8%
CO2 and water modelsProperty methodAspen Plus V14/NIST REFPROP; independent state-property evaluation with REFPROP 9.1 [22]
CompressorIsentropic/mechanical efficiency0.785/0.98
ExpanderIsentropic/mechanical efficiency0.80/0.98
Heat exchangersPressure drop per unit/reference minimum temperature differencePressure losses follow listed states; gas cooler B water side: 0.02 MPa at baseline; 5 K reference
EnvironmentReference state for exergy25 °C/0.1013 MPa
Table 3. Baseline CO2 states corresponding to Figure 3. Enthalpy and entropy are independently evaluated using REFPROP 9.1 [22]. State 6 (Aspen S5) is single-phase supercritical CO2. State 7 (S6) follows isenthalpic throttling; its calculated vapor mass fraction of approximately 0.693 agrees with the displayed 0.69.
StateLocation/Aspen IDT (°C)p (MPa)ṁ (kg s−1)h (kJ kg−1)s (kJ kg−1 K−1)Phase
1Compressor inlet/S1297.503.485105.0548.992.2195Superheated gas
2Compressor outlet/S2339.7726.000105.0767.532.3148Supercritical
3Gas cooler A outlet/S3312.8725.980105.0733.242.2577Supercritical
4Gas cooler B outlet/S8130.0025.960105.0463.181.6984Supercritical
5Recuperator hot outlet/S492.5225.940105.0385.161.4951Supercritical
6Expander outlet/S539.028.600105.0360.091.5150Supercritical
7Valve outlet/S60.433.525105.0360.091.5850Two phase, x ≈ 0.693
8Evaporator outlet/S727.673.505105.0470.961.9846Superheated gas
Table 4. Baseline water/steam states corresponding to Figure 3. Pressures are absolute. W2 is subcooled liquid before throttling; W3 and W5 are the separated saturated steam and liquid, respectively.
StateLocation/Aspen IDT (°C)p (MPa)ṁ (kg s−1)Displayed Phase Fraction
MHigh-pressure make-up water/S120.007.00010.790.00
W1Mixed water/S21110.007.00037.000.00
W2Heater outlet/S11279.296.98037.000.00
W3Separated steam/S18145.380.42010.791.00
W4Product steam/S15303.330.40010.791.00
W5Separated liquid/S17145.380.42026.210.00
W6Recycle-pump outlet/S14146.497.00026.210.00
Table 5. Component-level exergy accounting used in the analysis.
Control VolumeExergy Balance/Definition
CompressorInput work minus CO2 exergy increase
ExpanderCO2 exergy decrease minus recovered work
Recycle pumpPump input minus recycled-water exergy increase
Gas coolers/recuperatorTotal inlet exergy minus total outlet exergy, with both streams enclosed
EvaporatorSource-water exergy decrease minus CO2 exergy increase
CO2 valveCO2 inlet exergy minus outlet exergy across the isenthalpic valve
Water throttling valve and flash separatorW2 inlet exergy minus the sum of W3 and W5 outlet exergies
Make-up water and recycle mixerSum of make-up water and recycle exergies minus mixed-stream exergy
Disclaimer/Publisher’s Note: The statements, opinions and data contained in all publications are solely those of the individual author(s) and contributor(s) and not of MDPI and/or the editor(s). MDPI and/or the editor(s) disclaim responsibility for any injury to people or property resulting from any ideas, methods, instructions or products referred to in the content.