3.1. Analysis of Pore-Throat Mobilization Characteristics in Different Types of Reservoirs
CO
2 dissolution in crude oil can cause oil swelling and alter the T
2 relaxation behavior, which may affect the NMR signal distribution. Although all experiments were conducted under constant temperature and backpressure to keep the CO
2 solubility consistent, a dedicated calibration of crude oil before and after CO
2 saturation was not performed; this limitation should be recognized. Therefore, the cumulative T
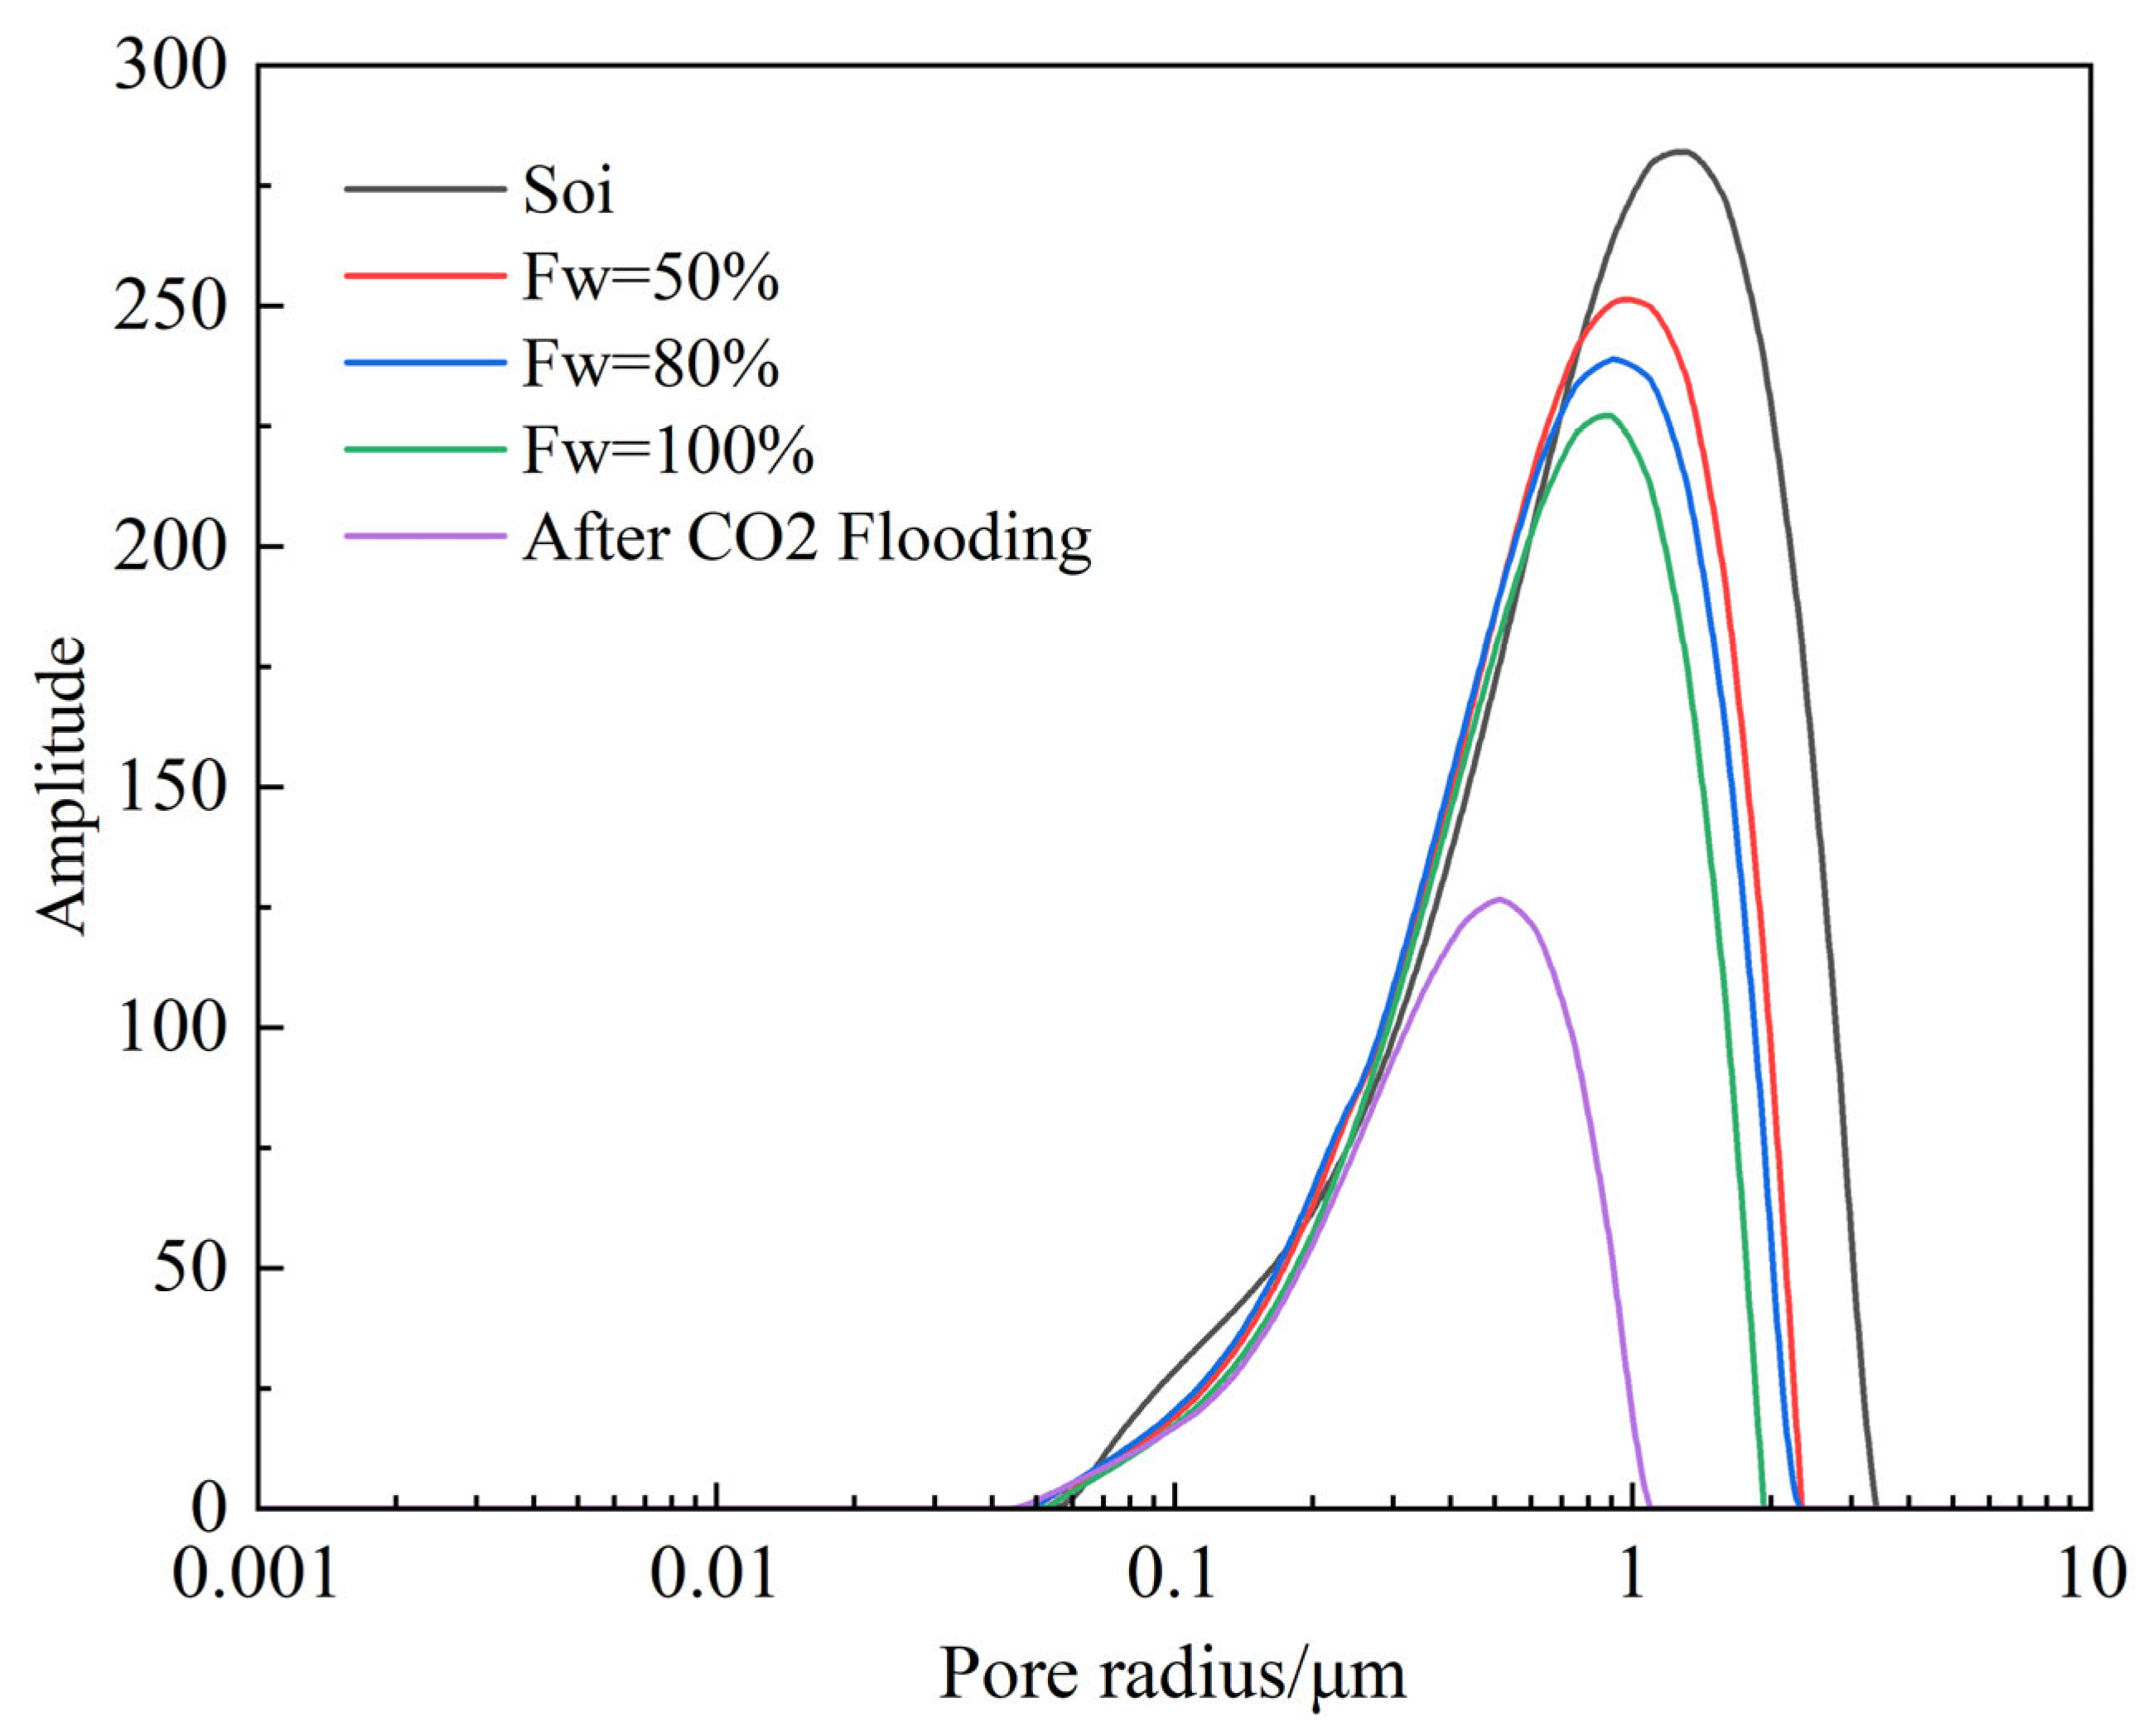
2 signal amplitude was used only as a relative indicator of the oil content/saturation, and the NMR signal should not be interpreted as directly reflecting oil saturation or as resolving the water film thickness, fluid interface morphology, or local fluid composition, as shown in
Figure 2. The curves represent different displacement stages: initial oil saturation, F
w = 50%, F
w = 80%, F
w = 100%, and after CO
2 flooding. It should be noted that the NMR observations presented in this section reflect the oil–water distribution at the end of each waterflooding stage (F
w = 50%, 80%, and 100%) rather than the post-CO
2 injection state for the 50% and 80% switching schemes.
With the increase in the degree of waterflooding, as the produced fluid water cut rises from 50% to 100%, the NMR signal curves representing the oil saturation within pore throats exhibit regular evolution: the peaks continuously shift to the right, and the overall amplitude decreases significantly. The medium-to-large pore throats (1 μm–10 μm) in the core are progressively swept, and crude oil is displaced. By the end of waterflooding (Fw = 100%), the signal in the large pore-throat interval approaches the background value. After CO2 flooding, the signal intensity of the curve across the entire pore-throat distribution range (0.001 μm–10 μm) drops to the global minimum. Especially in the micropore throat range of 0.01 μm–0.1 μm, the signal becomes completely flat and significantly lower than that at any waterflooding stage, demonstrating that CO2 flooding achieves a more thorough mobilization of the entire pore system. CO2 possesses the characteristics of low viscosity and low interfacial tension and can achieve miscibility with crude oil, significantly reducing capillary resistance. In addition, the strong diffusion and dissolution capacity of CO2 in crude oil enables it to enter micropore throats blocked by the water phase through mass transfer, thereby effectively displacing the crude oil therein and realizing more uniform microscopic displacement.
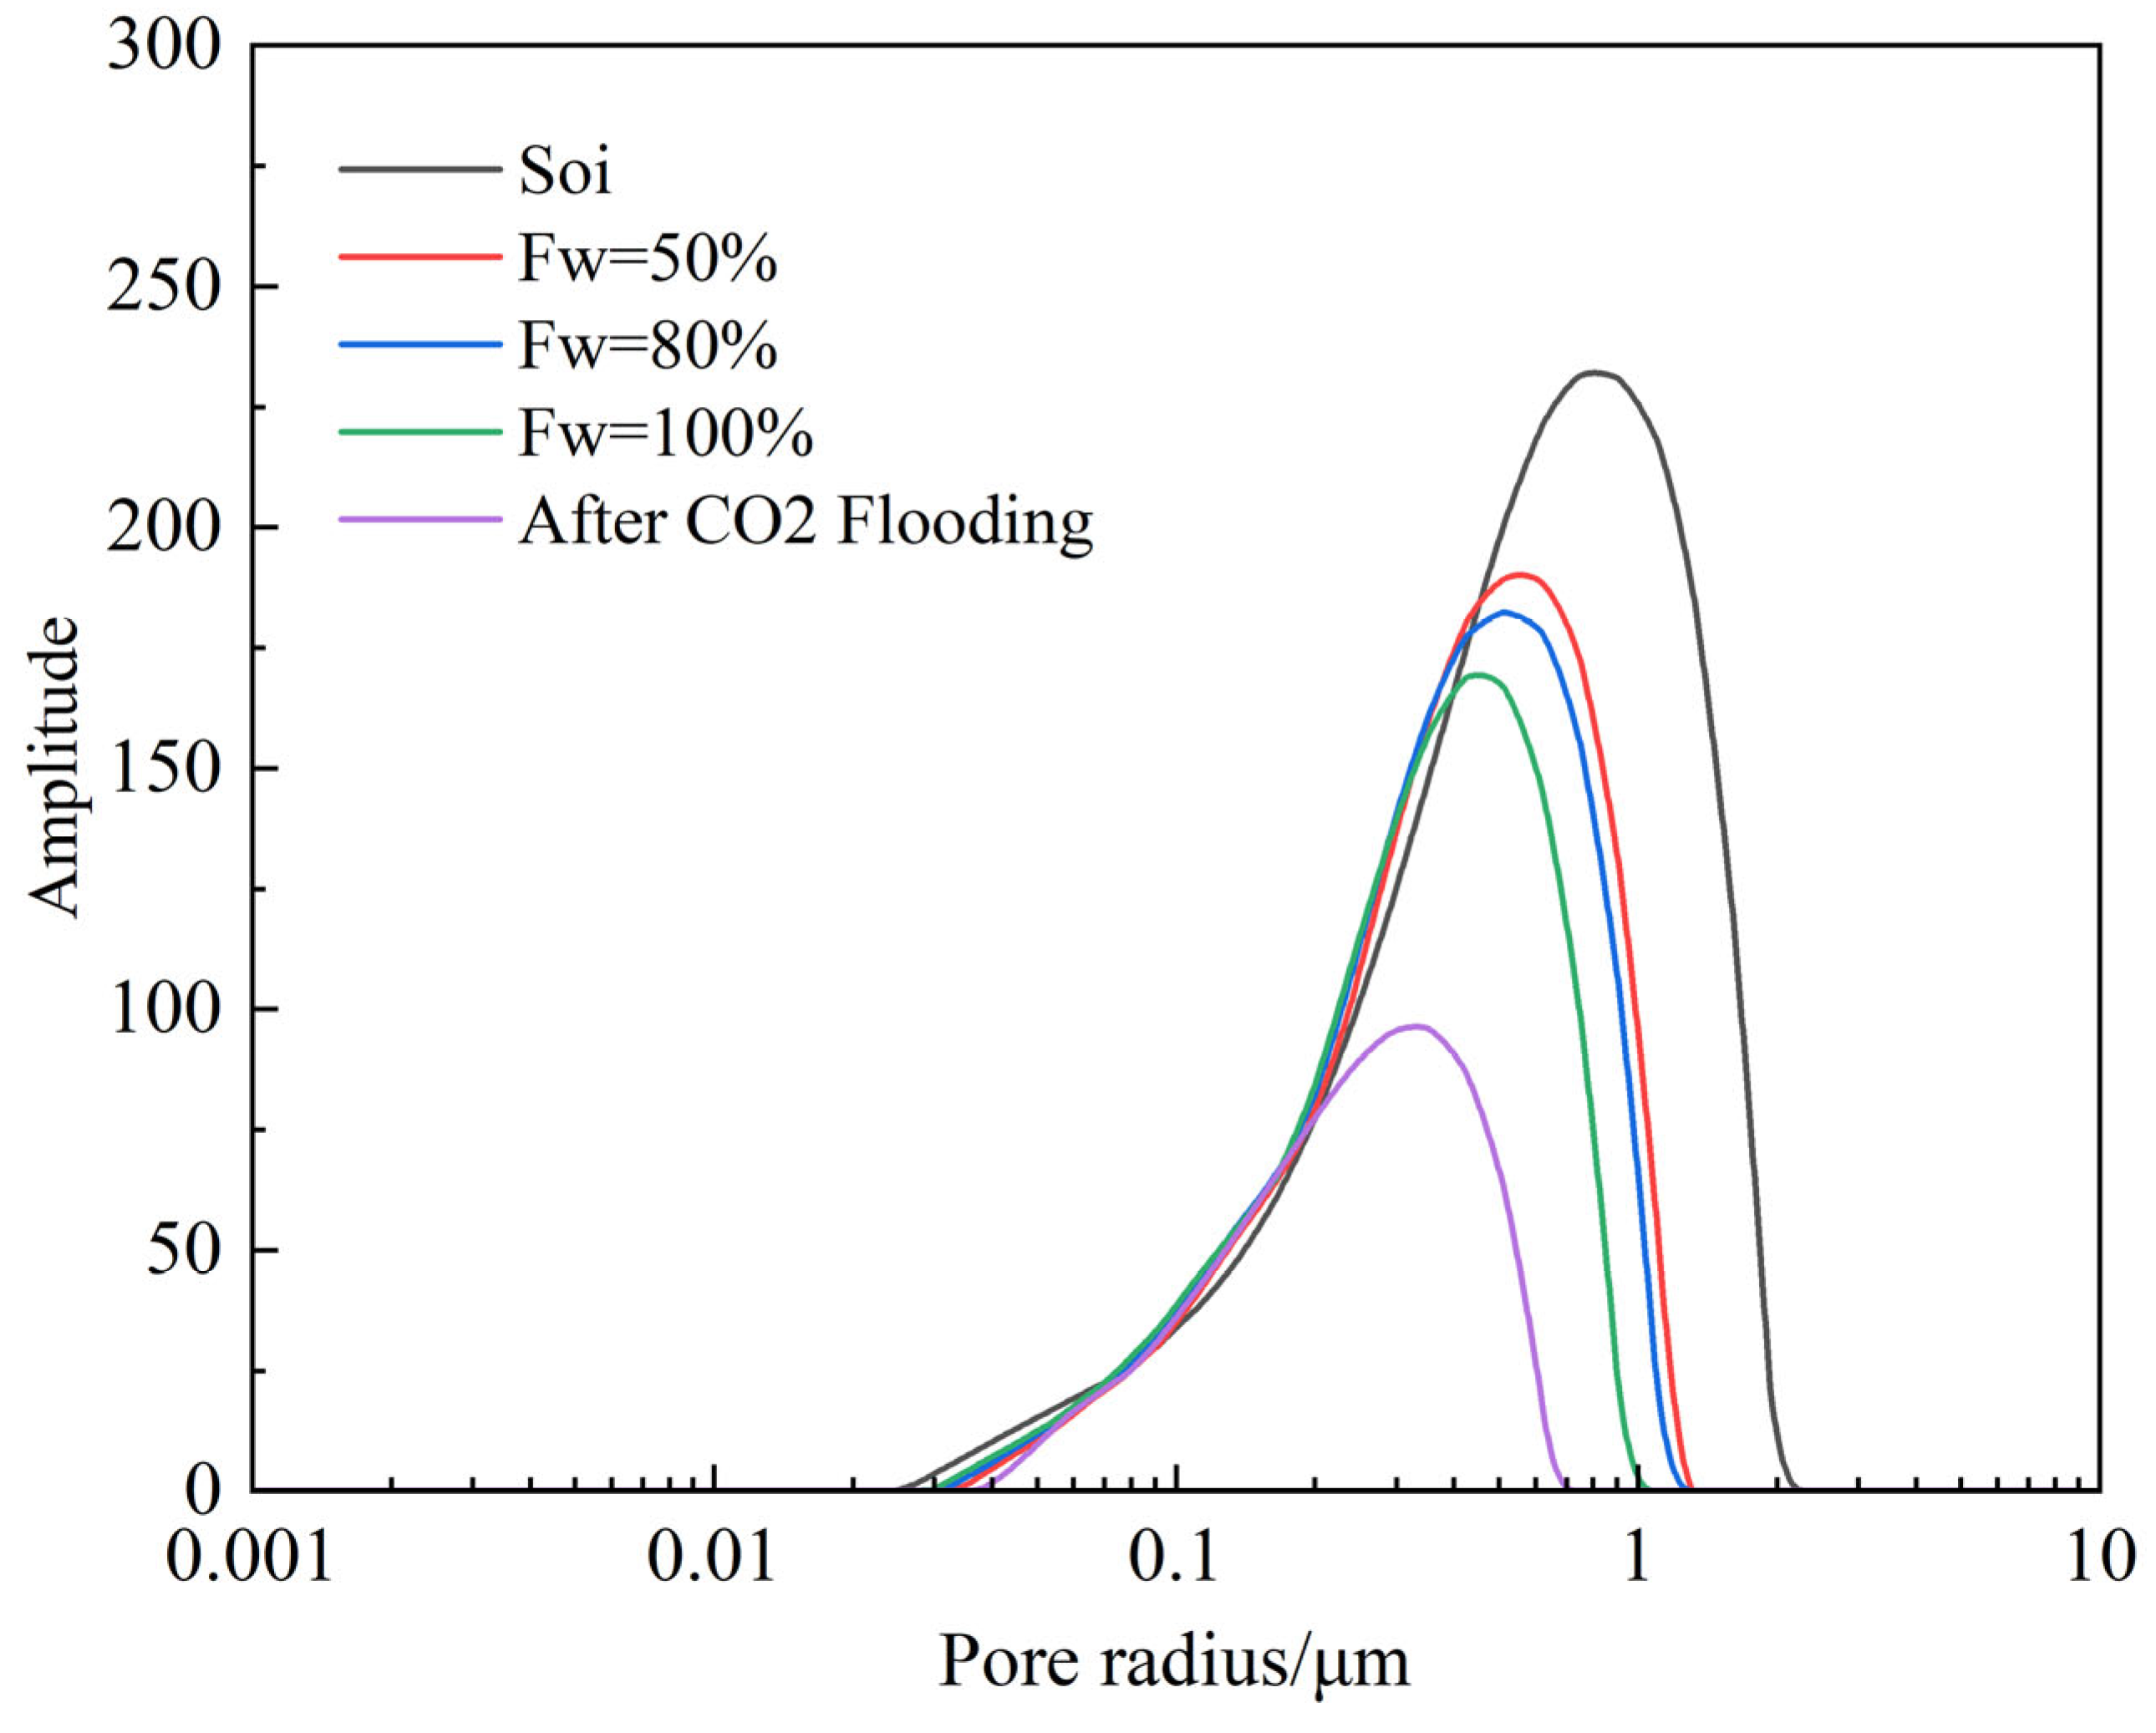
Figure 3 shows the NMR scanning results of Class III reservoir cores at different displacement stages. With the progress of waterflooding (F
w increasing from 50% to 100%), the signal peaks of the curves gradually shift to the right and shrink toward the lower-amplitude region, indicating that the crude oil in the medium-to-large pore throats (0.1 μm–10 μm) is progressively displaced. By the end of waterflooding (F
w = 100%), the signal of the curve in the larger pore-throat interval has significantly decreased. After CO
2 flooding, the overall signal amplitude of the curve drops to the lowest across the entire pore-throat range, especially in the micropore throat range of 0.01 μm–0.1 μm, where the signal is lower than that of the waterflooding curve at any stage, demonstrating that CO
2 flooding achieves a more thorough mobilization of the core pore space.
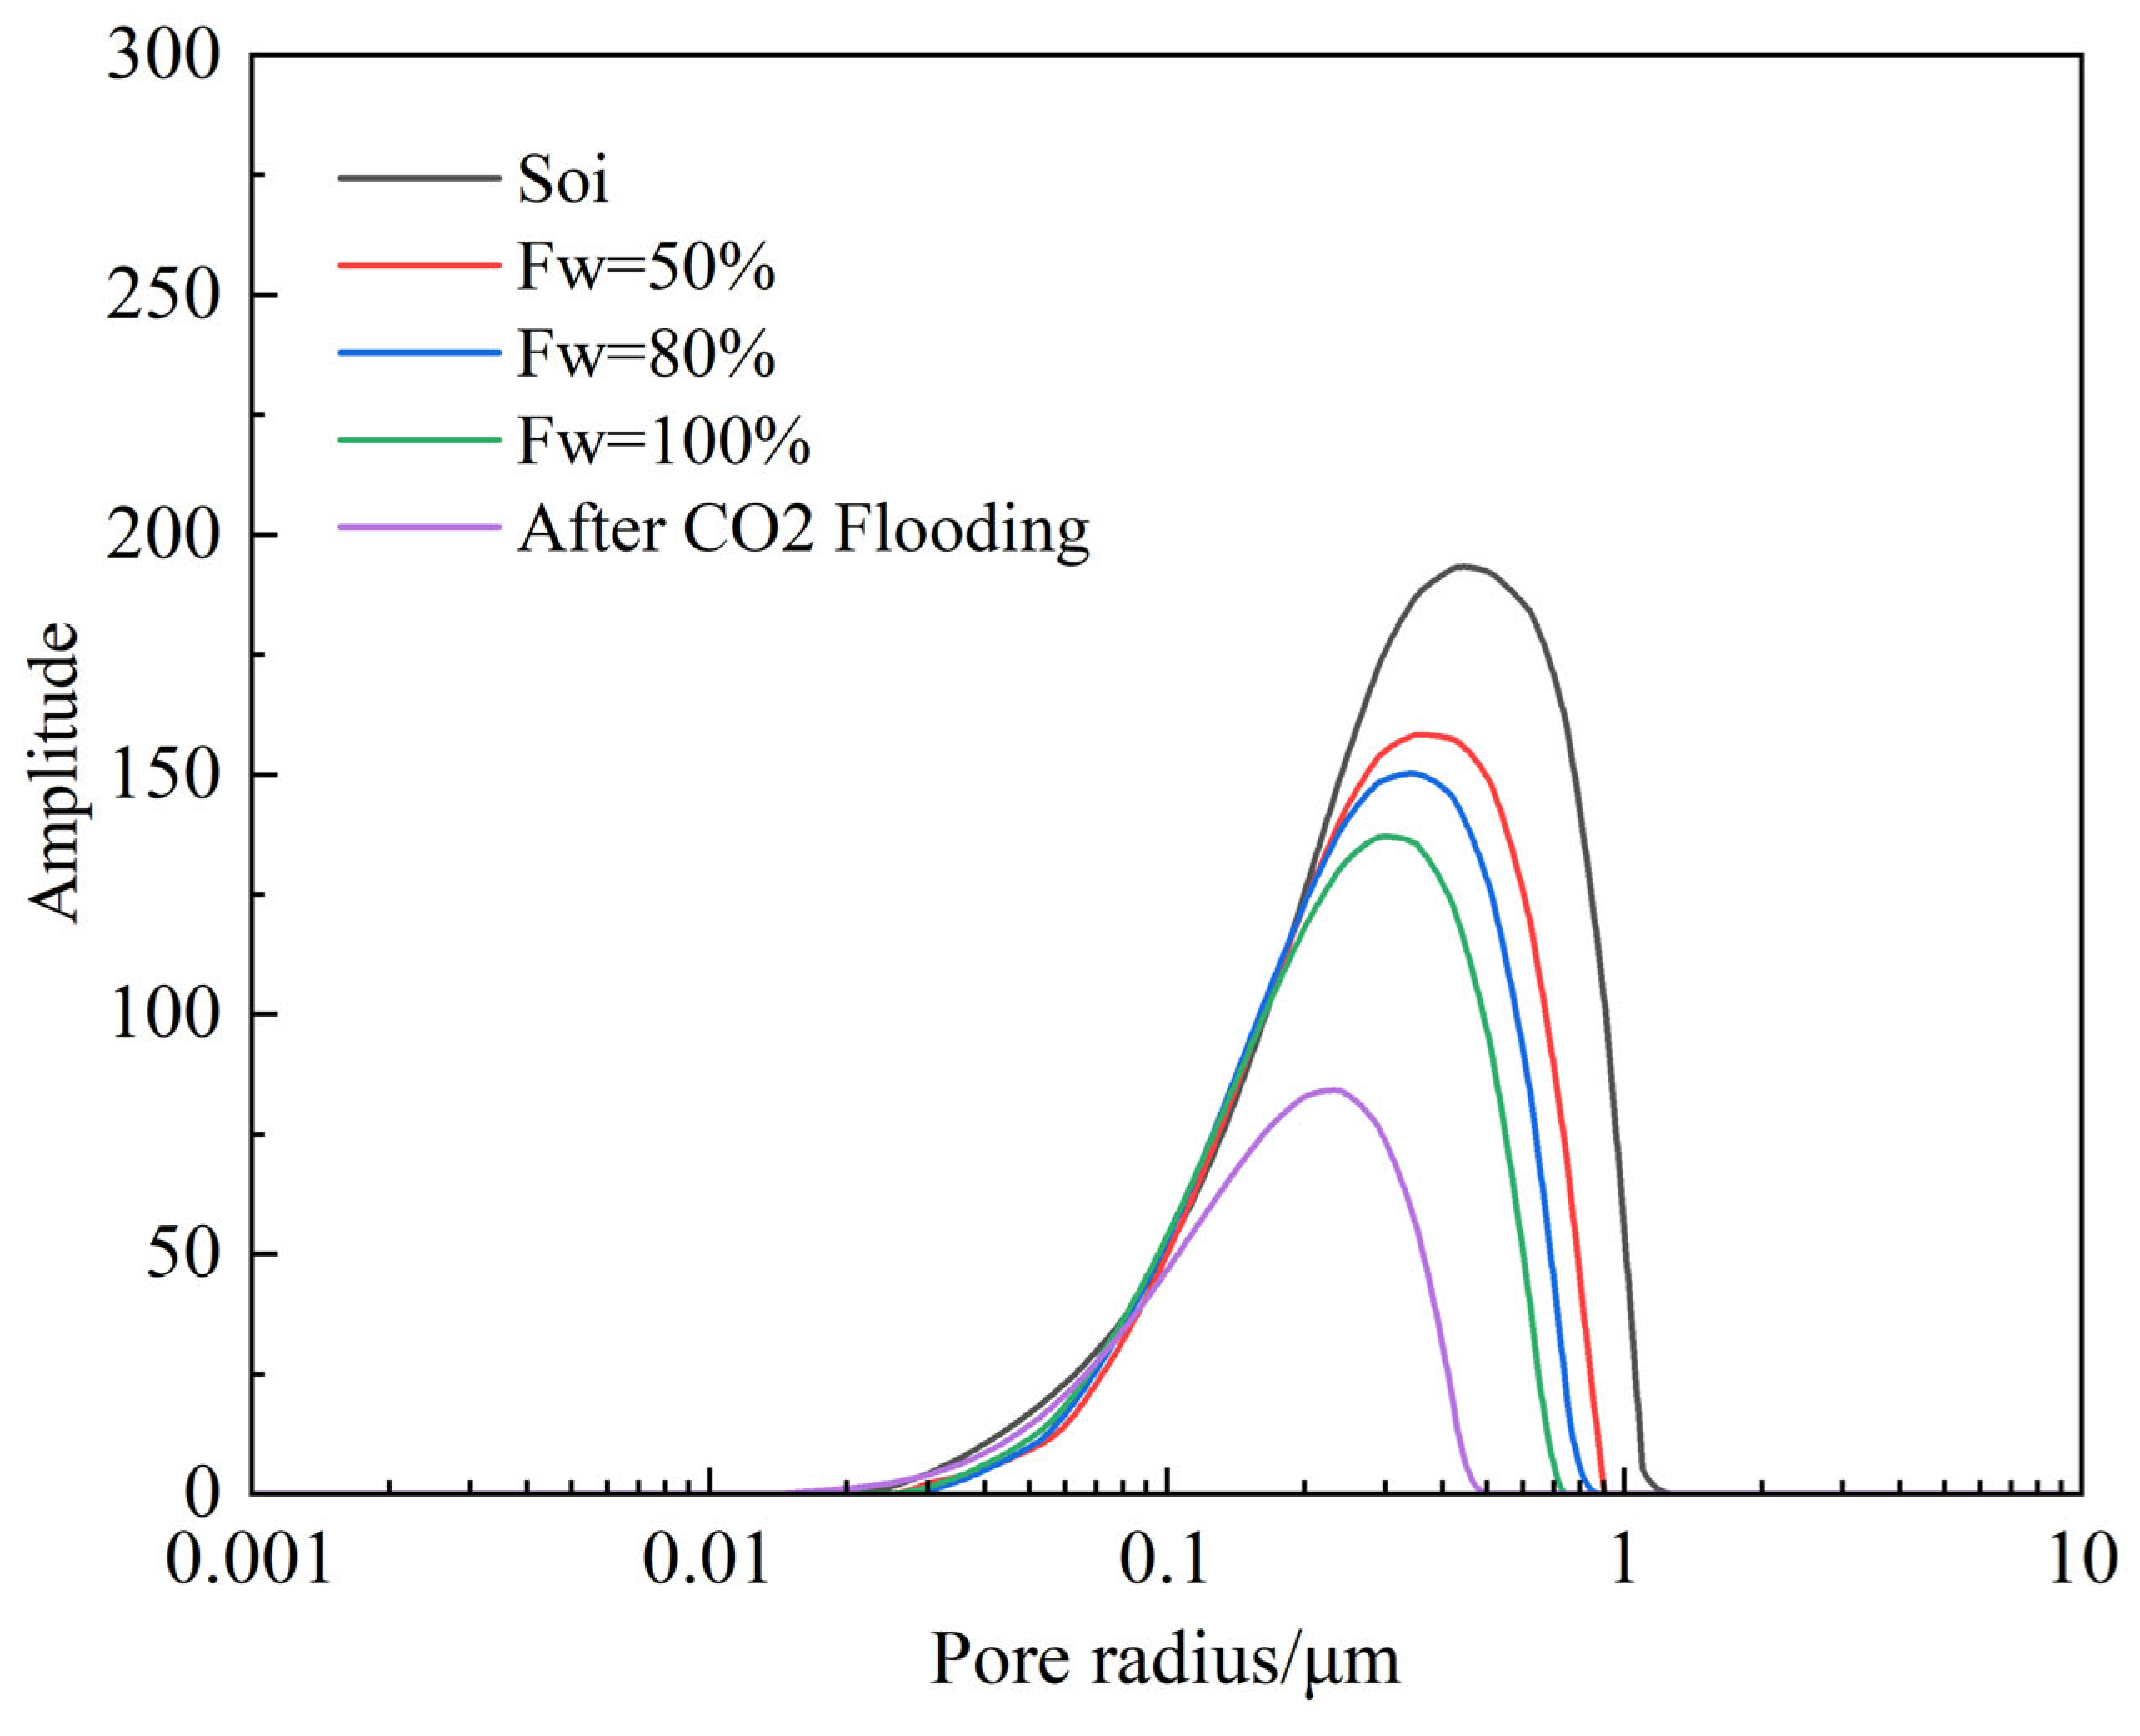
Figure 4 shows the NMR scanning results of Class IV reservoir cores. During the waterflooding stage, as the produced-fluid water cut (Fw) increases from 50% to 100%, the curves representing different displacement stages exhibit an overall systematic rightward shift, and the signal amplitude in the medium-to-large pore-throat interval (0.1–10 μm) decreases significantly. By F
w = 100%, the signal in the large pore-throat region has dropped to an extremely low level, indicating that the mobilization of medium-to-large pore throats by waterflooding is relatively thorough. Compared with waterflooding, the curve after CO
2 flooding shifts further to the right overall, and the signal amplitude across the entire pore-throat range (especially in the 0.01–1 μm interval) drops to even lower levels. This indicates that CO
2 flooding can not only continue to drive the remaining oil left in large pore throats after waterflooding but, more importantly, also exhibits extremely a strong mobilization capacity in micropore-throat regions. Waterflooding relies primarily on pressure differential drive and is greatly influenced by fluid viscosity and interfacial tension. Class IV reservoirs have poor physical properties, with extremely high capillary resistance in micropore throats, making it difficult for the water phase to overcome this resistance to enter. Consequently, preferential channels are prone to form along medium-to-large pore throats with lower flow resistance, leading to uneven microscopic sweep efficiency and a large amount of remaining oil trapped in small pores.
To evaluate the NMR-derived oil saturation trends, the cumulative oil production observed at the outlet was compared with the oil saturation decreases inferred from the NMR signal during the short-core experiments. The two sets of data show consistent trends, especially during the CO2 flooding stage, indicating that the reduction in the NMR signal is qualitatively consistent with oil production instead of solely reflecting oil redistribution or relaxation behavior changes caused by CO2 dissolution. Since the MnCl2 solution was used to shield the water signal, the NMR signal predominantly represents the oil phase. However, because the produced oil volume from the short cores was too small for precise volumetric metering at the outlet, this comparison serves as a qualitative consistency check rather than as a quantitative mass-balance validation.
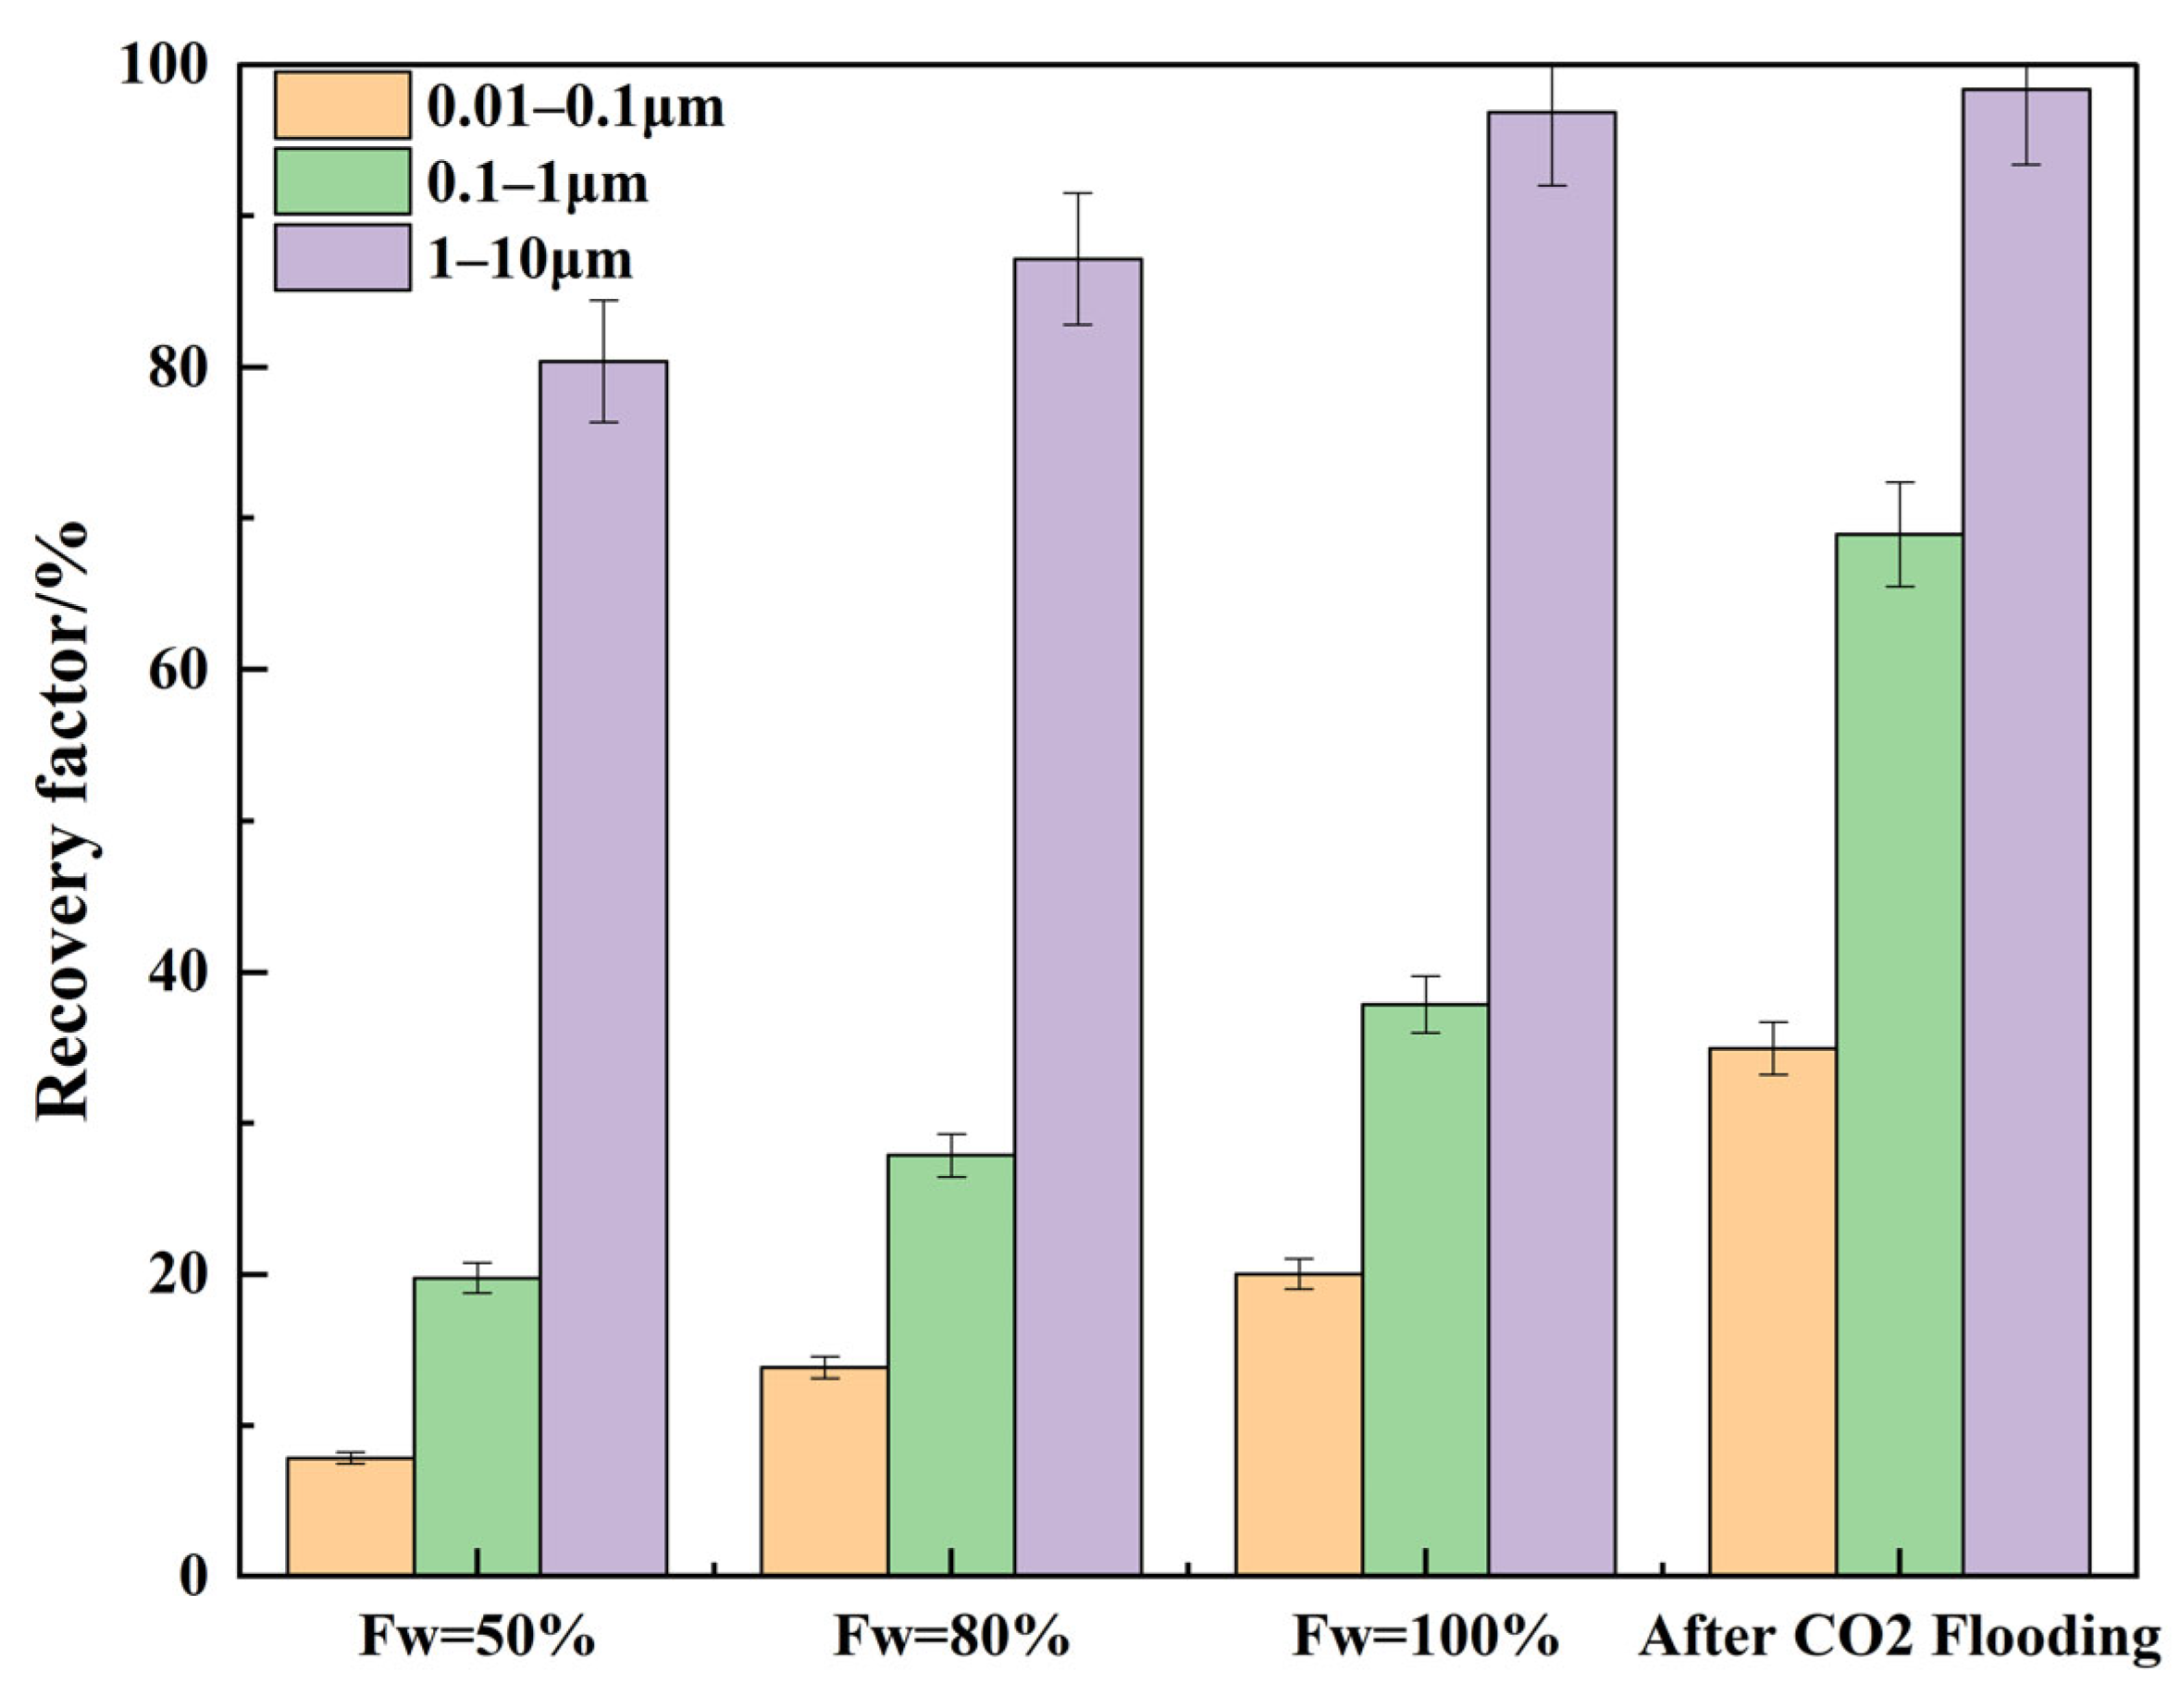
Figure 5 shows the comparison of the pore-throat mobilization across different scales. From the perspective of microscopic pore-throat mobilization characteristics, during the waterflooding process, the recovery efficiency of large pores increases from 80% at F
w = 50% to approximately 96.84% at F
w = 100%. The recovery efficiency of medium pores increases from 19% to approximately 38%. The recovery efficiency of small pores remains at the lowest level throughout, slowly increasing from 8% to about 20%. Even at the end of waterflooding, about 80% of the initial crude oil in small pores remains unproduced, constituting the primary storage space for the waterflooding remaining oil. The waterflooding process exhibits a clear mobilization sequence of large pores → medium pores → small pores, with the mobilization degree decreasing sharply step by step. This intuitively reflects the law that flow resistance increases exponentially as the pore-throat radius decreases. After CO
2 flooding, the oil recovery efficiencies across all three T
2-derived pore-size classes achieve dramatic enhancements, and the mobilization uniformity is significantly improved. The recovery efficiency of small pores rises to 35%. The recovery efficiency of medium pores increases from about 38% to nearly 69%, showing the largest magnitude of increase. The recovery efficiency of large pores is also further optimized from approximately 96.84% to approximately 98.35%. By substantially enhancing the oil recovery efficiency of medium-to-small pore throats—especially small pores—CO
2 flooding precisely and efficiently mobilizes the remaining oil enrichment zones left by waterflooding.
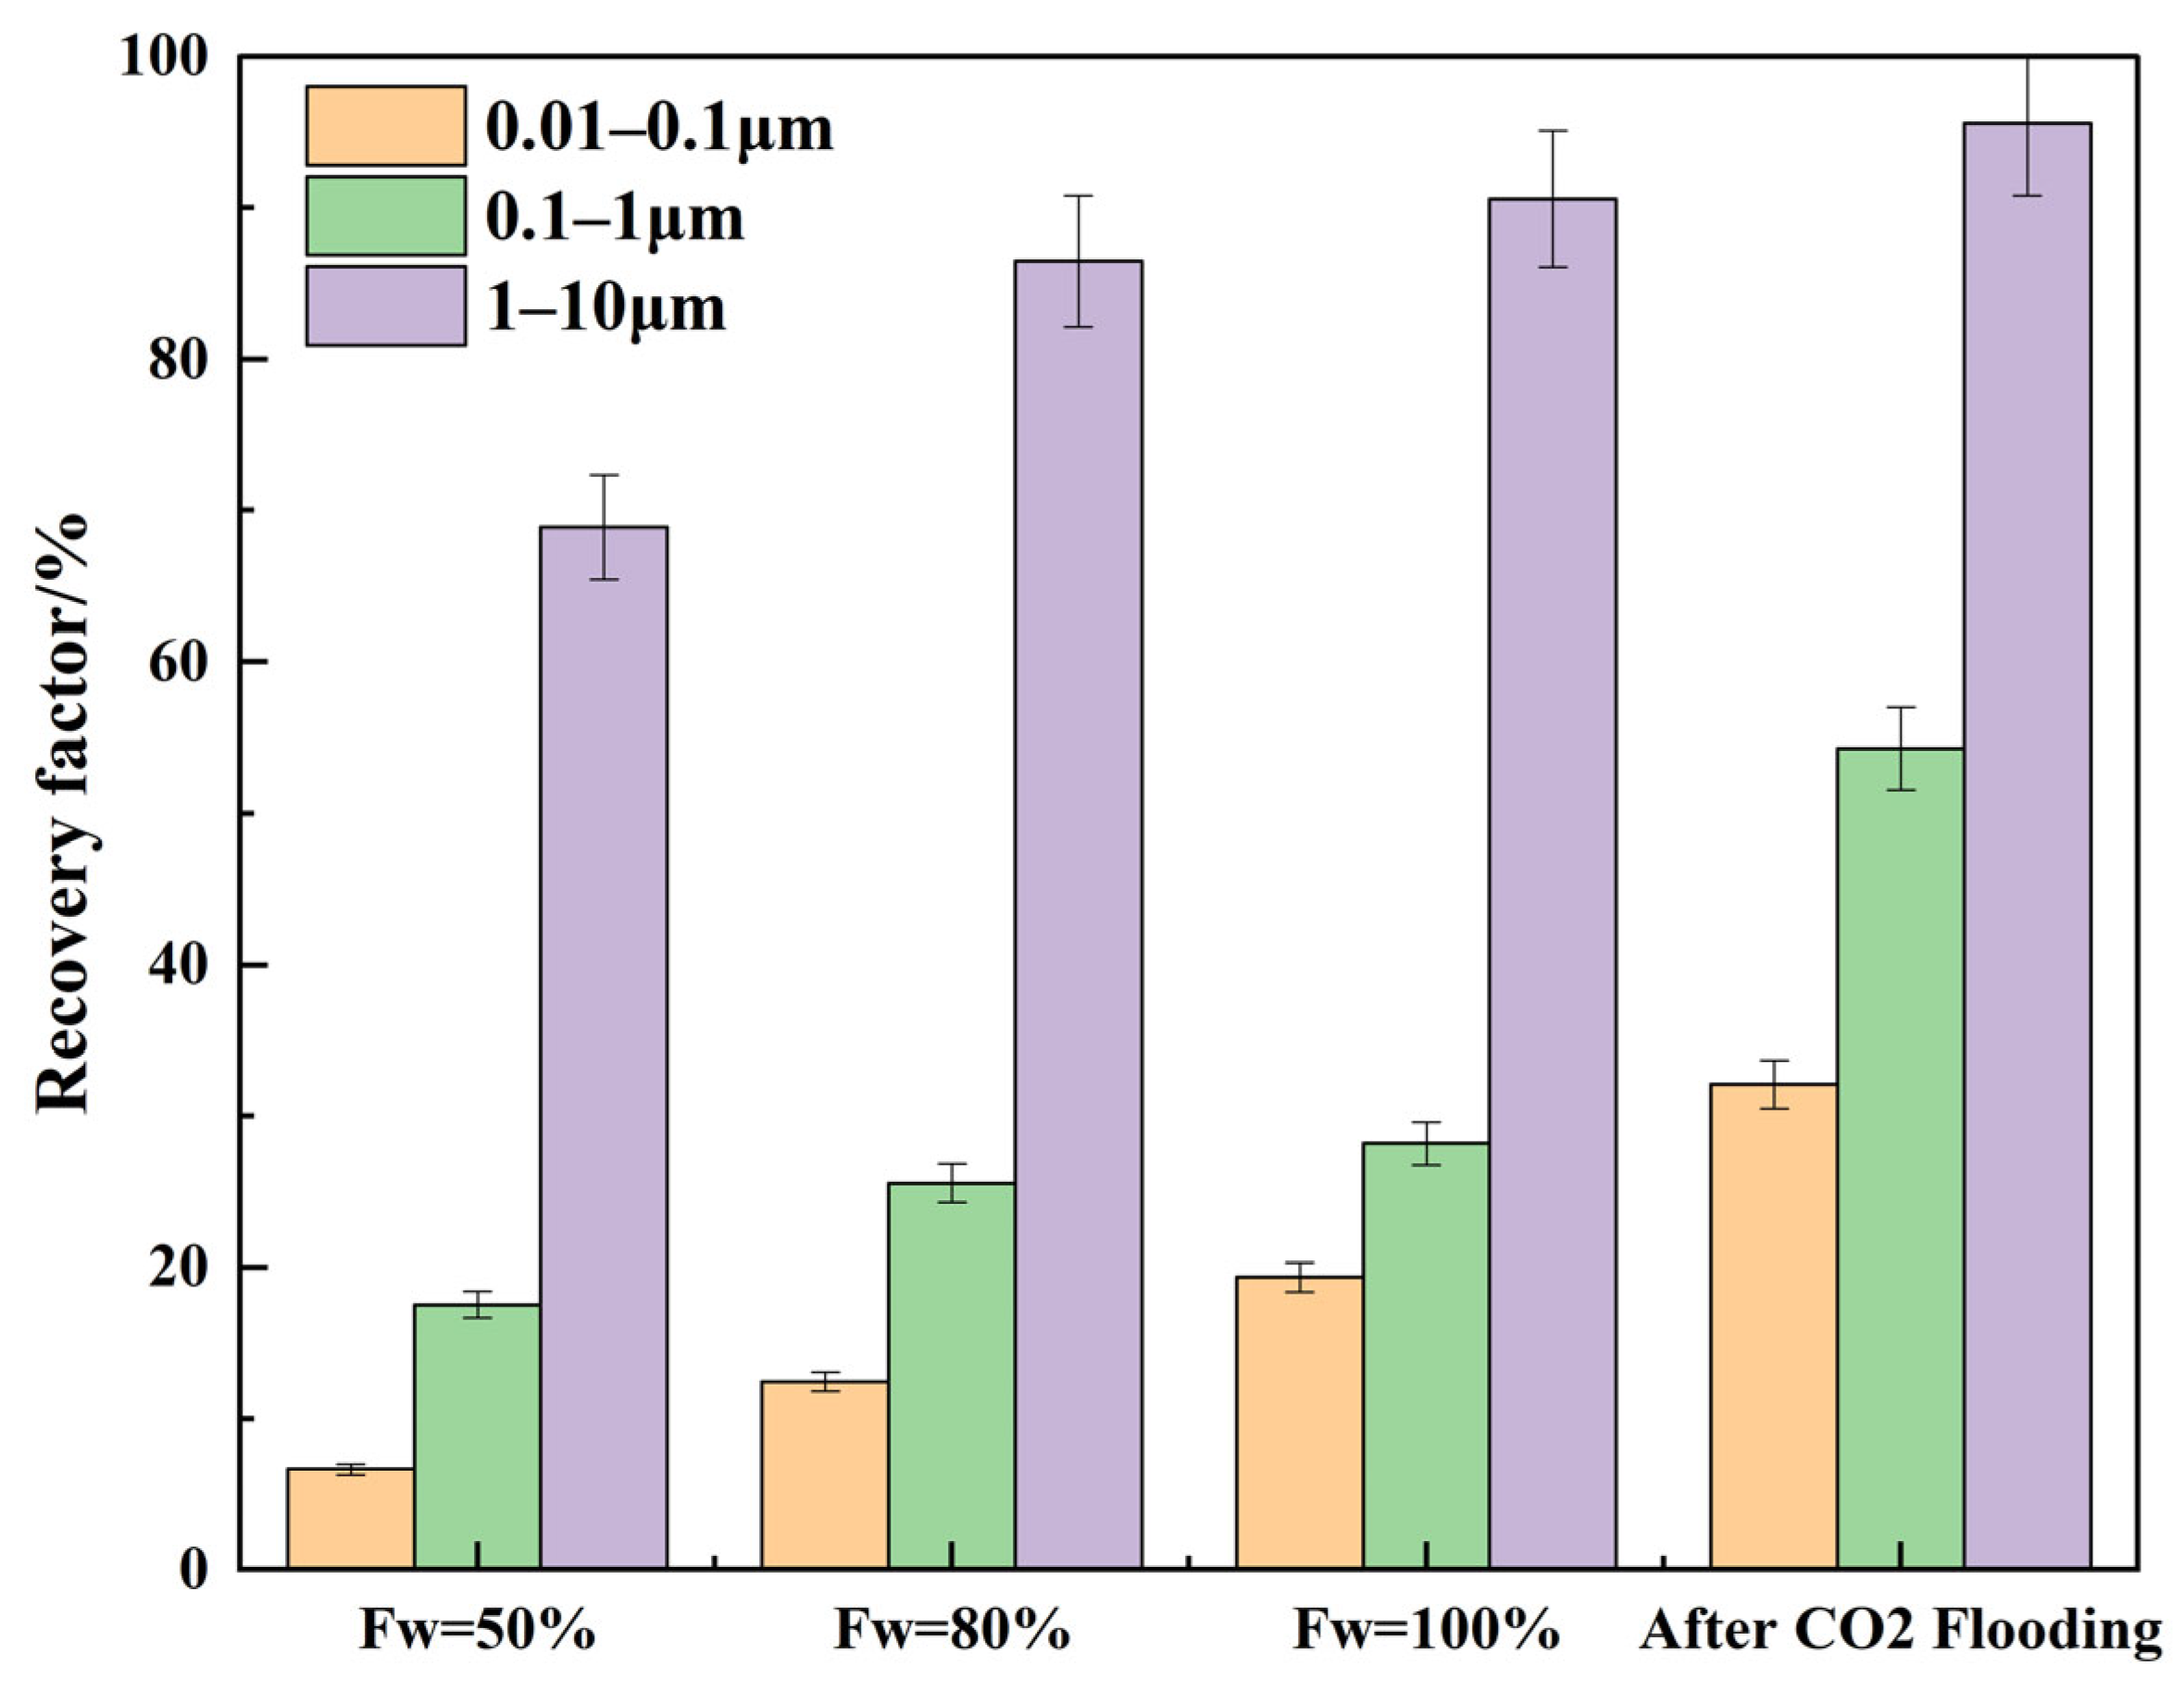
Compared with Class II reservoirs, Class III reservoirs exhibit a slower mobilization of pore throats smaller than 1 μm, and the corresponding results are shown in
Figure 6. During the waterflooding stage, the recovery efficiency of medium pores steadily increases from about 17% to around 28%, but the ultimate efficiency still shows a significant gap compared to that of large pores. The recovery efficiency of small pores remains the lowest throughout, slowly increasing from about 7% to 19%. Even at the end of waterflooding, about 80% of the initial crude oil in small pores remains unproduced, becoming the enrichment zone of the waterflooding remaining oil. Upon the completion of waterflooding, the remaining oil is highly concentrated in small pores and partial medium pores. Small pores and medium pores retain approximately 80% and 72% of the initial reserves, respectively, making them the primary potential-tapping targets for enhanced oil recovery. After CO
2 flooding, the microscopic mobilization uniformity across the three T
2-inferred pore size classes is fundamentally improved. The recovery efficiency of small pores increases to about 32%, with an increment exceeding 13 percentage points. The recovery efficiency of medium pores increases from about 28% to nearly 54%, showing the most significant enhancement.
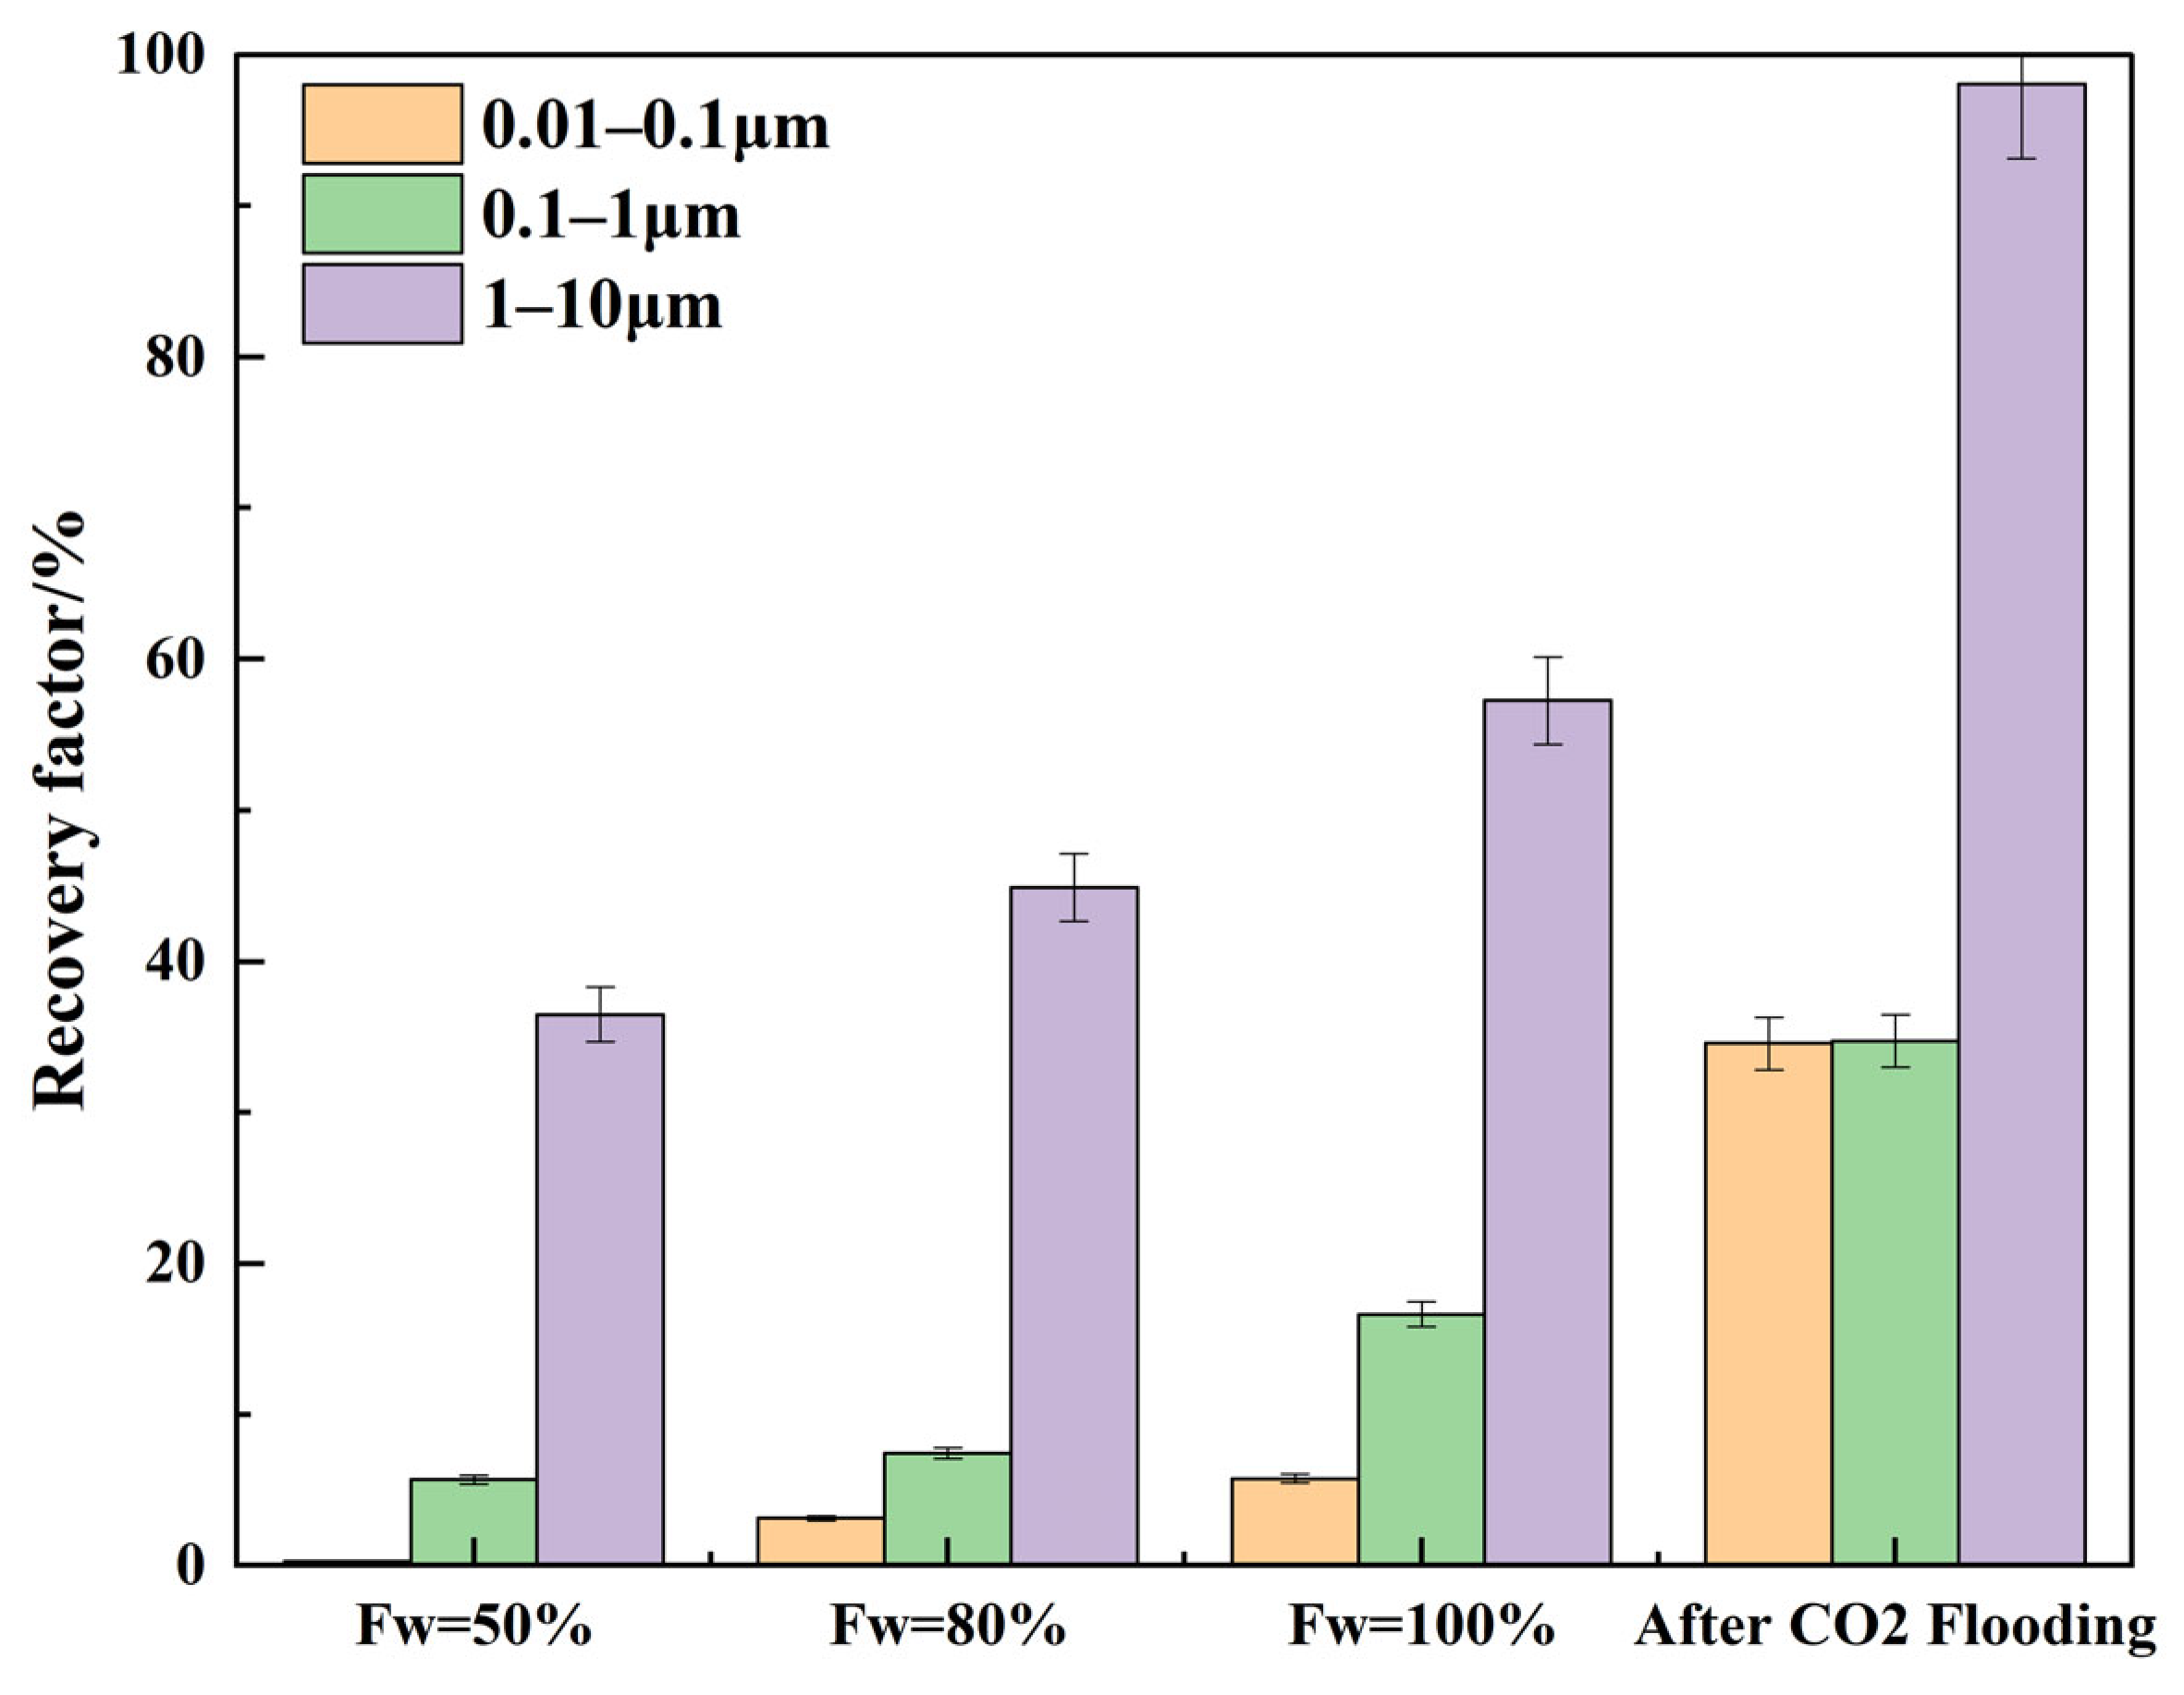
Compared with the first two types of reservoirs, the overall mobilization degree of Class IV reservoirs is significantly lower than that of medium-to-high-permeability cores, and the corresponding results are shown in
Figure 7. During the waterflooding stage in Class IV reservoirs, the recovery efficiency of small pores is extremely low, with a recovery degree of only 5.8%, and over 90% of the crude oil remains trapped within small pores. The recovery efficiency of medium pores increases gently from 5.7% to 16%. The recovery efficiency of large pores increases from 36.5% to 57%, indicating that even under low-permeability conditions, waterflooding still possesses a certain displacement capacity for large pore throats. After CO
2 flooding, the recovery efficiency of small pores increases to about 34.5%, with an increment as high as 29 percentage points, showing a significant improvement. The recovery efficiency of medium pores leaps from about 16.6% to about 34.7%. The recovery efficiency of large pores further increases from about 57% to about 98%, approaching complete production.
During the waterflooding process, the signal of large pores drops sharply with the advancement of waterflooding, indicating more thorough mobilization and less remaining oil at the end of waterflooding. The signal of medium pores decreases significantly, indicating that waterflooding has a favorable displacement effect on pore throats in this interval. At the end of waterflooding, a strong signal still exists in the small pore interval, showing that a large amount of crude oil in micropores remains immobilized, making it the primary remaining oil enrichment zone of waterflooding. Even under high-permeability conditions, the mobilization capacity of conventional waterflooding for small pores is still limited, and the problem of incomplete microscopic displacement caused by mobilization limits is widespread. CO2 flooding can significantly compensate for the deficiencies of waterflooding, further lower the mobilization limit to effectively mobilize the crude oil retained in micropore throats after waterflooding, and achieve further utilization of the pore space. This confirms that CO2 exhibits a superior ability to overcome capillary resistance, access smaller pore throats, and mobilize microscopic remaining oil, significantly enhancing pore-scale oil-washing efficiency. Therefore, sequential CO2 flooding after waterflooding is a key subsequent technology for improving microscopic sweep efficiency and tapping the potential of remaining oil.
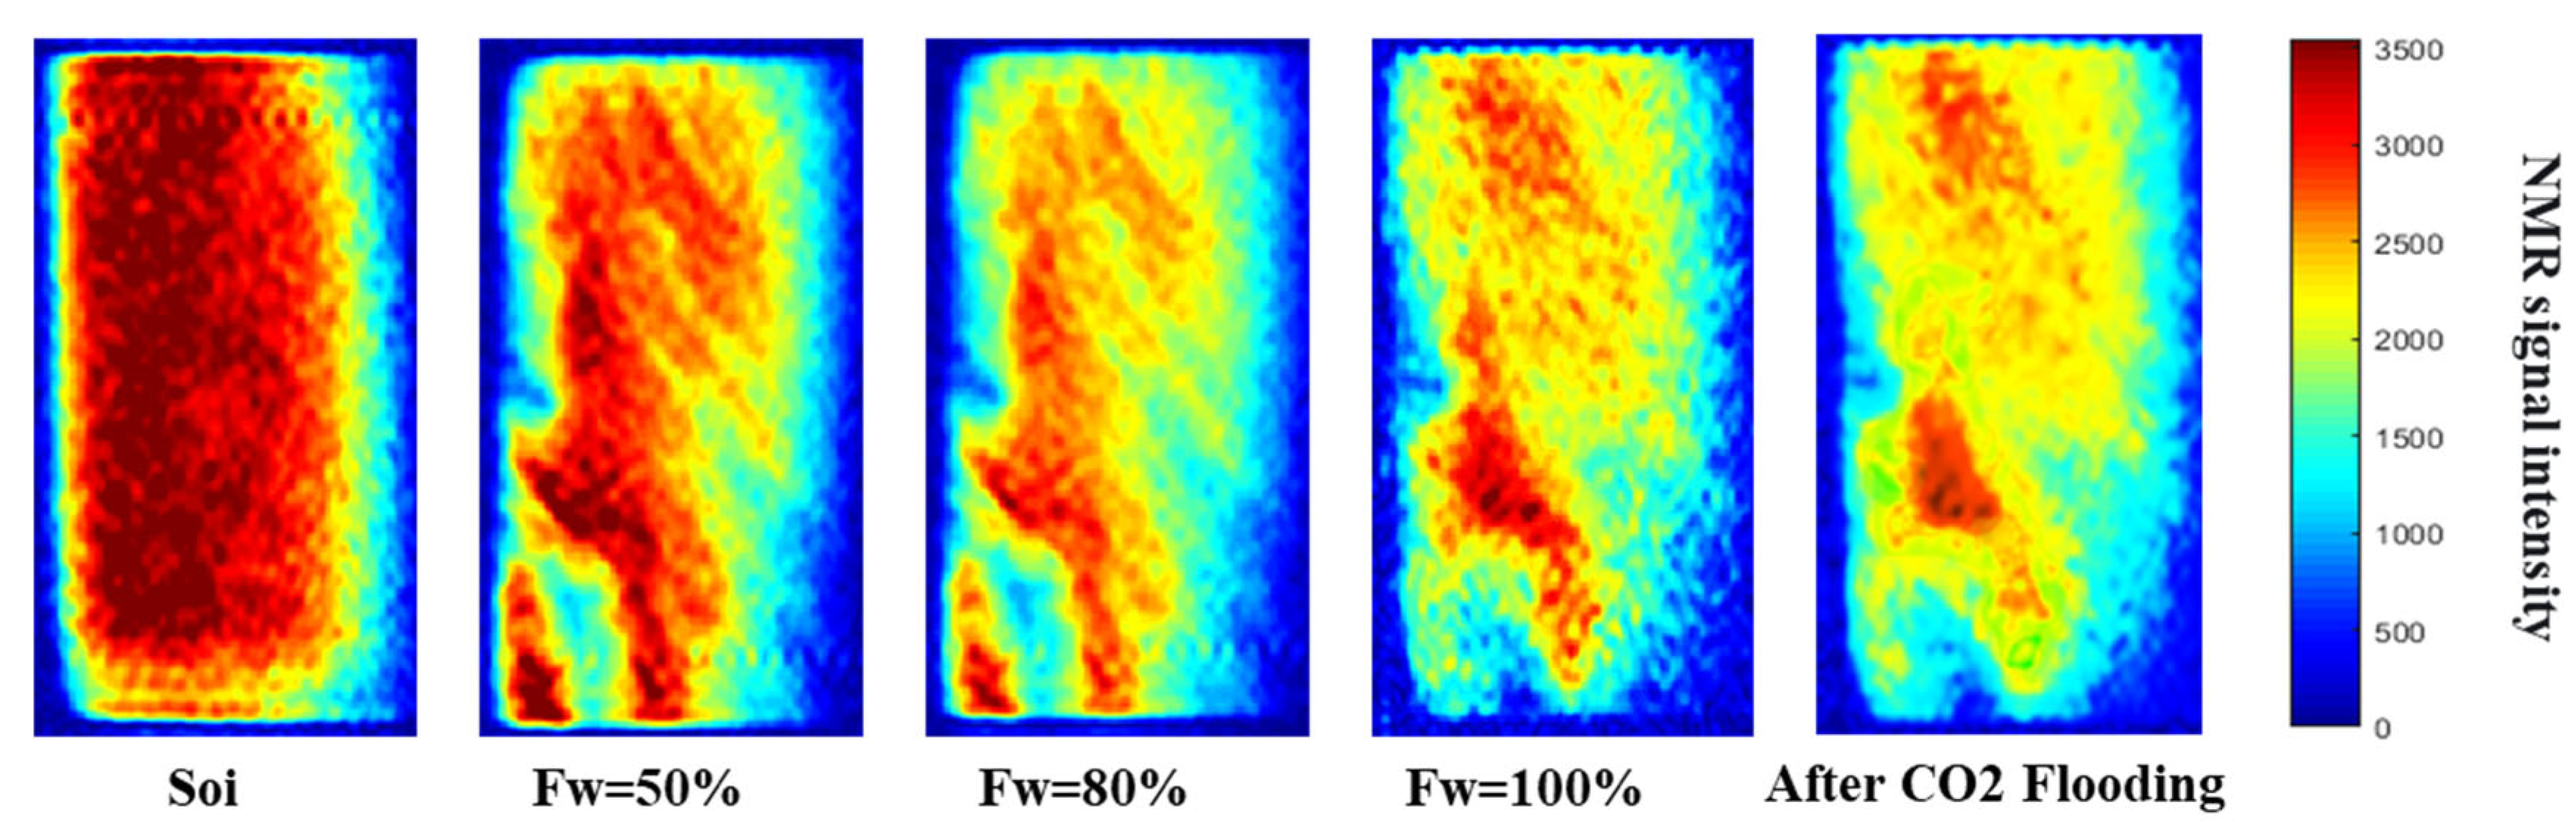
Class II cores are selected as the representative example for NMR imaging because their favorable porosity and permeability allow for the clearest visualization of flood-front advancement and water channel evolution, whereas the lower signal-to-noise ratios in Class III and IV low-permeability cores limit the spatial resolution of 2D imaging during online displacement. By identifying hydrogen signals to determine the oil saturation distribution within the core, and taking Class II reservoirs as an example, comparing the NMR scan images at different water cuts during waterflooding allows for an intuitive tracking of the advancement of the displacement front and changes in the remaining oil distribution, as shown in
Figure 8. Red represents the oil phase, with darker colors indicating higher oil saturation in that region. In the initial oil-saturated state, the core presents an overall dark-red color, indicating that crude oil fills the entire pore space. With the progress of waterflooding, the red color at the injection end (lower side) first begins to lighten or non-red regions appear, showing significant differences in the oil displacement efficiency across different positions of the core. At a water cut of 50%, the water phase has formed a distinct front, with large areas of medium-to-light-red regions behind it, indicating that a considerable amount of remaining oil is still distributed in continuous or semi-continuous states. As the water injection volume increases, the area near the injection end turns light red or non-red, and the remaining oil in the middle and rear parts of the core is segmented into discontinuous dark-red patches. When the water cut reaches 80%, several preferential flow paths with virtually no red color appear, surrounded by red regions, leading to uneven sweep efficiency. By the end of the waterflooding stage, the blocky remaining oil at the inlet end is mobilized, but the remaining oil in the middle and rear parts of the core is segmented into discontinuous dark-red patches (mainly located in the middle of the core), while patchy or isolated red patches still exist near the production end, representing microscopic remaining oil bypassed or immobilized by waterflooding. Compared with waterflooding, the overall red color of the core after CO
2 flooding further lightens and its range shrinks, with the dark-red patches remaining after waterflooding is significantly reduced or completely has disappeared. This suggests that through diffusion, viscosity reduction via dissolution, and miscibility mechanisms, CO
2 can enter pore spaces inaccessible to the water phase, thereby further enhancing oil recovery.
According to the fractional flow equation, as water saturation increases, the relative permeability of the water krw increases while that of the oil kro decreases, leading to the enhanced mobility of the water phase. During post-waterflooding gas injection, the flow of CO2 is more susceptible to pressure gradient control. When waterflooding reaches a water cut of 100%, the krw approaches its maximum, and water flow becomes completely dominant, with the water phase occupying most of the pore network in a continuous distribution. Inferred from the rapid rise in the water cut and the decline in the oil production rate, the production performance indicates that a continuous water-dominated flow path has been established. At this stage, the injected CO2 tends to advance along the path of least resistance, and subsequent gas injection is highly prone to channeling along the high-permeability channels formed by the continuously distributed water phase. The contact interface between CO2 and crude oil is relatively limited, which hinders the full utilization of diffusion and mass transfer advantages and easily leads to gas channeling. When the water cut is 50%, the relative permeabilities of the oil and water phases are in a relatively balanced range. Water-channeling pathways have not yet formed, and the oil phase distribution remains relatively continuous. Meanwhile, the water phase in the pores is in a dispersed state. Following CO2 injection, the mobility-control effect that is suggested by the observed displacement performance may facilitate sufficient diffusion and mass transfer with the remaining oil, thereby delaying gas channeling. Therefore, the key to formulating a post-waterflooding CO2 injection strategy lies in selecting the appropriate transition timing based on different reservoir physical properties. This suggests that the dispersed water phase may exert a mobility-control effect, while also promoting diffusion and mass transfer between CO2 and the dispersed remaining oil, ultimately achieving the highest oil recovery efficiency. It must be noted that inferences regarding relative permeability changes (krw/kro), continuous water pathways, and mobility control are interpretations of the macroscopic production response, rather than measured in-situ water saturation (Sw) or relative-permeability data.
3.2. Analysis of Experimental Results of High-Temperature and High-Pressure Long-Core Post-Waterflooding CO2 Transition Flooding
By analyzing the dynamic responses of different types of reservoirs during waterflooding and gas flooding processes, it can be found that their production performance is closely related to reservoir physical properties and pore structures. Experiments on transitioning to CO
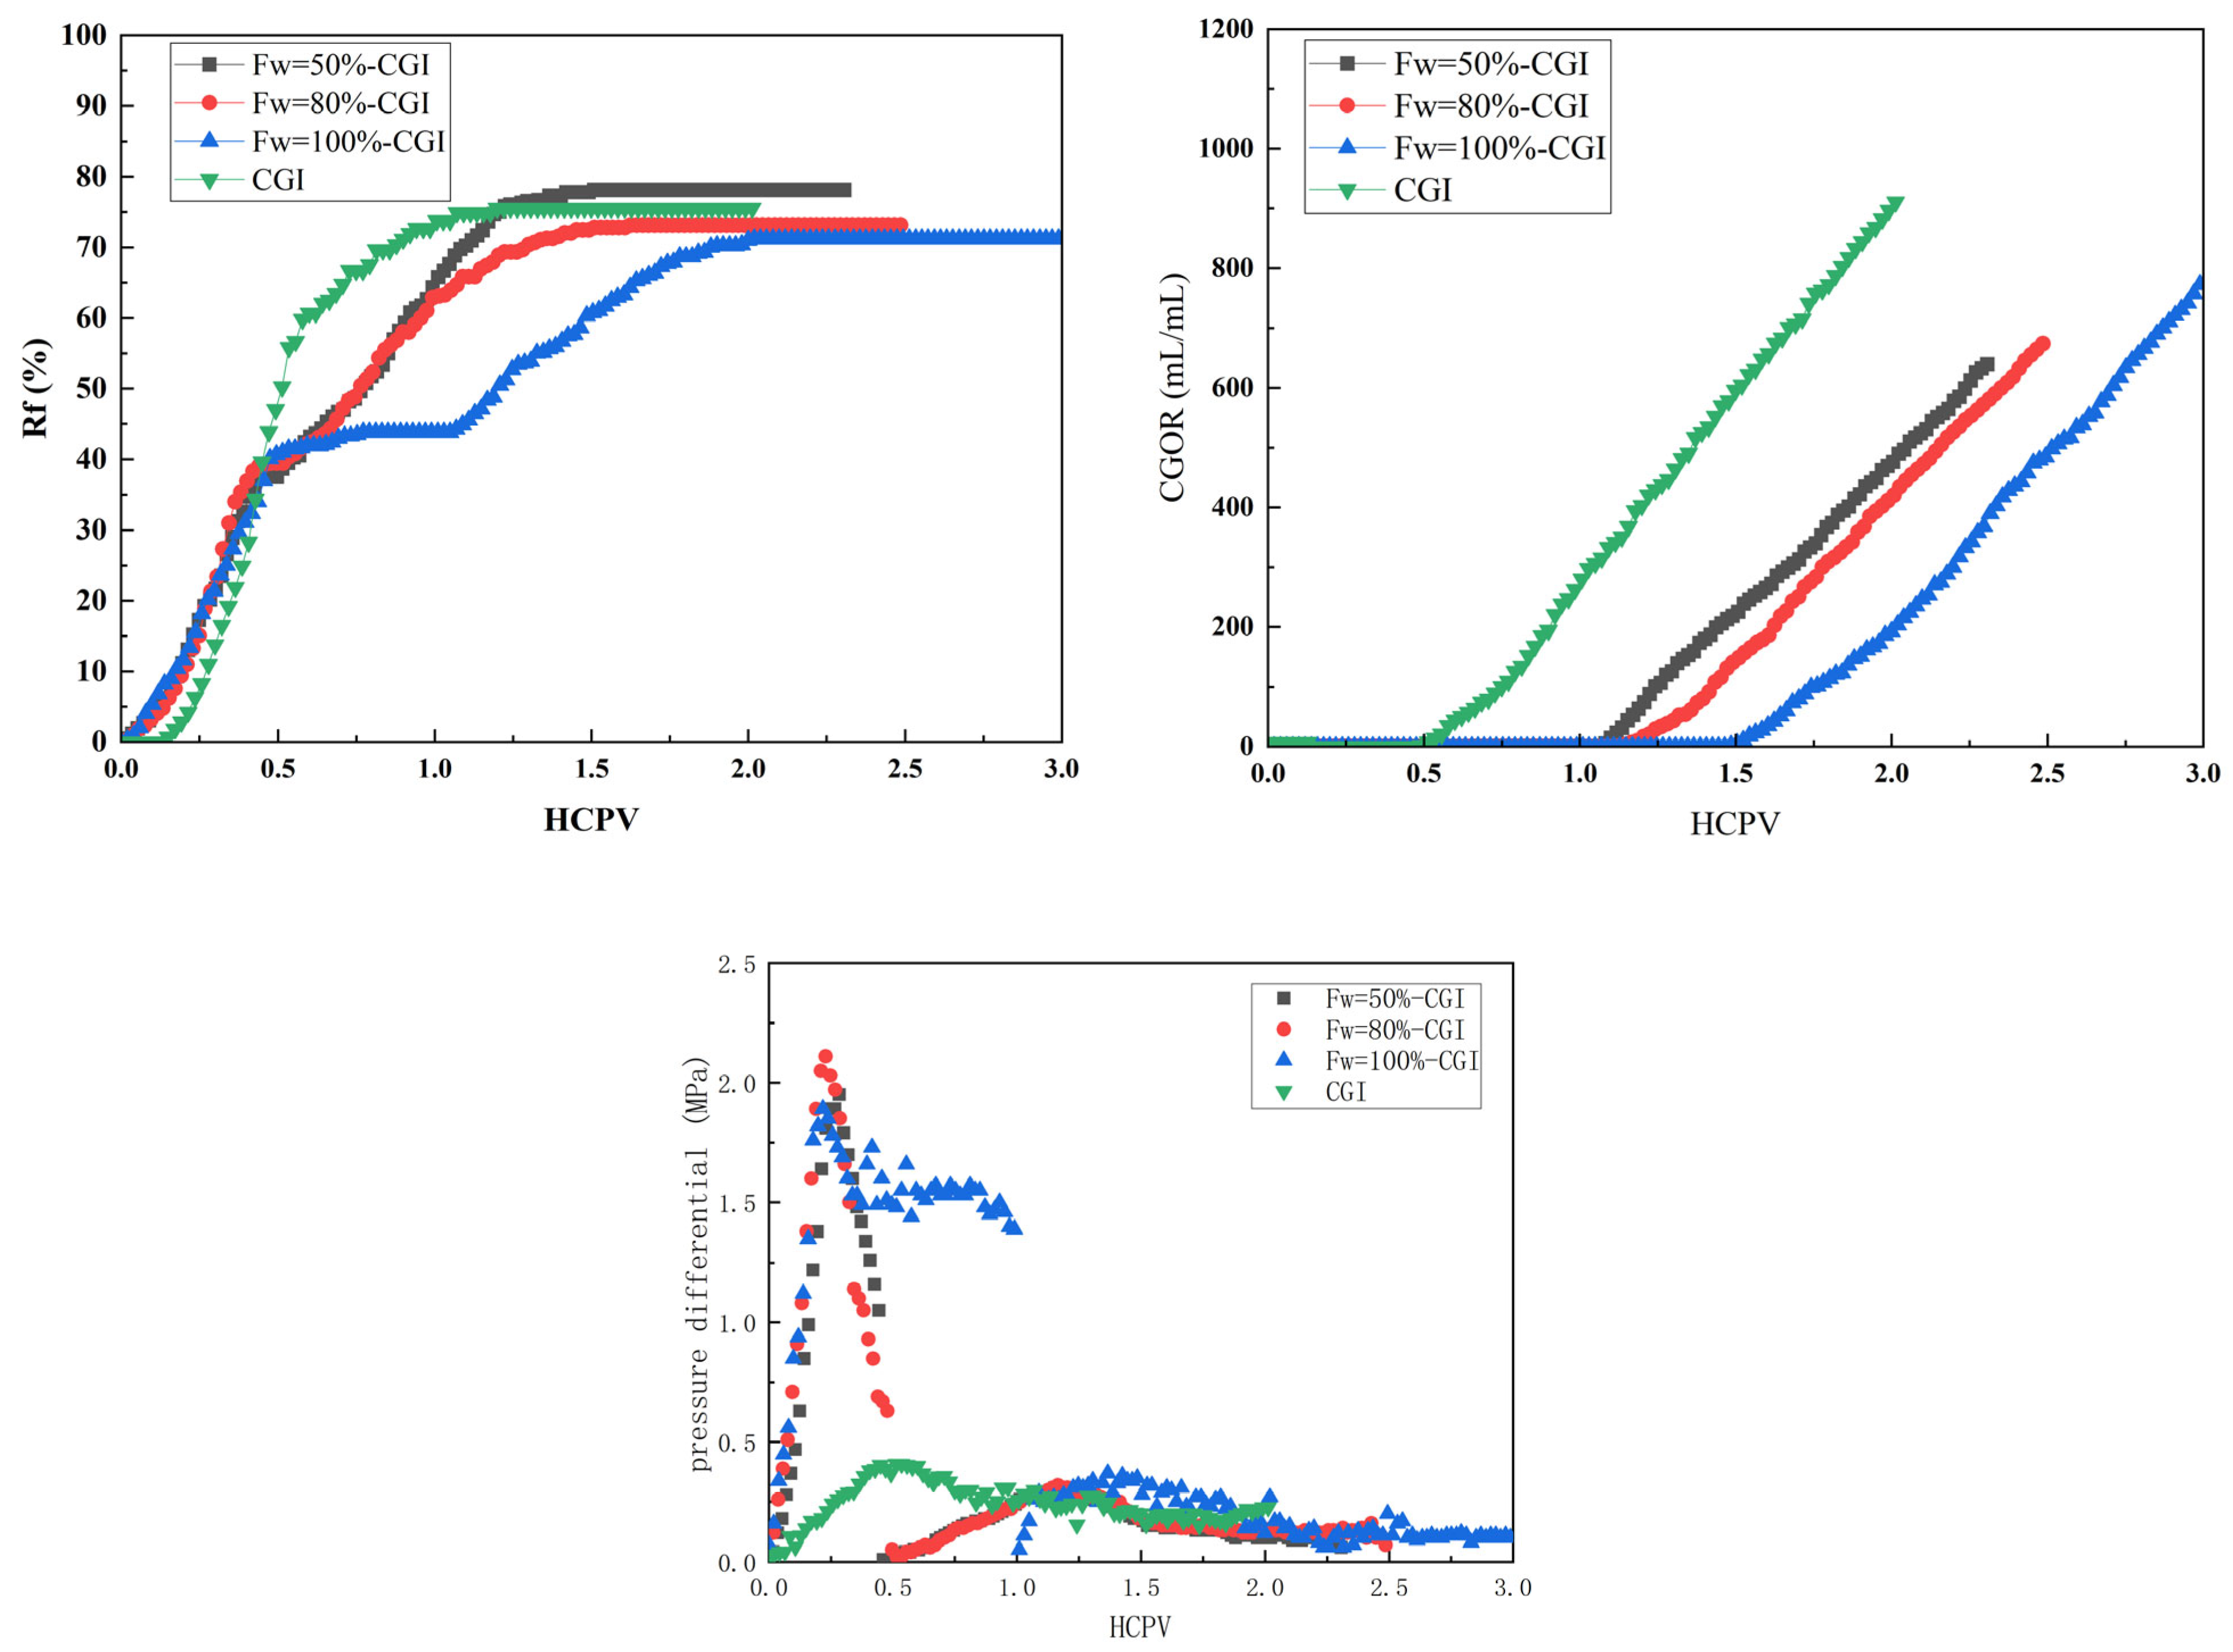
2 flooding after waterflooding to different water cuts were conducted using cores from three types of reservoirs, and the results were compared with CGI. Among the switching points investigated, the recovery performance and CGOR were analyzed through the recovery degree and CGOR, and the experimental results for Class II reservoir cores are shown in
Figure 9. In the early stage of injection (<0.15 HCPV), the CGI scheme exhibits a slightly lagging slope in the increase of recovery degree due to the time required to establish oil-gas mass transfer. In contrast, the post-waterflooding CO
2 transition schemes start with a higher baseline recovery degree at the beginning of the gas flooding stage, inheriting the foundation established by the preceding waterflooding. Among them, for the F
w = 100% scheme, after transitioning from waterflooding to gas flooding, the recovery degree shows the smallest increment because most of the movable oil has already been swept away by waterflooding and long-term water flushing tends to create preferential water-flow paths, as indicated by the flattening of the recovery curve. The F
w = 50% scheme demonstrates an exceptional capacity for enhancing oil recovery, with the recovery degree rising rapidly after the transition and eventually reaching a peak of 78.11%. The reason is that when the water cut reaches 50%, oil and water coexist within the reservoir, and the remaining oil is distributed in a continuous or semi-continuous state. When CO
2 is injected at this point, destructive water-channeling pathways have not yet formed, and a moderate movable water saturation is present. The water phase is considered to provide a mobility-control effect, which may force CO
2 to sweep medium-to-small pores more uniformly; meanwhile, CO
2 can undergo efficient diffusion, dissolution, and extraction with the continuously distributed remaining oil, achieving the ultimate efficiency of water-gas synergistic sequential displacement and allowing its ultimate recovery efficiency (78.11%) to even exceed that of continuous gas injection (75.53%). As the degree of waterflooding deepens further to 80% or even 100%, long-term water flushing causes the crude oil to be severely fragmented and trapped within micropores, transforming the oil phase from continuous to extremely dispersed. Meanwhile, the water phase becomes fully interconnected within high-permeability channels, forming preferential water-flow paths. When transitioning to CO
2 injection at this stage, the rapid rise in the CGOR and the leveling of recovery are consistent with early gas breakthrough and preferential flow along these swept paths, which limits gas–oil contact, reduces mass transfer efficiency, and yields a lower final recovery of 71.19%. Due to the large pore-throat radii in high-permeability reservoirs, continuous CO
2 injection lacks the mobility control provided by the water phase, causing gas channeling to occur at an extremely early stage (approximately 0.55 HCPV). When the gas injection volume reaches 0.82 HCPV, the slope of the CGOR curve reaches its maximum, soaring to approximately 900 mL/mL, which indicates severe gas channeling and low effective gas utilization under continuous gas injection. Compared with continuous gas injection, for the post-waterflooding CO
2 transition flooding, the recovery degree increases relatively quickly during the early waterflooding stage, as higher porosity and permeability are conducive to fluid flow, allowing higher oil recovery to usually be achieved during both the waterflooding and gas-flooding stages. However, this type of reservoir also tends to face strong heterogeneity and high-permeability channels, which easily induce water channeling. Once water breaks through, the water cut increases rapidly, and the oil production rate drops sharply until the production end predominantly produces water with negligible oil production. After transitioning to CO
2, the water phase retained within the pores during waterflooding is considered to act as a mobility-control slug, increasing the flow resistance of the gas phase and suppressing the premature breakthrough of CO
2. Especially when F
w = 100%, the water phase fills most of the pore network, resulting in the most pronounced delay in gas channeling and the slowest rise in the CGOR. Here, the inferred moderate movable water saturation, continuous water pathways, and mobility-control effects are interpretations of the effluent production response and differential pressure dynamics, not the measured in situ S
w or relative-permeability data.
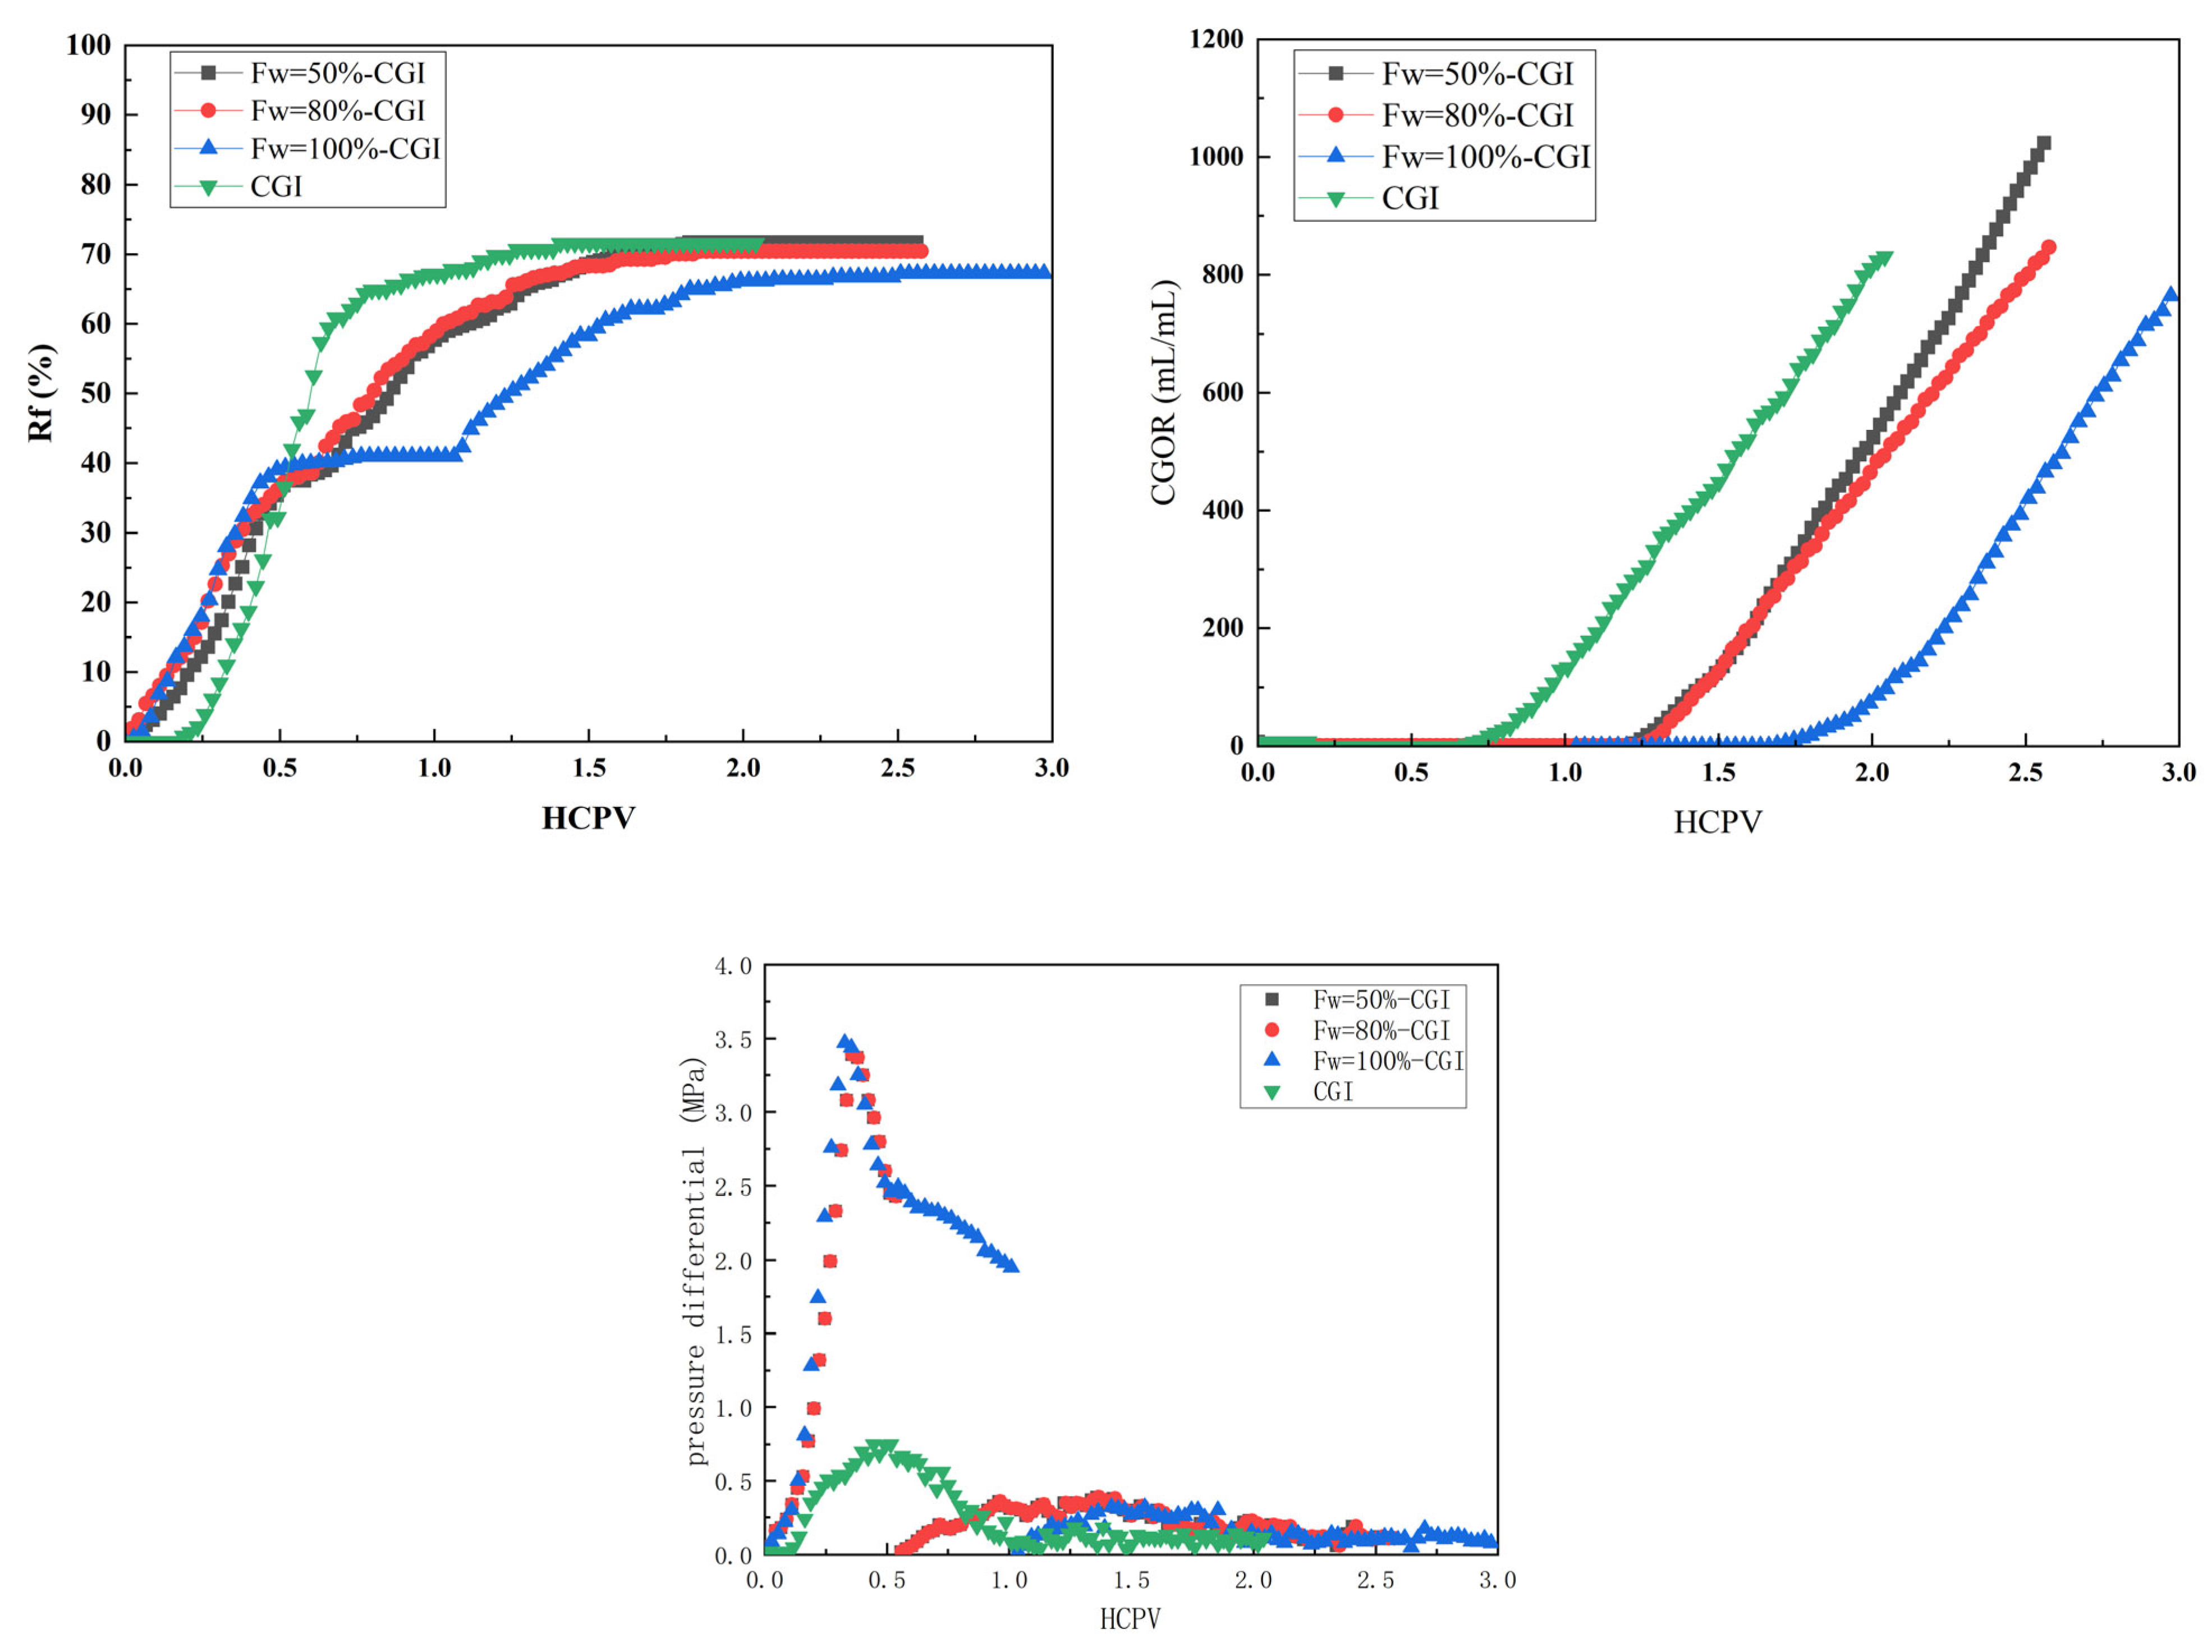
In the 80 mD medium-permeability reservoir, due to the decreased matrix permeability and reduced pore-throat size compared to the 170 mD reservoir, the flow resistance during direct pure CO
2 injection is relatively increased, and the occurrence of gas channeling is slightly delayed compared to the 170 mD reservoir. However, after the injection volume reaches the mid-to-late stage (approximately 0.7 HCPV), due to the lack of mobility control by the water phase, gas channeling occurs, resulting in a final recovery efficiency of 71.60%; the corresponding results are shown in
Figure 10. In the post-waterflooding CO
2 transition schemes, as the produced-fluid water cut (F
w increasing from 50% to 100%) at the transition timing increases, the effect of delaying gas channeling gradually becomes more pronounced. Among the post-waterflood switching schemes, the Fw = 50% scheme achieved the highest recovery (71.70%), which is essentially comparable to that of CGI (71.60%), with the growth rate of the recovery degree after gas transition being significantly faster than those of other schemes. For the F
w = 50% transition scheme, the coexistence state of oil and water in the reservoir is ideal at this point, the remaining oil has not been excessively washed by waterflooding, and the production response is consistent with the absence of dominant preferential water pathways. The injection of CO
2 can fully play the roles of diffusion, mass transfer, extraction, and miscible displacement. Meanwhile, the moderate water saturation provides a favorable mobility-control effect, contributing to the highest ultimate recovery efficiency. For the F
w = 100% scheme, after undergoing the entire waterflooding process, most of the movable oil has already been produced during the waterflooding stage. After gas transition, the flattening of the recovery growth curve may be partly attributed to the high water saturation and associated water-locking effects, which inhibit the energy supply and light component extraction functions of gas flooding. However, other factors such as limited injectivity and poor phase connectivity may also contribute to this behavior. During transition at the high-water-cut stage, microscopic remaining oil is mostly trapped in medium-to-fine pore throats with high capillary resistance, and the continuous blockage formed by the water phase hinders the direct contact between the gas and crude oil, thereby impairing the gas flooding performance. These deduced internal flow mechanisms, including moderate water saturation, mobility control, and continuous water blockage, represent interpretations of production data, not measured S
w or relative-permeability effects.
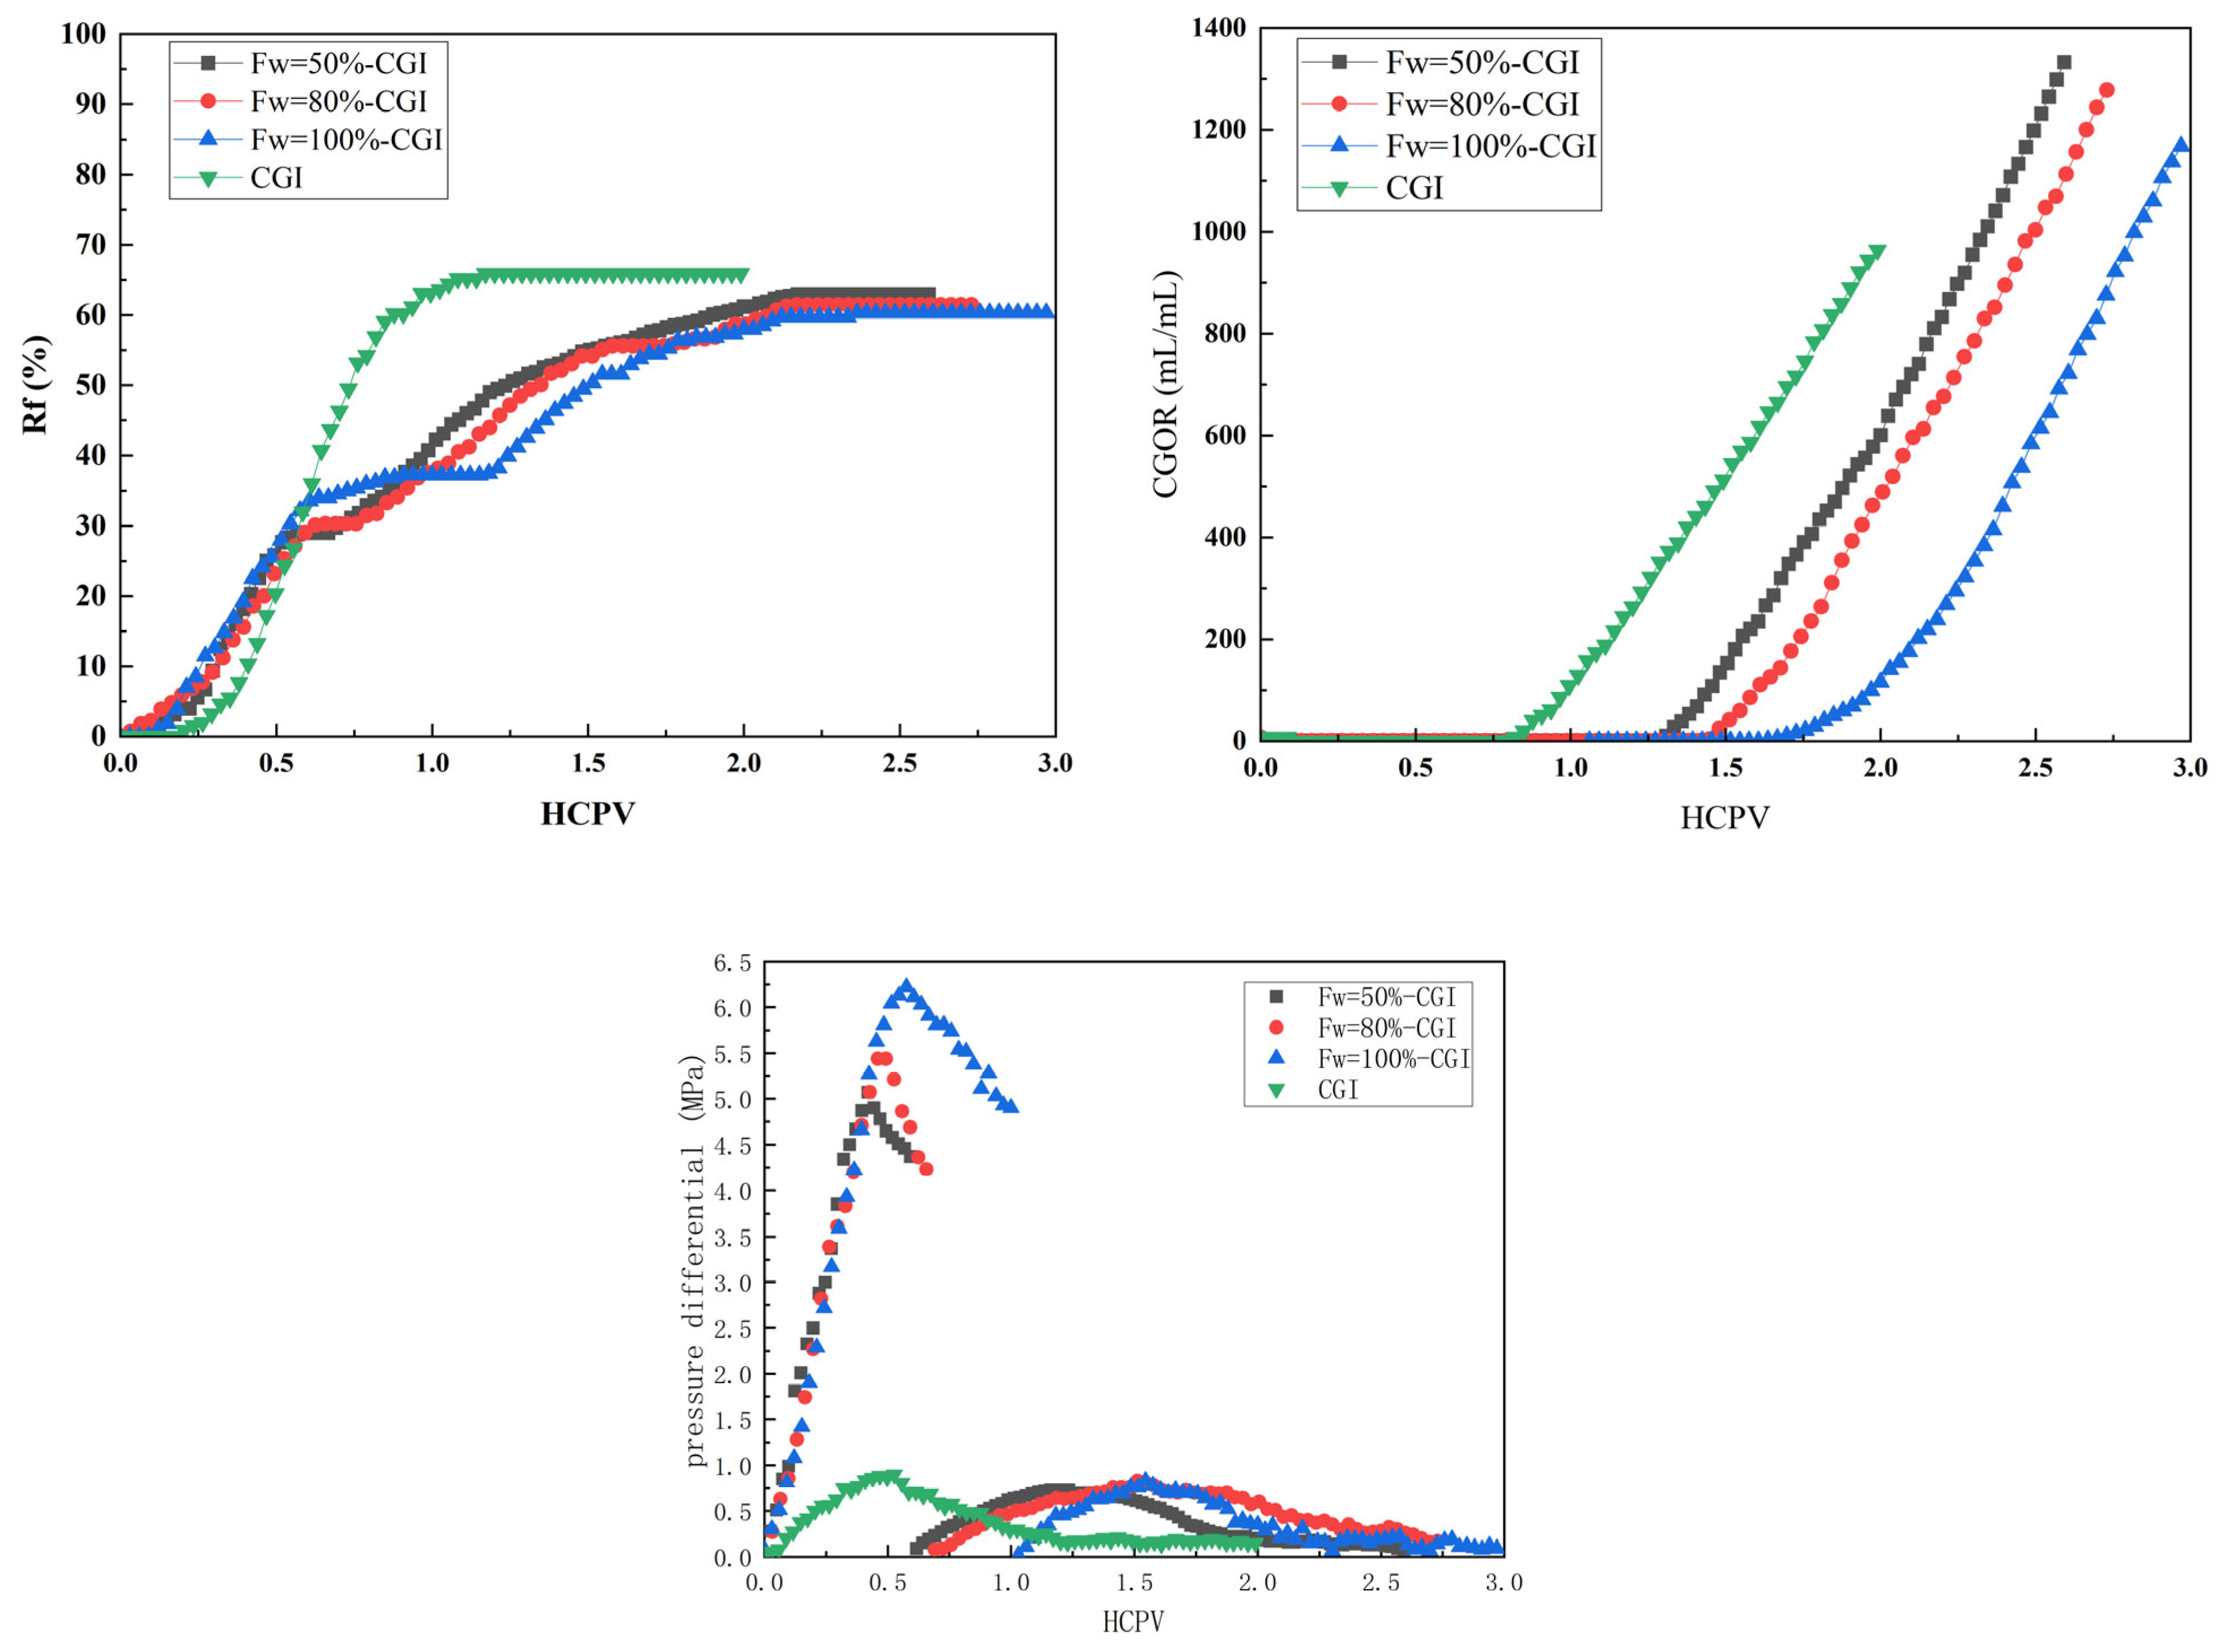
For Class IV reservoirs with fine pore throats and poor physical properties, the same transition timing faces completely different challenges. Due to the small average pore-throat radius, relatively tight pore structure, and high capillary resistance in Class IV reservoirs, the gas-channeling point during direct CO
2 injection is significantly delayed compared to medium-to-high-permeability reservoirs (at approximately 0.8 HCPV). However, due to the strong heterogeneity of micropore throats in low-permeability cores, once the gas breaks through, the CGOR soars rapidly, and its value is significantly higher than that of medium-to-high-permeability reservoirs, with the final recovery efficiency of direct CO
2 injection reaching 66%; this comparative result is illustrated in
Figure 11. In the post-waterflooding CO
2 transition schemes, during the waterflooding stage, a larger production pressure differential is required to drive fluid flow. When transitioning to gas injection development, a considerable amount of movable water still remains in the reservoir, and these water phases hinder the establishment of an effective displacement relationship between the gas and crude oil, causing crude oil production to fail to respond rapidly and resulting in a significant lagging phenomenon. Meanwhile, due to their inherent strong hydrophilicity and extremely high capillary resistance, it is difficult for the injected gas to effectively break through the continuous water barrier formed by movable water. The water phase forms a barrier within the micropore throats, severely impeding the physical contact between CO
2 and the trapped crude oil, which greatly weakens the key extraction, diffusion, and dissolution mechanisms. Meanwhile, water-locking effects are considered to be one of the possible contributing factors that may prevent the gas from effectively displacing and driving the crude oils. Other factors, including limited pore connectivity and capillary end effects, may further complicate the displacement process. This not only reduces the mobility of crude oil but also significantly weakens the extraction and miscible displacement effects of CO
2 on crude oil, thereby constraining the ultimate recovery efficiency of this type of reservoir. Therefore, even with the transition to gas injection, the ultimate recovery efficiency basically remains at the level of the end of waterflooding, with a recovery efficiency of 61.43%. The macroscopic results above are not contradictory to the microscopic mobilization capacity of CO
2 revealed by NMR for Class IV reservoirs. The NMR experiments (
Figure 4 and
Figure 7) show that the small-pore recovery increases from 5.8% after waterflooding to 34.5% after CO
2 flooding, reflecting the ultimate microscopic displacement capacity of CO
2. However, the long-core F
w = 100% switching scheme yields negligible macroscopic incremental recovery. This apparent contradiction can be explained from three aspects. First, the absolute oil content in micropores is limited, so even a substantial relative increase in small-pore recovery contributes little to total recovery in absolute terms. Second, high capillary pressure and water-locking effects may inhibit effective CO
2–oil contact and mass transfer. Third, in the short NMR cores (5 cm), the diffusion distance is short, allowing mobilized oil to reach the outlet more easily; in the long cores (30 cm), the diffusion distance is six times longer, and the mobilized oil struggles to overcome capillary resistance to form a continuous oil phase. Meanwhile, pressure monitoring data show that the pressure differential stabilized after waterflooding and showed no significant decline after CO
2 injection, indicating that the injected gas failed to establish an effective displacement pressure gradient—further supporting the above interpretation. Therefore, the NMR results demonstrate the microscopic potential of CO
2, while the macroscopic results reflect practical constraints of transport and connectivity—the two are complementary rather than contradictory. It should be stressed that descriptions such as continuous water barriers and water locking are interpretations of the observed production lag and pressure curves rather than measured saturation or relative-permeability data.
Comparing the experimental results of the 10 mD low-permeability layer, 80 mD medium-permeability layer, and 170 mD high-permeability layer, the transition scheme at a water cut of 50% achieved the highest recovery among the tested conditions for the high-permeability layer (170 mD) and medium-permeability layer (80 mD). Class II reservoirs exhibit the most significant enhancement; with well-developed large pore throats, waterflooding can rapidly carry away movable oil, and at Fw = 50%, the water phase is considered to provide favorable mobility control with excellent water–gas synergy, yielding a recovery efficiency that even exceeds that of the CGI development scheme. This superiority stems from the fact that under this transition timing, the fluid distribution and flow state within the reservoir achieve an ideal dynamic equilibrium. At a water cut of 50%, the production response is consistent with the absence of stable, high-permeability preferential flow pathways such that gas injection does not immediately result in severe preferential gas flow or early breakthrough. Under these conditions, the movable water phase inferred to be present in the pore network may provide favorable mobility control. It partially occupies the larger pores, forcing the subsequently injected CO2 gas to enter medium-to-small pores more extensively and contact the remaining oil therein, thereby significantly reducing the relative permeability of the gas, effectively controlling gas mobility, suppressing the premature occurrence of gas channeling, and enhancing the sweep volume and displacement efficiency of the gas. For Class II reservoirs with favorable physical properties, oil and water coexist within the pores at this stage, with a moderate movable water saturation. The injected CO2 can not only undergo effective mass transfer and extraction with the crude oil but can also achieve a smoother displacement front with the assistance of the water phase. This water–gas synergistic microscopic displacement mechanism is far more efficient than continuous gas injection or gas transition at the high-water-cut stage. As with the earlier interpretations, this postulated water–gas synergy and mobility control by a water slug are deductions from macroscopic recovery trends, not directly measured saturation distributions or relative-permeability characteristics.
To better evaluate the incremental contribution of CO
2 under different switching schemes,
Table 3 summarizes the waterflood recovery, incremental recovery by CO
2, final recovery, cumulative water injected, and oil produced per unit volume of injected CO
2 for each test. For Class II and III medium-to-high-permeability reservoirs, the F
w = 50% switching scheme yields the highest incremental recovery by CO
2 (40.54% and 34.18%, respectively) and the highest CO
2 utilization (0.160 and 0.116 mL/mL), significantly outperforming delayed switching schemes (0.108–0.133 mL/mL for Class II; 0.089–0.108 mL/mL for Class III). Notably, the cumulative water injected at F
w = 50% is only 0.44–0.53 PV, whereas at F
w = 100%, the cumulative water injected reaches 0.982–1.000 PV, yet the CO
2 incremental recovery drops to 27.36% and 26.24%, with CO
2 utilization as low as 0.108 and 0.089 mL/mL. This indicates that when switching is delayed to a high water cut, waterflooding has already established preferential flow paths, significantly reducing CO
2 efficiency. The CGI scheme achieves the highest final recoveries (75.53% and 71.60%) but lacks the mobility control provided by the water phase, leading to higher gas-channeling risks and potentially higher recycling costs in field practice. For Class IV low-permeability reservoirs, the post-waterflood switching schemes yield final recoveries of only 60.28–62.93%, with CO
2 utilization as low as 0.052–0.076 mL/mL. In contrast, the CGI scheme achieves a final recovery of 65.91% and a substantially higher CO
2 utilization (0.147 mL/mL), significantly outperforming all post-waterflood switching schemes. This is consistent with constraints imposed by water-locking effects and high capillary pressure on the CO
2 displacement efficiency in low-permeability reservoirs, further supporting the recommendation that low-permeability reservoirs should adopt early or direct CO
2 injection.
Regarding microscopic pore-throat mobilization, our results are in good agreement with Zhao et al. [
36], who reported a recovery increment of 17.09–31.49% in micropore throats of medium-to-low-permeability cores after CO
2 miscible flooding, and with Su et al. [
37], who demonstrated the mobilization capacity of CO
2 in nanopores (<3.7 nm). Specifically, for Class IV low-permeability cores, the recovery efficiency of micropores (<0.1 μm) increased from 5.8% after waterflooding to approximately 34.5% after CO
2 flooding, with an increment of 28.70%. In contrast to previous studies that often treated pore systems homogenously across different core types, our classified comparison reveals a distinct petrophysical hierarchy in T
2-inferred pore size mobilization: for Class II medium-to-high-permeability reservoirs, the incremental recovery is dominated by mesopores (0.1–1 μm, 31%), whereas for Class IV low-permeability reservoirs, the CO
2 contribution is heavily concentrated in micropores (<0.1 μm, 28.70%) and macropores (1–10 μm, 41%) that were previously bypassed during waterflooding. This suggests that CO
2 may target trapped remaining oil across different pore scales depending on reservoir petrophysical properties.
Regarding the transition timing, Liu et al. [
20] recommended switching at a high-water-cut stage (F
w ≈ 82%) based on net present value (NPV) optimization, while Li and Gu [
15] advocated an intermediate timing (when waterflooding recovery reaches 50% of its ultimate secondary recovery). Our classified experimental results further refine these earlier understandings: for Class II and III medium-to-high-permeability reservoirs, transitioning at F
w = 50% yields the highest ultimate recovery (78.11%), exceeding continuous gas injection (75.53%) and delayed switching at F
w = 100% (71.19%). For Class III medium-permeability reservoirs, the recovery at F
w = 50% (71.70%) is the highest among the tested post-waterflood switching schemes and is essentially comparable to continuous gas injection (71.60%, a negligible difference of only 0.10 percentage points, which does not constitute an outperformance) but is higher than delayed switching at F
w = 100% (67.23%). This favorable recovery performance among the tested schemes is mainly attributed to the mobility control provided by moderate movable water saturation before continuous water pathways are fully established (which represents an interpretation of production data rather than a measured saturation or relative-permeability effect). In contrast, for Class IV low-permeability reservoirs, late switching is considered highly unfavorable, which may be partly related to high capillary resistance and water-locking effects, along with other possible factors, such as limited injectivity and poor phase connectivity. Direct CO
2 injection or very early transition achieves a significantly higher recovery (65.91%) than switching after complete waterflooding (61.43%). These findings demonstrate that the transition timing should not follow a single fixed threshold but requires differentiated optimization based on the interplay among the mobility ratio, gas channeling, and capillary resistance across different reservoir classes.





 ,
,