1. Introduction
Household appliance efficiency policies are widely deployed as instruments of demand-side energy governance [
1,
2]. Energy-efficiency labeling plays a distinctive role: rather than removing low-efficiency products, it reshapes the market mix by steering both consumer purchases and manufacturer offerings toward higher grades [
3,
4,
5]. In China, the dishwasher market now operates under the GB 38383-2019 labeling system, which ranks products by Energy Efficiency Index (EEI); a full transition from the lowest to the highest grade implies roughly a 37.5% reduction in per-cycle energy consumption [
6].
China has since issued the revised GB 38383-2025 standard [
7], which tightens EEI thresholds across all grades and takes effect on 1 April 2027. A related issue is the extent to which the potential embedded in the existing 2019 system can be realized under existing implementation constraints. Energy savings from such policies tend to fall systematically short of engineering projections, a divergence widely termed the implementation gap [
8,
9]. Diagnosing its magnitude and structural sources under the 2019 system offers direct reference for the challenges the 2025 revision will face, especially for dishwashers, whose realized performance depends jointly on consumer adoption and enterprise compliance.
China provides a particularly informative setting because the China Energy Label operates alongside mandatory minimum energy performance standards and complementary incentive programs. Evidence from national survey data indicates that labeling and incentive programs are associated with the adoption of high-efficiency air conditioners and washing machines, although their effects vary across regions and household characteristics [
10]. Online transaction data further show that efficiency grades influence appliance choice, but this relationship is moderated by product price and consumers’ intertemporal decisions [
11]. Quasi-experimental evidence on air-conditioner standards suggests that tighter efficiency requirements may be partly offset by increases in use intensity or frequency [
12], while market data following a standard revision show changes in the price premium attached to efficiency grades [
13]. Recent household-level studies likewise report appliance-specific and heterogeneous effects of labeling on electricity consumption, including possible rebound effects [
14,
15]. These findings indicate that China’s standards-and-labeling system affects purchasing, market valuation, and post-purchase use, with outcomes varying across products and households.
Existing research has predominantly estimated the theoretical energy-saving potential of efficiency policies through engineering-based approaches, combining per-unit consumption differences, sales projections, lifetime distributions, and stock-flow accounting to compute savings under idealized conditions [
16,
17,
18,
19,
20]. Such models establish a valuable technical upper bound, but typically assume frictionless market uptake, thereby overlooking the behavioral and organizational dynamics that govern actual implementation [
21,
22,
23]. They thus offer limited insight into why realized savings fall short, or how the shortfall is distributed across actors.
In parallel, a separate strand has examined real-world implementation constraints on the consumer and enterprise sides. On the demand side, label awareness and information design shape adoption [
4,
5,
24,
25,
26,
27]. Efficiency preferences and usage experience also matter [
28,
29,
30,
31]; for dishwashers, experience attributes such as cleaning performance, noise, and cycle time can outweigh efficiency considerations [
32]. On the supply side, studies examine how new requirements are absorbed into design, manufacturing, and compliance, highlighting technical, organizational, and cost barriers, especially for small- and medium-sized enterprises [
33,
34,
35,
36,
37,
38], where efficiency gains are tightly coupled with water use, washing time, and noise.
Taken together, these studies highlight the importance of both technical efficiency and implementation conditions. For dishwasher labeling in China, however, further work is needed to connect stock-based estimates of technical savings with consumer-side and enterprise-side constraints and the scope for policy intervention. This study therefore aims to quantify the gap between theoretical and realizable electricity savings, identify the constraints underlying this gap, and assess opportunities for its recovery. The analysis focuses on the transition from lower-efficiency to higher-efficiency products under GB 38383-2019 over 2020–2030.
Specifically, the study addresses three related questions. How large is the difference between theoretical electricity savings and the savings estimated to be realizable under existing implementation constraints? How do consumer-side and enterprise-side capacities differ, which factors limit each side, and which side constitutes the binding constraint? To what extent can interventions targeting individual factors, either side, or both sides recover the gap, and which interventions produce the greatest improvement under the specified scenarios?
To address these questions, the study combines a stock-flow model with survey-based indicators and policy scenario simulations. Consumer adoption and enterprise implementation are treated as necessary, non-substitutable conditions, represented through a weakest-link function. This framework links theoretical potential, constraint-adjusted realizable savings, and the recoverable share of the gap, providing a basis for diagnosing implementation barriers and identifying intervention priorities.
2. Methods
2.1. Research Framework
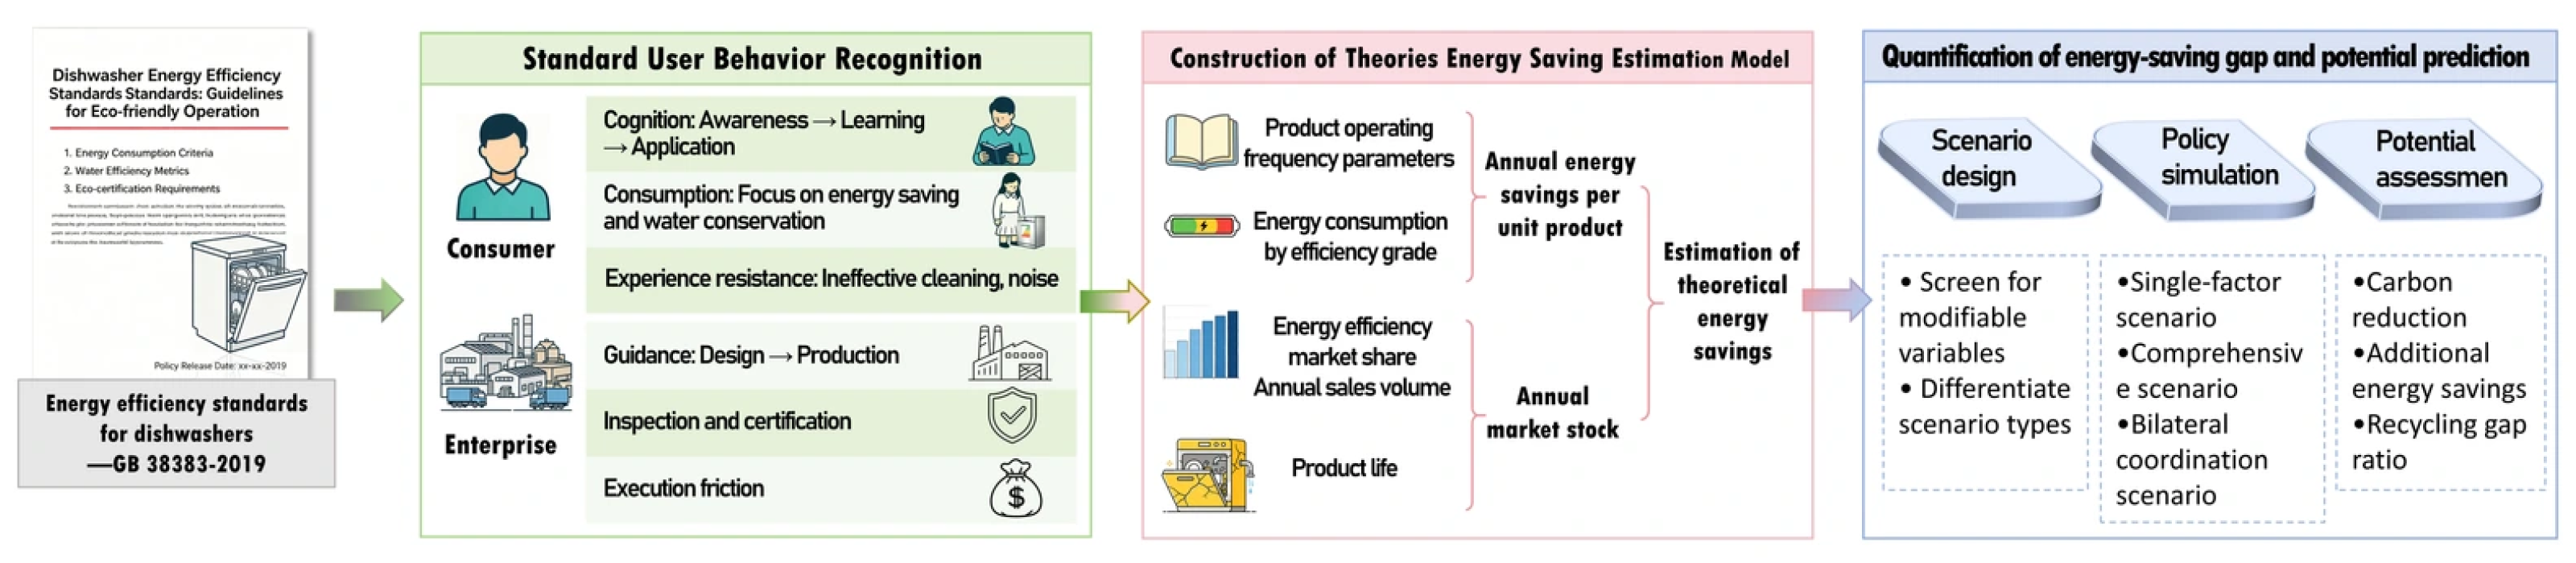
This study employs a four-component analytical framework to systematically evaluate the implementation effectiveness of dishwasher energy-efficiency labeling in China (
Figure 1).
The first component, a theoretical energy-saving model, establishes the technical upper bound of electricity savings under a label-driven market transition from lower-efficiency to higher-efficiency products within the GB 38383-2019 system, using a logistic stock-flow approach over the 2020–2030 horizon. The second component, a dual-sided implementation constraint indicator system, characterizes the multi-dimensional behavioral and organizational frictions on the consumer and enterprise sides, drawing on primary survey data from 199 consumers and 191 enterprises. The third component, a realization rate model, integrates the two sides through the weakest-link principle (R = min(Ccomp, Ecomp), where Ccomp and Ecomp denote the composite scores of consumer-side and enterprise-side constraints, respectively) to estimate the realized share of the theoretical potential and to identify the binding side of the market. The fourth component, a policy scenario simulation, examines how different single-side, comprehensive, and bilateral intervention intensities reshape the realization rate, thereby quantifying the policy-recoverable share of the implementation gap.
Together, these four components form an integrated analytical chain that traces dishwasher efficiency outcomes from theoretical potential, through realized savings, to recoverable potential, providing a structured basis for evaluating where the current labeling system underperforms and where targeted interventions can most effectively close the implementation gap.
The realization rate (R) in this framework requires a clear interpretation. It is not a measured energy-saving outcome obtained from metered electricity data, but an index of the degree to which the theoretical potential can be attained. Specifically, the engineering-based theoretical potential represents the savings achievable under idealized, frictionless conditions; R then discounts this potential according to the empirically observed constraints on the consumer and enterprise sides, yielding the constraint-adjusted share that can realistically be attained. The framework is therefore diagnostic rather than predictive: its purpose is to locate and quantify the implementation gap created by these dual-sided constraints, not to forecast the actual electricity savings the market will eventually deliver.
2.2. Theoretical Energy-Saving Model
2.2.1. Model Scope and Parameter Justification
This component estimates the theoretical upper bound of electricity savings under a label-driven market transition, in which all newly sold dishwashers within the chosen scope are assumed to enter the market as higher-efficiency products under the GB 38383-2019 labeling system. This formulation deliberately abstracts away from behavioral and organizational frictions, so that the resulting estimate represents the maximum savings physically attainable rather than the savings expected to be realized in practice. The realized outcome and the gap between the two are addressed in the subsequent components.
The temporal scope spans 2020 to 2030. Historical sales data for 2020–2023 are obtained from GfK China market intelligence, while sales for 2024–2030 are projected from the historical trend (see
Section 2.2.3); this projection horizon to 2030 is consistent with China’s medium-term residential energy and carbon-peaking timeline. The 15-place-setting dishwasher is selected as the representative product, as large-capacity models (15-place-setting and above) have become the fastest-growing segment in the Chinese market, reflecting a clear consumer shift toward higher-capacity products [
39].
To ensure that the engineering parameters are grounded in published evidence and industry practice, the reference scenario was defined using market reports, established energy-consumption benchmarks, and technical interviews conducted in 2024 with engineers from leading dishwasher manufacturers. The 15-place-setting model was selected as the reference configuration, reflecting the market trend towards larger-capacity dishwashers [
39]. The model adopts one washing cycle per operating day and 280 operating days per year. The annual usage benchmark of 280 cycles is drawn from Commission Delegated Regulation (EU) No 1059/2010 [
40] and has been applied in previous engineering research [
41]. Industry consultations further indicated that domestic dishwasher manufacturers widely use this benchmark as a practical reference value for annual usage in engineering estimates. These parameters define a baseline reference scenario rather than a deterministic prediction, and their influence on the cumulative estimate is examined through the sensitivity analysis in
Section 2.2.4.
2.2.2. Energy Efficiency Grades and Unit Savings
The energy-efficiency performance of dishwashers under the GB 38383-2019 labeling system is governed by the Energy Efficiency Index (EEI), a normalized metric where lower numerical values indicate higher operational efficiency. The standard classifies products into five grades, with per-cycle energy consumption increasing monotonically from the most efficient to the least efficient grade. For 15-place-setting dishwashers, the per-cycle energy consumption
Ecycle (kWh) is determined by the EEI as defined in QB/T 1520-2023 [
42]:
where
ps denotes the place-setting capacity (
ps = 15 for the representative product). Substituting the EEI thresholds specified in GB 38383-2019, the resulting per-cycle energy consumption values for the 15-place-setting representative product are summarized in
Table 1.
The reference scenario in this study compares lower-efficiency products representative of the market prior to full implementation of the labeling system with higher-efficiency products that meet the upgraded efficiency level. Both per-cycle consumption values are derived from the GB 38383-2019 thresholds following the calculation method specified in QB/T 1520-2023. On this basis, the representative per-cycle energy consumption is reduced from 1.380 kWh to 0.863 kWh, corresponding to a 37.5% reduction.
Combining the per-cycle reduction with the typical usage intensity defined in
Section 2.2.1 (
Tday = 1 cycle per day,
Dyear = 280 days per year), the annual energy saving per unit Δ
E is calculated as:
where
Eold and
Enew are the per-cycle energy consumptions of the lower-efficiency and higher-efficiency products, respectively. Substituting the values from
Table 1, the resulting per-unit annual saving is Δ
E ≈ 144.9 kWh. This per-unit technical saving, when aggregated across the in-use stock developed in
Section 2.2.3, generates the cumulative theoretical potential of the label-driven market transition.
2.2.3. Sales Projection, Product Lifetime, and Stock-Flow Aggregation
Total in-use stock in each year is constructed by combining annual sales with a product-retirement function, following the stock-flow accounting approach widely used in appliance and product-lifecycle modeling [
20,
43]. Historical sales data for 2020–2023 are obtained from GfK China market intelligence [
39], and sales for 2024–2030 are projected at a baseline annual growth rate of 3%, which approximates the average growth observed in the historical period; its sensitivity to alternative growth assumptions is examined in
Section 2.2.4.
Product retirement follows a logistic retirement function, an approach consistent with the lifetime-distribution models commonly applied to durable appliances [
20,
44]. This function captures the non-uniform replacement pattern of durable goods—low retirement rates in early years, accelerated retirement in mid-life, and saturation in later years. The cumulative retirement rate of products
t years after sale is:
where
S(
t) is the cumulative retirement rate after
t years,
μ = 8 years is the time of peak retirement, and
σ = 2 is the scale parameter, calibrated based on engineering interviews indicating peak retirement between years 7 and 9 [
44]. The number of products sold in year
t that remain in use in year
y is the share that has not yet retired:
where
Vt is sales in year
t. The total in-use stock in year
y, the annual energy saving, and the cumulative savings by year
Y are, respectively:
where
Y = 2030 is the endpoint of the analysis. The cumulative calculation aggregates the annual savings of all in-use cohorts from 2020 through 2030, with sales for 2024–2030 obtained from the projection described above. It should be emphasized that
Etotal represents a theoretical upper bound rather than a forecast of realized outcomes, as it abstracts away from the consumer adoption and enterprise implementation frictions examined in the subsequent components.
2.2.4. Sensitivity Analysis
To examine how the central estimate responds to alternative parameter choices, a one-at-a-time deterministic sensitivity analysis is performed, in which each of four parameters is varied individually across a plausible range while the others are held at their reference values: sales growth rate (1–5%; reference 3%), median retirement age μ (6–10 years; reference 8), daily cycles Tday (0.8–1.2; reference 1.0), and annual operating days Dyear (250–300; reference 280). The lower and upper bounds define a set of alternative reference scenarios rather than statistical distributions. The deterministic nature of this analysis is appropriate here because the perturbed parameters represent engineering and usage assumptions rather than random variables, and the policy interpretation in subsequent sections relies on the directional ordering of parameters rather than on probabilistic inference.
2.3. Dual-Sided Implementation Constraint Indicator System
2.3.1. Survey Design and Data Processing
Online questionnaires were administered between October and November 2024, yielding 199 valid responses from consumers and 191 from enterprise representatives. Respondents were recruited through online distribution rather than random selection from a predefined sampling frame; accordingly, the surveys used a non-probability sampling design. The survey records indicate that both samples covered northern and southern China, with broadly similar numbers of responses across the two regions (
Table 2). The survey data provide empirical inputs for constructing consumer- and enterprise-side implementation capacity indicators, identifying constraints on the realization of energy-saving potential, and assessing the potential effects of interventions under the specified scenarios.
Two parallel survey instruments were designed to capture the dual-sided structure of implementation constraints, each comprising 18 items distributed across three dimensions. The consumer instrument measures cognitive accessibility (C1, 6 items), efficiency preference (C2, 2 items), and experience-related barriers (C3, 10 items aggregated into three thematic categories). The enterprise instrument measures implementation embeddedness (E1, 6 items), compliance capacity (E2, 3 items), and implementation friction (E3, 9 items). All items were pilot-tested with industry experts before deployment.
To ensure comparability, all raw responses were normalized to the [0, 1] interval. C1, C2, E1, and E2 are positively oriented (higher values indicate stronger adoption or implementation capacity), while C3 and E3 are barrier-oriented (higher values indicate greater friction). To ensure that all dimensions contribute in the same direction to the composite scores, C3 and E3 are reversed at the composite stage (operationalized as 1 − C3 and 1 − E3), so that higher composite scores uniformly indicate stronger realization capacity.
2.3.2. Consumer-Side Dimensions
For all multi-item dimensions, PCA suitability was first verified through standard diagnostic procedures (KMO measure and Bartlett’s test of sphericity) [
45], with representative diagnostics reported for C1 as an illustrative case. Cognitive accessibility (C1) consists of six items; the KMO measure is 0.847 and Bartlett’s test is significant (
p < 0.001), confirming suitability for PCA. Two principal components are retained, explaining 70.08% of the variance—the first capturing general standard awareness, the second distinguishing active participation from passive knowledge. Based on the normalized component loadings:
Efficiency preference (C2) contains only two items and is computed as their simple average:
Experience-related barriers (C3) aggregate ten items into three categories; because the number of aggregated variables is small, PCA is used primarily for weight determination, and all three components are retained:
The comfort barrier carries the highest weight (0.501), reflecting that operational noise is the most influential experience factor, followed by cleaning performance (0.299) and the efficiency-related barrier (0.200).
2.3.3. Enterprise-Side Dimensions
Implementation embeddedness (E1) includes six items; three retained components explain 70.56% of the variance:
where E1
design, E1
prod, and E1
comply denote front-end design embedding, production embedding, and compliance-verification embedding, respectively; the largest weights fall on production and compliance integration. Compliance capacity (E2) includes three items, with all three components retained:
where E2
internal denotes internal assurance and E2
external denotes external supervision; internal organizational arrangements carry over 95% of the weight. Implementation friction (E3) includes nine items. An initial PCA shows that the first three components explain only 51.42% of the variance, indicating a heterogeneous set of obstacles rather than a single latent construct. E3 is therefore decomposed into three theoretically grounded sub-dimensions—technical-cost friction (53%), institutional-cognitive friction (41%), and market friction (6%)—and combined as:
This two-stage construction is a deliberate methodological choice rather than an analytical limitation: the low first-pass variance confirms the a priori expectation that enterprise frictions are multi-source and should not be collapsed into a single latent factor. Within the institutional-cognitive sub-dimension, standard-quality variables (coverage, test method, and technical clarity) account for 96.4% of the weight, while subjective cognitive barriers contribute only 3.6%. This indicates that enterprise-side friction is driven primarily by the design quality of the standard and associated retrofitting costs, rather than by insufficient awareness or institutional misfit.
2.3.4. Composite Scores and Binding Constraint
Second-order PCA determines the weight of each sub-dimension within the composite scores (consumers: C1 = 0.34, C2 = 0.26, C3 = 0.40; enterprises: E1 = 0.41, E2 = 0.27, E3 = 0.32). Applying the directional reversal of the barrier-oriented dimensions (C3 and E3), the composite scores are:
where higher scores indicate stronger realization capacity. The sample mean values are
Ccomp = 0.559 and
Ecomp = 0.657, indicating that consumer-side capacity is systematically lower than enterprise-side capacity. This asymmetry identifies the consumer side as the binding constraint of the implementation gap, which structures the realization rate analysis and the policy scenario simulation in
Section 2.4.
2.4. Realization Rate Model and Policy Scenario Framework
2.4.1. Realization Rate Model
The realized share of the theoretical potential depends jointly on consumers and enterprises, which operate as sequential gates rather than additive contributors: theoretical potential is realized only when both sides act on it. The realized share is therefore bounded by the weaker of the two sides, formalized through the weakest-link principle—a logic established in the analysis of jointly produced outcomes, where the aggregate result is governed by the least-performing input [
46]:
where
R ∈ [0, 1] is the realization rate. The realized cumulative savings and the implementation gap are
Erealized =
R·
Etotal and
Egap = (1 −
R)·
Etotal. With
Ccomp = 0.559 and
Ecomp = 0.657, the baseline realization rate is
R = 0.559, identifying the consumer side as the binding constraint.
2.4.2. Policy Scenario Simulation Framework
To assess how much of the gap can be recovered, a policy scenario simulation perturbs the six modifiable indicators (C1–C3, E1–E3) under structured intervention regimes. For each indicator, three intensities are defined: a conservative 10%, a moderate 20%, and a high-intensity 30% improvement relative to baseline. The 10–30% range reflects realistic policy feasibility while avoiding the unrealistic assumption of complete elimination of frictions. Three families of regimes are simulated: single-factor scenarios (one indicator at a time, isolating marginal contributions), comprehensive scenarios (all three indicators on one side, capturing side-level packages), and bilateral scenarios (all six indicators jointly, representing the maximum recoverable potential under coordinated interventions).
Under each scenario, the perturbed indicators yield a new realization rate
R′, and the gap recovery ratio is
η, with the additional cumulative savings given by Δ
Erec. Together,
η (relative) and Δ
Erec (absolute) provide a paired metric for cross-scenario comparison and policy interpretation.
3. Results
3.1. Theoretical Energy-Saving Potential
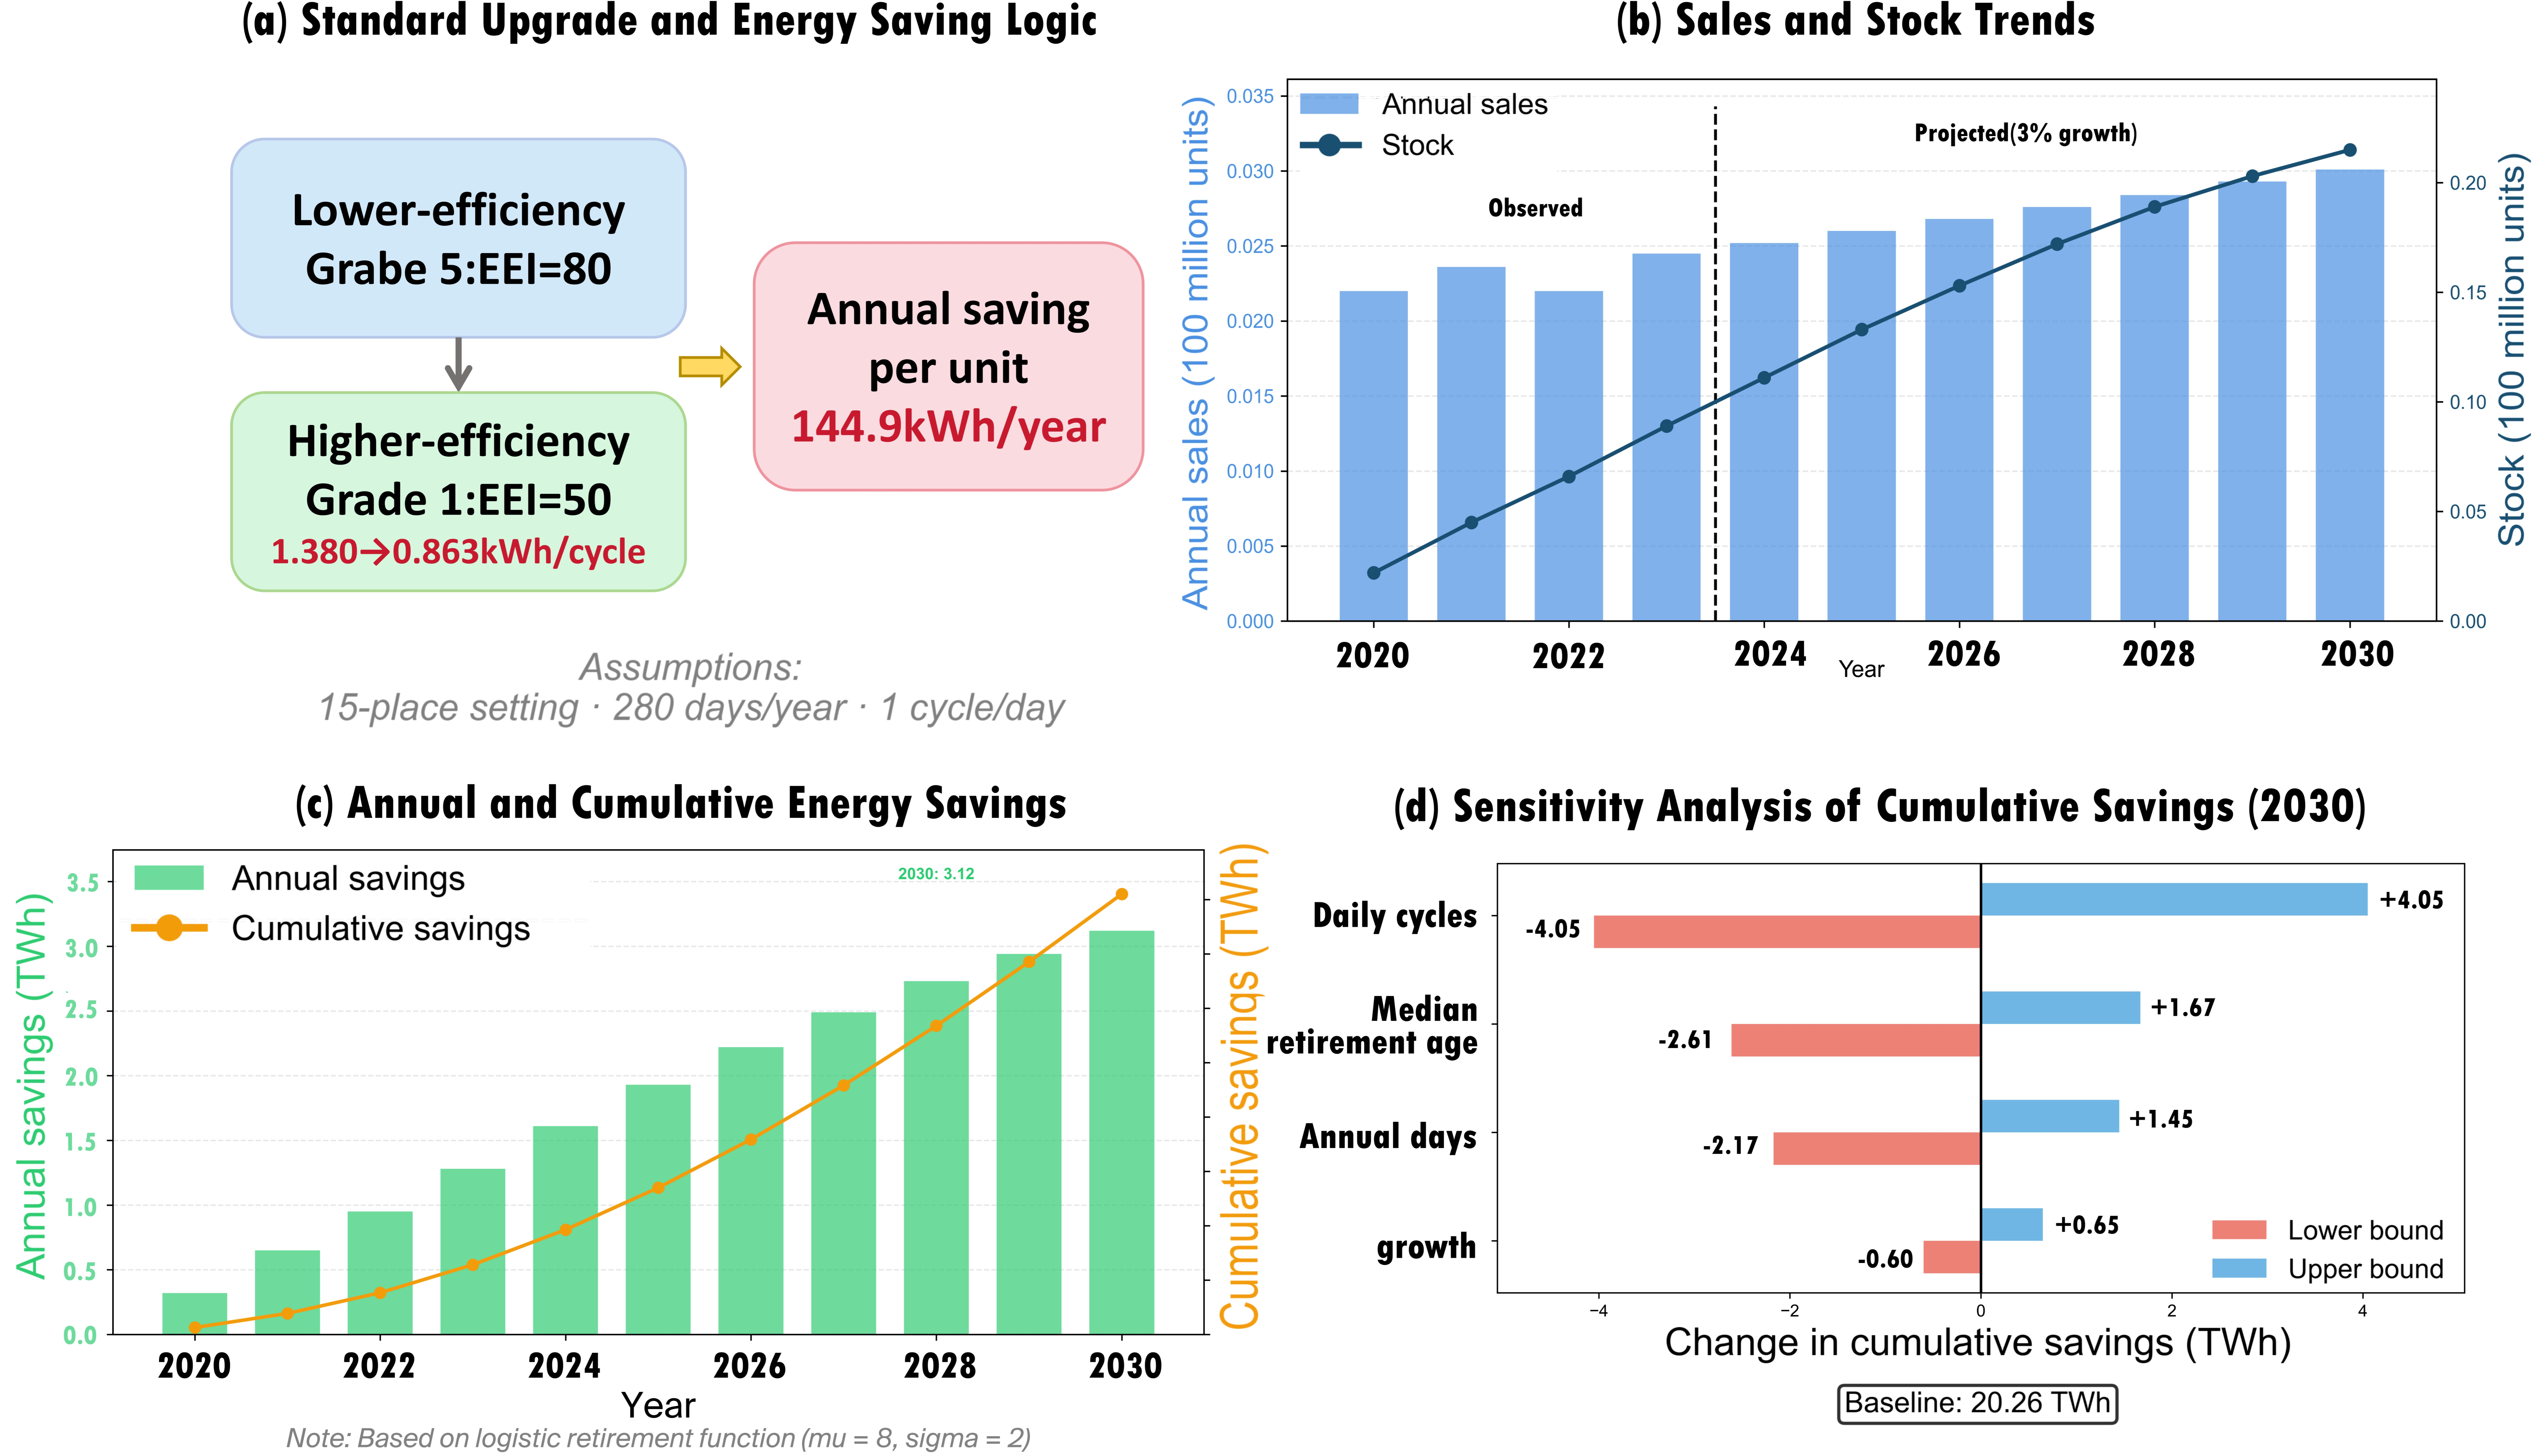
At the individual product level, the transition from lower-efficiency to higher-efficiency products under the GB 38383-2019 labeling system yields a notable reduction in per-cycle energy consumption, from 1.380 kWh to 0.863 kWh, a 37.5% reduction. When aggregated across the typical household usage of one cycle per day over 280 annual operating days, this translates into an annual saving of approximately 144.9 kWh per unit (
Figure 2).
Despite these product-level gains, a persistent divergence exists between annual sales and total in-use stock. While annual sales rise modestly from 2.2 million units in 2020 to about 3.0 million units by 2030 under the 3% baseline growth trajectory, the cumulative in-use stock builds up to roughly 21.5 million units over the same period. This divergence reflects the stock-accumulation effect inherent to durable household goods: because dishwashers have a median service life of around eight years, early sales cohorts continue to occupy the operating stock and shape macro-level energy consumption well beyond the year of purchase.
Annual theoretical savings follow an upward trajectory, growing from about 0.32 TWh in 2020 to approximately 3.12 TWh in 2030, with cumulative theoretical savings reaching approximately 20.26 TWh by the end of 2030. The shape of this trajectory is governed primarily by the logistic retirement function, with later sales cohorts continuing to generate compounding savings over their remaining service life within the analytical horizon.
Sensitivity analysis indicates that the central estimate is bounded within a relatively narrow range. As shown in
Figure 2d, daily cycle frequency is the most influential parameter—a ±20% perturbation in daily cycles produces a near-proportional ±20% change in cumulative savings (16.21–24.31 TWh). The median retirement age and annual operating days exhibit moderate sensitivities, with cumulative savings ranging from 17.65 to 21.93 TWh and from 18.09 to 21.71 TWh, respectively, while the sales growth rate has the smallest proportional effect (19.66–20.91 TWh). Across the four-parameter sensitivity range, cumulative theoretical savings by 2030 remain within approximately 16.2 to 24.3 TWh, indicating that while precise estimates depend on usage assumptions, the order of magnitude of the theoretical potential is stable.
3.2. Assessment of Dual-Sided Implementation Constraints
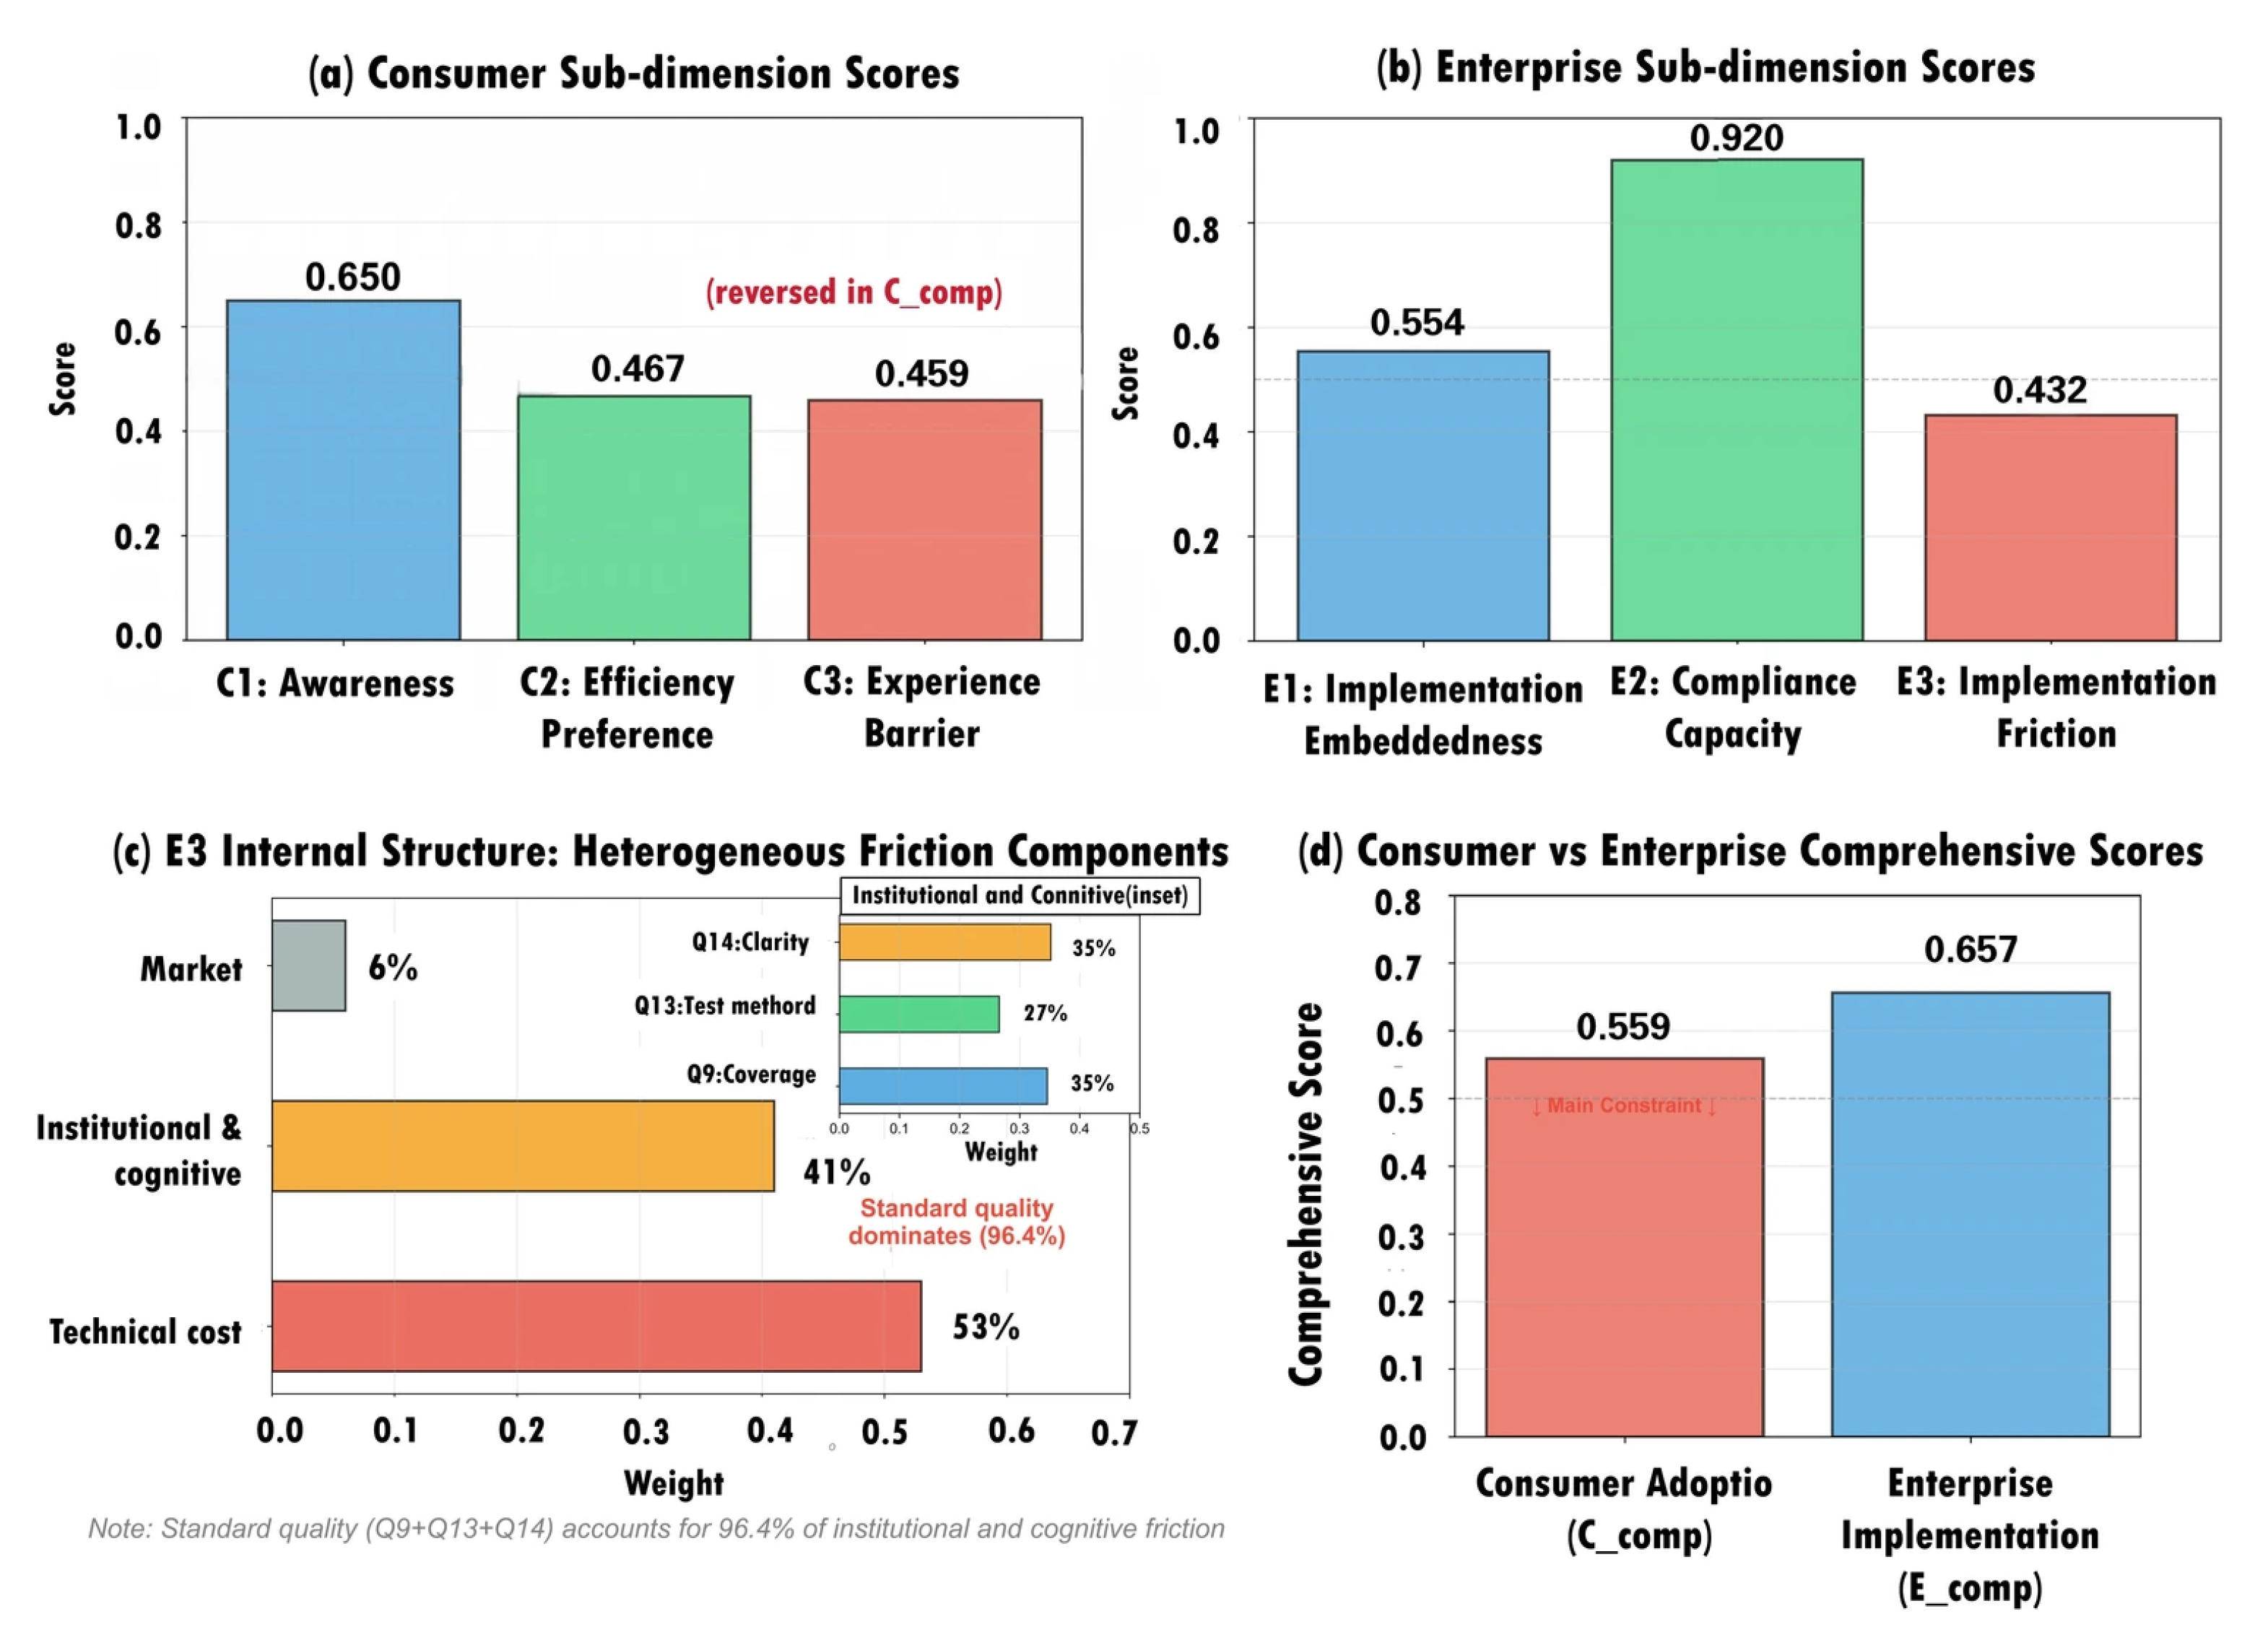
A detailed evaluation of the dual-sided indicator system reveals notable asymmetries between demand-side adoption and supply-side implementation capacities (
Figure 3). On the consumer side, performance across the three sub-dimensions is uneven. While general standard awareness maintains a moderate level (C1 = 0.650), subjective efficiency preference is relatively low (C2 = 0.467), suggesting that less than half of surveyed consumers actively prioritize energy or water conservation attributes during their purchasing decisions. The experience barrier (C3 = 0.459) also remains substantial; because it carries the highest weight (0.40) within the consumer composite, the data suggest that experience-related issues—cleaning performance, operational noise, and extended cycle times—appear to be the most weighted practical constraints on consumer adoption.
The enterprise side exhibits a different structural pattern. Compliance capacity (E2 = 0.920) is close to its upper bound, indicating that enterprises have largely adapted their core internal processes to satisfy the labeling requirements. However, this does not imply that supply-side friction is absent: moderate room for improvement remains in implementation embeddedness (E1 = 0.554) and overall implementation friction (E3 = 0.432), suggesting that while enterprises can pass inspections, full integration of efficiency into design and manufacturing remains incomplete. A granular decomposition shows that enterprise friction is led by technical-cost friction (53%) and institutional-cognitive friction (41%); within the latter, 96.4% of the weight relates to objective standard-quality variables rather than subjective cognitive barriers.
A direct comparison of the two agents indicates that the consumer side functions as the binding constraint within the current baseline scenario. The consumer composite score (Ccomp = 0.559) is lower than the enterprise composite score (Ecomp = 0.657); this 0.098 difference provides quantitative evidence that the persistent implementation gap is primarily shaped by demand-side behavioral constraints, rather than by a lack of enterprise manufacturing readiness.
3.3. Realization Rate and Implementation Gap
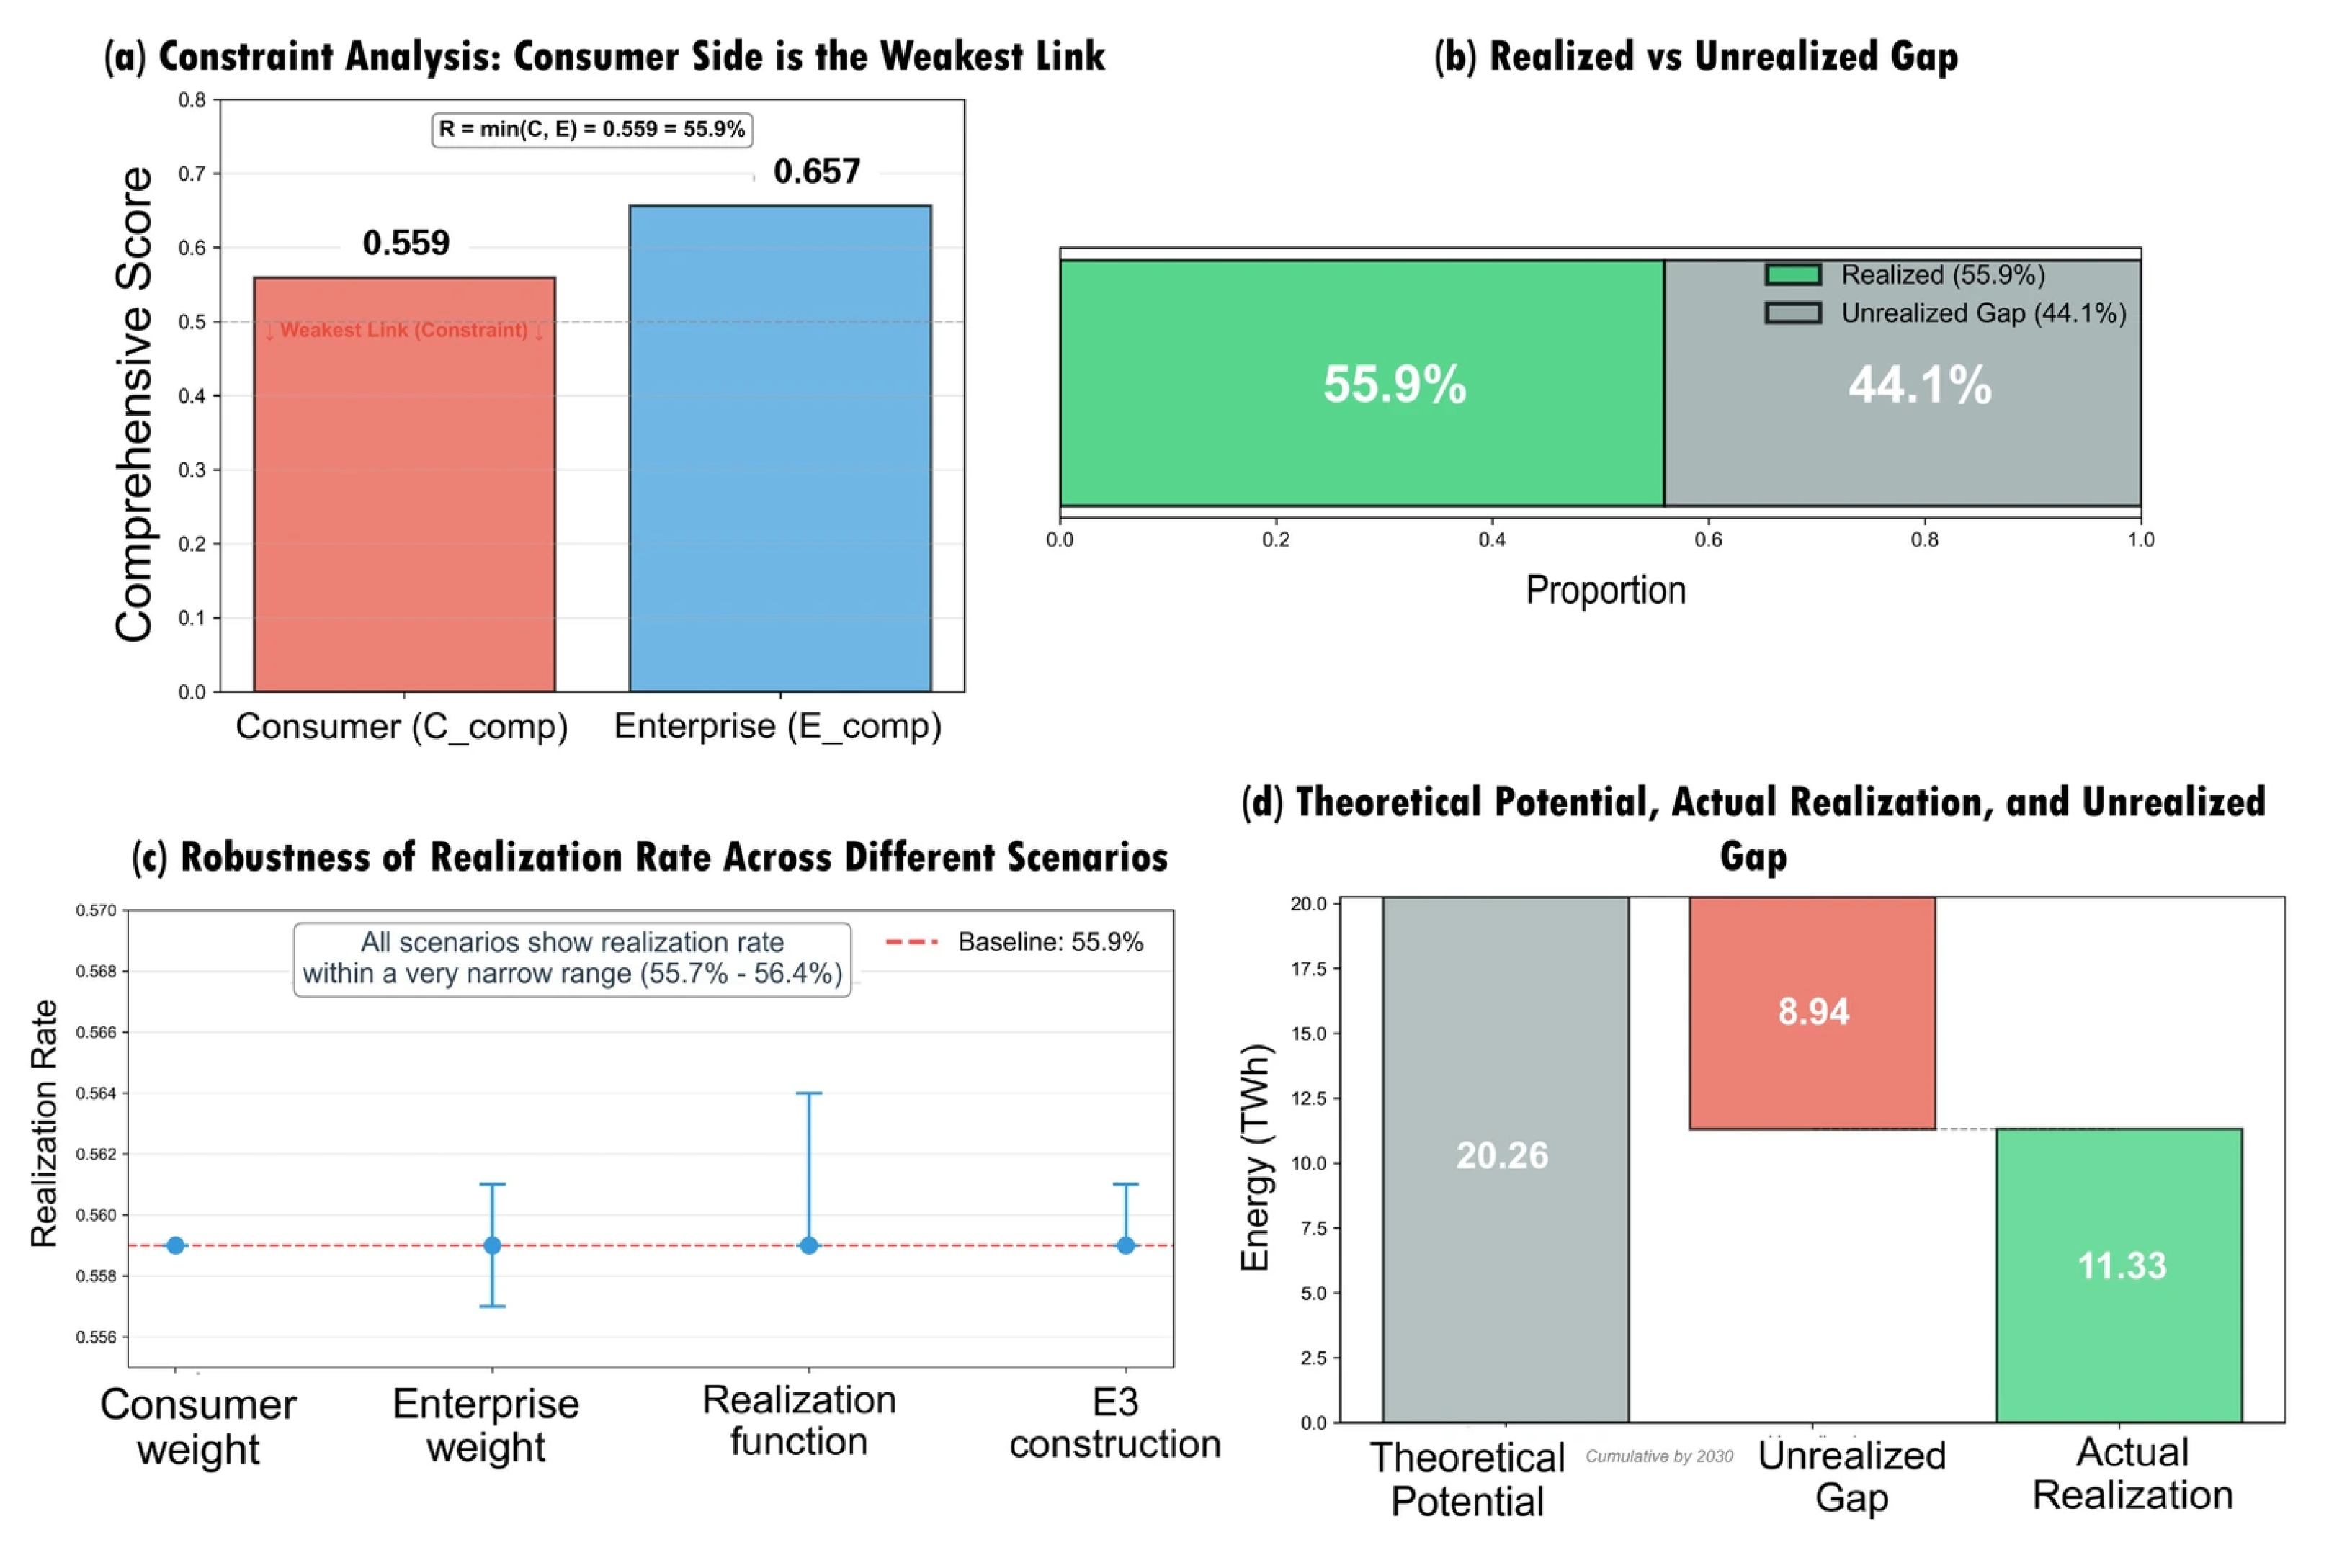
The overall realization rate of the label-driven transition is governed by the weakest-link principle, where overall system effectiveness cannot exceed the capacity of its most constrained actor. Because the consumer composite score (C_comp = 0.559) is lower than the enterprise score (E_comp = 0.657), the consumer side determines the realization rate, keeping it at 55.9% (
Figure 4).
Consequently, this constrained realization rate implies that out of the theoretical potential projected by engineering models, 55.9% is estimated to be realizable under current conditions. This result indicates an implementation gap of 44.1%. It should be noted that this implementation gap is not treated as a statistical error; it represents the potential scope for future targeted policy interventions and behavioral improvements.
The robustness of these findings is examined across a set of alternative analytical specifications. Regardless of whether we apply different weighting assumptions during the PCA stage, alter the mathematical function choices (switching from the strict minimum function to broader arithmetic or geometric means), or vary the internal construction methodologies of the friction variables, the calculated realization rate ranges from 55.7% to 56.4%. These checks indicate that the identified consumer-driven bottleneck is a consistent feature across the reported specifications.
Translating these percentages into absolute metrics shows the corresponding absolute values. Of the 20.26 TWh of theoretical cumulative savings projected by the year 2030, the realization model estimates that 11.33 TWh is realizable. This leaves an estimated implementation gap of 8.94 TWh.
3.4. Policy Scenario Simulation
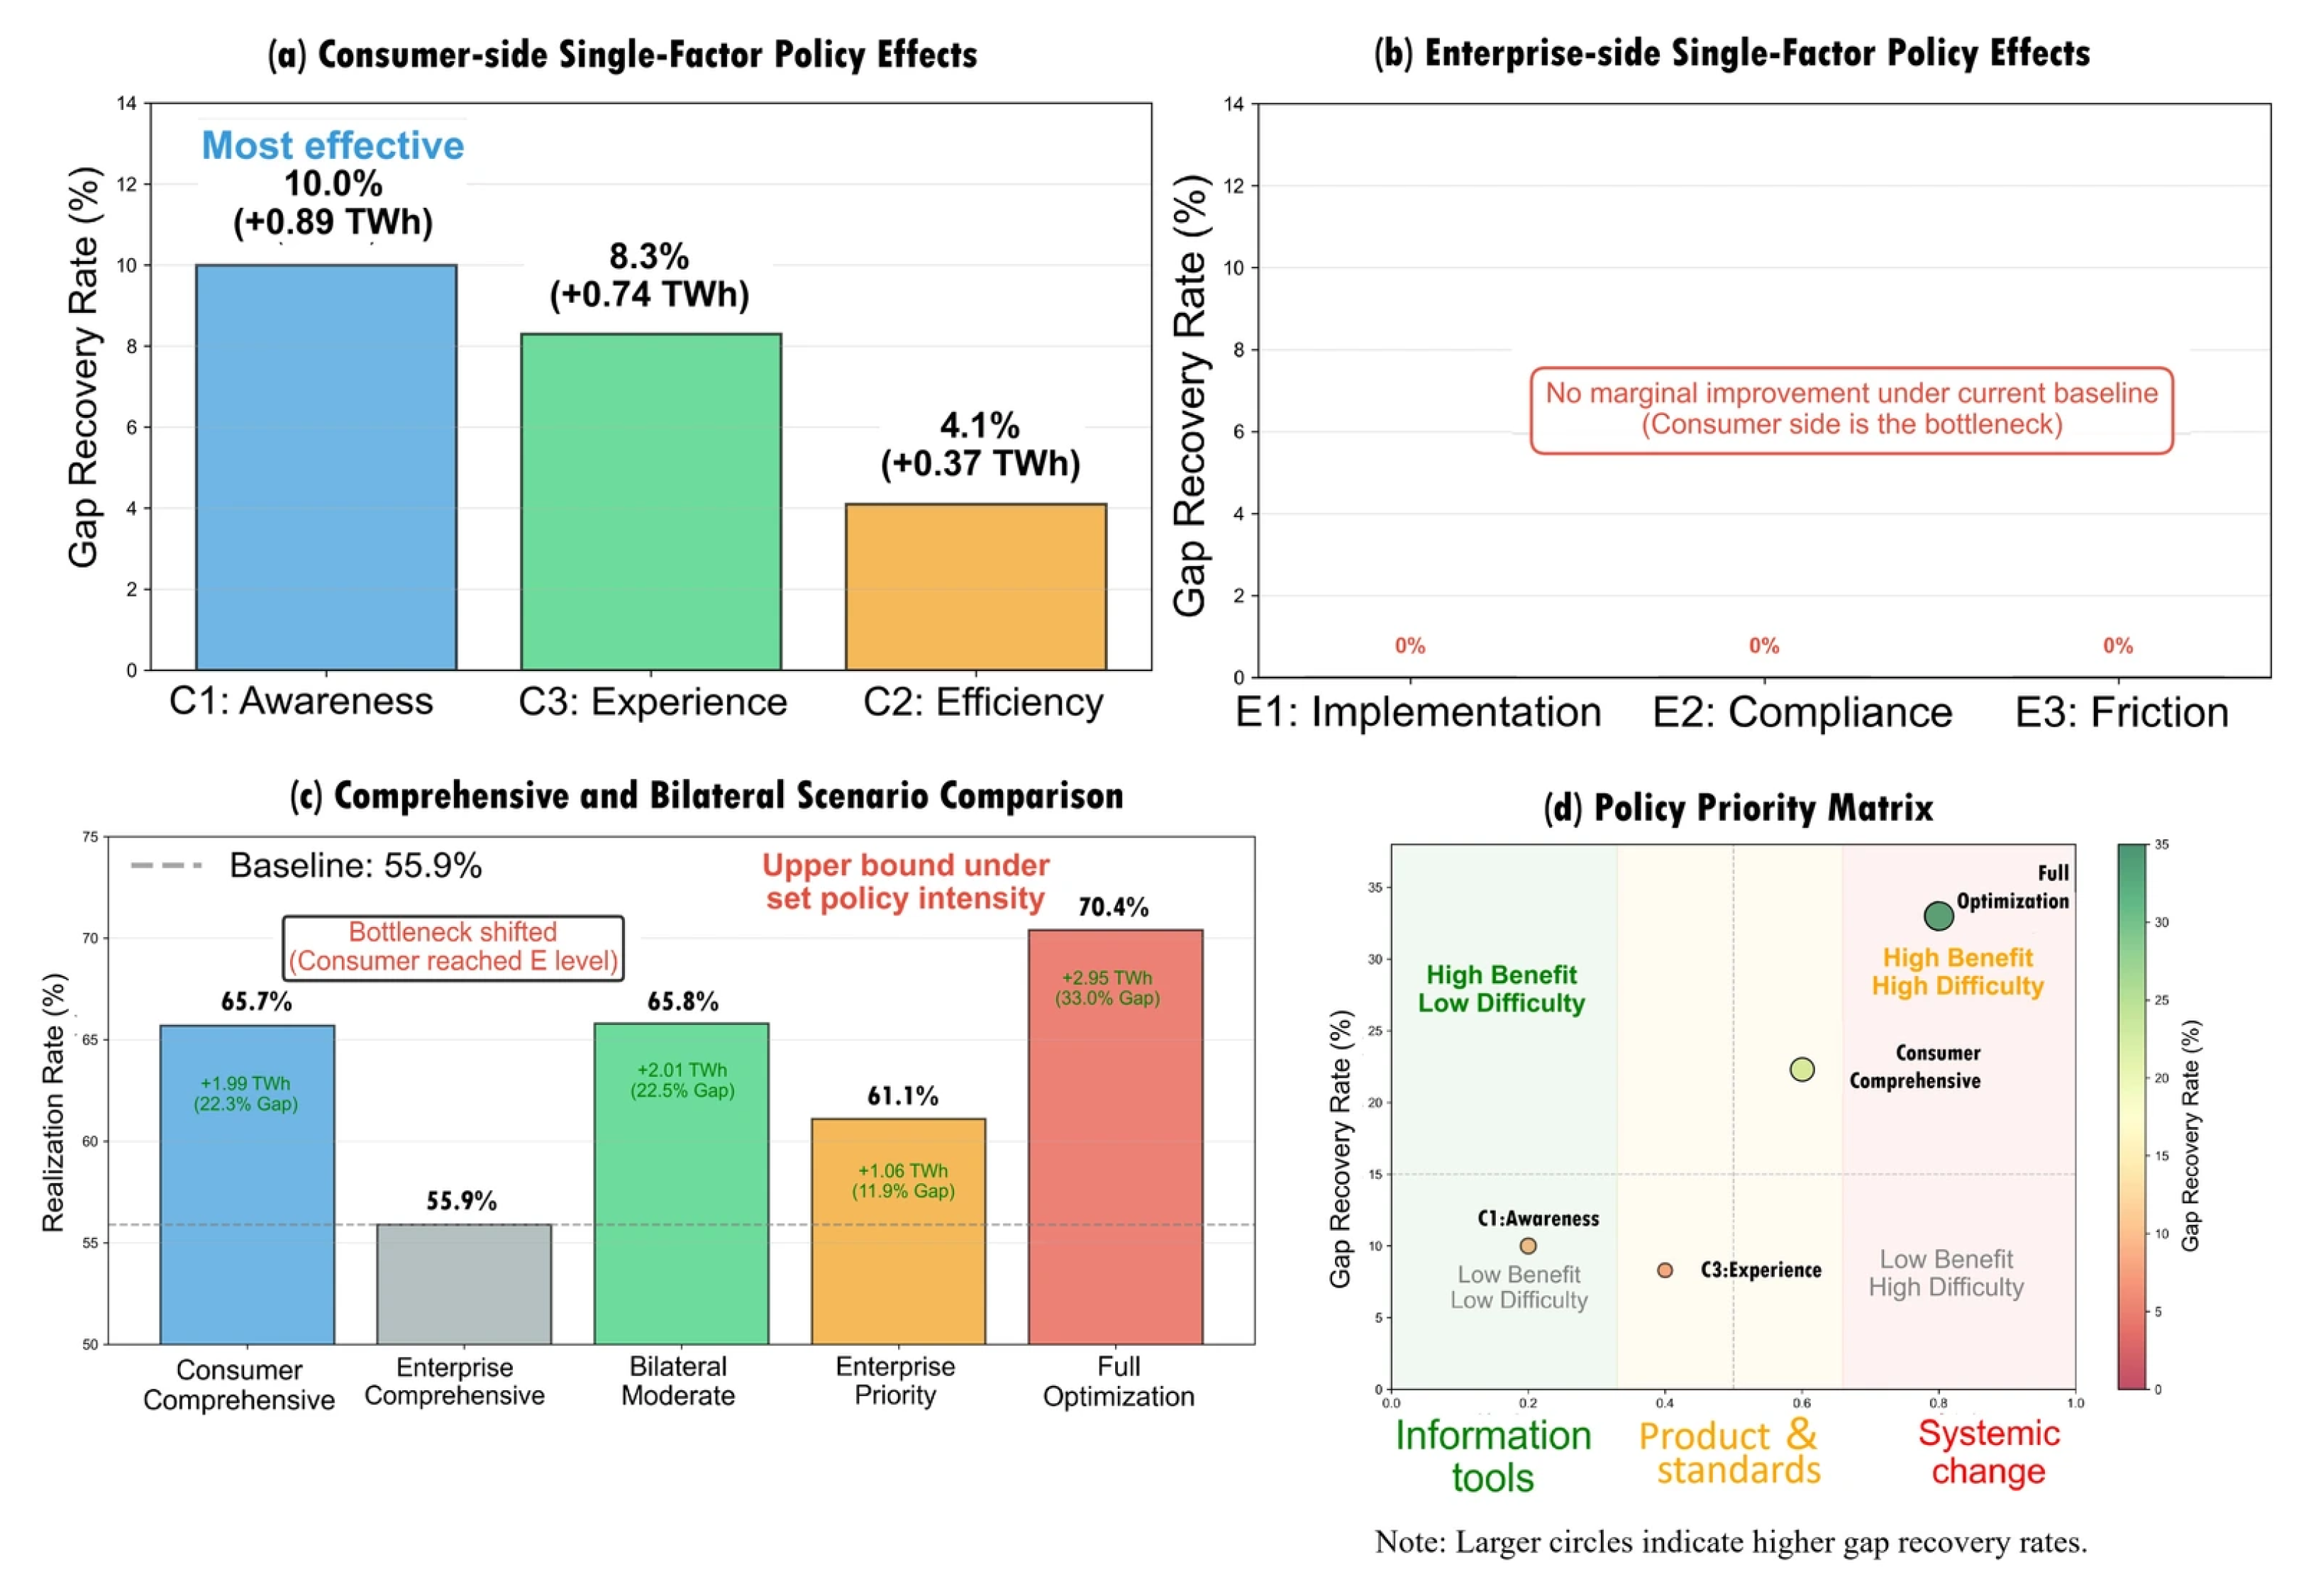
For single-factor policy interventions on the consumer side, awareness strengthening (C1) is the most effective tool. Under a modeled moderate intensity scenario—representing a 20% functional improvement in baseline consumer awareness—this specific intervention recovers 10.0% of the entire implementation gap, yielding 0.89 TWh in additional modeled energy savings. By comparison, reducing experience barriers (C3) recovers 8.3% of the gap, while improving subjective efficiency preferences (C2) recovers 4.1% (
Figure 5). This comparison suggests that under current market constraints, directly enhancing a consumer’s access to and understanding of the energy standard is associated with the highest modeled benefit among the compared interventions.
By contrast, executing single-factor policy improvements on the enterprise side generates no marginal improvement in overall realization under current baseline conditions. Even if policymakers improve implementation embeddedness (E1), compliance capacity (E2), or reduce institutional friction (E3), the overall system realization rate remains fixed at 55.9%. This outcome is a direct implication of the weakest-link logic: strengthening an agent that is already structurally stronger than its counterpart does not change the realization rate until consumer-side constraints are relaxed.
Shifting to a comprehensive consumer-side improvement scenario—where all three consumer dimensions are improved simultaneously—increases the overall realization rate to 65.7%, recovering 22.3% of the outstanding gap. A threshold effect is observed here: applying moderate versus high policy intensities to the consumer side yields the same result. This occurs because once the consumer composite score (C_comp) marginally exceeds the unchanged enterprise score (E_comp), further consumer-side improvement is constrained by enterprise-side capacity. Similarly, deploying a bilateral moderate improvement strategy achieves a realization rate of 65.8%, a figure slightly higher than isolated consumer improvements. This indicates that simultaneous enterprise support yields limited marginal gains as long as the consumer remains the binding constraint.
The theoretical upper limit of policy intervention is explored via the full bilateral optimization scenario, which assumes maximum high-intensity, synchronized improvements across both the consumer and enterprise domains. Under these idealized conditions, the overall realization rate increases to 70.4%, recovering 33.0% of the implementation gap and yielding 2.95 TWh in additional energy savings. The policy priority matrix plots the interventions across dual axes of projected benefit versus implementation difficulty. This matrix places C1 awareness strengthening in the high-benefit, low-difficulty quadrant, indicating it as a candidate priority under the assumed difficulty ratings. Conversely, comprehensive bilateral optimizations, while offering the largest modeled total benefits, reside in the high-difficulty quadrant, requiring coordination across both sides.
4. Discussion and Limitations
4.1. Why the Theoretical Potential Has Not Been Realized
The results indicate a sizable divergence between the theoretical energy-saving potential of label-driven efficiency improvement (approximately 20.26 TWh of cumulative savings by 2030) and the share of that potential realizable under current conditions (approximately 55.9%, or about 11.33 TWh). The remaining 44.1%—an implementation gap of about 8.94 TWh—is not a measurement artefact of the framework but a structural feature of the socio-technical system through which the labeling system operates. This section discusses three structural reasons underlying this divergence.
Stock inertia and the limits of theoretical projections.
Engineering-based projections typically assume that high-efficiency products replace lower-grade stock without friction. In practice, dishwashers have a median service life of around eight years, and the in-use stock turns over only gradually. Even if all newly sold products were high-efficiency from the start of the horizon, a substantial share of the in-use stock during 2020–2030 would still consist of earlier cohorts. This stock-inertia mechanism implies that part of the theoretical potential is structurally unrealizable within the medium term, under the assumed replacement trajectory—consistent with the broader energy efficiency gap literature [
20].
The consumer side as the current binding constraint.
The weakest-link formulation treats consumer adoption and enterprise implementation as jointly necessary, non-substitutable conditions for realizing energy savings. Under this assumption, stronger capacity on one side cannot compensate for insufficient capacity on the other, so the lower composite score determines the realization rate. Arithmetic and geometric means allow partial compensation and therefore represent alternative assumptions about the relationship between the two sides. With
Ccomp = 0.559 and
Ecomp = 0.657, the consumer side functions as the binding constraint. This contrasts with the conventional assumption that supply-side compliance is the principal barrier to efficient policy outcomes—an assumption that motivates many enterprise-focused interventions. The underlying issue is not simply low awareness: experience-related barriers (C3 = 0.459) carry the largest weight in the consumer composite, with cleaning performance, operational noise, and extended cycle times as the dominant components, while efficiency preference (C2 = 0.467) is also relatively low and standard awareness (C1 = 0.650) is moderate. This also explains why isolated enterprise-side interventions yield no marginal improvement under current conditions [
4,
24,
27,
32].
Enterprise-side frictions: not currently binding, but not absent.
Although the enterprise side is not the binding constraint, this does not imply that supply-side frictions are absent. Compliance capacity is close to its upper bound (
E2 = 0.920), but implementation embeddedness (
E1 = 0.554) and overall friction (
E3 = 0.432) point to ongoing operational challenges. The decomposition indicates that enterprise friction is technical-cost (53%) and institutional-cognitive (41%) in nature, and that 96.4% of the institutional-cognitive component is attributable to features of the standard itself rather than to subjective managerial reluctance. If consumer-side constraints were relaxed in the future, these supply-side frictions would likely emerge as the next active boundary on the realization rate [
34,
35,
36].
4.2. What Determines the Recoverable Potential
Even under the highest-intensity policy scenario simulated within this study—a bilateral scenario with simultaneous, high-intensity interventions on both sides—only 33.0% of the current implementation gap is recovered. This scenario raises the total realization rate from its baseline of 55.9% to a modeled value of 70.4%. This means that 67.0% of the implementation gap remains unrecovered under the specified modeled policy intensity. It should be noted that this remaining 67.0% is not permanently unrecoverable under all conditions; rather, it represents the share of the gap that is not mitigated within the timeframes, technical constraints, and policy intensities modeled in this baseline scenario. This bounded recovery is consistent with the gradual turnover of the durable-goods market. Behavioral habits and purchasing decisions may change slowly. Even when provided with information campaigns and high-performance models, some households may delay adopting new technologies, often waiting until their older units require replacement before re-entering the market [
22,
23].
Further analysis of the enterprise constraint structure informs supply-side policy design. While the enterprise compliance score (E2) is high, the relatively moderate scores in implementation embeddedness (E1 = 0.554) and implementation friction (E3 = 0.432) indicate that manufacturers still face significant operational challenges. Our detailed decomposition of this friction indicates that technical-cost and institutional-cognitive factors carry the largest weights. Specifically, 96.4% of the institutional friction is associated with standard-quality variables—including testing methods, certification timelines, and technical clarity—rather than subjective cognitive factors [
33,
34,
35,
36,
37]. These findings support technical guidance and implementation assistance addressing the standard-related difficulties identified in the survey. Consumer-side priorities include clearer label information and measures addressing cleaning performance, noise, and cycle duration, reflecting the indicator structure and scenario comparisons. Within the weakest-link framework, enterprise-side support becomes increasingly relevant as consumer-side constraints are relaxed.
4.3. Limitations
Several limitations should be acknowledged. First, the surveys are used to examine how consumer- and enterprise-side frictions jointly constrain savings realization, rather than to produce nationally representative estimates of these frictions. The capacity estimates and the identification of the binding side are based on the current survey data and model assumptions. Because the surveys do not track changes before and after interventions, they do not directly verify the effects of the simulated policy measures. Second, the 3% baseline sales growth rate reflects the average historical growth rather than a forecast, and the absolute level of cumulative savings will move with alternative trajectories, as documented in the sensitivity range. Third, the analysis focuses on the 15-place-setting dishwasher, which may not capture heterogeneity in other product segments. Fourth, the simulated intervention intensities are stylized scenarios chosen to compare structural sensitivity, rather than empirically estimated policy elasticities.
These limitations are intrinsic to the data structure and the policy-evaluation setting rather than reflecting deficiencies in implementation, and several design choices were made to contain their influence. The four-parameter sensitivity analysis, the alternative-specification checks for the realization rate, and the use of bounded scenario regimes jointly demonstrate that the central findings—the magnitude of the implementation gap, the identification of the consumer side as the binding constraint, and the bounded share of the gap that can be recovered—are not artifacts of any single modeling choice but persist across the alternative configurations examined.
Within these acknowledged limitations, the contribution of this study lies less in producing a precise forecast of national energy savings and more in providing a transferable analytical framework for diagnosing implementation gaps in appliance efficiency policy. The framework can be extended to other appliance categories, to longitudinal designs that allow causal inference on the determinants of consumer adoption, and to the post-implementation evaluation of the GB 38383-2025 revision once sufficient market data become available.
5. Conclusions
This study developed a four-component analytical framework to evaluate the implementation effectiveness of dishwasher energy-efficiency labeling in China. Combining a logistic stock-flow model of theoretical savings with primary survey data from 199 consumers and 191 enterprises, the framework integrates the consumer and enterprise sides through a weakest-link logic to estimate the realization rate and uses scenario simulation to quantify the policy-recoverable share of the implementation gap.
Under the baseline scenario, a market transition from lower-efficiency to higher-efficiency products within the GB 38383-2019 labeling system yields an estimated 20.26 TWh of cumulative theoretical electricity savings by 2030. Of this potential, 11.33 TWh (55.9%) is realizable under the modeled implementation conditions, leaving a gap of approximately 8.94 TWh (44.1%). Within the weakest-link framework, consumer-side capacity (Ccomp = 0.559) is lower than enterprise-side capacity (Ecomp = 0.657) and therefore constrains savings realization. Experience-related barriers, particularly cleaning performance, operational noise, and cycle length, carry the largest weight in the consumer composite. The highest-intensity bilateral scenario raises the realization rate to 70.4%, recovering 33.0% of the baseline gap. Together, these findings indicate that higher technical efficiency alone is insufficient to secure the full savings potential, while coordinated improvements on both sides can partially close the gap under the specified scenarios.
These findings suggest that efficiency-grade improvements should be accompanied by measures addressing adoption and implementation barriers. Because consumer-side capacity is currently binding in the model, near-term priorities include improving label clarity and accessibility, providing practical operating guidance, and addressing concerns about cleaning performance, noise, and cycle duration through product and service improvements. The additional gains identified in the bilateral scenarios support combining these consumer-oriented measures with testing guidance and technical implementation assistance for manufacturers. As consumer-side constraints are relaxed, enterprise-side capacity may become binding, making continued attention to both sides necessary.
More broadly, the framework developed here suggests that the effectiveness of appliance efficiency policy should be evaluated not against theoretical potential alone, but against the realizable share of that potential and the recoverable share of the remaining gap—a perspective that becomes particularly relevant as the GB 38383-2025 revision approaches its scheduled enforcement date.