1. Introduction
In contemporary electrical networks, a constant supply of power is of paramount importance. Voltage fluctuations and outages can jeopardize critical processes and endanger sensitive equipment in industrial, commercial, and residential facilities. The possibility of failure of a substation transformer supplying multiple loads has to be minimized in order to ensure a reliable service for all utility customers. On the other hand, it is also important for network administrators to minimize maintenance costs, including indirect costs due to the requirement for a substation transformer to be de-energized during maintenance. There is therefore a strong incentive for the development of methods for the condition assessment of transformers, capable of identifying emerging faults and accurately characterizing their state of health.
A power transformer comprises multiple components, each performing a specific and essential function in its overall operation and performance. The components include the core, cooling system, insulation system, tap changer, and bushings, among others. To guarantee correct functioning and maximum efficiency, its components must be monitored for any events, including failures and irregularities. Recent improvements in condition monitoring technologies have profoundly impacted the operation and maintenance of these systems. Health Index (HI) is considered to be an effective method for evaluating the overall condition of a transformer [
1,
2]. The HI offers a systematic approach to evaluating transformer performance and has multiple practical applications in asset management. Utilities and asset managers conduct it for real-time or periodic assessment by retrieving the most recent laboratory or online monitoring data, calculating the HI, and recording it for each transformer. Under this framework, composite information such as normal operating parameter values, on-site observations, and laboratory tests can be combined into a concise index that facilitates prediction. It can thus help an asset manager decide whether equipment degradation can be considered acceptable or not and, in the latter case, whether it can be addressed by maintenance or replacement.
The components with the highest contribution to the probability of failure of the transformer are the windings, on-load tap changers (OLTCs), and bushings. The inclusion of their condition in the transformer HI formulation can significantly add to its efficacy [
3]. The tap-changer, in particular, is susceptible to a wide range of faults [
4,
5]. It is the only component of the power transformer with moving parts. Moreover, it performs the breaking and making of current. The OLTC and its insulating medium are thus subjected to wear and subsequent aging. OLTC faults can lead to problems such as excessive tap transition time and contact wear. In severe cases, these abnormalities can lead to serious disruptions, such as voltage fluctuations or even forced transformer shutdowns and outages. In fact, according to a statistical analysis of substation transformer outages performed by a Cigré Working Group [
6], over 30% were associated with tap changer failures. Furthermore, maintenance costs, especially when mandatory transformer shutdowns are taken into account, are a substantial part of substation transformer maintenance budgets. Poor evaluation of OLTC health can lead to a deterioration in the quality of power supplied by the grid or unnecessarily increased maintenance expenditures.
The simplest approach to OLTC maintenance is the traditional, time-based method [
7]. This may avert many failures, but it may also result in unnecessary shutdowns. On the other hand, unanticipated failures may occur between scheduled maintenance events. Methods of monitoring OLTC health and effective maintenance without overly increasing costs are currently topics of intense research interest [
4]. By combining information from various sources, more accurate estimations of the probability of failure can be achieved, allowing for an optimization of maintenance intervals. Irrespective of the source of information, a comprehensive index for documenting the state of health of the OLTC by utilizing all the available data can help engineers make informed decisions regarding the maintenance of this vital asset. The development of such an index is the subject of the present study.
Current methods for HI calculation can be classified into two main categories: the weighted-score sum (WSS)-based methods and artificial intelligence (AI) algorithm-based methods [
8,
9]. In WSS-based methods [
10,
11], transformer HI is determined as a weighted score of the results of different diagnostic tests. A score for each test is generated based on a grade range of one to four or five grades, and then a weight is allocated indicating its significance to the overall state of the transformer. Nevertheless, this technique presents two drawbacks. The first issue is that the distribution of weights across measurements is contingent upon the expertise of transformer specialists and on manufacturing standards, which vary among individuals. The difference between these weights and precise values results in the estimated health index likewise varying from an accurate value. The second issue is that the numerical boundaries between the various scores (grades) for several diagnostic tests may not be properly determined; an overlap or unclear zone persists. A solution to these issues is to employ a fuzzy-logic-based method.
AI-based methods [
12,
13] use intelligent algorithms such as fuzzy logic to approximate the underlying relationship between different parameters and the transformer HI. By using fuzzy-logic-based methods, the aforementioned problems of WSS can be avoided. The results of the different diagnostic tests are expressed using linguistic indicators such as “Good”, “Fair”, etc. After an analysis of rules based on expert judgment, an output is produced that measures the health status with an easily interpretable metric unit. In order to design the rules, knowledge of the importance of each test relative to the others is needed. Any membership function of any test may intersect with neighboring membership functions, which means that no sharp thresholds are needed between grades. In [
12,
13], fuzzy logic is used for the calculation of the HI. However, these methods focus on the transformer and use furan analysis, dissolved gas analysis, and other oil analysis results as inputs. In the present study, the authors have chosen to develop a total health index model specifically for the OLTC, as it is the most defective component of a transformer.
The innovation of the current study is not the application of fuzzy logic itself, but the construction of a hierarchical HI framework particular to OLTC that integrates different diagnostic groups in a structured, multi-level structure. Rather than mapping all diagnostic data to a single final score, the proposed technique first analyzes individual measurements and sub-contributors, then combines the resulting contributor conditions to produce the overall OLTC Health Index. A comprehensive and thoroughly developed health index model for the transformer as a whole will be addressed in a future research endeavor.
2. Materials and Methods
2.1. OLTC Operation and Failures
An OLTC adjusts the turn ratio of a power transformer by adding or subtracting turns from a winding under load, without interruption to the supply of power. This regulation is essential in order to preserve the stability of the network under variable load conditions [
14,
15]. The tap-change operation is carried out in two steps. First, the next tap to be used is selected by the tap selector, which is controlled by a motor-drive mechanism. During this process, no transfer of load current takes place. At the same time, a spring energy accumulator is tensioned. The release of the spring results in the operation of the diverter switch after a very short time interval. The diverter switch then transfers the load current from the initial tap to the preselected one [
14,
15]. The motor-drive mechanism needed to operate the tap-changer is mounted on the outside of the transformer. The power is transmitted to the tap selector by means of shafts and bevel gears [
14,
16]. There are several mechanical parts in the OLTC contributing to the tap-changing process [
17,
18].
Field Diagnostics and Maintenance Data
The OLTC is considered one of the most failure-prone transformer components because it is the only moving part exposed to repeated mechanical and electrical stresses during tap operations, accounting for approximately 30–40% of transformer failures [
6]. Consequently, OLTC condition assessment is critical for transformer health evaluation. The condition of the diverter switch is particularly important, as contact life depends on operating current, switching frequency, and mechanical wear [
19]. Overloading beyond standard limits accelerates contact degradation, while weakening spring tension and transition resistor deterioration further affect performance [
20,
21].
One diagnostic technique is insufficient to provide a reliable assessment of OLTC health. As a result, condition evaluation integrates data from diagnostic tests, maintenance inspections, and online monitoring. Online monitoring systems enable early detection of anomalies in contacts, gears, lubrication, selector alignment, and drive mechanisms by providing continuous measures such as switching current, number of operations, motor supply current, and voltage [
2,
20]. OLTC health assessment can also be supported by other methods such as infrared thermography, dissolved gas analysis (DGA), and vibro-acoustic analysis [
6].
DGA is a crucial, recognized diagnostic method for assessing the condition of transformers and OLTCs. The current research intentionally focuses on non-DGA OLTC condition indicators, including electrical, mechanical, operational, protection, and visual inspection metrics. The aim is to extend Health Index evaluation beyond traditional DGA-methodology-based approaches by integrating these less commonly used OLTC-specific parameters into a unified fuzzy-inference system. Hence, the suggested technique should be regarded as supplementary to DGA-based diagnostics rather than a replacement. This broader integration constitutes part of the novelty of the suggested approach.
Routine maintenance inspections provide further operational information. During transformer servicing, visual inspection of the conservator, motor-drive mechanism, oil level, breather, heater, toothed belt, and emergency stop system is conducted [
22]. Protective devices such as pressure relays, oil-flow relays, and pressure relief devices can initiate alarms or transformer trips when abnormal conditions occur. In such cases, detailed diverter switch inspection is required before re-energization [
19,
22].
Maintenance intervals are generally determined by the number of switching operations or operating time. During overhaul, the transformer is de-energized, and the switch is removed for inspection. Contact wear, contact clearance, transition resistor condition, flexible connections, bolts, springs, plug-in contacts, and oil condition are evaluated against manufacturer specifications [
19,
23]. The motor-drive mechanism is also periodically overhauled, including inspection of protection functions, cable connections, lubrication, heaters, brakes, and contact timing [
22,
24].
OLTC evaluation is further supported by diagnostic measurements. While dynamic resistance measurements record transient switching behavior and transition resistor performance during OLTC operation, static winding resistance measurements contribute to the identification of winding and connection problems. Contact wear, broken springs, low contact pressure, misalignment, and malfunctioning transition resistors can all be detected by these procedures [
18,
22,
25].
To improve health index (HI) assessment, many studies employ scoring and weighting approaches based on transformer condition parameters. However, conventional methods rely heavily on expert judgment and predefined score boundaries, which may introduce uncertainty and overlap between condition grades. Fuzzy-logic (FL) methods address these limitations by converting crisp measurements into linguistic variables using membership functions, allowing smoother transitions between assessment categories and reducing dependence on strict thresholds [
23,
25,
26].
Therefore, the OLTC can be analyzed by means of a combination of several functional contributors that provide a structured assessment of failure modes and operational reliability. Field diagnostics, maintenance records, online monitoring, and operational data can be combined to provide a comprehensive basis for overall OLTC health condition assessment [
27].
2.2. Tap Changer Health Index Assessment Methodology
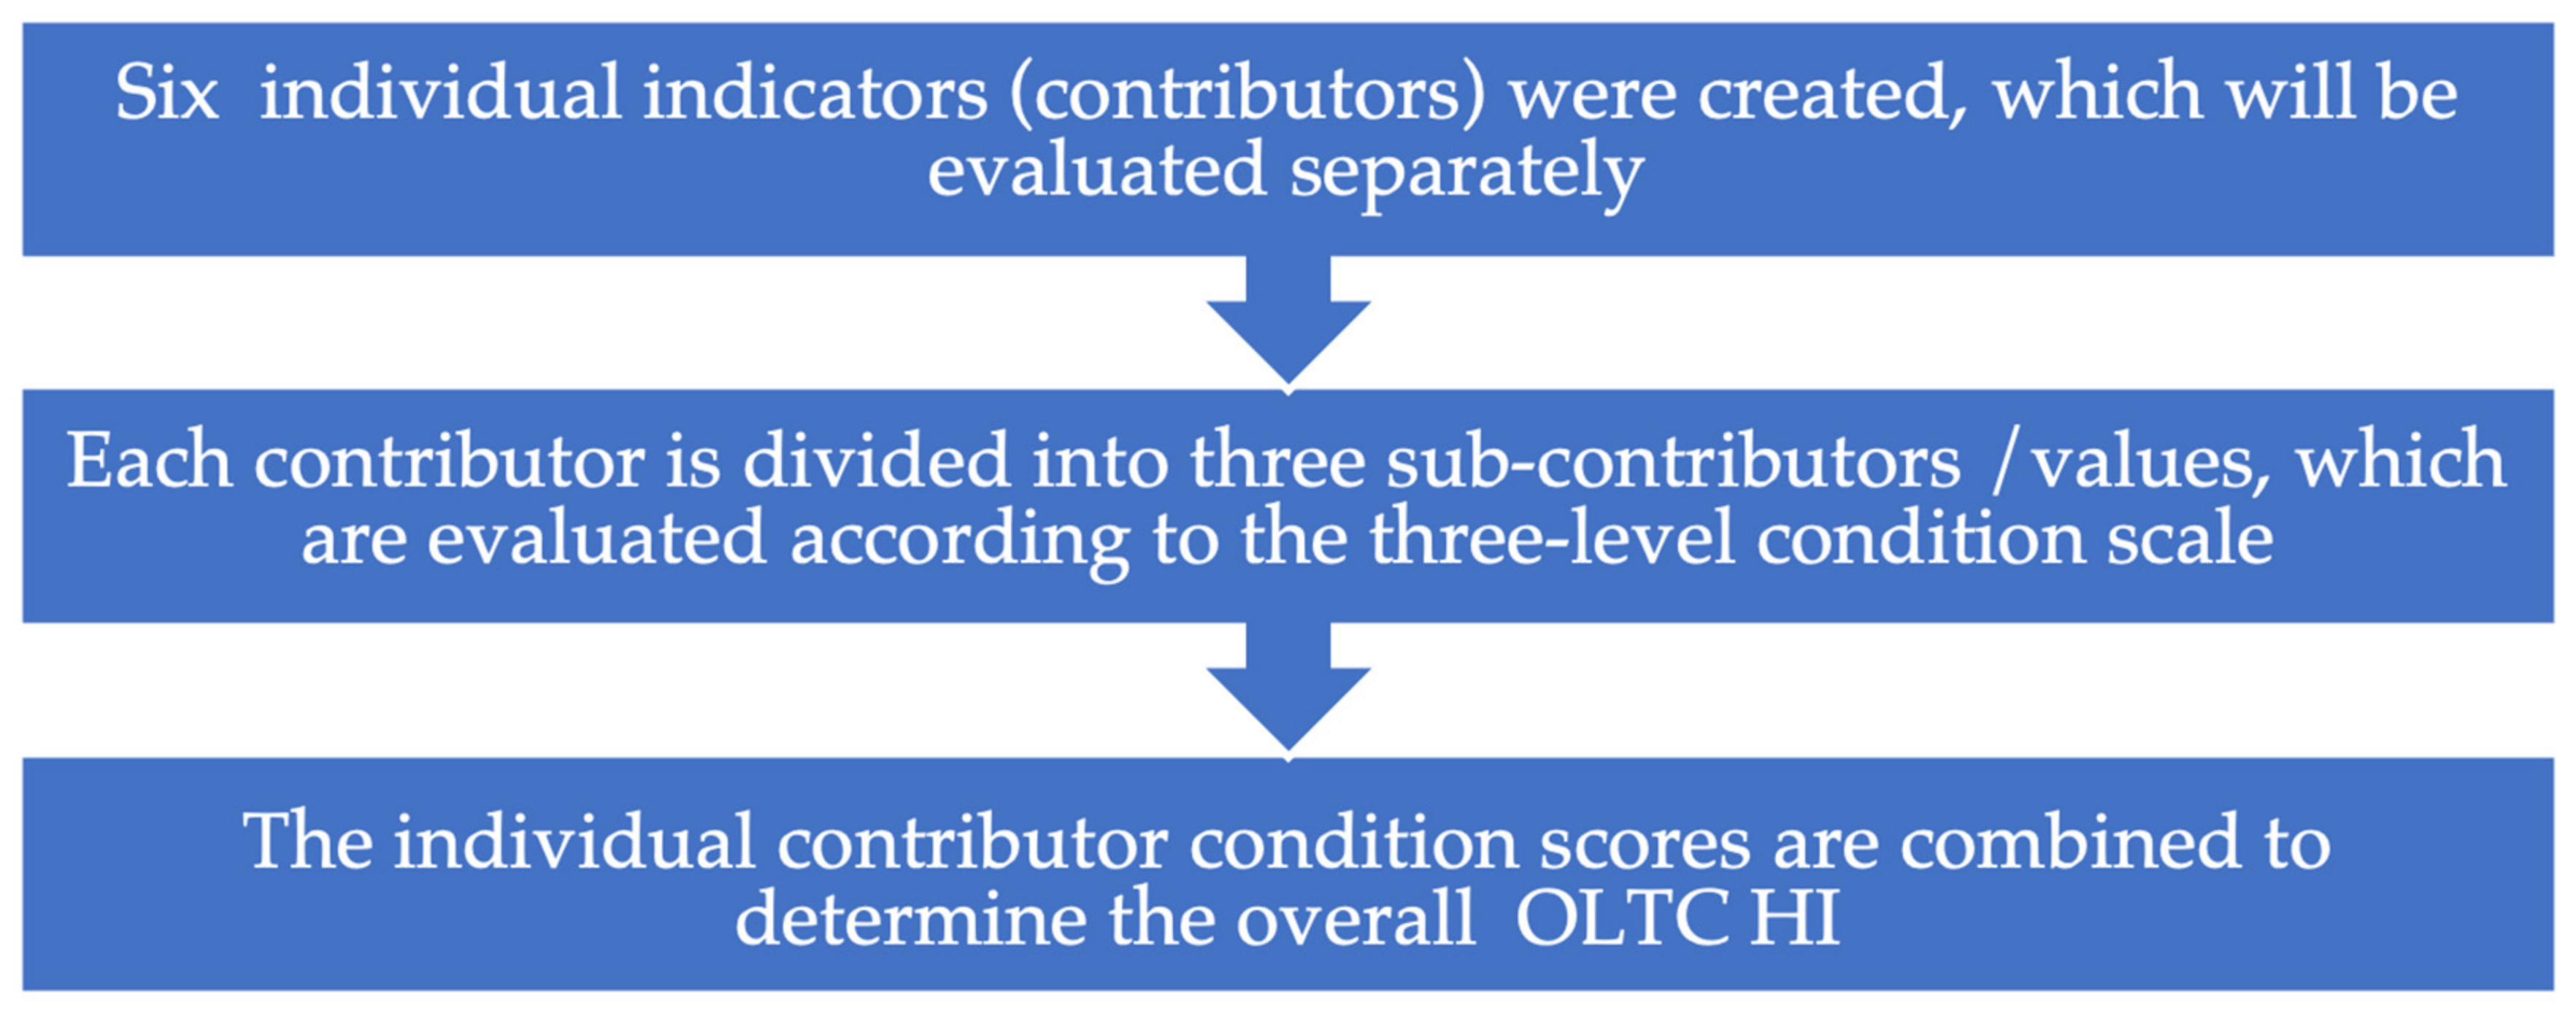
To conduct an HI analysis, the OLTC is deconstructed into six subsystem components, referred to as contributors, to facilitate a systematic and thorough investigation of its failure modes. As an OLTC comprises various components, its HI can be determined as the aggregate result of these various parts. The health model structure for an OLTC consists of six health groups, each corresponding to a structural part. To determine the overall HI, the condition of each health group (contributor) is evaluated individually and classified into one of three categories: A, B, or C. The final OLTC HI is then obtained by combining the results of all six contributors.
It should be noted that six contributors were selected to ensure a balance between analytical clarity and comprehensive coverage of the OLTC’s most critical functional areas. Each contributor is a key subsystem whose performance is essential to the transformer’s overall dependability. This means that potential failure modes can be used to evaluate each contributor. Through operation, these assets generate data that can be used to assess asset performance. Data for a specific asset or group of assets may be collected from multiple data sources, such as Online Monitoring Systems, Supervisory Control and Data Acquisition Systems, and Chemical Laboratory Management Systems. The potential data sources for this study are identified through a review of the relevant literature and supplemented by manufacturer datasheets, utility records, and publicly available technical databases. Data can be presented in various formats and used effectively. These formats may include numerical values, text, binary information, and more. These events can be utilized, in conjunction with other maintenance data, the endogenous data of the PT, and actual diagnostic tests conducted in the field, to assess the overall OLTC health condition.
The assessment of the HI of OLTCs in Power Transformers requires a methodological approach grounded in measurable indicators. For this reason, the proposed contributor-based model integrates both qualitative and quantitative parameters, enabling a comprehensive and risk-informed evaluation of OLTC condition.
To ensure reliability, the model is aligned with international standards and technical specifications, including
IEC 60137—Bushings for alternating voltages [
28];
IEC 60185—Current transformers [
29];
IEC 60296—Specification for mineral insulating oils for transformers [
30];
IEC 60354—Loading guide for oil-immersed transformers [
31];
CIGRÉ. Guide on Transformer Intelligent Condition Monitoring (TICM) Systems [
32]; .
Moreover, the data under investigation were collected from substations, each equipped with power transformers of the Electroputer model.
2.2.1. Contributor-Based Model
Each contributor is assessed using a three-level rating scale to simplify the evaluation process and improve clarity in decision-making. This classification approach also facilitates automatic prioritization within asset management systems. The HI estimation for the overall contributor, Tap Changers, is provided by the following rule: The most unfavorable characterization that has been assigned to one or more individual indicators is also the one that characterizes the overall contributor. This rigorous rule guarantees that any singular major failure categorizes the entire component as high risk, ensuring immediate maintenance interventions. The three-tier category scale is presented in
Table 1.
So, for scoring the overall contributor, Tap Changers, the procedure outlined in
Figure 1 was developed.
The required values could be condition measurements, operating observations, and diagnostic data. Each value is assessed against reference ranges or boundary values established from a synthesis of international standards, statistical population research, and expert subject knowledge.
The inspected Transformer Type comprises the following technical characteristics (
Table 2), as outlined in the manufacturer’s manual [
16,
33].
The OLTC examined in this study is an ABB UCLRN 650/900 unit, installed at the neutral point of the MV winding, with 19 operating positions and a BUE motor-drive mechanism. According to the ABB/Hitachi Energy technical documentation, the UCL is a conventional, resistance-type, in-tank, diverter-switch OLTC. The UC-series tap changers are installed inside the transformer tank. The tap selector is located below the diverter-switch housing, forming part of the in-tank OLTC assembly, whereas the motor-drive mechanism is mounted externally on the transformer tank and mechanically connected to the OLTC through the drive system.
2.2.2. Contributors and Values of ‘Tap Changers’
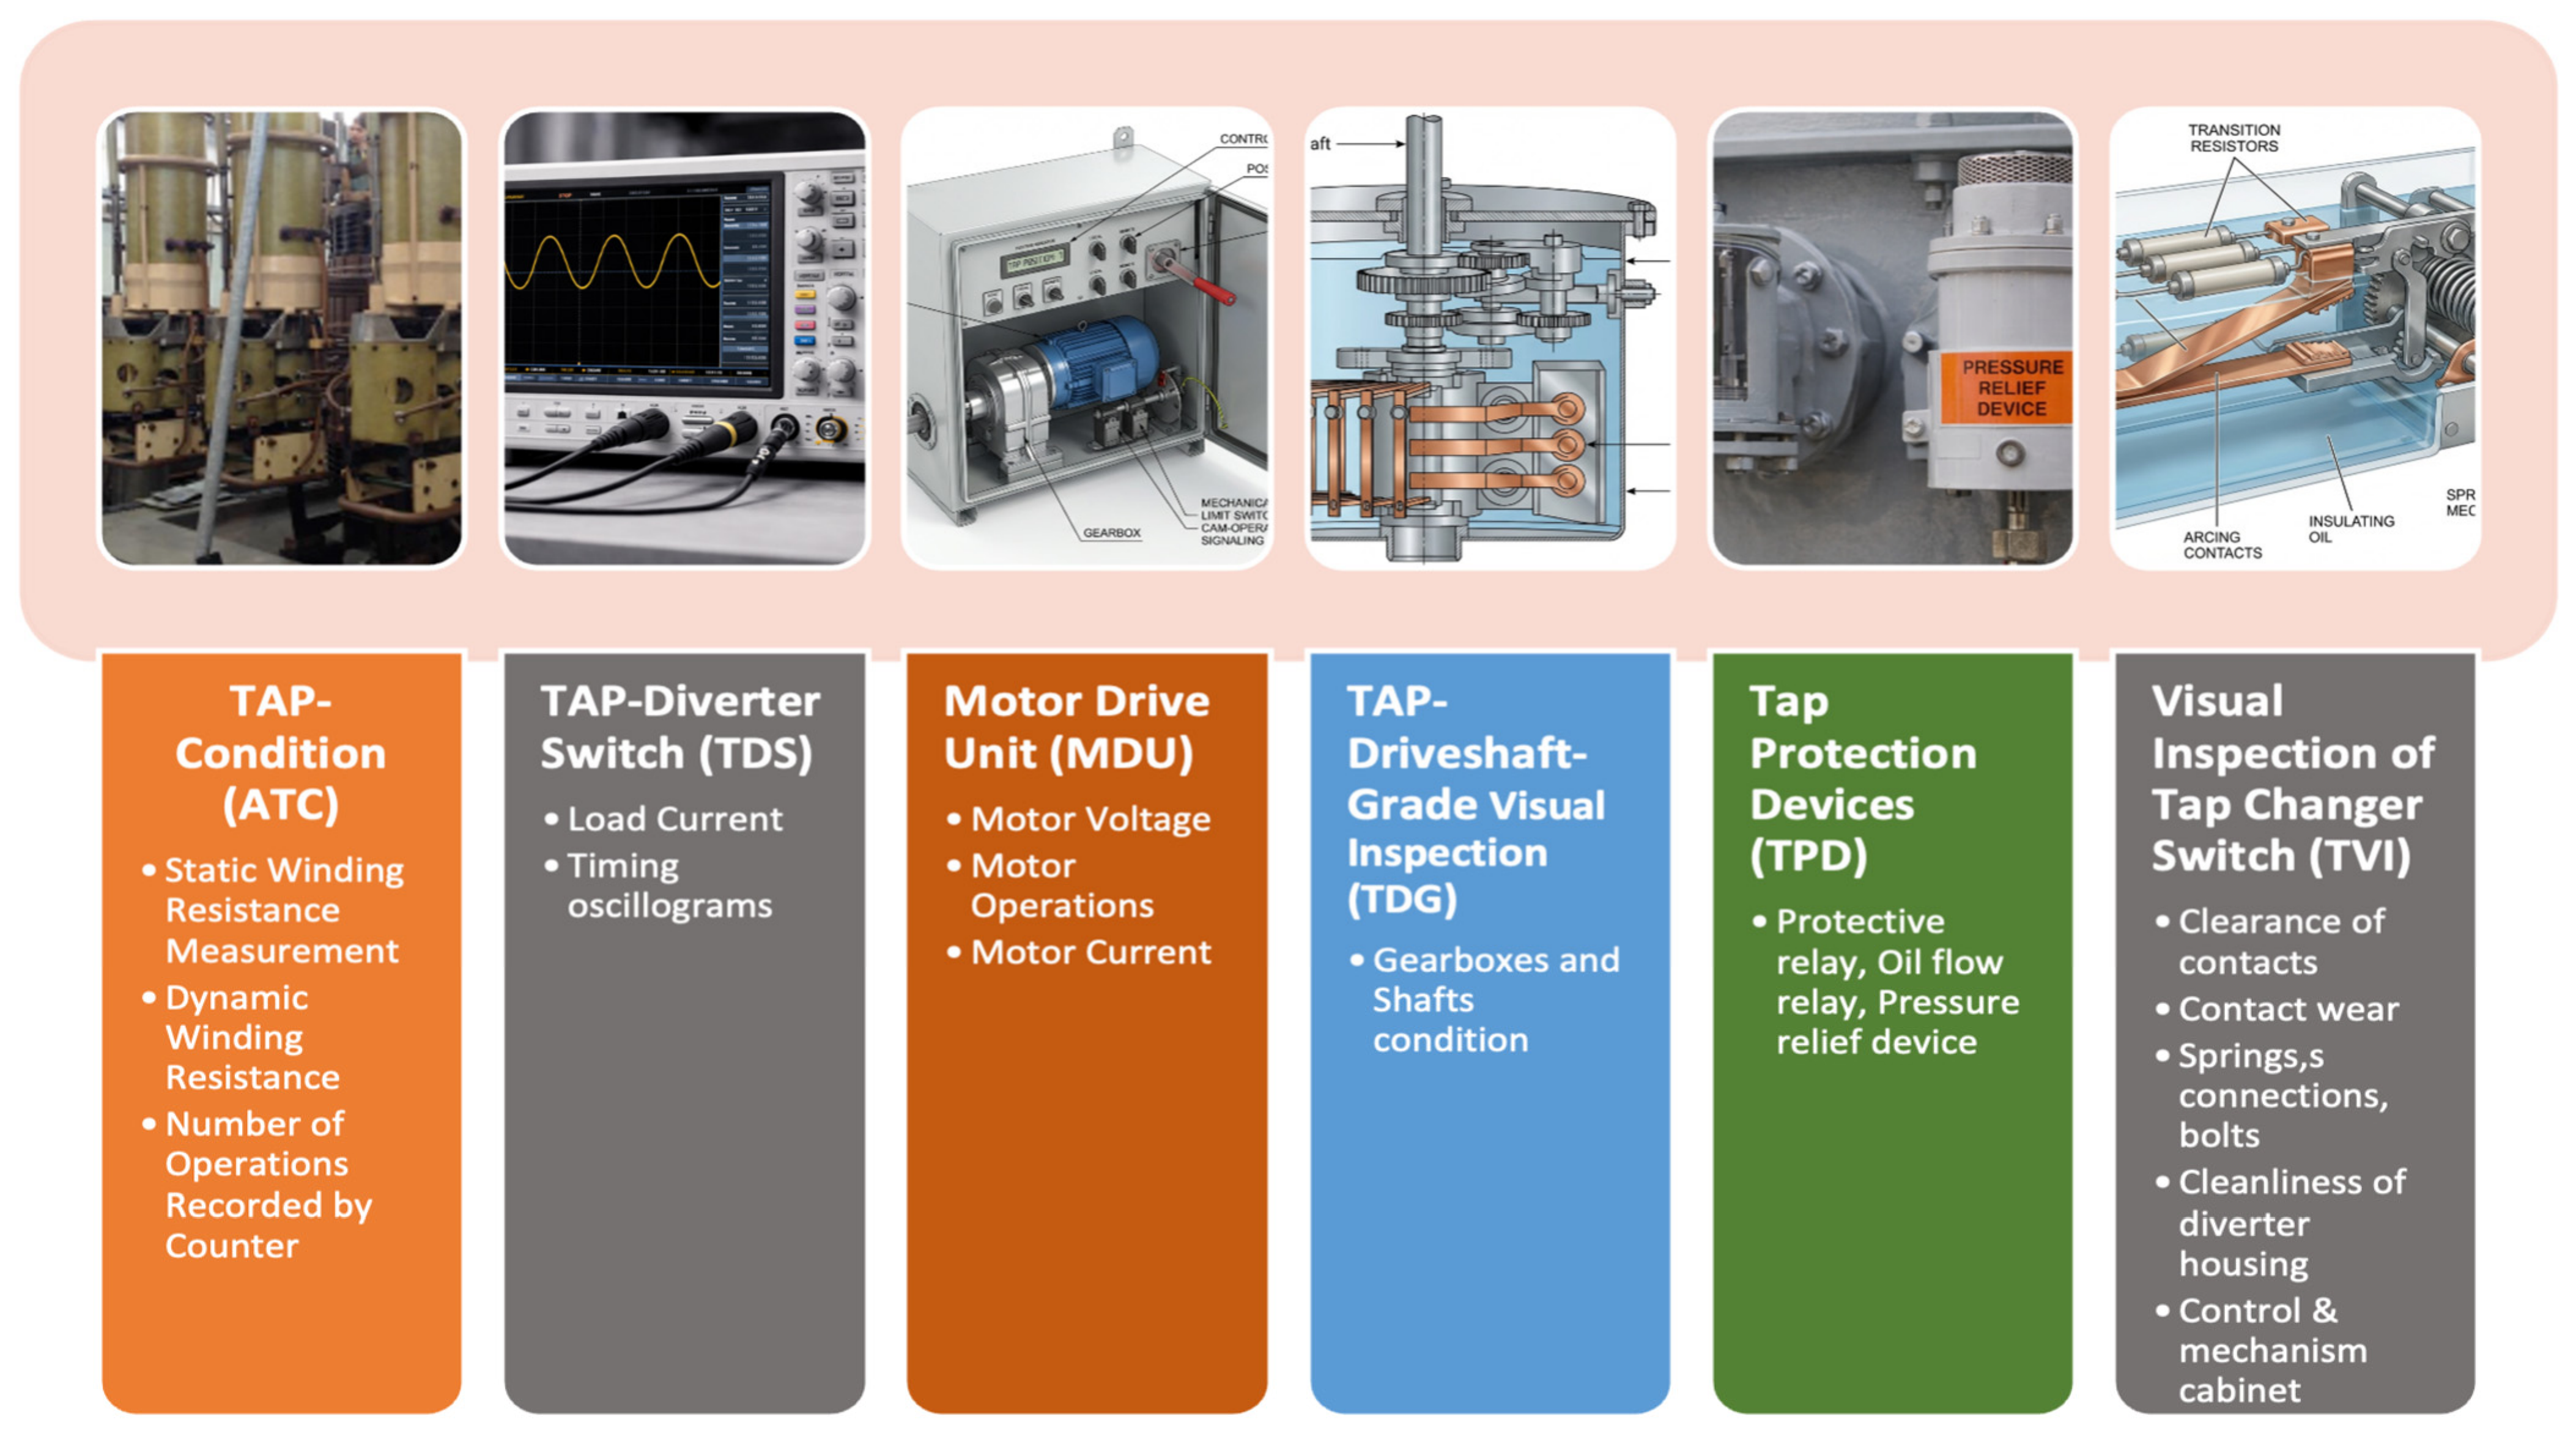
The contributors that are considered in this study are illustrated in
Figure 2.
Contributor 1: Tap Condition. For scoring the first contributor/Value 1, the following are evaluated:
- •
Value 1a: Dynamic Resistance (DR) [
22] (Section 3.11, p. 20). Verify that the resistors are undamaged and compare their values to those listed on the rating plate (RP). The values must not differ by more than 20%.
- •
Value 1b. Static Winding Resistance measurements (WR) [
22].
- •
Value 1c: Number of operations recorded by the counter (NO) [
34]. The number of operations must not exceed 500,000 due to the weakening spring tension of the contacts.
Initially, three sub-indices are defined, each with three functional states, and each value is assigned a score of A, B, or C. These scores are assigned based on the following states, as shown in
Table 3.
Ultimately, the score of Contributor 1 and the score of all contributors are assessed using the following criterion: The most unfavorable characterization that has been assigned to one or more individual indicators is also the one that characterizes the overall contributor.
The Score of Contributor 1, Tap-Condition, and, generally, the score of all contributors is assessed as illustrated in
Table 4.
Contributor 2: Tap Diverter Switch. For scoring this contributor/Value 2, the Load Current (LC) and the Timing Oscillograms (TO) are evaluated according to IEC 60214-1 [
24] (Clauses 5.2.6.3 and 5.3.3, p. 36) and IEC 60214-2 [
19]. The Score for Values for this contributor is presented in
Table 5.
Because the conditions of Value 2, Value 4, Value 5, and some of Value 6 are expressed in non-numerical terms, they are qualitative rather than directly measurable. Their condition states are therefore represented using predefined symbolic labels. These symbols transform descriptive inspection outcomes into structured categorical inputs suitable for processing by the fuzzy-inference system. Each state is expressed by the symbols T, G, P, S, H, and V, as presented below. For example, the condition of the Timing Oscillograms is represented by the symbol T and classified into three states:
- •
Condition T1: The Timing Oscillograms show no significant deviation from the reference condition.
- •
Condition T2: The Timing Oscillograms show an acceptable deviation that remains within permissible limits.
- •
Condition T3: The Timing Oscillograms show a significant deviation, indicating a potentially degraded or critical condition.
Contributor 3: Motor Drive Unit. The motor-drive mechanism should be visually inspected annually.
- •
Value 3a: Motor Voltage [
24] (Clause 6.1.2, p. 36). The driving motor and the control equipment of the motor-drive mechanism shall be designed to operate satisfactorily between 85% and 110% of the rated supply voltage.
- •
Value 3b: Motor Operations [
34] (Section 3.1, p. 13). The number of operations must not exceed 1,500,000, which is the mechanical lifetime of the motor-drive mechanism.
- •
Value 3c: Motor Current [
24]. Operates satisfactorily between 90% and 100% of the rated current.
The Score of Values for Contributor 3 is presented in
Table 6.
Contributor 4: Tap Driveshaft Grade Visual Inspection. To score this contributor/Value 4, a visual inspection of the overall condition of Gearboxes and Shafts is performed according to [
18,
35]. The Score of Values for Contributor 4 is presented in
Table 7.
Contributor 5: Tap Protection Devices (Protective Relay, Oil Flow Relay, Pressure Relief Device). To evaluate this contributor/Value 5 (
Table 8), the functional state of different Tap Protection Devices is determined based on [
16,
19,
24].
Contributor 6: Visual Inspection of Tap Changer Switch. For scoring contributor 6/Value 6, a visual inspection of the Tap Changer Switch is conducted. Initially, five sub-indices are defined, each with three conditions, and each value is assigned a score of A, B, or C (
Table 9). These scores are assigned based on the following states:
- •
Value 6a: Clearance of fixed-moving main contacts and fixed-moving transition contacts (CL) [
22,
34] (Section 3.9, pp. 18–19).
- •
Value 6b: Contact wear (CW) [
22,
36] (Section 3.10, p. 20).
- •
Value 6c: Operating springs, contact springs, plug-in contacts, bolts, flexible connections (OS) [
22] (Section 3.9, p. 18).
- •
Value 6d: Cleanliness of the diverter switch housing (CD) [
4,
22,
37] (Section 3.6.1, p. 17).
Value 6e: Visual Inspection of Tap changer control and mechanism cabinet component condition [
4,
18,
37].
Good (A): Wiring, terminal blocks, relays, heaters, motors, contactors, and switches are all in good condition. LTC operating mechanism, shafts, brakes, gears, bearings, and indicators are free from corrosion, abrasion, or obstruction and are lubricated. No sign of overheating or deterioration on any electrical or mechanical components. The number of operations does not exceed 500,000 (all the above conditions are classified as Condition V1).
Fair (B): About 20% of the wiring, terminal blocks, relays, and switches are in degraded condition. LTC’s operating mechanism is in fair condition. The number of operations does not exceed 1,000,000 (Condition V2).
Critical (C): A significant amount of wiring, terminal blocks, relays, and switches are in very poor condition. Fuses blow periodically. One or more of the LTC operating mechanism components are in imminent danger of failure. Requires immediate corrective action. The number of operations exceeds 1,500,000, which is the mechanical lifetime of the motor-drive mechanism (Condition V3).
2.3. Fuzzy-Inference Health Index Model—Fuzzy-Logic Approach for Condition Assessment
Fuzzy Logic (FL) is mainly the endeavor to mathematically interpret human natural language and thinking processes. It employs linguistic principles derived from human interaction with non-numerical data (fuzzy). Fuzzy-logic models are mathematical frameworks designed to address uncertainty, fuzziness, and imprecision, particularly in complex structures where conventional binary logic (true/false) becomes excessively inflexible. Fuzzy models can mathematically express, understand, and utilize fuzzy information, and are capable of resolving nonlinear issues [
38,
39]. Additional information regarding the development of fuzzy membership functions, and generally on FL, can be found in [
23,
25,
26,
40].
The fuzzy-based model for OLTC health utilizes data acquired from diagnostic testing conducted during manufacturing tests, in-service tripping, or maintenance activities.
A fuzzy-inference system (FIS) is a nonlinear mapping of an input data vector to a scalar output. This method is grounded in Zadeh’s fuzzy set theory, which formalizes, in a mathematical framework, the representation and reasoning over ambiguous, incomplete, or noisy input information in a manner related to how humans think [
41]. It analyzes information through a sequence of stages, utilizing fuzzy-logic operators, membership functions, and if-then rules to produce an outcome or decision. Specifically, for estimating an OLTC’s HI, FIS processes input data from transformer assessments (tests, inspections, etc.), analyzes it using fuzzy labels (Good/Fair/Critical), implements expert IF-THEN rules, and generates a singular, continuous Health Index. So, FIS estimates an OLTC’s HI by integrating heterogeneous condition data along with expert judgments into a singular, interpretable score [
42].
Initially, FIS imports contributor metrics such as Dynamic Winding Resistance, Number of Operations Recorded by Counter, tap changer evaluations, and visual inspections. In fuzzification, each measurement is correlated with linguistic states such as Good (A), Fair (B), and Critical (C) through the application of membership functions [
43]. Subsequently, expert rules specify asset policy; for instance, IF any contributor qualifies as Critical, THEN HI is classified as Critical. During inference, the impact strength of each rule is calculated, and the rule consequents HI = A/B/C are combined into a singular fuzzy output set. Ultimately, defuzzification converts this set into a precise HI score on a continuous scale (0–3), which can be categorized into health classes. In brief, the FIS operates as an effective gateway between field measurements and expert guidelines, yielding a reliable and comprehensible HI for asset management [
12,
44].
A model of a fuzzy IF-THEN rule-based system comprises four parts [
45,
46]:
Fuzzification is the process of transforming crisp sets into fuzzy sets using language norms derived from human cognition rather than a computational mathematical form. For each category of condition data, a Membership Function (MF) is allocated according to relevant industry standards (e.g., IEEE, IEC, or CIGRE). These MFs denote the OLTC’s condition values: A (Good), B (Fair), and C (Critical).
Knowledge representation—establishment of fuzzy rules. The fuzzy rules comprise a collection of “If-Then” statements that utilize the expertise of human specialists.
Fuzzy Inference. Membership functions were generated utilizing fuzzy rules, while the Mamdani maximum-minimum inference approach was employed to obtain the output membership function. Fuzzy Inference comprises two components: the antecedent (IF portion) and the consequent (THEN part), yielding outcomes based on these linguistic norms.
Defuzzification is the conversion of fuzzified outputs, associated with fuzzy rules, into a crisp set. It employs a defuzzification approach, such as the centroid method of the output MF, to determine a crisp output value that indicates the HI of each OLTC contributor. Centroid defuzzification returns the center of gravity of the fuzzy set along the x-axis. Nonetheless, a limitation of this strategy is that fuzzy-logic rules are wholly reliant on expert experience.
Fuzzy-Inference System Simulation in MATLAB Software
The simulation for this project is conducted using MATLAB R2024b—Fuzzy Toolbox and Simulink [
47]. In this section, the FL model for the HI of the OLTC is developed. To assess its overall health condition, six individual contributors have been scored. Every contributor is evaluated using a three-tier category scale, as outlined in the methodology of the previous section. To achieve precision, the model is segmented into subfuzzy models, and their combination yields a comprehensive health evaluation of the OLTC. The subfuzzy models estimate the scoring of each value of the contributor tap changers.
To preprocess the input data for the fuzzy-logic model, field-testing data from different testing and inspection methods must be converted into numerical scores according to the examined cases. The formulation of the membership functions was mostly based on IEEE and IEC standards, relevant literature, and the expertise of transformer field operators. This research utilizes the Mamdani inference approach, as the literature study reveals that Mamdani systems are widely adopted for diagnostic and assessment issues where clear linguistic standards and human interpretability are crucial [
47]. Two typical membership functions (MFs) are the trapezoidal and triangular versions. Triangular and trapezoidal MFs are common due to their simplicity, both computationally and visually, for parameterization [
47,
48].
2.4. Design of a Mamdani-Type Fuzzy-Inference System for ‘Score of Tap Changers HI’
The model is divided into six sub-fuzzy models, corresponding to the number of contributors/values. These sub-fuzzy models evaluate the score of each value of the whole contributor tap changers. As described in the previous chapter, a fuzzy-inference system (FIS) model comprises four main components: (A) fuzzification—determination of fuzzy input variables, (B) knowledge representation—establishment of fuzzy IF-THEN rules, (C) fuzzy inference—rule processing, and (D) defuzzification. In this study, a separate FIS is constructed for each individual Value. The complete formulation is presented for Value 1 as a representative case. Since Parts B, C, and D of the FIS model are identical for all contributors, these stages are omitted in the subsequent analyses of the remaining five contributors, and only Part A (fuzzification) is described. Subsequently, the six sub-fuzzy models are integrated to form a comprehensive health evaluation framework for the OLTC. The overall fuzzy model is therefore structured with six input variables and a single output, corresponding to the total Health Index (HI) of the tap changer. The six contributors of the OLTC are identified as fuzzy variables, followed by the definition of Membership Functions (MFs) [
47].
2.4.1. Fuzzy-Inference System for “Score of Value 1—Tap Condition”
This sub-model estimates the scoring of specific parameters, namely Value 1: Tap Condition, through the application of measured data.
Value 1—Tap Condition, identified as a fuzzy variable, then follows the definition of Membership Functions (MFs). A membership function is a curve that indicates the degree of membership of each point in the domain that has a particular attribute, ranging from 0 to 1. Each input
is fuzzified into degrees of truth
using trapezoidal MF [
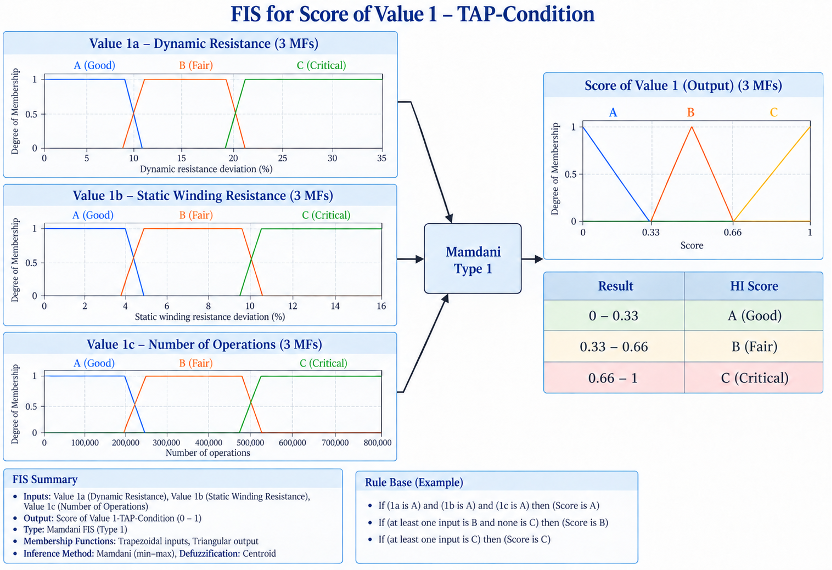
40]. Mamdani-type FIS synthesizes three heterogeneous indicators: Value 1a—Dynamic Winding Resistance, Value 1b—Static Winding Resistance, and Value 1c—Number of Operations Recorded by Counter, into a single categorical outcome, the ‘Score of Value 1’.
A. Fuzzification—the Fuzzy Variables Determination Inputs. The subsequent phase in the advancement of the FIS is to identify the three fuzzy sets for each input and output variable, utilizing the trapezoidal structure of the Membership Function [
47]. Each variable is split into three linguistic terminologies: A (Good), B (Fair), and C (Critical), whose supports align with the specification in
Table 2, as described in
Section 2.2.2. The inputs are shown in
Table 10.
The thresholds of Contributor 1 were converted into trapezoidal MFs using a uniform overlap rule. For each variable, the transition half-width was defined as follows:
where T_AB and T_BC denote the original Good–Fair and Fair–Critical diagnostic boundaries, respectively. The original thresholds remain the crossover points between adjacent fuzzy sets. Consequently, the overlap interval around each threshold was expressed as follows:
with equal membership of the two adjacent classes at the original threshold:
Overlap was introduced only between adjacent classes (A–B and B–C).
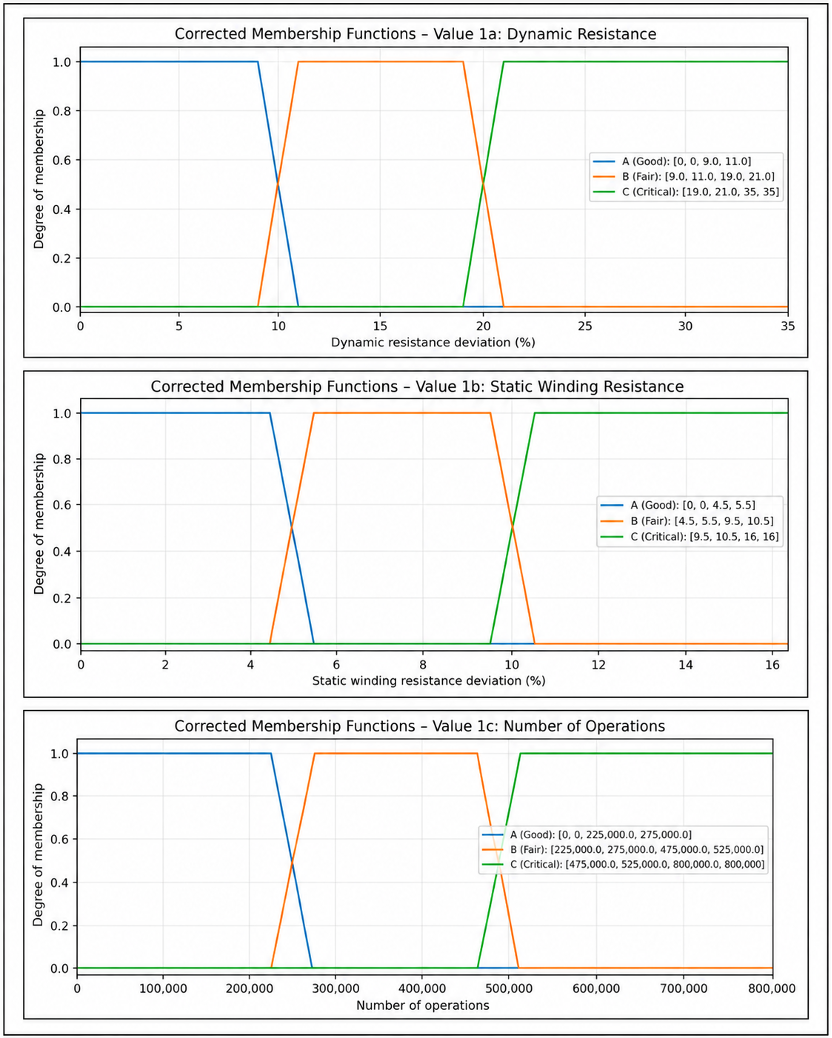
Table 11 summarizes the resulting membership-function parameters for Dynamic Resistance, Static Winding Resistance, and Number of Operations.
So, each input has three trapezoidal MFs, as shown in
Figure 3.
The FIS has one output variable: Score of Value 1.
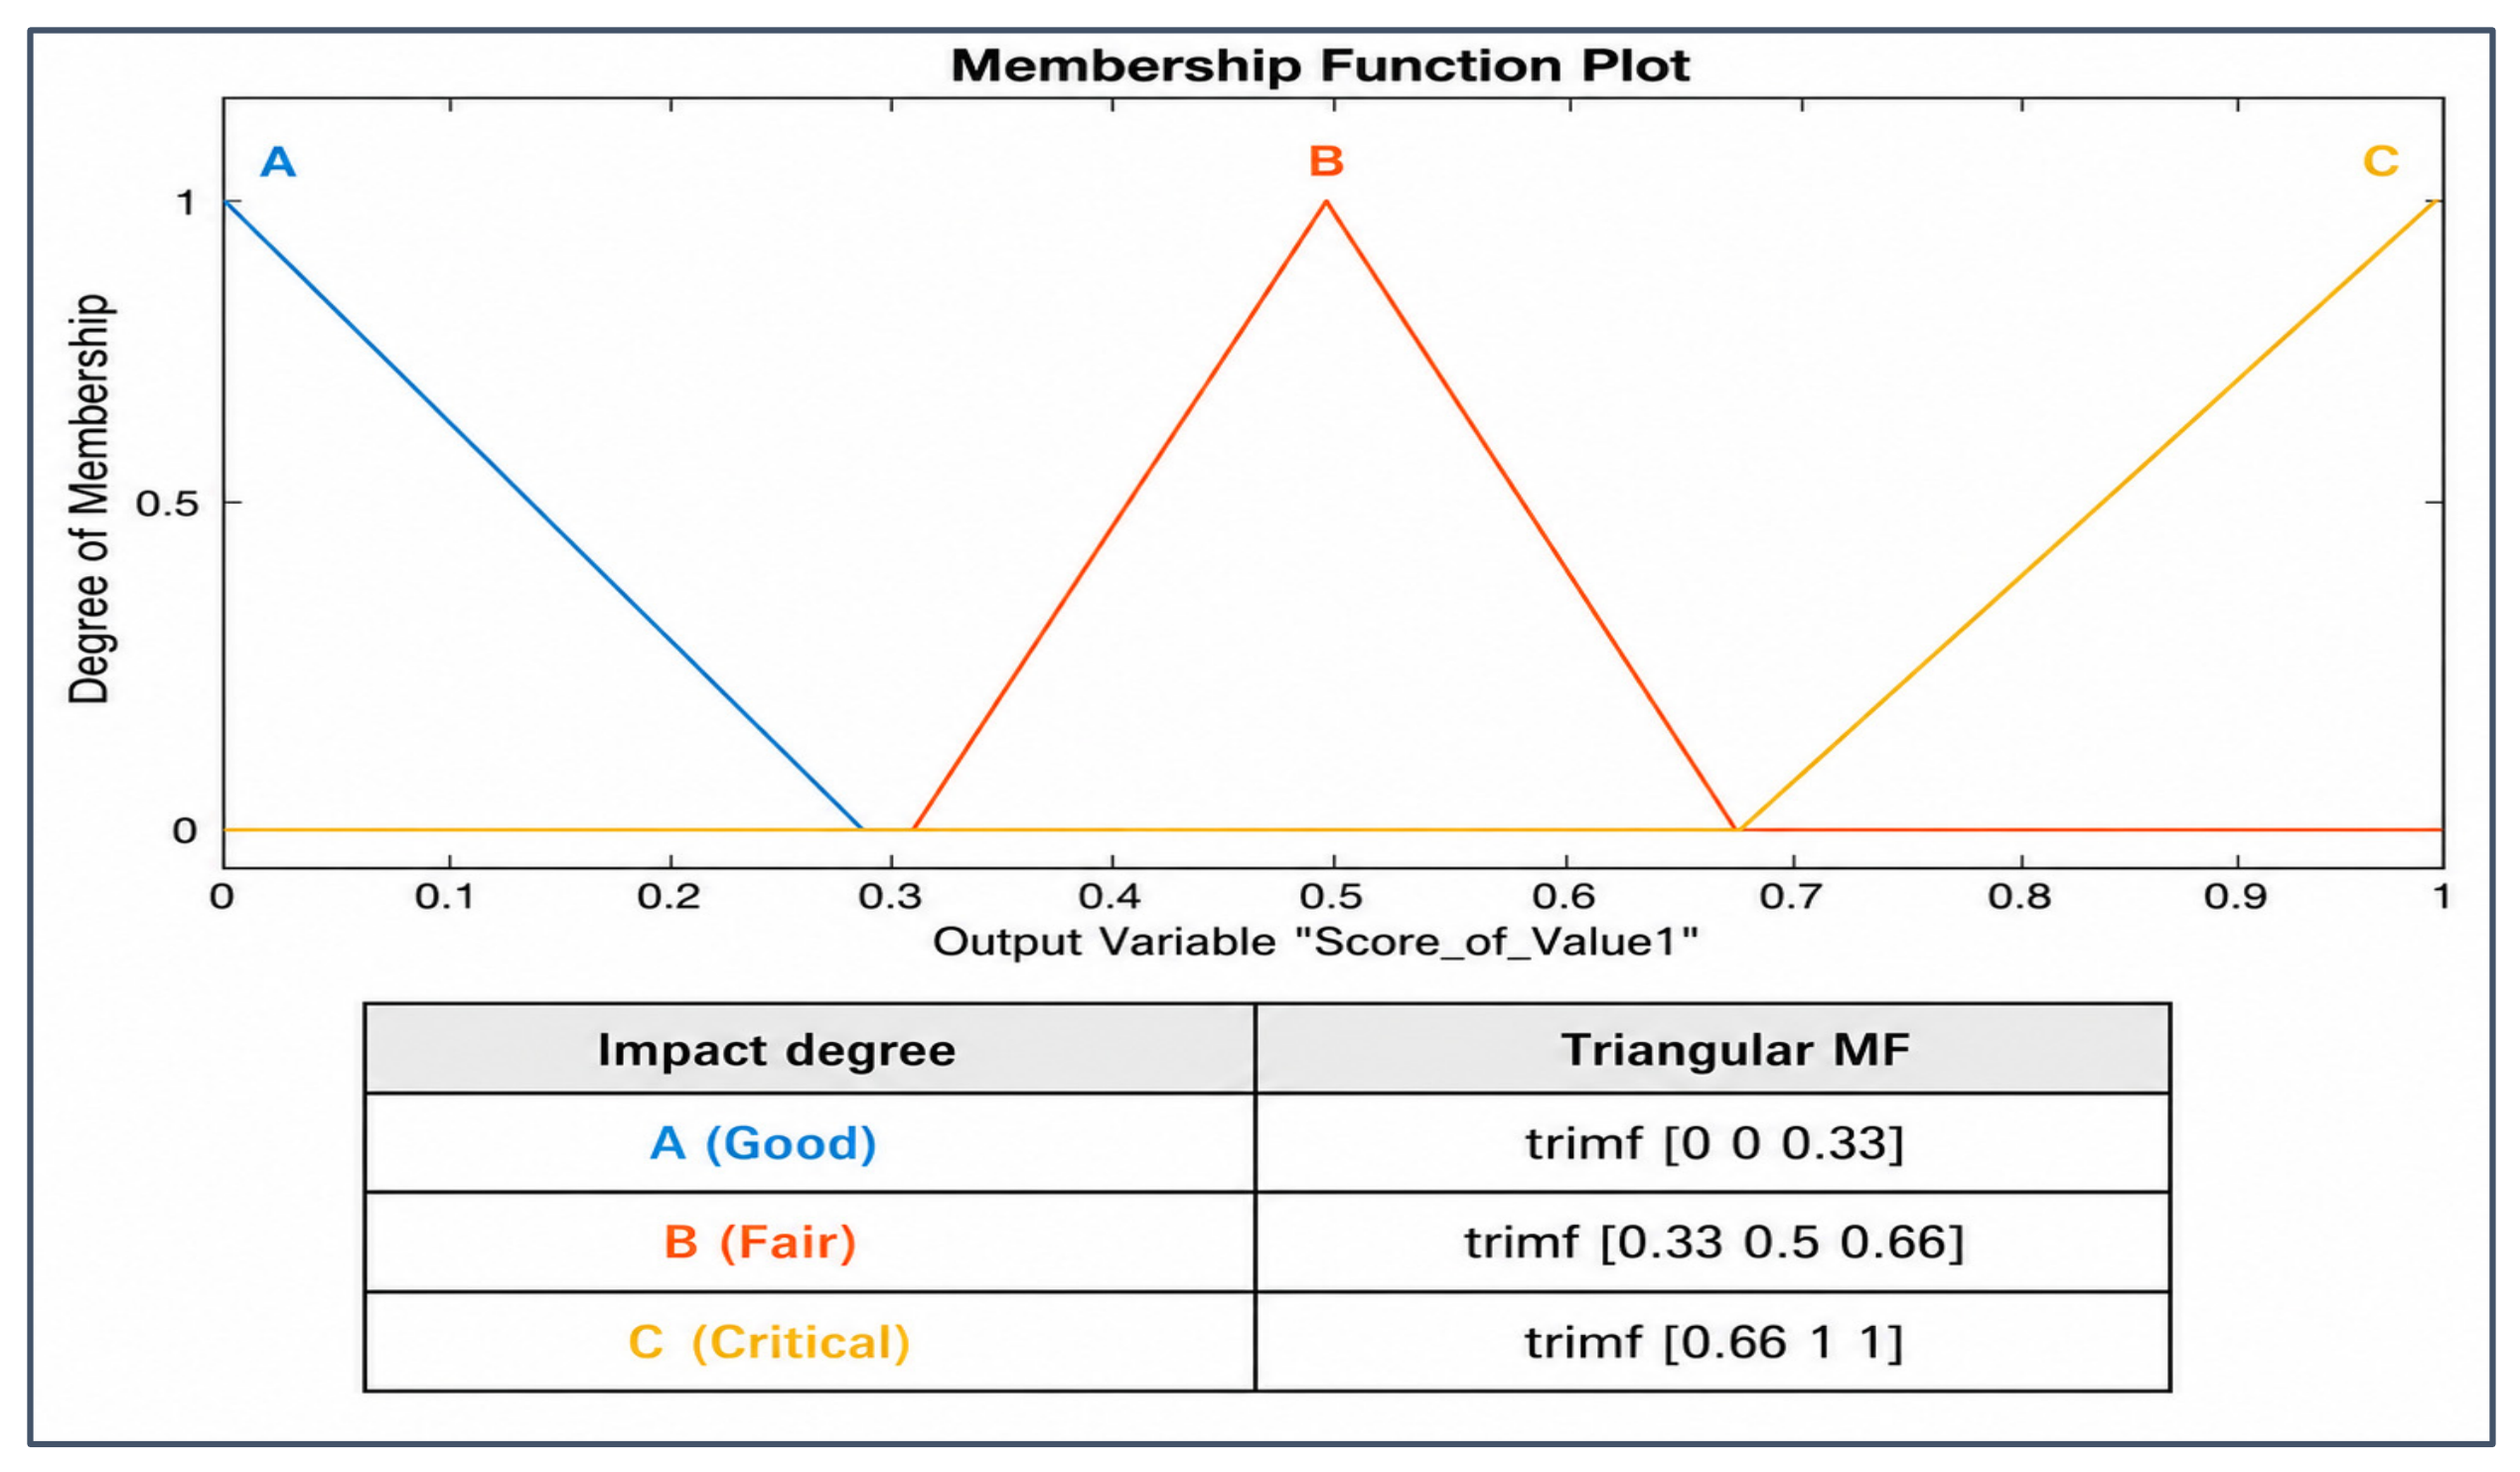
The output variable is split into three linguistic terminologies, bounded to [0, 1] [0, 1] [0, 1], and represented by three triangular sets as illustrated in
Table 12.
The ordinal impact-degree scale from 0 to 3 was expressed in normalized form on a 0–1 scale according to
so that the class boundaries at 1 and 2 on the 0–3 scale correspond approximately to 0.33 and 0.66 on the normalized scale, respectively. The triangular output membership functions were defined as presented in
Table 12.
The repeated end points in the A and C sets define the boundary triangular forms at the lower and upper ends of the normalized output domain, whereas the B set is centered at 0.50. These output MFs are different from the trapezoidal input membership functions used for Contributor 1; the uniform overlap rule applied to the numerical input thresholds does not modify the output-scale definition.
Table 12 summarizes the corresponding parameters.
The above arrangement maintains ordinal significance (A < B < C) while producing an individual defuzzified index. A triangular MF provides smooth and simple overlaps among rules. Therefore, the output has a corresponding triangular membership function, as illustrated in
Figure 4. This configuration maintains interpretability (A/B/C) while allowing scalar defuzzification when a numeric score is required alongside the label [
40].
B. Knowledge representation—Establishment of fuzzy rules [
47]. The fuzzy rules are configured in order to convert the system’s input value into an outcome, including all potential data-effect combinations. The IF-THEN rule-based system comprises two components: the IF antecedent and the THEN consequent. A rule is established by choosing one or more input variables and a single output variable. The guidelines for decision encoding are presented in
Table 13.
For this model, fuzzy rules can be extracted. For example:
- •
If (Value 1a is A) and (Value 1b is A) and (Value 1c is A), then (Score_of_Value 1 is A)
- •
If (Value 1a is B) and (Value 1b is A) and (Value 1c is A), then (Score_of_Value 1 is B)
C. Fuzzy inference—Rule processing. In this phase, the Decision Maker is established, during which all rules are assessed. Following the induction process, the system arrives at a conclusion based on the contributions of each rule. The inference mechanism relies on the Mamdani approach. The authors implement this policy as a Mamdani Fuzzy-Inference System (FIS) in MATLAB’s Fuzzy Logic Designer [
47]. These mirror expert min-max reasoning and produce stable, interpretable results.
D. Defuzzification. The final section of a fuzzy-logic system is the defuzzification process, which transforms the aggregated output fuzzy set into a single numerical value. Numerous defuzzification strategies exist; however, none are grounded in theoretical principles. The primary criterion for picking an appropriate methodology is computational simplicity; therefore, in this paper, the centroid method is preferred. Generally, employing the default centroid approach suffices for the majority of applications. Centroid defuzzification yields the center of gravity of the fuzzy set along the
x-axis. The centroid is calculated using the formula in which μ (xi) represents the membership value of point xi within the universe of discourse. With the centroid method, the aggregated output set is converted to a scalar in [0,1] [
23,
47]. Subsequently, when the View-Rules command is executed, the FIS is displayed. One can intervene in the system, altering the input values to observe the related ‘Score of Value 1—Tap Condition’.
The output ‘Score of Value 1—Tap Condition’ will yield a number 0–0.33 if the Tap Condition is in a good state; 0.33–0.66 if the Tap Condition is in a fair state, and 0.66–1 if the Tap Condition is in a critical state.
Table 4 presents the results and their corresponding score.
Figure 5 presents the FIS model used to determine the Score of Value 1 (TAP Condition).
Figure 5.
FIS for ‘Score of Value 1—Tap Condition’.
Figure 5.
FIS for ‘Score of Value 1—Tap Condition’.
2.4.2. Fuzzy-Inference System for ‘Score of Value 2—Tap-Diverter Switch’
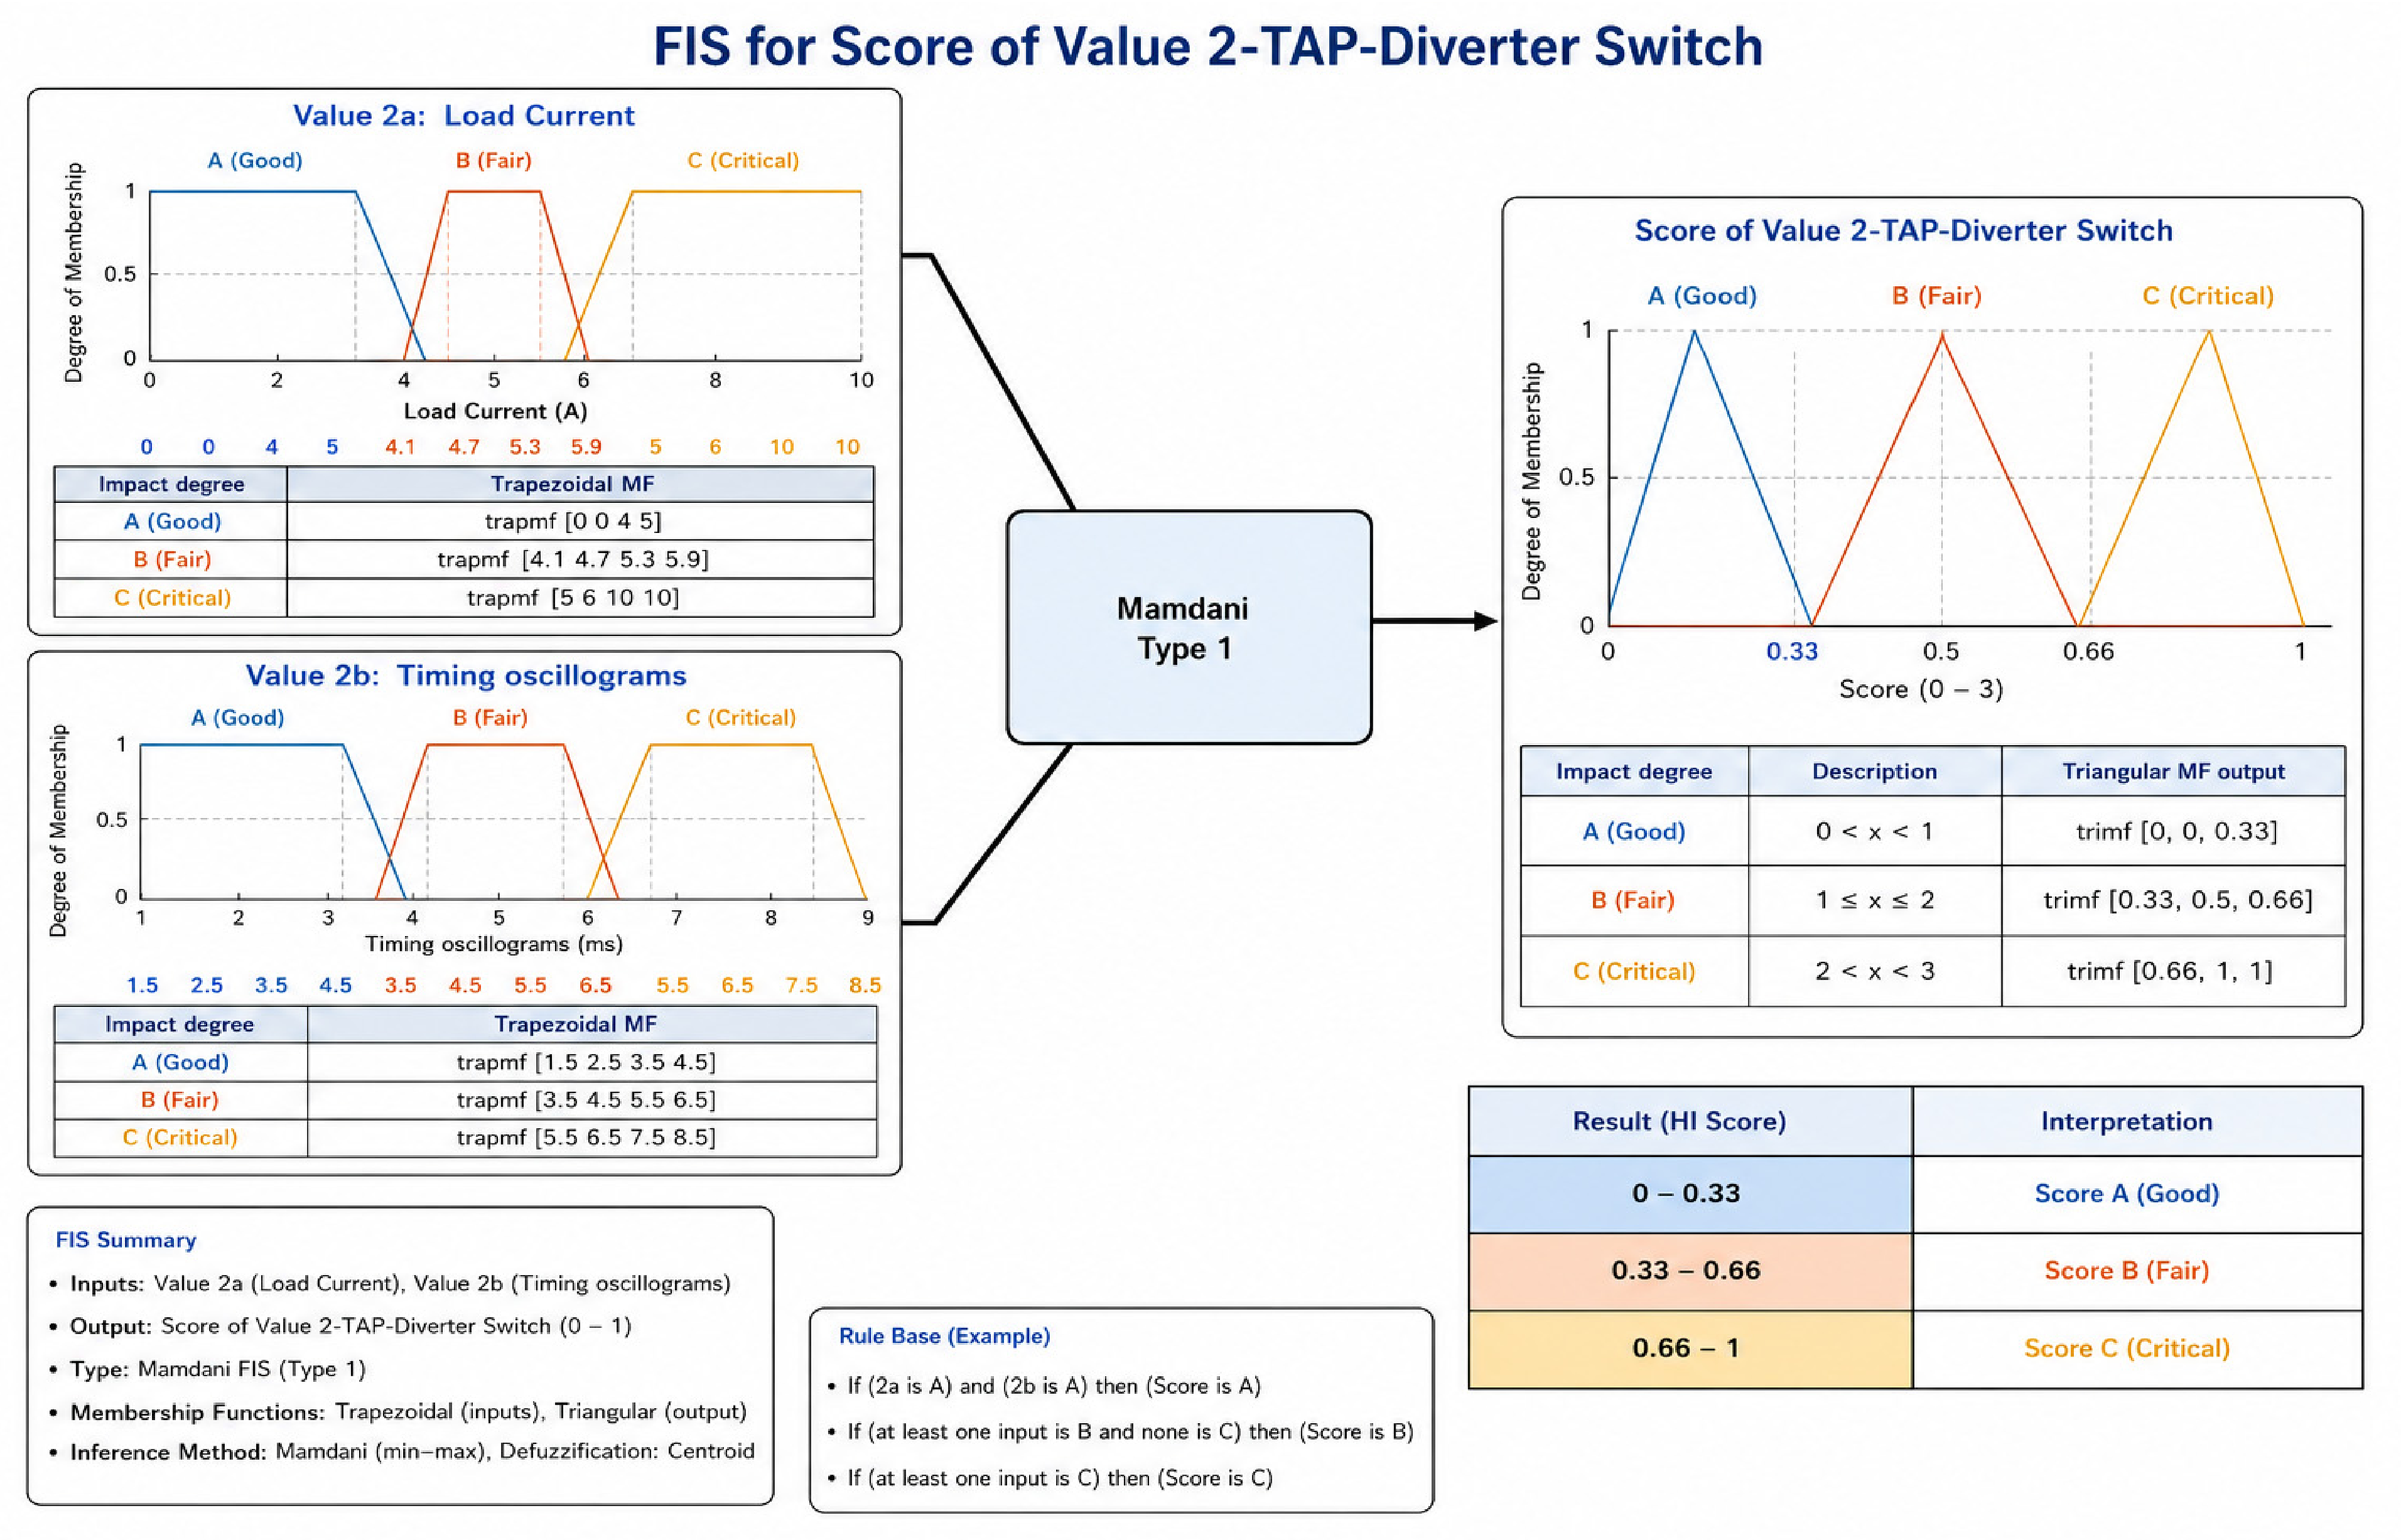
This sub-model estimates the scoring of specific parameters, namely ‘Score of Value 2—Tap-Diverter Switch’, through the application of measured data. The following procedure is similar to the method described above for Score of Value 1. The Mamdani-type FIS synthesizes three heterogeneous indicators—Value 2a: Load Current, Value 2b: Timing Oscillograms—into a single categorical outcome, the Score of Value 2.
Table 14 illustrates the input partitioning, and the following method is shown in
Figure 6.
2.4.3. Fuzzy-Inference System for ‘Score of Value 3—Motor Drive Unit’
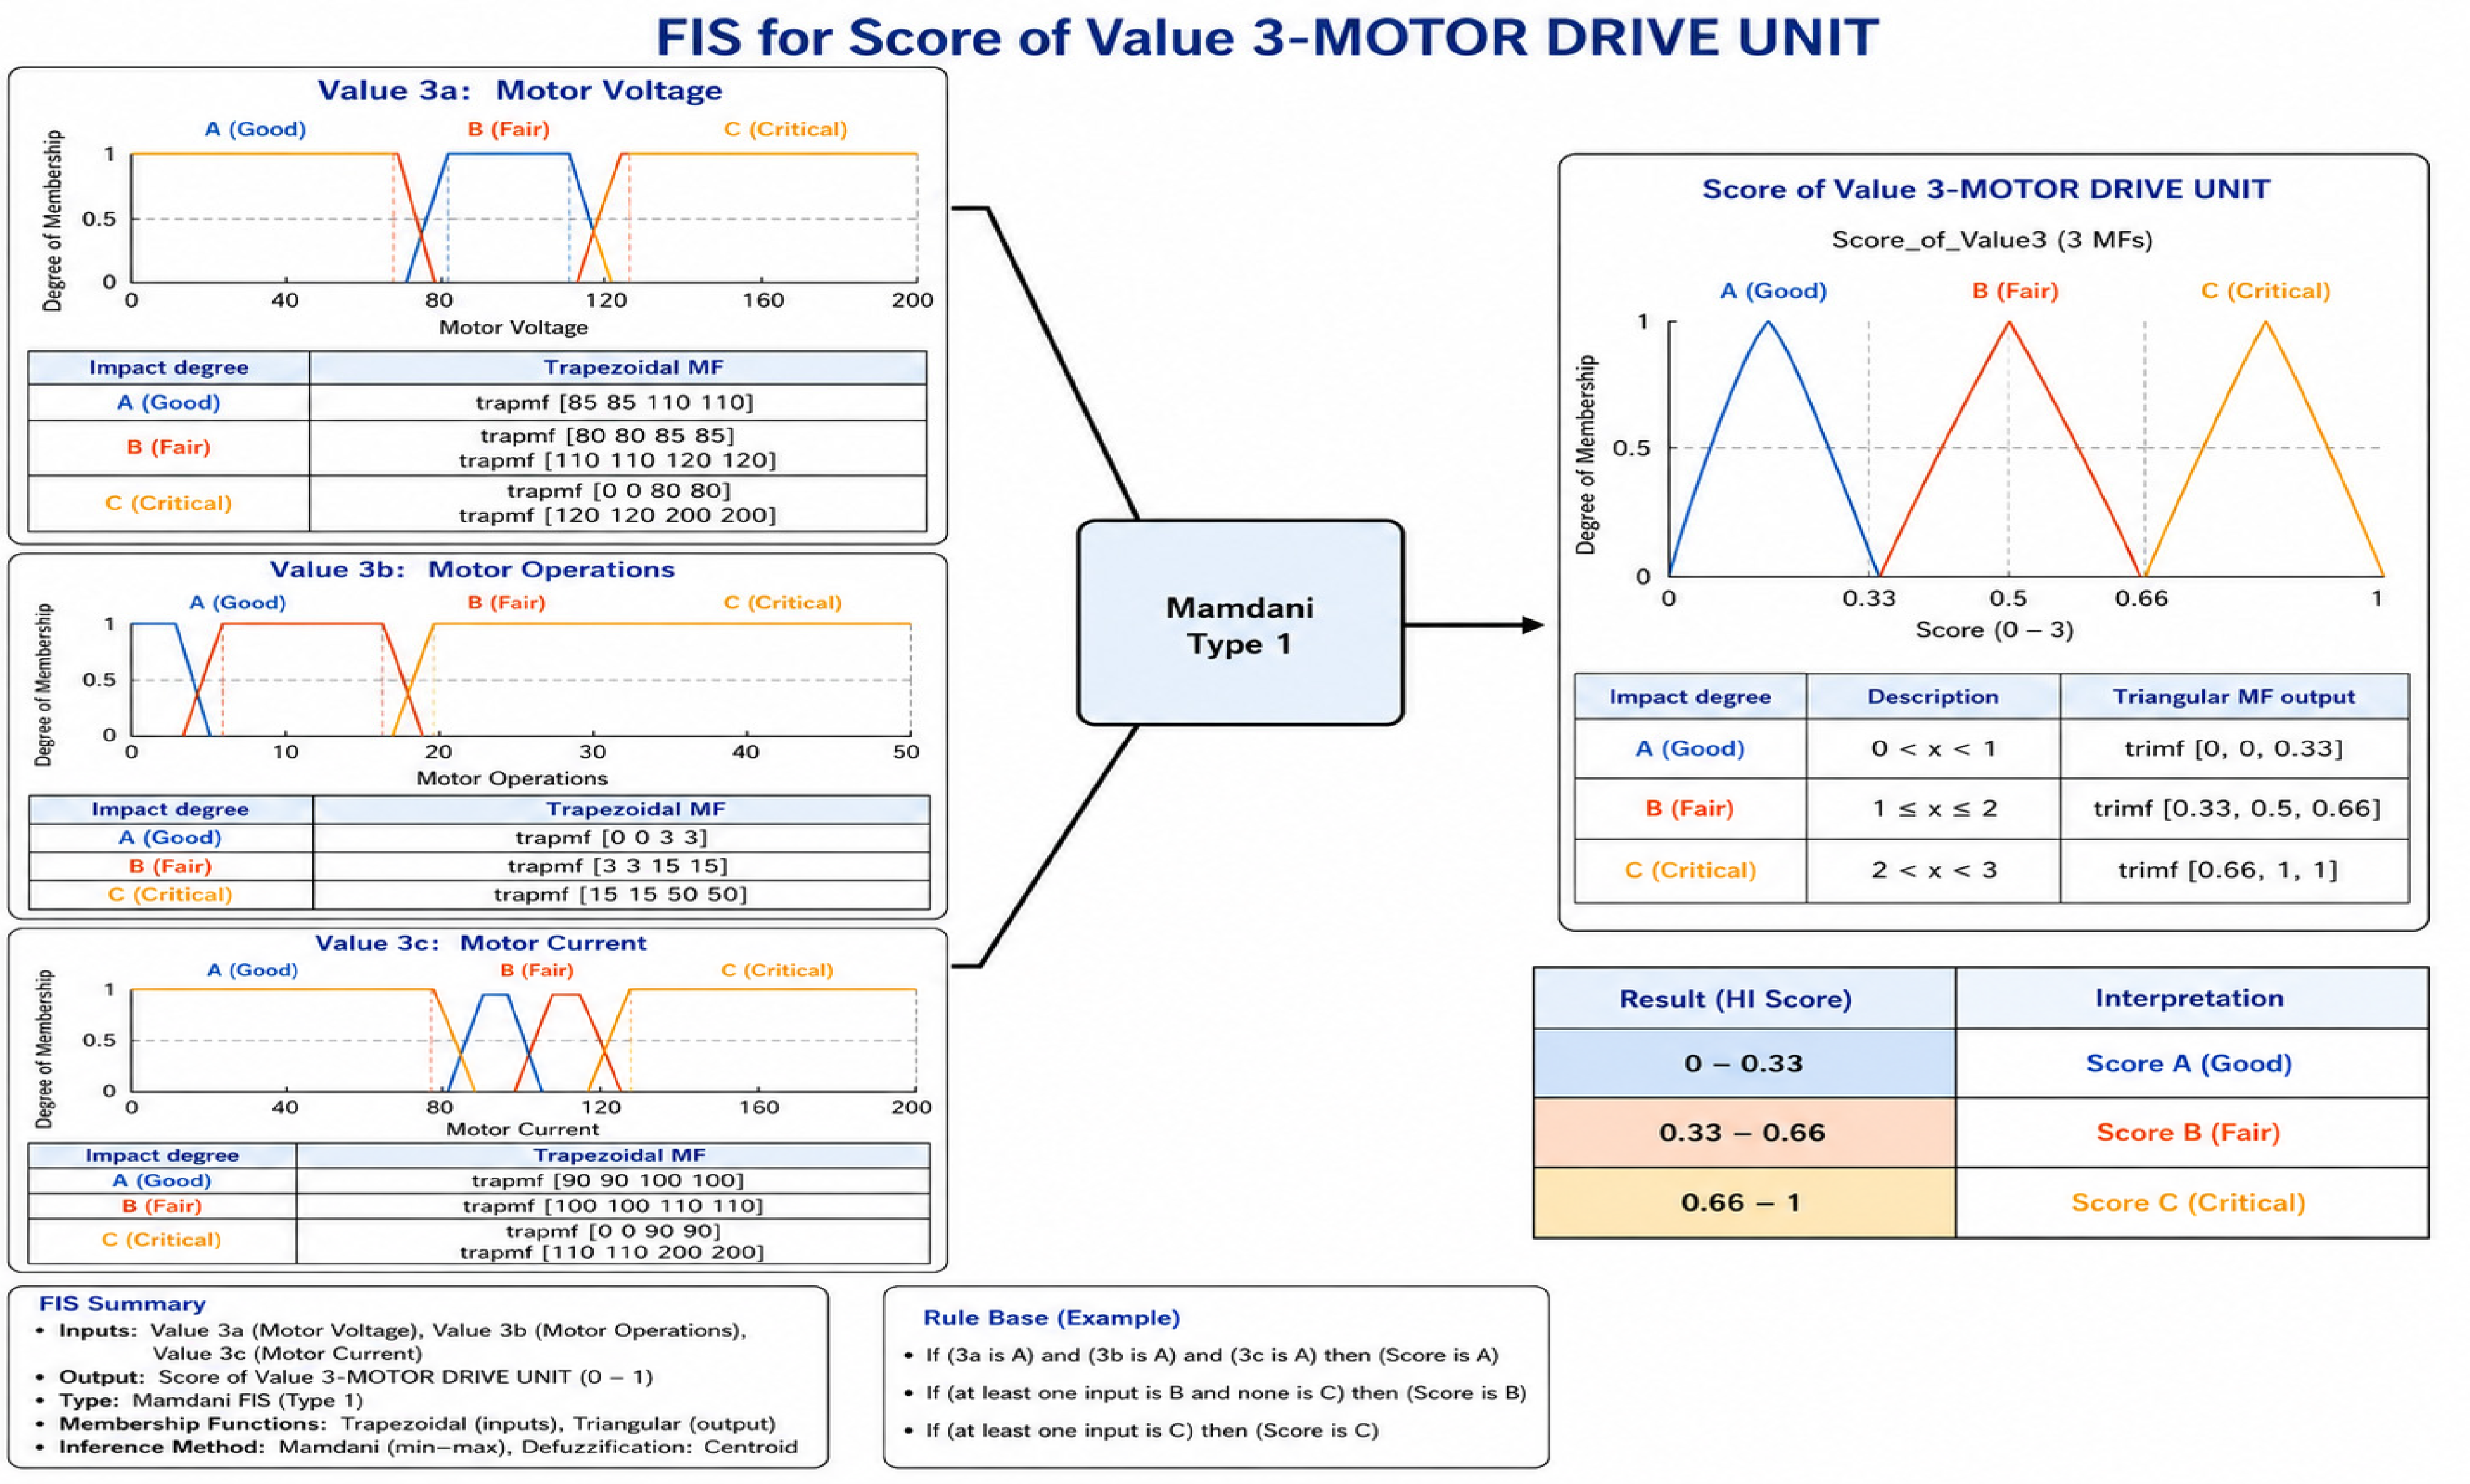
In this case,
Table 15 illustrates the input partitioning, and the following method is shown in
Figure 7.
2.4.4. Fuzzy-Inference System for ‘Score of Value 4—Tap Driveshaft Grade Visual Inspection’
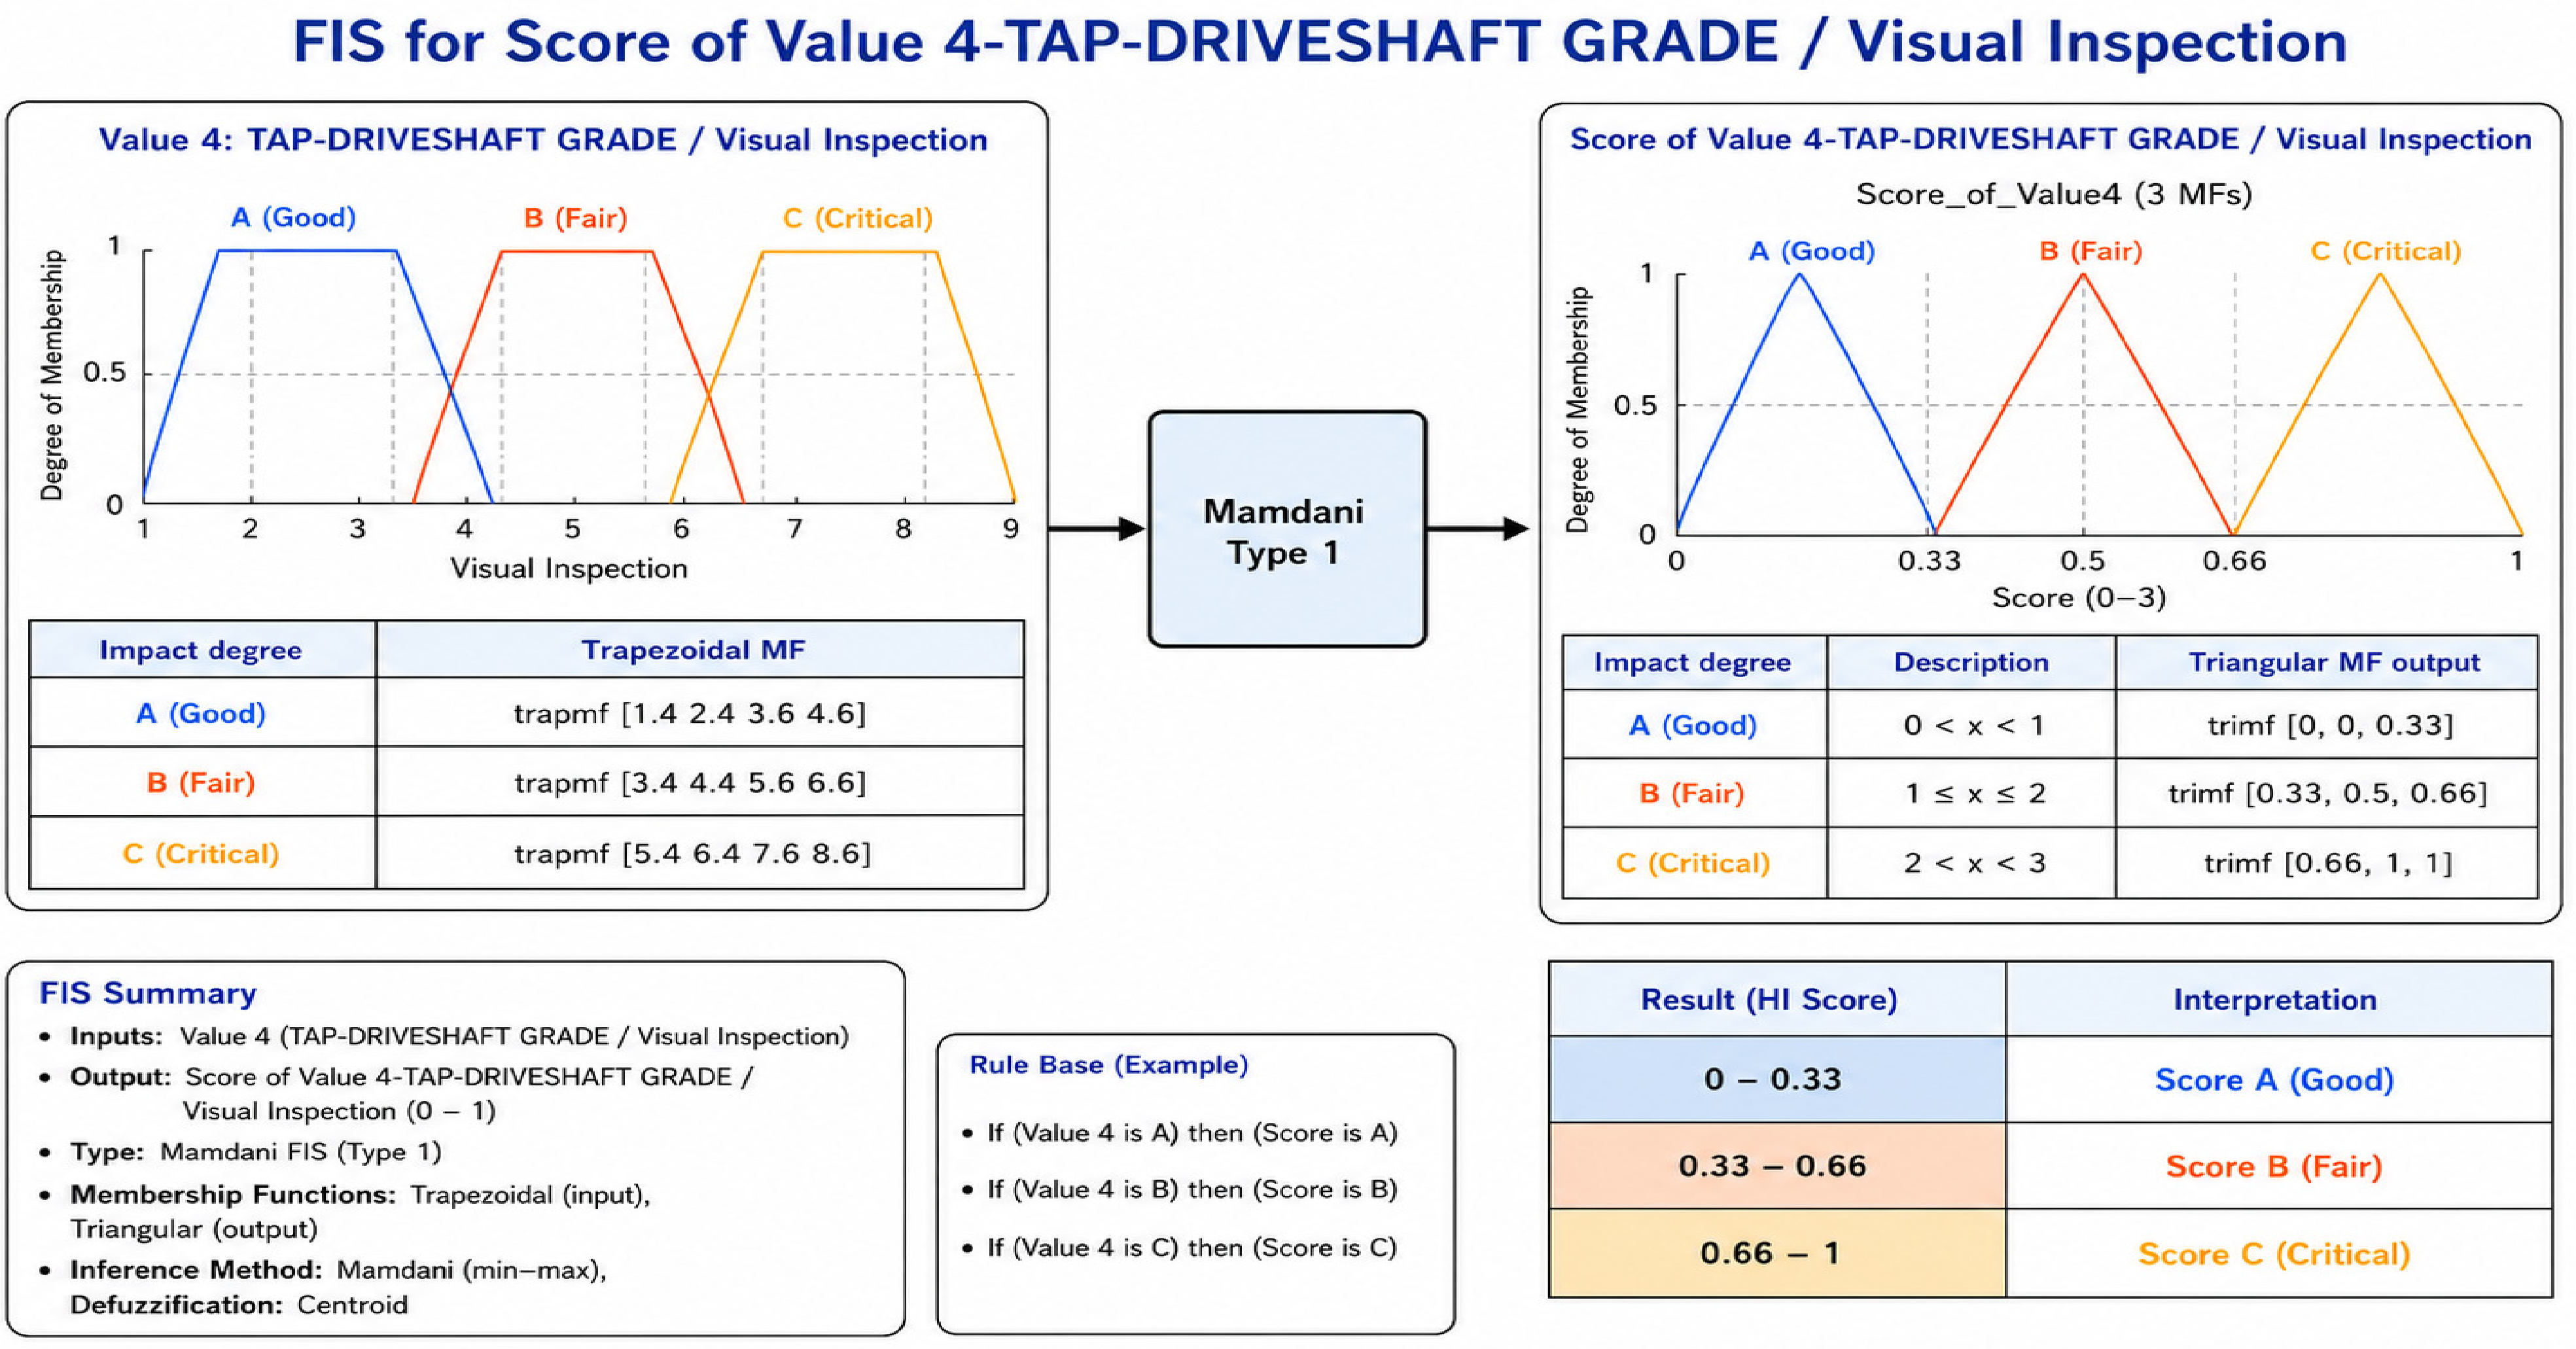
The following process is identical to the preceding method for Score of Value 1, and the following approach is depicted in
Figure 8.
2.4.5. Fuzzy-Inference System for ‘Score of Value 5—Tap Protection Devices’
This sub-model estimates the scoring of specific parameters, namely ‘Score of Value 5—Tap Protection Devices’. The procedure and the FIS model are similar to the method described above for ‘Score of Value 4—Tap Driveshaft Grade Visual Inspection’.
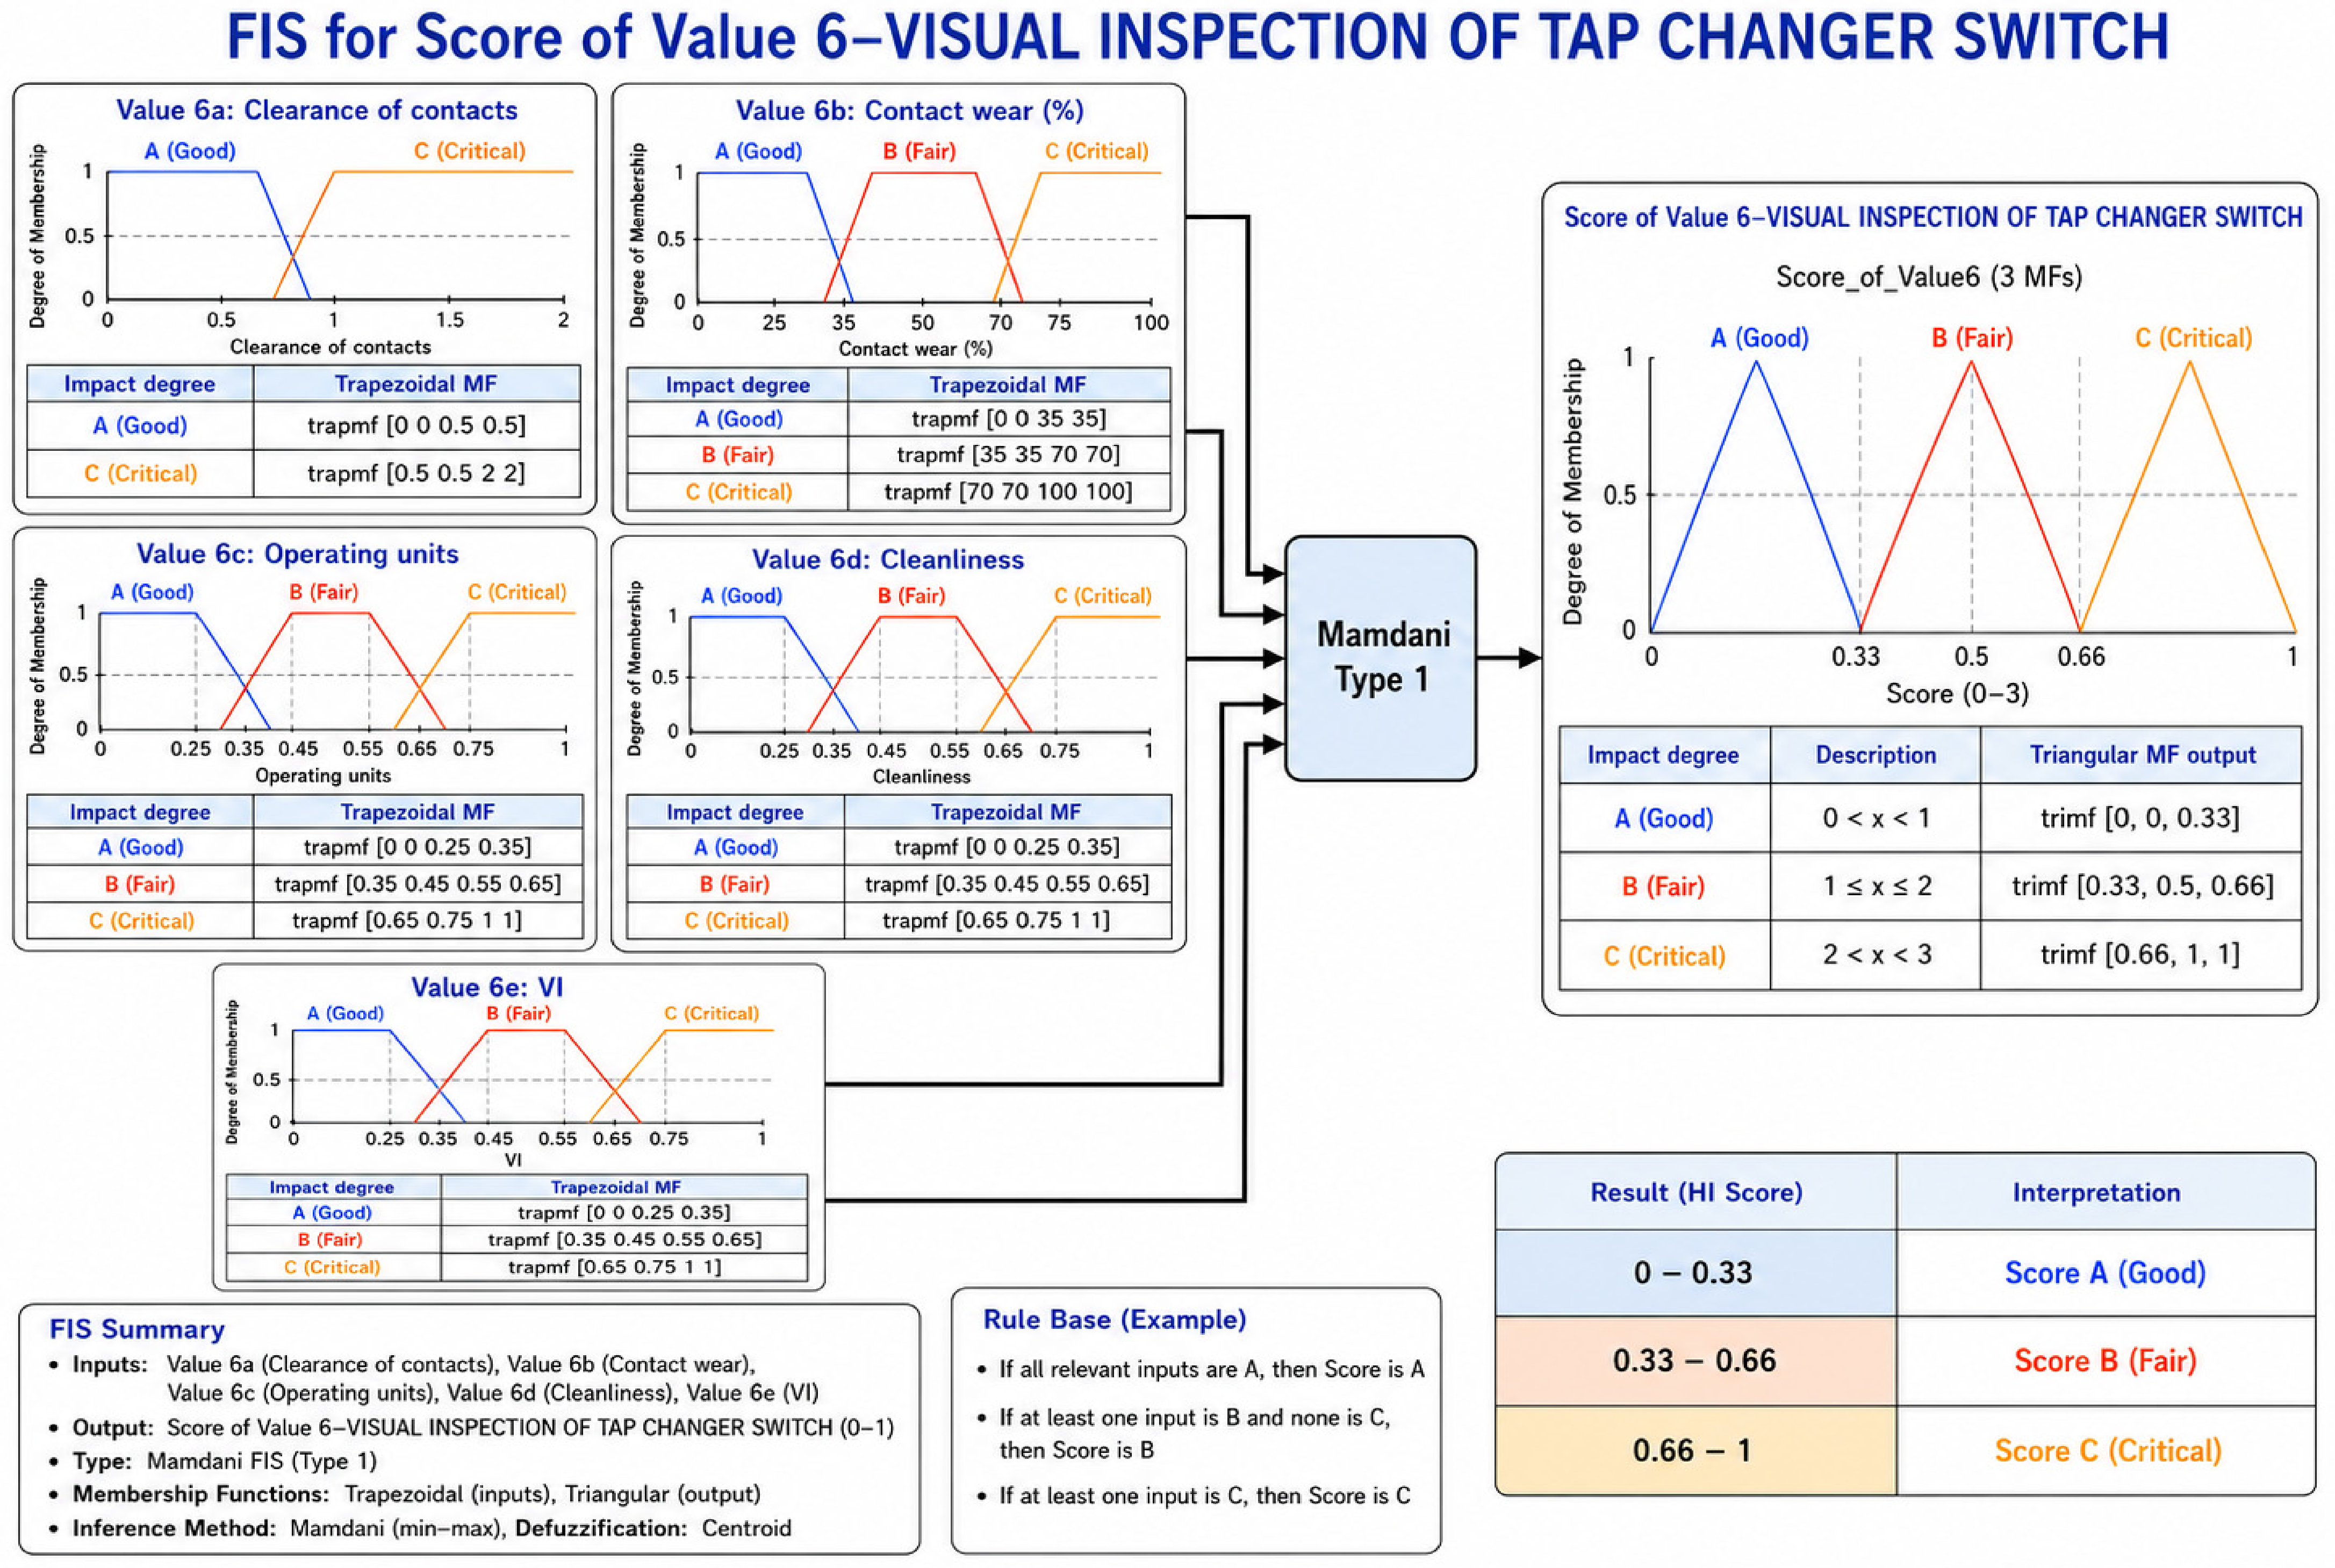
2.4.6. Fuzzy-Inference System for ‘Score of Value 6—Visual Inspection of Tap Changer Switch’
This sub-model estimates the scoring of specific parameters, Score of Value 6—VI. This Mamdani FIS computes the Score of Value 6 from Value 6a—Clearance of contacts, Value 6b—Contact wear, Value 6c—Springs/connections/bolts, Value 6d—Cleanliness of diverter housing, Value 6e—Control & mechanism cabinet (
Table 16,
Figure 9).
2.5. Integrated Fuzzy Health Index Model for OLTC Condition Assessment
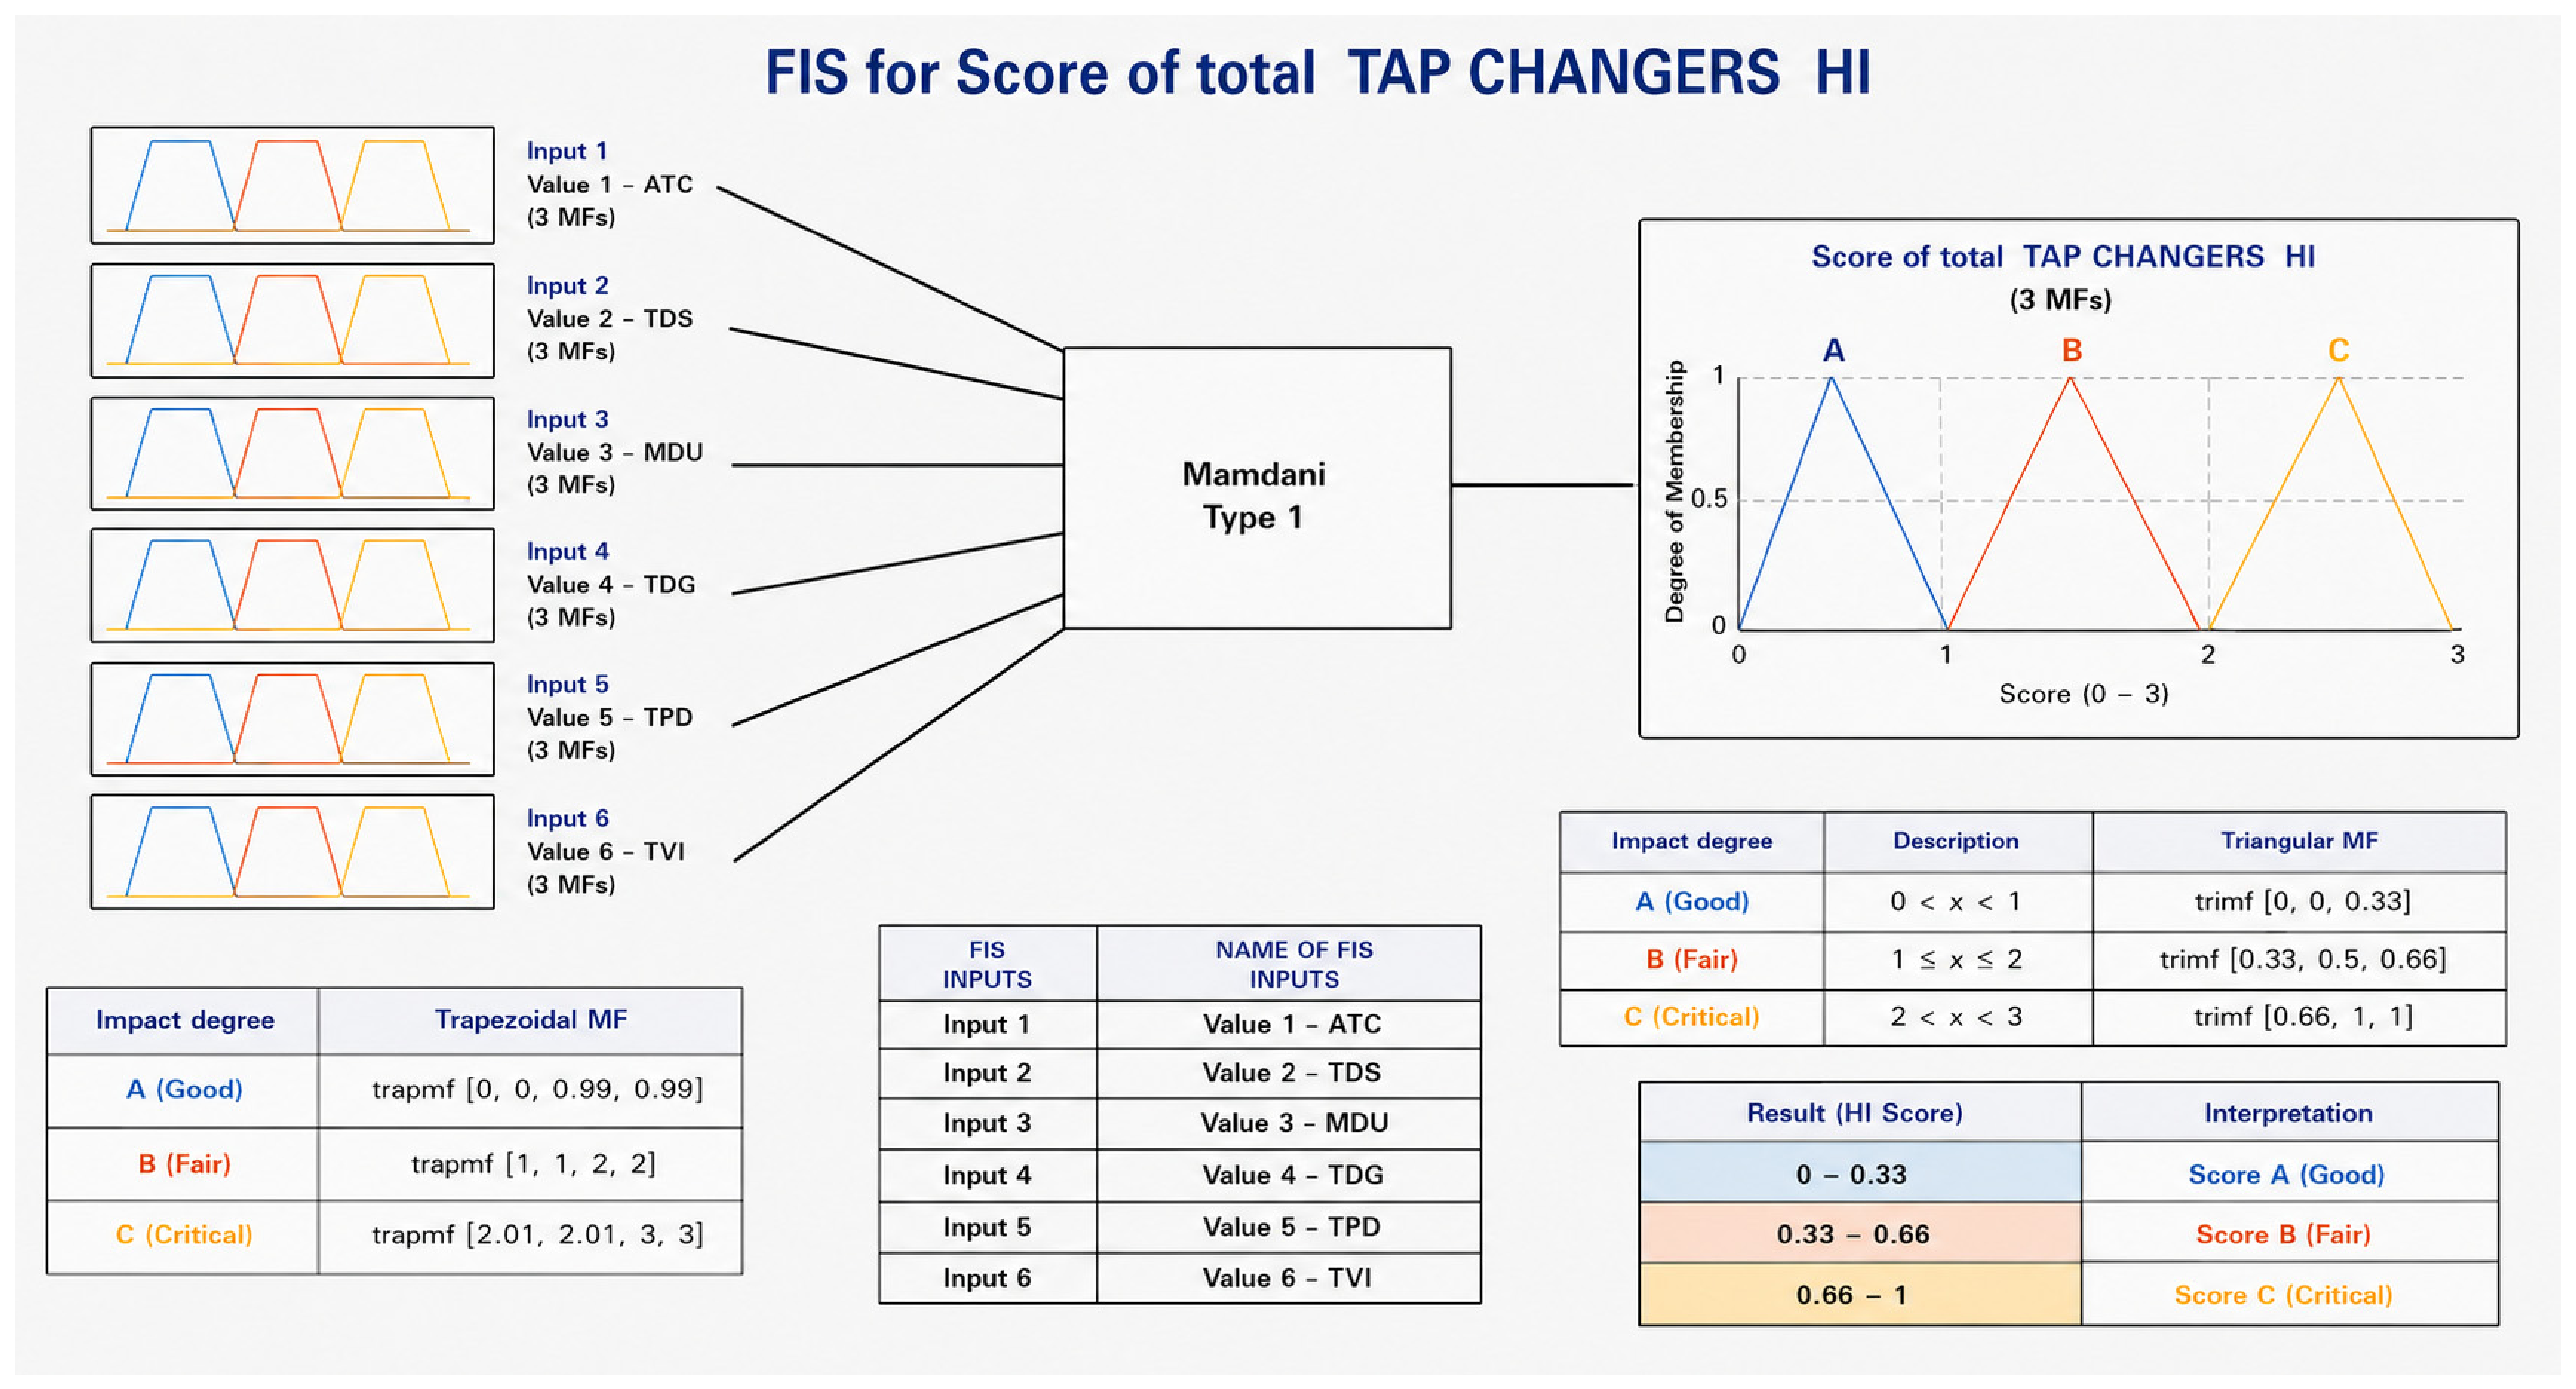
The six sub-fuzzy models are integrated to establish a comprehensive health evaluation system for OLTC. Therefore, the Final Fuzzy model is formed by using six inputs and one output.
Fuzzification—the Fuzzy Variables Determination for ‘Score of Tap Changers HI’
The six sub-contributors of the OLTC are identified as fuzzy variables, and then the definition of Membership Functions (MFs) follows. The six sub-contributors are defined as inputs to the FIS as shown in
Figure 10.
All six inputs share the same universe [0, 3] [0, 3] [0, 3]. To precisely keep to the strict and open bounds in the definitions, trapezoidal membership functions with minimal gaps around 1 and 2 have been employed, ensuring that the sets do not overlap at the boundaries:
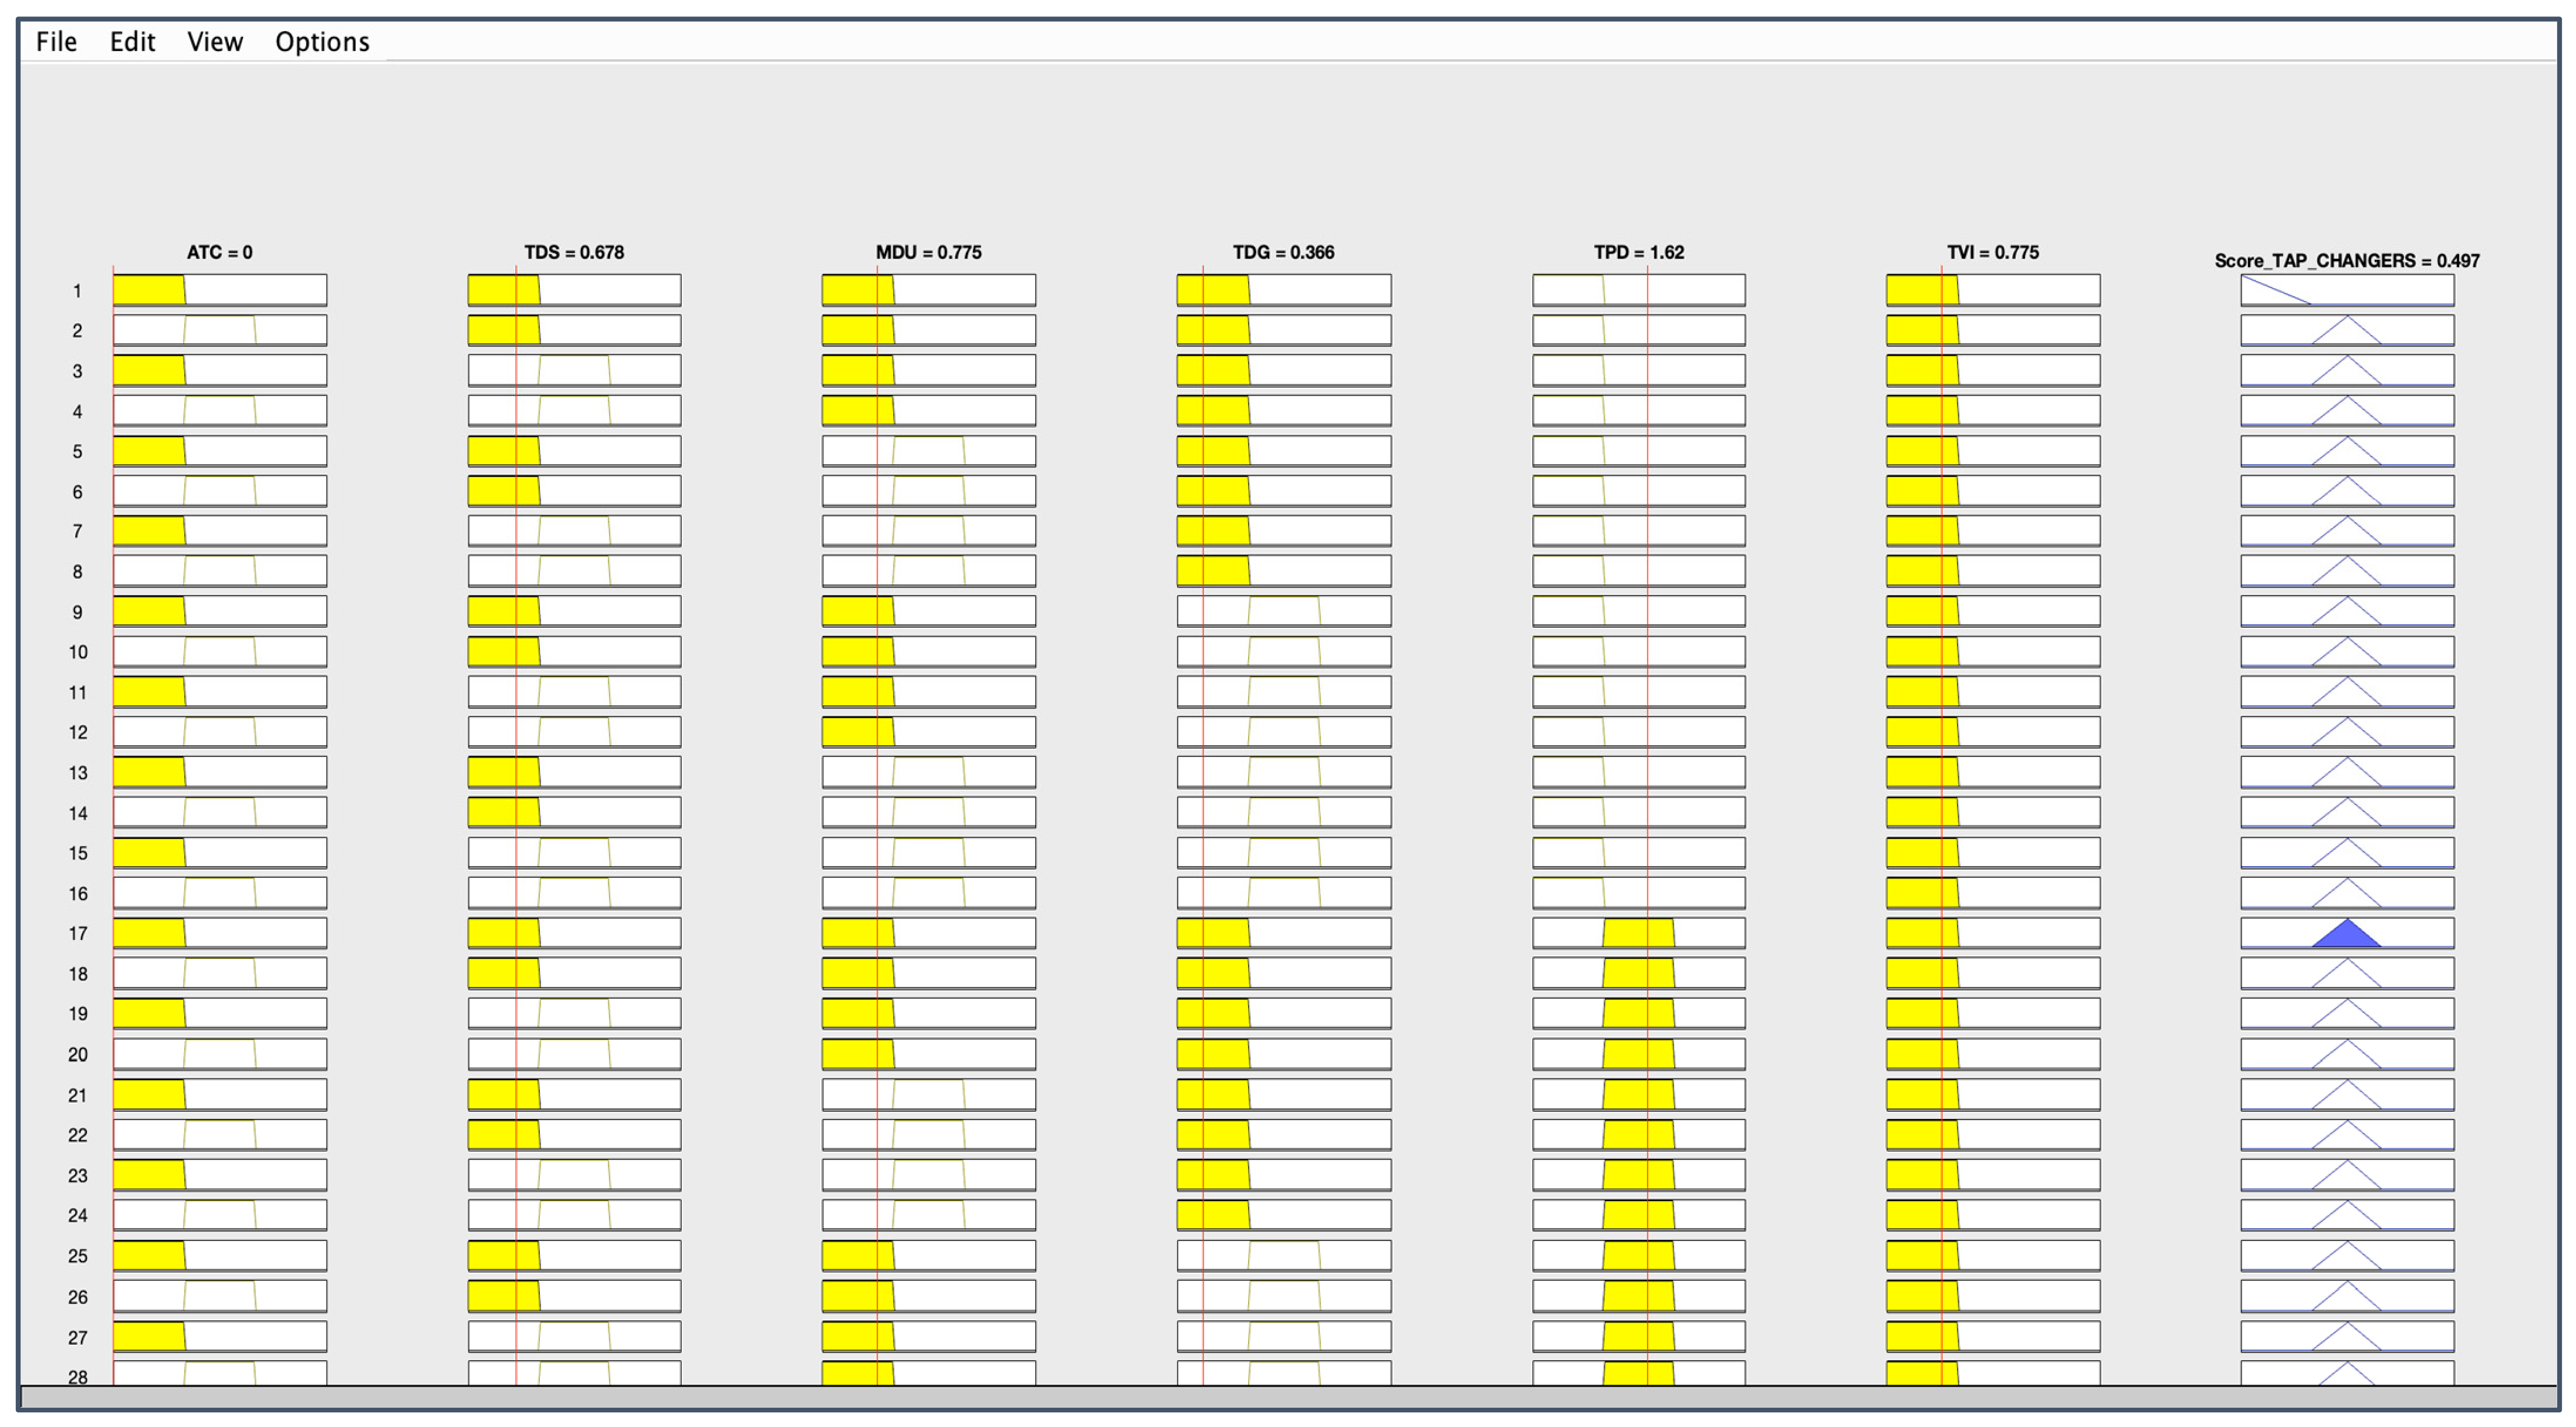
Subsequently, when the View-Rules command is executed, the FIS outcomes are displayed. One can intervene in the system by altering the input values to observe the corresponding Tap Changer HI. The Rule Viewer is illustrated in
Figure 11.
Shape Indication: Each column represents a variable, while each rule constitutes a row of plots. The initial six columns of plots (yellow) illustrate the membership functions associated with the antecedent, or the if-clause of each rule. The seventh column of plots (blue) displays the membership functions associated with the consequent, or the then-part, of each rule. The output ‘Score of Tap Changers HI’ will yield a number 0–0.33 if the tap changers are in good condition; 0.33–0.66 if the tap changers are in fair condition, and 0.66–1 if the tap changers are in a critical state.
2.6. System Integration in Simulink and Rule View
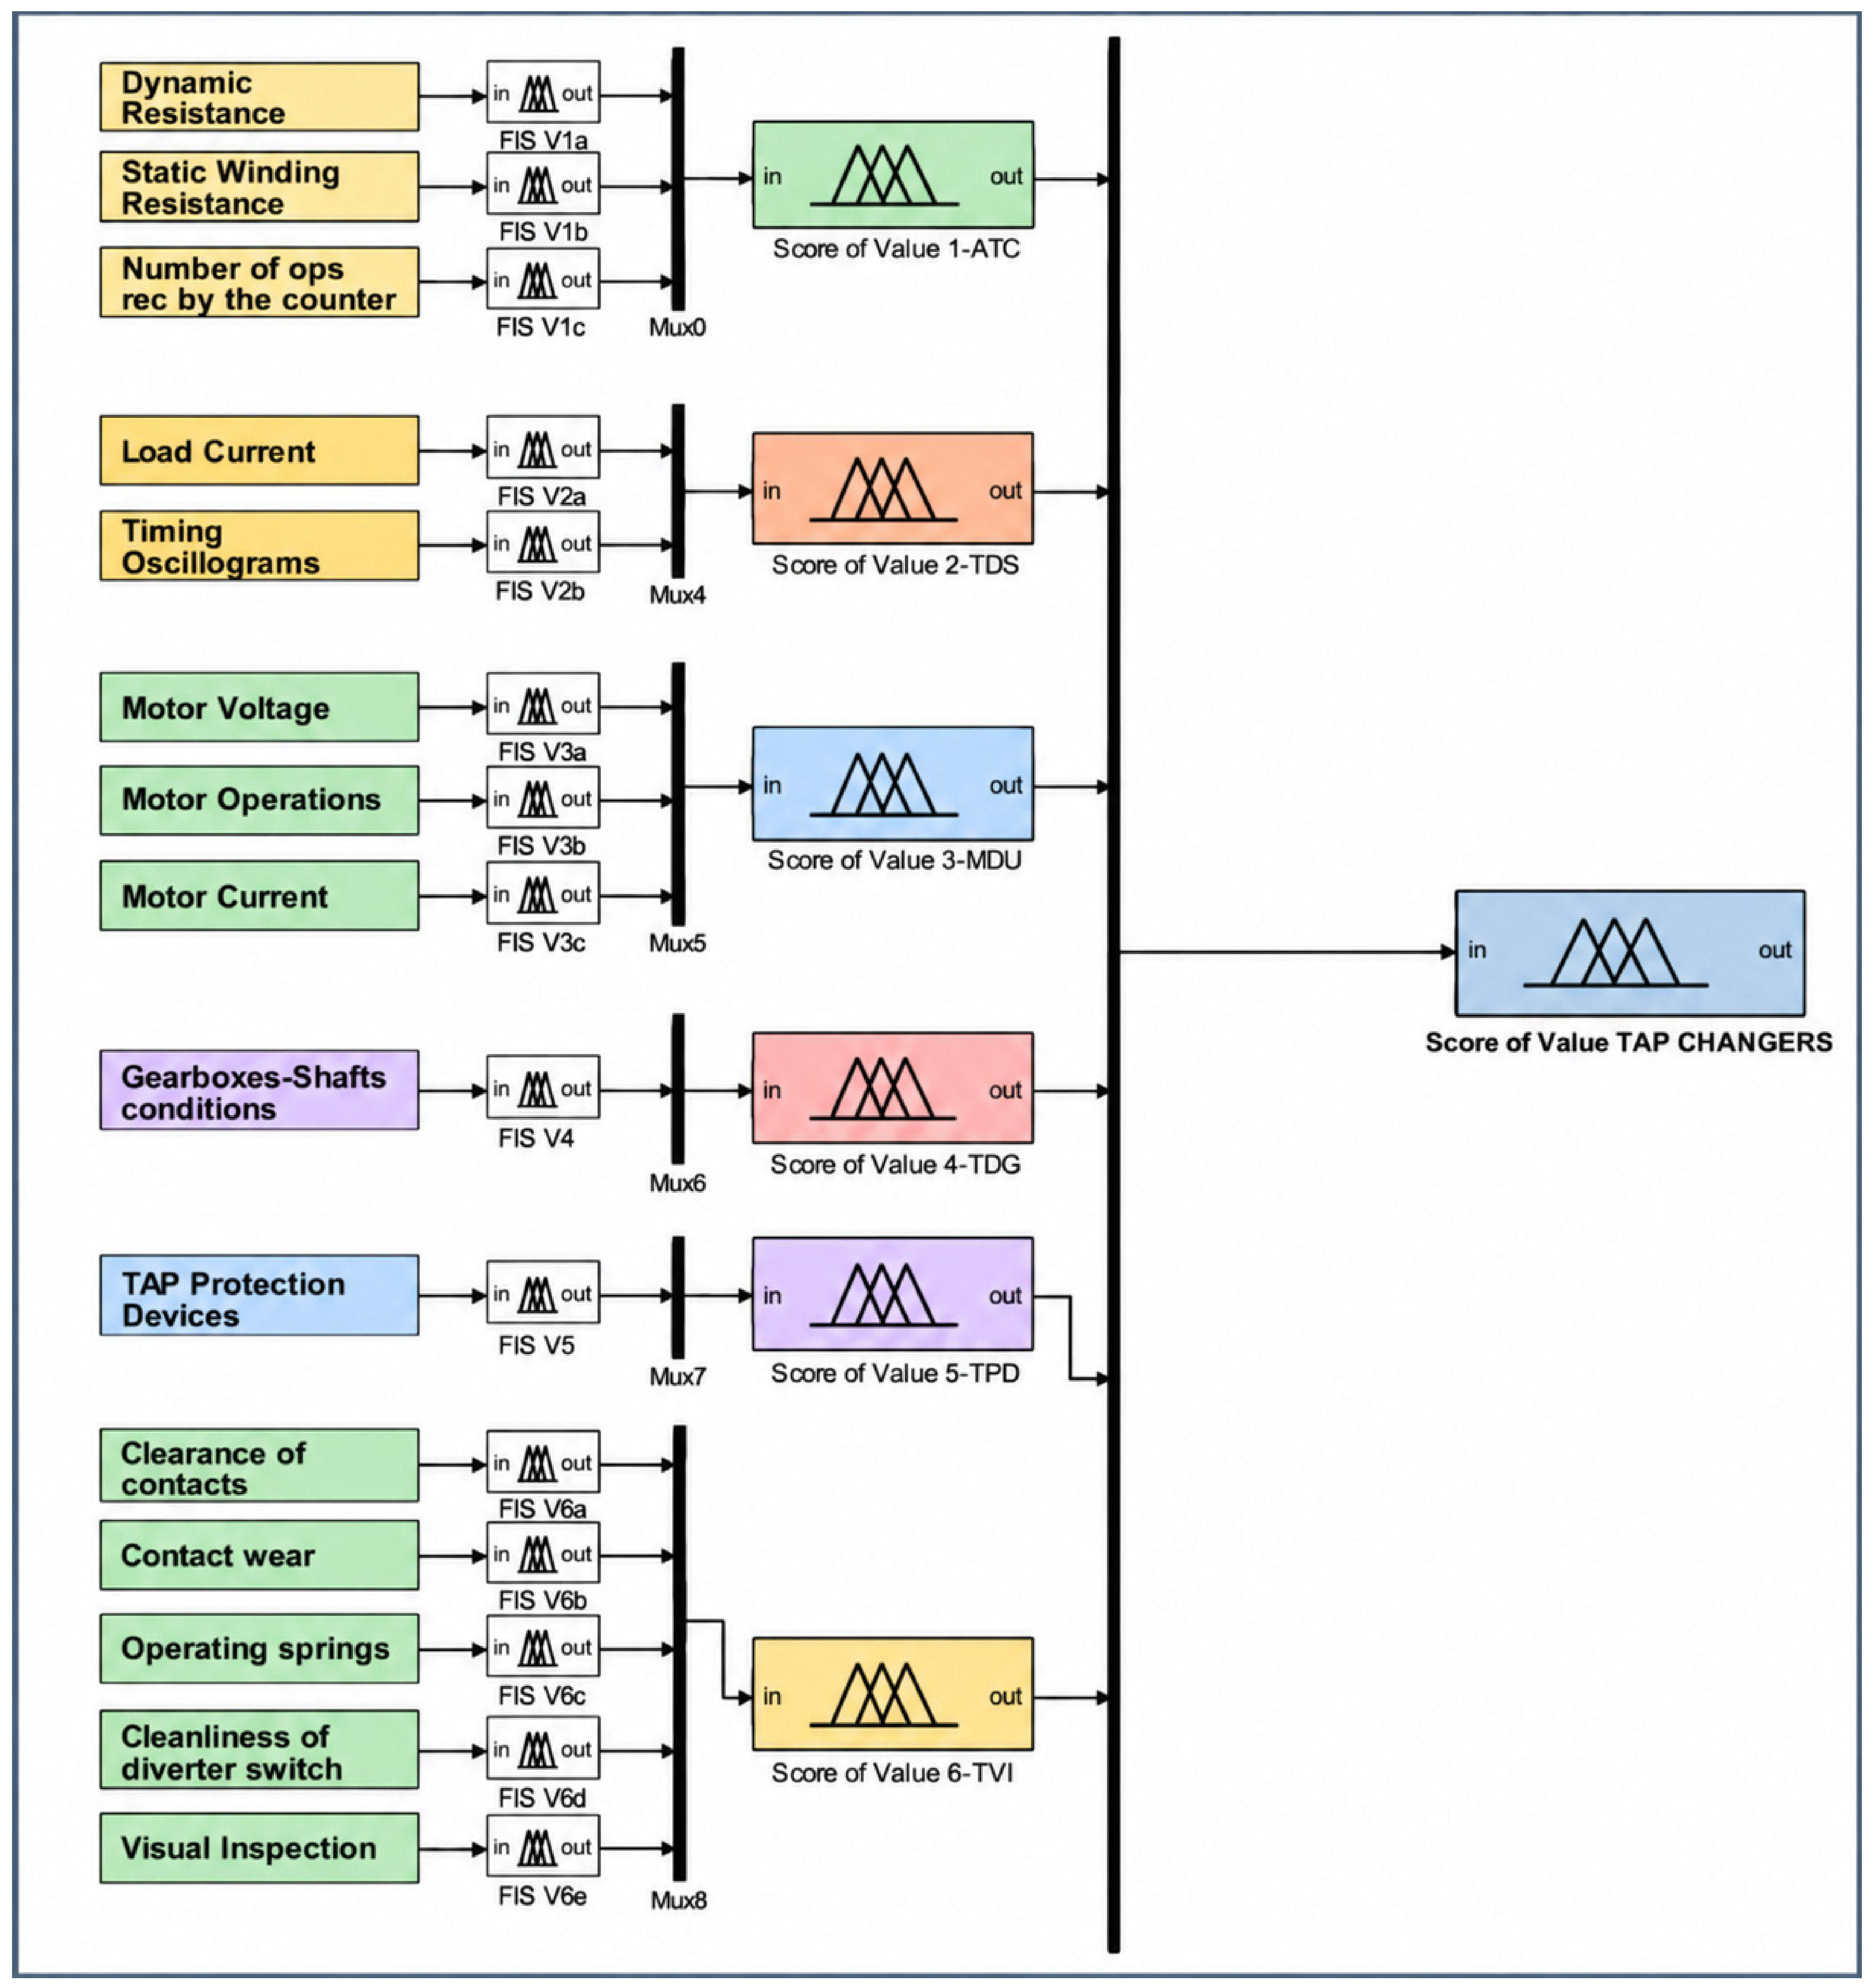
Subsequent to the formulation of distinct FIS for each sub-contributor and the final integration of them into the entire HI model, the comprehensive health evaluation system for OLTC is implemented in MATLAB Simulink. Simulink offers a block-diagram framework that interfaces with MATLAB’s Fuzzy Logic Designer, facilitating dynamic modeling of the HI prediction process based on the FIS outlined in previous sections. The Simulink diagram manages the FIS blocks constructed in the Fuzzy Logic Designer and arranges them in a three-layer structure [
47]: (a) the initial layer represents blocks for the 15 FISs’ Values of Sub-Contributors, (b) the secondary layer represents six blocks for the FISs’ Sub-Contributors, (c) the third layer represents the ultimate defuzzified HI output. Each Simulink FIS block performs the Mamdani process—fuzzification, rule evaluation, aggregation, and defuzzification—using min-max operators and centroid defuzzification, as previously specified. The output variable is defuzzified into a crisp scalar representing the system’s final decision (the HI score) and its categorical label (A, B, or C). This framework makes the decision-making process measurable while offering a single quantitative metric appropriate for trend analysis and alerts. The whole system has been simulated in MATLAB Simulink and presented in
Figure 12.
3. Results and Discussion
This study proposes a comprehensive, component-wise fuzzy logic–based HI evaluation methodology for the OLTC of power transformers. This method aims to provide a more precise, more conservative, and interpretable evaluation of OLTC condition than conventional crisp-value methods by incorporating expert knowledge, diagnostic measures, and standards through a structured fuzzy-inference framework.
The fundamental methodological structure of the suggested HI framework is not strictly limited to this particular OLTC type, even if the current validation was carried out on twenty transformers fitted with the same OLTC model. Conventional OLTCs generally follow similar operating principles and condition-assessment logic. Therefore, modifying the diagnostic thresholds and membership-function parameters in accordance with the particular manufacturer, rating qualities, and maintenance needs would be the primary necessity for applying the suggested technique to different OLTC models. The inference process and general hierarchical structure would not change. However, before the quantitative findings can be more widely used, further validation on several OLTC models is needed.
To validate the accuracy of the suggested approach, many defective OLTC cases were assessed under various operational conditions. The procedure was implemented on twenty Power Transformers. These units comprised both newly commissioned transformers and aging assets displaying differing levels of mechanical and electrical deterioration. A collection of flawed OLTC scenarios was purposely included to evaluate the method’s sensitivity under actual operational conditions, including raised mechanical friction, defective contacts, or irregular actuation rates.
Table A1 in
Appendix A summarizes the HI estimation from the proposed FL methodology. Twenty Power Transformers equipped with ABB UCLRN 650/900 Y On-Load Tap Changers (BUE mechanism) are examined. Parameters/values (as presented in
Section 2) include dynamic and static resistance, number of operations, motor drive conditions, mechanical and protective device status, and visual inspections. All measurements for the parameters, Load Current and Timing Oscillograms indicate that they are in good condition. The last column illustrates the HI.
These parameters/values are inserted into the FIS block as Simulink signals, and the resulting HI score is produced at the output. It can be easily visualized using a Scope block, enabling the user to monitor the HI value during the simulation. Finally, the following results are obtained.
The OLTCs in T-6, T-7, T-9, T-10, T-16, T-17, and T-18 were designated as being in satisfactory condition, and T-1, T-3, T-4, T-8, T-11, T-13, T-14, T-15, and T-20 are in fair condition. Conversely, transformers T-2, T-5, T-12, and T-19 demonstrated a deficient health score, signifying the necessity for prompt maintenance. In general, the OLTC condition ranges from good to fair. Particularly, units with irregular resistance values, high tap changer operation counts, or protective devices marked “Service Needed” should be closely monitored if their Health Index is C. Preventive maintenance for these units should be scheduled during the upcoming service interval.
Table A2 in
Appendix A summarizes the results. Simulated inspections were conducted to identify the transformer’s health condition by inputting precisely similar measurement data into the fuzzy-logic model. The term “Health Index by Expert” refers to the reference condition classification assigned to each transformer based on the available diagnostic and condition data, evaluated according to criteria derived from international standards, statistical population studies, and expert knowledge.
The evaluation of the reference condition and the suggested FL model was conducted using the same input data. The diagnostic data were introduced into the suggested FL model without further modification or interpretation. The twenty datasets used for validation consist of actual measurements recorded from transformers operating in the field.
Table A2 in
Appendix A provides a summary of the comparative results.
Columns 2 and 3 present the HI estimation (numeric value and Condition Band). Column 4 outlines the Health Index (HI) of the proposed FL model. Column 5 (Agreement) denotes the presence of agreement between the two HI estimations. The final column delineates the recommended solutions. It is essential to note here that, although considerable advancements have been made, the literature from 2015 to 2025 identifies numerous gaps and issues that future studies must address, the most important being limited datasets and fault data availability.
The fourth column of
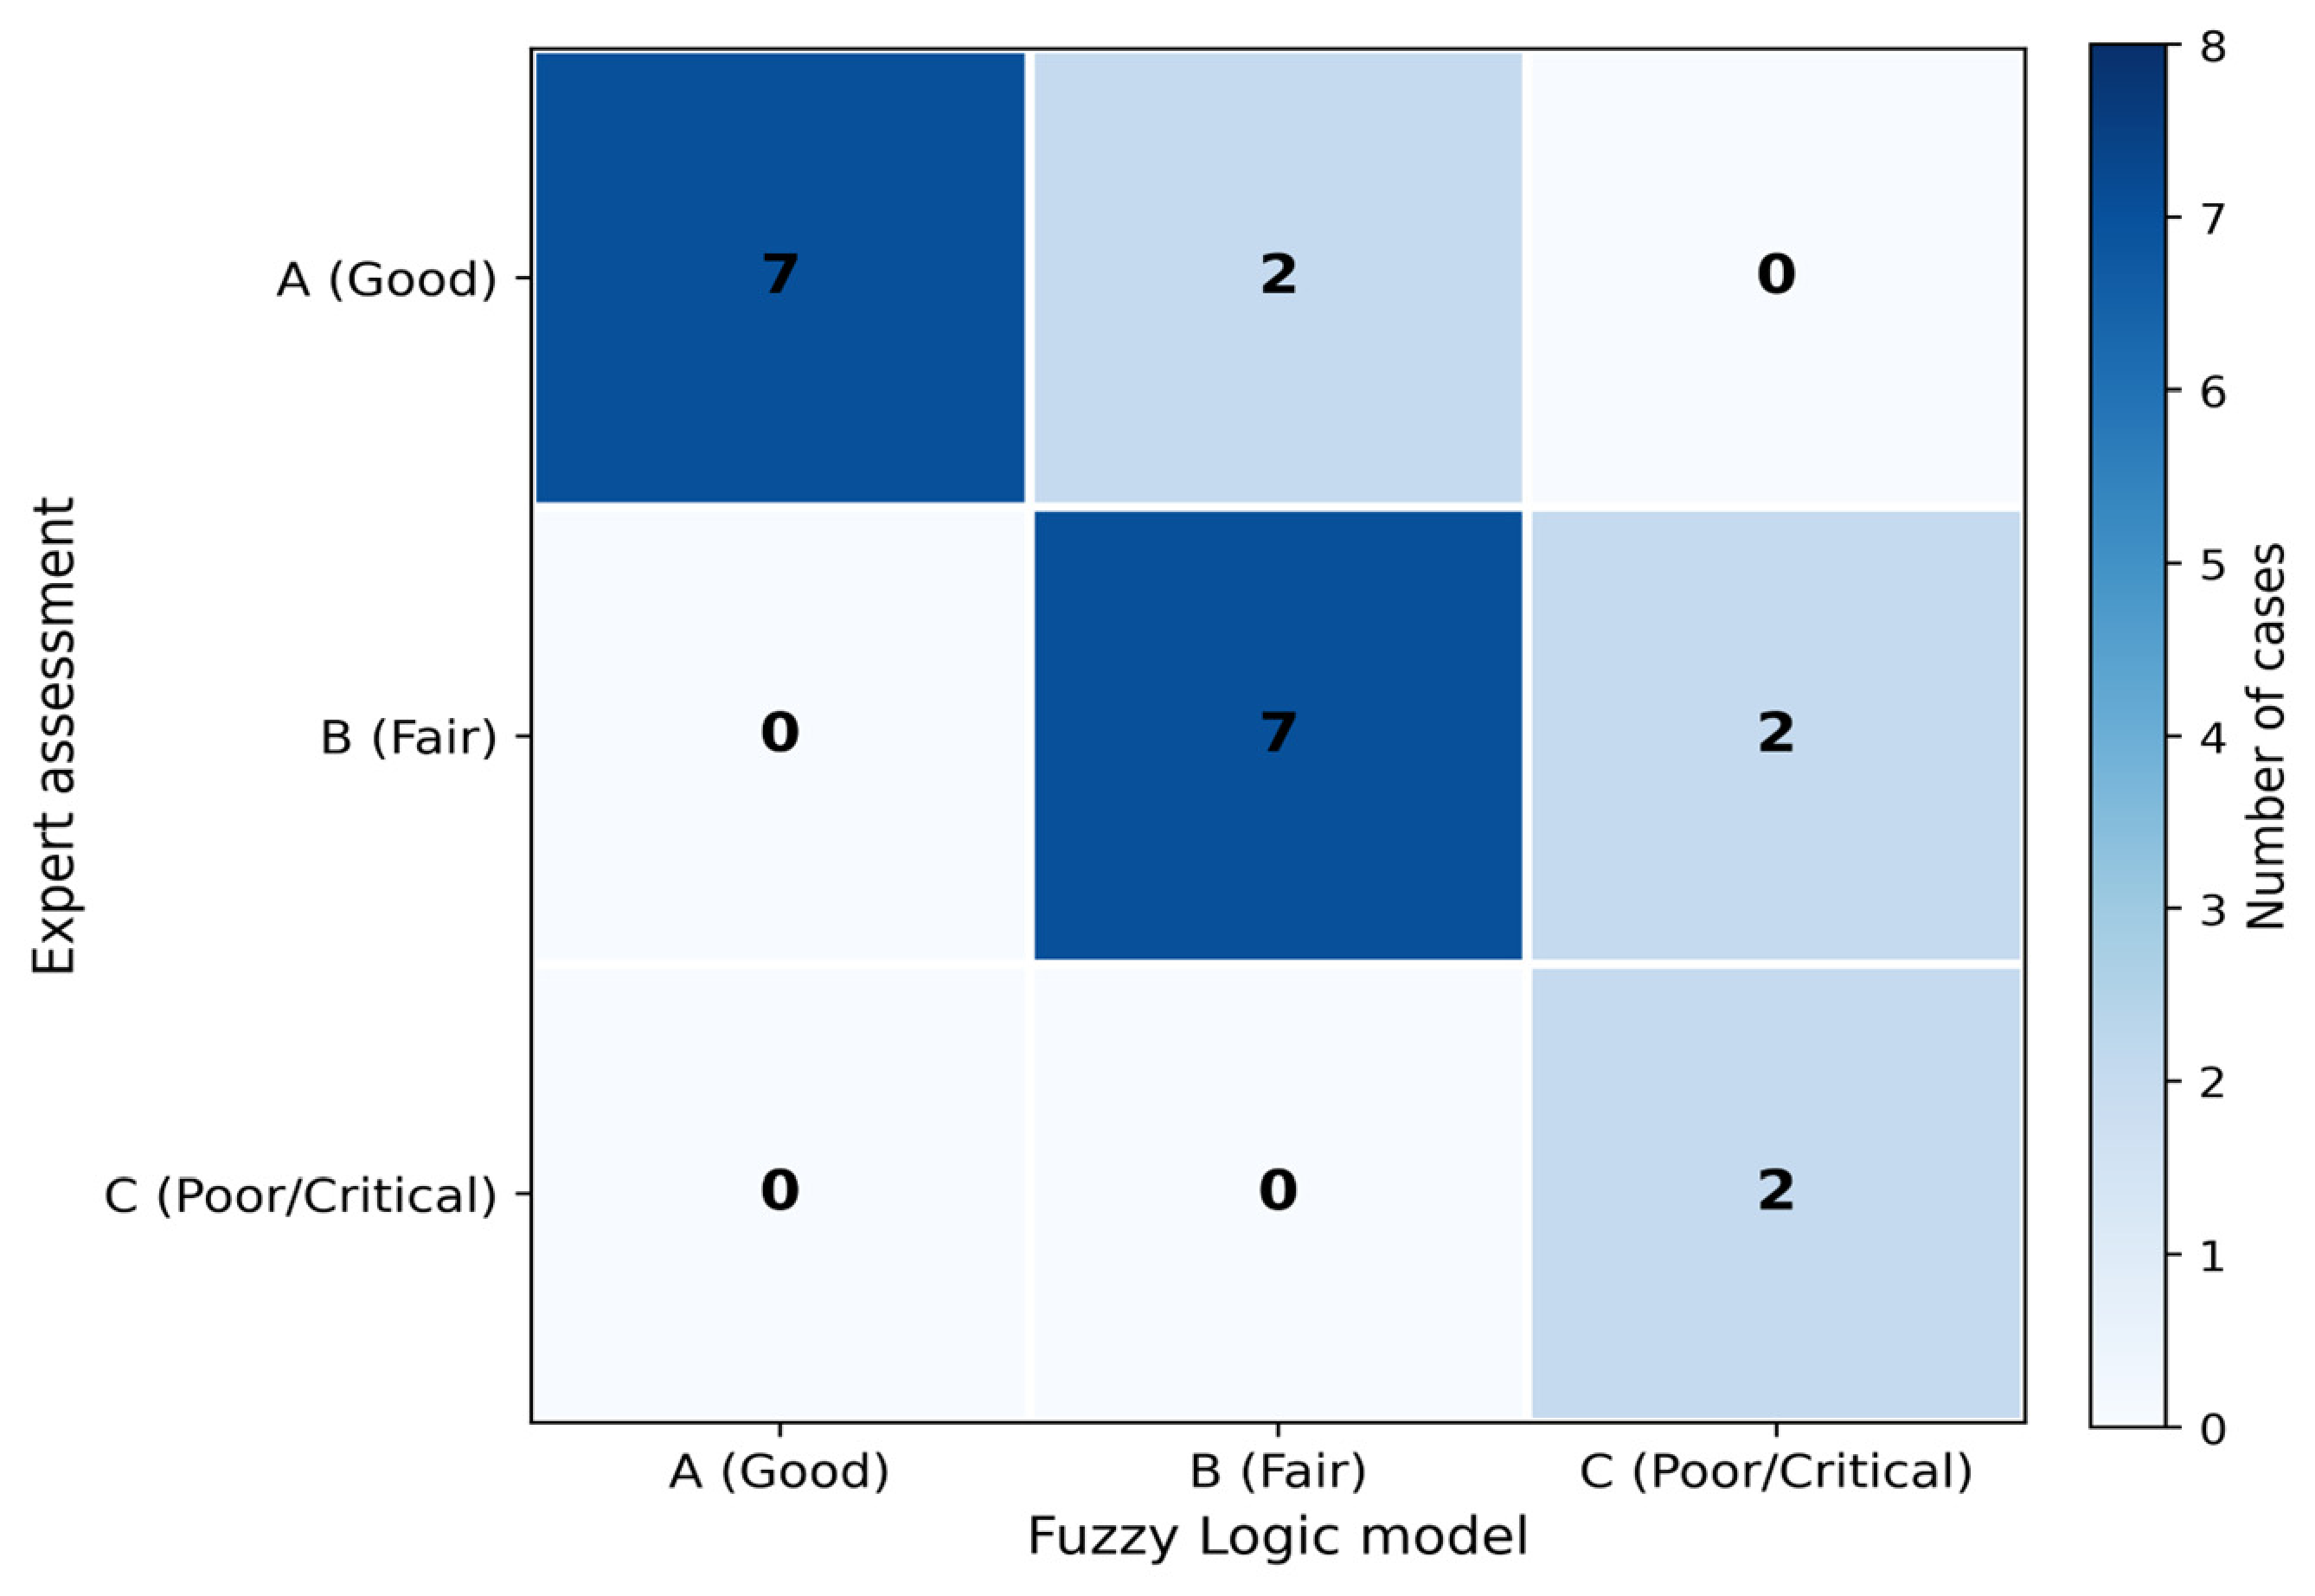
Table A2 indicates that just four of the twenty cases, transformers T-2, T-13, T-14, and T-19, demonstrated different condition classifications between the reference condition and the suggested FL model, yielding an 80 percent agreement rate. In each case, the FL model assigned a less favorable condition category than the reference assessment: T-2 and T-19 changed from B to C, whereas T-13 and T-14 changed from A to B. Consequently, all disagreements involved only one adjacent condition level; no direct A-to-C or C-to-A disagreement was observed.
These differences indicate the conservative behavior of the adopted rule base and should not be interpreted as evidence that the fuzzy model provides a more accurate diagnosis than the reference assessment.
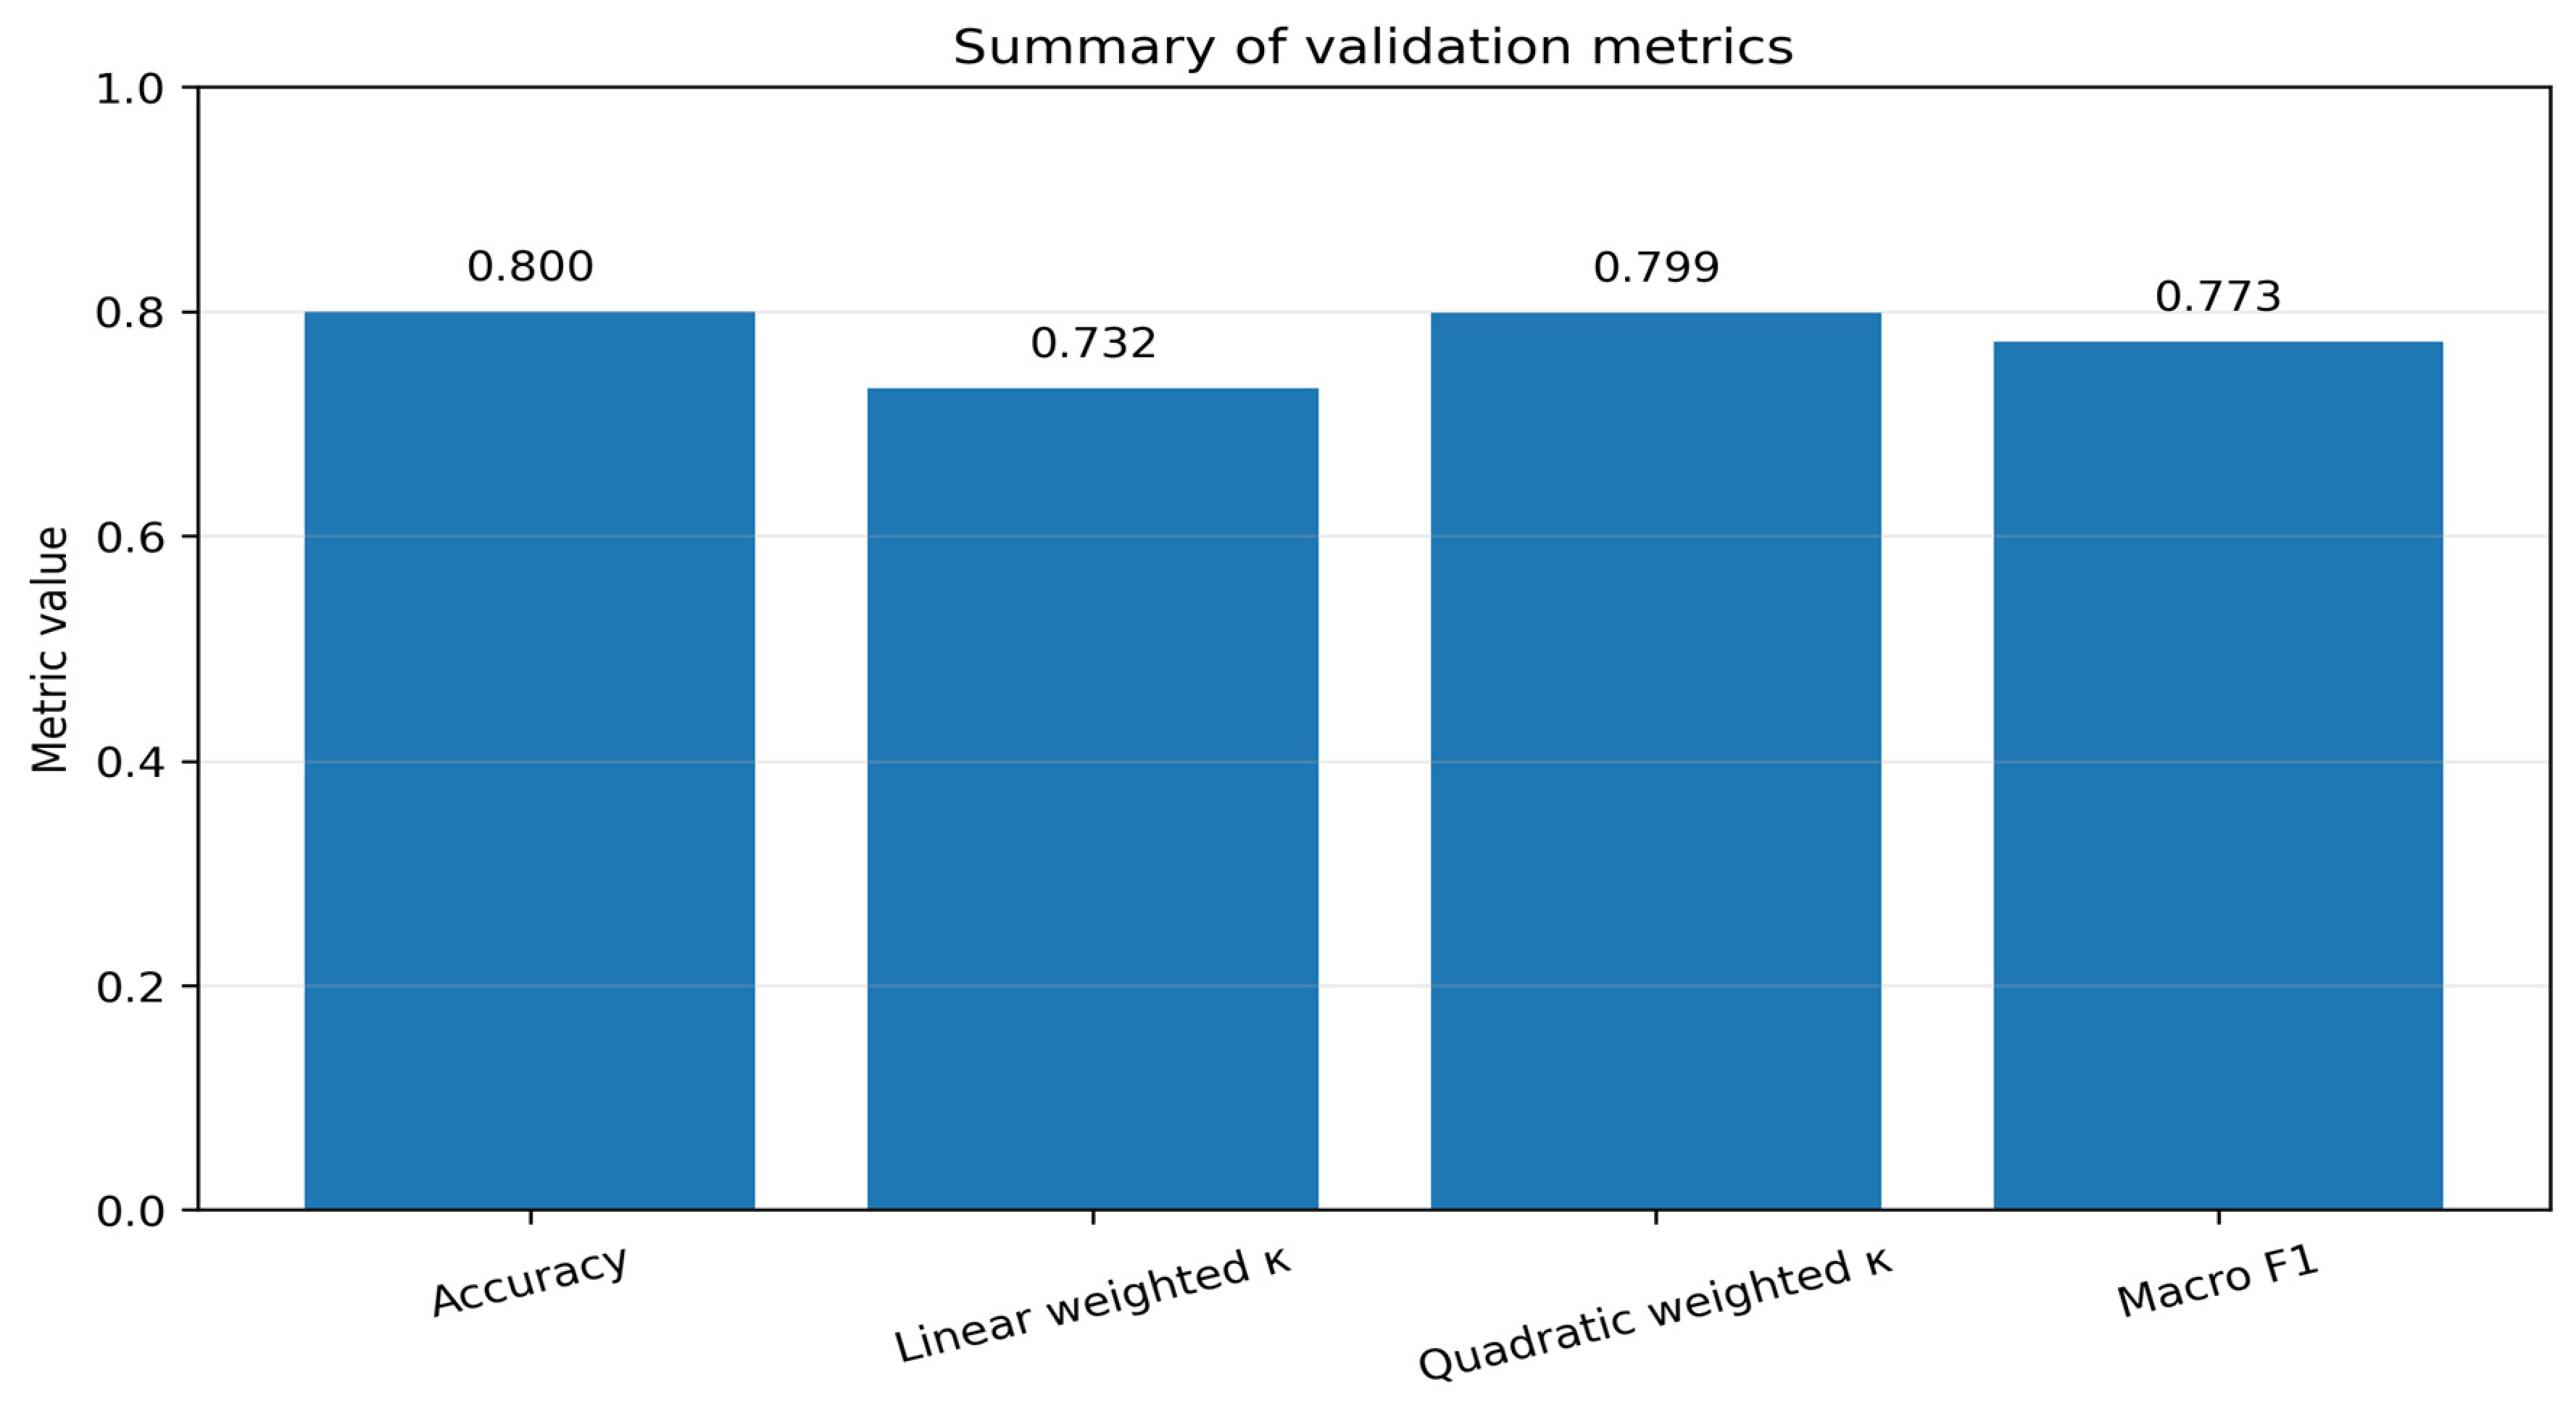
A confusion matrix and Cohen’s kappa statistics were also used to further evaluate the agreement between the proposed fuzzy-logic model and the expert assessment. The confusion matrix provided detailed classification results for the three OLTC condition classes. The confusion matrix showed an 80% exact agreement (16/20 cases), with all four disagreements being between adjacent condition classes and no A-to-C or C-to-A misclassifications. The overall classification accuracy was calculated from the diagonal elements of the confusion matrix as
where
denotes the number of correctly classified cases in class
,
is the number of condition classes, and
is the total number of evaluated cases. Accordingly,
Cohen’s kappa was used to measure the level of agreement above chance. Since the condition categories are ordinal, we also calculated weighted Cohen’s kappa to address the severity of disagreements between adjacent and non-adjacent classes. Cohen’s kappa was 0.677, and the linear and quadratic weighted kappas were 0.732 and 0.799, respectively, indicating high agreement taking into account the ordinal nature of the condition classes. The results showed that the reference assessment and the fuzzy-logic model were in a high degree of agreement.
Appendix B provides details of the confusion matrix, kappa calculations, weighting schemes, and the resulting agreement metrics.
An in-depth analysis of these variations indicates that, in all four instances, the FL-based health index allocated a more stringent condition rating compared to that of the reference condition.
This conservative behavior mainly reflects the aggregation strategy used for the overall OLTC Health Index. The six contributors represent different functional conditions of the OLTC, and the final condition is defined by the most critical contributor. This rule was purposely selected from a safety-oriented view, since a severe condition in a vital subsystem should not be compensated for by fair conditions in the remaining subsystems. In a weighted aggregation scheme, several favorable scores could mask an important local deterioration. For example, a crucial indication associated with the motor-drive unit, the protection devices, or the contact condition may demand additional investigation even when the remaining monitored parameters are within acceptable limits.
Conversely, the suggested FL approach aims to supplement, not replace, professional engineering judgment. Specifically, a total HI C classification should be regarded as a signal that the associated OLTC needs increased attention, including more inspection, validation measures, or technical evaluation. It should not be regarded as an automatic necessity for immediate component replacement or immediate maintenance. This interpretation is particularly significant due to the conservative nature of the adopted aggregation rule, which is designed to yield stricter assessments when any subsystem demonstrates a critical condition.
This behavior suggests that the implied FL model is essentially more tuned in to initial signs of deterioration and hidden risk variables that may be undervalued in traditional expert assessments. This tougher judgment improves the assessment’s reliability by minimizing the risk of overlooking emerging errors and underestimating operating risk. Thus, the FL model offers a more protective and risk-conscious assessment of OLTC condition, which is more consistent with preventive maintenance purposes and long-term asset dependability.
A formal comparison was made between the fuzzy-logic-based HI results and those derived from a conventional assessment method that depends on precise numerical thresholds. This comparison requires thoughtful interpretation due to the fundamental differences in how the two methodologies address uncertainty: the traditional approach yields a singular deterministic value, while the fuzzy model expresses degradation both linguistically and mathematically via membership functions. As expected, numerical differences exist between the crisp conventional values and the fuzzy-derived HIs. Nonetheless, the linguistic interpretations of equipment condition are closely aligned.
Additionally, it has been observed that the accuracy of the FIS is strongly affected by the inference rules that define the fuzzy reasoning process. These rules are the foundation of the decision-making framework and must consequently align with contemporary standards, expert agreement, and the latest field knowledge. It is essential to continuously improve the rule base as novel diagnostic investigations, maintenance records, and operational data are obtained.
It is important to note that the proposed FIS is knowledge-based rather than data-driven and, therefore, its purpose is not to learn new diagnostic thresholds or rules from the available data. Moreover, the suggested approach facilitates the integration of diverse OLTC condition data, including quantitative metrics, operational variables, protection-device conditions, and qualitative assessment outcomes, into an integrated inference model.
Finally, by further achieving quantitative agreement with reference assessments, the proposed FL framework offers significant practical benefits for utilities and organizations managing extensive fleets of power transformers. When diagnostic data are structured appropriately, the model can automatically process numerous OLTC cases using consistent membership functions and a standardized rule base. This approach minimizes the need for repeated manual interpretation of individual measurements and enables a faster, standardized, reproducible, and scalable condition-assessment process, which is especially advantageous for fleet-level asset management. Furthermore, the fuzzy-inference mechanism enables gradual treatment of measurements near diagnostic thresholds, rather than abrupt crisp transitions, thereby supporting a more systematic representation of borderline operating conditions. The methodology is intended primarily as a decision-support tool, not as a replacement for expert judgment. Its main practical function is to formalize expert knowledge within a consistent computational framework, simplify the screening and prioritization of multiple OLTCs, and enable maintenance specialists to concentrate on assets that require further inspection or intervention.