Article

Competition in Building Heating—The Techno-Economic Case for Decentralized Heat Pumps in Germany up to 2045


1
Fraunhofer Institute for Systems and Innovation Research ISI, Breslauer Strasse 48, 76139 Karlsruhe, Germany
2
INATECH, Albert Ludwigs University Freiburg, Emmy-Noether-Str. 2, 79110 Freiburg, Germany
3
E3Modelling, Panormou 70, 11523 Athens, Greece
4
NHF Netzgesellschaft Heilbronn-Franken mbH, Weipertstr. 39, 74076 Heilbronn, Germany
5
Fraunhofer Institute for Solar Energy Systems ISE, Heidenhofstr. 2, 79110 Freiburg, Germany
*
Author to whom correspondence should be addressed.
Energies 2026, 19(18), 4377; https://doi.org/10.3390/en19184377
Submission received: 1 August 2026 / Revised: 8 September 2026 / Accepted: 9 September 2026 / Published: 15 September 2026
(This article belongs to the Section G: Energy and Buildings)

Abstract

Decarbonizing the German building sector by 2045 requires a rapid transformation of the heating technology stock, in which decentralized heat pumps (HPs) compete with district heating (DH) and green-gas-based solutions. Yet, the existing literature has not sufficiently resolved which segments of the building stock are most appropriately served by which low-carbon technology. This paper addresses this gap through a bottom-up, dynamic analysis using the agent-based building stock model RENDER-Building, which combines building-specific environmental heat-source potentials with DH and gas distribution infrastructure availability across Germany. Three explorative techno-economic scenarios are evaluated, differing in their electricity network charge development, DH expansion, and gas infrastructure trajectories. The modeling results show that HPs are cost-competitive over their lifetime in most building stock segments, delivering unit heat at an average cost of 11–15 ct/kWh. Between 11 and 15 million units are projected to be heated by HPs by 2045, covering 25 to 30% of building heating demand. Settlement type and local heat-source availability are found to be the primary determinants of feasibility and adoption. The findings underline the importance of ensuring the availability of energy carriers and stable long-term policies for a cost-effective and climate-friendly transformation of heating in buildings.

1. Introduction

Germany has set the goal of achieving climate-neutrality in the building sector by 2045 [1]. The German building sector represents one of the largest heat markets in Europe, with a heating energy demand of around 740 TWh. Almost 75% of this demand was covered by fossil fuels in 2024 (including centralized heat supply), making heating an important end-use that must rapidly become climate-neutral in German buildings [2].
The importance of direct electrification in heating via heat pumps is evident in the decarbonized future energy system, with scenarios of a reduction of more than 85% greenhouse gas emissions showing an electrification rate from between 40% to 85% [3], and is already becoming a market reality. In 2025, heat pumps (HPs) made up almost half of new heating system sales [4]. Yet, aggregate system-level scenario projections rarely reveal where HPs are in close competition with other CO2-neutral options such as district heating (DH) or green gases, e.g., methane of biogenic origin or synthetic methane (SNG), or hydrogen. Some existing studies partially address this, but largely assess the economic and technical situation for individual building or settlement types under generalized and homogeneous assumptions, focusing on the target year [5,6,7]. To the best of our knowledge, none of the existing studies take a comprehensive view of the entire German building sector while simultaneously assessing heating technology options that depend on the available heat sources or heating infrastructure, as well as the implications of the evolution of the heating infrastructure and the building stock development at a high level of spatial and technological detail. The building sector is heterogeneous and dynamic, and equally important are its overall transition pathway and the sectoral picture during the transition phases, as these inform when and where infrastructure investments are needed, and which instruments are the most effective at each stage.
What is currently missing in the existing literature is a bottom-up, technology-specific analysis of the building sector that captures the constraints on heating technology choices, including the availability of heat sources, and DH and gas infrastructure across different segments of the building stock (e.g., single-family buildings, non-renovated buildings, buildings in suburban areas, etc.) throughout the full transition period up to 2045. This is necessary to identify and localize the robust demand for each heating technology and energy carrier, and to determine where competition between technologies intensifies. Therefore, the following question is central: how competitive are decentralized HPs for different segments in the building stock during the transformation of the heating technology stock through 2045 and what rollout can be expected under different techno-economic scenarios?
To address this research question and fill the gap in the literature, we adopt an approach that explicitly focuses on the three main competing heating technologies: (1) decentralized heat pumps, (2) district heating, and (3) gas-based solutions (using a mix of green gases, i.e., biomethane, SNG and hydrogen in the gas distribution network). We model the annual uptake of heating technologies in the German building stock through investment choices using the building stock model RENDER-Building [8]. The model captures the dynamics of the building sector itself and the technologies as it accounts for building-specific characteristics such as type, size, condition, and location, population change and new construction, renovation and modernization through technological investment cycles, and the availability of DH and gas infrastructure. To capture the interaction between the sector’s demand and the broader energy system, we derive assumptions on energy carrier prices and infrastructure development and costs from system-level analyses and reapply them as model inputs. Detailed assumptions on (1) local heat-source availability for decentralized HPs, (2) potential expansion of DH networks based on distribution costs, and (3) decommissioning of gas distribution networks and resulting network charges are integrated, which is novel to this study.
The present paper contributes novel insights to the literature by providing a dynamic, transition-focused analysis of the competition between heating technologies in the German building sector that: (1) combines local heat-source potentials for decentralized HPs with infrastructure availability constraints for DH and gas in a unified bottom-up modeling framework, enabling the localization of robust demand for each heating technology, and (2) links building-stock modeling with sector-level price and infrastructure assumptions to quantify the impact on costs, technology uptake and CO2 emissions across the transition period. The paper is organized as follows. Section 2 presents the background including a literature review and the research questions of this paper. Then, the data and methods used are explained in detail in Section 3. Section 4 shows and discusses the results, followed by our conclusions and outlook in Section 5.

2. Background

This section presents the background to this work by outlining the current state of research on the topic, identifying the research gap and presenting the research questions.

2.1. State of Research

As heat pumps (HPs) are central for climate-neutral heating, there is a body of literature investigating many different aspects about them. Some studies have looked at the interaction of HPs with the energy system. For example, Roth et al. investigated the benefits of flexible HPs (via thermal storage) for the power sector in Germany up to 2030 [9]. In another study, the extent of the cost-optimality of “designing higher-performance yet higher-cost” air-to-water HPs was investigated for the UK using an energy system model [10]. Similarly, optimizing HP systems from a whole-energy-system perspective was the problem that was tackled by Mersch et al. for the UK through detailed HP design in an energy system model using heat-demand profiles of buildings, who found that the natural gas price (main competitor in the UK), subsidy for HPs, and electricity grid upgrade cost influence the optimal heat pump deployment [11]. Energy system optimization models were also extended for application at the local level for municipal planning, such as demonstrated in the Karlsruhe case [12]. Their stochastic approach to model the transformation of the local building stock captures dynamic developments and heterogeneity including DH infrastructure availability but links the dissemination of other technologies to national-level trends rather than bottom-up investment decisions and heat-source availability. They exogenously restrict HP adoption in buildings with a space heating demand above a certain threshold. This limits the model’s ability to endogenously resolve where HPs are truly competitive.
With that, a recurring challenge in system analyses is evident: the spatial coverage, scope and focus of the (optimization) problem are in a trade-off with the level of technological and spatial detail that can be maintained. Particularly relevant to our study is the fact that the assumptions on technology availability and adoption were increasingly applied top-down rather than derived from local conditions. Billerbeck et al. handled this trade-off by modeling the “race between hydrogen and heat pumps for space and water heating” using two separate detailed optimization models for the supply and demand side with a large scope (perspective for the EU). They found that decarbonization pathways with high shares of HPs yield system cost savings of around €70 bn. In the least-cost scenario, decentralized HPs supply approximately 50% of the total heating demand [13]. An extended version of the work provides a general indication that predominantly recently constructed buildings that have relatively new gas systems retain their gas-based heating in cost-optimal decarbonization pathways; but, even there, a detailed, spatially resolved characterization of the demand across building stock segments is not given [14]. Another optimization tool found that electrifying more than 80% of the core gas demand is part of the cost-minimizing mix of infrastructure expansion and gas or electricity demand reductions to satisfy sector-specific emissions constraints [15].
Studies specifically for building stocks have also been carried out in various regional scopes. In the US, it was found that air-to-air HPs could be cost-effective without subsidies for around 65 million homes [16]. Hummel et al. focused on the cost-efficiency of thermal renovations and heating system changes in the European building stock. They found that achieving higher renovation rates is less costly at the system level than maintaining low renovation rates. Furthermore, thermal renovations in buildings connected to DH are cost-effective, while solid biomass is deployed up to its available potential regardless of the level of thermal renovation activity [17]. In a case study of five European cities, it was found that aiming for refurbishment rates between 1% and 2%, maximizing the connection rate to the DH network in DH-suitable regions, and fulfilling the remaining heat demand using decentralized heating technologies is more consistent with the “energy efficiency first” principle [6]. Air-sourced HPs were shown empirically (with a customer data sample from an energy company) to reduce total household energy demand by 40% and household CO2 emissions by 36% in the UK, and time-of-use rates can halve electricity consumption during peak times [18]. For Germany, Rieck et al. looked at a snapshot of the self-sufficiency potential of German residential building stock using PVs, HPs and storage, assuming floor heating in buildings and not considering the dynamics and economics of the building and technology stock. They found that 35% of the electricity demand for residential heating can be cut using these technologies and single-family houses can reach up to 90% self-sufficiency in energy use [19]. A similar study was done for Geneva’s multi-family buildings, where the potential impact of massive deployment of HPs in combination with PVs on the regional electric grid was analyzed through detailed numerical simulation of the system components, taking into account the local heat sources and the snapshot of the multi-family building stock [20].
More detailed analysis can be conducted at the building or settlement-type level. The total cost of ownership (TCO) of air-source HPs under different policy scenarios for taxes and levies in the UK [21], and the levelized cost of heat (LCOH) under the impact of settlement type, energy prices, infrastructure costs and investment costs in Germany [5] were previously shown. Mandel et al. examined a generic urban district in three European countries to assess the cost balance of envelope and heating system retrofits and showed that in Germany, GSHPs and biomass boilers have the lowest average costs among other technologies, while ASHPs and gas boilers are at a similar range of 100 EUR2020/MWh, including external costs for climate and air pollution damage [7]. Even though these findings are generalizable, they offer only a partial perspective of the overall system. The importance of these technologies can be revealed in the details of the stock’s transformation phases.

2.2. Research Gap and Research Questions

Taken together, the reviewed literature can be organized along a spectrum from energy-system-level to building-level analyses. System-level studies shed light on the macroeconomic and infrastructure-related implications of widespread HP deployment but do not show details on the segments in the building stock where HPs are the competitive choice and where other carbon-neutral solutions are more appropriate. Building stock studies offer aggregate demand-side insights across regions but typically inform the status quo, lacking guidance for the transition pathway to climate-neutrality. Detailed building-level analyses provide the highest resolution on cost competitiveness but are largely isolated and target-oriented, focusing on the situation during the target year for isolated cases rather than on the technology uptake pathway across the stock’s transition. Crucially, none of these perspectives jointly capture the economics and infrastructure availability constraints, especially local heat-source potentials for decentralized HPs, DH network coverage and gas infrastructure. This determines in practice which heating technologies are even viable options for a given segment before any economic comparison is undertaken. Hence, the research gap that is directly relevant to the central question of this paper becomes apparent (Section 1).
Addressing this gap requires two considerations in particular. (1) First, high spatial resolution, minimum at building-level and maximum at hectare-level: the availability of heating and gas infrastructure, as well as a local heat source for decentralized HP, are critical constraints in investment choices that precede the economic attractiveness of any given technology. The size, condition, purpose and location of a building are further additional influencing factors. Local modeling of heat demand and supply has been shown to yield different estimates of potential than nationally aggregated approaches [22]. A high spatial resolution is therefore necessary to understand the realistic competitiveness of HPs against network-based heating options (i.e., DH and gas) and to provide actionable information for infrastructure planning and resource allocation. (2) Second, stock dynamics: modeling the building sector through the evolution of the population, building physics, technology stock, local environment, and occupant characteristics is essential to go beyond static archetype-based assessments and capture the transition pathway itself, not just the beginning or the end state.
To close the gap identified above, and to provide a bottom-up, dynamic, and spatially resolved analysis that is currently missing from the literature, this paper addresses the following research questions (RQs):
  • RQ 1: What heating options are available to building users, and at what cost of unit heat, considering local technology potentials under different techno-economic scenarios in Germany up to 2045?
  • RQ 2: Which heating technologies are expected to be adopted in Germany up to 2045 under the considered techno-economic scenarios, and how does the role of HPs vary across building stock segments?
  • RQ 3: What is the estimated total expenditure and CO2 emission reduction resulting from the heating stock transformation in German buildings under the scenarios considered, and what is the impact of a dominant role for HPs?

3. Materials and Methods

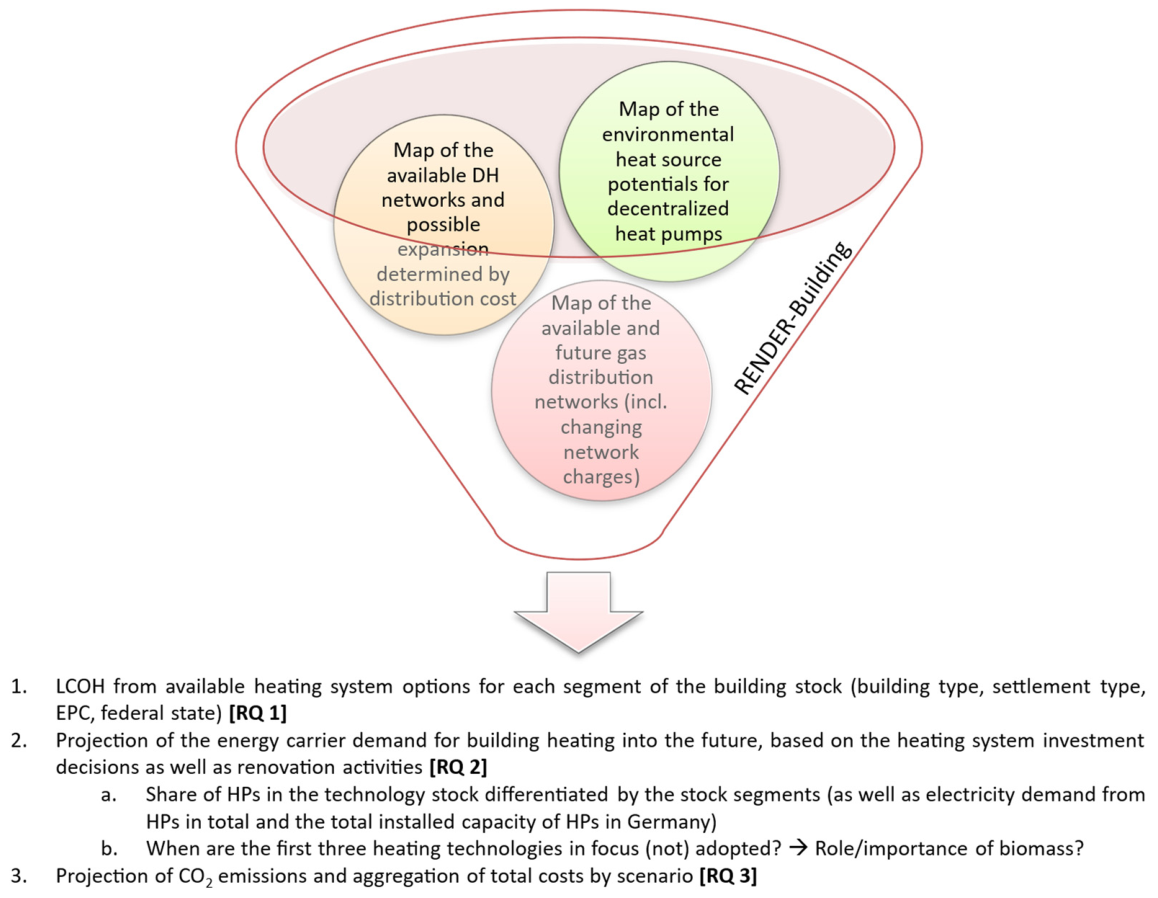
The objective of this paper is to assess the techno-economic competitiveness of decentralized HPs compared to other carbon-neutral heating options across building stock segments in Germany, and to project the resulting technology uptake, expenditures and CO2 emissions over the transition period from 2025 to 2045 (Section 1 and Section 2). The study covers space heating and domestic hot water as end-uses. CO2 emissions are accounted for on a direct, on-site basis (Scope 1) and an indirect basis reflecting upstream generation emissions (Scope 2). Energy carrier prices and infrastructure costs are treated as exogenous inputs derived from system-level analyses, meaning that feedback effects from building-sector demand on energy market prices are not modeled endogenously. To this end, we combine spatially resolved data on the availability of the main heating technology options of DH, HPs, and gas boilers with the dynamic building stock model RENDER-Building [8]. Other heating technologies considered without any spatially resolved availability in this study are: oil boilers, biomass boilers and mini combined heat and power (mini-CHP) systems using either gas, oil, or biomass as fuel. Figure 1 illustrates the overall approach.
Three streams of spatial input data are prepared and fed into the building stock model RENDER-Building. These are introduced in detail in Section 3.1. Using this technology availability, RENDER-Building simulates heating technology modernization along with new construction and renovation under different techno-economic scenarios, to yield the annual energy demand of the building stock up to 2045. The model outputs that will be shown and analyzed in this study are: (1) the LCOH of available heating options for each building stock segment under each scenario, (2) projections of energy carrier demand and technology uptake across the building stock, and (3) total expenditures from the owner/user perspective and CO2 emissions associated with the modeled technology uptake pathways. Building stock segments of interest in this study are: (a) buildings grouped by their purpose of use: residential (RES) and non-residential (NRES), (b) buildings grouped by their type: single-family or two-family house (SFH), multi-family house (MFH), apartment building (AB), and non-residential building (NRES), (c) buildings grouped by their settlement type: urban, suburban and rural, based on the data and categorization by the Global Human Settlement Layer [23], (d) buildings grouped by their energy performance class (EPC): A/B, C/D, E/F, and G/H, and (e) buildings grouped by their federal state: city states (Berlin, Bremen, Hamburg), the states found formerly in Eastern Germany (Mecklenburg-Vorpommern, Brandenburg, Saxony, Saxony-Anhalt, Thuringia) and the states found formerly in Western Germany (Baden-Württemberg, Bavaria, Hesse, Lower Saxony, North Rhine-Westphalia, Rhineland-Palatinate, Saarland, Schleswig-Holstein) before the German reunification.
The data sources and spatial preparation are described in Section 3.1, the model and the implemented enhancements are presented in Section 3.2, and the scenario definition with the main assumptions are laid out in Section 3.3.

3.1. Data

Each stream of spatial input data, as also illustrated in Figure 1, relates to one of the main technologies under consideration. These data are prepared to be fed into RENDER-Building: (1) environmental heat-source potentials for decentralized HPs, estimated for each building in Germany, (2) the current and prospective DH networks, and (3) the prospects for the gas distribution networks. Together, these inputs determine which heating options are technically available to each building agent in the model. The datasets have different spatial resolutions. The heat-source potentials (1) are building-specific, the areas with a DH network (2) are at a hectare-level, and the gas distribution network prospects (3) are prepared specific to the settlement type and NUTS 3 region. The data and how each of them are treated and prepared for input are introduced in the following Section 3.1.1, Section 3.1.2 and Section 3.1.3.

3.1.1. Environmental Heat-Source Potentials for Decentralized HPs

HPs use an environmental heat source together with electricity to produce heat. For example, air, ground, ground water, river, lake, and solar thermal heat can all act as a heat source to HPs. Generally, air, ground (shallow geothermal), ground water and solar are the most suitable sources for decentralized HPs, as they are available in the immediate vicinity of the building and are easily accessible [24]. To limit the scope of this study, only air and ground are considered as heat sources for decentralized HPs. The limiting factor when using ambient air as a heat source is the noise created by the HP during operation, as the sound emission guideline values should not be exceeded. For ground as a heat source, the limiting factor is the area available for installing ground heat exchangers to extract heat. The building-specific potential of these heat sources for decentralized HPs were estimated using the approach described in [25]. It should be noted that the following amendment was made to the method wherever available: cadastral records were used instead of the Voronoi method to determine the property area associated with each building. Unlike the Voronoi method, a 5 m inter-parcel setback was not applied, as the property boundaries from the cadastral records were considered definitive. Records were collected from the portal of each federal state either through Web Feature Service (WFS) requests or through bulk download. We were able to obtain the property geometries and calculate property area for 85% of all German buildings. The complete records for the federal state of Bavaria could not be accessed due to data restrictions, but the region of Munich was provided by the Bavarian Agency for Digitization, High-Speed Internet and Surveying for scientific use. The potentials are published for the whole of Germany in a database [26].
For air-source heat pumps (ASHPs), buildings were clustered according to their maximum permissible sound emission levels, while for ground-source heat pumps (GSHPs), clustering was based on available property area ranges. The building-level potentials were then aggregated by cluster range, NUTS 3 region, and settlement type to match the spatial resolution required by RENDER-Building. We directly use the heat-source potentials identified under current conditions rather than the HP capacities reported in the dataset, as improvements in HP technology and heat extraction occur over time. These effects can be captured via time-variant calculation factors in the model. However, no systematic investigation of past trends and future projections in such technological improvements, and the corresponding parameters required to model them, has been conducted. Consequently, the model assumes no technical improvements in HP technology with respect to sound emissions or ground heat extraction up to 2045.

3.1.2. DH Potentials—Current and Identified Future DH Areas

Areas that are suitable for DH infrastructure can be identified using the indicator of heat density [27,28,29]. Heat density typically considers the demand for space heating (SH) and sanitary hot water (SHW) from residential and non-residential buildings, mapped with high spatial resolution, e.g., at the hectare-level. Furthermore, the number of connections within a DH area (the so-called “connection rate”) is a substantial factor affecting the DH price and, consequently, the economic viability of DH. By assuming DH market shares and plausible connection rates (e.g., 50–75%), and defining a threshold of heat density, or of distribution costs derived from the heat density, that indicates the economic viability of DH infrastructure, possible DH areas can be identified. It should be noted that DH infrastructure depends not only on the demand side but on further factors such as the availability of climate-neutral heat sources, active local and municipal stakeholders and existing regulatory and political conditions. Many of these factors cannot be fully captured in country-wide modeling; however, by defining possible areas based on hectare-level heat density, distribution costs and assumed connection rates, the potential for connecting buildings to DH can be assessed more accurately than by most models that assume country-wide availability.
In this paper, data based on the analysis published by Manz et al. [30] is used. Manz et al. calculated the heat density in Germany for the years 2020, 2030 and 2050 under two different building refurbishment scenarios. Based on the heat density, they considered different possible DH expansion levels, characterized by the DH market share (i.e., the share of heating and sanitary hot water demand that is covered by DH in Germany), and the average connection rate (i.e., the share of heating and sanitary hot water demand that is covered by DH within the possible DH areas), and calculated the corresponding marginal distribution capital costs. This dataset of costs for potential DH areas indicates at the hectare-level whether DH could be available in these areas in the future. The hectares with distribution costs below the threshold of 10 €/GJ were classified as DH-suitable based on [22]. Hectare grid cells were spatially overlaid with settlement-type classifications and NUTS 3 regional boundaries to aggregate DH-suitable buildings by NUTS 3 region and settlement type for the years 2030 and 2050. Existing DH connections from the 2022 census [31] served as a floor, ensuring that availability never falls below the observed status quo level (i.e., no existing DH networks are decommissioned or taken out of operation). Intermediate years were linearly interpolated. We take the “high-refurb” scenario with a 1.6% average annual renovation rate between 2020 and 2050, as this is the same average renovation rate that the RENDER-Building model scenarios result in when renovation behavior is modeled according to renovation cycles of building components.
The market share of DH in Germany in 2021 was 9.2%, and the average connection rate was 59% [30]. A conservative, lower end of DH expansion could be represented by a market share of 20% in 2050, and an ambitious scenario is represented by a market share of 30%. This leads to potential DH areas for densification and expansion of existing DH as well as potential areas for the construction of new DH networks, mainly in cities and densely populated suburban areas where there is currently no DH infrastructure. Based on the (existing and potential) DH areas, the final connection rate and market share of DH are a model output from RENDER-Building based on end-consumer decisions, which are modeled endogenously.

3.1.3. Prospects on the Gas Distribution Networks and Network Charges

Towards climate-neutrality, the long-term need for gas distribution networks is under discussion since they may not be as necessary as they have been until now [32,33,34,35,36,37,38,39]. To avoid the risk of the existing infrastructure becoming a stranded asset, investment strategies can be implemented that aim for financing the network decommissioning. Oberle et al. precisely investigated that; developing and using a model for evaluating investment options for gas distribution network operators, they looked at three investment strategies ((1) investment stop, (2) partial decommissioning, and (3) full dismantling) under three regulatory options for treating the decommission costs [40]. In the scenario where gas networks are decommissioned, the likely regulatory option is decommissioning with provisions. This is where the network operator creates provisions now to use later for decommissioning, and this is likely since the draft of the Amendment to the Energy Industry Act (EnWG) foresees planned decommissioning and it is currently discussed to be implemented in the network regulation by the German regulatory authority [41]. Even though the assumed implementation of provisions in the regulatory framework of the paper is deviating from the current implementation, its overall effect on the network charges is similar. Furthermore, it should be noted that the alignment between demand reduction and decommissioning is done by a potential function and not by detailed network modeling, making this a rather “optimistic” scenario. We use the pathway for network charges modeled for this option in our scenarios without the gas focus (Section 3.3) and assume one decommissioning “rate” for natural gas networks in all regions and settlement types in line with the natural gas demand decrease published for this option [40]. The relative change in the annual network charge is applied to the projection pathway of the price component and the resulting end-consumer price is obtained by combining it with the projections for other gas price components [42] (Table A2).

3.2. Method: Scenario Modeling with RENDER-Building

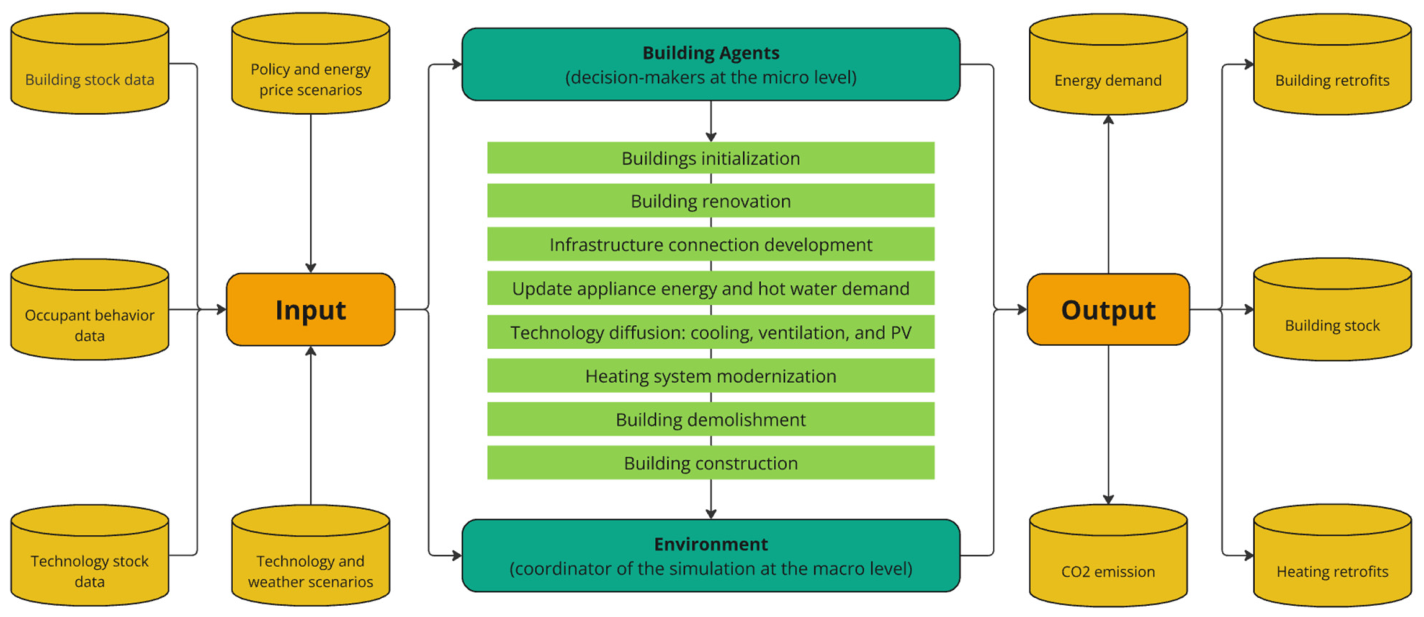
The agent-based building stock transformation model RENDER-Building is used to depict the transformation pathways of the building stock under different scenarios. It simulates the annual changes in a given building stock as well as its technology stock, through which it can project the sectoral energy demand and CO2 emissions [8]. In the model, each building agent is characterized by a set of attributes assigned during initialization: building type, construction period, floor area, envelope U-values, heating system, settlement type (one of seven categories derived from the Global Human Settlement Layer [23]), and NUTS 3 region. For Germany, a coverage rate of 5% yields approximately 1.1 million agents representing both the residential and non-residential building stock. In each simulation year, building agents sequentially update their renovation status, infrastructure availability, appliance and hot water energy demand, and their heating and other technological equipment through a probabilistic discrete-choice selection among available options. Building demolition and new construction are driven by socio-demographic projections, with newly constructed buildings assigned envelope efficiency standards corresponding to the respective simulation year [8]. Figure 2 shows the workflow of the model together with the input and output data. The data mentioned in Section 3.1 are prepared as input to the model and fall under the categories “Technology and weather scenarios” and “Policy and energy price scenarios”.
First, it should be noted that a building agent is prompted to replace its heating technology only when the end-of-life of the technology is reached [8]. So, early replacements are not modeled in this study. Next, when prompted to replace (or install the initial technology in the case of new construction), the building agent checks the infrastructure and heat-source availability: DH network, gas network, hydrogen network, and air and ground heat-source potential. If a specific infrastructure or heat source is not available, the agent removes the corresponding technology from the list of technology options. Each available technology n has a levelized cost, L C n , determined by Equation (1) [8]. By default, the L C n is made up of the annualized investment expenditure, the first year’s operation and maintenance cost ( O M C ) as well as the first year’s energy cost ( E C ) in the model. This means that the energy cost influencing the investment decision is the cost incurred during the first year of operation, rather than the total energy cost incurred over the technology lifetime.
L C n = r · I E U n · C A P 1 ( 1 + r ) L T n · ( 1 s u b n ) + E C n + O M C n
  • r interest rate
  • I E U investment expenditure per unit capacity (made up of material and labor expenditure, distinguishing between the corresponding case: new installation, replacement with the same type of technology, and replacement with a different type of technology)
  • C A P heating capacity of the technology
  • L T expected lifetime of the technology
  • s u b rate of subsidy on the investment
  • E C energy cost (taking into account the efficiency of the technology and the price of the energy carrier used, which includes taxes, levies and CO2 emission price)
  • O M C operation and maintenance cost
The selection probability P of technology n is calculated based on the L C n according to Equation (2) for each agent and the choice of technology is made based on the probability. This probability-based discrete-choice approach represents the “bounded rationality” of the agents [8]. The discrete choice parameter, β , represents agents’ responsiveness to differences in the L C n when making the decision. Higher β values imply greater responsiveness to cost, meaning that agents have a higher probability of choosing the least cost option and therefore, tend to make cost-optimizing choices with the near-sight they have. The default value of β in the model is 2, assigned based on expert knowledge and validated by confirming that the resulting adoption behavior is consistent with historically observed market trends [8]. This follows standard practice in discrete choice modeling [43,44]. A sensitivity analysis on how this parameter affects the key results is presented in the Appendix C (Figure A10, Figure A11 and Figure A12).
P n = e β L C n n e β L C n
To answer our first research question (RQ 1) on the cost of unit heat, we additionally calculate the LCOH of available heating technology options for agents, using Equation (3).
L C O H = t = 1 L T I E U t · C A P · ( 1 s u b ) + O M C t + E C t ( 1 + r ) t t = 1 L T H G t ( 1 + r ) t
  • t year
  • H G annual heat generated
Finally, we implemented two methodological enhancements in the model for this exercise:
  • The environmental heat-source potentials for decentralized HPs are designed as a new “availability” input table. This table contains the number of buildings in each settlement type and NUTS 3 region categorized by (1) the range of maximum feasible distance the building’s potential HP installation site has to the (limiting) neighboring building (for an ASHP), and (2) the range of available property area for the installation of ground heat exchangers (for a GSHP). This availability input is considered in the model when a building agent considers adopting a decentralized HP.
  • The efficiency of a HP is influenced by and varies according to the supply flow temperature level of the heating circuit. As a proxy for this phenomenon, the annual seasonal performance factor (SPF) of a HP is now implemented in the model to vary according to the EPC of the building, using a suitable adjustment factor. Generally, the expectation is that a building with better energetic performance would have a lower supply flow temperature for space heating. However, the model assumes that there is a central system serving both the SH and SHW demand and the temperature of the SHW should be at least 55 °C for ensuring hygiene standards [45]. So, the share of SHW demand in the whole heat demand is also an influencing factor and it increases as the energy performance of the building improves [46]. Therefore, for residential buildings, we allocate the design supply and return temperatures of the SH system (Tsupply/Treturn) and the share of SHW in total heating demand to EPCs as in Table 1 based on [46]. This is important for varying the SPF according to the EPC in the following.
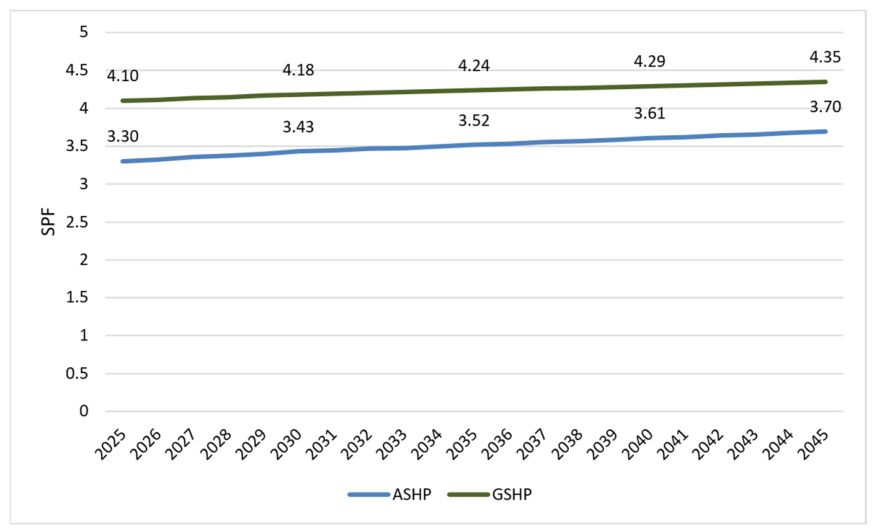
The median SPF of monitored ASHP and GSHP systems were found to be 3.3 and 4.1, respectively [47] (Figure A2). Adjustment factors specific to the EPC (i.e., combination of Tsupply/Treturn and share of SHW) that are shown in Table 1 are derived using the “JAZ-Rechner” [48] web tool, averaging the resulting overall system SPF of 12 different commercial HP models per type (Table A3). The adjustment factor is then applied to the median SPF of the respective heating technology via multiplication.

3.3. Definition of Scenarios and Main Assumptions

The scenarios in this study are defined against the backdrop of the uncertainty about the future development of the heating infrastructure landscape in Germany. While the current national heat act (German: Gebäudeenergiegesetz, GEG) is subject to ongoing political debate, the European regulatory framework provides a more stable basis for assumptions. Under the EU Emissions Trading System for buildings (ETS2), CO2 pricing on direct emissions from heating will apply. The scenarios therefore take a techno-economic perspective, deliberately minimizing the influence of specific national policy instruments and instead focus on the structural drivers of heating technology competitiveness: (1) the cost of electricity, (2) the expansion of DH networks, and (3) the future of gas distribution infrastructure.
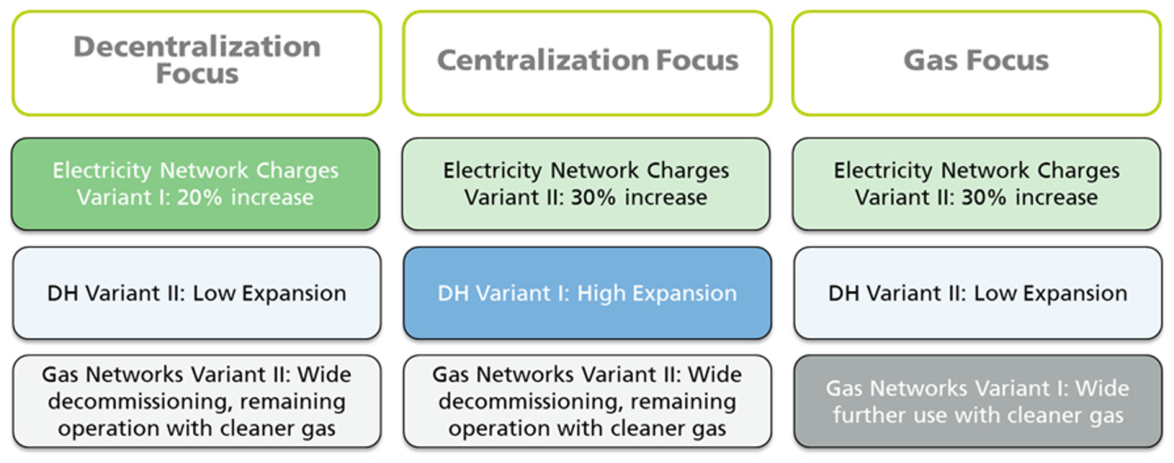
Three explorative scenarios are defined (Figure 3), each representing a distinct combination of development pathways along these three dimensions: (1) electricity network charges and levies (which then affect and change the end-consumer price), (2) DH network expansion, and (3) gas network development and network charges. Two variants are considered for each dimension and described in the following.
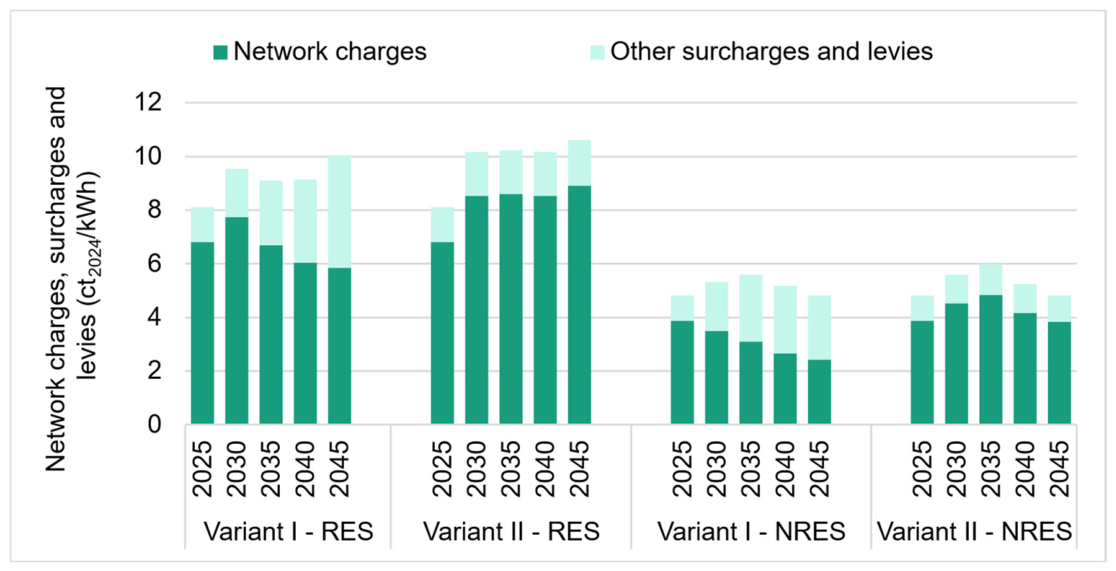
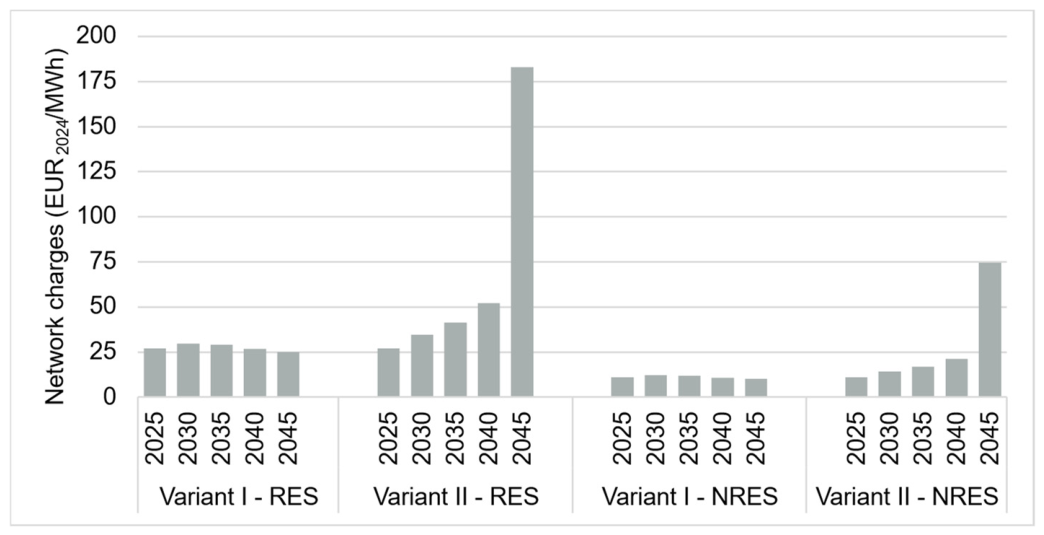
Electricity network charges. Variant I assumes an average increase of 20% for households, driven by high investment needs in transmission and distribution networks due to high shares of renewables, while variant II assumes up to a 30% increase, reflecting lower electricity demand and slower growth, with correspondingly higher per-unit network costs (Figure 4) [49].
DH network expansion. Variant I represents a high expansion of DH networks into new areas, while variant II assumes minimal expansion, with investment limited primarily to densification of existing networks.
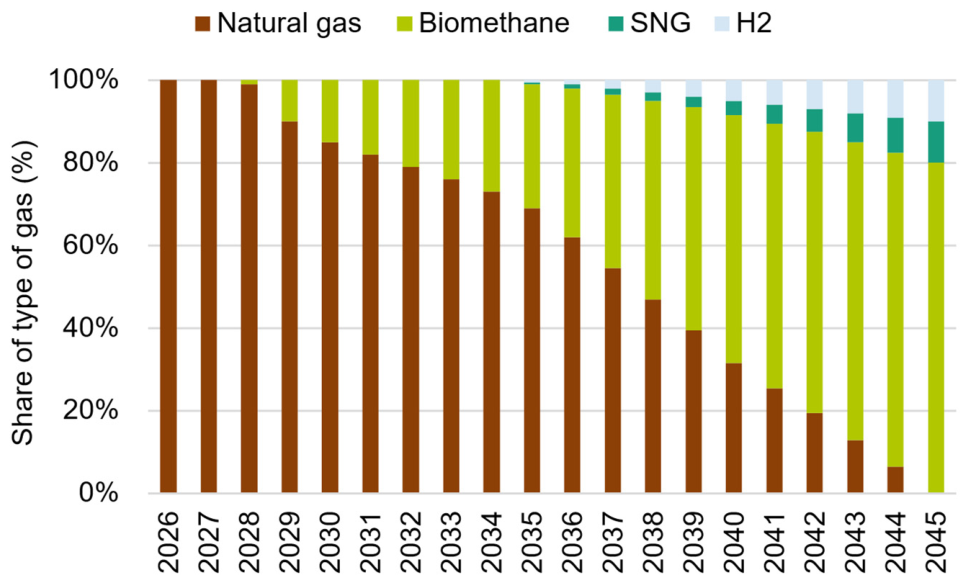
Gas distribution networks and network charges. Variant I assumes continued wide operation of gas networks, increasingly supplied with green gases (biomethane, SNG, and hydrogen). Variant II assumes wide decommissioning of gas distribution networks and rising network charges due to a significant reduction in gas demand [40], with the networks gradually blending green gases in during their remaining operation time. A gradual admixture of biogenic heating oil (assumed to be biodiesel, referred to hereafter as “bio-oil”) in the oil supply is also assumed in the scenarios, up to 20% by 2040 in consistence with the compatibility thresholds reported for conventional oil heating equipment [50]. Figure 5 shows the composition of the gas assumed in the gas distribution networks. Gas network charges are shown in Figure 6 according to variant and sector.
From these dimension-specific variants, three scenarios are derived. Figure 3 shows an illustration of the combinations for each scenario definition.
  • Scenario 1: Decentralization Focus. Favors the widespread adoption of decentralized heat pumps. Electricity network charges follow variant I (lower increase, see Figure 4), DH networks are minimally expanded (variant II), and gas networks are widely decommissioned (variant II).
  • Scenario 2: Centralization Focus. Favors the expansion of centralized heating networks. DH networks are significantly expanded (variant I), while electricity network charges follow variant II (higher increase, see Figure 4) and gas networks are widely decommissioned (variant II).
  • Scenario 3: Gas Focus. Favors the continued use of gas distribution infrastructure, increasingly supplied with green gases (see Figure 5) (variant I). Electricity network charges follow variant II (higher increase, see Figure 4) and DH networks are minimally expanded (variant II).
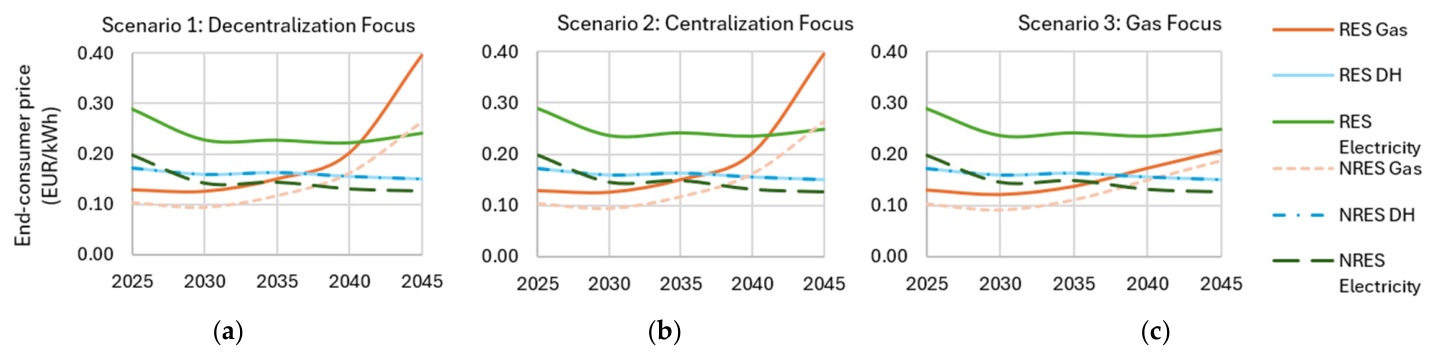
The assumed end-consumer price of energy carriers that are centrally relevant to the scenario storylines are shown in Figure 7. A sensitivity analysis is presented in Appendix C for two additional pathways of the electricity-to-gas price ratio (EtGPR). Full assumptions on the EC price components (based on [42]), heating system costs (based on [51]), and technology efficiencies (especially the SPF pathway for HPs in Figure A2) are shown in the Appendix. Technology learning effects, especially for HPs, are reflected in declining costs and increasing efficiencies.

4. Results and Discussion

The dynamics of the building and heating technology stock is simulated using RENDER-Building for the time period up to 2045 (Section 3). This section presents and analyzes the results obtained from the study. The final section discusses the results and the patterns identified.

4.1. LCOH for Different Segments

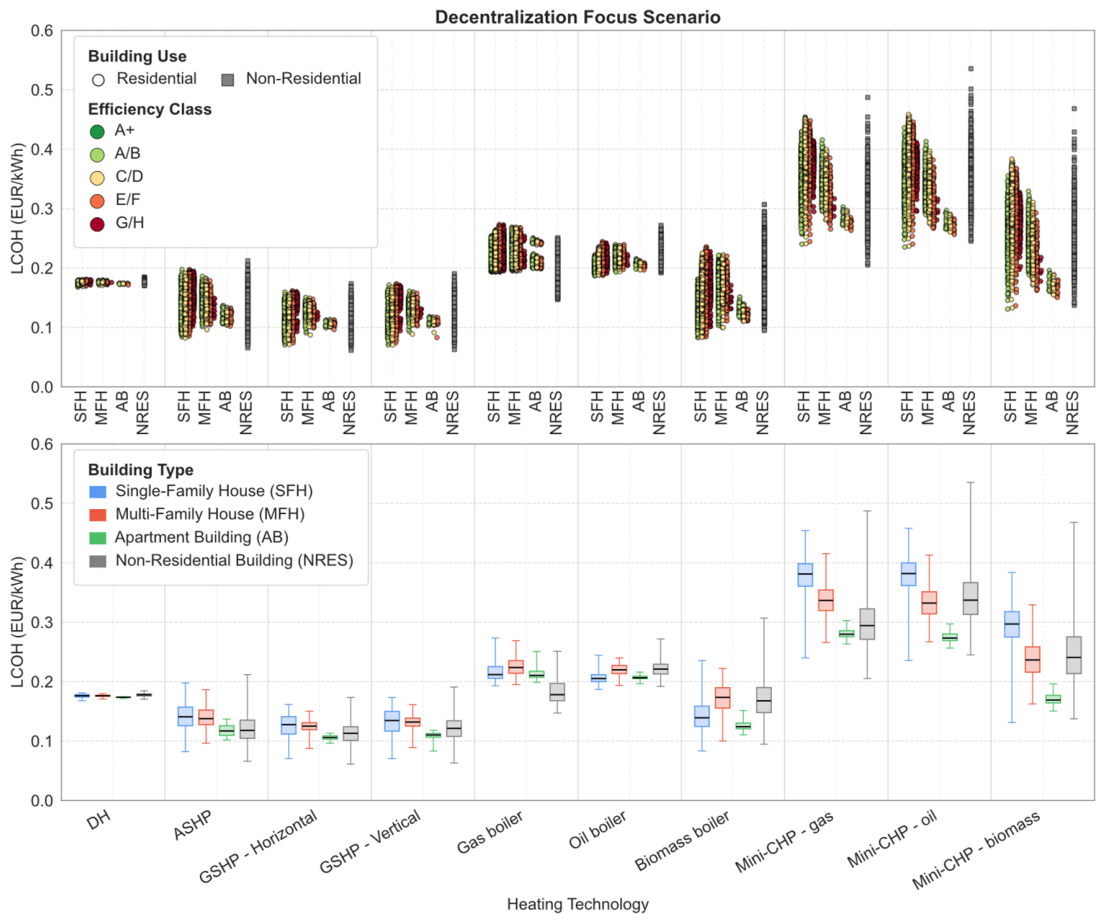
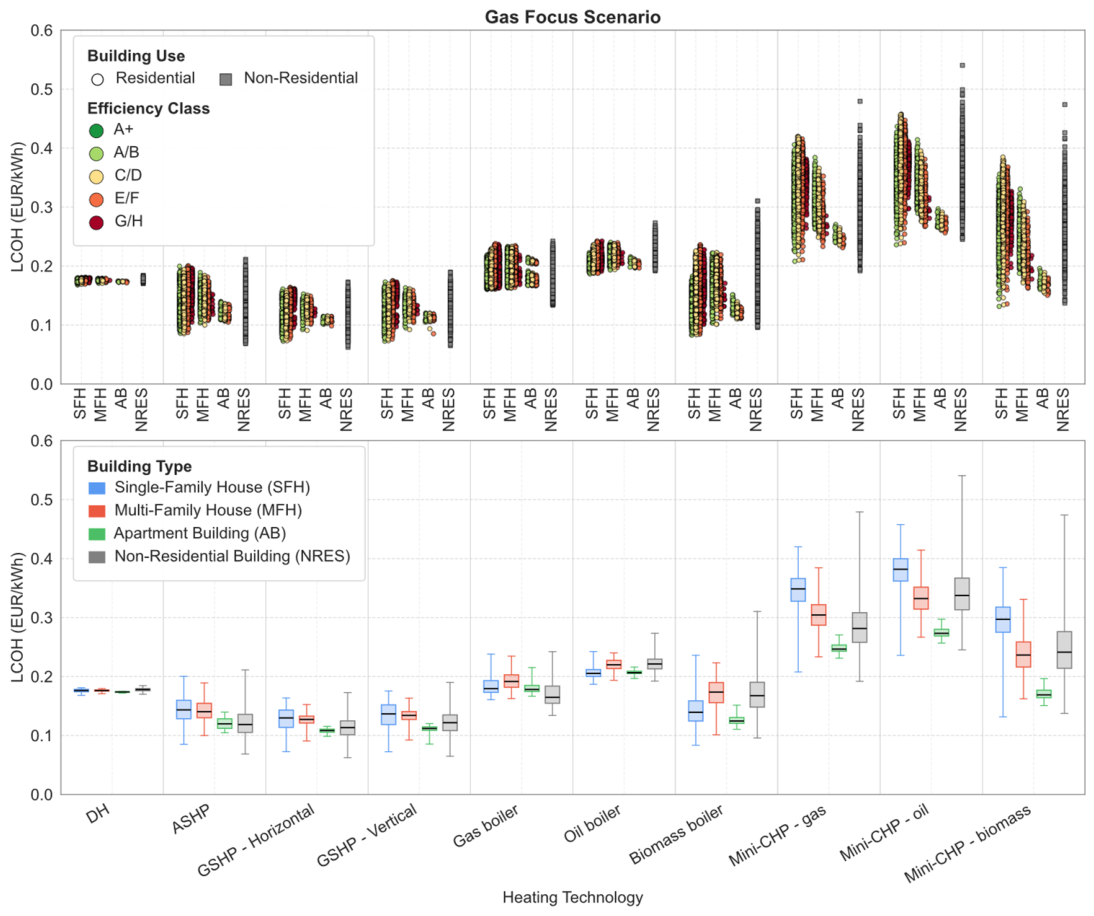
The LCOH for each building agent in the model is calculated. Figure 8 and Figure 9 show the calculated LCOH for the building agents, i.e., the different heating technologies modeled, differentiated by building types and efficiency classes. Only residential buildings are labeled with their efficiency classes. In contrast, for non-residential buildings no efficiency class is shown, as the scale differs greatly, depending on the purpose of use.
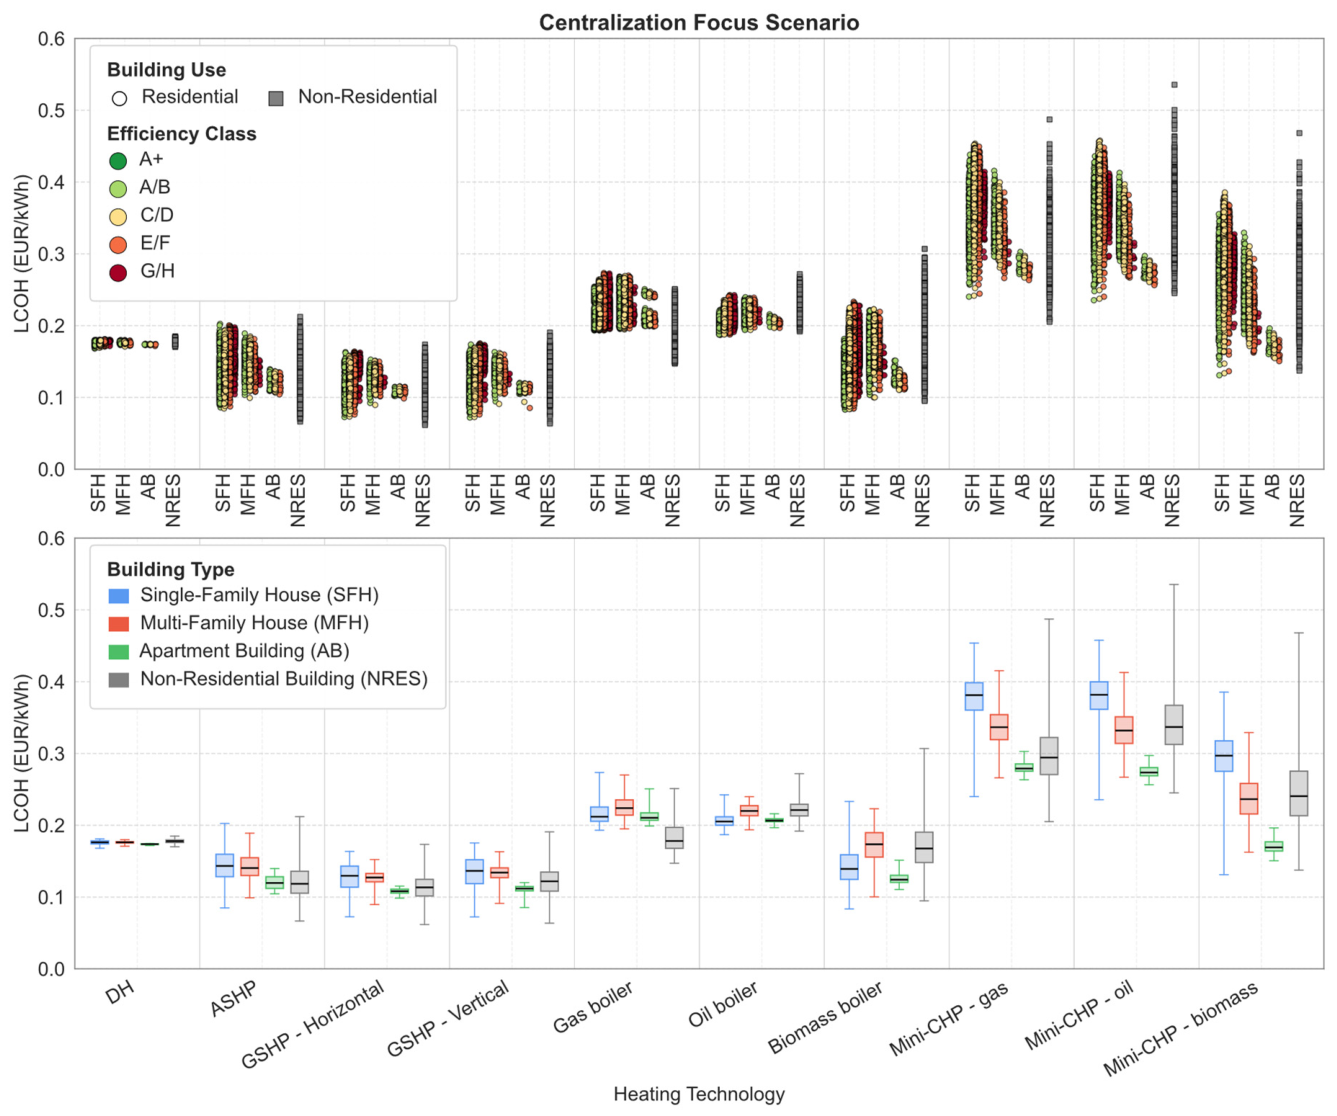
Figure 8 presents the LCOH distributions for the Decentralization Focus scenario, and Figure 9 presents those for the Gas Focus scenario. The Centralization Focus scenario is provided in the Appendix (Figure A3), as its pattern closely resembles that of the Decentralization Focus scenario.
Across the technology options, DH exhibits little variation in LCOH, HPs and conventional boilers show a moderate variation, and mini-CHP units display the greatest variation. HPs emerge as a cost-competitive option over their lifetime. In general, the median LCOH of all technology options increases with decreasing building energy performance. In the Gas Focus scenario, the LCOH of gas boilers is lower overall but remains, on average, higher than that of HPs. Solid biomass boilers provide heat at a LCOH between these two technologies, while oil boilers higher unit heat costs. Over the twenty-year lifetime considered, fuel costs become the decisive factor in the operation of the heating technology. This is why, even though HPs require high upfront initial investment in the equipment, they compensate for this later through less expenditure on fuel thanks to their efficiency. Conversely, gas, oil and biomass become more expensive up to 2045, resulting in higher heat costs from the boilers using these fuels than from HPs. The variation in LCOH within a building type for a given heating technology is due to differences in system size and energy consumption behavior.
The LCOH values obtained in this study for HPs largely correspond with the lower end of the ranges reported in the literature [5]. Two main reasons account for this. First, from the consumer perspective adopted here, the 35% subsidy for renewable heating technologies is included in the LCOH, reducing the effective cost. Second, the lower electricity network charges assumed in the present study, compared with the abovementioned study, reduce the end-consumer price and thereby lower the effective cost of unit heat from HPs. The levelized cost from HPs has been reported to be even lower than the values identified here, when reversible HPs, which can also deliver cooling, are considered [52].

4.2. Adoption of Heating Technologies up to 2045 and the Role of Heat Pumps

This section focuses on the projected adoption of heating technologies in the building stock. Resulting from the dynamics both in the building stock and the heating technology stock, the final energy carrier mix changes over the years.
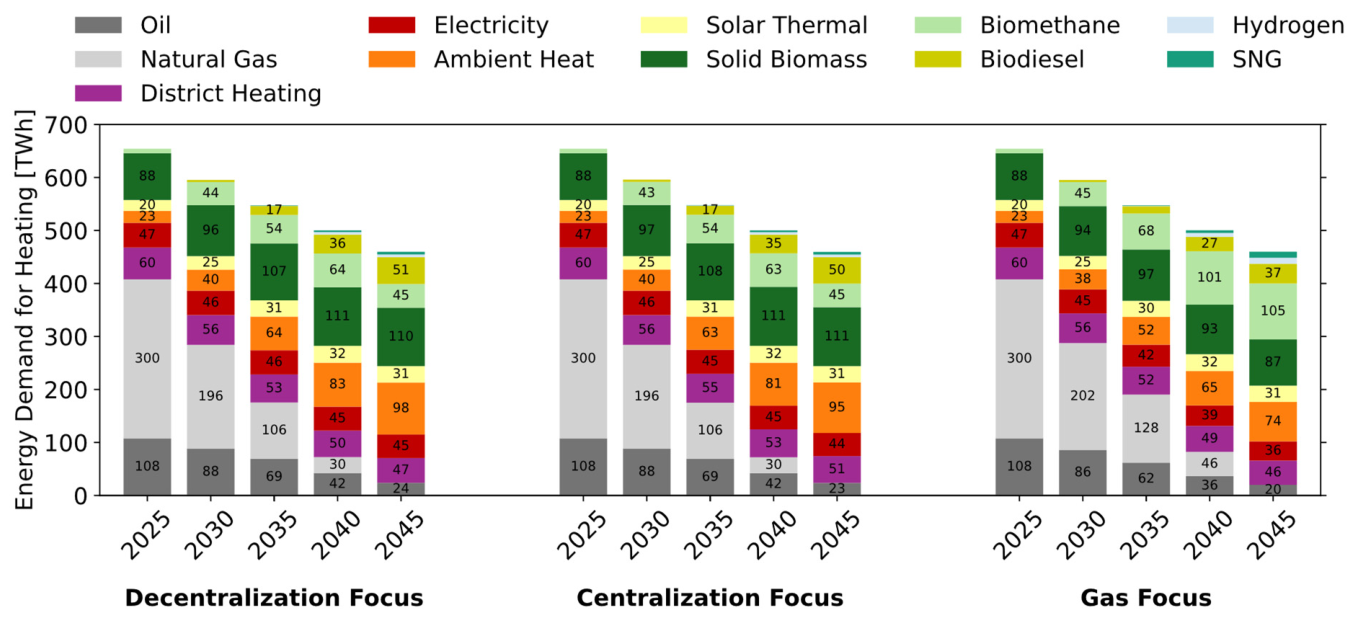
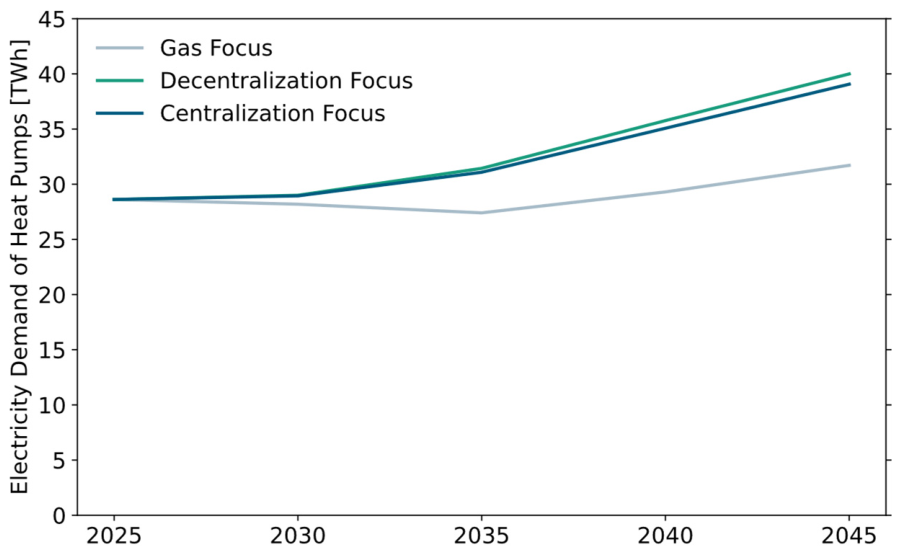
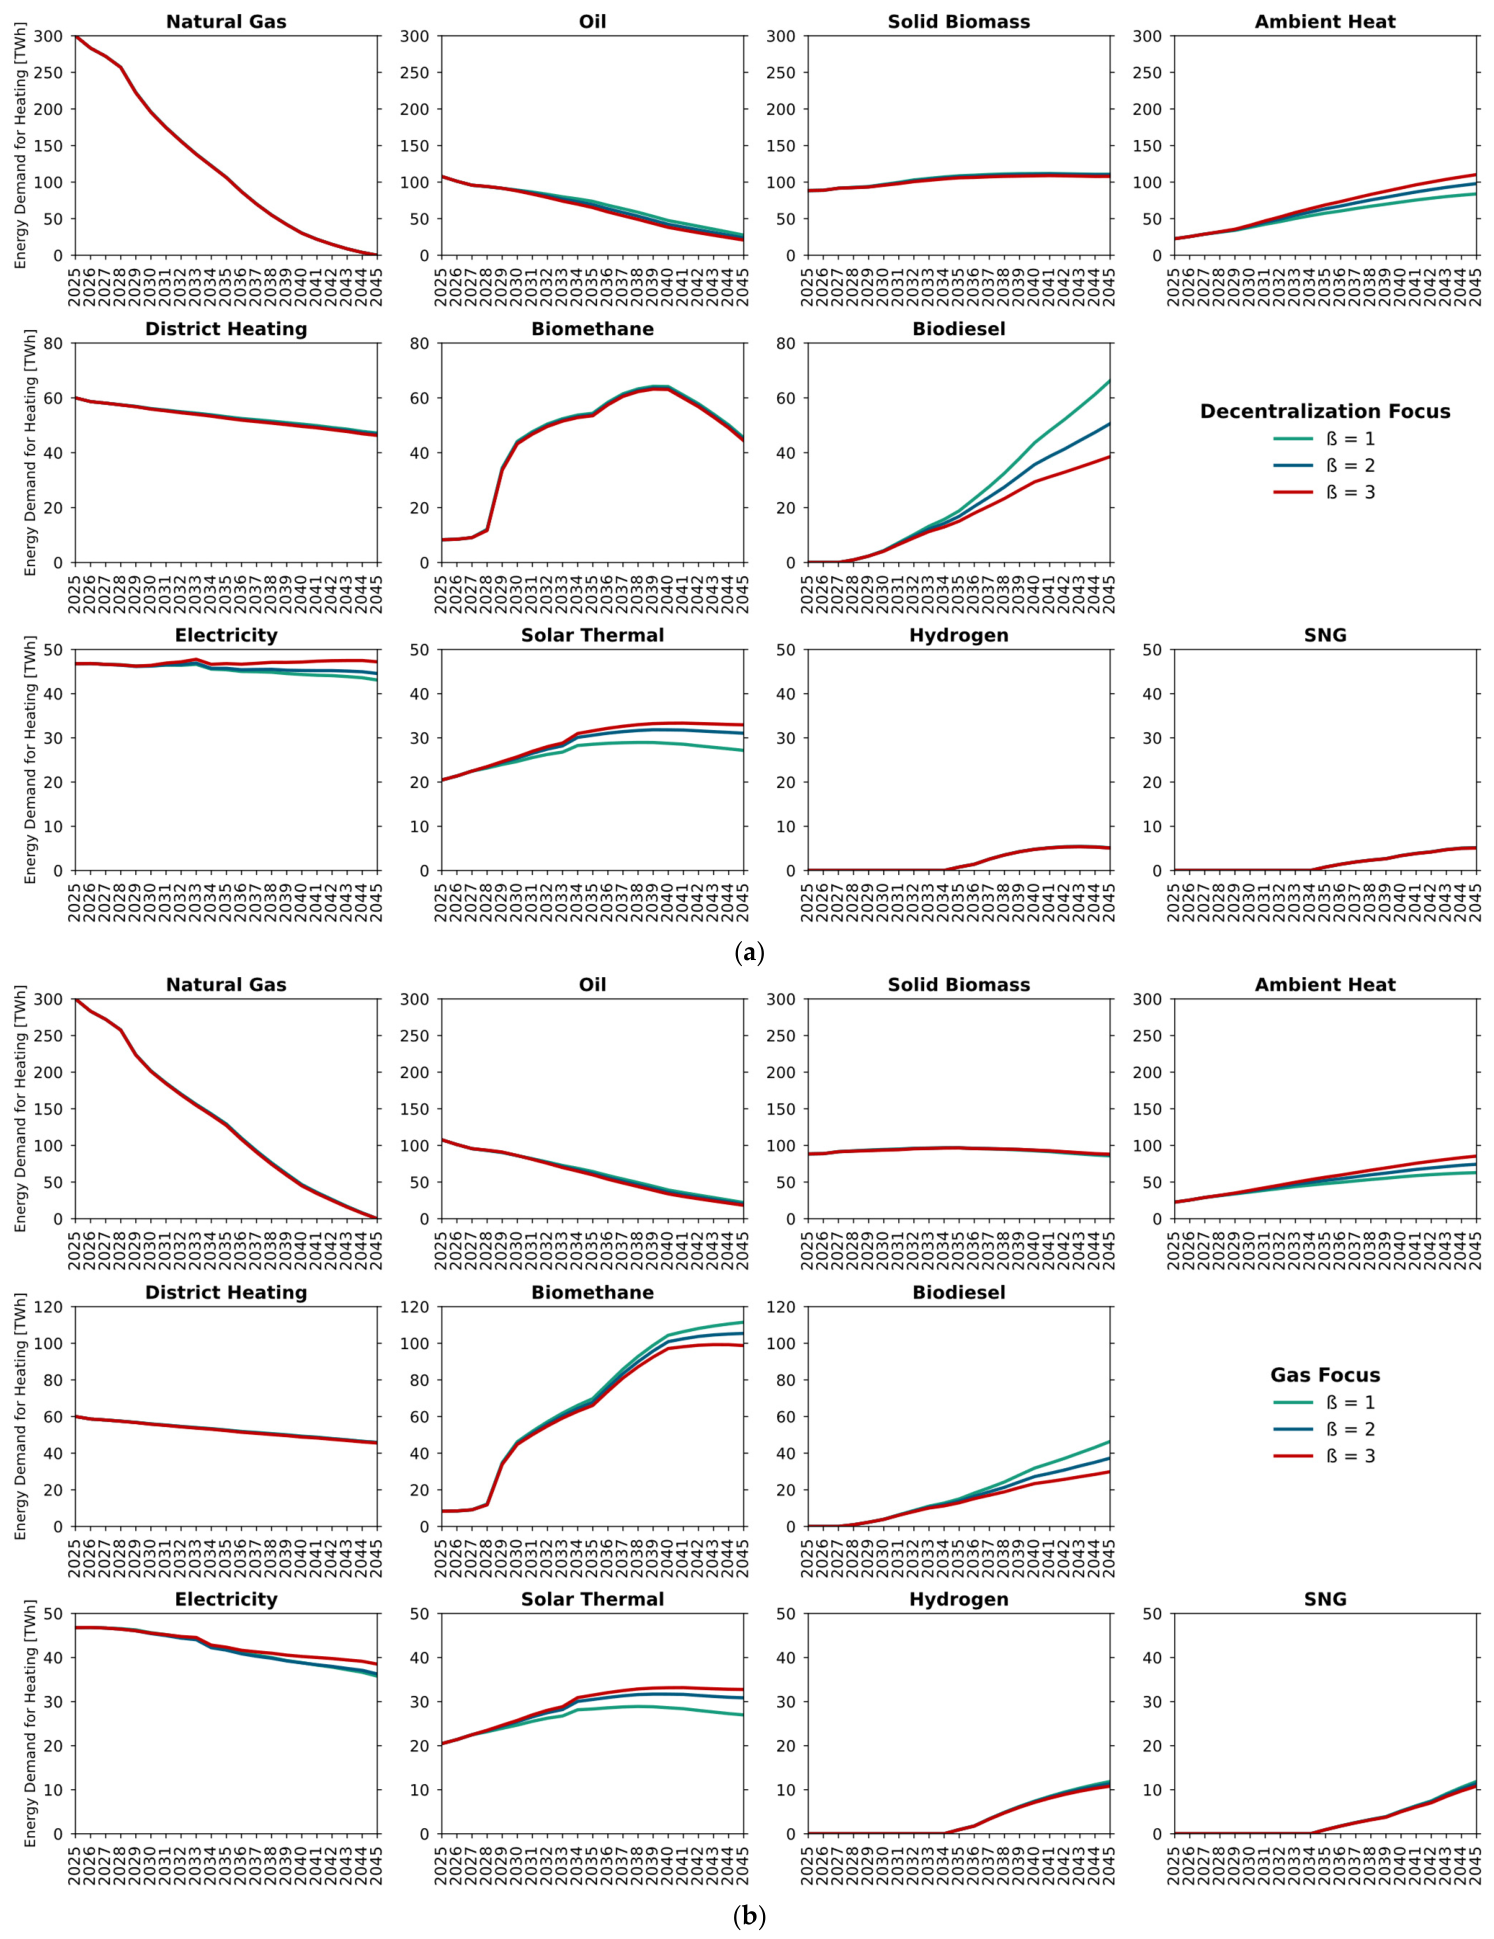
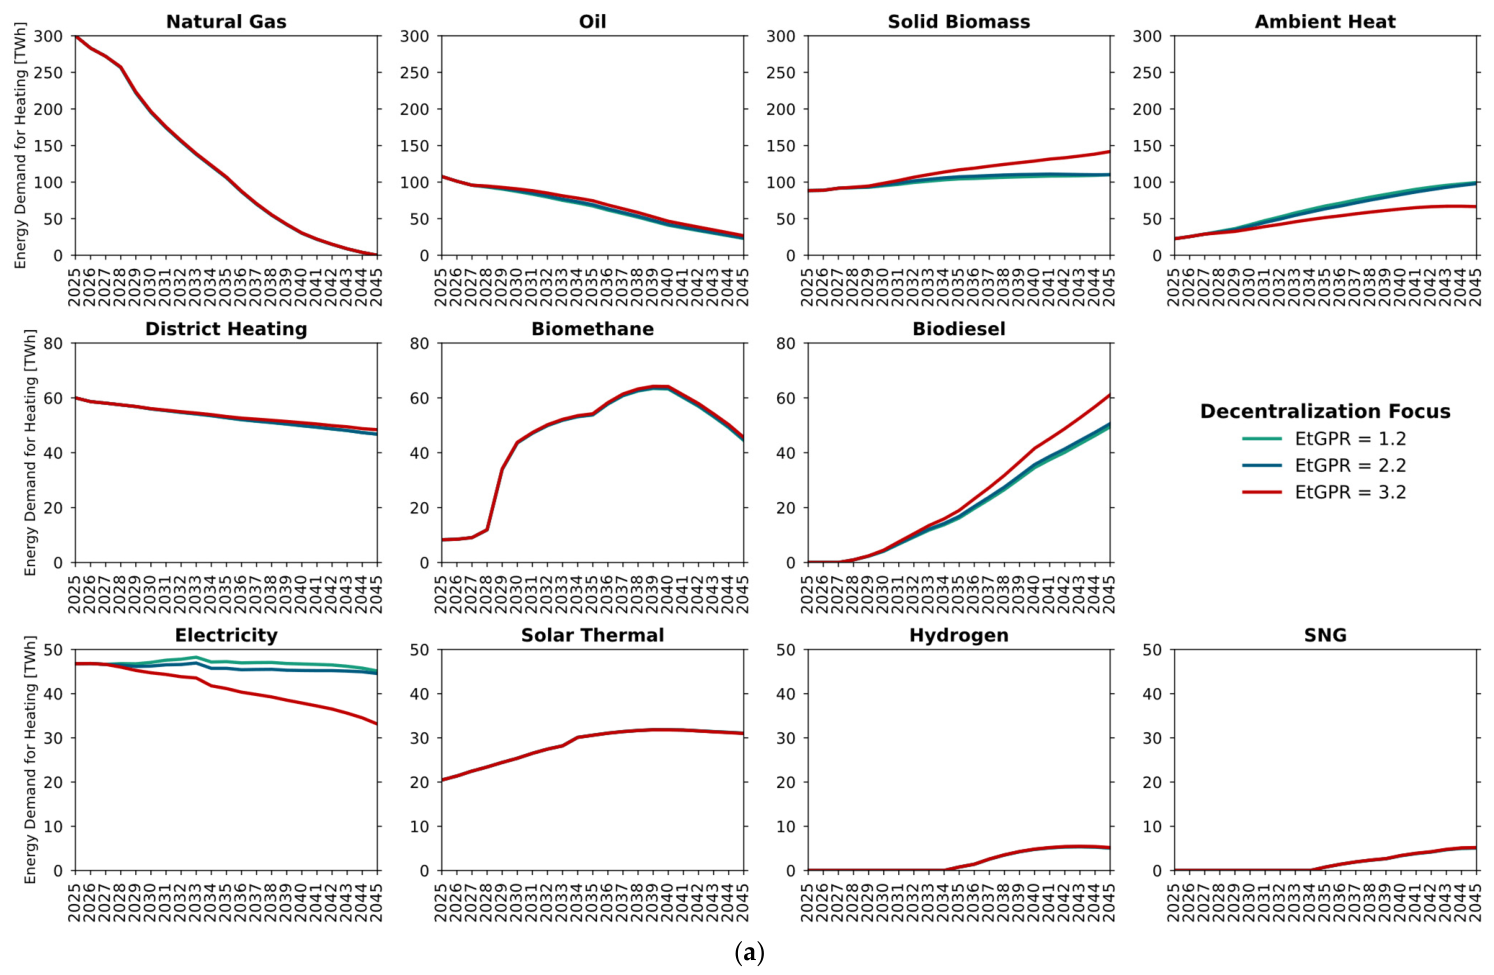
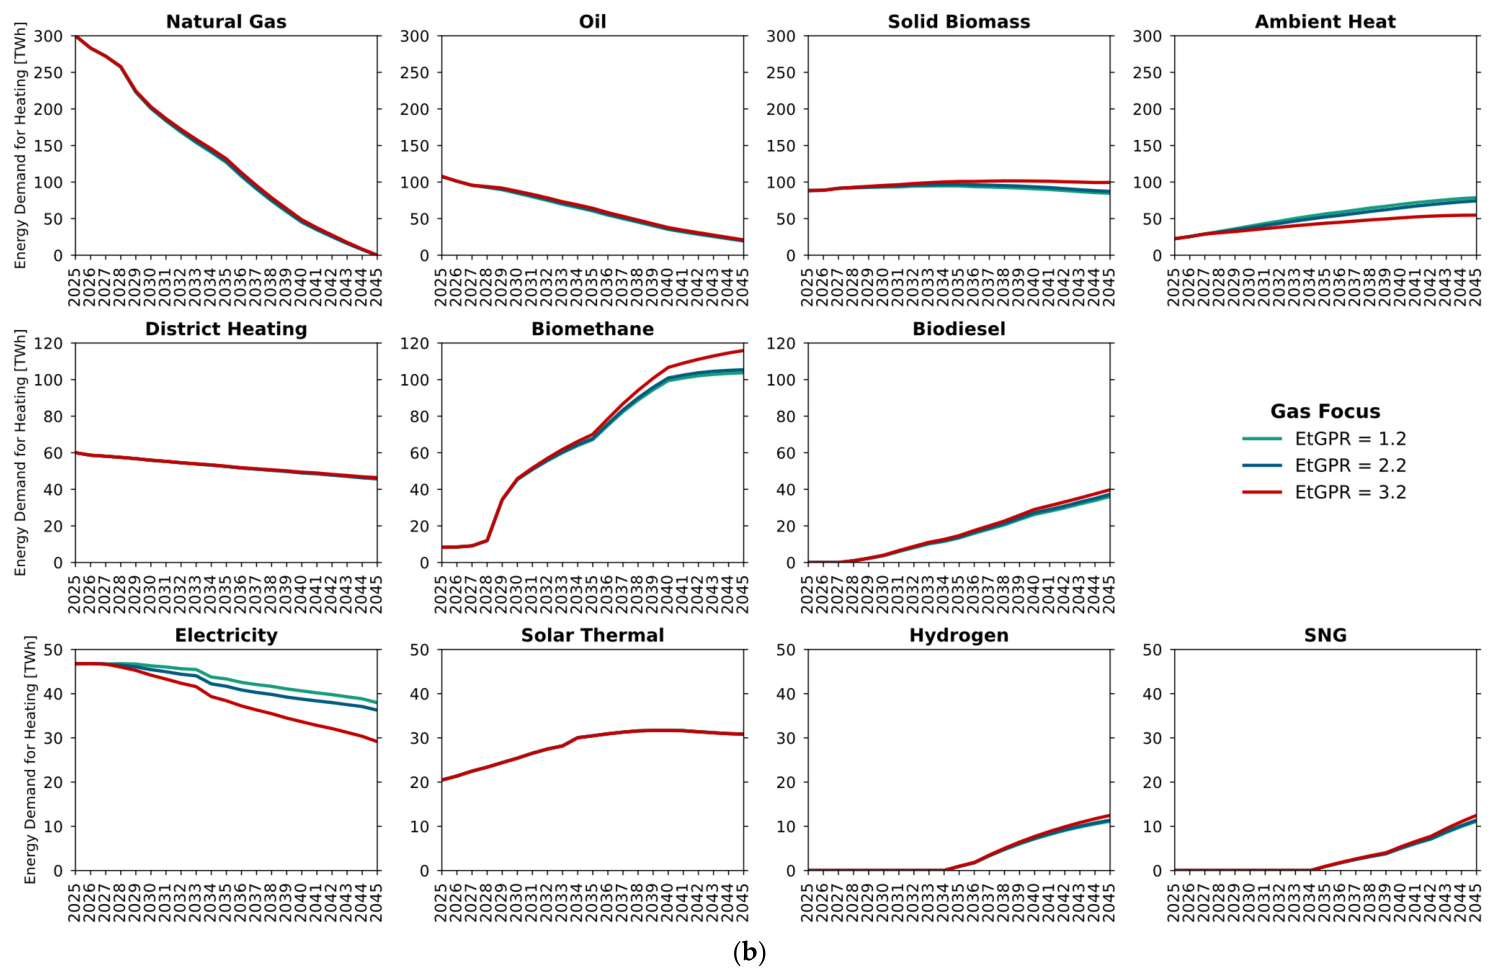
Figure 10 shows the evolution of the final energy demand for heating, with the breakdown for each energy carrier. Due to the overall efficiency gains in the building envelope and high efficiency of newly constructed buildings, the total energy demand for heating decreases up to 2045. The demand for fossil fuels (natural gas and heating oil derived from fossil sources) decreases drastically as well, majorly defined by the decreasing role of the related heating technologies and the assumption of clean fuel blending to the supply mix (Section 3.3). Overall, electricity demand for heating decreases, while the contribution of ambient heat to the energy mix increases steadily. This shows that the contribution of HPs to building heating is gaining importance in the upcoming years, while the electricity demand is not significantly changing due to the switch from direct electric heating to HPs and efficiency gains both in the building envelope and HPs itself. In the Gas Focus scenario, efficiency gains combined with the slower uptake of HPs result in a slight decrease in the total electricity demand from HPs up to 2035 before it increases again (Figure A4).
Energy carriers of biogenic origin become increasingly important over the years, appearing in various forms. In the Decentralization and Centralization Focus scenarios, absolute demand for solid biomass increases and peaks at around 110 TWh in 15 years, and the total demand for gaseous and liquid biogenic fuels increases as well. The demand for these energy carriers is even higher in the Gas Focus scenario, the total reaching up to almost 230 TWh for all forms by 2045 and biomethane making up approximately 45% of the total (105 TWh). Energy system studies typically assume a total available biomass potential of 200–500 TWh/yr, with the dominant role of biofuels in the energy sector focused on centralized heat and power generation, as well as in high-temperature industrial applications, aviation and shipping [53,54,55]. Given this sectoral preference and competing demand, the availability of biogenic fuels for decentralized use in the building sector to the extent found in the scenarios of the present study is highly uncertain and potentially unrealistic. A sensitivity analysis is performed to test the results for fixed amounts of biogenic fuels available to the building sector. The results of this analysis are shown in Appendix C (Figure A16, Figure A17 and Figure A18). The share of HPs in the heating technology stock in 2045 could reach between 60 and 70% in all scenarios when the biomass potential is limited to 150 and 125 TWh/a, respectively. This would correspond to between 80 to 100 GW of installed HP capacity by 2045. The combined effect of the switch from direct electric heating to HPs and the efficiency gains both in the building envelope and HPs itself on the total electricity demand is also evident in the sensitivity scenarios. Even though the amount of ambient heat demand increases significantly, showing the increasing importance of HPs in building heating, the overall electricity demand hardly doubles by 2045.
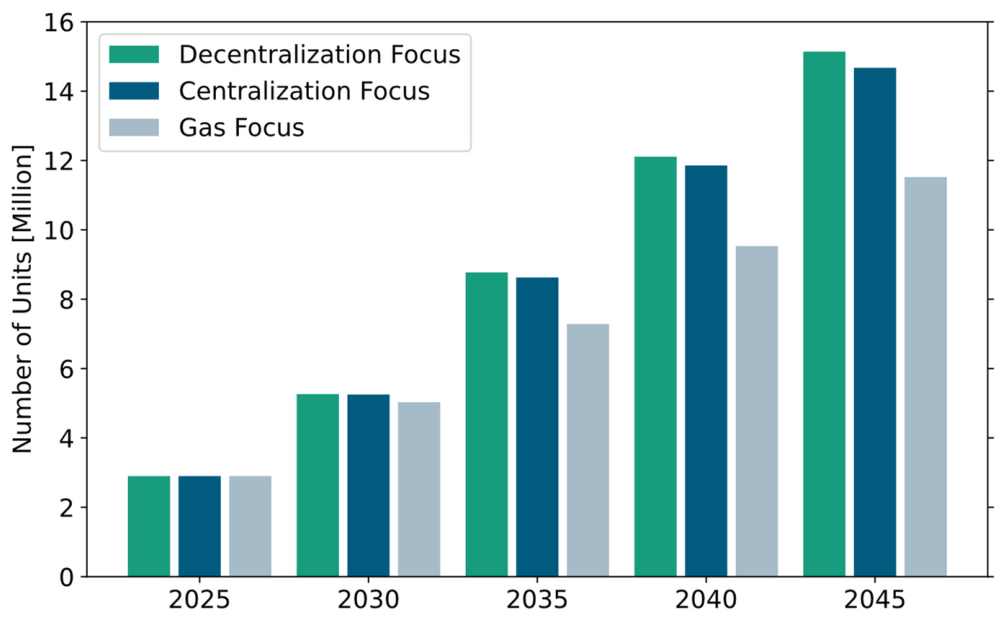
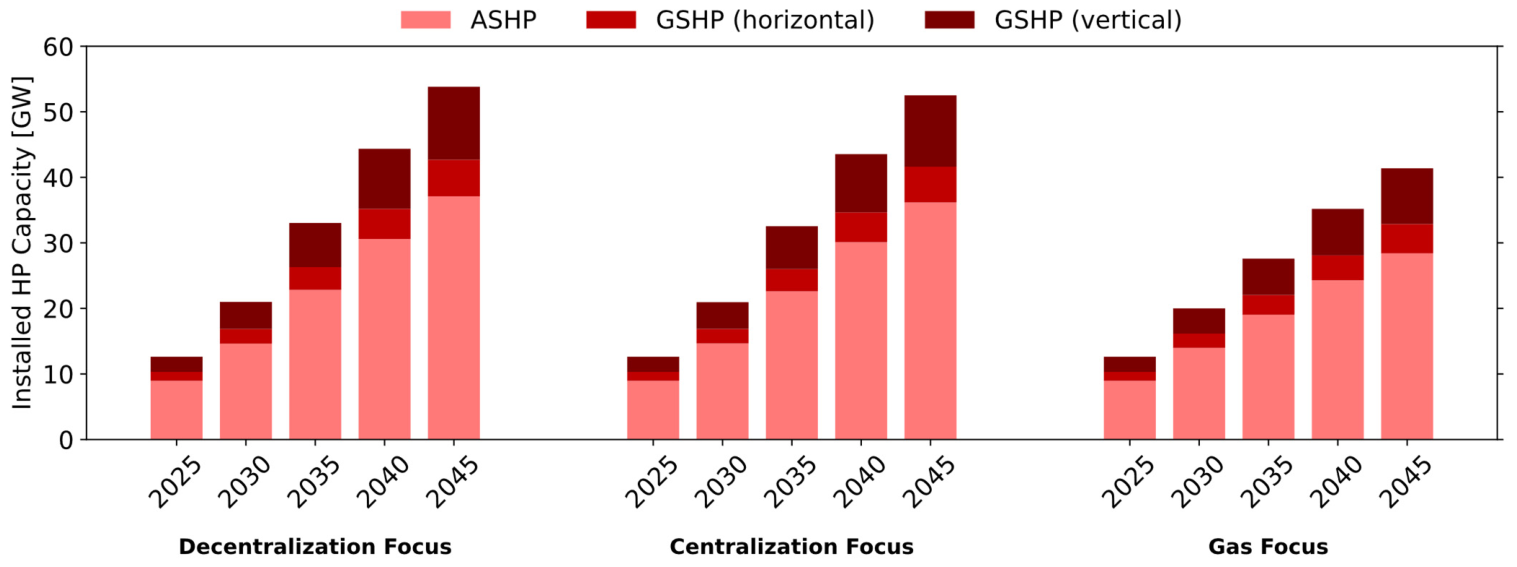
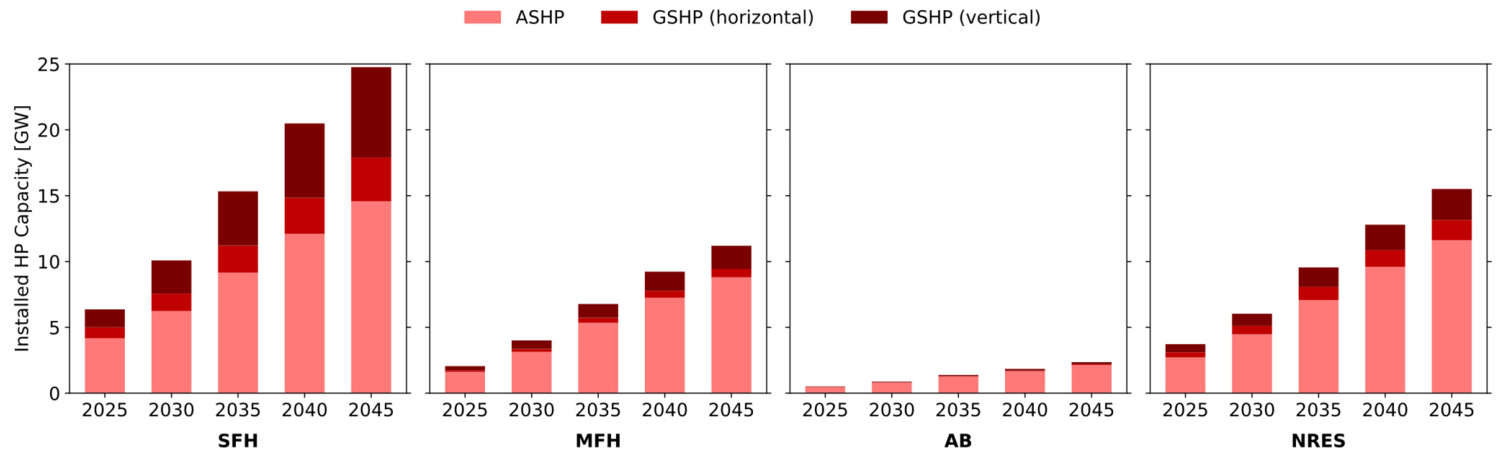
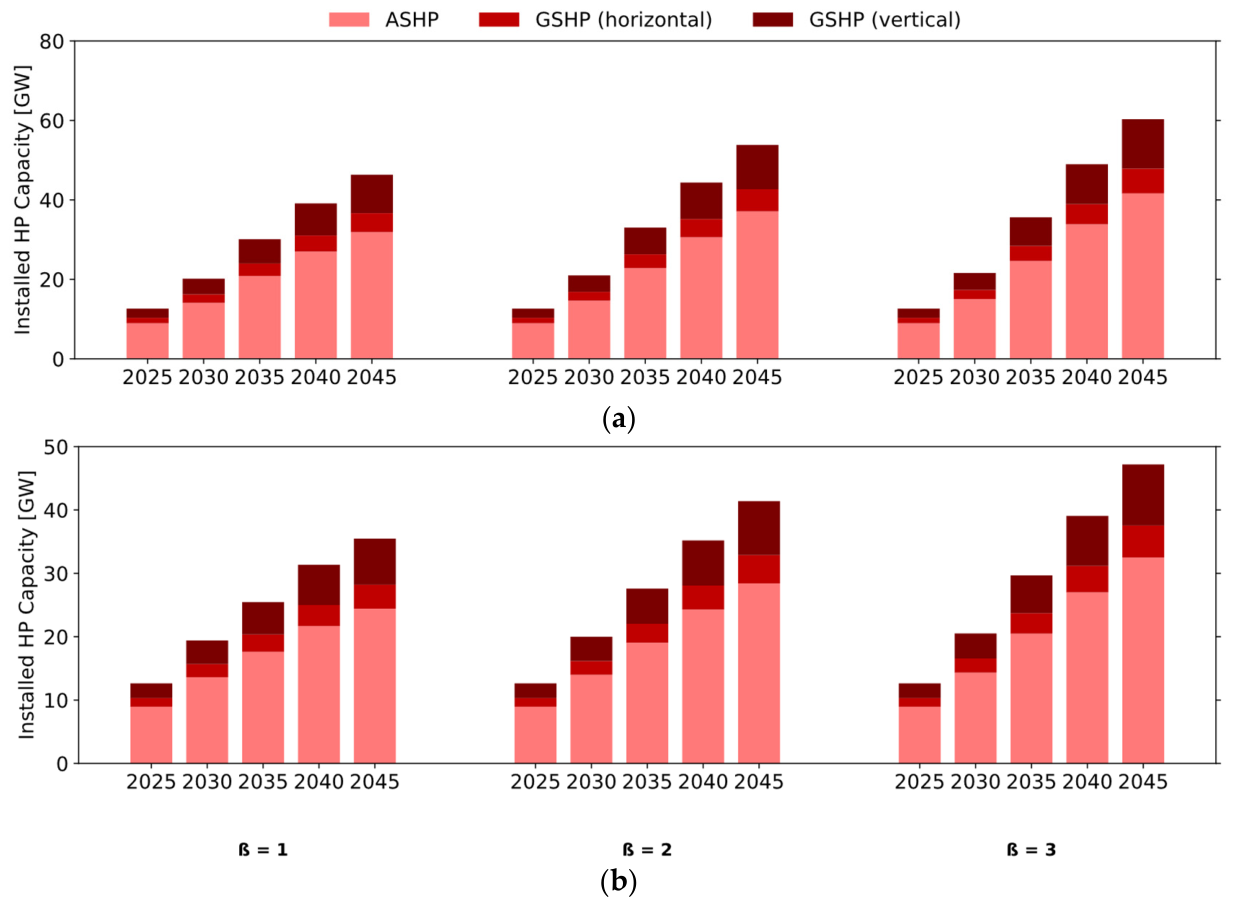
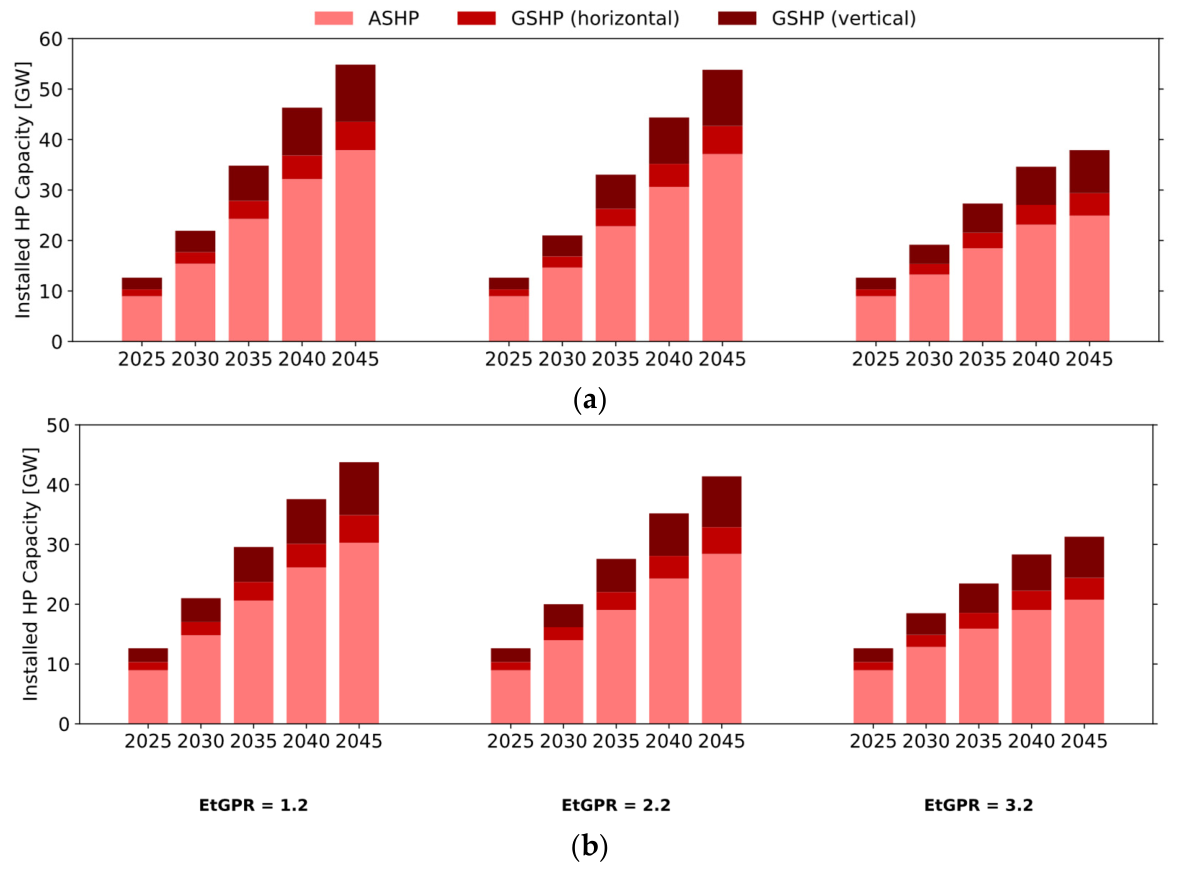
Figure 11 shows the projected number of units heated by HPs up to 2045. Here, units are dwellings or NRES buildings assumed as one working unit. There is a steady increase over the years across all scenarios. In the Decentralization Focus scenario, nearly 15 million units are projected to be heated with decentralized HPs by 2045, corresponding to approximately 54 GW of installed capacity (37 GW with air source and 17 GW with ground source). The Centralization Focus scenario yields a very similar projection. In the Gas Focus scenario, more than 11 million units are projected to be heated with decentralized HPs, corresponding to approximately 41 GW of installed capacity (28 GW with air source and 13 GW with ground source; see Figure A5).
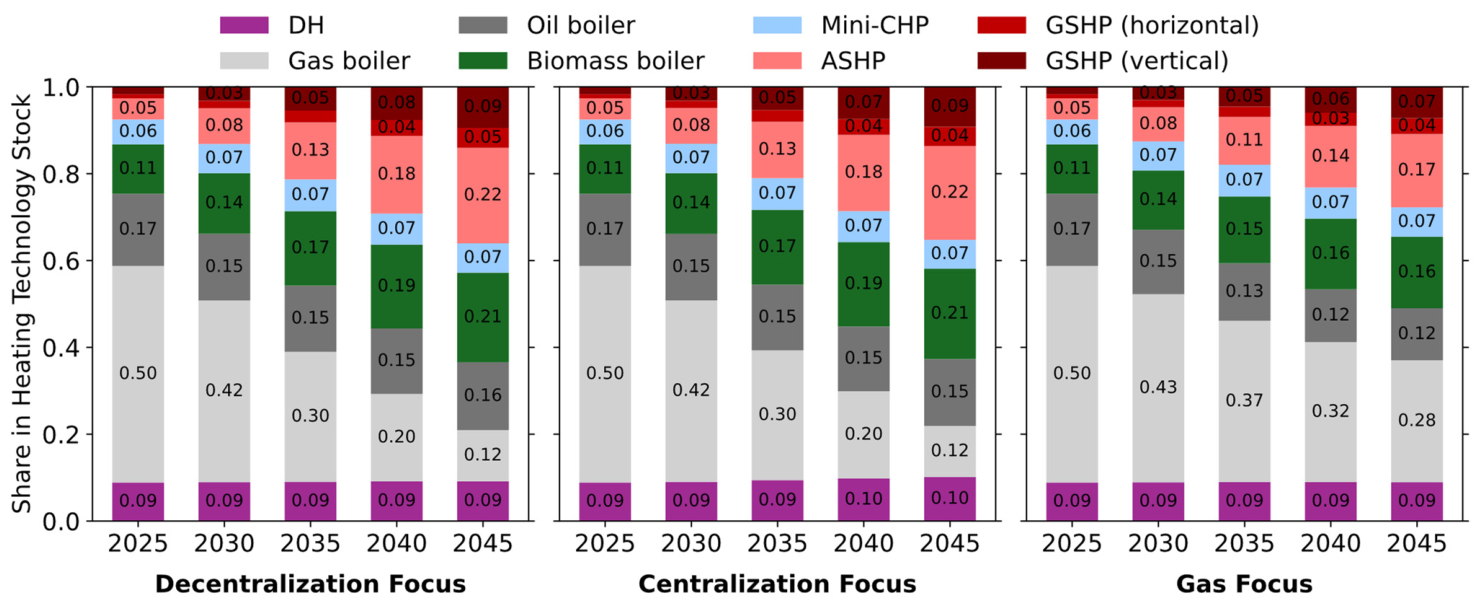
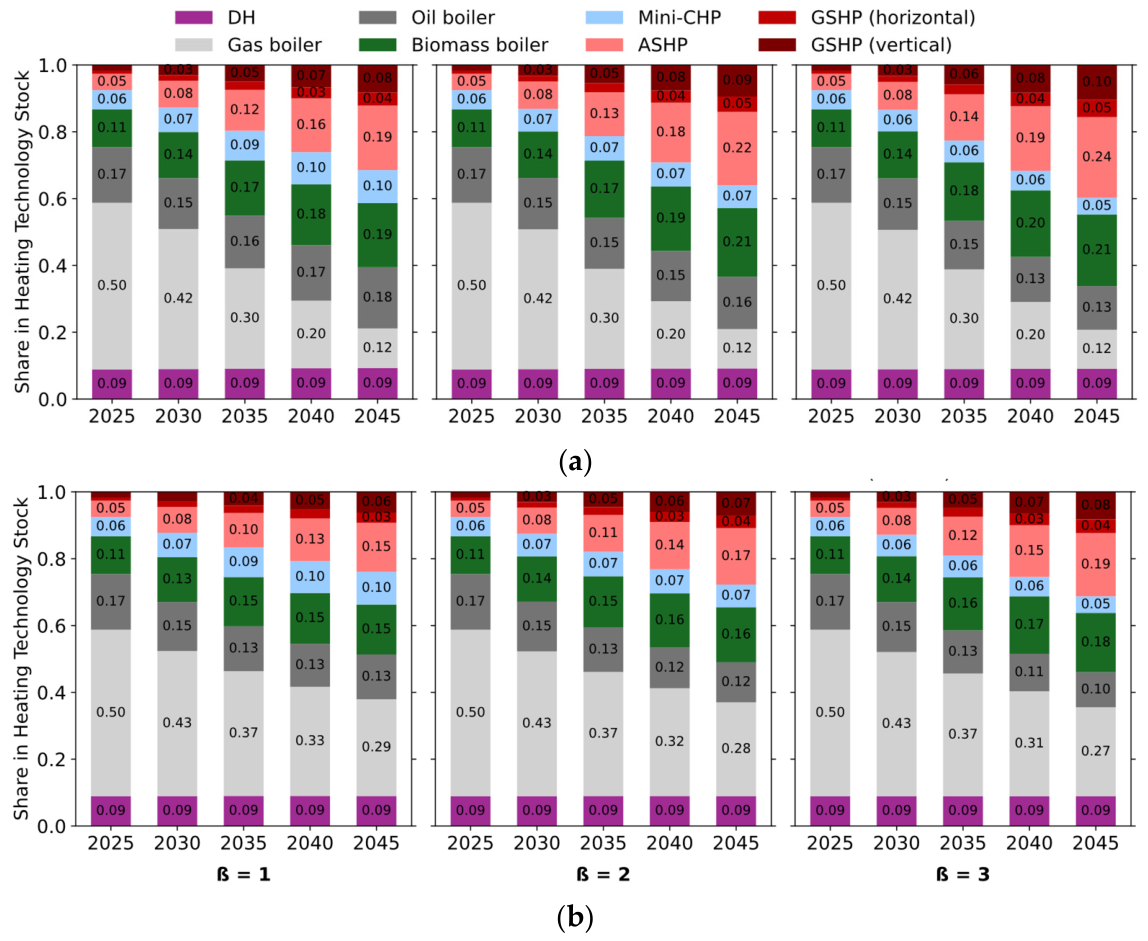
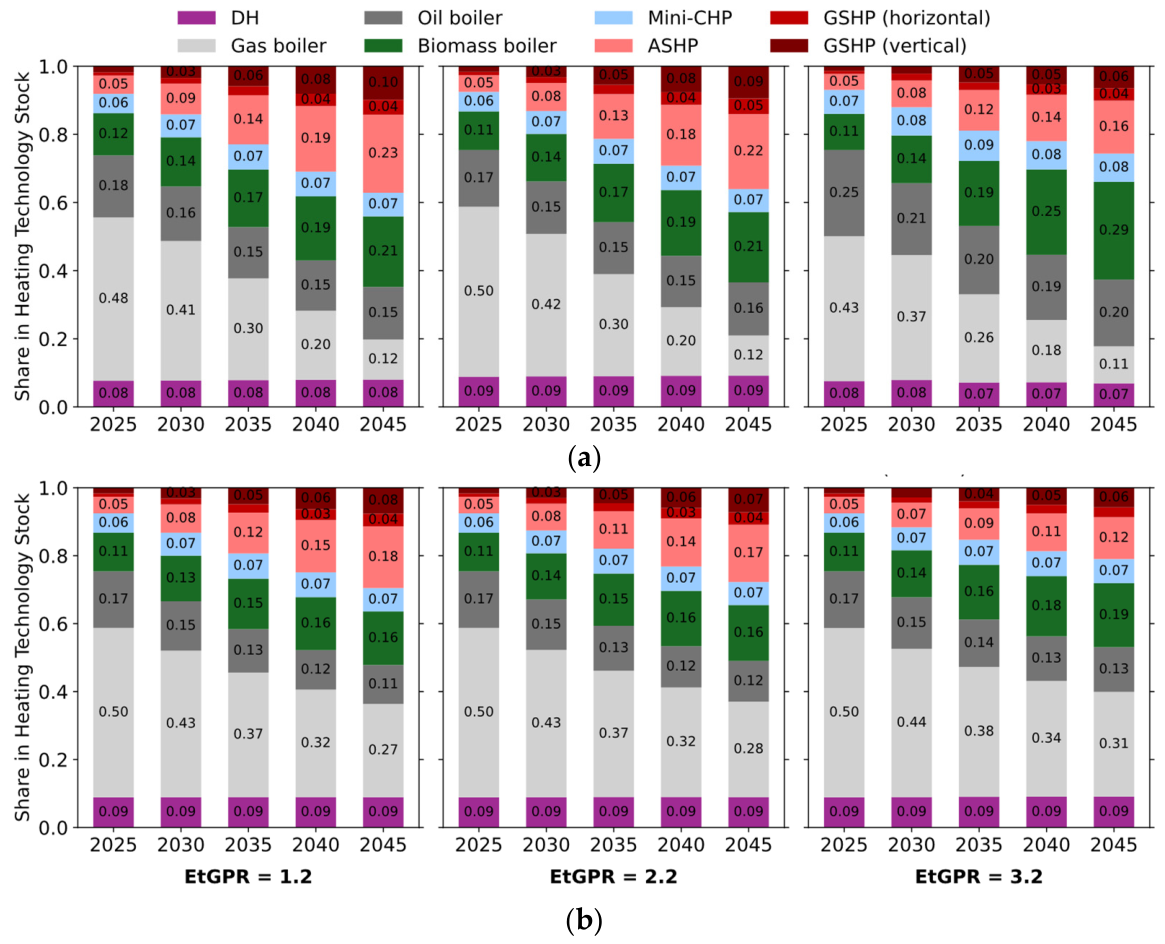
Figure 12 illustrates the share of different heating technologies in the total heating technology stock. The share of HPs in the stock increase steadily over time, starting with a little over 5% to almost 20% by 2035 and up to 36% by 2045 in the Decentralization Focus and Centralization Focus scenarios. In the Gas Focus scenario, as gas networks continue to be operated and continue to accept new connections, HPs are in direct competition with gas boilers in terms of share in stock: both of these heating technologies make up 28% of the stock by 2045. Even though DH availability increases, especially to a high extent in the Centralization Focus scenario, the share of DH in the heating technology stock does not increase significantly. Biomass boilers gain importance in the stock as well, with an increased share of around 20% by 2045 in the Decentralization Focus and Centralization Focus scenarios. This shows that the DH price assumed remains unattractive to agents when freely choosing their heating technology to invest in.
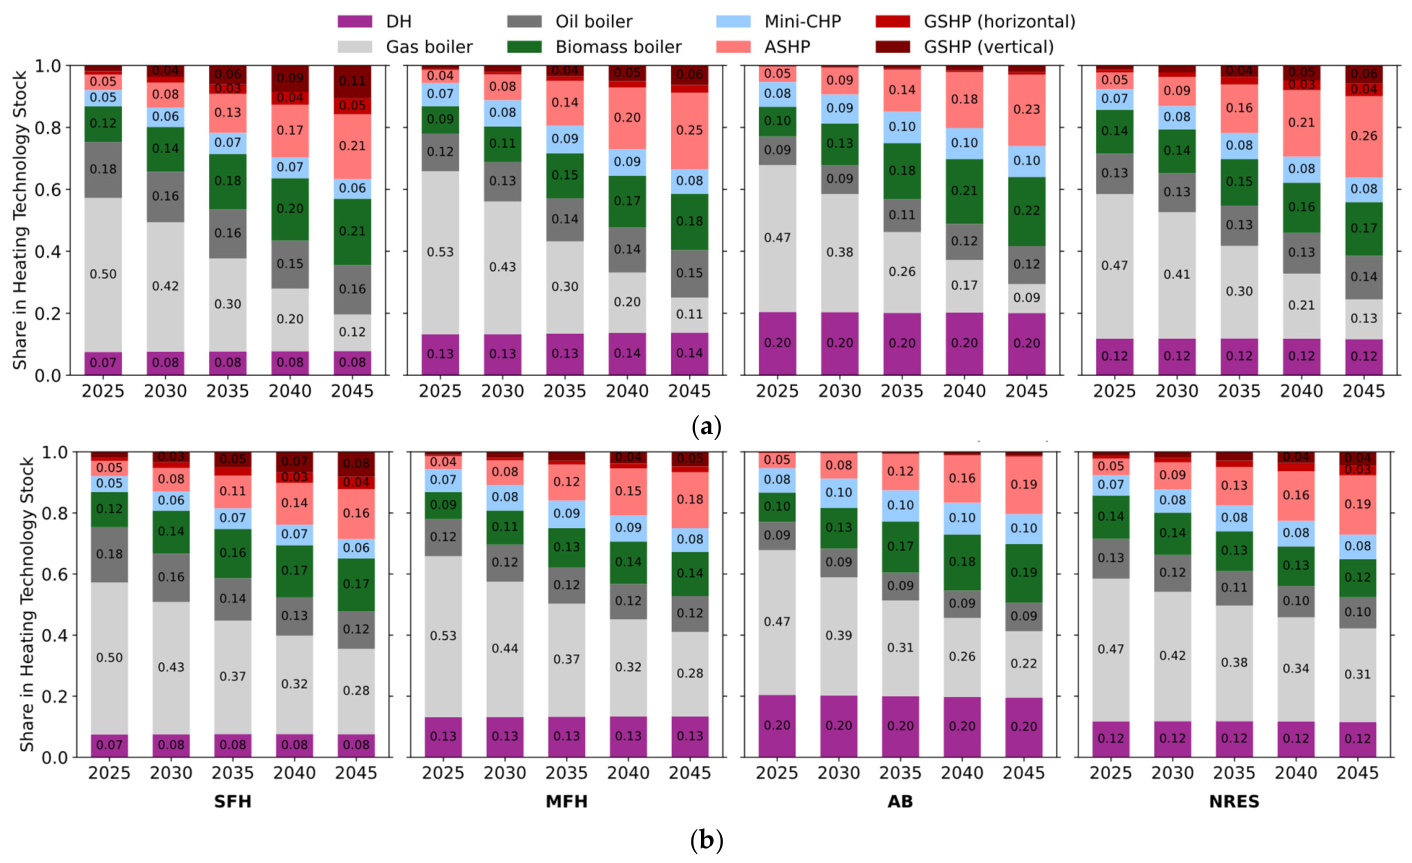
Figure 13 illustrates the share of different heating technologies within the stock of building-type segment of interest. HPs have the highest share in almost all building-type clusters. Even in the Gas Focus scenario, they have at least the same share as gas boilers in all clusters except for in MFH buildings. They gain importance especially in SFH and NRES buildings. Gas boilers on the other hand experience a steady decrease in their share of stock for all building-type segments. Oil boilers gain importance in stock, especially in bigger buildings (MFH, AB, NRES) in the Decentralization Scenario; while biomass boilers’ importance in the installed heating technology stock increases for all building-type segments in all scenarios, except for NRES buildings in the Gas Focus scenario. Overall, biomass boilers have more significant shares in the Decentralization and Centralization Focus scenarios than the Gas Focus scenario, which shows the direct competition between biomass and gas boilers. DH connections retain their importance, with slight increases in all scenarios for the SFH and MFH buildings. It is important to keep in mind that SFH buildings are the most common type of buildings in the German building stock, followed by MFH and AB, and then NRES buildings [31].
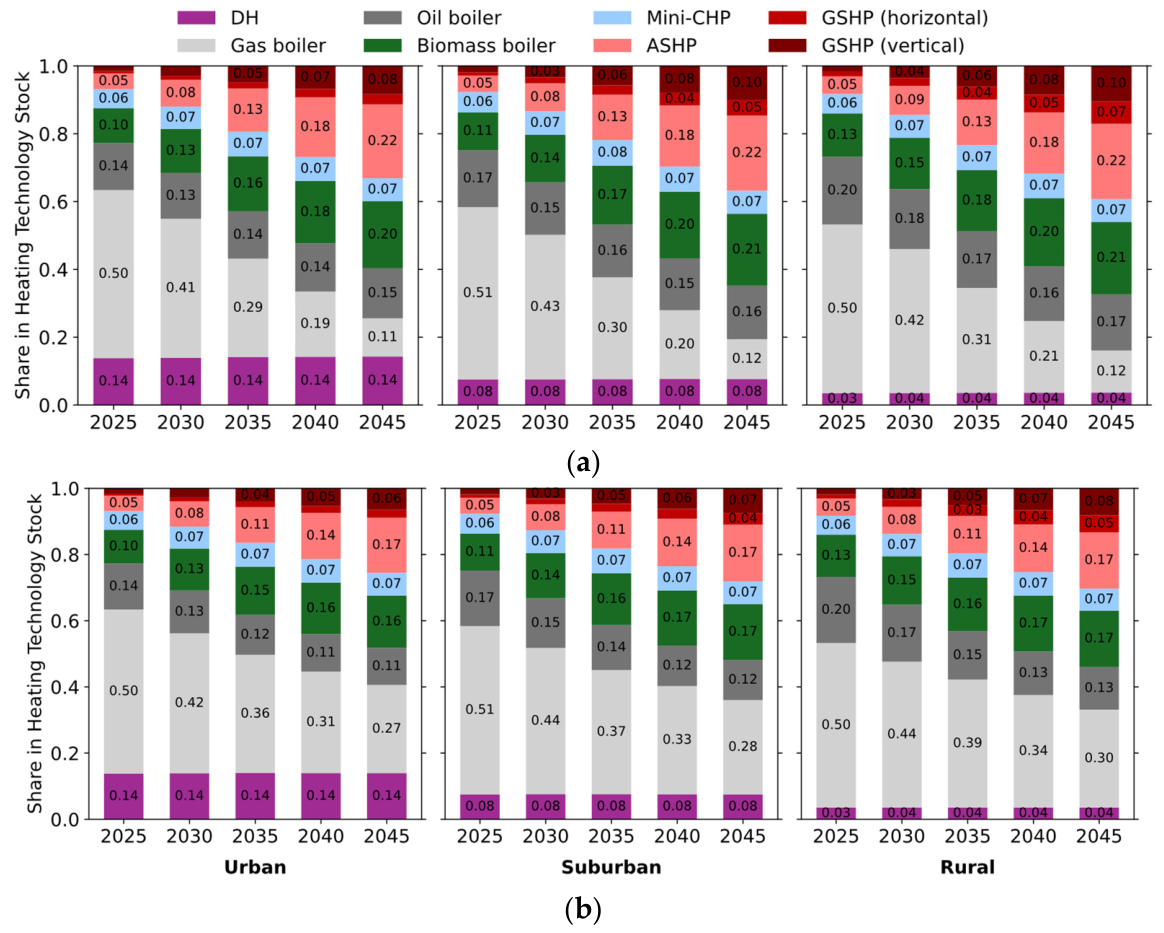
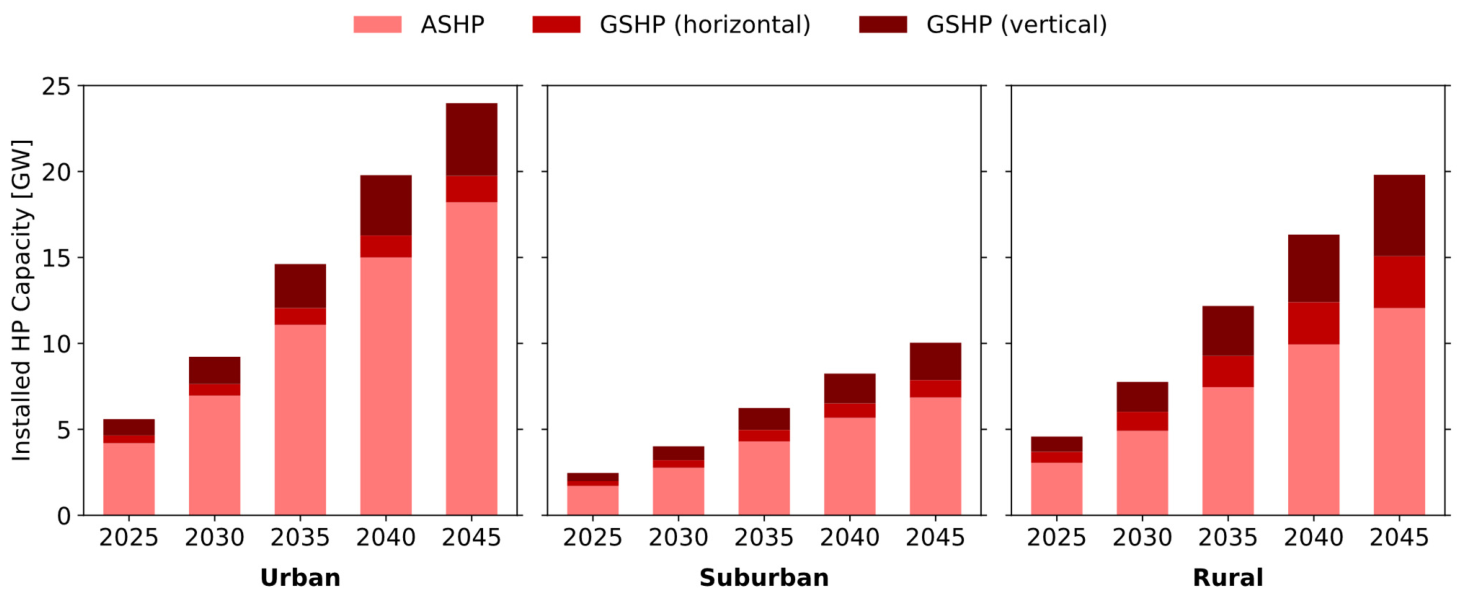
Figure 14 shows that by 2045, at least 30% of the heating technology stock in all types of settlements would consist of HPs in almost all scenarios. Except, they don’t reach 30% share in buildings found in urban and suburban settlements in the Gas Focus scenario. They make up between 22 to 29% of the stock, since gas distribution networks widely continue to operate and remain attractive in most cases.
Roughly 45% of Germany’s heated buildings are in settlements classified as urban according to population density [23]. As gas boilers in the stock are replaced in the Decentralization and Centralization scenarios, biomass boilers gain importance. They are in direct competition for heat supply to the urban building stock whenever HPs aren’t feasible and DH isn’t attractive. For buildings located in urban areas, the limited space availability for environmental heat sources is the deciding factor in this competition, together with the energy carrier prices of DH and biomass. The important role of DH in urban buildings remains over the years but does not increase. As the population density decreases (i.e., in suburban and rural areas), HPs have more room for environmental heat sources and can be deployed. This can be seen in the increased shares of HPs in the stock of suburban and rural building stocks. Note that buildings in rural settlement types make up around 35% of the whole German building stock. The remaining 20% of buildings are located in suburban areas [23].
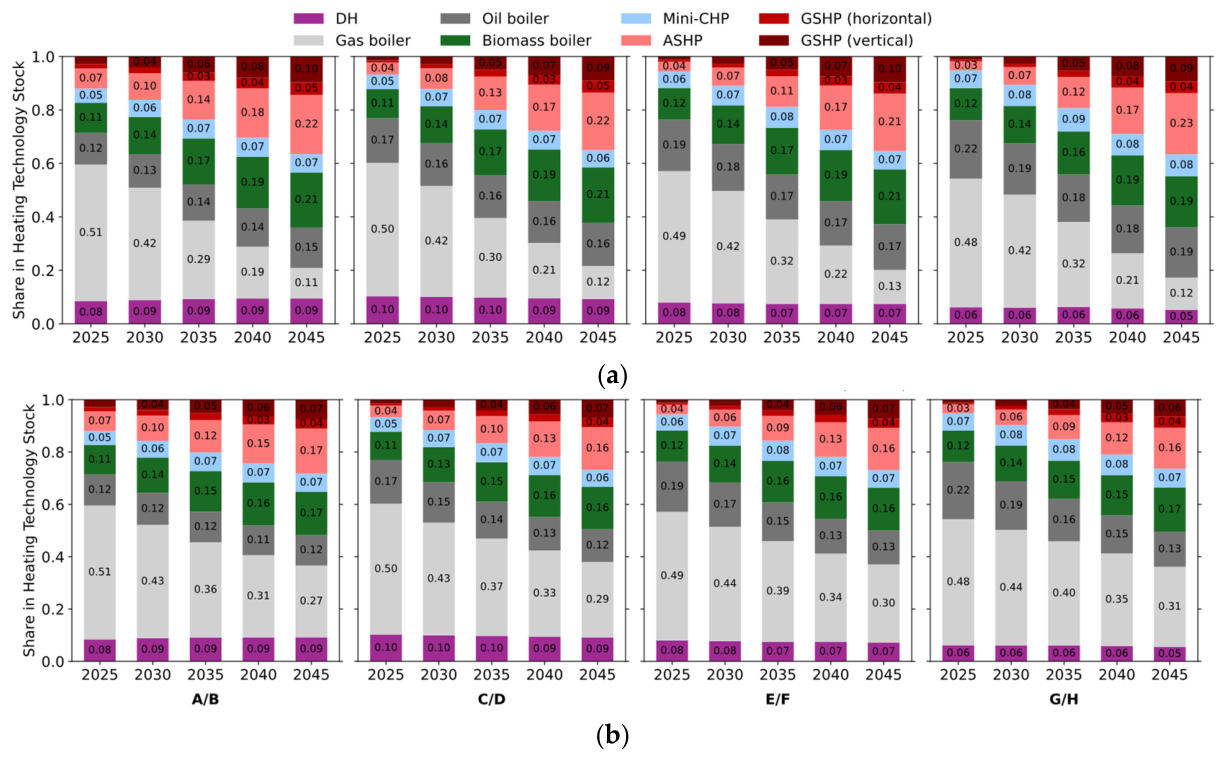
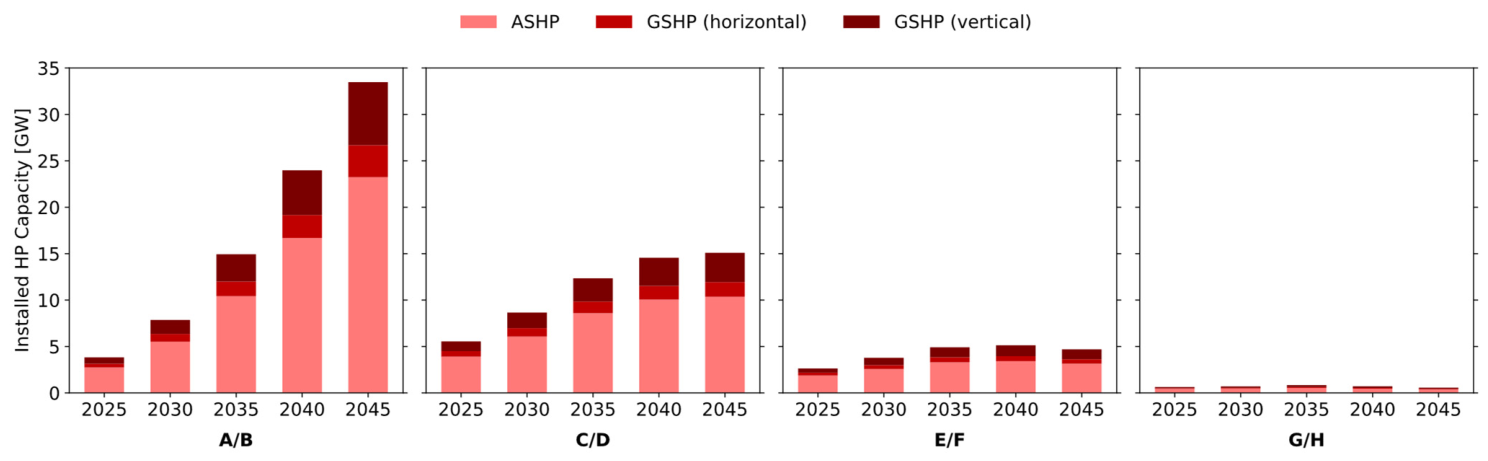
The share of heating technologies within the stock of each EPC cluster can be seen in Figure 15. Even though HPs initially play a more important role in buildings with EPC ratings A or B, they rapidly gain market share and reach comparable levels across all efficiency class clusters. Overall, there are no significant differences in the composition of heating technology stocks across the EPC clusters. Note that the total number of buildings with EPC rating A or B almost triples by 2045 in the scenarios. By 2045, the total number of buildings with EPC ratings G or H decreases to 1/8th of the 2025 level.
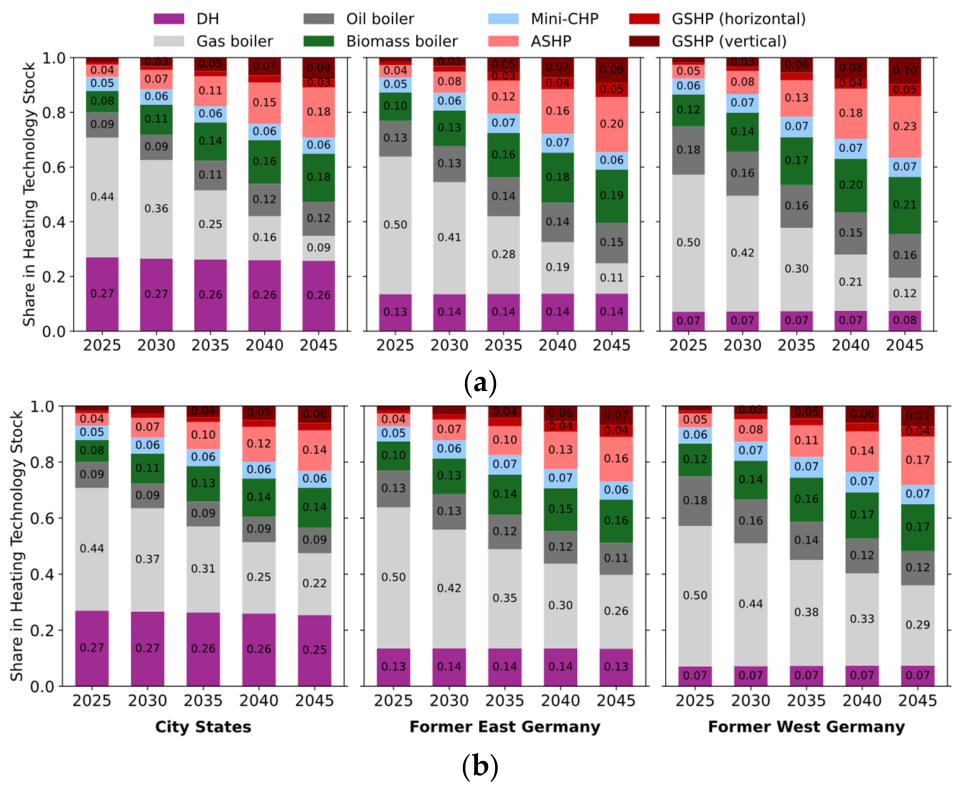
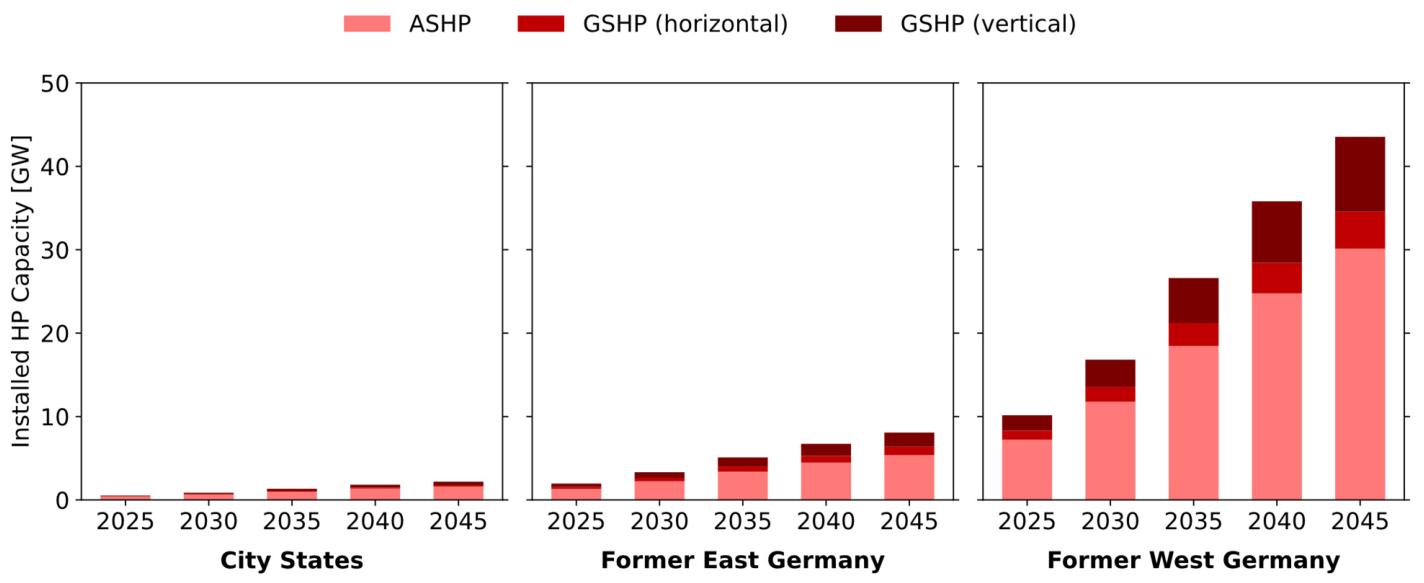
Buildings are also clustered by the federal state in which they are located. Figure 16 shows the shares of heating technologies within the building stocks of each federal state cluster. These clusters have distinctive characteristics, mostly related to their overall population and population density. The total number of buildings found in these clusters is disproportionate: 4% of all German buildings are found in the city states (e.g., Berlin, Bremen and Hamburg), 15% in the former eastern states like Brandenburg and Thuringia, and the rest in the former western states like Baden-Württemberg and North Rhine-Westphalia (roughly 80%) [31].
No significant differences between federal state clusters are observed, except for the role of DH. DH is the most dominant heating technology in the city states and retains its dominant position over time. This is mainly due to high heat densities in the city states. Nevertheless, HPs could reach up to 30% of the installed heating technology stock even in the city states mainly in urban fringes, i.e., outlying districts with lower heat densities.

4.3. Total Heating Expenditures and CO2 Emissions

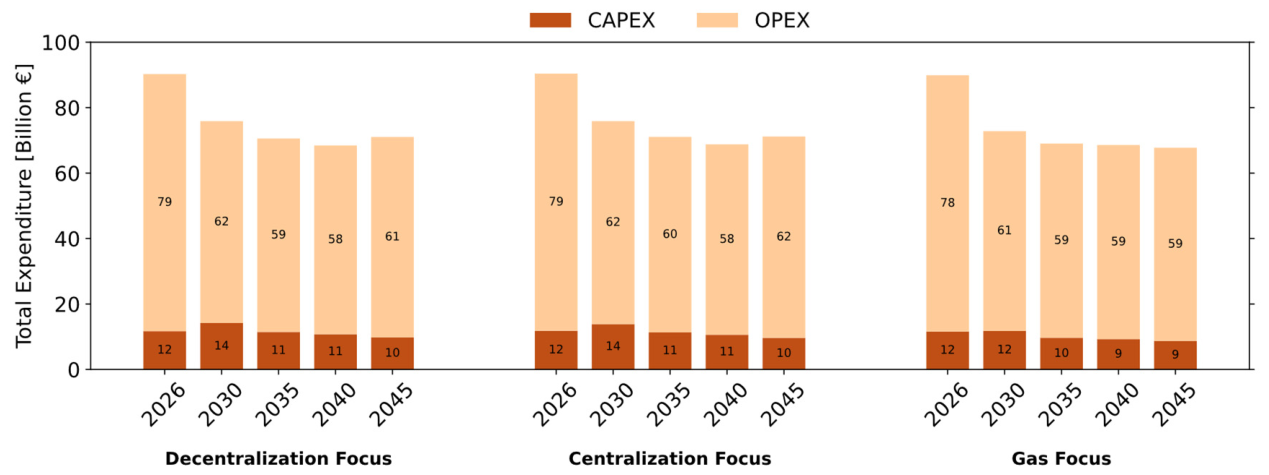
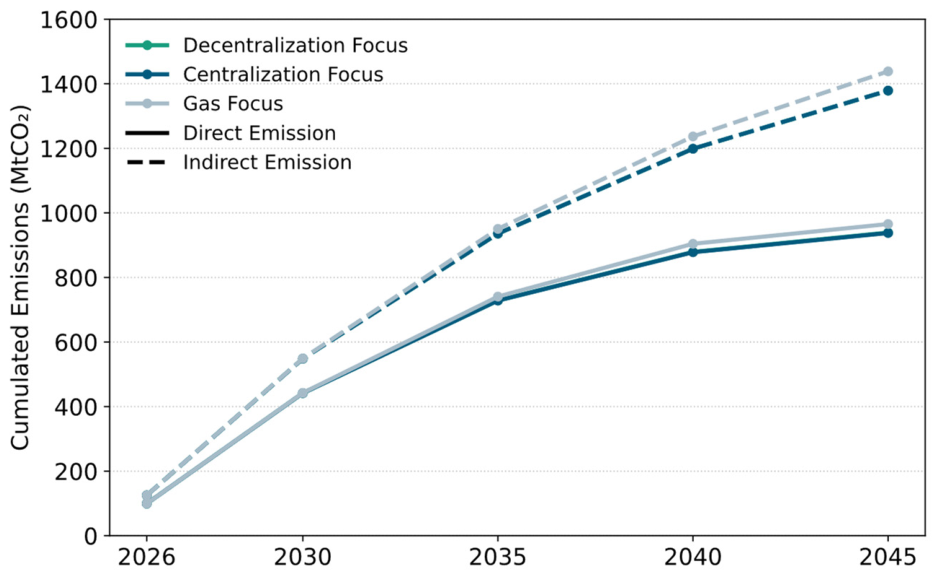
Figure 17 shows the total annual capital investment expenditure (CAPEX) and fuel expenditure (OPEX, excl. maintenance costs) for heating from the consumer perspective. It is important to remember that the gradual blending of biogenic and other green fuels is assumed to incur no additional costs to the existing equipment. Also, there is no distinction of different parties such as landlords, tenants, housing associations that only rent their dwelling units. Furthermore, Figure 18 shows the cumulated direct (on-site) and indirect emissions starting from the base year 2026.
Based on the annual expenditures shown in Figure 17, cumulative expenditures are calculated as the sum of the annual CAPEX and OPEX from 2026 to 2045. In summary, there is around 3% difference observed between the scenarios in terms of their cumulated expenditure, and 3 to 4% difference observed in terms of their direct and indirect CO2 emissions. Cumulatively, the Gas Focus scenario exhibits around 25 billion Euros less CAPEX than the other two scenarios, around 10 billion Euros less OPEX than the Decentralization scenario and around 16 billion Euros less OPEX than the Centralization scenario. Although it results in 27 to 28 Mt more cumulated direct CO2 emissions than the other two scenarios, its cumulative indirect CO2 emissions are approximately 60 Mt higher by 2045. This shows that a more prominent role of decentralized HPs in the building stock saves 27 Mt direct CO2 emissions in total in the next 20 years, with potential savings of up to 60 Mt in indirect CO2 emissions when the decarbonization of the electricity and DH supply is considered.

4.4. Discussion

In this paper, we modeled the transformation of the German building stock under three explorative techno-economic scenarios to assess potential developments in heating technology stock up to 2045. This section discusses the key findings with respect to our three research questions, relates them to the existing literature, derives implications for policy and practice, and highlights the study’s limitations.

4.4.1. Heating Options and the Cost of Heat

The results addressing RQ 1 on the available heating options and unit heat costs show that decentralized HPs are cost-competitive over their lifetime across a wide range of building stock segments for all scenarios considered. Their median LCOH increases as the energetic performance of the building decreases (Section 4.1). The pattern is observed across all scenarios. Even in the Gas Focus scenario, where gas boilers achieve their lowest LCOH, HPs remain on average the more cost effective option, while biomass boilers fall within an intermediate cost range. This confirms that, from a purely techno-economic perspective, HPs represent a competitive heating choice for most segments, provided sufficient local heat sources are available (Section 4.4.2).

4.4.2. Adoption and the Role of Heat Pumps

Despite this cost-competitiveness, the modeled adoption of HPs is more gradual than the LCOH results alone would suggest (Section 4.2). Nevertheless, HPs achieve the highest share in the stock in almost all building-type clusters. By 2045, nearly 15 million units (≈54 GW installed capacity) are heated by HPs in the Decentralization and Centralization Focus scenarios, and more than 11 million units (≈41 GW installed capacity) are heated by HPs in the Gas Focus scenario. These results indicate that decentralized heat pumps could consistently provide at least 25% of the heating demand in buildings, thereby answering RQ 2 on the expected adoption of heating technologies by 2045 and the role of HPs in the transition.
The modeled deployment pattern is strongly influenced by settlement type. In urban areas, where space for environmental heat sources is limited, HPs compete with DH, oil, and biomass boilers. In suburban and rural areas, however, the greater availability of environmental heat sources supports broader HP adoption. Conversely, projected HP shares evolve similarly across EPC clusters. This suggests that EPC is not a major barrier to adoption under the techno-economic assumption that the median SPF of HPs is only weakly affected by the building’s EPC rating when a central system supplies both SH and SHW demand (Section 3.2).
The gap between lifetime cost-competitiveness and modeled adoption can be attributed to two factors that are reflected both in the model and in real world decision-making. First, decision-makers typically base heating technology investments on current and near-term energy prices rather than on lifetime costs. In the model, this behavior is represented by the sum of annualized investment expenditures and a single year of fuel expenditure at prevailing prices. Second, HPs require relatively high upfront investments, which remain substantial even with the assumed 35% subsidy on capital costs.
It is important to note that the method to estimate the maximum achievable decentralized HP capacity at individual-building level is based on conservative assumptions. As a result, actual capacities may be higher, depending on site-specific conditions [25]. Furthermore, integrating these building-level potentials into the building stock model required aggregation and clustering. Buildings within each settlement type were assigned to predefined ranges of sound emissions and available ground area. Because values within these ranges were assigned randomly to the modeled agent, the resulting HP potential estimates are subject to a degree of uncertainty.

4.4.3. Expenditures and CO2 Emissions

The scenarios differ slightly in terms of total expenditures and cumulated emissions (3 to 4%; see Section 4.3), thereby addressing RQ 3 on the expenditures and CO2 emission reductions associated with the heating stock transformation in German buildings and the contribution of HPs. Compared with the Decentralization and Centralization Focus scenarios, the Gas Focus scenario results in cumulative expenditures that are 35 to 41 billion euros lower over the next 20 years. However, it also leads to 27 Mt higher direct and 60 Mt higher indirect CO2 emissions.
These results are influenced by the assumption that using biogenic and other green fuels in the existing fossil boiler stock does not require additional equipment investments. This assumption is made on three considerations: (1) biomethane and SNG are chemically equivalent to natural gas and can therefore be used as direct substitutes [56], (2) the assumed hydrogen admixture remains within the concentration limits reported to be compatible with conventional gas appliances [57], and (3) the maximum biodiesel admixture of 20% is consistent with reported compatibility thresholds for conventional oil heating equipment, beyond which material degradation and filter clogging may necessitate equipment replacement [50].
Although the transition toward low-carbon heating progresses under all three scenarios considered, particularly through the admixture of green gaseous and liquid fuels, decarbonization proceeds more slowly in the Gas-Focused scenario. A larger shortfall in meeting climate targets under this pathway could have political and economic consequences for Germany, particularly through higher compliance costs and obligations under European climate agreements. In addition, a Gas-Focused pathway for building heating would place further pressure on the remaining total CO2 emissions budget, thereby reducing the flexibility available for emissions in other sectors. Finally, heavy reliance on fuels of biogenic origin is associated with considerable uncertainty regarding both their future availability and affordability.

4.4.4. Policy Implications

One important outcome of the study is that, although DH is economically viable in the identified potential areas, its modeled market share remains below the assumed potential of 30%. This is because DH is not always the most attractive option compared with competing technologies at the building level, and the model does not include either mandatory connection requirements or additional incentive for connecting to an available DH network. While individual buildings are represented in considerable detail, DH is modeled using a single average price that is applied uniformly across all networks and scenarios. In reality, however, DH prices vary according to the network size, heat generation source, and ownership structure [58]. To our knowledge, no comprehensive published study has systematically characterized DH price variation by network size, temperature level, settlement type, region, or generation mix across Germany. If future analyses of spatially differentiated DH prices identify areas with high heat demand and prices below the national average, the modeled DH share would increase. Although regulatory frameworks and competitive pressures may limit the extent of the price variation, its impact on DH deployment warrants further investigation.
Furthermore, implementing envelope efficiency measures after the installation of a new heating technology would slightly increase the LCOH. In the case of HPs, it may also lead to system oversizing in the renovated building state, rendering a part of the initial investment redundant and reducing the equipment’s operating efficiency. This underlines the importance of coordinating heating system replacement with building retrofit measures, as well as policies that facilitate and accelerate energy savings. Instruments such as renovation passports, which provide building owners with tailored renovation roadmaps and help avoid lock-in effects, can play an important role in this regard [59].
Finally, the results suggest that limited foresight and high upfront investment costs slow HP adoption despite their favorable lifetime economics. Stable long-term policies that provide clear and predictable signals are therefore crucial to accelerating uptake. Conversely, policy uncertainty, such as that associated with the ongoing debates surrounding the German national heat act, can weaken the near-term expectations on which many investment decisions are based.

4.4.5. Limitations of the Study

Limitations of the study should be acknowledged. First, owing to the lack of consistent, building-sector-specific literature on future biomass, biogas, and bio-oil availability and price pathways, the analysis was limited to testing a range of hypothetical aggegate for biogenic fuels potentials. In base scenarios, solid biomass demand peaks at 100 to 110 TWh over the next 10 to 15 years, while biogas demand reaches 55 to 70 TWh in 2035 and 45 to 105 TWh by 2045. Bio-oil demand amounts to approximately 20 TWh in 2035 and 37 to 50 TWh by 2045. Existing studies of economy-wide biomass resource potentials indicate that biomass and biofuel demand at these levels is unlikely to be available to the building sector [53,54,55]. The sensitivity analysis for biofuels (see Appendix C) demonstrates that HPs become substantially more dominant in building heating under constrained biogenic fuel availability. Future research should therefore investigate the share of biofuel resources that could realistically be allocated to the building sector and develop consistent price pathways against which these demand projections can be reassessed.
Second, the model accounts for increased electricity network charges as an economic consequence of grid investment requirements but does not explicitly represent physical capacity constraints in local distribution networks (e.g., low-voltage transformer capacity). In some cases, local transformer infrastructure may require upgrading to accommodate high concentrations of HP installations, particularly in suburban and rural areas where the largest HP growth is projected. The resulting costs may not be fully reflected in the network charges assumed in this study. Future research should therefore assess the extent to which local grid capacity constraints could affect the projected HP rollout and whether additional infrastructure costs alter the competitiveness conclusions presented here.
Third, the analysis adopts a purely techno-economic perspective. In practice, decision-making may also be shaped by political discourse, social factors such as peer effects and personal preferences [60], as well as imperfect access to information. As a result, decision-makers may not evaluate the full range of technology options considered in the model.
Finally, the model does not distinguish between different decision-making actors (e.g., owner-occupiers, landlords, tenants, housing associations), whose differing incentives and objectives may lead to varying investment and consumption behavior. Moreover, stock turnover is determined solely by the end of a technology’s technical lifetime. This assumption may result in a slower transition than observed in reality and overlooks replacement decisions triggered by short-term “shocks”, such as sudden energy price changes or policy incentives, which may encourage owners to replace functioning systems before the end of their technical lifetime.

5. Conclusions and Outlook

In this study, we analyzed the techno-economic competitiveness of decentralized heat pumps (HPs) compared to other low-carbon heating options across segments of the German building stock, and projected their uptake, costs, and CO2 emission savings through the transition to 2045. Using the agent-based model RENDER-Building, we novelly combined local environmental heat-source potentials for decentralized HPs with plausible expansion potentials of district heating (DH) networks and potential evolution of gas distribution networks in a bottom-up framework and evaluated the competitiveness and adoption under three explorative techno-economic scenarios. The three scenarios—Decentralization Focus, Centralization Focus, and Gas Focus—represent distinct combinations of electricity network charge development, district heating expansion, and gas distribution infrastructure trajectories, each designed to project the competitiveness and adoption of heating technologies under different structural conditions.
The results show that decentralized HPs are cost-competitive over their lifetime across a wide range of building stock segments and emerge as the dominant heating technology in almost all building stock segments and all scenarios. Between 11 and 15 million living and working units are projected to be heated by HPs by 2045 (≈41–54 GW installed capacity), corresponding to a consistent coverage of at least 25% of building heating demand across all scenarios. Settlement type and local heat-source availability are the primary determinants of the importance of HPs in stock. HPs are projected to roll out broadly in suburban and rural areas, while in dense urban areas they compete more closely with DH, and gas and biomass boilers.
Notably, the Decentralization Focus and Gas Focus scenarios differ in both aggregate expenditures and cumulative emissions. A greater share of decentralized HPs in the building stock leads to total emission savings of 27 Mt direct and 60 Mt indirect CO2 over the next 20 years. A Gas-Focused pathway in building heating would cause Germany to miss the climate targets by a larger margin, potentially resulting in political and economic consequences and increasing pressure on the total CO2 emissions budget, thereby reducing the flexibility available for emissions in other sectors.
Finally, when compared with the combined contribution of fuels of a biogenic origin, including solid biomass, biogas, and bio-oil, the bundle of electricity and environmental heat together does not emerge as the dominant energy carrier option in the modeled scenarios. However, the future availability of these fuels remains highly uncertain and should therefore be critically evaluated. Should high amounts of biogenic fuels be unavailable to the building sector, HPs would become the dominant heating technology with up to a 70% share in the stock. Overall, the analysis provides segment- and settlement-specific insights by simultaneously accounting for infrastructure availability constraints, building-level economic performance, and stock dynamics. To date, most existing studies have been limited in their ability to represent these interacting dimensions and the resulting competition between alternative heating technologies at a comparable detail, underscoring both the rationale for and the contribution of the present study. A central practical implication is that stable, long-term policy frameworks coupled with well-coordinated and timely renovation and modernization efforts are critical for translating the favorable lifetime cost-competitiveness of HPs into actual market adoption.
Building on these findings, some aspects call for further investigation and future work. First, the limited regional and sectoral availability of solid, liquid and gaseous biofuels should be considered and the prices of these energy carriers should be validated against the identified demands to re-evaluate the projections. Second, regional differentiation of electricity and DH prices would refine the assessment of technology competitiveness at the local level beyond the average price assumptions used in the present study. Third, the environmental heat-source potentials could be extended to include additional sources such as solar-thermal or PV-thermal collectors, as well as excess heat. In addition, the role of (small) DH networks with low temperatures operated with decentralized HPs deserves dedicated analysis, as they may bridge centralized and decentralized supply in dense areas. Fourth, the interaction of HPs with on-site PVs and battery storage could be examined as a factor influencing their cost-competitiveness. Finally, emerging technology options such as unit or dwelling-level HPs (i.e., one HP per apartment in multi-family buildings), and hybrid HPs (i.e., combining HPs with other technologies such as boilers) could open additional segments, particularly within the multi-family and apartment building stock where HP adoption is projected to lag. The further research streams outlined above could build on the findings of the present.

Author Contributions

Conceptualization, Ş.A., S.O., A.B. and H.-M.H.; methodology, Ş.A. and S.Y.; software, Ş.A. and S.Y.; formal analysis, Ş.A.; investigation, Ş.A.; data curation, Ş.A. and S.O.; writing—original draft preparation, Ş.A.; writing—review and editing, Ş.A., S.Y., S.O., A.B. and H.-M.H.; visualization, Ş.A.; supervision, Ş.A. All authors have read and agreed to the published version of the manuscript.

Funding

This research received no external funding.

Data Availability Statement

The environmental heat-source potentials presented and used in this study are available in Zenodo at https://doi.org/10.5281/zenodo.18614551. These data were derived based on the following resources available in the public domain: footprints of all buildings in Germany found at https://zenodo.org/records/11845992 (accessed on 8 October 2025), residential building TABULA Archetype Dataset Germany found at https://zenodo.org/records/13771740 (accessed on 8 October 2025), and cadaster records of federal states found at https://www.geoportal.de/apps/land (accessed on 14 January 2026).

Acknowledgments

The authors express their gratitude to Pia Manz for her contribution to the consideration of the district heating potentials used in this work and to the Erne Hussong for his work on the collection and preparation of the cadaster data from each federal state of Germany. During the preparation of this manuscript, the authors used Claude Opus 4.8 R for the purpose of improving wording, readability and language. The authors have reviewed and edited the output and take full responsibility for the content of this publication.

Conflicts of Interest

Author Şirin Alibaş was employed by the Fraunhofer Institute for Systems and Innovation Research. The remaining authors declare that the research was conducted in the absence of any commercial or financial relationships that could be construed as a potential conflict of interest.

Abbreviations

The following abbreviations are used in this manuscript:
ABapartment building
ASHPair-source heat pump
CAPEXcapital investment expenditure
CHPcombined heat and power
DHdistrict heating
EPCenergy performance class
GSHPground-source heat pump
HPheat pump
LCOHlevelized cost of heat
MFHmulti-family house
NRESnon-residential
OPEXoperating expenditure
PVphotovoltaics
RESresidential
RQresearch question
SFHsingle-family house
SHspace heating
SHWsanitary hot water
SNGsynthetic methane
SPFseasonal performance factor

Appendix A. Assumptions

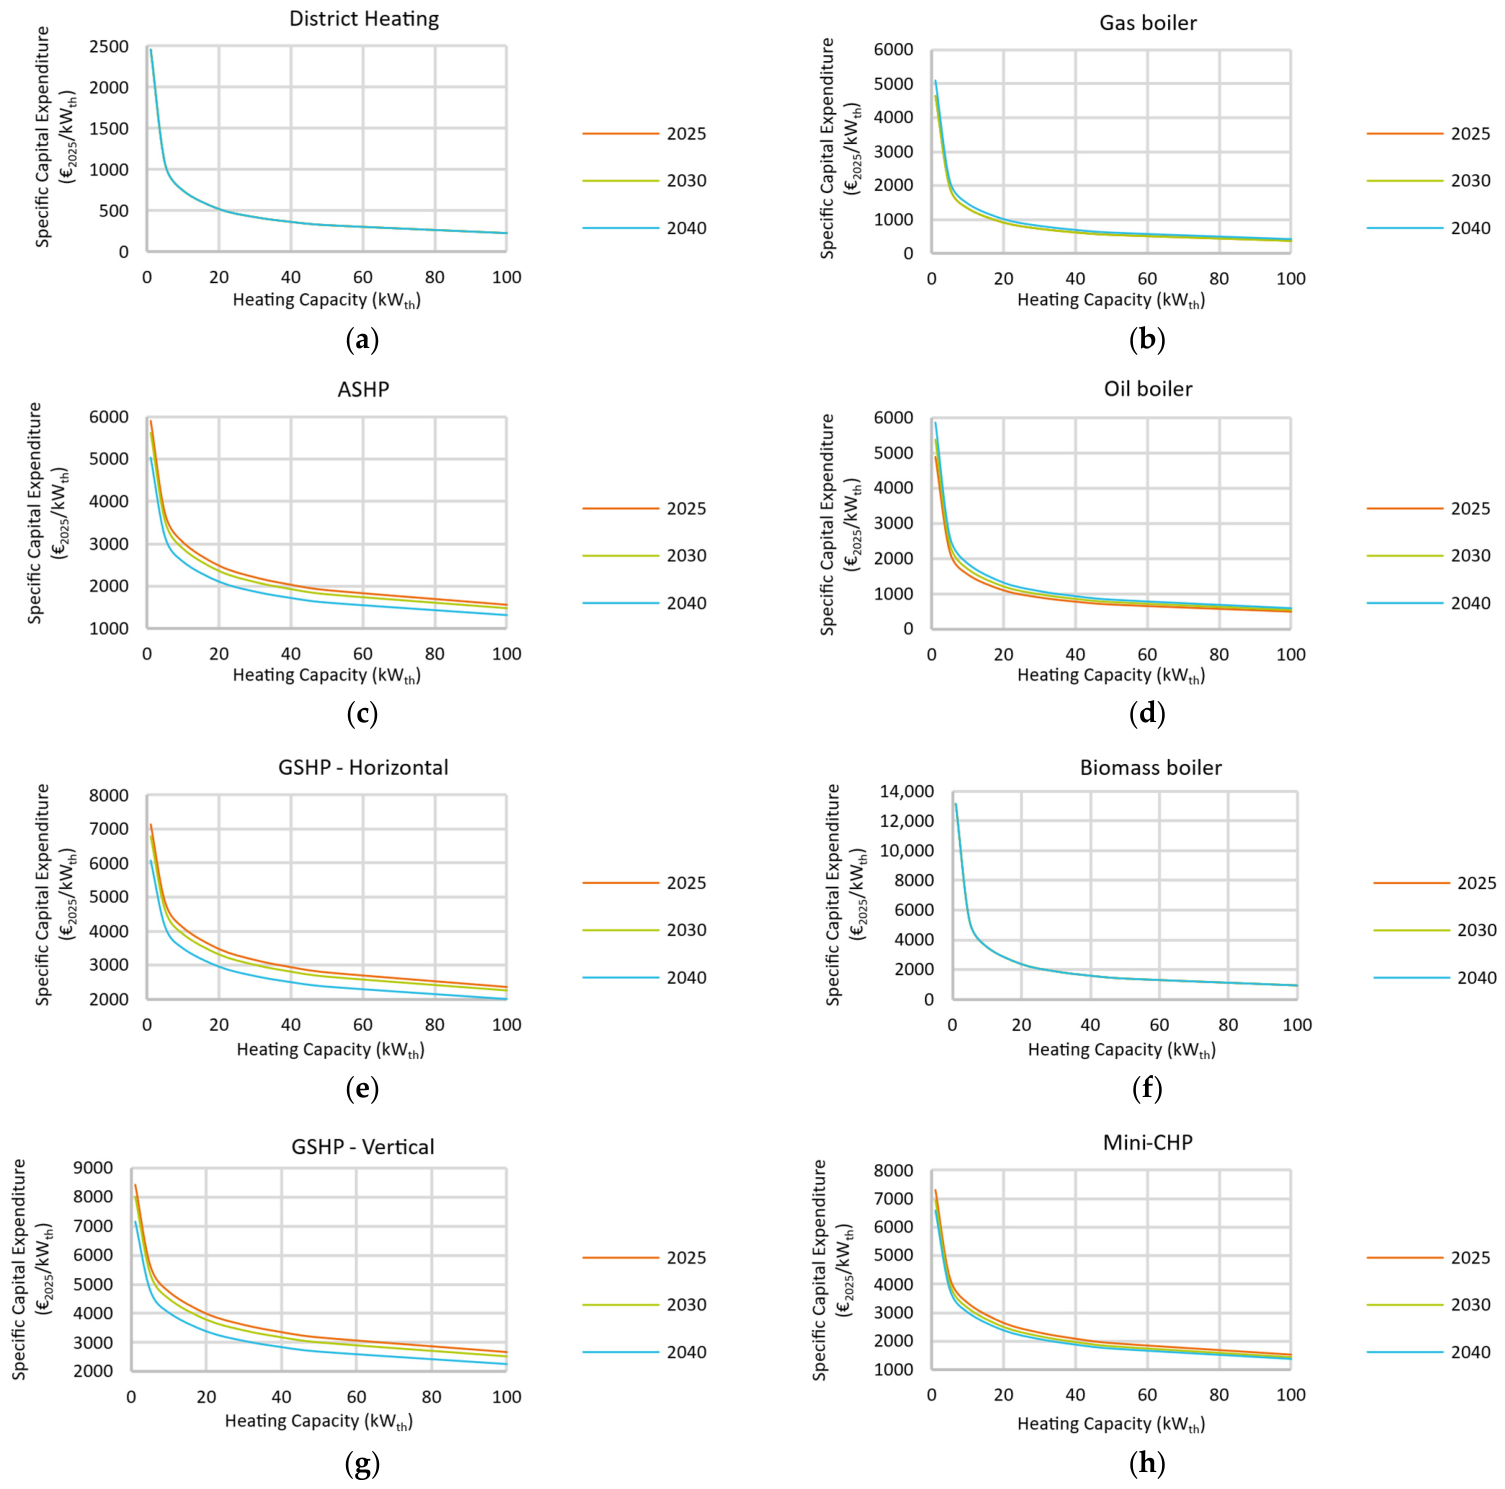
This section of the appendix contains assumptions on the model parameters and variables. Table A1 contains the parameters of cost curves that give the investment expenditure (IE) according to the following equation, where capacity (CAP) is given in kWth:
I E = a × C A P b
Table A1. Parameters of cost curves for total capital expenditure of heating systems according to year, based on [51].
Heating Technology202520302040
District heating house station
Parameter a245624562456
Parameter b0.47870.47870.4787
ASHP
Parameter a590956145023
Parameter b0.710.710.71
GSHP—Horizontal
Parameter a714867916076
Parameter b0.760.760.76
GSHP–Vertical
Parameter a842980087165
Parameter b0.750.750.75
Gas boiler
Parameter a463446345097
Parameter b0.460.460.46
Oil boiler
Parameter a488653755863
Parameter b0.50.50.5
Biomass boiler
Parameter a13,12413,12413,124
Parameter b0.430.430.43
Mini-CHP
Parameter a730469396574
Parameter b0.660.660.66
Figure A1. Specific capital expenditure of heating systems according to year, shown for (a) district heating house station, (b) gas boiler, (c) air-source HP, (d) oil boiler, (e) ground-source HP with horizontal ground collectors, (f) biomass boiler, (g) ground-source HP with vertical ground probes, and (h) mini-CHP systems (based on [51]).
Energies 19 04377 g0a1
Table A2. End-consumer prices assumed for energy carriers (including VAT) and the price components (€/kWh).
Energy CarrierPrice Component2030203520402045
RESNRESRESNRESRESNRESRESNRES
Electricity (special HP rate)
Variant I & IIProcurement and Sales [42]0.0780.0640.0830.0630.0800.0560.0880.056
Variant INetwork charges [49]0.0770.0350.0670.0310.0600.0270.0590.024
Variant ISurcharges and levies [42,49]0.0360.0200.0410.0270.0460.0270.0460.026
Variant IEnd-consumer price0.2280.1420.2270.1440.2220.1310.2410.126
Variant IINetwork charges [49]0.0850.0450.0860.0480.0850.0420.0890.038
Variant IISurcharges and levies [42,49]0.0340.0130.0330.0130.0310.0130.0310.012
Variant IIEnd-consumer price0.2350.1450.2410.1490.2340.1310.2480.126
Natural gas
Variant I & IIProcurement and Sales [42]0.0370.0300.0330.0270.0310.0250.0310.025
Biogas
Variant I & IIProcurement and Sales [42]0.1060.1150.1260.136
Hydrogen (green)
Variant I & IIProcurement and Sales [42]-0.1370.1290.118
Synthetic Natural Gas (SNG)
Variant I & IIProcurement and Sales-0.2600.2450.224
Gas Mix
Variant I & IIProcurement and Sales0.0470.0410.0590.0550.1000.0990.1430.143
Variant I & IISurcharges and levies [42]0.0060.0050.0050.0050.0050.0040.0050.004
Variant I & IICarbon tax0.02160.02520.01380
Variant INetwork charges [40]0.0300.0120.0290.0120.0270.0110.0250.010
Variant IEnd-consumer price0.1200.0910.1360.1110.1710.1490.2060.187
Variant IINetwork charges [40]0.0350.0140.0410.0170.0520.0210.1830.074
Variant IIEnd-consumer price0.1260.0930.1500.1170.2010.1610.3940.263
DH
Variant I & IIEnd-consumer price [42]0.1340.1370.1310.127
Heating oil
Variant I & IIProcurement and Sales [42]0.0530.0520.0520.050
Biodiesel (heating oil of biogenic origin)
Variant I & IIProcurement and Sales0.1760.1990.2190.233
Heating oil Mix
Variant I & IIProcurement and Sales [42]0.0710.0960.1520.196
Variant I & IISurcharges and levies [42]0.0090.0040.0040.004
Variant I & IICarbon tax0.0280.0330.0240.014
Variant I & IIEnd-consumer price0.1240.1530.2090.251
Biomass (average)
Variant I & IIEnd-consumer price [42]0.05100.05680.06280.0718
Carbon price in €/tCO2 [42]
Variant I & IIEU-ETS 2106152191224
Sub-headers in bold and italic font distinguish energy carriers, while the end-consumer price of each energy carrier is shown in plain bold font.
Figure A2. Evolution of the heat pump (HP) technology efficiency (SPF) assumed towards 2045, for air-source HPs (ASHPs) and ground-source HPs (GSHPs).
Energies 19 04377 g0a2
Table A3. SPF of different commercial HP models at different operating conditions per type [48].
Parameter/HPOperating Condition/SPF
Tlimit1212151515
Tsupply/Treturn35/2545/3550/4055/4560/50
Share of SHW (%)4025181510
ASHP Model
Aereco3.313.413.523.423.34
Bosch3.723.733.843.713.59
Buderus3.433.483.593.473.37
Daikin3.413.413.513.393.27
Carrier2.572.632.772.72.65
EQtherm3.683.733.793.653.53
Fujitsu3.133.143.233.123.02
Dimplex3.233.283.373.273.17
Mitsubishi3.093.093.143.022.9
Ochsner3.283.283.323.263.14
Panasonic3.493.63.633.583.43
StiebelEltron3.6683.723.833.73.59
Average3.333.383.463.363.25
Relative change to median1%2%5%2%−2%
GSHP Model (Horizontal)
Aereco3.944.074.053.913.75
Bosch4.34.454.434.274.09
Buderus4.34.454.434.274.09
Daikin4.184.324.34.153.97
Elco4.174.294.274.123.96
EQtherm3.944.084.063.913.75
Ecoforest4.184.324.34.153.98
Dimplex4.194.314.294.143.98
Mitsubishi4.694.674.574.364.13
Ochsner4.074.24.194.033.87
alpha-innotec4.144.264.244.093.93
StiebelEltron4.144.264.244.093.94
Average4.194.314.284.123.95
Relative change to median2%5%4%1%−4%
GSHP Model (Vertical)
Aereco4.174.314.34.164.01
Bosch4.564.714.74.544.38
Buderus4.564.714.74.544.38
Daikin4.334.484.474.144.14
Elco4.214.334.364.184.04
EQtherm4.184.324.314.164.09
Ecoforest4.144.284.274.123.81
Dimplex4.454.574.64.414.26
Mitsubishi4.84.844.774.584.26
Ochsner4.314.464.524.294.19
alpha-innotec 4.344.374.194.05
StiebelEltron4.394.524.614.424.39
Average4.374.494.504.314.17
Relative change to median7%9%10%5%2%
Sub-headers in bold and italic font distinguish heating technology type, while the average SPF and the relative change to the corresponding median SPF is shown in plain bold font.

Appendix B

This section of the appendix contains additional result figures.
Figure A3. LCOH of different heating technologies in the Centralization Focus scenario, building agents clustered by their energy efficiency classes and building types in the scatter plot (top), and by their building types in the box plot (bottom).
Energies 19 04377 g0a3
Figure A4. Electricity demand from HPs by 2045 according to scenario (including electricity demand from the auxiliary resistance heater).
Energies 19 04377 g0a4
Figure A5. Installed capacity of decentralized HPs by 2045 according to scenario (with breakdown according to source type).
Energies 19 04377 g0a5
Figure A6. Installed capacity of decentralized HPs by 2045 in the Decentralization Focus scenario according to building-type cluster.
Energies 19 04377 g0a6
Figure A7. Installed capacity of decentralized HPs by 2045 in the Decentralization Focus scenario according to settlement-type cluster.
Energies 19 04377 g0a7
Figure A8. Installed capacity of decentralized HPs by 2045 in the Decentralization Focus scenario according to building efficiency-class cluster.
Energies 19 04377 g0a8
Figure A9. Installed capacity of decentralized HPs by 2045 in the Decentralization Focus scenario according to federal state cluster.
Energies 19 04377 g0a9

Appendix C

This section of the appendix contains the figures for sensitivity analyses.
Figure A10, Figure A11 and Figure A12 present the sensitivity of the heating energy demand for different energy carriers as well as the composition of the heating technology stock and installed HP capacity to the discrete choice parameter, β . With greater responsiveness to cost, i.e., a higher β value, there is noticeably less biodiesel and oil demand, and correspondingly more electricity, ambient heat and solar thermal demand. As the β increases, the decrease in biomethane demand is also considerable in the Gas Focus scenario conditions.
The influence of β reflects on the evolution of the heating system stock as well. With increasing β, there would be a reduced adoption of oil boilers and mini-CHPS, and a higher adoption of biomass boilers and HPs. Additionally, in the Gas Focus scenario, there would be slightly lower adoption of gas boilers. This shows that the more decision-makers focus on cost optimization when modernizing heating systems, the more likely they are to opt for HPs. The installed HP capacity could reach more than 60 GW in the Decentralization scenario and almost 47 GW in the Gas Focus scenario, if β = 3 represents the decision-maker’s behavior when modernizing the heating system. Note that this corresponds to around a 10% change in the installed capacity and stock share.
Figure A10. β sensitivity of heating energy demand by energy carrier for scenarios Decentralization Focus (a) and Gas Focus (b).
Energies 19 04377 g0a10
Figure A11. β sensitivity of the composition of heating technology stock for scenarios Decentralization Focus (a) and Gas Focus (b).
Energies 19 04377 g0a11
Figure A12. β sensitivity of the installed HP capacity for scenarios Decentralization Focus (a) and Gas Focus (b).
Energies 19 04377 g0a12
The scenarios are tested under two different EtGPR pathways to evaluate the sensitivity of the results to this parameter. The baseline scenarios start with EtGPR = 2.2 in 2025, when considering the electricity rate for heat pumps. Scenarios are analyzed for a constant EtGPR of 1.2 and 3.2, starting from 2027 up to 2045. Figure A13, Figure A14 and Figure A15 show the results of this sensitivity analysis.
A lower EtGPR is more favorable for HPs in comparison to gas-based systems. This effect can be observed in the results: there is correspondingly more ambient heat and electricity demand as the EtGPR decreases. In contrast, there is decreasing biodiesel and solid biomass demand in the Decentralization Focus scenario and decreasing biomethane demand in the Gas Focus scenario as the EtGPR decreases, which suggests that favorable electricity rates make HPs appealing compared to gas-based systems in the status quo and make them appealing compared to solid-biomass- and oil-based systems in the absence of gas networks. Installed HP capacity would be correspondingly higher under more favorable economic conditions for HPs.
The scenarios are also tested for different biofuel potentials available to the building sector to evaluate the sensitivity of the results to such an influential factor. In the base scenarios, the demand for energy carriers of a biogenic origin (known as biofuels) reached 210–230 TWh in total (Section 4.2). In Figure A16, Figure A17 and Figure A18, this case with a total biofuel potential of approximately 250 TWh is labelled “Biofuel Limit = 250”. We further consider two lower potential cases of 150 TWh (“Biofuel Limit = 150”) and 125 TWh (“Biofuel Limit = 125”).
As the available biofuel potential decreases, there is a significant increase in the demand for electricity and ambient heat, both in the Decentralization Focus and Gas Focus scenarios. In addition, there is a considerable increase in DH demand (Figure A16). HPs could constitute up to 70% of the heating technology stock by 2045 (Figure A17). From 80 up to more than 100 GW of HPs could be installed in the scenarios, depending on the available biofuel potential.
Figure A13. EtGPR sensitivity of heating energy demand by energy carrier for scenarios Decentralization Focus (a) and Gas Focus (b).
Energies 19 04377 g0a13aEnergies 19 04377 g0a13b
Figure A14. EtGPR sensitivity of the composition of heating technology stock for scenarios Decentralization Focus (a) and Gas Focus (b).
Energies 19 04377 g0a14
Figure A15. EtGPR sensitivity of the installed HP capacity for scenarios Decentralization Focus (a) and Gas Focus (b).
Energies 19 04377 g0a15
Figure A16. Sensitivity of heating energy demand to available biofuel potential by energy carrier for scenarios Decentralization Focus (a) and Gas Focus (b).
Energies 19 04377 g0a16aEnergies 19 04377 g0a16b
Figure A17. Sensitivity of the composition of heating technology stock to available biofuel potential for scenarios Decentralization Focus (a) and Gas Focus (b).
Energies 19 04377 g0a17
Figure A18. Sensitivity of the installed HP capacity to available biofuel potential for scenarios Decentralization Focus (a) and Gas Focus (b).
Energies 19 04377 g0a18

References

  1. German Federal Diet. Bundes-Klimaschutzgesetz (Federal Climate Action Act): KSG. 2019. Available online: https://www.gesetze-im-internet.de/ksg/BJNR251310019.html (accessed on 29 May 2026).
  2. AGEB—AG Energiebilanzen e.V. Anwendungsbilanzen zur Energiebilanz Deutschland: Endenergieverbrauch nach Energieträgern und Anwendungszwecken. Detaillierte Anwendungsbilanzen der Endenergiesektoren für 2023 und 2024 Sowie Zusammenfassende Zeitreihen zum Endenergieverbrauch nach Energieträgern und Anwendungszwecken für Jahre von 2014 bis 2024. 2026. Available online: https://ag-energiebilanzen.de/wp-content/uploads/EBD24e_AnwBil.pdf (accessed on 24 July 2026).
  3. Ruhnau, O.; Bannik, S.; Otten, S.; Praktiknjo, A.; Robinius, M. Direct or indirect electrification? A review of heat generation and road transport decarbonisation scenarios for Germany 2050. Energy 2019, 166, 989–999. [Google Scholar] [CrossRef] [Scilit]
  4. BDH—Bundesverband der Deutschen Heizungsindustrie. Absatz Wärmeerzeuger in Deutschland 2010–2025. Available online: https://www.bdh-industrie.de/presse/pressemeldungen/artikel/jahresbilanz-heizungsabsatz-faellt-auf-niedrigsten-stand-seit-15-jahren (accessed on 22 July 2026).
  5. Moritz, M.; Czock, B.H.; Ruhnau, O. A heated debate—The future cost efficiency of climate-neutral heating options under consideration of heterogeneity and uncertainty. Energy Policy 2025, 206, 114790. [Google Scholar] [CrossRef] [Scilit]
  6. Popovski, E.; Ragwitz, M.; Brugger, H. Decarbonization of district heating and deep retrofits of buildings as competing or synergetic strategies for the implementation of the efficiency first principle. Smart Energy 2023, 10, 100096. [Google Scholar] [CrossRef] [Scilit]
  7. Mandel, T.; Worrell, E.; Alibaş, Ş. Balancing heat saving and supply in local energy planning: Insights from 1970-1989 buildings in three European countries. Smart Energy 2023, 12, 100121. [Google Scholar] [CrossRef] [Scilit]
  8. Alibaş, Ş.; Yu, S.; Bagheri, M.; Fleiter, T. Advancing building stock transformation models: An agent-based approach and its application to Germany. Adv. Appl. Energy 2025, 20, 100256. [Google Scholar] [CrossRef] [Scilit]
  9. Roth, A.; Gaete-Morales, C.; Kirchem, D.; Schill, W.-P. Power sector benefits of flexible heat pumps in 2030 scenarios. Commun. Earth Environ. 2024, 5, 718. [Google Scholar] [CrossRef] [Scilit]
  10. Olympios, A.V.; Hoseinpoori, P.; Markides, C.N. Toward optimal designs of domestic air-to-water heat pumps for a net-zero carbon energy system in the UK. Cell Rep. Sustain. 2024, 1, 100021. [Google Scholar] [CrossRef] [Scilit]
  11. Mersch, M.; Sapin, P.; Corbett, H.C.; Utting, M.; Mac Dowell, N.; Markides, C.N. Household and whole-system assessments of distributed heat pump deployment for domestic heat decarbonisation in the UK. Energy 2025, 330, 136903. [Google Scholar] [CrossRef] [Scilit]
  12. Kleinebrahm, M.; Weinand, J.M.; Naber, E.; McKenna, R.; Ardone, A. Analysing municipal energy system transformations in line with national greenhouse gas reduction strategies. Appl. Energy 2023, 332, 120515. [Google Scholar] [CrossRef] [Scilit]
  13. Billerbeck, A.; Kiefer, C.P.; Winkler, J.; Bernath, C.; Sensfuß, F.; Kranzl, L.; Müller, A.; Ragwitz, M. The race between hydrogen and heat pumps for space and water heating: A model-based scenario analysis. Energy Convers. Manag. 2024, 299, 117850. [Google Scholar] [CrossRef] [Scilit]
  14. European Commission: Directorate-General for Energy; Dröscher, T.; Ladermann, A.; Maurer, C.; Tersteegen, B.; Willemsen, S.; Billerbeck, A.; Kiefer, C.; Winkler, J.; Bernath, C.; et al. Potentials and Levels for the Electrification of Space Heating in Buildings: Final Report; European Commission: Brussels, Belgium, 2023; Available online: https://data.europa.eu/doi/10.2833/282341 (accessed on 5 June 2026).
  15. von Wald, G.; Sundar, K.; Sherwin, E.; Zlotnik, A.; Brandt, A. Optimal gas-electric energy system decarbonization planning. Adv. Appl. Energy 2022, 6, 100086. [Google Scholar] [CrossRef] [Scilit]
  16. Wilson, E.J.H.; Munankarmi, P.; Less, B.D.; Reyna, J.L.; Rothgeb, S. Heat pumps for all? Distributions of the costs and benefits of residential air-source heat pumps in the United States. Joule 2024, 8, 1000–1035. [Google Scholar] [CrossRef] [Scilit]
  17. Hummel, M.; Müller, A.; Forthuber, S.; Kranzl, L.; Mayr, B.; Haas, R. How cost-efficient is energy efficiency in buildings? A comparison of building shell efficiency and heating system change in the European building stock. Energy Effic. 2023, 16, 32. [Google Scholar] [CrossRef] [Scilit]
  18. Bernard, L.; Hackett, A.; Metcalfe, R.; Schein, A. Decarbonizing Heat: The Impact of Heat Pumps and a Time-of-Use Heat Pump Tariff on Energy Demand. NBER Working Paper No. w33036. 2024. Available online: https://ssrn.com/abstract=4978834 (accessed on 13 May 2026).
  19. Rieck, K.; Dabrock, K.; Pflugradt, N.; Weinand, J.M.; Stolten, D. Large-scale quantification of the future self-covered heat demand using a nationwide residential building database. Energy 2025, 317, 134622. [Google Scholar] [CrossRef] [Scilit]
  20. Fraga, C.; Hollmuller, P.; Schneider, S.; Lachal, B. Heat pump systems for multifamily buildings: Potential and constraints of several heat sources for diverse building demands. Appl. Energy 2018, 225, 1033–1053. [Google Scholar] [CrossRef] [Scilit]
  21. Rosenow, J.; Barnes, J.; Galvin, R.; O’Mara, S.; Lowes, R. Total cost of ownership of heat pumps and policy choice: The case of Great Britain. iScience 2025, 28, 111784. [Google Scholar] [CrossRef] [Scilit] [PubMed]
  22. Manz, P.; Alibaş, Ş.; Fleiter, T.; Billerbeck, A. Finding an optimal district heating market share in 2050 for EU-27: Comparison of modelling approaches. In Proceedings of the ECEEE Summer Study Proceedings, Agents of Change. ECEEE 2022 Summer Study, Hyeres, France, 6–11 June 2022; pp. 177–186. [Google Scholar]
  23. Schiavina, M.; Melchiorri, M.; Pesaresi, M. GHS-SMOD R2023A—GHS Settlement Layers, Application of the Degree of Urbanisation Methodology (Stage I) to GHS-POP R2023A and GHS-BUILT-S R2023A, Multitemporal (1975–2030); European Commission, Joint Research Centre (JRC), 2023. [Google Scholar] [CrossRef]
  24. IEA—International Energy Agency. The Future of Heat Pumps; IEA: Paris, France, 2022. [Google Scholar]
  25. Alibaş, Ş.; Yu, S.; Manz, P. Environmental Heat Source Potentials for Decentralized Heat Pumps: A GIS-Based Analysis. Energies 2026, 19, 1219. [Google Scholar] [CrossRef] [Scilit]
  26. Alibaş, Ş.; Yu, S.; Manz, P. Potential of Decentralized Heat Pumps for Buildings in Germany. Available online: https://zenodo.org/records/21729853 (accessed on 1 August 2026).
  27. Fallahnejad, M.; Kranzl, L.; Haas, R.; Hummel, M.; Müller, A.; García, L.S.; Persson, U. District heating potential in the EU-27: Evaluating the impacts of heat demand reduction and market share growth. Appl. Energy 2024, 353, 122154. [Google Scholar] [CrossRef] [Scilit]
  28. Persson, U. District Heating in Future Europe: Modelling Expansion Potentials and Mapping Heat Synergy Regions. Ph.D. Thesis, Chalmers University of Technology, Gothenburg, Sweden, 2015. [Google Scholar]
  29. García, L.S. Modelling District Heating Network Costs. Bachelor’s Thesis, Lund University, Lund, Sweden, 2023. Available online: https://hh.diva-portal.org/smash/record.jsf?pid=diva2%3A1772661&dswid=-9382 (accessed on 5 June 2026).
  30. Manz, P.; Fleiter, T.; Billerbeck, A.; Fritz, M.; Alibaş, Ş.; Eichhammer, W. Identifying future district heating potentials in Germany: A study using empirical insights and distribution cost analysis. Int. J. Sustain. Energy Plan. Manag. 2024, 40, 131–145. [Google Scholar] [CrossRef] [Scilit]
  31. Statistische Ämter des Bundes und der Länder. Zensus 2022: Gebäude mit Wohnraum nach Energieträeger der Heizung; Statistische Ämter des Bundes und der Länder: Wiesbaden, Germany, 2024. [Google Scholar]
  32. Then, D.; Bauer, J.; Kneiske, T.M.; Braun, M. Interdependencies of Infrastructure Investment Decisions in Multi-Energy Systems—A Sensitivity Analysis for Urban Residential Areas. Smart Cities 2021, 4, 112–145. [Google Scholar] [CrossRef] [Scilit]
  33. Oberle, S.; Neuwirth, M.; Gnann, T.; Wietschel, M. Can Industry Keep Gas Distribution Networks Alive? Future Development of the Gas Network in a Decarbonized World: A German Case Study. Energies 2022, 15, 9596. [Google Scholar] [CrossRef] [Scilit]
  34. Gurieff, N.; Moghtaderi, B.; Daiyan, R.; Amal, R. Gas Transition: Renewable Hydrogen’s Future in Eastern Australia’s Energy Networks. Energies 2021, 14, 3968. [Google Scholar] [CrossRef] [Scilit]
  35. Nadel, S. Impact of Electrification and Decarbonization on Gas Distribution Costs; ACEEE: Washington, DC, USA, 2023. [Google Scholar]
  36. Giehl, J.; Hollnagel, J.; Müller-Kirchenbauer, J. Assessment of using hydrogen in gas distribution grids. Int. J. Hydrogen Energy 2023, 48, 16037–16047. [Google Scholar] [CrossRef] [Scilit]
  37. Hollick, F.; Crawley, J.; Broad, O.; Elwell, C. The persistence of gas use in homes with electric heat pumps. Build. Serv. Eng. Res. Technol. 2026, 47, 431–442. [Google Scholar] [CrossRef] [Scilit]
  38. Agora Energiewende. Ein neuer Ordnungsrahmen für Erdgasverteilnetze: Analysen und Handlungsoptionen für eine bezahlbare und Klimazielkompatible Transformation. 2023. Available online: https://www.agora-energiewende.de/publikationen/ein-neuer-ordnungsrahmen-fuer-erdgasverteilnetze (accessed on 22 June 2026).
  39. Meyer, R.; Palovic, M. Kosteneinsparungen einer Frühen Gasnetzstilllegungsplanung. 2025. Available online: https://umweltinstitut.org/energie-und-klima/gasausstieg/gasnetz-studie/ (accessed on 22 June 2026).
  40. Oberle, S.; Gnann, T.; Wayas, L.; Wietschel, M. Analyzing the regulatory framework gaps for gas distribution networks with decreasing natural gas demand in Germany. Heliyon 2024, 10, e40800. [Google Scholar] [CrossRef] [Scilit] [PubMed]
  41. Bundesnetzagentur. Bestimmungen zu Rückstellungen für Stilllegungen und unvermeidbaren Rückbau von Erdgasnetzen: BRÜCKEN. 2025. Available online: https://www.bundesnetzagentur.de (accessed on 13 June 2026).
  42. Kemmler, A.; Kreidelmeyer, S.; Limbers, J.; Lübbers, S.; Muralter, F. Rahmendaten und Endverbrauchspreise für die Treibhausgas-Projektionen 2026; Prognos AG: Basel, Switzerland, 2026. [Google Scholar] [CrossRef]
  43. McFadden, D. Conditional logit analysis of qualitative choice behavior. In Frontiers in Econometrics; Zarembka, P., Ed.; Academic Press: New York, NY, USA, 1974; pp. 105–142. ISBN 0127761500. ISSN 0127761500. [Google Scholar]
  44. Train, K. Discrete Choice Methods with Simulation, 2nd ed.; Cambridge University Press: Cambridge, UK; New York, NY, USA, 2009; ISBN 9780521766555. [Google Scholar]
  45. van Kenhove, E.; Dinne, K.; Janssens, A.; Laverge, J. Overview and comparison of Legionella regulations worldwide. Am. J. Infect. Control 2019, 47, 968–978. [Google Scholar] [CrossRef] [Scilit] [PubMed]
  46. Graf, C.; Cadenbach, A. Domestic hot water in existing residential buildings: Comparative simulation study of efficiency and hygiene challenges. Energy 2025, 337, 138528. [Google Scholar] [CrossRef] [Scilit]
  47. Lämmle, M.; Metz, J.; Kropp, M.; Wapler, J.; Oltersdorf, T.; Günther, D.; Herkel, S.; Bongs, C. Heat Pump Systems in Existing Multifamily Buildings: A Meta-Analysis of Field Measurement Data Focusing on the Relationship of Temperature and Performance of Heat Pump Systems. Energy Technol. 2023, 11, 2300379. [Google Scholar] [CrossRef] [Scilit]
  48. Bundesverband Wärmepumpe e.V. JAZ-Rechner; Bundesverband Wärmepumpe e.V.: Berlin, Germany, 2026. [Google Scholar]
  49. Agora Energiewende. Stromnetzentgelte—Gut und Günstig: Ausbaukosten Reduzieren und Entgeltsystem Zukunftssicher Aufstellen. 2025. Available online: https://www.agora-energiewende.de/publikationen/stromnetzentgelte-gut-und-guenstig (accessed on 20 May 2026).
  50. ICS 75.160.20 (DIN 51603-1:2024-11); Fuel Oils—Part 1: Fuel Oils EL, Minimum Requirements. DIN Deutsches Institut für Normung e.V.: Berlin, Germany, 2024.
  51. Deutsche Energie-Agentur GmbH. KWW-Technikkatalog Wärmeplanung. Excel File. 2025. Available online: https://api.kww-halle.de/fileadmin/PDFs/KWW-Technikkatalog-Waermeplanung_12-2025.xlsx (accessed on 3 May 2026).
  52. Oberfeier, P.; Thomsen, J.; de Vries, C.; Kumar, R.; Weidlich, A. Reversible heat pumps in municipal energy transitions: Cost-optimal heating and cooling pathways in temperate climates under rising temperatures. Energy 2026, 356, 141304. [Google Scholar] [CrossRef] [Scilit]
  53. Szarka, N.; Lenz, V.; Thrän, D. The crucial role of biomass-based heat in a climate-friendly Germany—A scenario analysis. Energy 2019, 186, 115859. [Google Scholar] [CrossRef] [Scilit]
  54. Meisel, K.; Jordan, M.; Dotzauer, M.; Schröder, J.; Lenz, V.; Naumann, K.; Cyffka, K.-F.; Dögnitz, N.; Schindler, H.; Daniel-Gromke, J.; et al. Quo Vadis, Biomass? Long-Term Scenarios of an Optimal Energetic Use of Biomass for the German Energy Transition. Int. J. Energy Res. 2024, 2024, 6687376. [Google Scholar] [CrossRef] [Scilit]
  55. Henning, H.-M.; Palzer, A. What Will the Energy Transformation Cost?: Pathways for Transforming the German Energy System by 2050; Fraunhofer Institute for Solar Energy Systems ISE: Freiburg, Germany, 2015. [Google Scholar]
  56. Marconi, P.; Rosa, L. Role of biomethane to offset natural gas. Renew. Sustain. Energy Rev. 2023, 187, 113697. [Google Scholar] [CrossRef] [Scilit]
  57. Choudhury, S.; McDonell, V.G.; Samuelsen, S. Combustion performance of low-NOx and conventional storage water heaters operated on hydrogen enriched natural gas. Int. J. Hydrogen Energy 2020, 45, 2405–2417. [Google Scholar] [CrossRef] [Scilit]
  58. Bänfer, M.; Billerbeck, A.; Plötz, P. Do publicly owned companies have lower district heating prices? An empirical analysis for Germany. Util. Policy 2025, 95, 101959. [Google Scholar] [CrossRef] [Scilit]
  59. BUILD UP. From Policy to Practice: How Renovation Passports Empower Europe’s Renovation Wave. Available online: https://build-up.ec.europa.eu/en/resources-and-tools/articles/how-renovation-passports-empower-europes-renovation-wave (accessed on 22 July 2026).
  60. Breitschopf, B. Understanding the role of non-monetary aspects in promoting citizen investment for the energy transition—An exploratory approach. Energy Res. Soc. Sci. 2026, 135, 104678. [Google Scholar] [CrossRef] [Scilit]
Figure 1. Overall modeling approach and outputs related to the research questions.
Energies 19 04377 g001
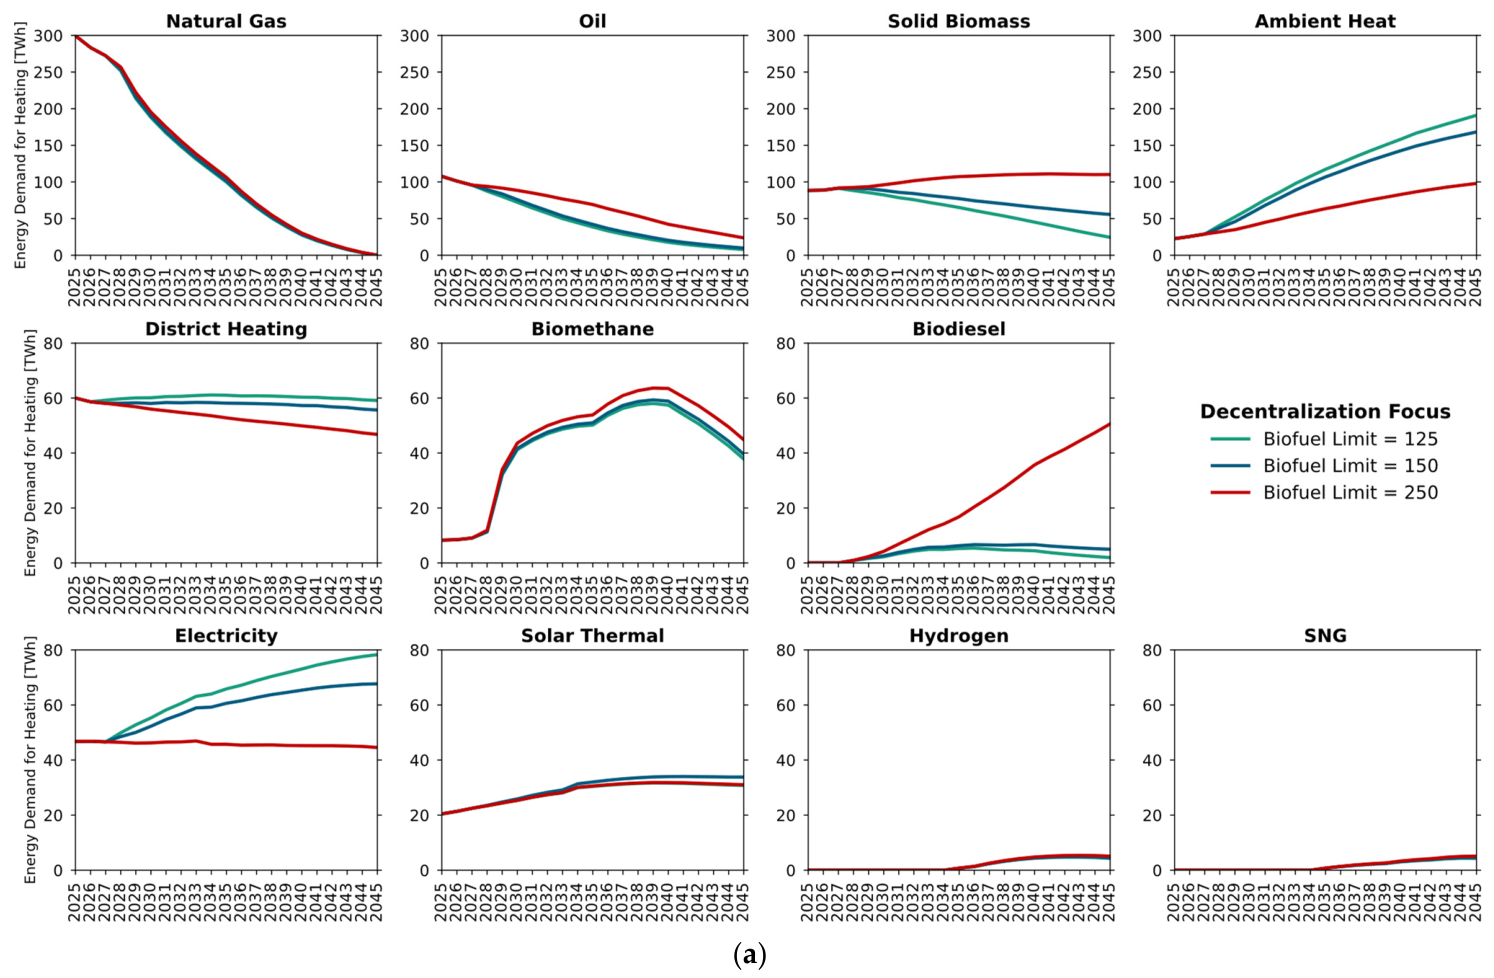
Figure 2. Workflow of the RENDER-Building model [8].
Energies 19 04377 g002
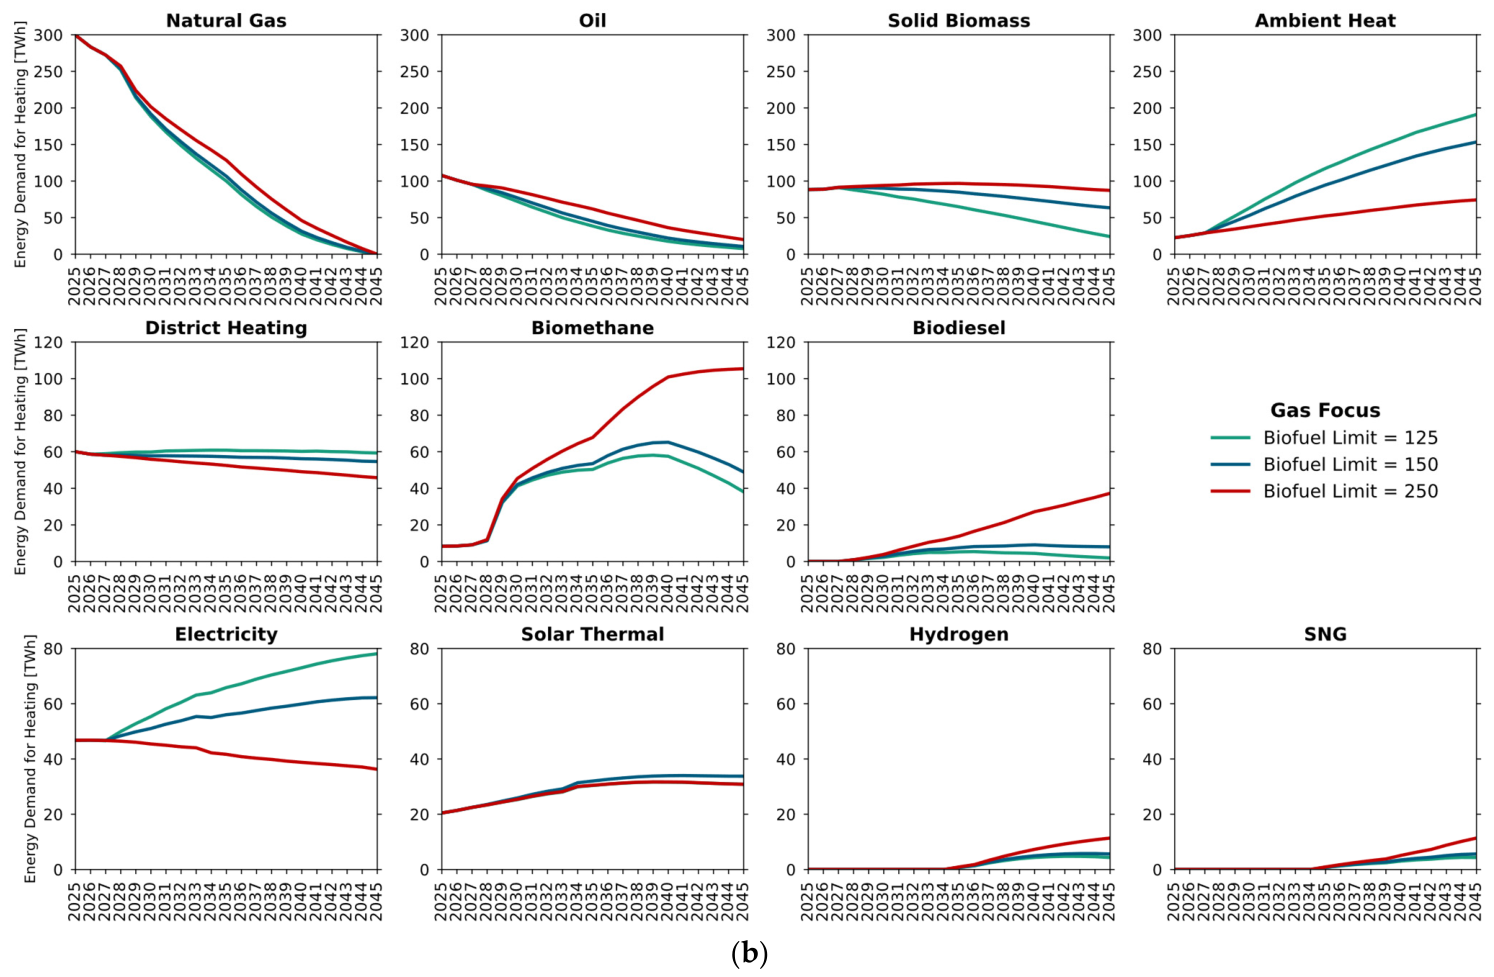
Figure 3. Overview of scenarios.
Energies 19 04377 g003
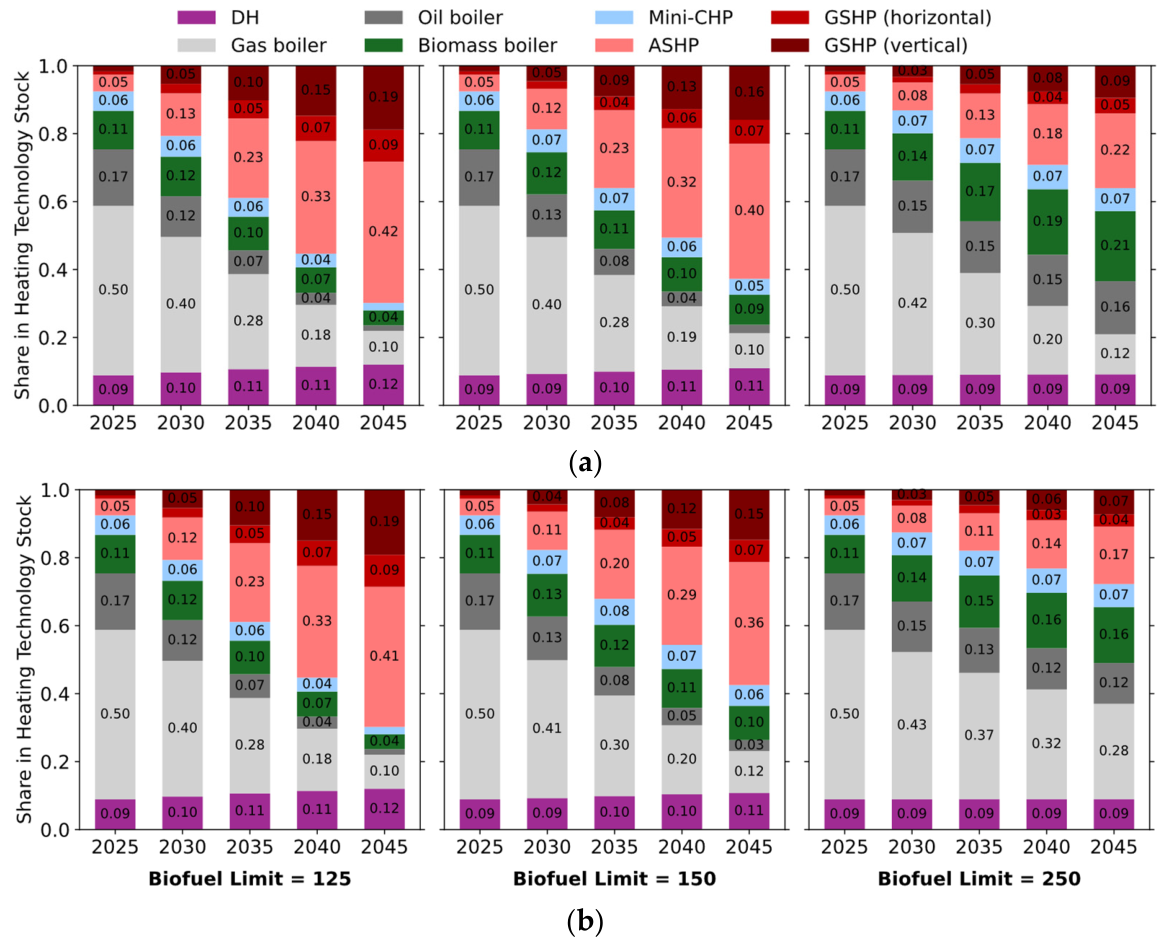
Figure 4. Electricity network charges and levies for residential (RES) buildings in the HP electricity rate (left) and for non-residential (NRES) buildings (right) according to the electricity network charge variant (based on [49]).
Energies 19 04377 g004
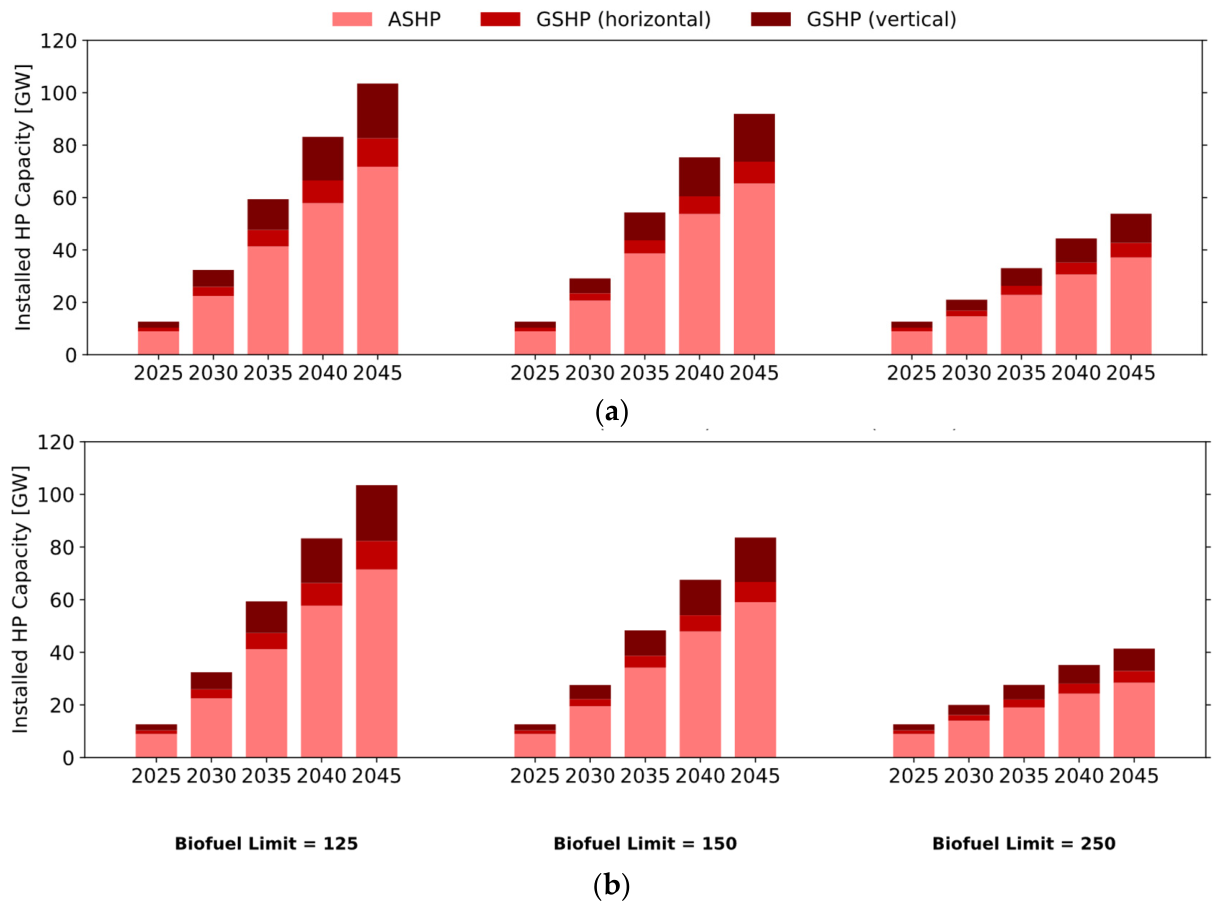
Figure 5. Composition of the (average) gas distribution network in the scenarios modeled.
Energies 19 04377 g005
Figure 6. Network charges according to gas distribution network variant and sector (RES: residential, NRES: non-residential), based on [40,42].
Energies 19 04377 g006
Figure 7. End-consumer price pathways of gas, electricity and DH up to 2045 by type of consumer in (a) Decentralization Focus scenario; (b) Centralization Focus scenario; and (c) Gas Focus scenario.
Energies 19 04377 g007
Figure 8. LCOH of different heating technologies in the Decentralization Focus scenario, building agents clustered by their energy performance classes and building types in the scatter plot (top), and by their building types in the box plot (bottom).
Energies 19 04377 g008
Figure 9. LCOH of different heating technologies in the Gas Focus scenario, building agents clustered by their energy performance classes and building types in the scatter plot (top), and by their building types in the box plot (bottom).
Energies 19 04377 g009
Figure 10. Evolution of the energy carrier mix (in final energy demand for space heating and sanitary hot water) up to 2045 by scenario.
Energies 19 04377 g010
Figure 11. Projection of the number of units heated by HPs by 2045 according to scenario.
Energies 19 04377 g011
Figure 12. Composition of the total heating technology stock of buildings according to scenario.
Energies 19 04377 g012
Figure 13. Composition of the heating technology stock according to building-type clusters for scenarios Decentralization Focus (a) and Gas Focus (b).
Energies 19 04377 g013
Figure 14. Composition of the heating technology stock according to settlement type for scenarios Decentralization Focus (a) and Gas Focus (b).
Energies 19 04377 g014
Figure 15. Composition of the heating technology stock according to EPC cluster for scenarios Decentralization Focus (a) and Gas Focus (b).
Energies 19 04377 g015
Figure 16. Composition of the heating technology stock according to federal state cluster for scenarios Decentralization Focus (a) and Gas Focus (b).
Energies 19 04377 g016
Figure 17. Total annual capital investment expenditure for heating technology installations (CAPEX) and fuel expenditure for energy consumption (OPEX) according to scenario.
Energies 19 04377 g017
Figure 18. Cumulated emissions (direct emissions shown with solid line and indirect emissions with dashed line) starting from 2026 up to 2045 according to scenario.
Energies 19 04377 g018
Table 1. Adjustment factor for the SPF of HPs according to energy performance class (EPC).
EPCTsupply/TreturnShare of SHW (%)SPF ASHPSPF GSHP
HorizontalVertical
A+35/25401.011.021.07
A/B45/35251.021.051.09
C/D50/40181.051.041.10
E/F55/45151.021.011.05
G/H60/50100.980.961.02
Disclaimer/Publisher’s Note: The statements, opinions and data contained in all publications are solely those of the individual author(s) and contributor(s) and not of MDPI and/or the editor(s). MDPI and/or the editor(s) disclaim responsibility for any injury to people or property resulting from any ideas, methods, instructions or products referred to in the content.