Article

An Online Monitoring Scheme for the Earth Resistance of a Common Earth Electrode

1
State Grid Shaanxi Electrical Power Research Institute, Xi’an 710100, China
2
State Grid Shaanxi Electric Power Co., Ltd. Extra High Voltage Company, Xi’an 710048, China
3
School of Electrical Engineering and Automation, Wuhan University, Wuhan 430072, China
4
State Key Laboratory of Power Grid Environmental Protection, School of Electrical Engineering and Automation, Wuhan University, Wuhan 430072, China
*
Author to whom correspondence should be addressed.
Energies 2026, 19(17), 3970; https://doi.org/10.3390/en19173970
Submission received: 14 July 2026 / Revised: 20 August 2026 / Accepted: 21 August 2026 / Published: 24 August 2026

Abstract

High-voltage direct current (HVDC) transmission is ideal for long-distance, large-capacity power delivery. A DC common earth electrode can be used for multiple DC lines, reducing the difficulty of land acquisition and lowering investment in grounding leads in power construction. The operating conditions of DC common earth electrodes are complex, and variations in earth resistance can cause ground potential rise (GPR), excessive step voltage, and other safety hazards. This paper proposes a technical scheme for online monitoring of DC earth resistance, verifies its feasibility through simple simulations, and finally validates the monitoring scheme using actual engineering parameters of the CH common earth electrode project through simulation. This study provides ideas and technical guidance for multiparameter monitoring of DC common earth electrodes and offers data to support the online monitoring of similar electrode groups.

1. Introduction

HVDC transmission offers significant advantages for long-distance and large-capacity power delivery. The earth electrode is an important component, providing a ground-return current path and maintaining the neutral-point potential of the converter station [1,2,3,4]. With the development of multi-circuit HVDC projects, common earth electrodes have been adopted in practical projects, allowing multiple DC systems to share one earth electrode and reducing land acquisition and investment costs [5,6,7]. Unlike independent earth electrodes, common earth electrodes are jointly affected by multiple DC systems, resulting in more complex current distributions and greater variations in operating conditions. These characteristics can increase electrode temperature rise and ground potential and may lead to excessive step and touch voltages if the earth resistance changes abnormally [8]. Therefore, earth resistance must be periodically measured [9]. However, the conventional current-injection method is an offline procedure that is time-consuming and cannot provide continuous information on the electrode’s operating state [10,11].
To overcome the limitations of offline measurements, online earth resistance monitoring has been investigated for various grounding systems. Fu et al. [12] and Zhang et al. [13] developed current-injection-based online monitoring systems for outdoor equipment and railway systems, respectively. Zhang et al. [14] proposed a clamp-meter method for tower grounding, while Ramelan et al. [15] developed an IoT-based system for real-time data acquisition and remote monitoring. These studies demonstrate the feasibility of online or remote earth resistance monitoring for conventional grounding facilities. For HVDC systems, Laninga et al. [16] reviewed monitoring technologies for HVDC transmission lines, mainly focusing on sensing, communication, and transmission-line condition monitoring. Akef et al. [17] modeled converter-station earth resistance, and other studies have addressed HVDC electrode interference [18], fault detection [19], and soil resistivity modeling [20,21]. These studies provide important foundations, but their monitoring targets, principles, and conditions differ from those of a common HVDC earth electrode.
Although these studies have advanced online monitoring and HVDC grounding analysis, their monitoring targets, measurement principles, and operating conditions differ from those of common earth electrodes. Current-injection-based methods [12,13] require an external test signal, whereas clamp-meter and IoT-based approaches [14,15] are mainly designed for conventional grounding facilities. The converter-station resistance estimation method [17] focuses on a specific grounding configuration rather than a common electrode jointly operated by multiple DC systems. For a common earth electrode, the selection of a remote zero-potential reference point is difficult in practical engineering, while the simultaneous current injection from multiple DC systems produces complex current division that makes the resistance of an individual earth electrode difficult to determine. Therefore, a monitoring method that utilizes the electrode’s normal operating state, without an additional test signal, is needed.
This paper proposes such an online monitoring scheme based on the physical definition of earth resistance. The scheme determines suitable monitoring locations through numerical analysis and estimates the earth resistance from the operational earth current and potential difference between selected points. The effects of monitoring distance, current distribution, and environmental conditions are investigated, and the scheme is applied to an actual common electrode group to determine its practical monitoring configuration. The results provide a technical basis for online monitoring and further multiparameter condition assessment of common HVDC earth electrodes.

2. Online Monitoring Method for Earth Resistance

2.1. Definition of Earth Electrode Earth Resistance and Its Measurement Principle

The earth resistance of an earth electrode is defined as the ratio of the potential difference between the earth electrode potential and that at the zero-potential point at infinity to the current entering the earth through the earth electrode—i.e.,
r g = V g / I g
where Vg is the potential of the earth electrode, and Ig is the current entering the earth through the earth electrode [22].
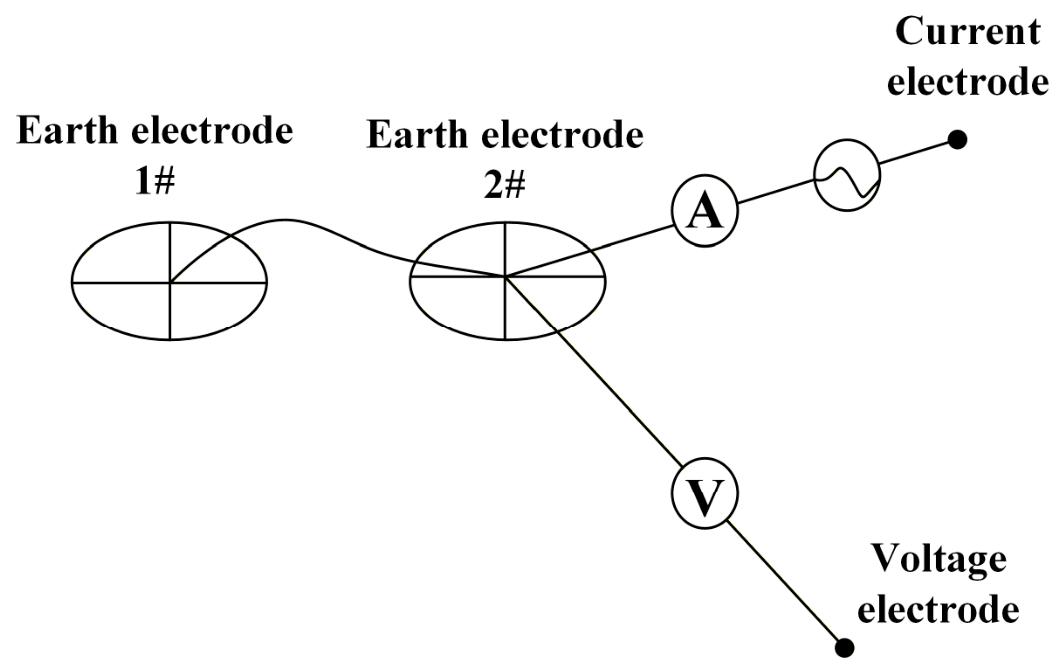
Field measurement of earth resistance generally employs the current injection method. During the shutdown of the earth electrode, an external DC test source is applied at the converter station (or earth electrode). Two electrode feeder lines are utilized as the current line and potential line, respectively. The current line forms a DC measurement loop with the grounding grid of the converter station. Reference potential electrodes are arranged at multiple locations far from the earth electrode body to measure the earth current of the earth electrode and the potential distribution, thereby determining the earth resistance. The principle diagram of DC earth electrode earth resistance measurement is shown in Figure 1.
Conventional field measurements are not suitable for real-time monitoring. If an online monitoring scheme were designed based on the principle of the current injection method, issues such as the difficulty of selecting a fixed zero-potential reference would arise.

2.2. Technical Approach for Online Monitoring of Earth Resistance

Online monitoring of earth resistance refers to the real-time, online surveillance of the primary operating parameters and on-site environmental data of the earth electrode. Collected data are transmitted in real-time via a network to a backend processing system, where the real-time earth resistance value of the earth electrode is calculated. This provides visibility into the operational status of the earth electrode and facilitates timely guidance and response for operation and maintenance tasks.
The proposed monitoring scheme includes theoretical analysis and simulation calculation. A current dispersion model of the earth electrode is established using earth electrode simulation software, and the boundary element method (BEM) is employed for simulation calculations of the earth electrode.
Based on the definition of earth resistance, the following can be used:
r g = ( V g + I g γ X + I g R g V 0 ) / I g
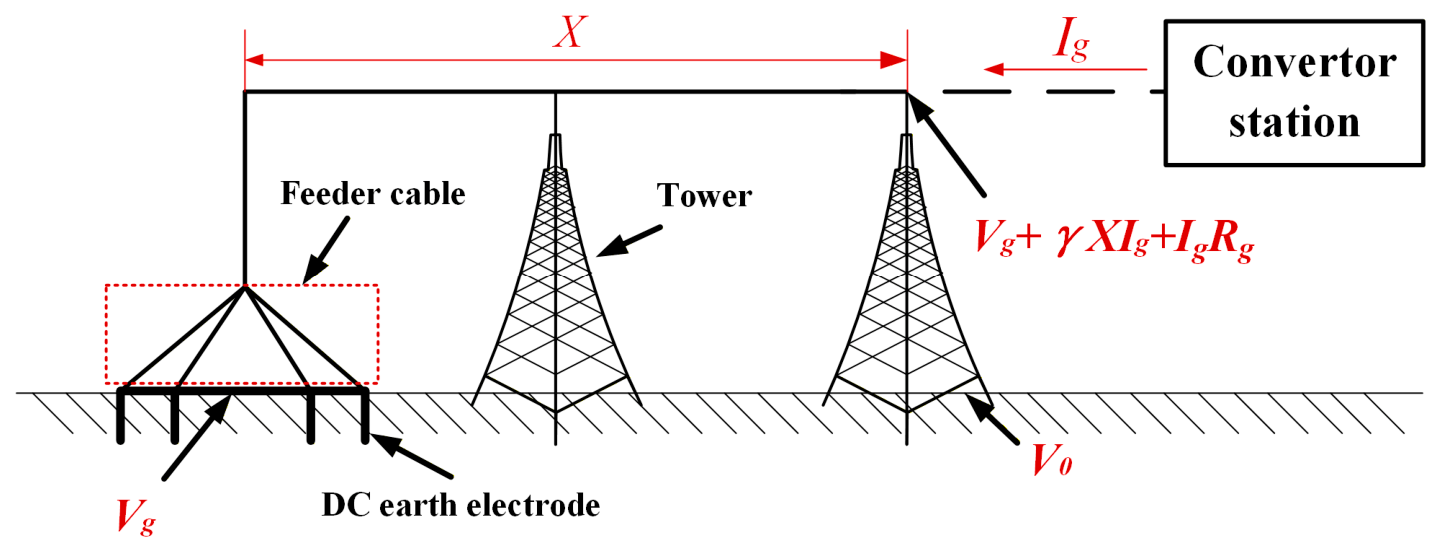
where: rg is the earth resistance of the earth electrode, Vg is the potential of the earth electrode, Ig is the earth current, γ is the resistance per unit length of the current-guiding overhead line, X is the distance from the monitoring point to the central tower of the earth electrode, Rg is the DC equivalent impedance of the underground feeder cable, and V0 is the GPR at the monitoring point.
In Equation (2), the value X represents the distance from the current-guiding tower to the central current injection tower, excluding the underground feeder cable section. In actual operating conditions, feeder cables are present within the earth electrode system. Therefore, to account for the voltage drop across the feeder cable, two current dispersion models are established: one for a circular ring earth electrode excluding the feeder cable structure, and another for a circular ring earth electrode including the feeder cable structure, which closely approximates actual operating conditions. By comparing the potentials at the current injection point obtained from the current dispersion calculation results of both models, the voltage drop across the feeder cable can be derived, and subsequently its equivalent DC impedance can be calculated.
As shown in Figure 2, a current dispersion model of the earth electrode under actual operating conditions is established. Relevant parameters are calculated to determine the optimal monitoring distance X between the monitoring point and the central tower. Based on the calculation results, the corresponding GPR at the towers on either side of the X location is recorded. The monitored earth resistance value is then recalculated and corrected to determine the optimal monitoring tower for the earth resistance under actual conditions. Finally, the earth resistance monitoring results are corrected considering environmental factors such as temperature.
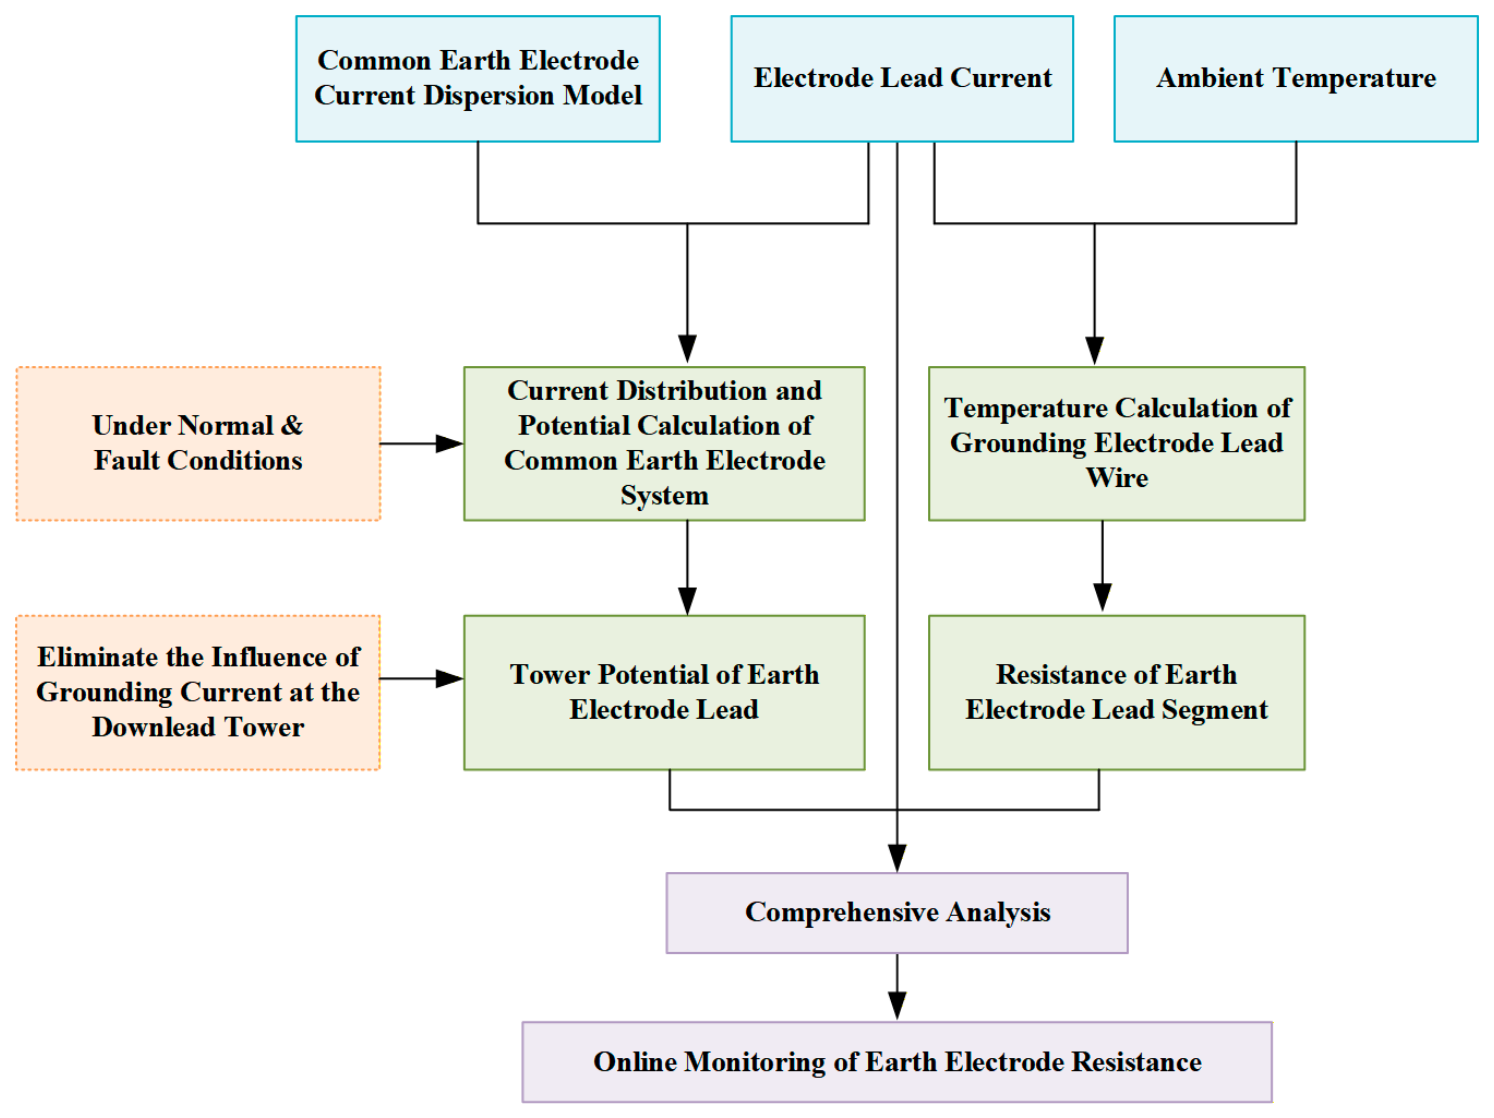
The primary difficulty in implementing online monitoring under actual operating conditions lies in the real-time monitoring of the potential at various potential monitoring points. This scheme avoids the selection of a zero potential point and the need for multi-point monitoring. According to the calculation formulas, the actual scheme only requires monitoring the potential difference between the earth electrode potential and the GPR at the tower serving as the optimal monitoring point, as well as parameters such as transmission line current and temperature. Flowchart of the online monitoring scheme for DC earth electrode earth resistance is shown in Figure 3.

3. Application of the Online Monitoring Scheme for a Common Earth Electrode

3.1. Overview of the Common Earth Electrode Project

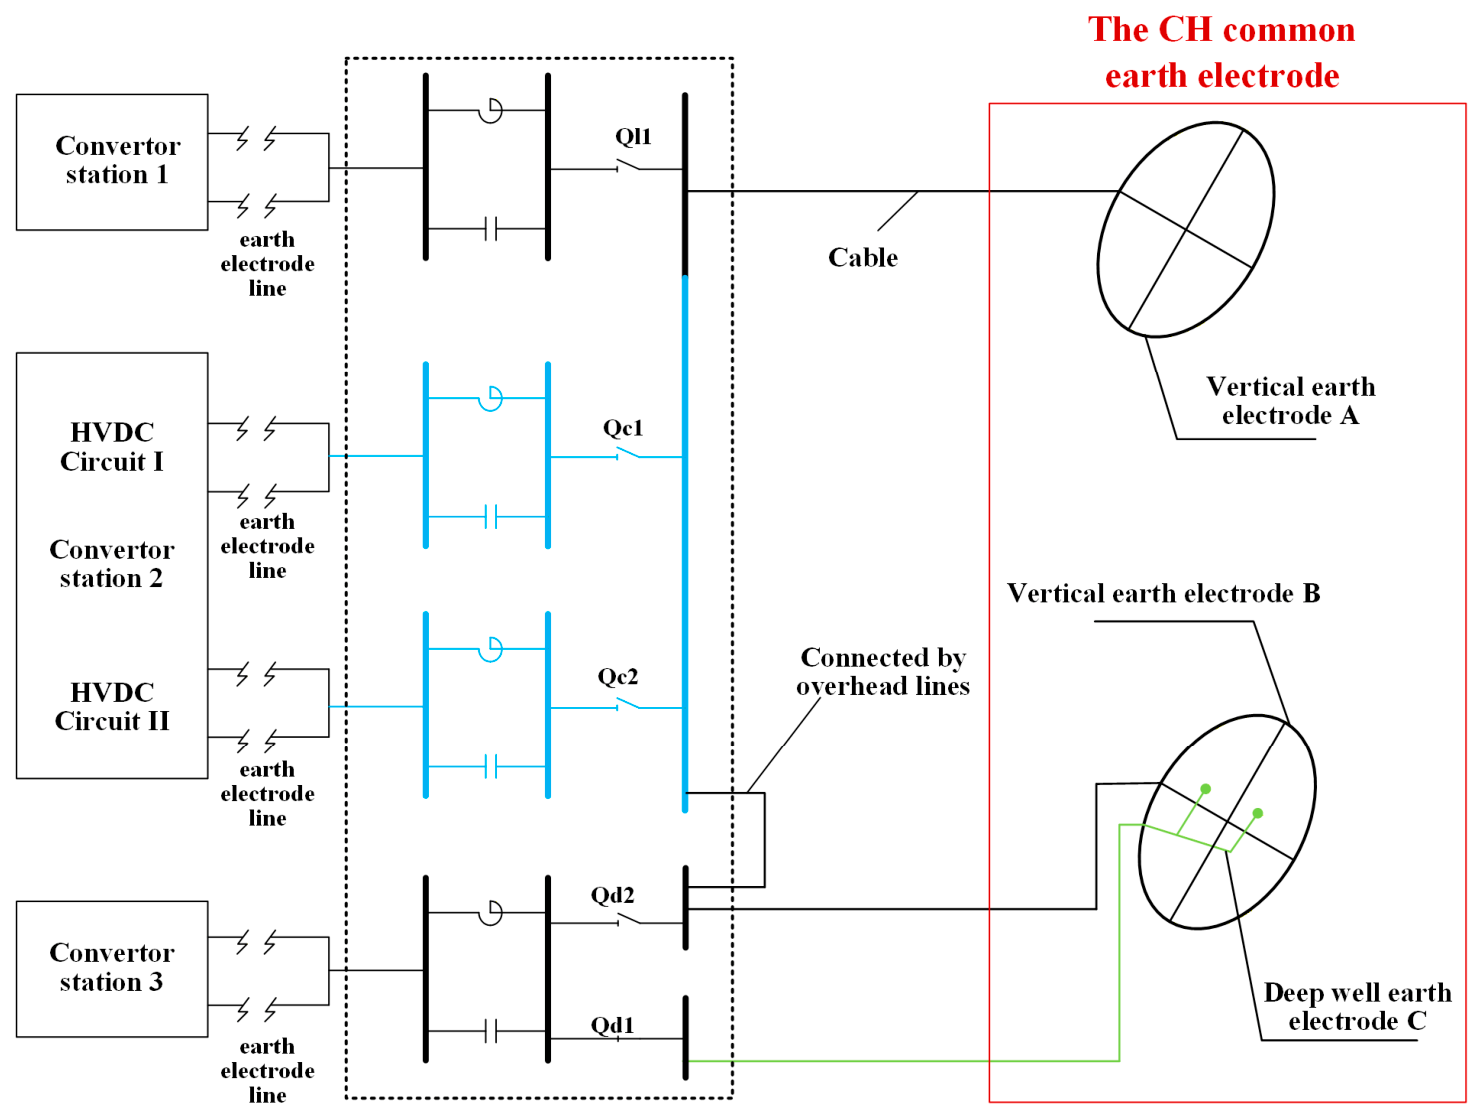
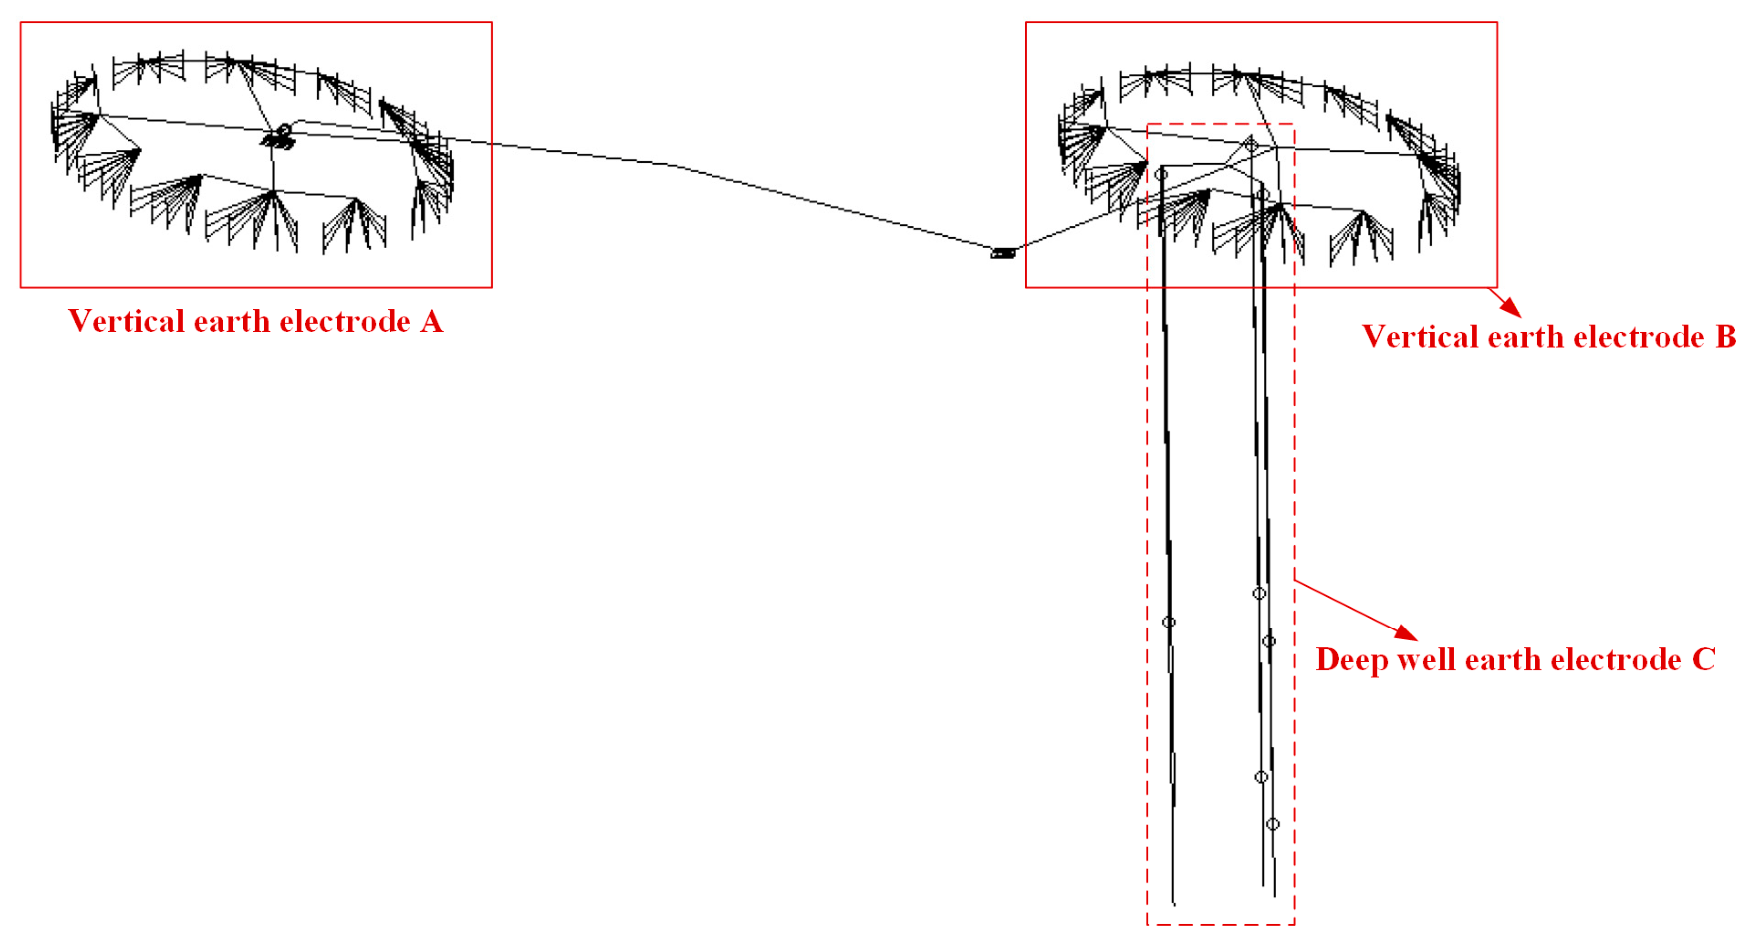
The CH common earth electrode system consists of two configurations: two vertical earth electrodes and one deep-well earth electrode. Specifically, the two vertical electrodes are jointly shared by Converter Stations 1 and 2, whereas the deep-well electrode is exclusively dedicated to Converter Station 3. A schematic diagram of the common earth electrode connections is shown in Figure 4. It should be noted that the analysis in this study is based on simulation using actual engineering parameters of the CH common earth electrode project, including soil resistivity measurements, electrode geometry, and recorded operating condition data. No field online monitoring tests were conducted; the simulation-based validation serves to verify the feasibility of the proposed scheme prior to field implementation.

3.2. Calculation and Analysis of the Common Earth Electrode Current Dispersion Model

3.2.1. Common Earth Electrode Current Dispersion Model

Based on engineering data, an eleven-layer soil model was constructed, and corresponding parameters for the grounding materials were set. The current dispersion model of the common earth electrode is shown in Figure 5. The following five operating conditions were selected for analysis [5,23], as listed in Table 1. Due to the temporary unavailability of data for the earth electrode lead lines, it is assumed that the current-guiding towers extend in the positive direction of the X-axis, originating from the central tower of the earth electrode A site. An observation line length of 10 km was set in the simulation.

3.2.2. Analysis of Calculation Results for the Common Earth Electrode Current Dispersion Model

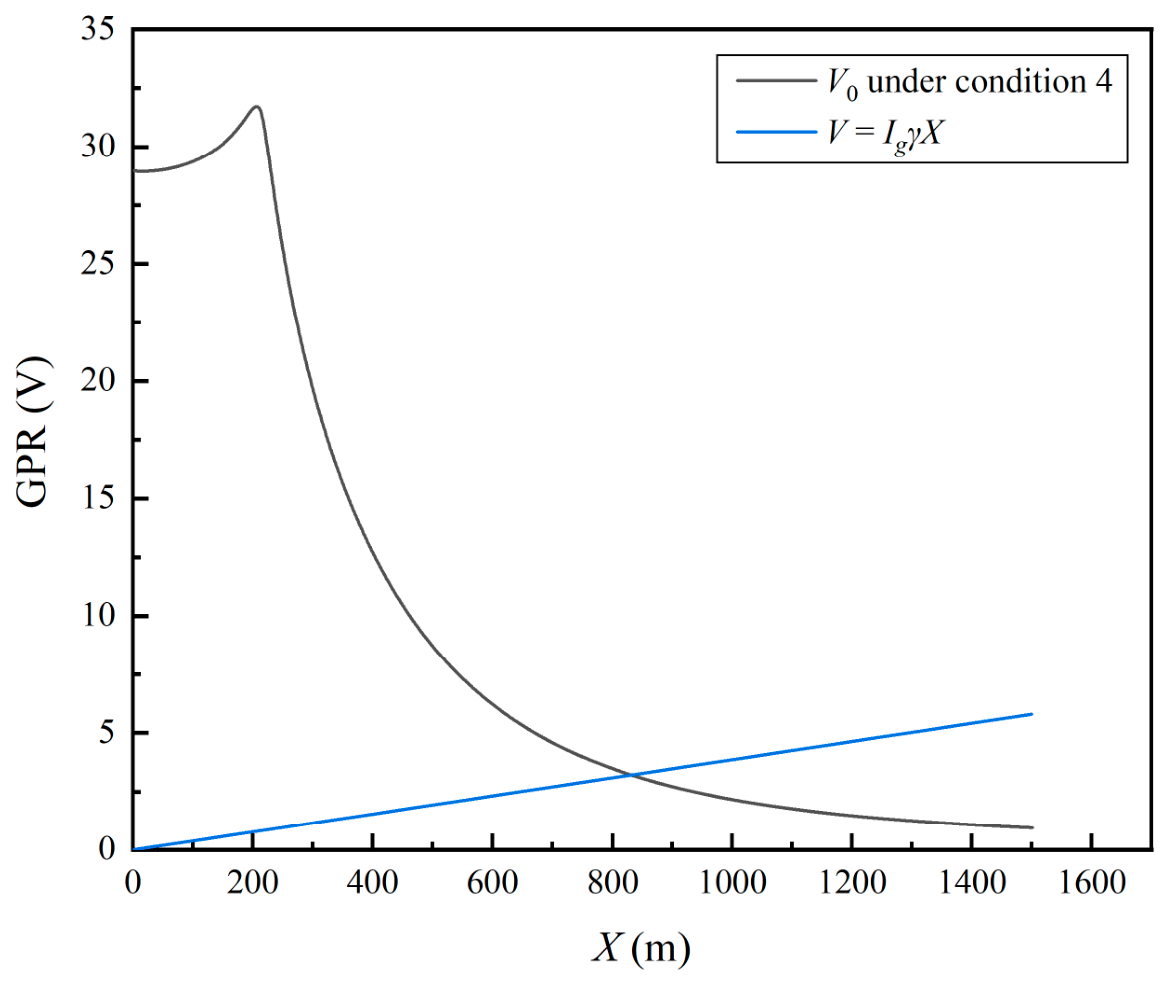
Under different operating conditions, the distribution trend of the GPR around the common earth electrode group remains consistent, differing only in peak magnitude, as shown in Figure 6.
In practical engineering, the influence of the feeder cables is not excluded when measuring the earth resistance. However, because the impedance of the feeder cables is relatively small, their effect on the grounding resistance of the earth electrode can be neglected. Since the current division between the two DC earth electrodes varies with the operating condition and is relatively complex to analyze, the two vertical earth electrodes and the overhead line connecting their central towers are considered as an integral entity and collectively referred to as the common earth electrode. Accordingly, the current injection point of the common earth electrode is the central tower of the earth electrode A. From Equation (2), it can be inferred that V1 for the common earth electrode is regarded as the potential at the central tower. Neglecting the voltage drop effects of the feeder cables and interconnecting overhead lines (IgRg), the calculation of the optimal monitoring point only needs to consider Equation (3):
I g γ X V 0 = 0
Equation (2) for calculating the earth resistance of the common earth electrode is therefore modified into
r g = ( V 1 + I g γ X V 0 ) / I g
Therefore, for the V0 = f(X) curve, the curve V = IgγX can be plotted, and their intersection determines the optimal monitoring distance. According to Equation (4), the solution curves for operating condition 4 are shown in Figure 6.
Comparing conditions 2 and 3, the calculated optimal monitoring points are X = 822.4 m and X = 822.5 m, respectively. Since the spacing between adjacent GPR monitoring points in the current-dispersion model is 1 m, the difference between the calculated optimal monitoring points is only 0.1 m, indicating that the results under the two conditions are essentially consistent. For conditions 4 and 5, the calculated optimal monitoring points are X = 830 m and X = 822.3 m, respectively, giving a difference of approximately 8 m. This indicates that the small current injected into the ground through the deep-well earth electrode C can affect the monitored grounding resistance of the common earth electrode, resulting in a monitoring deviation of approximately 0.9% under this operating condition. If one circuit of the double-circuit line of Converter Station 2 is out of service, the influence of the small ground current from the deep-well earth electrode C on the grounding-resistance monitoring results of the common earth electrode becomes more significant.
The operating-condition results indicate that variations in earth current mainly affect the magnitude of the GPR, whereas the corresponding optimal monitoring distance remains relatively stable under the investigated operating conditions.

3.2.3. Optimal Monitoring Point for Online Monitoring

Assuming that transmission towers are installed at 250 m intervals from the central tower of earth electrode A, the calculated optimal monitoring point lies between the third and fourth towers based on the preceding analysis. The GPR distribution under condition 4 in Figure 6 shows that the GPR varies steeply within the 0–800 m range, indicating that changes in soil or environmental conditions may have a significant influence on the monitoring accuracy in this region.
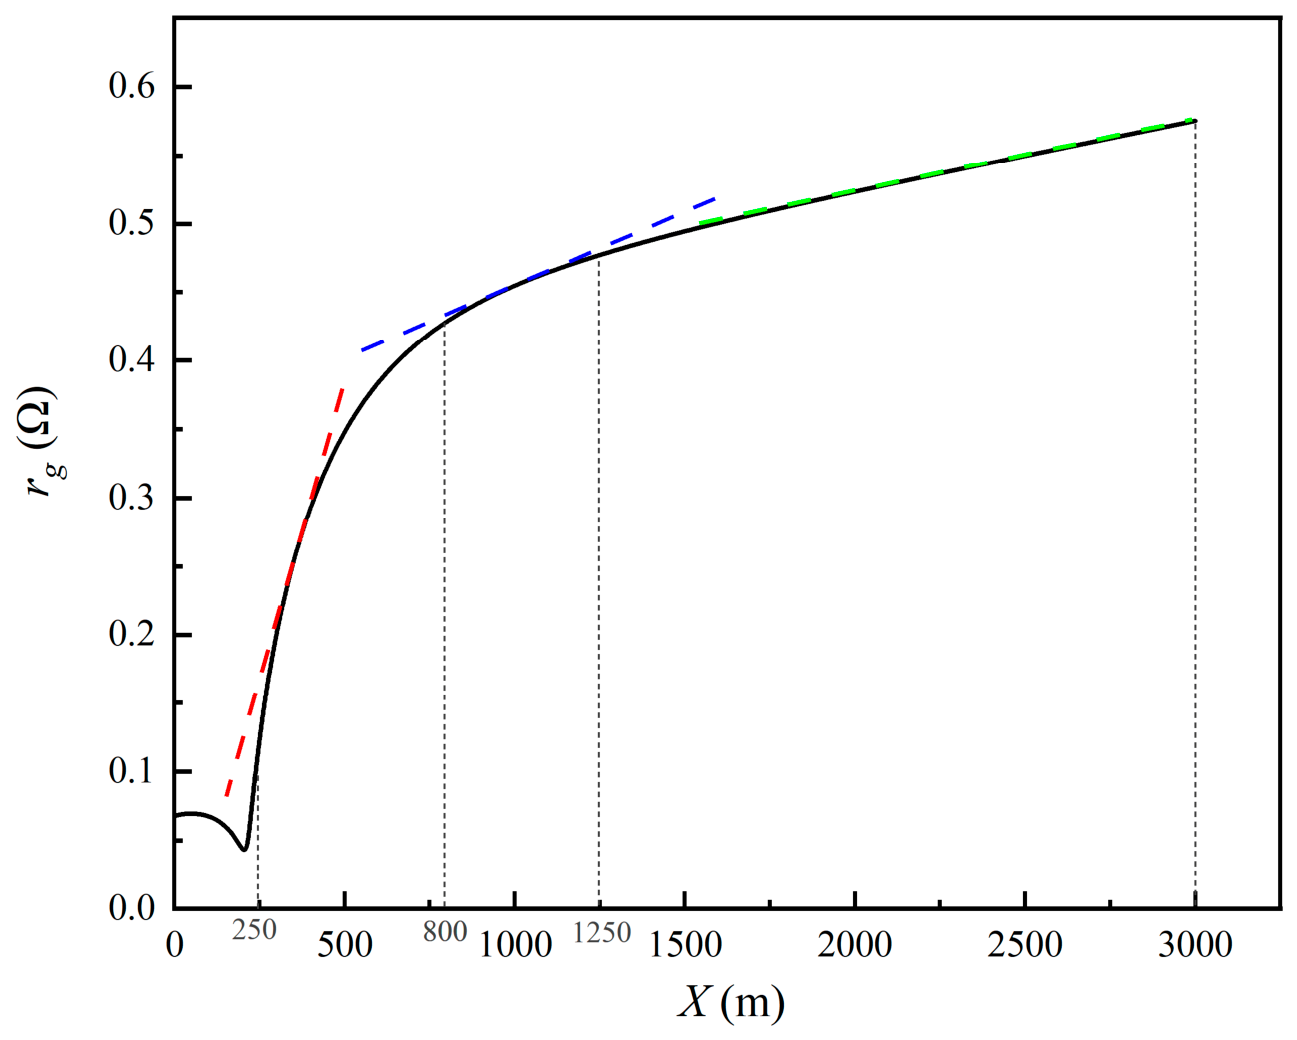
Taking condition 4 as an example, the variation of the calculated grounding resistance rg with the monitoring distance X is obtained based on Equation (3). The values of V1 and Ig are set to 34.217 V and 79 A, respectively, while V0 is obtained from the current dispersion calculation. The resulting curve is shown in Figure 7.
As shown in Figure 7, the calculated earth resistance rg gradually increases with X beyond 250 m. The curve is divided into three sections: 250–800 m, 800–1250 m, and 1250–3000 m. Tangent lines are drawn for these three sections using red, blue, and green dashed lines, respectively. The approximate slopes of the three sections are 10−3; 9.2 × 10⁻⁵ and 5.3 × 10⁻⁵, respectively. The rate of change of the slope begins to decrease in the second section, while the slope in the first section differs substantially from those in the latter two sections. A monitoring point located in the first section would therefore be more susceptible to disturbances, whereas monitoring in the 1250–3000 m section would be less sensitive to such influencing factors.
Considering the calculated optimal monitoring point together with the actual tower locations, the theoretical optimal monitoring point is 830 m from the central tower. The third and fourth towers are located at 750 m and 1000 m, respectively. Although the third tower is closer to the theoretical optimal point, it is still located within the region where the GPR varies relatively steeply. In contrast, the fourth tower at 1000 m is located in a relatively stable region, where the calculated earth resistance is less sensitive to variations in the monitoring distance and external disturbances. Therefore, considering both the theoretical optimal monitoring point and the sensitivity of the monitoring results, the fourth tower, located 1000 m from the central tower of the earth electrode A, is selected as the practical monitoring point.

4. Error Analysis of Online Earth Resistance Monitoring

4.1. Influence of Line Span on Earth Resistance Monitoring Results

In practice, the monitoring device is installed at an existing tower. Due to the fixed tower span, the selected monitoring point may differ from the theoretically optimal point, resulting in a monitoring deviation that requires correction. Taking condition 4 as an example, all conductor material parameters in the current dispersion model are set at 20 °C. Under this condition, the earth resistance obtained at the 1000 m monitoring point from the curve in Figure 7 is 0.455 Ω, whereas the theoretical earth resistance of the common earth electrode is 0.429 Ω, corresponding to a monitoring deviation of 5.99%. Based on Equation (2), the monitoring error caused by the deviation of the actual tower location from the theoretically optimal monitoring point can be derived as Equation (5). Under condition 4, the calculated optimal monitoring point is 830 m, whereas the actual monitoring tower is located 1000 m from the current injection point. Therefore, for the 20 °C case under condition 4, the monitoring result should be corrected using Equation (5).
Δ r g = ( I g γ Δ X Δ V 0 ) / I g
In Equation (5), ΔX is the distance between the optimal monitoring tower and the theoretically optimal monitoring point; ΔV0 is the difference in GPR between the optimal monitoring tower and the theoretically optimal monitoring point.
In actual practice, only the potential difference between the current injection point of the common earth electrode and the GPR at the monitoring tower is measured in real time; V0 is not directly monitored. Therefore, V0 used in the correction formula is taken from the calculation results of the current dispersion model under various operating conditions.

4.2. Influence of Earth Current from the Deep-Well Earth Electrode on Earth Resistance Monitoring Results

Comparing condition 4 and condition 5 reveals that, when the earth current of the common earth electrode is relatively small, the earth current of the deep-well earth electrode can affect the monitored earth resistance, causing the corrected monitoring value to be lower than the actual value. The influence of an interfering earth current depends not only on its magnitude but also on its injection location. Since the distances between the deep-well earth electrode and the current injection point of the common earth electrode and the selected monitoring tower are different, the deep-well earth electrode current produces different GPR disturbances at these two locations. Consequently, the potential difference used for earth resistance estimation is affected, leading to an error in the monitored earth resistance.
When the earth current of the deep-well earth electrode is much larger than that of the common earth electrode, as in condition 3, the influence of the deep-well earth electrode current on the online monitoring result becomes significant. This indicates that both the magnitude and the injection point of an interfering earth current should be considered when evaluating its influence on the monitoring results.
For the specific scenario of condition 4, after applying the line-span correction in Section 4.1, the monitored earth resistance is 0.411 Ω, while the theoretical value is 0.429 Ω, resulting in a residual error of 0.018 Ω. This residual error is primarily attributed to the unequal GPR rises caused by the deep-well electrode current at the injection point and the monitoring tower. It should be emphasized that this 0.018 Ω value is specific to this particular simulation case and is not intended as a fixed compensation constant for engineering implementation. This case serves as an example to demonstrate that the deep-well earth electrode current can introduce measurable interference under certain operating conditions. The interference from the deep-well earth current is a recognized concern that merits further investigation.

4.3. Influence of Temperature on Earth Resistance Monitoring Results

Temperature is the most intuitive environmental parameter affecting the monitoring results. Changes in temperature can lead to a series of variations in soil resistivity, the resistivity of the earth electrode body, and the resistivity of the conductors. In this project, the soil model is an eleven-layer stratified model. Variations in resistivity with temperature do not affect a large volume of soil but are limited to the soil parameters surrounding the earth electrode. The change in soil resistivity is relatively complex and has a minor impact on GPR at distant points. Therefore, the situation of changing soil resistivity due to temperature variations is neglected. The primary considerations are the influences of temperature on the resistivity of the earth electrode body and the conductor resistivity. The magnitude of their impact on the monitoring results is analyzed separately, and corresponding corrections are proposed. Based on simulation test results, the following conclusions can be drawn:
When considering the influence of temperature on individual parameters of the earth electrode separately, it does not affect the correction methods and results presented in the previous section. However, if the combined influence of temperature on multiple parameters of the earth electrode is considered simultaneously, the situation becomes more complex. In such a case, several parameters with the most significant impact should be selected for combined analysis. This combined analysis is not discussed further in this paper.

5. Discussion

The results demonstrate the feasibility of the proposed online monitoring scheme for estimating the earth resistance of a common earth electrode under the investigated operating conditions. Unlike conventional offline measurements, the proposed approach uses the earth current and the potential difference between the earth electrode and the selected monitoring tower, avoiding the need for a remote zero-potential reference and enabling continuous monitoring.
The correction methods for line span and conductor temperature improve the robustness of the monitoring scheme. The results show that these factors can introduce non-negligible errors when neglected, while the proposed corrections effectively reduce their influence.
The present validation is based on theoretical analysis and simulations using practical engineering parameters. Field measurements are still required to evaluate the scheme under actual operating conditions. Future work will investigate the effects of seasonal soil-moisture- and rainfall-induced changes in soil resistivity. The influence of earth current from nearby earth electrodes, particularly deep-well earth electrodes, also requires further investigation. A dynamic compensation strategy based on real-time earth-current measurements will be considered to improve the applicability of the proposed scheme.

6. Conclusions

This paper presents an online monitoring scheme for the earth resistance of a common earth electrode. The feasibility of the scheme was verified through simulation, and the optimal monitoring tower was identified via theoretical analysis. By monitoring the potential and current at the current injection point and the optimal monitoring tower, online monitoring of the earth resistance was achieved. The main contributions are as follows:
(1)
A novel approach for online earth-resistance monitoring was proposed. Based on the physical definition of earth resistance, the proposed scheme avoids the need to determine a remote zero-potential point and enables online estimation using pre-determined monitoring parameters and real-time measurements at the common earth electrode and selected monitoring tower.
(2)
The optimal monitoring tower was determined through current dispersion analysis. The theoretical optimal monitoring distance was first identified, and the practical monitoring tower was then selected by considering the actual line span and the sensitivity of the monitoring result to the monitoring distance.
(3)
The influences of external environmental factors on the monitoring results were analyzed, and corresponding correction schemes were proposed. With the optimal monitoring tower determined, the influences of environmental factors such as line span and temperature on the monitoring results were analyzed. Corresponding correction schemes were proposed based on theoretical analysis and simulation validation, enhancing the flexibility and reliability of the scheme.

Author Contributions

Conceptualization, W.L. and K.Z.; methodology, W.L. and M.Z.; validation, W.L., M.Z. and L.L.; formal analysis, W.L. and K.Z.; data curation, K.Z. and M.Z.; writing—original draft preparation, W.L.; writing—review & editing, Y.J., L.L. and Y.L.; visualization, Y.J. and Y.L. All authors have read and agreed to the published version of the manuscript.

Funding

This research was funded by the State Grid Science and Technology Project under grant number 5500-202432169A-1-1-ZN.

Data Availability Statement

The data presented in this study are available on request from the corresponding author.

Conflicts of Interest

Mr. Kun Zuo was employed by State Grid Shaanxi Electric Power Co., Ltd. Extra High Voltage Company, Xi’an. The remaining authors declare that the research was conducted in the absence of any commercial or financial relationships that could be construed as a potential conflict of interest. The authors declare that this study received funding from State Grid Science and Technology Project. The funder was not involved in the study design, collection, analysis, interpretation of data, the writing of this article, or the decision to submit it for publication.

References

  1. Xie, G. Power System Earthing Technology; Water and Power Press: Beijing, China, 1991; pp. 95–100. [Google Scholar]
  2. Pourmirasghariyan, M.; Zarei, S.F.; Hamzeh, M. DC-system grounding: Existing strategies, performance analysis, functional characteristics, technical challenges, and selection criteria—A review. Electr. Power Syst. Res. 2022, 206, 107769. [Google Scholar] [CrossRef] [Scilit]
  3. Azizi, M.; Husev, O.; Veligorskyi, O.; Rahimpour, S.; Roncero-Clemente, C. Grounding and Isolation Requirements in DC Microgrids: Overview and Critical Analysis. Energies 2023, 16, 7747. [Google Scholar] [CrossRef] [Scilit]
  4. IEC TS 62344:2022; Design of Earth Electrode Stations for High-Voltage Direct Current (HVDC) Links—General Guidelines. International Electrotechnical Commission: Geneva, Switzerland, 2022. Available online: https://webstore.iec.ch/en/publication/61523 (accessed on 16 May 2022).
  5. Li, S.; Wang, H.; Wang, M.; Xie, G.; Zhang, M.; Li, X.; Sun, X.; Lei, X. Analysis of maintenance and operation of grounding electrodes shared by DC systems. Power Syst. Technol. 2015, 39, 3346–3352. [Google Scholar]
  6. Liu, Y.; Wang, W. Research on the scheme of shared grounding electrode for four-circuit HVDC system. South. Energy Constr. 2024, 11, 29–35. [Google Scholar]
  7. Liu, Y.; Wang, W. Research on the Interaction Between Multi-Circuit Shared HVDC Grounding Electrodes. South. Energy Constr. 2023, 10, 87–93. [Google Scholar]
  8. Wen, X.; Jing, M.; Cai, H.; Zhang, Y.; Hu, S.; Teng, Y.; Liu, G.; Lan, L.; Lu, H. Temperature characteristics and influence of water-saturated soil resistivity on the HVDC grounding electrode temperature rise. Int. J. Electr. Power Energy Syst. 2020, 118, 105720. [Google Scholar] [CrossRef] [Scilit]
  9. DL/T 437-2012; Technical Guide of HVDC Earth Electrode System. National Energy Administration: Beijing, China, 2012.
  10. DL/T 253-2012; Measurement Method for Earth Resistance, Ground Potential Distribution, Step Voltage and Current Dividing on Earth Electrodes. National Energy Administration: Beijing, China, 2012.
  11. Su, L. Study on Operation State Assessment and Maintenance Method of HVDC Grounding Electrode. Master’s Thesis, North China Electric Power University, Beijing, China, 2019. [Google Scholar]
  12. Fu, Z. Design and exploration of an online monitoring system for grounding resistance of highway outfield equipment. China Transp. Informatiz. 2020, 3, 123–126. [Google Scholar]
  13. Zhang, Y. Design and implementation of an online ground resistance testing and remote monitoring system. Railw. Commun. Signal Eng. Technol. 2020, 17, 51–55. [Google Scholar]
  14. Zhang, Y.; Wang, Z.; Feng, K.; Zhang, Y.; Tian, Z.; Zheng, Z.; Lu, H. Accurate Measurement of Tower Grounding Resistance for Single-Tower and Multi-Tower Parallel Scenarios Based on the Clamp Meter Method: For the Sustainable Operation of Towers. Sustainability 2024, 16, 7551. [Google Scholar] [CrossRef] [Scilit]
  15. Ramelan, A.; Irwan, I.; Sari, D.M. Design of IoT-Based Ground Resistance Monitoring and Control Systems. In Proceedings of the 2024 FORTEI-International Conference on Electrical Engineering (FORTEI-ICEE), Badung, Indonesia, 24–25 October 2024; pp. 124–129. [Google Scholar]
  16. Laninga, J.; Esfahani, A.N.; Ediriweera, G.; Jacob, N.; Kordi, B. Monitoring Technologies for HVDC Transmission Lines. Energies 2023, 16, 5085. [Google Scholar] [CrossRef] [Scilit]
  17. Akef, S.; El-Morshedy, A.M.K.; Samy, M.M.; Emam, A.M.; El-Hawary, H.H. Ground Resistance Estimation for a DC Converter Station: Theory versus Experiment. Energies 2024, 17, 765. [Google Scholar] [CrossRef] [Scilit]
  18. Brignone, M.; Mestriner, D.; Molfino, P.; Nervi, M.; Marzinotto, M.; Patti, S. The Mitigation of Interference on Underground Power Lines Caused by the HVDC Electrode. Energies 2023, 16, 7769. [Google Scholar] [CrossRef] [Scilit]
  19. Hemmati, M.; Ghaffarzadeh, N. A novel phaselet-based approach for fault detection and location in HVDC lines. Comput. Electr. Eng. 2024, 120, 109667. [Google Scholar] [CrossRef] [Scilit]
  20. Pauly, J. Measurement of Soil Resistivity for an HVDC Electrode Station Using High Current DC Source. In Proceedings of the 2023 13th International Conference on Power, Energy and Electrical Engineering (CPEEE), Tokyo, Japan, 25–27 February 2023; pp. 13–16. [Google Scholar] [CrossRef] [Scilit]
  21. Jing, M.; Wen, X.; Cai, H.; Teng, Y.; Hu, S.; Zhang, Y.; Lan, L.; Lu, H. Research on Earth Resistivity Measuring and Modeling of HVDC Deep-Well Grounding Electrode Sites. IEEE Access 2020, 8, 23776–23786. [Google Scholar] [CrossRef] [Scilit]
  22. Chen, C. Fundamentals of Electrical Engineering, 3rd ed.; China Electric Power Press: Beijing, China, 2016; pp. 45–60. [Google Scholar]
  23. Li, L.; Pu, Y.; Lü, Y.; Gong, F.; Fu, G. Design of coordination strategy for the Belo Monte UHVDC bipole transmission project in Brazil. Autom. Electr. Power Syst. 2020, 44, 175–183. [Google Scholar]
Figure 1. Principle diagram of DC earth electrode earth resistance measurement.
Energies 19 03970 g001
Figure 2. Schematic diagram of the online earth resistance monitoring programme.
Energies 19 03970 g002
Figure 3. Computational framework for online monitoring of shared earth electrode resistance.
Energies 19 03970 g003
Figure 4. Diagram of connection for CH common earth electrode.
Energies 19 03970 g004
Figure 5. Simulation model for a common earth electrode group.
Energies 19 03970 g005
Figure 6. V and V0 curves under condition 4.
Energies 19 03970 g006
Figure 7. Variation in earth resistance, rg, with distance, X.
Energies 19 03970 g007
Table 1. Operating conditions considered in the study.
Operation ConditionConverter Station 1Converter Station 2 Line IIConverter Station 3
Condition 1Monopole operation: 3125 ATwo-circuit monopole operation: 6400 AMonopole operation: 3125 A
Condition 2Unbalanced bipolar operation: 10 ASingle-circuit monopole operation: 3232 AUnbalanced bipolar operation: 15 A
Condition 3Unbalanced bipolar operation: 10 ATwo-circuit unbalanced bipolar operation: 64 AMonopole operation: 3125 A
Condition 4Unbalanced bipolar operation: 10 ATwo-circuit unbalanced bipolar operation: 64 AUnbalanced bipolar operation: 15 A
Condition 5Out of service:0 ATwo-circuit unbalanced bipolar operation: 64 AUnbalanced bipolar operation: 15 A
Disclaimer/Publisher’s Note: The statements, opinions and data contained in all publications are solely those of the individual author(s) and contributor(s) and not of MDPI and/or the editor(s). MDPI and/or the editor(s) disclaim responsibility for any injury to people or property resulting from any ideas, methods, instructions or products referred to in the content.