Article

Dimensional Analysis-Based Prediction of Photovoltaic Module Electrical Characteristics Under Variable Environmental Conditions

by
Samah Hashim
1,* and
Mohammed H. Siddig
2
1
Department of Electrical Engineering, University of Business and Technology, Jeddah 21445, Saudi Arabia
2
Department of Mechanical Engineering, University of Khartoum, Khartoum 11115, Sudan
*
Author to whom correspondence should be addressed.
Energies 2026, 19(15), 3614; https://doi.org/10.3390/en19153614
Submission received: 20 May 2026 / Revised: 27 July 2026 / Accepted: 29 July 2026 / Published: 1 August 2026
(This article belongs to the Special Issue Research on Photovoltaic Modules and Devices)

Abstract

This paper presents a simplified dimensionless model for predicting the electrical performance of photovoltaic (PV) modules under varying irradiance and temperature conditions. Unlike conventional equivalent-circuit models that require detailed parameter extraction, the proposed approach employs dimensional analysis to establish direct relationships between key PV operating points and normalized environmental variables, without assuming a predefined physical model. The model is validated using experimental datasets from Sandia National Laboratories, covering a wide range of irradiance (100–1100 W/m2) and module temperatures (15–75 °C). Model accuracy is evaluated using normalized root mean square error (nRMSE). The results demonstrate strong predictive capability, with average nRMSE values below 2.5% for maximum power point voltage and current, below 1% for maximum power, and low errors for open-circuit voltage and short-circuit current. To the best of the authors’ knowledge, this represents the first application of the Buckingham π theorem to derive dimensionless scaling laws for predicting PV module electrical characteristics under varying irradiance and temperature conditions. The proposed model provides a computationally efficient and accurate alternative to conventional PV models. Moreover, the dimensionless framework offers strong potential for predicting the performance of complex multiphysics energy systems, where conventional equivalent-circuit-based approaches are often difficult to apply or fail to achieve satisfactory accuracy.

1. Introduction

Accurate modeling of photovoltaic (PV) modules is essential for the analysis, design, control, and optimization of solar energy systems. Reliable PV models enable the prediction of electrical performance under varying environmental and operating conditions and are, therefore, widely used in system simulation, performance assessment, and energy management applications.
Existing PV modeling approaches can generally be classified into three categories. The first category includes equivalent-circuit models, such as the single-diode and double-diode models, which represent the PV device using electrical circuit elements and require parameter extraction procedures to determine the model parameters. Among these approaches, the single-diode model remains one of the most widely adopted methods due to its relatively simple structure and reasonable accuracy. Several studies have focused on improving parameter estimation techniques for diode-based models using manufacturer datasheet information and characteristic points of the I–V curve [1,2,3].
The second category consists of empirical and data-driven approaches, including the Sandia PV Array Performance Model [4], which relies on measured I–V characteristics and experimentally derived correlations to estimate module performance under varying operating conditions. The third category includes physics-based models derived from semiconductor transport equations, such as the Poisson and drift–diffusion equations, which provide a detailed physical representation of PV devices but require extensive device information and significant computational resources [5].
Despite their widespread use, diode-equivalent circuit models present several limitations. First, the parameters of these models are generally not available in manufacturer datasheets and must be determined using nonlinear parameter extraction techniques, which often involve iterative numerical procedures and may suffer from convergence and initialization difficulties [6]. Second, many analytical formulations rely on simplifying assumptions that may not remain valid under all operating conditions. A review by [7] showed that several commonly used assumptions in single-diode formulations may produce non-physical parameter values under varying irradiance and temperature conditions. Third, the extracted parameters are typically determined under standard test conditions (STCs) and must be adjusted for different environmental conditions using additional empirical relationships [8]. Furthermore, equivalent-circuit models inherently depend on predefined electrical circuit representations that only approximate the complex semiconductor processes governing PV module behavior [2,9,10].
Recent years have seen significant activity in PV module modeling, with approaches spanning analytical, data-driven, and hybrid methodologies. On the analytical side, Zaimi et al. [11] proposed mathematical models for the temporal variation of Power-Law Model shape parameters validated on 22 NREL modules, while Benahmida et al. [12] developed an optimized analytical framework achieving an nRMSE below 0.92% for maximum power prediction on NREL data. Kumar et al. [13] proposed improved three-, five-, and seven-parameter models validated across a range of irradiance conditions, including low-irradiance regimes not typically addressed in the literature. On the data-driven side, machine-learning approaches, including artificial neural networks, decision tree regression, and gradient boosting, have been applied to predict PV module I–V characteristics as functions of irradiance and temperature [14,15], achieving high accuracy but requiring large training datasets and offering limited physical interpretability. Hybrid approaches combining physics-based constraints with data-driven fitting have also been proposed [16], seeking to balance accuracy with generalisability.
These limitations motivate the development of alternative PV modeling approaches that reduce dependence on predefined circuit structures and iterative parameter extraction procedures. Dimensional analysis provides a systematic framework for establishing relationships between physical variables based on their fundamental dimensions, enabling predictive modeling without requiring a detailed representation of the internal physical mechanisms of the system. Previous work by [17] demonstrated the applicability of dimensional analysis for estimating PV module efficiency; however, the approach was limited to efficiency prediction and did not address the direct prediction of PV electrical characteristics.
It is important to distinguish the proposed dimensional-analysis-based framework from conventional empirical or curve-fitting approaches. In empirical modeling, an output variable is expressed as an arbitrary function of raw measured inputs, with coefficients determined by regression on a specific dataset. The present work differs fundamentally from conventional empirical and curve-fitting approaches in the way the predictive equations are derived. In empirical modeling, an output variable is expressed as an arbitrary function of raw measured inputs, with coefficients determined by regression on a specific dataset. The resulting equations are dataset-dependent and carry no inherent guarantee of physical consistency or cross-technology generalisability. In contrast, the proposed framework applies the Buckingham π theorem [18] to first identify, from the governing variables alone, the minimum set of independent dimensionless groups that must appear in any physically consistent relationship describing PV module electrical behavior. The mathematical form of the model is, therefore, constrained by the laws of dimensional homogeneity before any experimental data is used—data serves only to determine the numerical exponents within that pre-established structure. This distinction makes the proposed framework simultaneously more principled than empirical curve fits and less restrictive in its assumptions than device-physics models such as the single-diode model [10], which impose specific assumptions about carrier transport, recombination mechanisms, and junction behavior. To the best of the authors’ knowledge, this is the first application of the Buckingham π theorem [18] to derive dimensionless scaling laws for predicting PV module electrical characteristics across varying irradiance and temperature conditions.
The goal of this work is to develop and validate a dimensional analysis-based framework for predicting the electrical characteristics of photovoltaic modules under varying irradiance and temperature conditions. The proposed model predicts the short-circuit current ( I s c ), open-circuit voltage ( V o c ), and the current and voltage at the maximum power point ( I m p and V m p ) using relationships derived from normalized environmental and electrical variables. Unlike conventional diode-equivalent approaches, the proposed method does not rely on predefined circuit structures or iterative parameter extraction procedures. The model is validated using publicly available datasets from the Sandia National Laboratories PV Performance Modeling Collaborative database, which is widely used for benchmarking photovoltaic performance models.

2. Materials and Methods

2.1. Dimensional Analysis Framework

The current–voltage (I–V) characteristics of photovoltaic modules under varying irradiance and temperature conditions exhibit self-similar behavior, indicating the presence of scalable relationships between the governing variables. In such systems, dimensional analysis becomes a powerful tool for identifying the underlying mathematical relationships among the variables describing the system [19]. Consequently, dimensional analysis can be applied to derive a mathematical model describing the electrical behavior of photovoltaic modules. A detailed description of the dimensional analysis methodology applied to photovoltaic systems is presented in [17]. Therefore, only the steps relevant to the development of the present model are summarized in the next subsection.

2.2. Selected Variables

The PV module is modeled using irradiance G and temperature T as inputs and electrical parameters I s c , V o c , I m p , and V m p as outputs. These variables form the basis for deriving dimensionless relationships.

2.3. Dimensionless Relationships

Following the dimensional analysis framework established in [17], the governing variables of PV module efficiency η , irradiance G and module temperature T are subjected to the Buckingham π theorem to identify the minimum set of independent dimensionless groups that must govern the system. PV module efficiency, which is defined as η = V m p · I m p G · A , was expressed as:
η r = τ ϕ γ α
where
η r = η η S T C , γ = G G S T C , τ = T T S T C
γ and τ are the normalized irradiance and temperature variables, respectively. ϕ and α are the model coefficients for the temperature and irradiance.
η S T C , G S T C and T S T C denote the efficiency, irradiance and module temperature under standard test conditions. Equation (1) represents the first equation in the proposed model. The framework requires four independent equations to predict the four electrical parameters ( V o c , I s c , V m p , and I m p ) separately. In addition to Equation (1), which yields the product V m p and I m p as a function of irradiance and temperature, three other equations will be developed in this section.
To develop the second equation in the model, a new parameter β is defined as the ratio between the open-circuit voltage and the short-circuit current β = V o c I s c .
The parameter β , with units of ohms, represents the characteristic resistance of the PV module under given operating conditions. It is the ratio of the maximum open-circuit electromotive force to the maximum short-circuit current and, as such, encodes the fundamental electrical impedance scale of the module’s energy conversion process. Both V o c and I s c are universally reported in manufacturer datasheets and can be measured directly without parameter extraction, making β a practical and physically motivated scaling quantity. The parameter β was found to follow a power-law trend that remains approximately consistent across different PV modules. Based on this observation, the ratio between voltage and current can be expressed as
V m p I m p = a β b
where a and b are the second set of model coefficients determined during the model development process. The relationship in Equation (2) expresses that the operating impedance at any point on the I–V curve scales consistently with this characteristic resistance—a consequence of the fact that the same internal device parameters (photocurrent, saturation current, and series resistance) govern both β and the I–V curve shape.
The second dimensionless equation of the proposed model describes the relationship between the normalized parameter β r = β β S T C and the normalized environmental variables. Based on the dimensional analysis framework, this relationship can be expressed as
β r = τ c 1 γ c 2
where c 1 and c 2 are the model coefficients for the temperature and irradiance variables, respectively.
In order to extend the proposed model to predict the open-circuit voltage and short-circuit current, an additional dimensionless parameter F is introduced. The dimensionless parameter F, which is defined as F = V o c I s c G A , represents the ratio of the maximum theoretical electrical power of the module V o c I s c to the total incident solar power on the aperture area G A . As such, F is a dimensionless upper-bound conversion efficiency that encodes the photovoltaic effectiveness of the module independently of its physical size or absolute power rating. Unlike the fill factor, which describes losses between the theoretical maximum and the actual maximum power point, F captures the fundamental photon-to-voltage conversion quality of the device. The use of F as a π group in this framework is, therefore, physically motivated by the need to normalize electrical output by the available solar input in a dimensionally consistent manner.
Similar to the previous formulations, a relationship links the normalized parameter F r to the normalized environmental variables as follows
F r = τ d 1 γ d 2
where F r = F F S T C and d 1 , d 2 are the model coefficients for the temperature and irradiance variables, respectively.
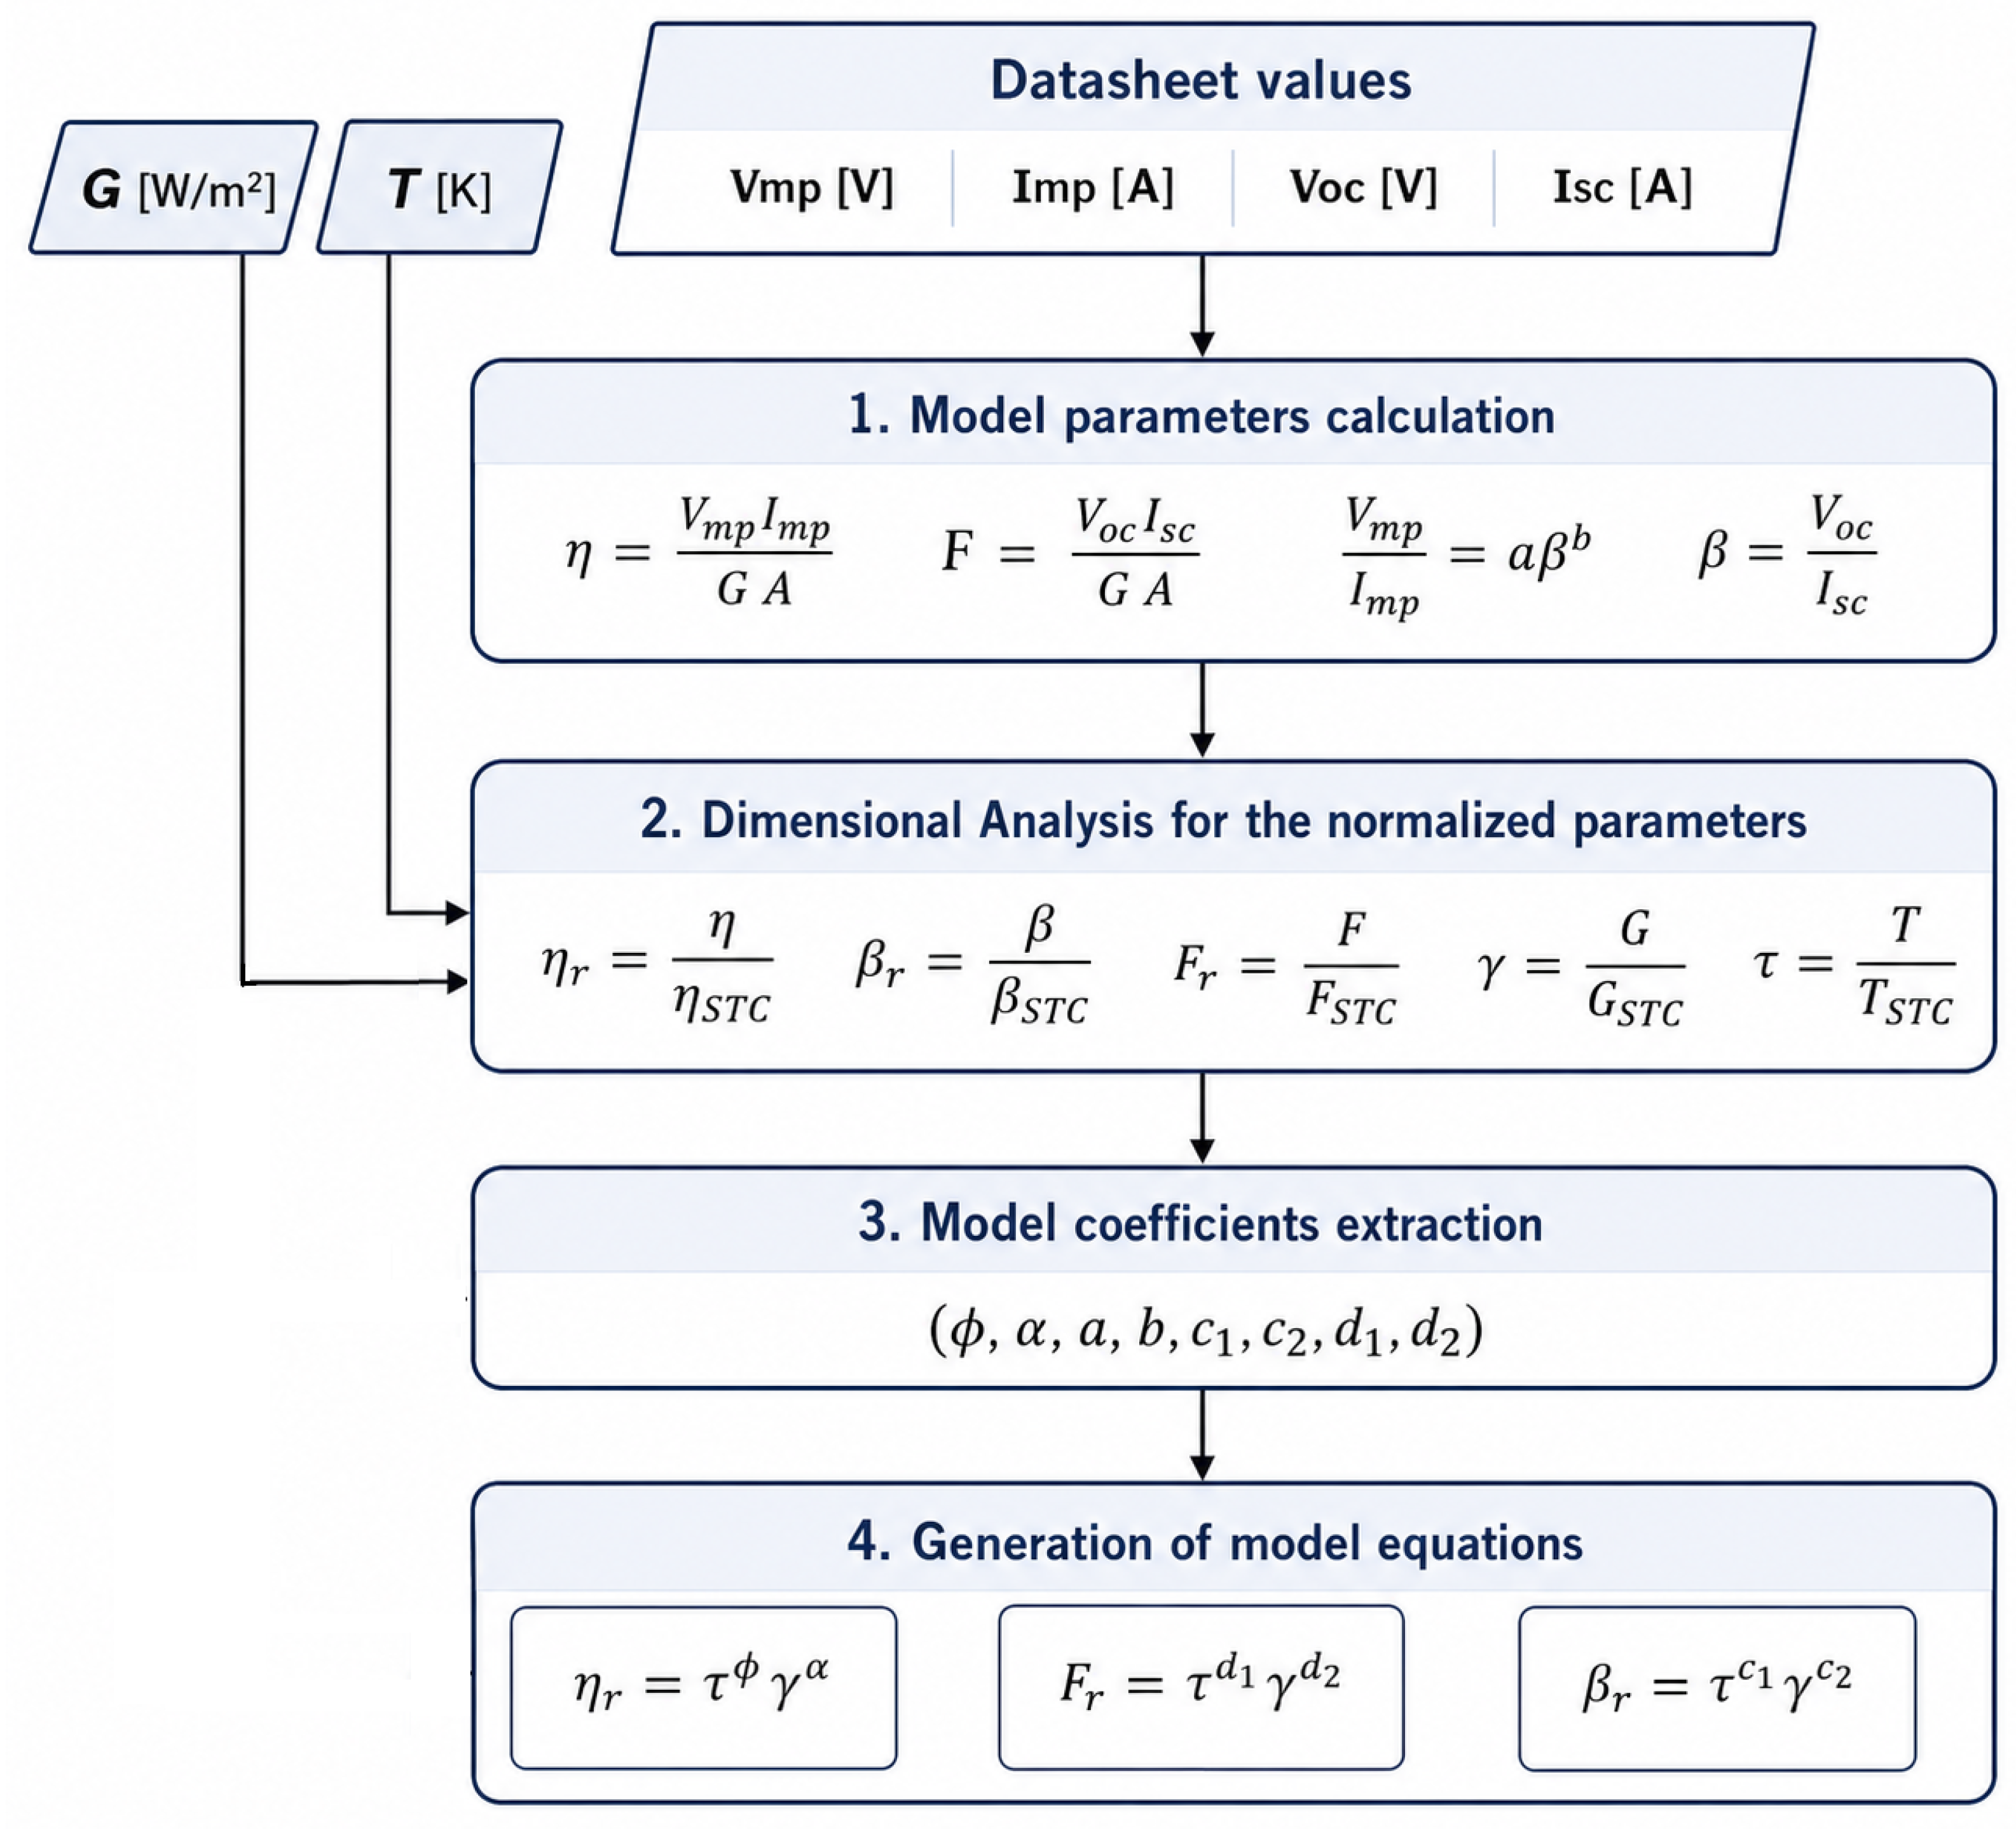
Φ , c 1 , d 1 are the model coefficients that represent the effect of temperature on PV module performance, while α , c 2 , d 2 represent the irradiance coefficients. The dimensionless relationships are summarized in Figure 1, which shows the structure of the proposed dimensionless model and the sequence used to derive the model equations.

2.4. PV Parameter Expressions

Using the derived dimensionless model equations, the electrical parameters can be obtained as functions of the normalized temperature and irradiance τ and γ .
The framework is structured as a complete algebraic system that extracts all four key electrical parameters ( V m p , I m p , V o c , I s c ) without iteration using the following equations:
V m p = a · V m S T C · I m S T C · ( V o c S T C I s c S T C ) b · τ ( ϕ + c 1 b ) / 2 · γ ( α + 1 + c 2 b ) / 2
I m p = 1 a V m S T C · I m S T C · ( I s c S T C V o c S T C ) b · τ ( ϕ c 1 b ) / 2 · γ ( α + 1 c 2 b ) / 2
V o c = V o c S T C · τ ( d 1 + c 1 ) / 2 γ ( d 2 + c 2 + 1 ) / 2
I s c = I s c S T C · τ ( d 1 c 1 ) / 2 γ ( d 2 c 2 + 1 ) / 2
This is a key practical advantage over the single-diode model, which requires solving an implicit transcendental equation iteratively, and over empirical models, which require separate regression fits for each output parameter independently.

2.5. Data Extraction

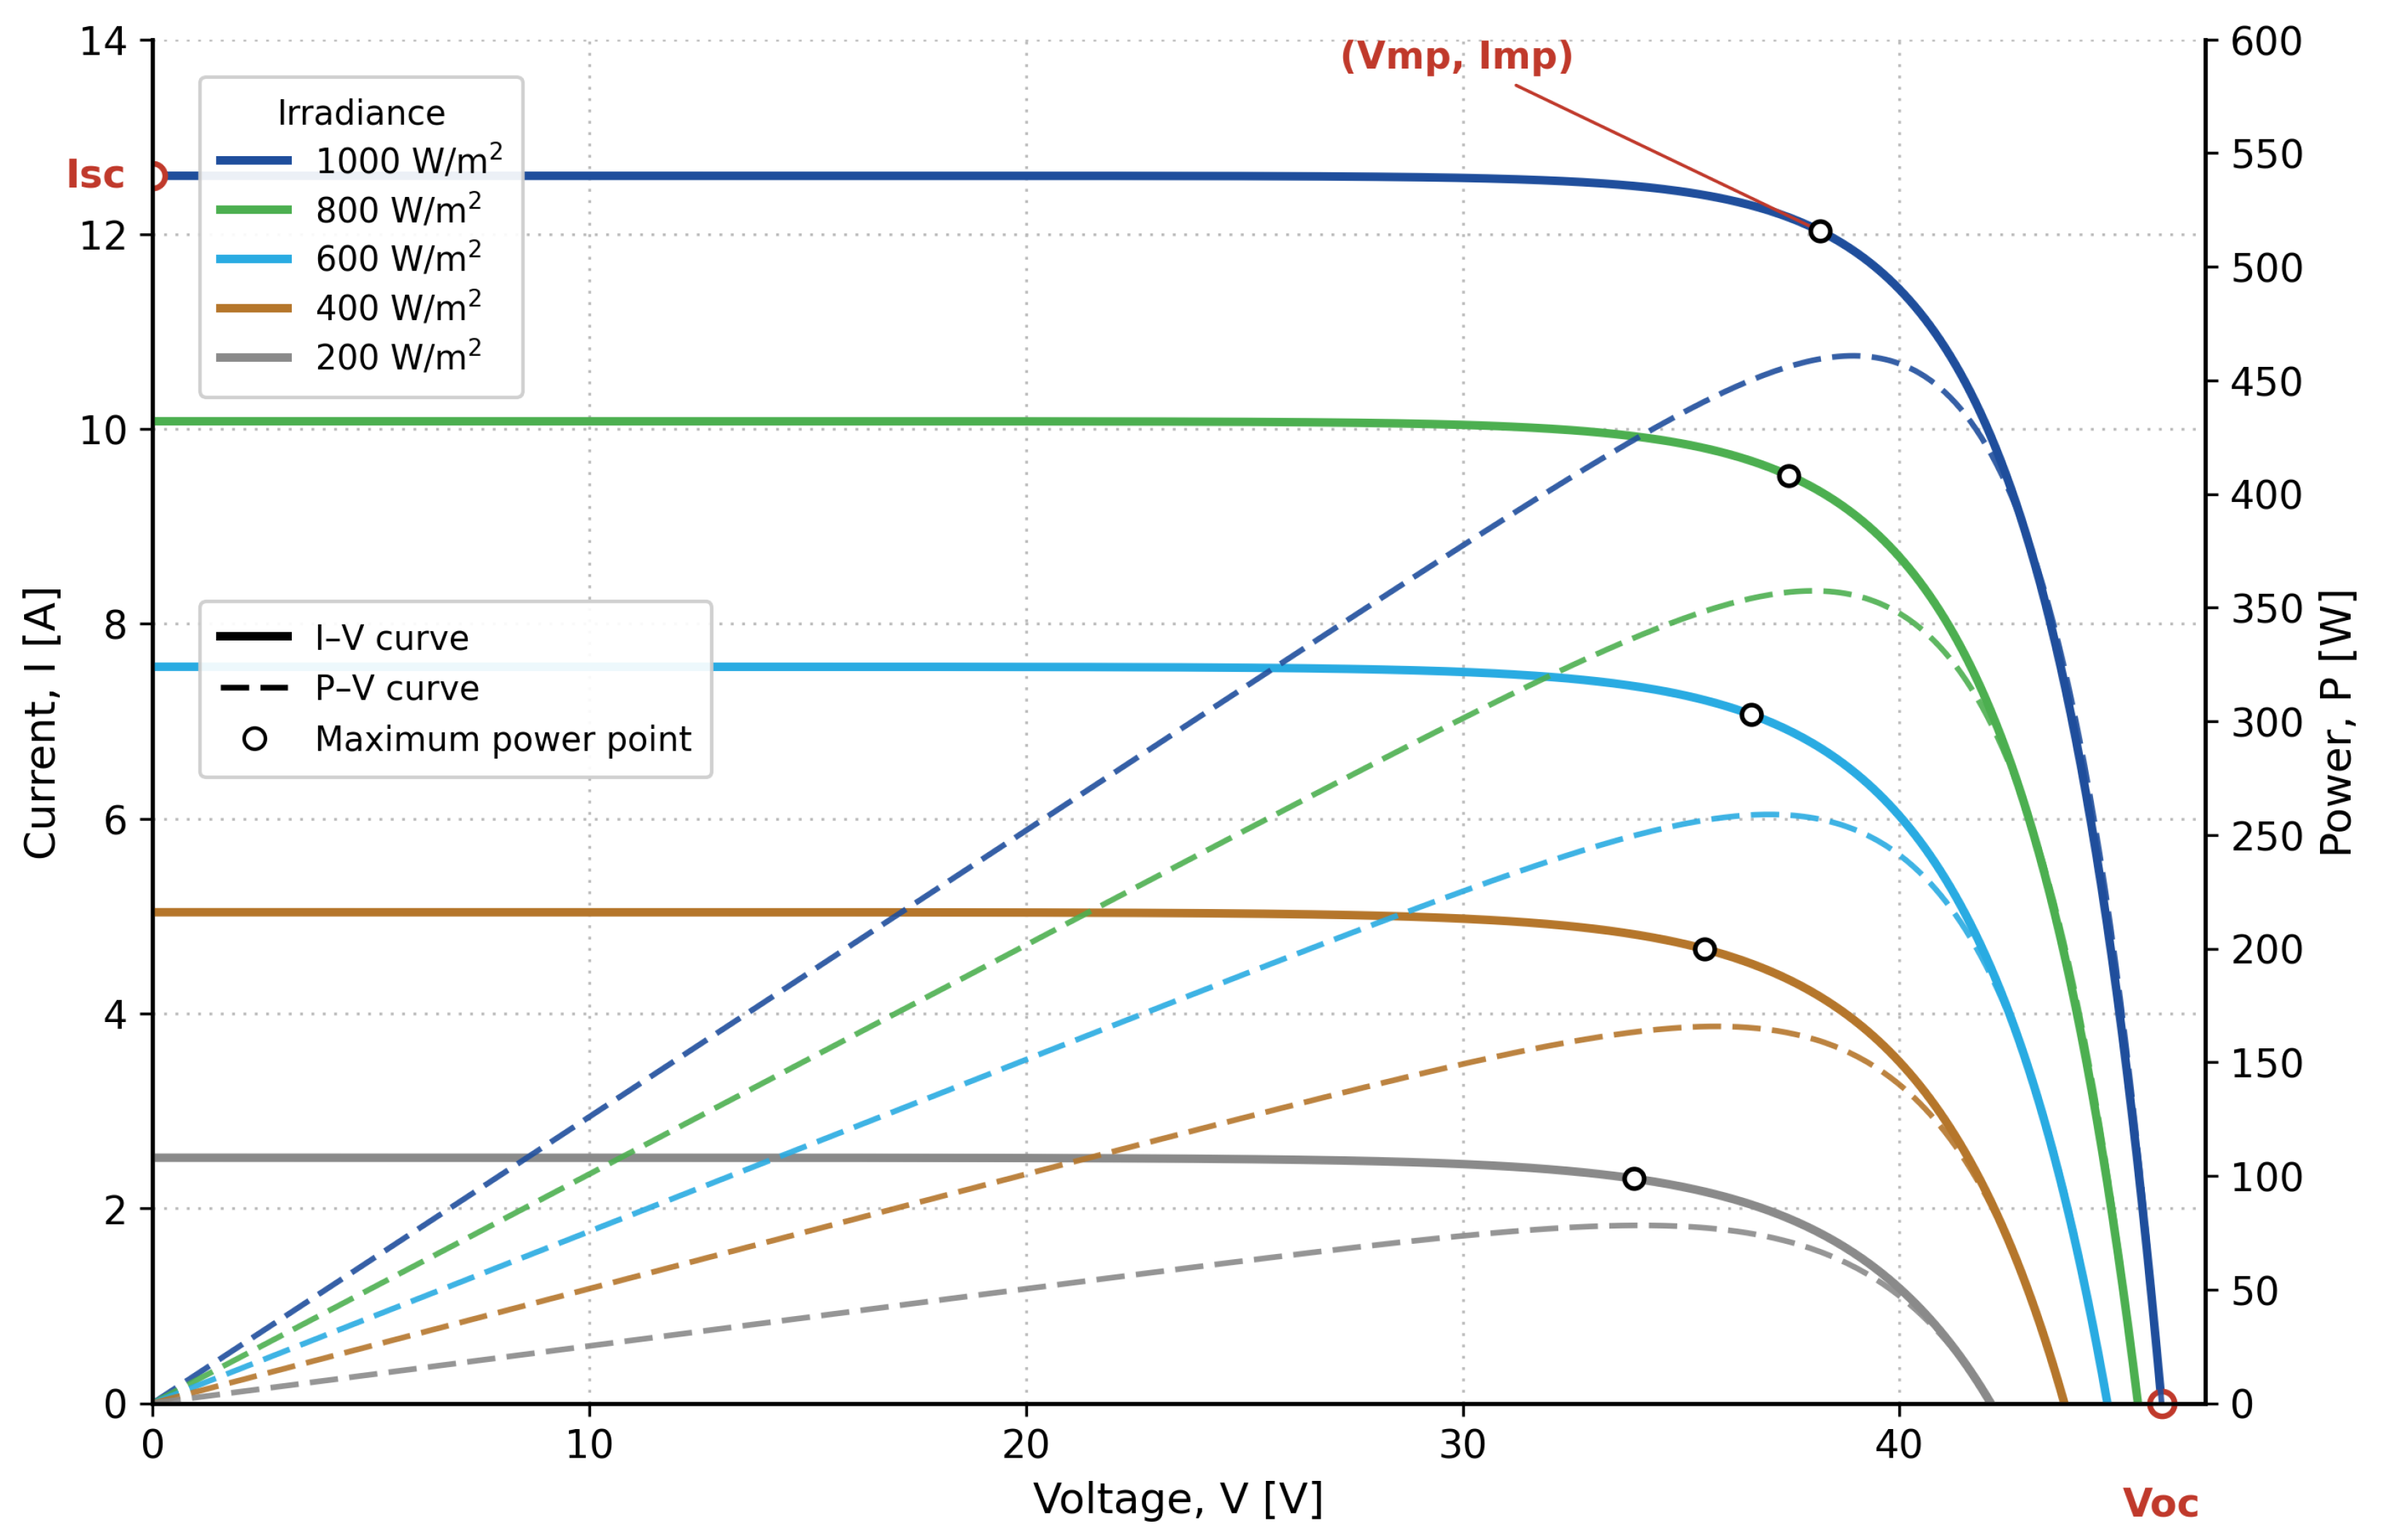
The I–V curves of the selected photovoltaic module (GCL-M10/72H) (GCL System Integration Technology Co., Ltd., Suzhou, Jiangsu, China) were digitized from the manufacturer’s datasheet using WebPlotDigitizer [20] (Version 4.7, Ankit Rohatgi, Austin, TX, USA). Key electrical parameters, including the short-circuit current ( I s c ), open-circuit voltage ( V o c ), and maximum power point ( V m p , I m p ), were extracted under different irradiance and temperature conditions, as illustrated in Figure 2.
The values of I s c , V o c , I m p , and V m p obtained from the digitized I–V curves under different environmental conditions are presented in Table 1. Using the extracted electrical parameters and equations from 1 to 8 from the previous section, the corresponding normalized parameters η r , β r , and F r were then determined. The calculated results are summarized in Table 2.

2.6. Coefficient Determination

Model coefficients ( ϕ , α , a , b , c 1 , c 2 , d 1 , d 2 ) were obtained by fitting the dimensionless relationships to the extracted dataset. The results are summarized in Table 2.

3. Model Validation

3.1. Validation Dataset

The proposed model was validated using experimental photovoltaic module datasets obtained from Sandia National Laboratories through the PV Performance Modeling Collaborative database [22], using a simplified method for predicting photovoltaic array output. These datasets contain detailed electrical measurements of 8 photovoltaic modules obtained under controlled laboratory conditions and are widely used for benchmarking photovoltaic performance models. The experimental measurements were conducted according to the procedures specified in IEC 61853-1, which defines a matrix of irradiance and temperature operating conditions for PV modules. The datasets include current–voltage (I–V) characteristics measured across irradiance levels typically ranging from 100 W/m2 to 1100 W/m2, and module temperatures varying approximately from 15 °C to 75 °C. For each module, the dataset includes 23 standardized operating points defined by the IEC 61853-1 test matrix, in addition to 17 supplementary measurement points provided at intermediate temperature conditions. In the present study, nine operating points were selected for extracting the coefficients of the proposed model. These points correspond to operating conditions that are commonly available in the manufacturers’ datasheet I–V curves, which represent the most accessible source of information for photovoltaic module modeling. The remaining 31 operating points were used exclusively for model validation to assess the predictive capability of the developed model over a wide range of irradiance and temperature conditions. The operating conditions used for model coefficient extraction and validation are summarized in Table 3. The extraction set includes operating points corresponding to typical manufacturer’s datasheet conditions, while the validation set covers a wide range of irradiance and temperature values.

3.2. Extracted Model Coefficients

Using the procedure described in Section 2, the model coefficients were extracted for each PV module using the selected operating points. The resulting coefficients for the eight modules considered in this study are summarized in Table 4. The photovoltaic modules listed in Table 4 are commercial products manufactured by the following companies: IT-360-SE72 (ET Solar Group Corp., Nanjing, China), Q.PLUS-G4.1-280 and Q.Peak-G4.1-300 (Q CELLS, Thalheim, Germany), VBHN325KA (Panasonic Corporation, Kadoma, Osaka, Japan), LG320N1K-A5 (LG Electronics Inc., Seoul, Republic of Korea), JKM260P (JinkoSolar Holding Co., Ltd., Shangrao, Jiangxi, China), CS6K-275M and CS6K-270P (Canadian Solar Inc., Guelph, ON, Canada). The module efficiencies are also included to facilitate future comparisons between module performance and the obtained coefficients. These coefficients were subsequently used to predict the electrical characteristics of the PV modules under the remaining operating conditions for validation purposes. The small variation observed in the extracted coefficients across the eight modules suggests that the proposed dimensional-analysis formulation captures the key relationships governing PV module behavior. This indicates that the model may be applied to different module technologies with limited parameter variability.
The irradiance coefficients α , c 2 , d 2 showed notably smaller deviations than the temperature coefficients Φ , c 1 , d 1 , indicating that material response is more sensitive to temperature variations than to irradiance. This aligns with early PV models such as [23], which disregarded irradiance effects. Additionally, excluding the HIT module would result in a lower standard deviation. Despite this variation, the overall dispersion of the coefficients remains limited across the analyzed modules.

3.3. Global Model Formulation

Based on the average values of the extracted coefficients reported in Table 4, the model equations can also be expressed in a global form using these mean coefficients. Substituting these mean coefficients into the model formulation yields the following simplified expressions:
V m p = 0.916 · V m p S T C · I m p S T C · V o c S T C I s c S T C · τ 1.24 · γ 0.026
I m p = 1.092 · V m p S T C · I m p S T C · I s c S T C V o c S T C · τ 0.121 · γ 1.006
V o c = V o c S T C · τ 0.987 γ 0.044
I s c = I s c S T C · τ 0.105 γ 1.001
These global expressions provide a simplified representation of the proposed model and may be useful for applications where module-specific calibration data are not available.

3.4. Applicability to Commercial PV Modules

To further evaluate the applicability of the proposed model using commonly available manufacturer information, the model coefficients were also extracted for eight additional commercial PV modules using datasheet electrical characteristics. The resulting coefficients are summarized in Table 5. The photovoltaic modules listed in Table 5 are commercial products manufactured by Suntech Power Co., Ltd. (Wuxi, Jiangsu, China), Panasonic Corporation (Kadoma, Osaka, Japan), Astronergy Co., Ltd. (Hangzhou, Zhejiang, China), LONGi Green Energy Technology Co., Ltd. (Xi’an, Shaanxi, China), BP Solar International Inc. (Frederick, MD, USA), Sharp Corporation (Sakai, Osaka, Japan), GCL System Integration Technology Co., Ltd. (Suzhou, Jiangsu, China), and JA Solar Technology Co., Ltd. (Beijing, China).
The average coefficients derived from the commercial module datasheets show good agreement with those obtained from the Sandia laboratory datasets. This consistency suggests that the proposed model coefficients can be reliably determined using commonly available manufacturer’s datasheet information.

4. Results

The prediction accuracy of the proposed model was evaluated using the normalized root mean square error (nRMSE) calculated for the 31 validation operating points described in Table 3. The normalized root mean square error (nRMSE), which quantifies the deviation between predicted and measured values over the validation dataset defined as
n R M S E = 1 N i = 1 N y p r e d , i y m e a s , i 2 y ¯ m e a s × 100
where the following applies:
y p r e d , i = predicted value from the model.
y m e a s , i = measured value.
N = number of validation points (31 points).
y ¯ m e a s = average of the measured values.
The nRMSE values were calculated for I s c , V o c , I m p , V m p , and P m p for each of the analyzed PV modules. The nRMSE values were computed for the predicted electrical parameters of each PV module using the 31 validation operating points spanning different irradiance and temperature conditions. The resulting nRMSE values for the eight PV modules are presented in Table 6.
Table 6 demonstrates very good agreement between the predicted and measured values across all PV modules and operating conditions considered in the validation dataset. These relatively low error values indicate that the proposed model is capable of accurately reproducing the electrical characteristics of PV modules over a wide range of irradiance and temperature conditions. Furthermore, consistent prediction accuracy is observed across modules based on different technologies, including monocrystalline, polycrystalline, and heterojunction (HIT) modules, confirming the robustness of the proposed dimensional-analysis formulation.
The statistical performance of the proposed dimensional-analysis-based framework was further evaluated using additional metrics, including the root mean square error (RMSE), Mean Absolute Error (MAE), Mean Bias Error (MBE), and the coefficient of determination ( R 2 ), averaged across all eight PV modules for each predicted electrical parameter. The results are summarized in Table 7. The framework achieves R 2 values exceeding 0.985 for all five parameters, with particularly high values observed for I m p ( R 2 = 0.9999), P m p ( R 2 = 0.9998), and I s c ( R 2 = 0.9992), confirming excellent linear agreement between predicted and measured values across the full irradiance and temperature operating range. The absolute RMSE values reflect the physical scale of each parameter: 0.809 V for V m p , 0.142 A for I m p , 0.493 V for V o c , 0.031 A for I s c , and 1.720 W for P m p . The MAE values are consistently lower than the corresponding RMSE values for all parameters, indicating the absence of large isolated prediction errors and confirming that residuals are distributed uniformly across the operating conditions rather than being dominated by outliers. The MBE values are small in magnitude for all parameters and alternate in sign—negative for V m p (−0.518 V) and P m p (−0.438 W) and positive for I m p (+0.047 A), V o c (+0.076 V) and I s c (+0.014 A)—indicating that no systematic directional bias is present across the full parameter set. The slight under-prediction of V m p and the corresponding slight over-prediction of I m p are physically consistent with the error compensation mechanism inherent to the proposed framework, whereby the V/I scaling constraint introduces a negative correlation between V m p and I m p prediction errors, resulting in partial cancellation of individual errors in their product P m p . This behavior explains the lower prediction error observed for P m p relative to V m p and I m p individually, as discussed further in Section 5. The complete per-module statistical metrics for all five predicted parameters. Detailed per-module statistical performance metrics for all five predicted electrical parameters across all eight PV modules are presented in Appendix A.
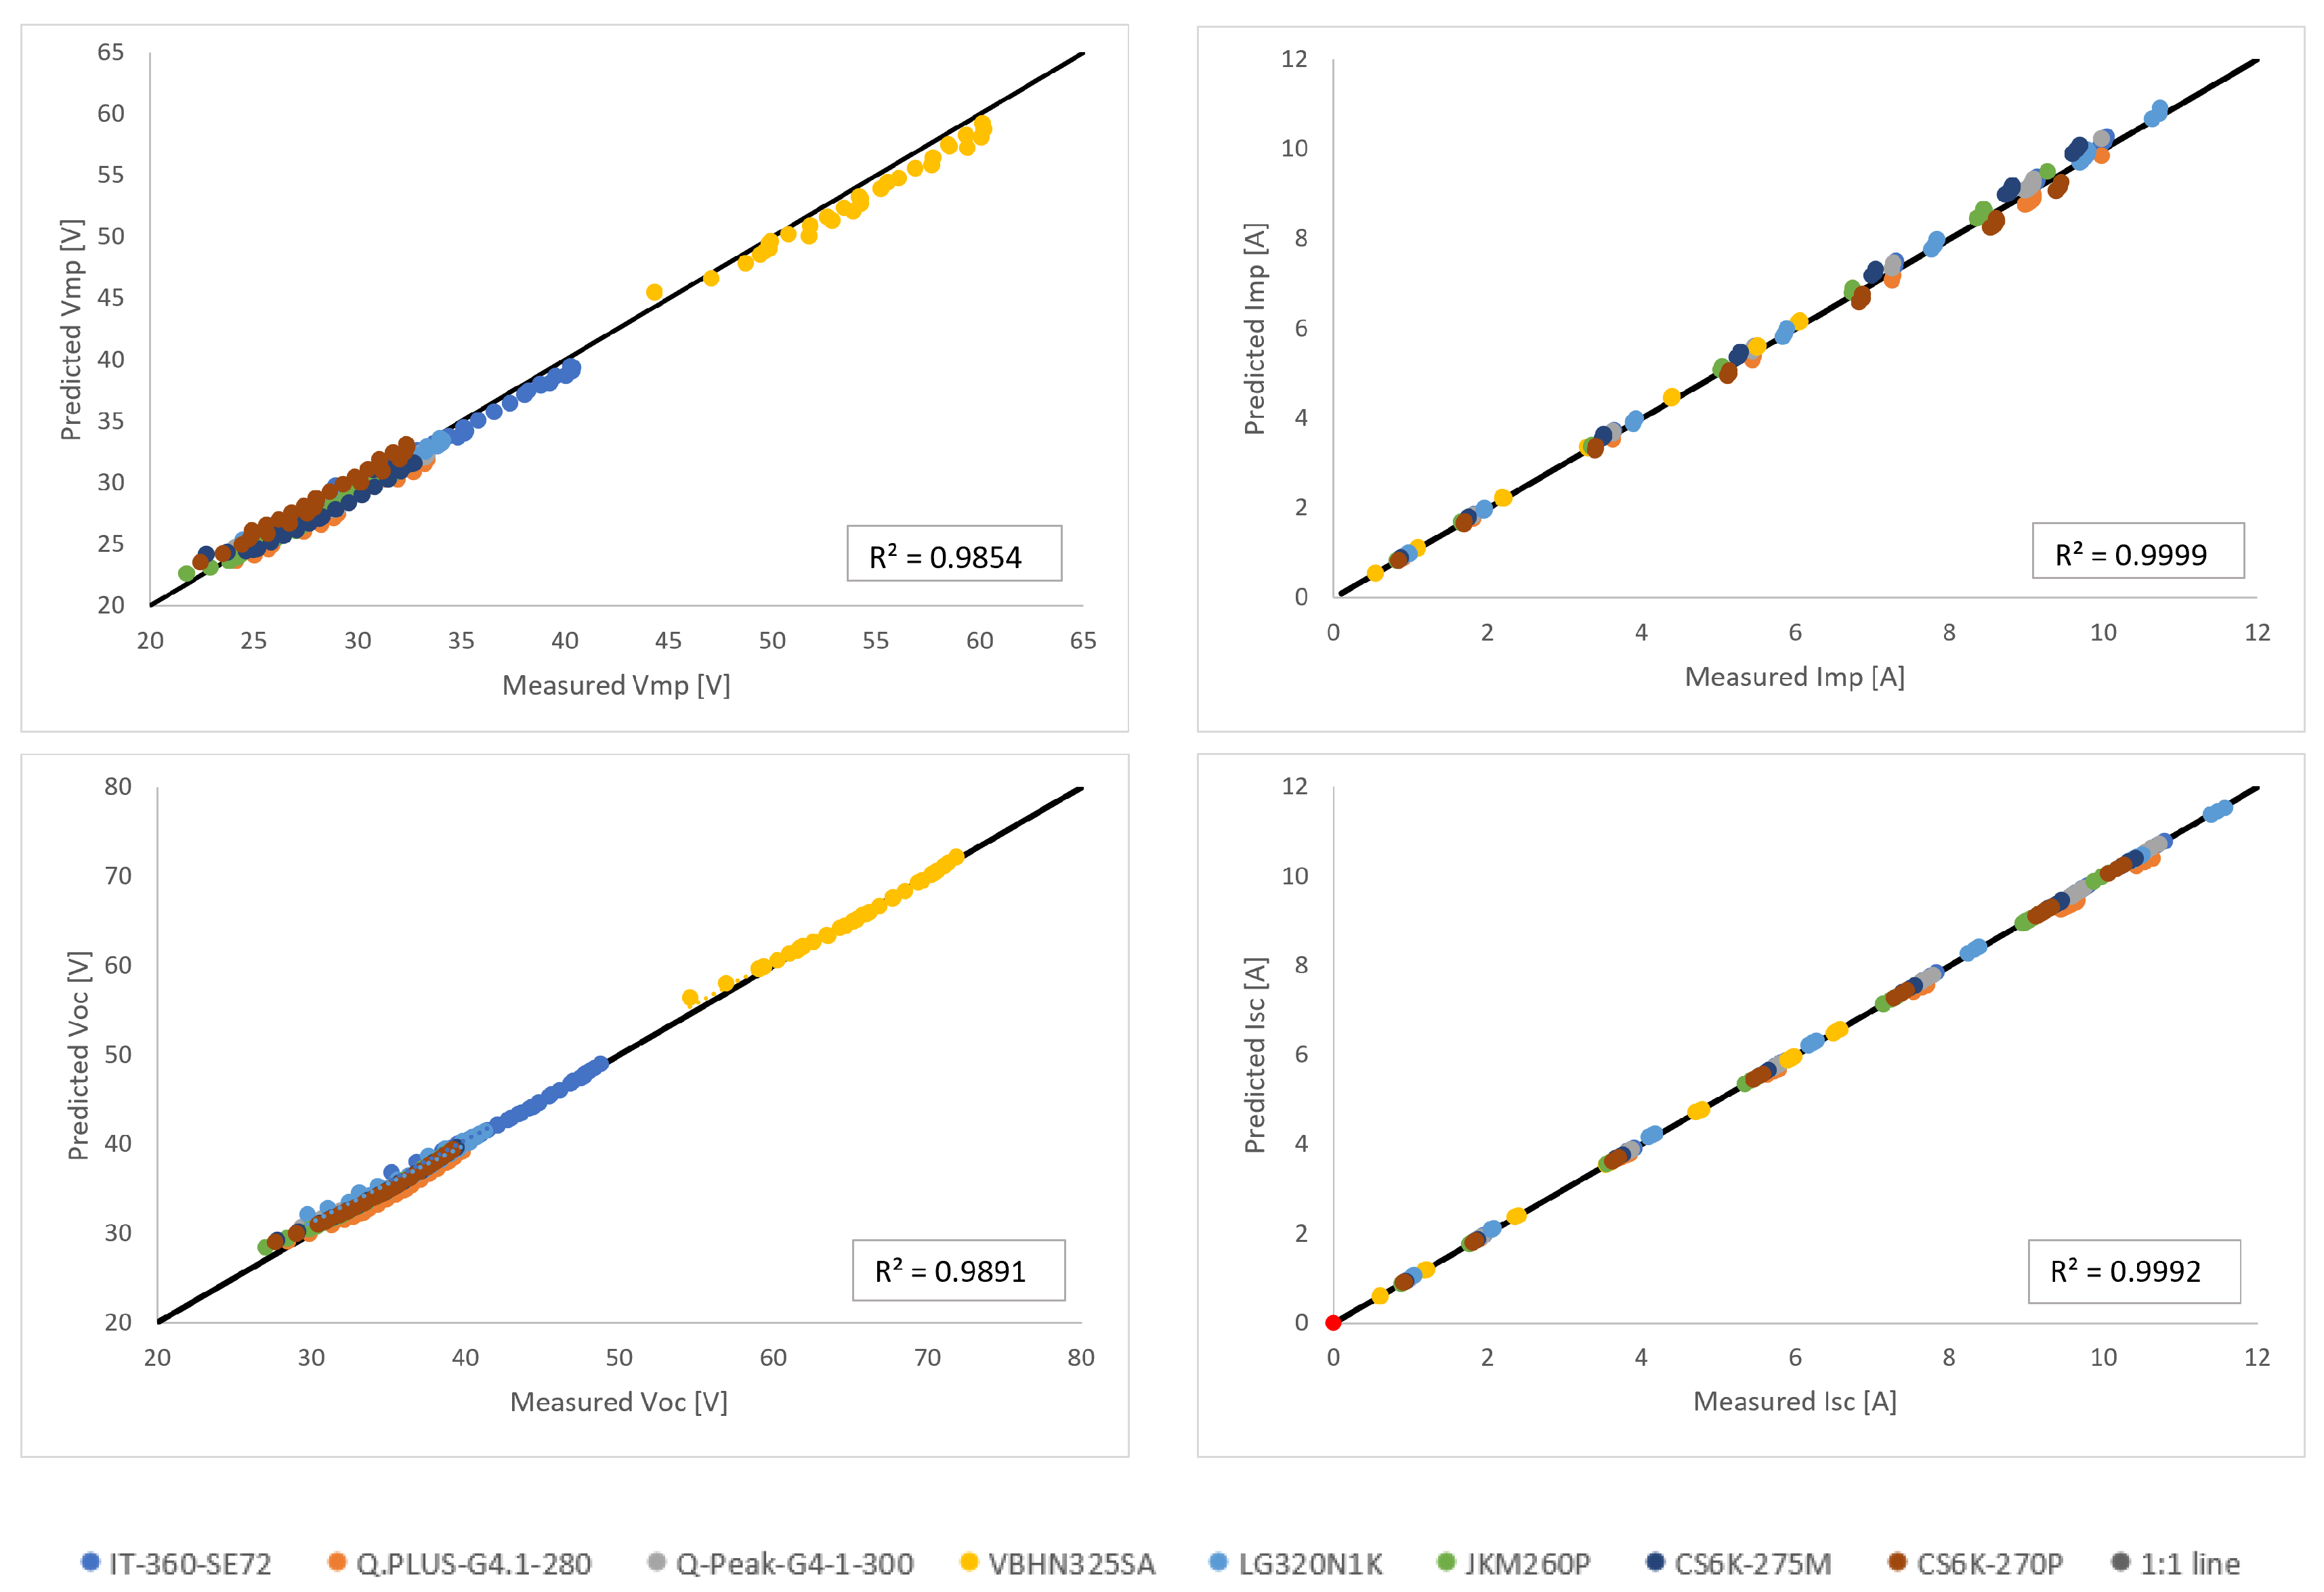
Figure 3 presents parity plots comparing predicted and measured values of V m p , I m p , V o c , and I s c across all eight PV modules and all validation test points, with data points color-coded by module to allow visual assessment of cross-technology consistency. The data points for all modules cluster tightly along the 1:1 perfect prediction line in all four subplots, confirming that the proposed DA-based framework reproduces the measured electrical characteristics accurately across the full irradiance and temperature operating range of the Sandia indoor characterization dataset. The coefficient of determination values ( R 2 = 0.9854, 0.9999, 0.9891, and 0.9992 for V m p , I m p , V o c , and I s c respectively) confirm excellent linear agreement between predicted and measured values for all four parameters. The highest R 2 is observed for I m p (0.9999) and I s c (0.9992), indicating that the current-related parameters are predicted with particularly high fidelity—consistent with the low average nRMSE values of 2.260% and 0.454% reported for these parameters in Table 6. The slightly lower R 2 for V m p (0.9854) reflects the higher inter-module variability in voltage at the maximum power point, which is sensitive to the series resistance and fill factor characteristics of each individual module. No systematic technology-dependent deviation is observed in any of the four subplots—the data points from monocrystalline (IT-360-SE72, LG320N1K, Q-Peak-G4-1-300, CS6K-275M), polycrystalline (Q.PLUS-G4.1-280, JKM260P, CS6K-270P), and HIT (VBHN325SA) modules are uniformly distributed around the 1:1 line without clustering above or below it for any specific technology class. This confirms that the dimensionless groups β and F successfully normalize the technology-dependent differences in absolute electrical parameter values, allowing the same functional relationships to describe all three technology classes with consistent accuracy.
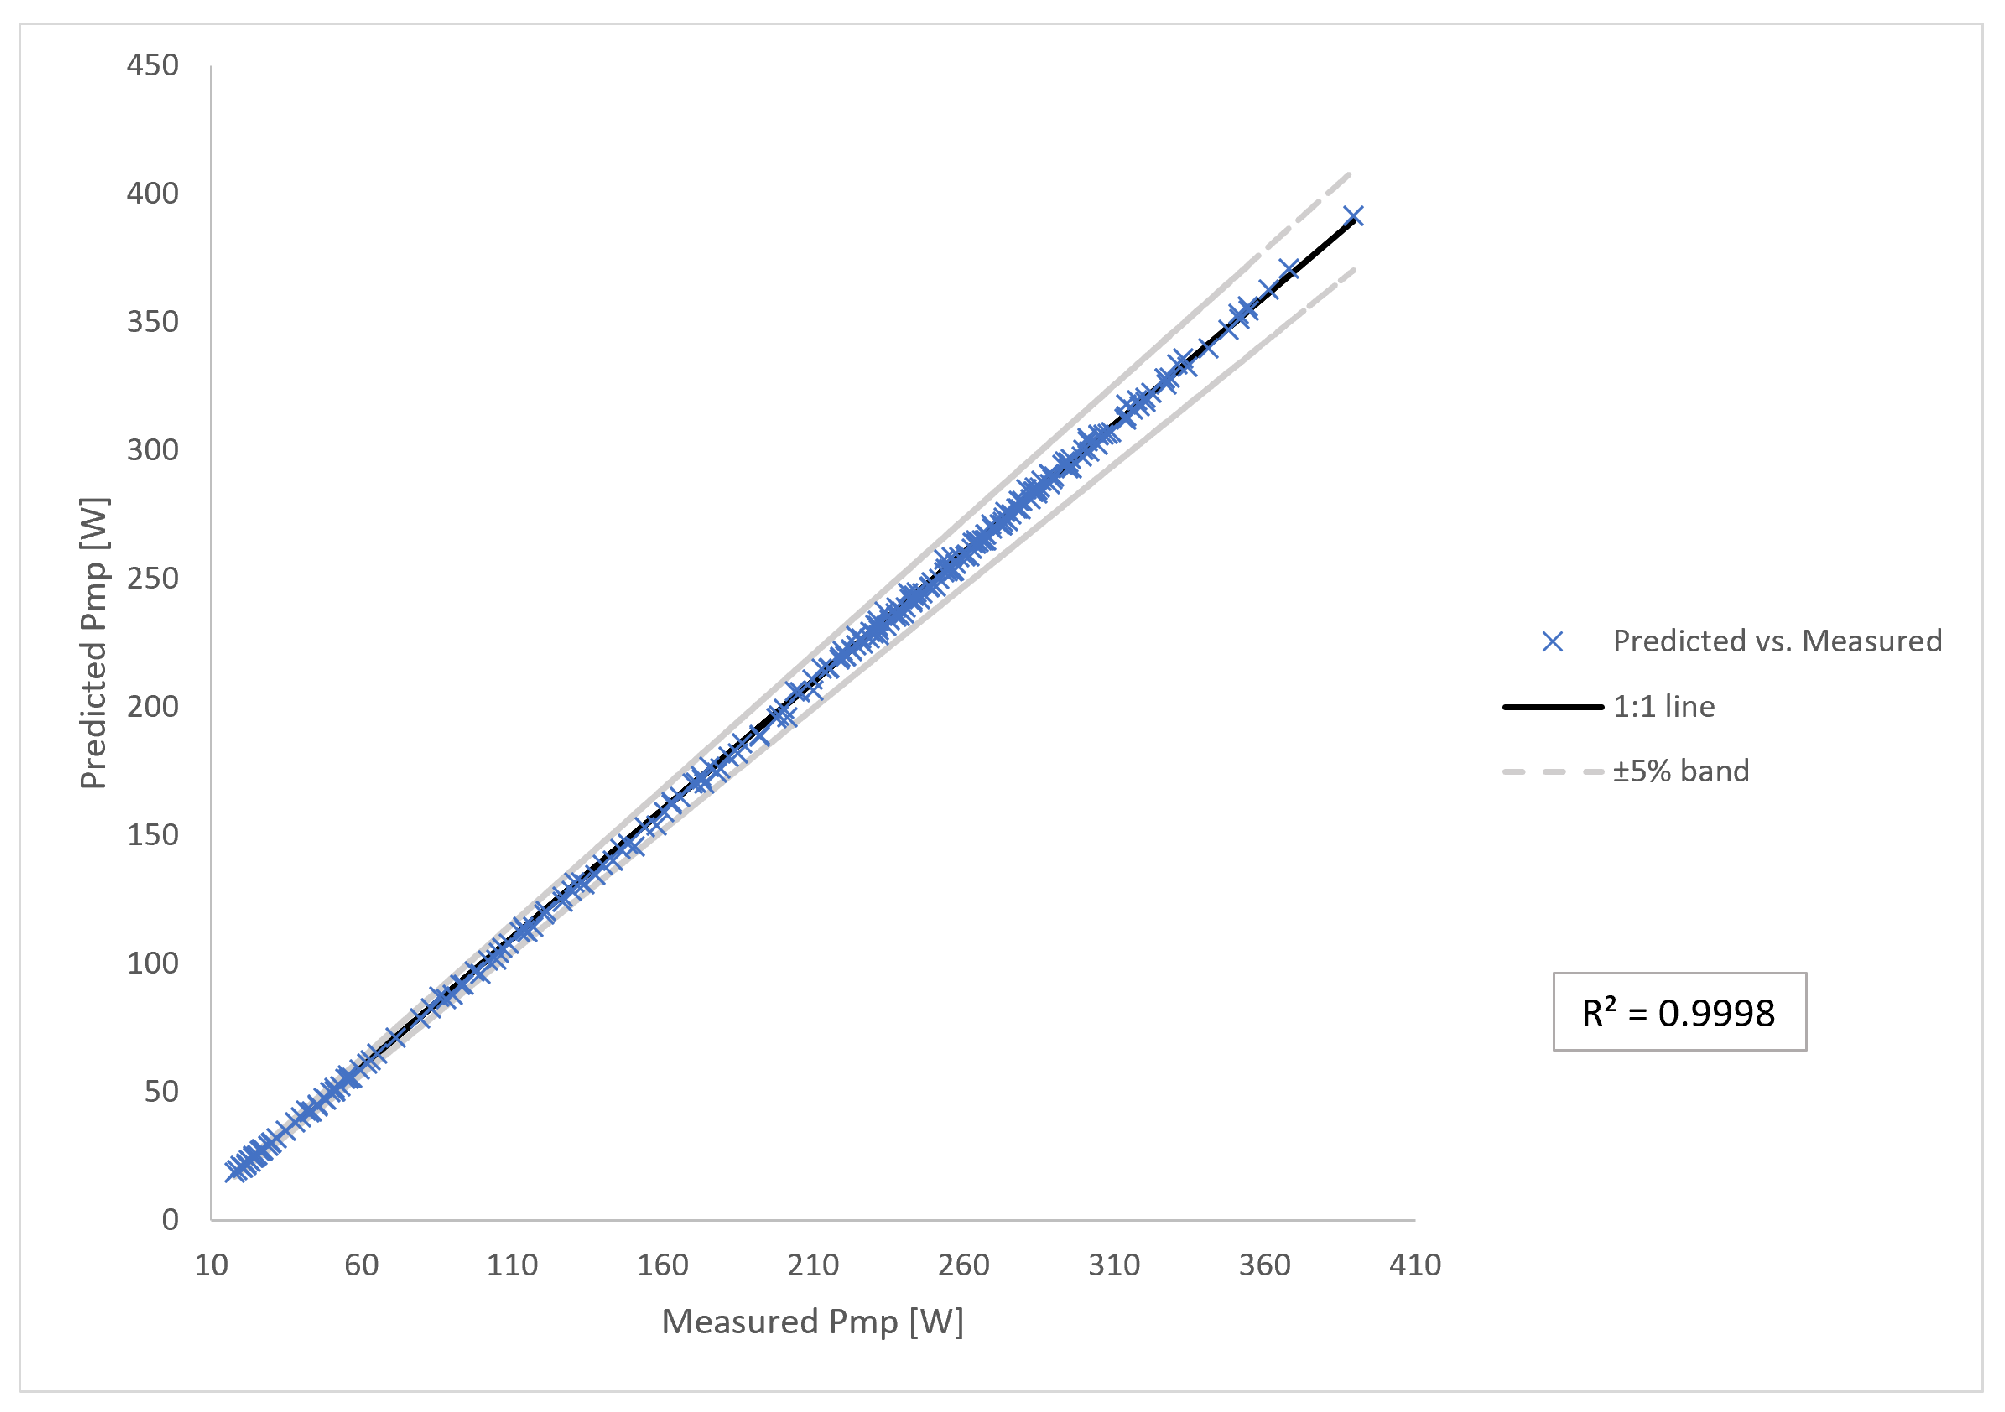
Figure 4 presents the parity plot of predicted versus measured P m p values across all eight modules and all 248 validation test points, further confirming the strong agreement between predicted and measured values reported in Table 7.
To assess the applicability of the proposed framework to PV modules not included in the calibration dataset, a leave-one-out cross-validation analysis was performed for the monocrystalline and polycrystalline technology classes. For each held-out module, technology-averaged coefficients derived from the remaining modules of the same technology class were used to predict V m p , I m p , and P m p across all validation test points. The results are presented in Table 8, where module-specific nRMSE values are compared against those obtained using technology-averaged (generic) coefficients. The generic model produces nRMSE values for V m p ranging from 0.23% to 3.01% across the seven tested modules, and for I m p , the values range from 1.30% to 3.94%, representing a moderate increase relative to the module-specific results, as expected when individual calibration coefficients are replaced by technology-class averages. The largest increase is observed for I m p of the Q.PLUS-G4.1-280 module (3.94%), which may reflect the greater inter-module variability within the polycrystalline technology class compared to monocrystalline silicon. Notably, the generic nRMSE values for P m p remain below 1.51% for all tested modules, and, in several cases, are lower than the corresponding module-specific values. This behavior is consistent with the known bias-variance trade-off in model fitting: averaging coefficients across multiple modules reduces overfitting to module-specific measurement noise present in individual calibration datasets, resulting in improved generalization performance for P m p prediction. The average generic nRMSE for P m p is 0.918% for monocrystalline modules and 1.104% for polycrystalline modules, both well within the accuracy range reported for established PV performance models in the literature (see Section 5). The HIT technology class is represented by a single module (VBHN325SA) in this study, which is insufficient for leave-one-out averaging; generic coefficients for HIT modules, therefore, could not be evaluated and are reported as N/A in Table 8. These results demonstrate that the proposed framework can be applied to any monocrystalline or polycrystalline silicon module of known technology class using only standard test condition datasheet values as inputs, without requiring module-specific calibration measurements. A set of technology-averaged coefficients for direct use with untested modules is provided in Table 9.

5. Discussion

5.1. Interpretation of Model Coefficients

The proposed framework is governed by three equations, each containing two coefficients representing the scaling exponents of normalized temperature τ = ( T + 273 ) / ( T r e f + 273 ) and normalized irradiance γ = G / G s t c . The physical interpretation of these coefficients provides insight into how the model captures the irradiance and temperature dependence of PV module electrical behavior.

5.1.1. Coefficients of the Normalized Efficiency Equation ( η r = τ Φ · γ α )

The normalized module efficiency η = P m p / ( G A ) describes how efficiently the module converts incident solar power to electrical output relative to its performance at standard test conditions. As illustrated in Table 9, the temperature exponent Φ takes averaged values of 1.3905 (Mono) and 1.4433 (Poly), confirming the well-established negative temperature dependence of PV module efficiency: as temperature increases above the STC reference, the normalized efficiency decreases, consistent with the known reduction in open-circuit voltage with increasing temperature in crystalline silicon devices. The magnitude of Φ is greater than unity in absolute value for both technology classes, indicating that efficiency is more sensitive to temperature than a simple linear relationship would suggest. The irradiance exponent α is small and positive for both technology classes (0.0223 for Mono; 0.0411 for Poly), reflecting the weak positive dependence of module efficiency on irradiance—a consequence of the logarithmic increase in V o c with irradiance, which slightly improves conversion efficiency at higher irradiance levels. The consistently small values of α across both technology classes confirm that irradiance has a secondary effect on efficiency compared to temperature, which is physically expected for crystalline silicon modules operating within their normal irradiance range.

5.1.2. Coefficients of the Normalized Characteristic Resistance Equation ( β r = τ c 1 · γ c 2 )

The normalized characteristic resistance β r = β / β s t c captures the variation of the module’s intrinsic electrical impedance scale with operating conditions. The temperature exponent c 1 takes values of 1.091 (Mono) and 1.164 (Poly), reflecting the decrease of β = V o c / I s c with increasing temperature. This behavior is physically consistent: V o c decreases significantly with temperature due to increased dark saturation current, while I s c increases only weakly, resulting in a net decrease in their ratio β with temperature. The magnitude of c 1 being close to unity indicates an approximately power-law scaling of β r with normalized temperature, consistent with the known near-linear temperature coefficient of V o c in crystalline silicon. The irradiance exponent c 2 takes values of 0.958 (Mono) and 0.956 (Poly)—remarkably consistent across the two technology classes—and reflects the decrease in β with increasing irradiance. Although V o c increases logarithmically with irradiance, I s c increases approximately linearly, causing their ratio β to decrease with increasing irradiance. The value of c 2 close to 1 is physically meaningful: since I s c G and V o c ln ( G ) , the ratio β = V o c / I s c scales approximately as ln ( G ) / G , which, in the power-law approximation within the operating range, yields an exponent close to 1 .

5.1.3. Coefficients of the Normalized Conversion Effectiveness Equation ( F r = τ d 1 · γ d 2 )

The normalized conversion effectiveness F r = F / F s t c describes how the upper-bound dimensionless efficiency of the module varies with operating conditions. The temperature exponent d 1 takes values of 0.8825 (Mono) and 0.9323 (Poly), confirming the negative temperature dependence of F = V o c I s c / ( G A ) . Since I s c increases only weakly with temperature while V o c decreases significantly, their product V o c · I s c decreases with temperature, causing F r to decrease—as captured by the negative sign of d 1 . The irradiance exponent d 2 is small and positive (0.0417 for Mono; 0.0514 for Poly), indicating a weak positive dependence of F r on irradiance. This is physically consistent with the logarithmic increase in V o c with irradiance: as G increases, V o c increases slightly, while I s c increases proportionally, causing their product V o c · I s c to increase slightly faster than G · A and resulting in a small positive irradiance exponent for F r .

5.1.4. Cross-Technology Consistency of Coefficients

A key observation is the strong consistency of the irradiance exponents across the monocrystalline and polycrystalline technology classes. The values of c 2 ( 0.958 vs. 0.956 ), α (0.022 vs. 0.041), and d 2 (0.042 vs. 0.051) show negligible variation between the two technology classes, supporting the theoretical expectation that irradiance scaling is governed primarily by the photogeneration process—a physical mechanism common to all crystalline silicon technologies. The temperature exponents show slightly greater variability between technology classes, particularly for Φ ( 1.3905 vs. 1.4433 ) and d 1 ( 0.8825 vs. 0.9323 ), which is physically expected given that temperature sensitivity is governed by recombination mechanisms and minority carrier lifetime—properties that differ between monocrystalline and polycrystalline silicon due to grain boundary effects and differences in bulk material quality. The irradiance and temperature sensitivities implied by the model coefficients are consistent with the known physical behavior of crystalline silicon PV modules across their normal operating range (100–1100 W / m 2 ; 15– 75   ° C ), as confirmed by the low nRMSE values reported in Table 6 and the tight clustering of predicted values along the 1:1 line in Figure 3 and Figure 4. The behavior of the model outside this validated range—particularly at temperatures below 0   ° C and above 75   ° C —is discussed in Section 5.5.

5.2. Technology-Dependent Behavior

The proposed framework demonstrates consistent predictive accuracy across the three PV technology classes examined in this study—monocrystalline silicon (Mono), polycrystalline silicon (Poly), and heterojunction with an intrinsic thin layer (HIT). As discussed in Section 5.1, the irradiance exponents show negligible variation across technology classes, while the temperature exponents exhibit modest but physically interpretable differences reflecting the distinct recombination mechanisms of each technology. Despite these coefficient differences, the average nRMSE values remain within a narrow range across all three technology classes (Table 6), confirming that the dimensional analysis framework captures the essential physics of crystalline silicon PV performance in a technology-independent mathematical structure. The leave-one-out cross-validation results presented in Table 8 further demonstrate that technology-averaged coefficients maintain engineering-grade accuracy for untested modules within the same technology class, with generic nRMSE values for P m p remaining below 1.51% for all tested modules. This cross-technology robustness is a theoretical consequence of the dimensional homogeneity of the framework: by expressing the governing relationships in terms of dimensionless groups η r , β r and F r that normalize the electrical parameters by physically appropriate scales, the correlations become invariant to module size, power rating, and technology-specific absolute parameter values. The HIT module (VBHN325SA) exhibits the highest V o c values and correspondingly distinct β values among the eight modules, reflecting its superior open-circuit voltage performance arising from the amorphous silicon passivation layers that suppress surface recombination. Despite this, the framework achieves nRMSE values comparable to those of the monocrystalline and polycrystalline modules for this technology class, suggesting that the dimensionless normalization effectively accommodates the higher voltage characteristics of HIT devices within the same functional relationships. The framework has not been validated for thin-film technologies (CdTe and CIGS) or emerging technologies (perovskite), which exhibit fundamentally different bandgap energies and recombination mechanisms; this represents a boundary condition of the current study and is addressed further in Section 5.5.

5.3. Comparison with Published Literature and Alternative Modeling Approaches

The limited variability of model coefficients across the three PV technologies examined (monocrystalline, polycrystalline, and HIT) provides empirical support for the theoretical expectation that dimensionless correlations derived through the Buckingham π theorem should exhibit cross-technology generalizability. A conventional empirical model fitted to raw (G, T) data would be expected to require distinct sets of coefficients for each technology; the relative consistency observed here suggests that the dimensionless groups identified through dimensional analysis capture the essential physics of energy conversion in a technology-independent manner. Table 10 summarizes the key distinctions between the proposed DA-based framework and the two principal alternative modeling approaches considered in the literature.
Table 11 further compares the nRMSE (%) achieved by the proposed DA-based framework against values reported in the recent peer-reviewed literature for established PV performance models. The comparison focuses on P m p , V o c , and I s c —the three parameters for which published nRMSE values are available in the literature for equivalent circuit and empirical models under comparable validation conditions.
Zaimi et al. [11] validated both the Power-Law Model (PLM) and the Single-Diode Model (SDM) on experimental data for 22 PV modules from NREL, reporting that nRMSE values for maximum power prediction did not exceed 4% for either model across all tested module technologies. Benahmida et al. [12] achieved an nRMSE below 0.92% for P m p using an optimized analytical model validated on three NREL modules spanning monocrystalline, polycrystalline, and HIT technologies. Bartholomäus et al. [24] reported nRMSE values of 9.30–9.76% for P m p , 8.27–8.50% for I s c , and 1.62–3.08% for V o c across the De Soto, CEC/SDM, and PVsyst models applied to eight bifacial modules measured outdoors over a full year in Denmark. The proposed DA-based framework achieves an average nRMSE of 0.880% for P m p , 0.454% for I s c , and 1.287% for V o c across eight commercial modules spanning monocrystalline, polycrystalline, and HIT technologies. For P m p , the proposed framework matches the accuracy of the most accurate published analytical model [12] (0.880% vs. 0.92%) while simultaneously predicting all five electrical parameters ( V m p , I m p , V o c , I s c , and P m p ) from a single consistent set of dimensionless equations—a capability not demonstrated by any of the referenced models. For I s c , the proposed framework achieves a substantially lower nRMSE (0.454%) compared to the equivalent circuit models reported by Bartholomäus et al. [24] (8.27–8.50%), representing an improvement of more than an order of magnitude. For V o c , the proposed framework (1.287%) compares favorably with the CEC/SDM (1.62%) and PVsyst (1.70%) models, and it outperforms the De Soto model (3.08%). It should be acknowledged that this comparison is indirect: the referenced studies used outdoor measurement datasets under real operating conditions, while the present work employs the Sandia indoor characterization dataset under controlled irradiance and temperature conditions. Outdoor validation introduces additional sources of variability—including spectral effects, angle-of-incidence losses, soiling, and thermal transients—that are absent in the controlled indoor environment used here. These factors typically increase prediction errors for all models, suggesting that the performance advantage of the proposed framework demonstrated under controlled conditions may be partially reduced under outdoor operating conditions. A direct head-to-head comparison on a shared outdoor dataset is, therefore, recommended as a priority for future work and has been noted in Section 6.

5.4. Error Analysis

The predictive accuracy of the proposed framework is comprehensively assessed through multiple statistical metrics reported in Section 4. The parity plot (Figure 4) confirms that all 248 predicted P m p values fall within the ±5% error band, with R 2 = 0.9998, while Figure 3 demonstrates consistent agreement between predicted and measured values for V m p , I m p , V o c , and I s c across all three technology classes. The additional statistical metrics reported in Table 7—RMSE, MAE, MBE, and R 2 —confirm the absence of systematic directional bias across all five predicted parameters, as evidenced by the small magnitude and alternating signs of the MBE values. The consistently high R 2 values (exceeding 0.985 for all parameters) and the MAE values (being lower than the corresponding RMSE values for all parameters) confirm that prediction errors are uniformly distributed across the operating range without large isolated outliers. The complete per-module breakdown of all statistical metrics is provided in Table A1 and Table A2 of Appendix A.

5.5. Limitations and Future Work

While the proposed dimensional-analysis-based framework demonstrates strong predictive accuracy across the eight PV modules and three technology classes examined in this study, several limitations should be explicitly acknowledged to define the boundary conditions of the current work and guide future research directions.

5.5.1. Validation Scope—Indoor Dataset Only

All validation data were obtained from the Sandia National Laboratories indoor characterization dataset under controlled irradiance and temperature conditions following the IEC 61853-1 measurement protocol. The controlled indoor environment eliminates confounding factors present in real outdoor operation—including spectral variation, angle-of-incidence effects, soiling, wind-induced cooling, and thermal transients—which are known to introduce additional sources of variability in PV module performance. The accuracy advantage demonstrated by the proposed framework under controlled conditions may, therefore, be partially reduced under real outdoor operating conditions, where these secondary effects contribute to prediction uncertainty. Outdoor validation across a range of climatic conditions and installation types is recommended as a priority for future work.

5.5.2. Technology Scope—Crystalline Silicon Only

The framework has been validated exclusively for crystalline silicon PV technologies—monocrystalline silicon, polycrystalline silicon, and heterojunction with an intrinsic thin layer (HIT). These three technology classes share the same semiconductor material and broadly similar device architecture, which underlies the cross-technology consistency of the dimensionless correlations demonstrated in this study. The framework has not been validated for thin-film technologies (CdTe and CIGS) or emerging technologies (perovskite and organic PV), which exhibit fundamentally different bandgap energies, recombination mechanisms, and temperature sensitivities. The application of the framework to these technology classes would require re-derivation of the dimensionless groups and re-validation of the scaling relationships; this is recommended as a direction for future work.

5.5.3. Temperature Range

The validation dataset covers a temperature range of 15   ° C to 75   ° C , corresponding to the standard IEC 61853-1 characterization matrix used in the Sandia indoor dataset. The behavior of the proposed framework outside this validated range—particularly at sub-zero temperatures encountered in cold-climate installations and at temperatures above 75   ° C encountered in desert or concentrated irradiance conditions—has not been established. At sub-zero temperatures, increased series resistance and reduced carrier mobility may alter the scaling behavior of the dimensionless groups in ways not captured by the current power-law relationships. At high temperatures above 75   ° C , accelerated recombination and potential encapsulant degradation may introduce additional performance losses outside the scope of the model. Extension of the validation to these extreme temperature regimes is recommended for applications in cold-climate and desert environments.

5.5.4. HIT Technology Class Representation

The HIT technology class is represented by a single module (VBHN325SA) in the current study, which is insufficient for robust statistical characterization of cross-module coefficient variability within this technology class. As a consequence, the leave-one-out cross-validation analysis demonstrating generic model applicability (Table 8) could not be performed for HIT modules, and technology-averaged coefficients for HIT devices are not reported. A minimum of three to five HIT modules would be required for a meaningful generalization study within this technology class. This limitation does not affect the module-specific validation results for VBHN325SA, which demonstrate comparable accuracy to the monocrystalline and polycrystalline modules.

5.5.5. Indirect Nature of Literature Benchmarking

As discussed in Section 5.3, the benchmarking comparison with published nRMSE values for established PV models (Table 11) is indirect, as the referenced studies used outdoor measurement datasets, while the present work employs the Sandia indoor characterization dataset. This difference in validation conditions limits the strength of conclusions that can be drawn from the numerical comparison. A direct head-to-head evaluation of the proposed framework against the Single-Diode Model, De Soto model, Sandia SAPM, and PVsyst on a shared dataset—ideally an outdoor multi-year measurement dataset covering multiple module technologies—is strongly recommended as the primary direction for future work.

5.5.6. Summary of Future Work Directions

The following future work directions are recommended based on the limitations identified above:
  • Outdoor validation of the proposed framework using independent multi-year field measurement datasets across diverse climatic conditions.
  • Extension of the framework to thin-film (CdTe and CIGS) and emerging (perovskite and organic PV) technology classes.
  • Validation at extreme temperature conditions (below 0   ° C and above 75   ° C ) for cold-climate and desert applications.
  • Expansion of the HIT technology class validation to a minimum of three to five modules to enable robust generalization analysis.
  • Direct head-to-head benchmarking against established equivalent circuit models (SDM, De Soto, Sandia SAPM, and PVsyst) on a shared outdoor dataset.

6. Conclusions

This study presents a photovoltaic module modeling approach based on dimensional analysis for predicting the electrical characteristics of PV modules under varying environmental conditions. The model coefficients were extracted using a limited set of operating points corresponding to conditions typically available in the manufacturer’s datasheet I–V curves. The proposed formulation was validated using experimental datasets from Sandia National Laboratories covering irradiance levels from 100 to 1100 W/m2 and module temperatures ranging from approximately 15 °C to 75 °C. The validation results demonstrate good agreement between the predicted and measured electrical parameters. The results indicate that the proposed model is capable of accurately reproducing the electrical behavior of PV modules across a wide range of operating conditions. In particular, the low prediction error for the maximum power demonstrates the model’s suitability for PV performance evaluation and system-level simulations. Furthermore, the prediction errors were shown to be comparable to or lower than the measurement uncertainty associated with flash testing of PV modules, which further supports the reliability of the proposed formulation. The model also demonstrated consistent performance across modules based on different technologies, including monocrystalline, polycrystalline, and heterojunction modules, highlighting its robustness and general applicability. Beyond the specific application to photovoltaic modeling, this work also highlights the potential of dimensional analysis as an effective modeling framework for engineering systems. Although dimensional analysis has traditionally been applied mainly in fields such as fluid dynamics and heat transfer, its use in electrical and energy systems remains relatively limited. The results presented in this study demonstrate that dimensional analysis can provide a systematic and physically meaningful approach for modeling the behavior of photovoltaic devices using a reduced set of parameters and operating points. This capability suggests that the methodology may be extended to other complex and multiphysics engineering systems where interactions between electrical, thermal, and environmental variables are present. Consequently, the proposed approach may open new opportunities for applying dimensional analysis to a wider range of engineering problems, particularly in electrical engineering applications where such methods have been rarely explored. To the best of the authors’ knowledge, this is the first application of the Buckingham π theorem to derive dimensionless scaling laws for predicting PV module electrical characteristics across varying irradiance and temperature conditions. The framework offers a physically principled, non-iterative, and computationally efficient alternative to established equivalent circuit models such as the Single-Diode Model and empirical curve-fitting approaches, requiring only standard test condition datasheet values as inputs.
Future work may focus on validating the proposed model using outdoor experimental measurements and extending the analysis to additional photovoltaic technologies, including emerging devices such as perovskite-based modules. In addition, the dimensional-analysis framework presented in this study could be further explored for modeling other complex electrical and multiphysics engineering systems.


Author Contributions

Conceptualization, S.H. and M.H.S.; methodology, S.H. and M.H.S.; software, S.H.; validation, S.H. and M.H.S.; formal analysis, S.H. and M.H.S.; investigation, S.H. and M.H.S.; resources, S.H. and M.H.S.; data curation, S.H. and M.H.S.; writing—original draft preparation, M.H.S.; writing—review and editing, S.H. and M.H.S.; visualization, S.H.; supervision, M.H.S.; project administration, M.H.S. All authors have read and agreed to the published version of the manuscript.

Funding

This research did not receive external funding. The article processing charge (APC) was funded by the University of Business and Technology.

Data Availability Statement

The datasets used in this study are publicly available from Sandia National Laboratories and were obtained from the Sandia Photovoltaic Performance Modeling Collaborative (PVPMC) database. Additional data extracted from manufacturer datasheets are available from the corresponding author upon reasonable request. https://pvpmc.sandia.gov (accessed on 12 August 2024). Other data will be available on request.

Conflicts of Interest

The authors declare no conflicts of interest.

Abbreviations

The following abbreviations are used in this manuscript:
PV    Photovoltaic
η     Photovoltaic module efficiency
η r     Normalized module efficiency ( η / η STC )
η STC     Module efficiency at standard test conditions
G    Solar irradiance W · m 2
G STC     Solar irradiance at standard test conditions W · m 2
T    Module temperature ° C
T STC     Module temperature at standard test conditions ° C
γ     Normalized irradiance ( G / G STC )
τ     Normalized temperature ( T / T STC )
V mp     Voltage at maximum power pointV
I mp     Current at maximum power pointA
P mp     Maximum power output of the PV moduleW
V oc     Open-circuit voltageV
I sc     Short-circuit currentA
β     Ratio of open-circuit voltage to short-circuit current ( V oc / I sc )
β r     Normalized β parameter ( β / β STC )
F    Dimensionless parameter ( V oc I sc ) / ( G A )
F r     Normalized F parameter ( F / F STC )
A    PV module area m 2
α , Φ     Model coefficients in efficiency relation
a , b     Model coefficients in voltage–current relation
c 1 , c 2     Model coefficients in normalized β relation
d 1 , d 2     Model coefficients in normalized F relation
STCStandard Test Conditions
RMSERoot Mean Square Error
nRMSENormalized Root Mean Square Error
MAEMean Absolute Error
MBEMean Bias Error
R 2 Coefficient of Determination
CVCoefficient of Variation
DADimensional Analysis
SDMSingle-Diode Model
PLMPower-Law Model
CECCalifornia Energy Commission
NRELNational Renewable Energy Laboratory
IECInternational Electrotechnical Commission
HITHeterojunction with Intrinsic Thin Layer

Appendix A. Per-Module Statistical Performance Metrics

Table A1. Per-module MAE, MBE, and R 2 for all five predicted electrical parameters.
ModuleTech.MAEMBE R 2
V m p I m p V o c I s c P m p V m p I m p V o c I s c P m p V m p I m p V o c I s c P m p
(V) (A) (V) (A) (W) (V) (A) (V) (A) (W)
IT-360-SE72Mono0.6890.1150.2490.0111.241−0.625+0.115+0.195+0.005−0.1810.99250.99980.99261.00000.9998
Q.PLUS-G4.1-280Poly1.0310.1310.7610.1321.956−1.031−0.131−0.711−0.132−1.5720.98300.99990.98431.00000.9996
Q-Peak-G4-1-300Mono0.6000.1110.2100.0101.328−0.556+0.111+0.147+0.002−0.4580.99070.99980.99241.00000.9997
VBHN325SAHIT1.1390.0710.2790.0051.342−1.063+0.071+0.142−0.001−0.4260.98681.00000.99980.99411.0000
LG320N1KMono0.4140.0640.4710.0291.346−0.301+0.062+0.408+0.017−0.3050.99060.99980.96741.00000.9997
JKM260PPoly0.5380.0940.2260.0081.233−0.466+0.093+0.148+0.002−0.4210.99210.99980.99191.00000.9997
CS6K-275MMono0.8520.2140.2270.0081.204−0.664+0.214+0.154+0.002+0.3010.96300.99990.99161.00000.9998
CS6K-270PPoly0.5910.1610.2110.0061.213+0.560−0.161+0.123−0.003−0.4440.98470.99980.99251.00000.9997
Average 0.7320.1200.3290.0261.358−0.518+0.047+0.076−0.014−0.4380.9851.0000.9890.9991.000
Std. Dev. 0.2230.0430.1720.0380.2190.4480.1130.2920.0430.4610.0090.0000.0090.0020.000
Table A2. Per-module RMSE and nRMSE% for all five predicted electrical parameters.
ModuleTech.RMSEnRMSE (%)
V m p I m p V o c I s c P m p V m p I m p V o c I s c P m p
(V) (A) (V) (A) (W) % % % % %
IT-360-SE72Mono0.7750.1360.4420.0131.6602.1942.0551.0160.1900.702
Q.PLUS-G4.1-280Poly1.1030.1460.8130.1552.4013.7742.1612.2972.2261.297
Q-Peak-G4-1-300Mono0.6750.1350.3590.0121.7301.3612.0620.9930.1740.895
VBHN325SAHIT1.2240.0810.4560.0071.6902.3031.9910.7000.1550.771
LG320N1KMono0.4900.0850.7420.0361.7871.6651.2052.0210.4740.837
JKM260PPoly0.6090.1150.3850.0091.5751.1221.8511.1270.1390.922
CS6K-275MMono0.9190.2470.3870.0101.3641.1693.6561.1120.1510.743
CS6K-270PPoly0.6720.1880.3570.0081.5542.3563.0951.0320.1260.876
Average 0.8090.1420.4930.0311.7201.9932.2601.2870.4540.880
Std. Dev. 0.2240.0480.1590.0450.2680.7730.6740.4930.6390.163

References

  1. Carrero, C.; Ramírez, D.; Rodríguez, J.; Platero, C.A. Accurate and fast convergence method for parameter estimation of PV generators based on three main points of the I–V curve. Renew. Energy 2011, 36, 2972–2977. [Google Scholar] [CrossRef]
  2. De Soto, W.; Klein, S.A.; Beckman, W.A. Improvement and validation of a model for photovoltaic array performance. Sol. Energy 2006, 80, 78–88. [Google Scholar] [CrossRef]
  3. Orioli, A.; Di Gangi, A. A procedure to calculate the five-parameter model of crystalline silicon photovoltaic modules on the basis of the tabular performance data. Appl. Energy 2013, 102, 1160–1177. [Google Scholar] [CrossRef]
  4. King, D.L.; Boyson, W.E.; Kratochvil, J.A. Photovoltaic Array Performance Model; SAND2004-3535; Sandia National Laboratories: Albuquerque, NM, USA, 2004. [Google Scholar]
  5. van Roosbroeck, W. Theory of flow of electrons and holes in germanium and other semiconductors. Bell Syst. Tech. J. 1950, 29, 560–607. [Google Scholar] [CrossRef]
  6. Batzelis, E.I.; Papathanassiou, S.A. A method for the analytical extraction of the single-diode PV model parameters. IEEE Trans. Sustain. Energy 2016, 7, 504–512. [Google Scholar] [CrossRef]
  7. Khan, F.; Al-Ahmed, A.; Alsulaiman, F. Critical analysis of the limitations and validity of the assumptions with the analytical methods commonly used to determine the photovoltaic cell parameters. Renew. Sustain. Energy Rev. 2021, 140, 110753. [Google Scholar] [CrossRef]
  8. Anani, N.; Ibrahim, H. Adjusting the single-diode model parameters of a photovoltaic module with irradiance and temperature. Energies 2020, 13, 3226. [Google Scholar] [CrossRef]
  9. Duffie, J.A.; Beckman, W.A. Solar Engineering of Thermal Processes; Wiley: Hoboken, NJ, USA, 2013. [Google Scholar]
  10. Villalva, M.G.; Gazoli, J.R.; Filho, E.R. Comprehensive approach to modeling and simulation of photovoltaic arrays. IEEE Trans. Power Electron. 2009, 24, 1198–1208. [Google Scholar] [CrossRef]
  11. Zaimi, M.; El Ainaoui, K.; Assaid, E.M. Mathematical models to forecast temporal variations of power law shape parameters of a PV module working in real weather conditions: Prediction of maximum power and comparison with single-diode model. Sol. Energy 2023, 266, 112197. [Google Scholar] [CrossRef]
  12. Benahmida, A.; Rachidi, S.; Hanifi, N.; Bhiri, B.; Jamil, A.; Houssaini, N.S. An accurate analytical model for predicting the maximum power of photovoltaic module operating outdoor under varying conditions. Int. J. Energy Res. 2022, 46, 8034–8048. [Google Scholar] [CrossRef]
  13. Kumar, M.; Malik, P.; Chandel, R.; Chandel, S.S. Development of a novel solar PV module model for reliable power prediction under real outdoor conditions. Renew. Energy 2023, 217, 119224. [Google Scholar] [CrossRef]
  14. Porowski, R.; Kowalik, R.; Szeląg, B.; Komendołowicz, D.; Białek, A.; Janaszek, A.; Piłat-Rożek, M.; Łazuka, E.; Gorzelnik, T. Prediction of photovoltaic module characteristics by machine learning for renewable energy applications. Appl. Sci. 2025, 15, 8868. [Google Scholar] [CrossRef]
  15. Tina, G.M.; Ventura, C.; Ferlito, S.; De Vito, S. A state-of-art-review on machine-learning based methods for PV. Appl. Sci. 2021, 11, 7550. [Google Scholar] [CrossRef]
  16. Boutana, N.; Mellit, A.; Haddad, S.; Rabhi, A.; Massi Pavan, A. An explicit I-V model for photovoltaic module technologies. Energy Convers. Manag. 2017, 138, 400–412. [Google Scholar] [CrossRef]
  17. Siddig, M.H.; Hashim, S.M.; Osman, A.E. Formulation of an efficiency correlation for mono-crystalline PV modules using dimensional analysis. Sol. Energy 2020, 205, 456–460. [Google Scholar] [CrossRef]
  18. Buckingham, E. On physically similar systems; illustrations of the use of dimensional equations. Phys. Rev. 1914, 4, 345. [Google Scholar] [CrossRef]
  19. Barenblatt, G.I. Dimensional Analysis; Makinen, P., Translator; OPA: Amsterdam, The Netherlands, 1987. [Google Scholar]
  20. PlotDigitizer, Version 3.1.6. Available online: https://plotdigitizer.com (accessed on 1 January 2025).
  21. GCL Solar. GCL-M10/72H Photovoltaic Module Datasheet; GCL Solar Energy: Suzhou, China, 2024; Available online: https://en.gclsi.com/uploads/EN-1072H-B.pdf (accessed on 5 May 2024).
  22. PV Performance Modeling Collaborative (PVPMC). Available online: https://pvpmc.sandia.gov (accessed on 12 August 2024).
  23. Evans, D.L. Simplified method for predicting photovoltaic array output. Sol. Energy 1981, 27, 555–560. [Google Scholar] [CrossRef]
  24. Bartholomäus, M.; Morino, L.; Poulsen, P.B.; Spataru, S.V. Benchmarking equivalent circuit models for the IV characteristic of bifacial photovoltaic modules. EPJ Photovolt. 2025, 16, 12. [Google Scholar] [CrossRef]
Figure 1. Flow diagram of the proposed dimensional-analysis-based photovoltaic module model illustrating the relationships between environmental variables, datasheet values, model parameters, dimensionless model equations, and the resulting dimensionless model equations.
Energies 19 03614 g001
Figure 2. Example of I–V curve digitization for the GCL-M10/72H module using WebPlotDigitizer [20], showing extracted data points and identification of key parameters ( I s c , V o c , V m p , and I m p ). The I–V and P–V curves are originally sourced from the GCL-M10/72H manufacturer’s datasheet [21] and digitized for model coefficient extraction. Cell temperature is set to 25   ° C per standard test conditions (STCs).
Energies 19 03614 g002
Figure 3. Comparison between measured (Sandia National Laboratories) and predicted (proposed DA-based framework) PV electrical parameters ( V m p , I m p , V o c , and I s c ) for eight PV modules spanning monocrystalline, polycrystalline, and HIT technologies. R 2 values confirm excellent agreement across all parameters and all validation test points ( V m p : R 2 = 0.9854; I m p : R 2 = 0.9999; V o c : R 2 = 0.9891; I s c : R 2 = 0.9992). Module model numbers and their corresponding technology classifications (Mono, Poly, and HIT) are listed in Table 8.
Energies 19 03614 g003
Figure 4. Parity plot of predicted versus measured maximum power output ( P m p ) for all eight PV modules across all validation test points. The solid black line represents the 1:1 perfect prediction line, and the dashed gray lines represent the ±5% error bands. All predicted values fall within the ±5% band, confirming the accuracy of the proposed DA-based framework across the full irradiance and temperature operating range ( R 2 = 0.9998).
Energies 19 03614 g004
Table 1. Electrical parameters extracted from the digitized I–V curves of the GCL-M10/72H photovoltaic module under different irradiance and temperature conditions, together with the calculated dimensionless quantities used for model coefficient determination.
Environmental ConditionsNormalizedExtracted Electrical ParametersCalculated Quantities
T [°C] G [W/m2] τ γ Vmp [V] Imp [A] Voc [V] Isc [A] β r η r Fr
2510001.0001.00041.99213.22350.39113.9111.0001.0011.000
258001.0000.80041.69010.66749.10511.1341.2171.0020.975
256001.0000.60041.6148.00049.0298.3301.6251.0000.971
254001.0000.40041.6905.25148.3485.5532.4030.9860.958
252001.0000.20041.9922.55747.2132.7494.7410.9670.926
1010000.9501.00043.75013.33352.27913.7661.0481.0511.027
2510001.0001.00041.61813.33350.14713.8890.9971.0000.994
4010001.0501.00039.85313.22747.86814.0120.9430.9500.957
5510001.1011.00037.27913.28045.51514.1340.8890.8920.918
7010001.1511.00034.41213.52043.16214.2570.8360.8380.878
Table 2. Model coefficients obtained for the GCL-M10/72H module.
ϕ α ab c 1 c 2 d 1 d 2
−1.1770.02260.80481.0594−1.180−0.9710.8160.0435
Table 3. Operating conditions used for coefficient extraction and model validation.
Dataset UsageTemperature (°C)Irradiance (W/m2)Description
Coefficient extraction (9 points)25100, 200, 400, 600, 800, 1000Irradiance variation at 25 °C
15, 25, 50, 751000Temperature variation at 1000 W/m2
Validation (31 points)15.3–74.761000Temperature sweep
15100, 200, 400, 600, 800, 1000
50100, 200, 400, 600, 800, 1000, 1100Irradiance variation
75100, 200, 400, 600, 800, 1000, 1100
Table 4. Extracted model parameters for eight photovoltaic modules from the Sandia National Laboratories Dataset.
ModuleTechnology Φ α ab c 1 c 2 d 1 d 2 Efficiency (%)
IT-360-SE72Mono−1.3390.0270.8231.027−1.068−0.955−0.8440.0470.178
Q.PLUS-G4.1-280Poly−1.4420.0320.8401.020−1.153−0.955−0.9340.0440.166
Q-Peak-G4-1-300Mono−1.3950.0210.8141.031−1.074−0.959−0.8600.0480.174
VBHN325SAHIT−1.0030.0430.8581.017−0.885−0.954−0.7300.0350.193
LG320N1KMono−1.3860.0210.8381.020−1.069−0.961−0.8920.0210.187
JKM260PPoly−1.4670.0480.8281.028−1.176−0.956−0.9420.0570.158
CS6K-275MMono−1.4420.0200.8031.047−1.153−0.958−0.9340.0510.169
CS6K-270PPoly−1.4210.0440.9071.000−1.162−0.957−0.9210.0530.163
Average values−1.3620.0320.8391.024−1.093−0.957−0.8820.044
Standard deviation0.1330.0100.0280.0120.0840.0020.0630.010
Table 5. Model coefficients extracted from manufacturer’s datasheet parameters for eight commercial PV modules.
ModuleTechnology Φ α ab c 1 c 2 d 1 d 2 Efficiency (%)
SN300M-10Mono−1.2730.0600.8441.027−1.155−0.946−1.0740.03918.4
HIT-240HDE4HIT−1.7140.0400.8380.993−1.468−0.963−0.6980.03717.3
CHSM60M-HCMono−1.1220.0120.8910.992−1.341−0.951−0.8740.02620.8
LR6-60PB-305MMono−1.7380.0480.8191.036−1.307−0.961−0.9580.06118.3
BP 3220TPoly−1.2310.0250.8920.973−1.520−0.946−0.9530.08413.2
NT-R5E3EMono−1.5370.1251.3900.826−1.143−0.875−0.9170.09913.5
GCL-M10/72H ProMono−1.1770.0230.8051.059−1.180−0.971−0.8160.04421.5
JAM60D00 300Mono−1.2410.0140.8101.054−1.187−0.963−0.8520.04418.7
Average values−1.3790.0430.9110.995−1.288−0.947−0.8930.054
Standard deviation0.2310.0340.1840.0700.1370.0280.1040.024
Table 6. Normalized root mean square error (nRMSE) values of the predicted electrical parameters for the eight PV modules using the 31 validation operating points.
ModuleTechnologynRMSE% V m p nRMSE% I m p nRMSE% V o c nRMSE% I s c nRMSE% P m p
IT-360-SE72(Mono)2.19442.05531.01640.18990.7016
Q.PLUS-G4.1-280(Poly)3.77352.16092.29682.22611.2969
Q-Peak-G4-1-300(Mono)1.36112.06230.99260.17360.8951
VBHN325SA(HIT)2.30251.99080.70010.15480.7708
LG320N1K(Mono)1.66541.20512.02070.47370.8371
JKM260P(Poly)1.12221.85091.12730.13900.9221
CS6K-275M(Mono)1.16903.65581.11220.15090.7428
CS6K-270P(Poly)2.35593.09521.03210.12600.8757
Average values 1.9932.2601.2870.4540.880
Table 7. Average statistical performance metrics of the proposed DA-based framework across all eight PV modules.
ParameterRMSEMAEMBE R 2
V m p (V)0.8090.732−0.5180.9854
I m p (A)0.1420.120+0.0470.9999
V o c (V)0.4930.329+0.0760.9891
I s c (A)0.0310.026−0.0140.9992
P m p (W)1.7201.358−0.4380.9998
Table 8. Comparison of module-specific and technology-averaged (generic) nRMSE (%) for V m p , I m p , and P m p —leave-one-out cross-validation.
ModuleTech.nRMSE% V m p nRMSE% I m p nRMSE% P m p
Specific Generic Specific Generic Specific Generic
IT-360-SE72Mono0.7752.4180.1362.3231.6600.890
Q-Peak-G4-1-300Mono0.6750.7390.1351.5831.7300.929
LG320N1KMono0.4902.7470.0852.8151.7870.860
CS6K-275MMono0.9192.2330.2472.2401.3640.992
Q.PLUS-G4.1-280Poly1.1033.0080.1463.9412.4011.505
JKM260PPoly0.6090.2280.1151.2971.5750.875
CS6K-270PPoly0.6720.9220.1881.7061.5540.931
VBHN325SAHIT1.224N/A0.081N/A1.690N/A
Avg. Mono 0.7152.0330.1512.2401.6350.918
Avg. Poly 0.7951.3860.1502.3151.8431.104
Table 9. Technology-averaged model coefficients for the proposed DA-based framework for direct application to untested monocrystalline and polycrystalline silicon PV modules.
Technology Φ α ab c 1 c 2 d 1 d 2
Monocrystalline (Mono)−1.39050.02230.81941.0313−1.0910−0.9583−0.88250.0417
Polycrystalline (Poly)−1.44330.04110.85841.0163−1.1637−0.9560−0.93230.0514
Table 10. Comparison of the proposed DA-based framework with empirical curve-fitting and physics-based modeling approaches.
CharacteristicEmpirical Curve FitDA-Based FrameworkPhysics-Based
(This Work)(SDM/De Soto)
Derivation basisRegression on raw dataBuckingham π theoremSemiconductor device physics
Dimensional consistencyNot guaranteedGuaranteed by constructionGuaranteed
Number of fitting parametersArbitraryMinimum set ( π groups)5 physical parameters
Technology generalizationDataset-specificCross-technology by designRequires re-parameterization
Physical interpretabilityLowModerateHigh
Computational costVery lowVery lowMedium (implicit equation)
Required inputsRaw G, T + regression dataSTC datasheet valuesMeasured I–V curves
Table 11. Comparison of nRMSE (%) for P m p , V o c , and I s c between the proposed DA-based framework and established PV models reported in the literature.
ModelReferenceDatasetnRMSE% V o c nRMSE% I s c nRMSE% P m p
Power-Law Model (PLM)Zaimi et al. [11]22 modules, NREL outdoor≤4.0
Single-Diode Model (SDM)Zaimi et al. [11]22 modules, NREL outdoor≤4.0
Analytical modelBenahmida et al. [12]3 modules, NREL outdoor≤0.92
De Soto (Five-Parameter)Barth. et al. [24]8 bifacial, Denmark outdoor3.088.509.76
CEC/SDMBarth. et al. [24]8 bifacial, Denmark outdoor1.628.279.30
PVsystBarth. et al. [24]8 bifacial, Denmark outdoor1.708.359.45
Proposed DA frameworkThis work8 modules, Sandia indoor1.2870.4540.880
Disclaimer/Publisher’s Note: The statements, opinions and data contained in all publications are solely those of the individual author(s) and contributor(s) and not of MDPI and/or the editor(s). MDPI and/or the editor(s) disclaim responsibility for any injury to people or property resulting from any ideas, methods, instructions or products referred to in the content.