1. Introduction
With increasing concern about energy security, air pollution, and global warming, the potential use of polymer electrolyte fuel cell (PEFC) in future sustainable and renewable energy systems has gained considerable momentum [
1,
2,
3]. The principles of PEFC technology can be traced back to the 19th century, and after nearly two centuries of development, PEFC has become the most promising type of fuel cell for automotive and some portable applications. Due to their high-power density and low operating temperature, PEFCs are also considered to have potential for backup power and distributed energy applications.
Despite significant progress in engineering and science, large-scale commercialization of PEFC has not been achieved in the past few decades, with major obstacles including: (1) technical issues related to water management; (2) high costs of materials and components [
4,
5,
6]. Among these, water management is a key factor affecting fuel cell performance and durability. Understanding the complexity of this problem lies in the strong coupling of heat and mass-transfer processes, the existence of two-phase flow and phase transition phenomena in porous media, and the complex transport and accumulation behavior of liquid water between different layers. Water generated by electrochemical reactions may condense and form droplets within the gas diffusion layer (GDL) or gas channel. If these droplets are not drained in time, they will cause gas channel blockage, localized oxygen deficiency, uneven current distribution, and performance degradation. Therefore, a deep understanding of the generation, transport, and evolution of liquid water is crucial for the further development of PEFC technology [
7,
8,
9,
10].
Computational fluid dynamics (CFD) methods provide an important tool for studying heat and mass transfer and two-phase flow in fuel cells. Numerical simulations can significantly reduce experimental costs and time and reveal transient interface evolution processes that are difficult to capture experimentally. CFD-based fuel cell models can not only be used to verify experimental results but also to evaluate the impact of different gas channel structures, operating parameters, and material properties on performance during the design phase [
11,
12]. However, many assumptions are typically made when building models, such as the interaction between gas and liquid, wall wettability, and effective parameters of porous media. This makes the simulation results quite sensitive to boundary conditions and properties.
A typical PEFC flow field consists of a series of gas channels. Effective removal of liquid water from the cathode side remains a key challenge. Since oxygen diffuses into the reaction interface within the cathode gas channel, droplet accumulation in the gas channel will hinder gas-phase transport and lead to local flooding, resulting in performance degradation or even operational instability [
4,
10,
13]. Liquid water typically seeps from the GDL surface and enters the gas channel as droplets or thin films. Its dynamic behavior is influenced by factors such as gas channel geometry, gas velocity, wall wettability, and droplet size and distribution. When the gas momentum is sufficient to overcome surface tension, droplets may be carried out of the gas channel in the form of slug flow, mist flow, or wall film/corner flow [
14,
15]. Appropriate design of the gas channel geometry and wall contact angle can achieve efficient drainage at lower pressure drops.
Although extensive experimental and numerical studies have been conducted to understand liquid water transport in PEFC gas channels, several important gaps remain. The majority of current simulations adopt simplified breakthrough geometries—typically circular, uniform, or single-point liquid inlets—overlooking the inherent heterogeneity and anisotropy of real GDL fibrous structures, which naturally produce irregular, orientation-dependent breakthrough morphologies [
16,
17]. Furthermore, multi-point breakthrough, a common occurrence in practical GDL that critically governs droplet coalescence, shielding effects, and detachment dynamics, has seldom been researched through systematic experiments and modeling. Consequently, the combined influence of inlet geometry, inlet orientation, breakthrough size, gas velocity, and wall/GDL wettability remains insufficiently understood [
18,
19,
20]. A systematic analysis of how the shape of breakthrough openings affects droplet dynamics under multiple simultaneous breakthrough sites in the gas flow channel of a PEFC—a condition typical of real GDL—is still lacking.
Recent experimental studies have shown that introducing engineered pores into GDL can significantly improve water removal and mass transport. Horst et al. [
21] used a carbon dioxide laser to create arrays of cylindrical (approximately circular) pores in GDL, reducing oxygen mass-transfer resistance by 28% and increasing the current density at 0.7 V by 18%. Similarly, Peng et al. [
22] fabricated aligned pore channels that promoted rapid liquid water transport, leading to substantial performance improvements in direct methanol fuel cells and zinc–air cells. These studies indicate that regular pore-engineered pathways, typically realized as circular laser-drilled holes, can facilitate liquid water drainage and alleviate flooding. However, the underlying role of breakthrough geometry itself has not been systematically investigated, and it remains unclear whether circular pores outperform other possible inlet shapes and through what physical mechanisms. Lv et al. [
23] combined micro-CT reconstructed GDL structures with LBM simulations to develop a droplet detachment model for PEMFCs, identifying 120–140° as the optimal intrinsic contact angle range for water removal and establishing the minimum necking diameter of the liquid bridge as the characteristic length governing the critical detachment force. Aroge et al. [
24] proposed rapid operando X-ray radiography as a complement to 3D computed tomography for PEFC liquid water visualization, revealing initial transient water buildup, random breakthrough point behavior with ~54% average persistence, and demonstrating a high-resolution, minimally intrusive lab-based workflow that extends X-ray imaging capabilities. Pei et al. [
25] designed a visualization setup for PEFC gas channels and experimentally observed that the volume and number of liquid droplets initially increased, followed by the coalescence of small droplets into larger ones.
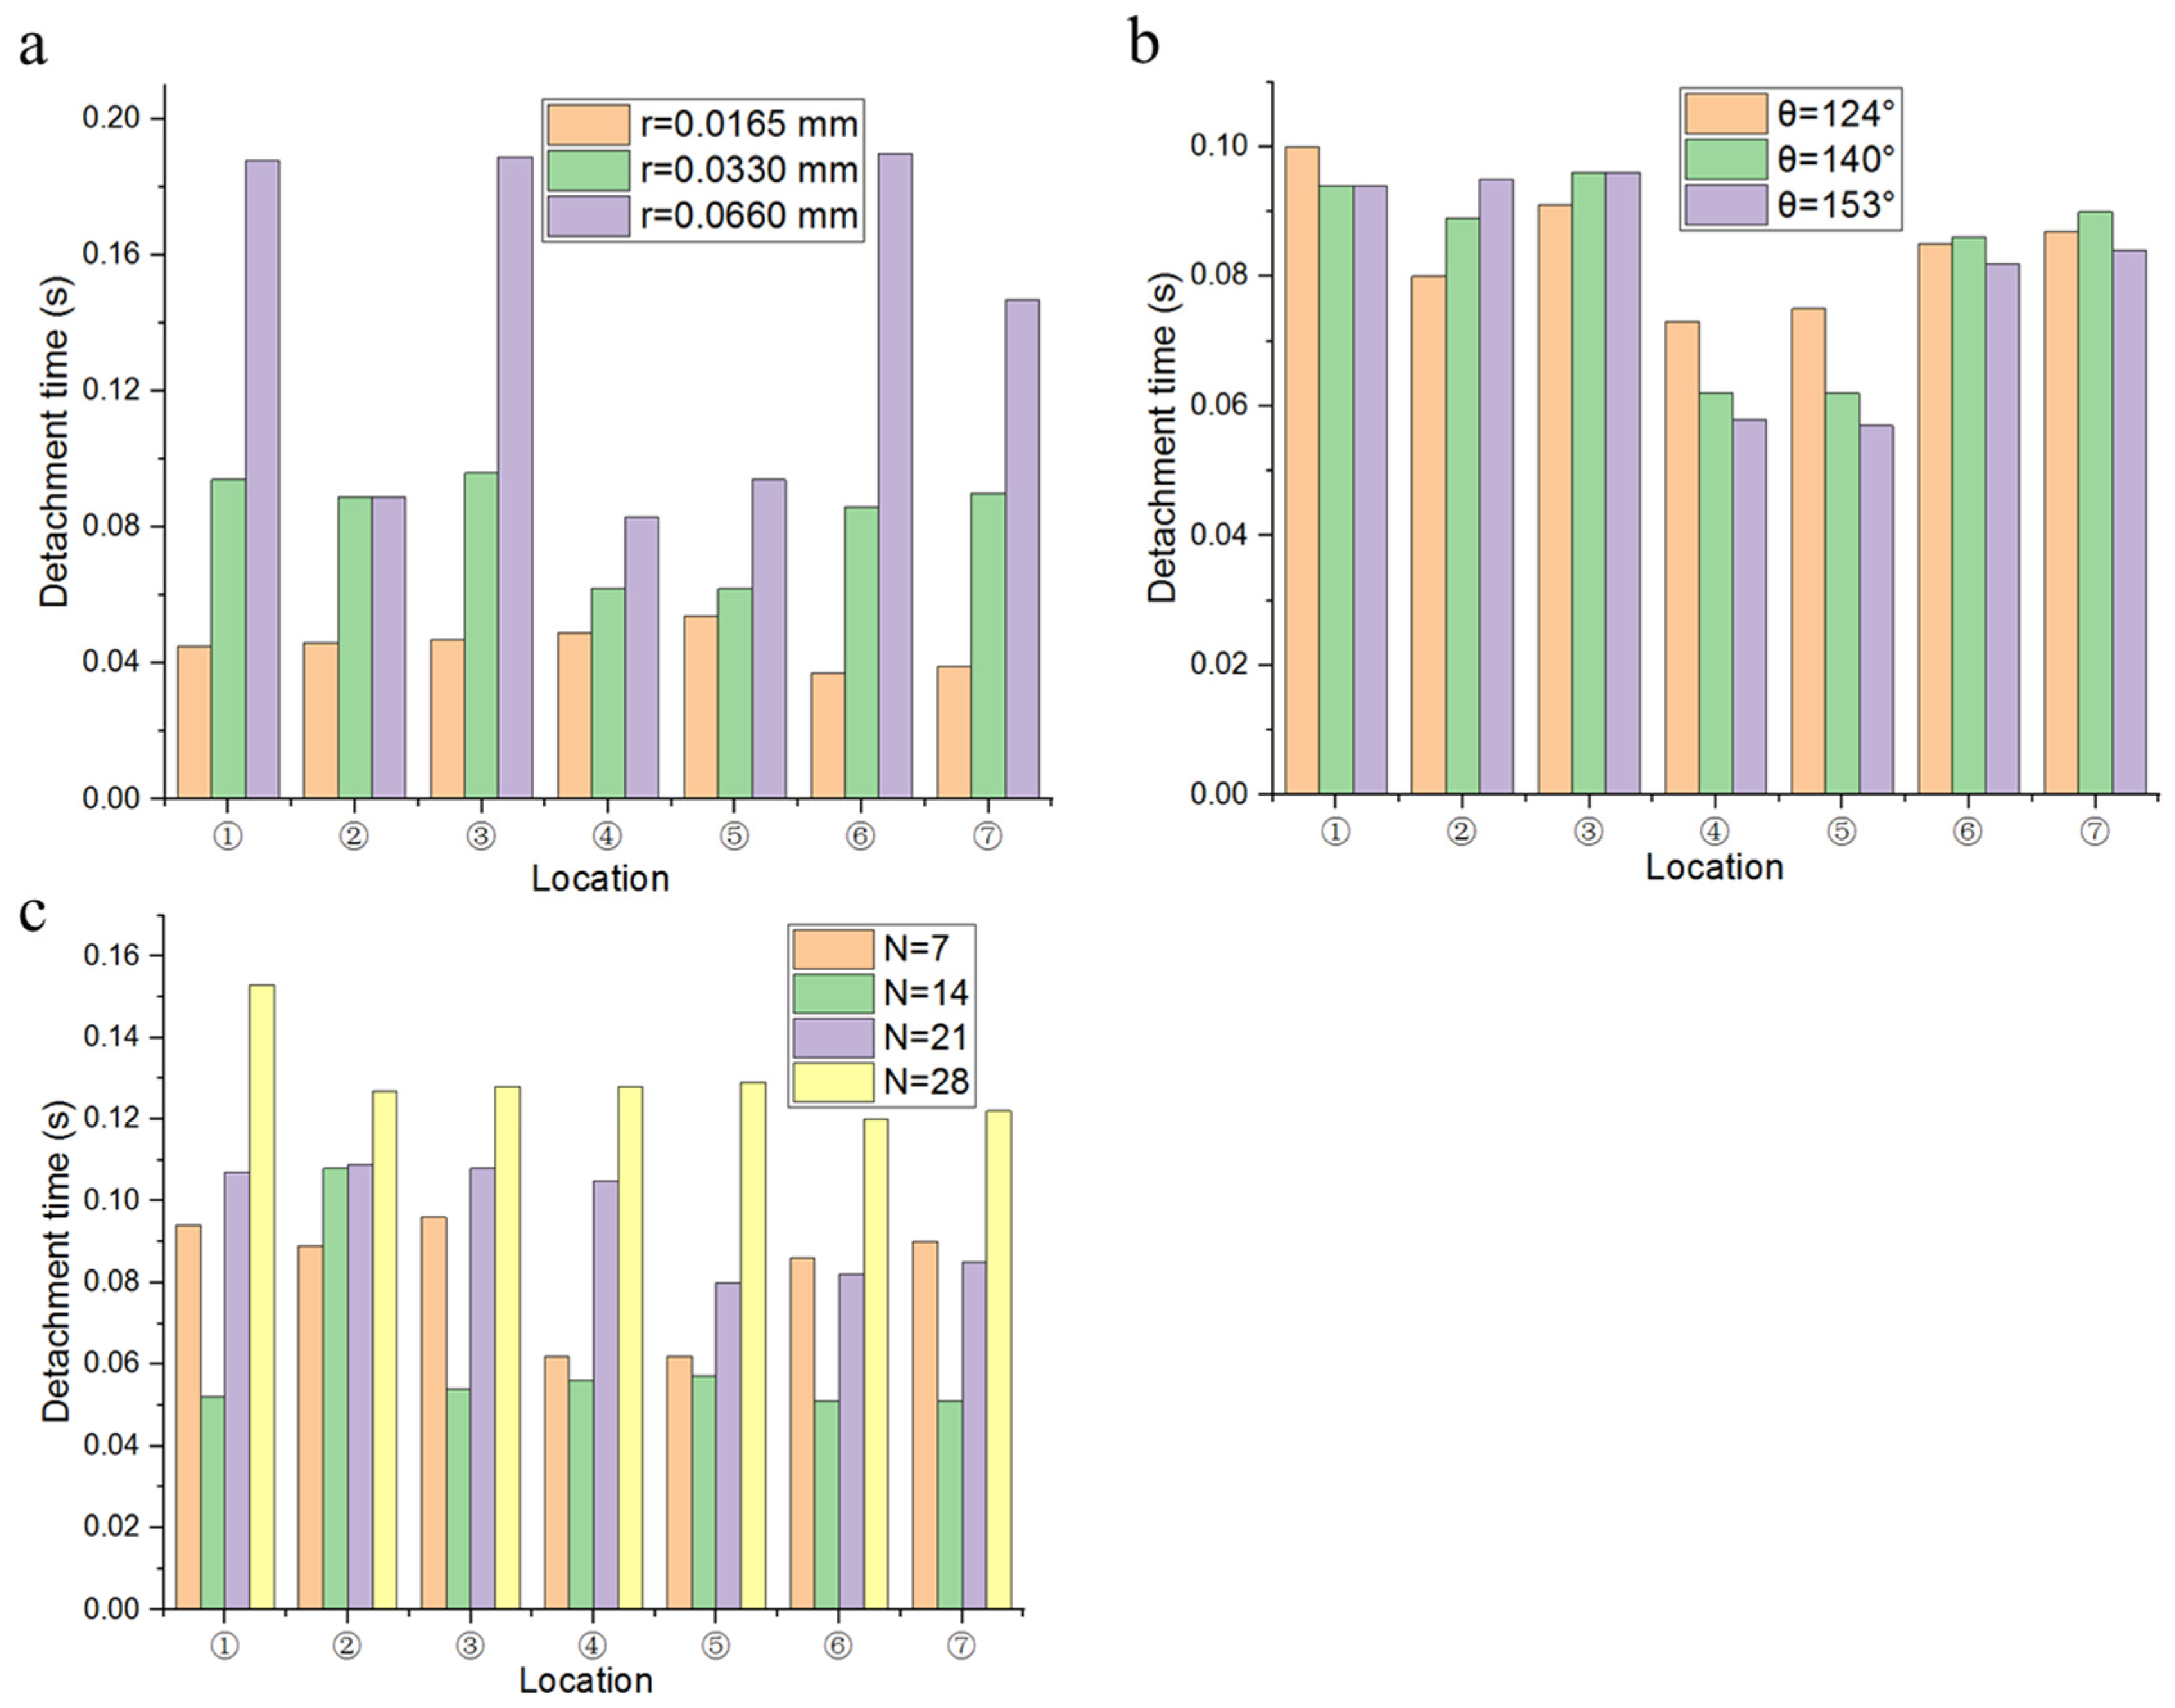
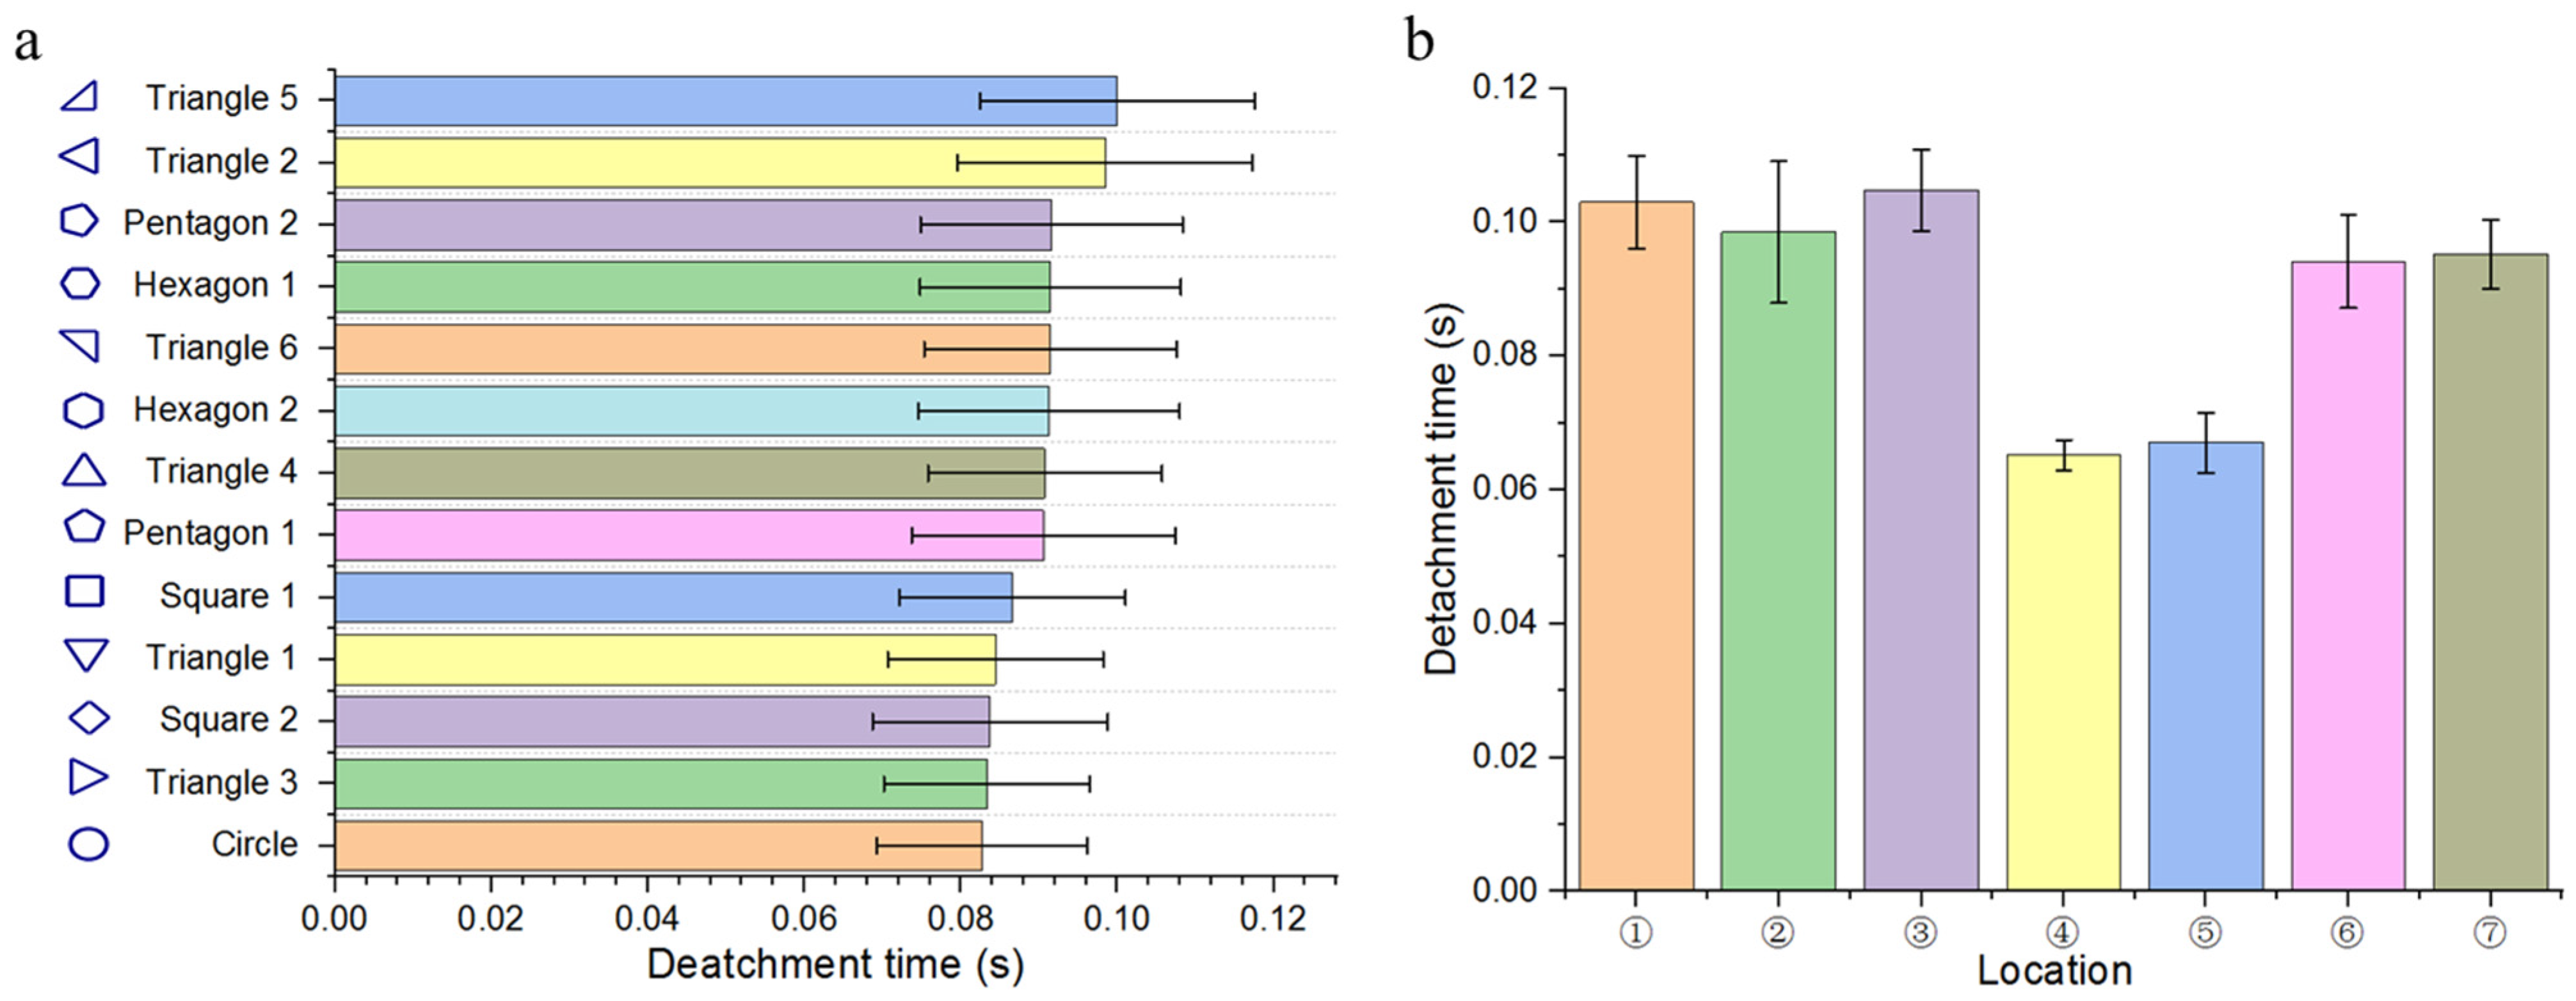
Despite these important advances, several fundamental questions about liquid water breakthrough from realistic GDL structures remain unresolved. In particular, it is not yet clear how the intrinsic heterogeneity of fibrous media governs the emergence, morphology, and transport behavior of liquid water at the GDL–gas channel interface. Motivated by these observations, this work develops a three-dimensional volume-of-fluid (VOF) model of a gas channel incorporating seven independent liquid breakthrough sites on the GDL surface with five distinct inlet geometries (triangular, square, pentagonal, hexagonal, and circular), thereby closely mimicking the geometric diversity arising from random fibrous microstructures. The model is validated against experimental data in terms of droplet shape evolution, growth behavior, and detachment time. A comprehensive parametric study is then conducted to elucidate how breakthrough geometry, inlet size, number of inlets, gas velocity, and surface wettability jointly govern droplet transport behaviors, including sidewall flow, corner flow, top-wall flow, and GDL-surface flow. Furthermore, detailed force decomposition analysis (including inertial, pressure, capillary, and viscous forces) is performed to reveal the underlying mechanisms driving different flow regimes. These findings provide new physical insights into multi-point water breakthrough phenomena and offer valuable guidance for the design of PEFC flow fields and GDL structures with improved water management capability.
2. Mathematical Model
A three-dimensional computational model was developed to investigate two-phase flow behavior in a single-gas channel PEFC. The model consists of a straight gas channel coupled with a GDL area, in which localized liquid water breakthrough regions are explicitly resolved. Dry air is supplied through a single gas inlet at the gas channel entrance, while a two-phase mixture of air and liquid water exits through the gas channel outlet. Liquid water is introduced into the gas channel exclusively through predefined breakthrough areas on the GDL surface, representing water emerging from the porous electrode under operating conditions.
2.1. General Assumptions
- –
Both gas and liquid phases are treated as incompressible and immiscible, and the simulations are performed under isothermal conditions at 80 °C.
- –
The GDL is represented as a liquid source on its upper surface, with its internal pore-scale transport not explicitly resolved.
- –
Liquid water enters the gas channel through prescribed discrete breakthrough inlets with steady injection velocities.
- –
Electrochemical reactions, species transport, and in situ water generation are not considered, and the focus is placed solely on droplet hydrodynamics after breakthrough. Consequently, the results reflect post-breakthrough hydrodynamics rather than the full coupled behavior of an operating cell. It is assumed that the imposed liquid inlet velocities correspond to local breakthrough intensities, rather than to PEFC averaged current densities.
- –
Phase change was not considered.
2.2. VOF Model
The VOF model [
26] is an interface analysis method that has become a commonly used approach for solving two-phase flow phenomena within PEFC [
27,
28,
29]. Using the VOF method, the interphase interface is tracked by the volume fraction of liquid water in the computational cell volume scheme. According to the VOF method, in each cell of the mesh, each dependent variable has only one value defining the state. A function α (
alpha.water) is introduced, whose value is 1 wherever the liquid phase occupies the area, and zero otherwise [
30]:
Vl is the volume of the calculated element, and
VCV is the volume of the liquid phase. In three-dimensional space, the fractional equation for the water phase follows [
26]:
The α value moves with the fluid.
The governing equations are the continuity and momentum equations that have the following form:
where
g is the acceleration due to gravity, and
F is the source term representing surface tension. The
v vector can be defined as [
29]:
The pressure drop across the entire surface is a function of the surface tension (
γ) [
27]:
Here,
R1 and
R2 are the two orthogonal radii required to measure surface curvature. According to the Continuous Surface Force (CSF) method, surface tension can be expressed as a pressure jump across the interface, and in the momentum equation, it is represented as a body force [
27]:
where
k is the surface curvature, which can be defined based on the divergence of the interface normal unit vector (
n) [
27,
28]:
Here, we have the unit vector tangent to the wall, the unit vector normal to the wall, and the static contact angle of the wall.
2.3. Force Analysis
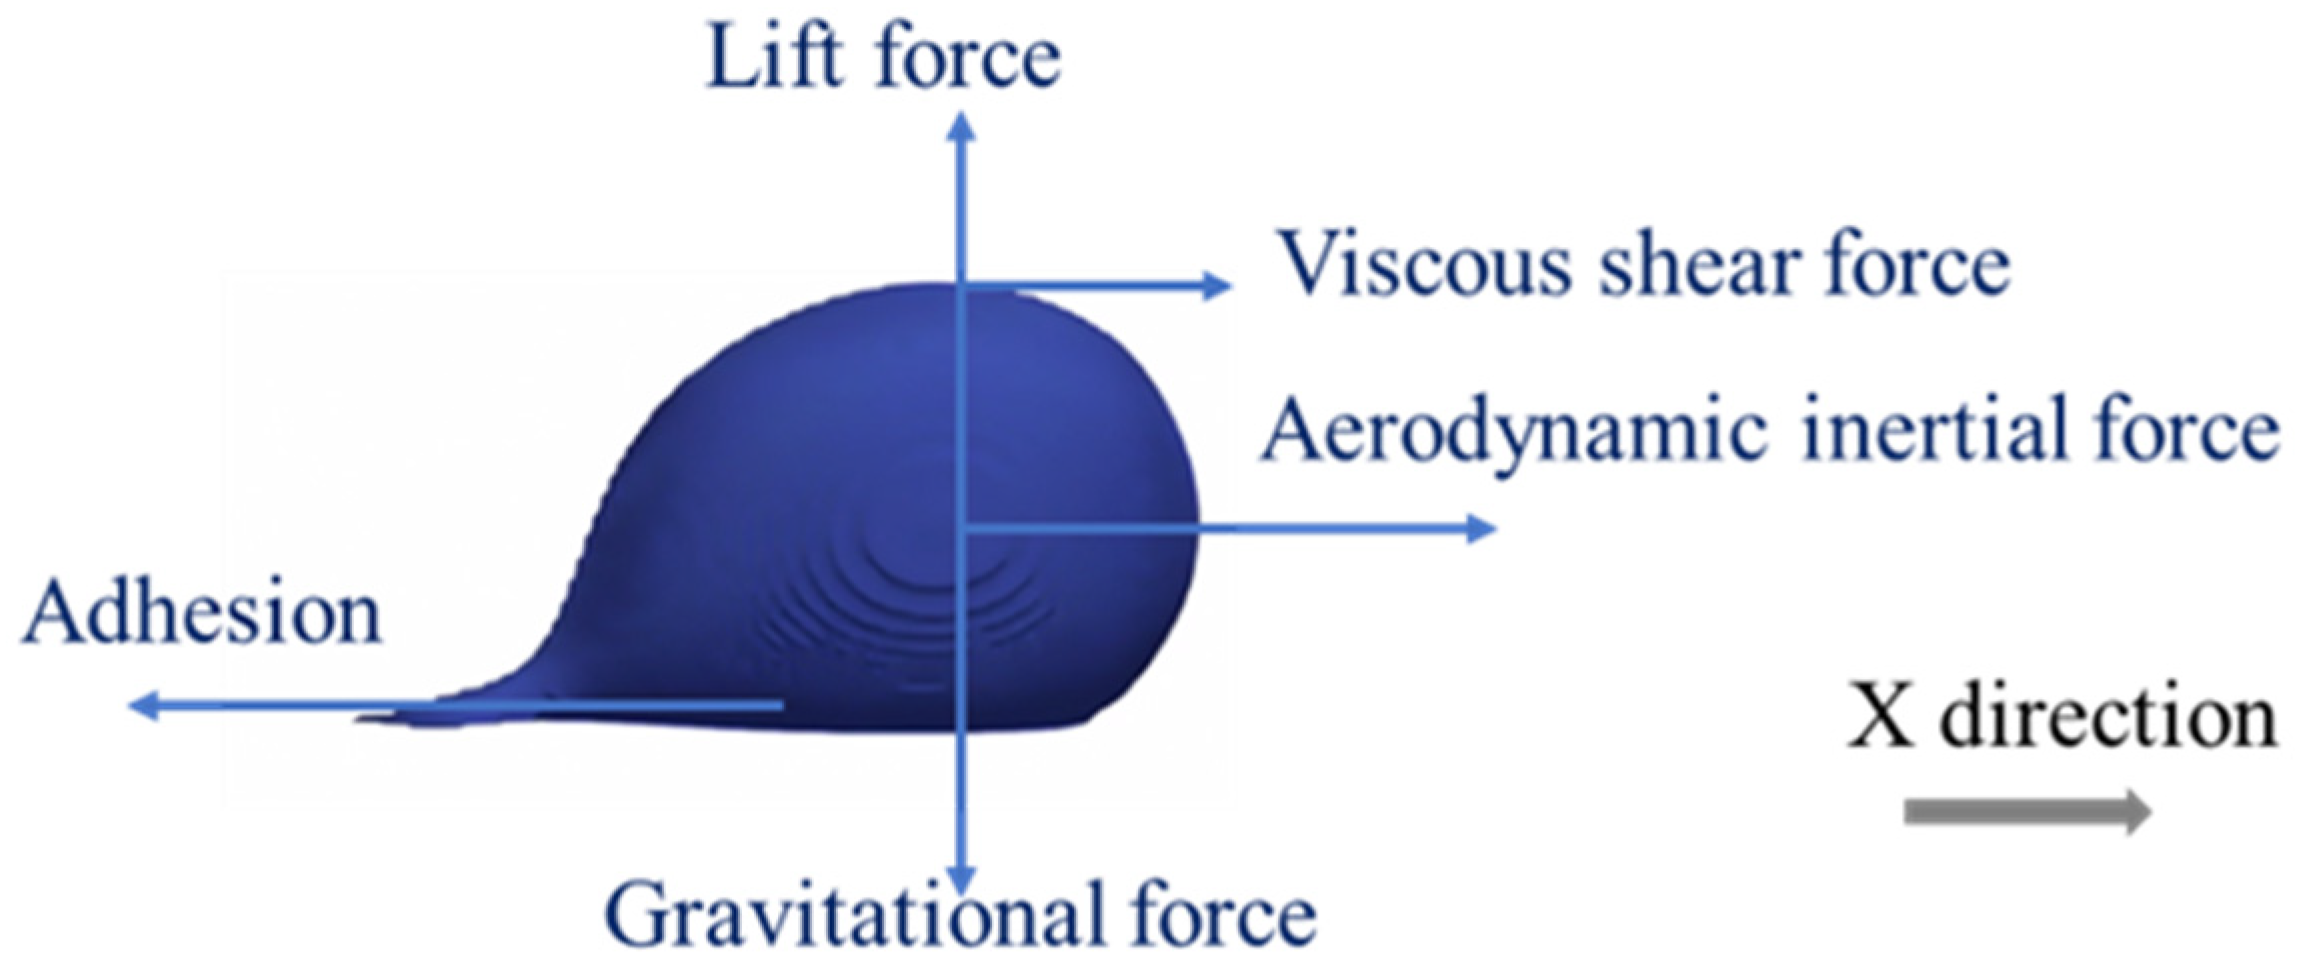
After liquid water breaks through the GDL surface into the gas channel, droplet motion is governed by the competition among several forces, including aerodynamic inertial force (, , ), viscous shear force (, , ), surface tension, and adhesion (, , ) at the three-phase contact line.
Under gas flow, the aerodynamic inertial force originates from the pressure difference between the windward and leeward sides of the droplet and represents the primary driving force for droplet migration and detachment. Its streamwise component (x-direction in
Figure 1) governs downstream transport, whereas geometric asymmetry of the breakthrough opening or proximity to the sidewall can generate pronounced transverse or vertical components, leading to lateral deflection or lift-induced motion. Viscous shear forces acting at the gas–liquid interface and liquid–solid contact regions contribute to droplet deformation and sliding along the wall or GDL surface but are generally insufficient to overcome resistance on their own.
Surface tension stabilizes the droplet interface by maintaining curvature continuity and constitutes the dominant resisting force against deformation and detachment. At the three-phase contact line, surface tension combined with surface wettability gives rise to an adhesion force, which depends on the contact angle and contact-line length. Increasing the hydrophobicity of the GDL surface reduces this adhesion force and facilitates earlier droplet detachment.
Accordingly, droplet detachment and subsequent transport occur only when the combined aerodynamic inertial and viscous forces exceed the resisting effects of surface tension and adhesion.
Figure 1 schematically illustrates the major forces acting on the droplet and their directional decomposition, providing a unified physical basis for the analysis of different flow regimes discussed in the following sections.
According to Newton’s second law (The following equations are all in the
x-axis direction):
The aerodynamic inertial force [
31]:
Fluid–fluid viscous shear force [
31]:
Adhesion force [
31]:
where
is the area;
are the projected area of the droplet in the
xyz direction;
is the density of water;
is the volume of water;
is the velocity of water;
is the time;
is the component of viscous force along the
x-axis;
is the component of fluid–solid viscous shear force along the
x-axis;
are the components of pressure along the
xyz axis;
,
are the unit vectors;
are the components of adhesion along the
xyz axis;
is the gas–solid contact line between the droplet and the GDL surface;
is the surface tension; and
is the contact angle.
The droplet forces were evaluated using ParaView-5.13.1’s surface and volume integration workflow. At each time step, the liquid phase was identified from the volume fraction field, and the liquid–gas interface together with the wetted wall surfaces was extracted. ParaView-5.13.1 integration filters were then applied to quantify the force components by spatially integrating the relevant fields. The inertial force was obtained from the pressure and momentum flux acting on the droplet interface, the viscous shear force from the tangential stress distribution, the surface-tension force from curvature-dependent capillary stresses, and the adhesion force from capillary traction along the three-phase contact line. All forces were decomposed into streamwise, transverse, and vertical components to enable direct comparison of their relative contributions to droplet deformation, detachment, and migration, as seen in
Figure 1.
2.4. Model and Parameters
Table 1 summarizes the modeling parameters employed in this study and their correspondence to representative PEFC operating conditions. Distinct wettability conditions are prescribed for the graphite gas channel wall (contact angle 53°) and the GDL surface (124°/140°/153°), reflecting typical hydrophilic–hydrophobic contrasts in PEFC components. Fluid properties are taken as standard values for air–water systems under typical operating conditions.
The imposed gas and liquid inlet conditions are selected to represent physically consistent operating regimes of a practical PEFC. The gas inlet velocities of 5, 10, and 15 m·s−1 are scaled to a cell with an active area of 200 cm2 and 25 parallel cathode gas channels. Assuming a mean current density of 1.0 A·cm−2, these velocities correspond to oxygen stoichiometric ratios of approximately 0.5 (lack of air), 1.0 (low stoichiometry), and 1.5 (medium stoichiometry), respectively, under ambient pressure. Consequently, the selected gas velocities span oxygen-deficient, low-stoichiometry, and moderate-stoichiometry cathode operation, which are particularly relevant for examining liquid water accumulation, droplet detachment, and drainage behavior in the PEFC gas channel.
Seven circular breakthrough inlets with a radius of 33 μm are prescribed, yielding a total inlet area of 2.39 × 10⁻⁸ m2. Based on Faraday’s law and a gas channel active area of 8 cm2 (corresponding to a 200 cm2 cell with 25 parallel gas channels), the imposed liquid inlet velocities correspond to local equivalent current densities of approximately 0.66, 3.31, and 6.61 A·cm−2, respectively. These values represent localized water generation intensities associated with breakthrough regions rather than cell-averaged current densities.
2.5. Model Development
The present model treats the GDL surface as a liquid source to study breakthrough behavior at the GDL–gas channel interface, extending prior single-droplet studies [
18,
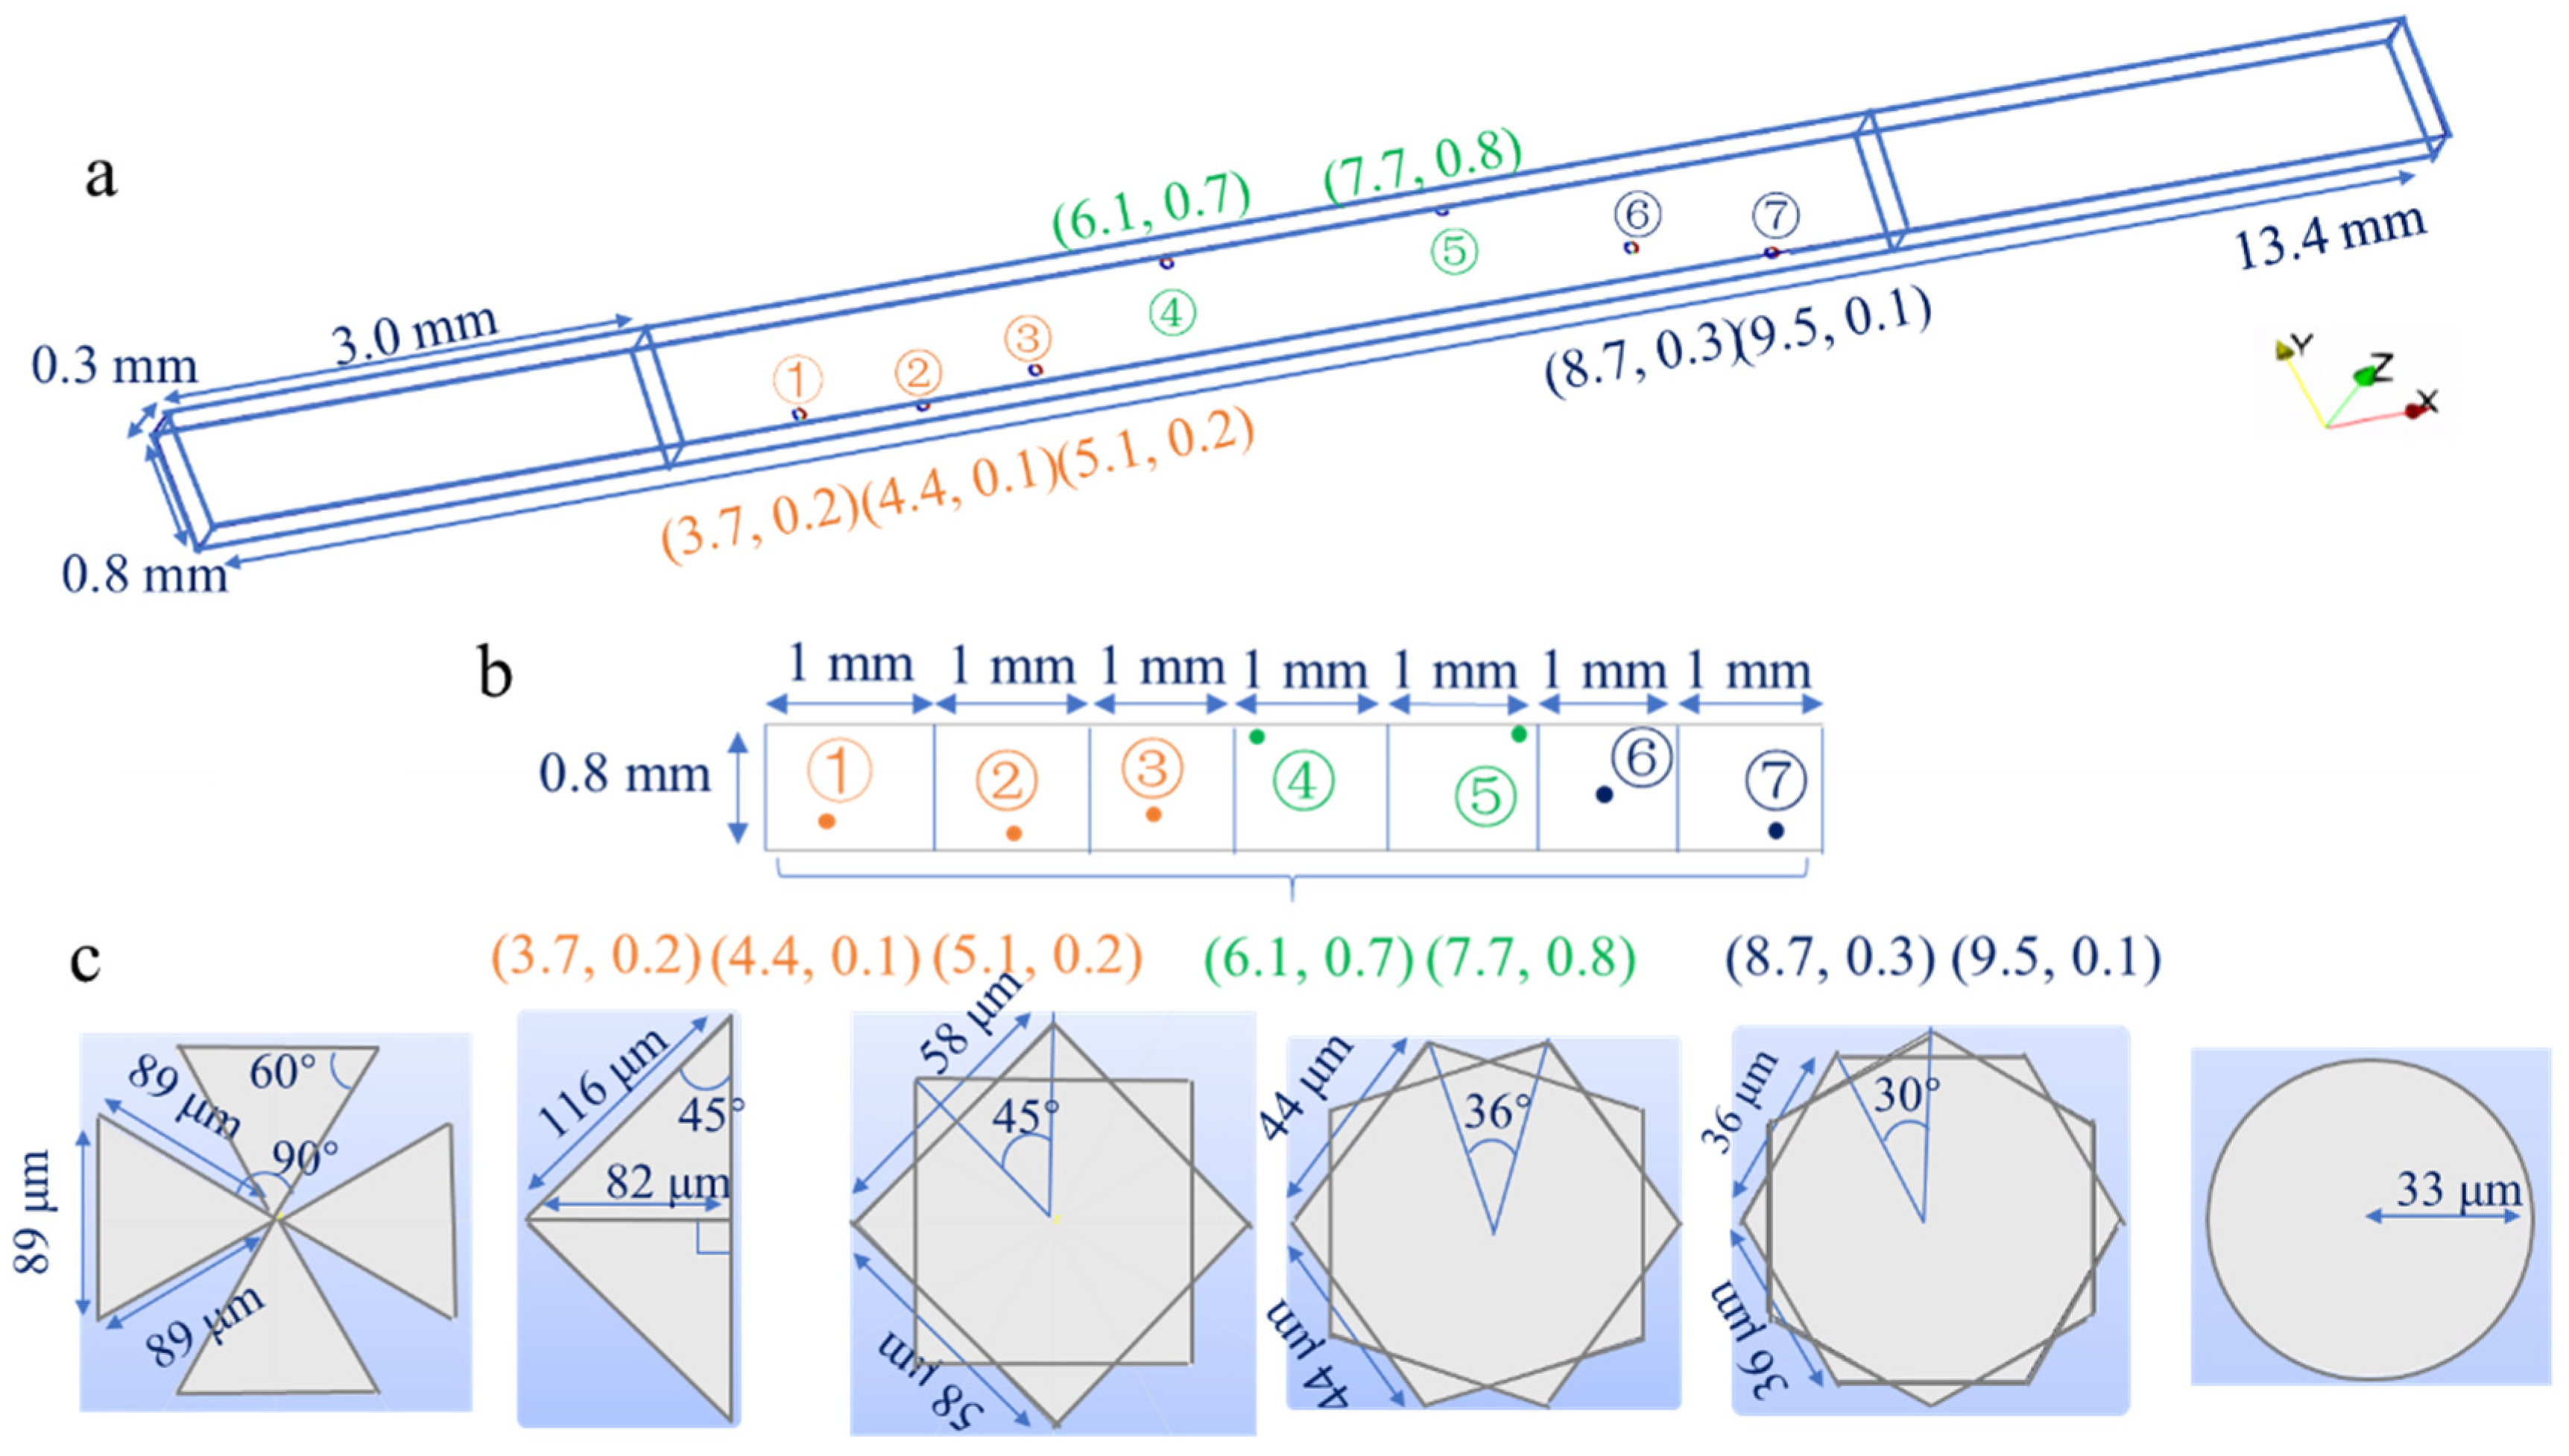
19]. To capture realistic heterogeneous water emergence, seven discrete breakthrough sites are prescribed along the interface based on Yu’s statistical results [
32,
33], with varied geometric shapes (triangles, squares, pentagons, hexagons, circles) mimicking irregular pores of Toray-90 GDL [
20]. These inlets are organized into seven GDL sub-regions, each containing 1–4 breakthrough sites, enabling systematic investigation of inlet number density and spatial clustering. The model resolves simultaneous droplet growth, interaction, coalescence, and detachment at multiple locations, bridging idealized single-inlet and realistic PEFC two-phase flow.
The straight gas channel is 13.4 mm long and 0.8 mm wide, with a GDL region on the bottom wall starting 3 mm downstream of the inlet and covering the central portion,
Figure 2a. The channel comprises an inlet region, a GDL–droplet region, and a fully developed region. Seven breakthrough inlets are numbered sequentially and grouped into three: Group I (inlets 1–3) upstream near one sidewall, Group II (4–5) mid-channel, and Group III (6–7) downstream near the opposite sidewall, allowing analysis of location-dependent droplet interactions and airflow development,
Figure 2b.
Air enters from the left and flows over the GDL; water is injected through the seven breakthroughs to mimic GDL liquid transport. By resolving droplet interactions among groups, the model captures combined effects of breakthrough location, droplet–droplet dynamics, and evolving gas flow conditions, while the varied inlet shapes and sub-region densities systematically bridge single-inlet idealizations and practical PEFC behavior.
2.6. Mesh Dependency Study
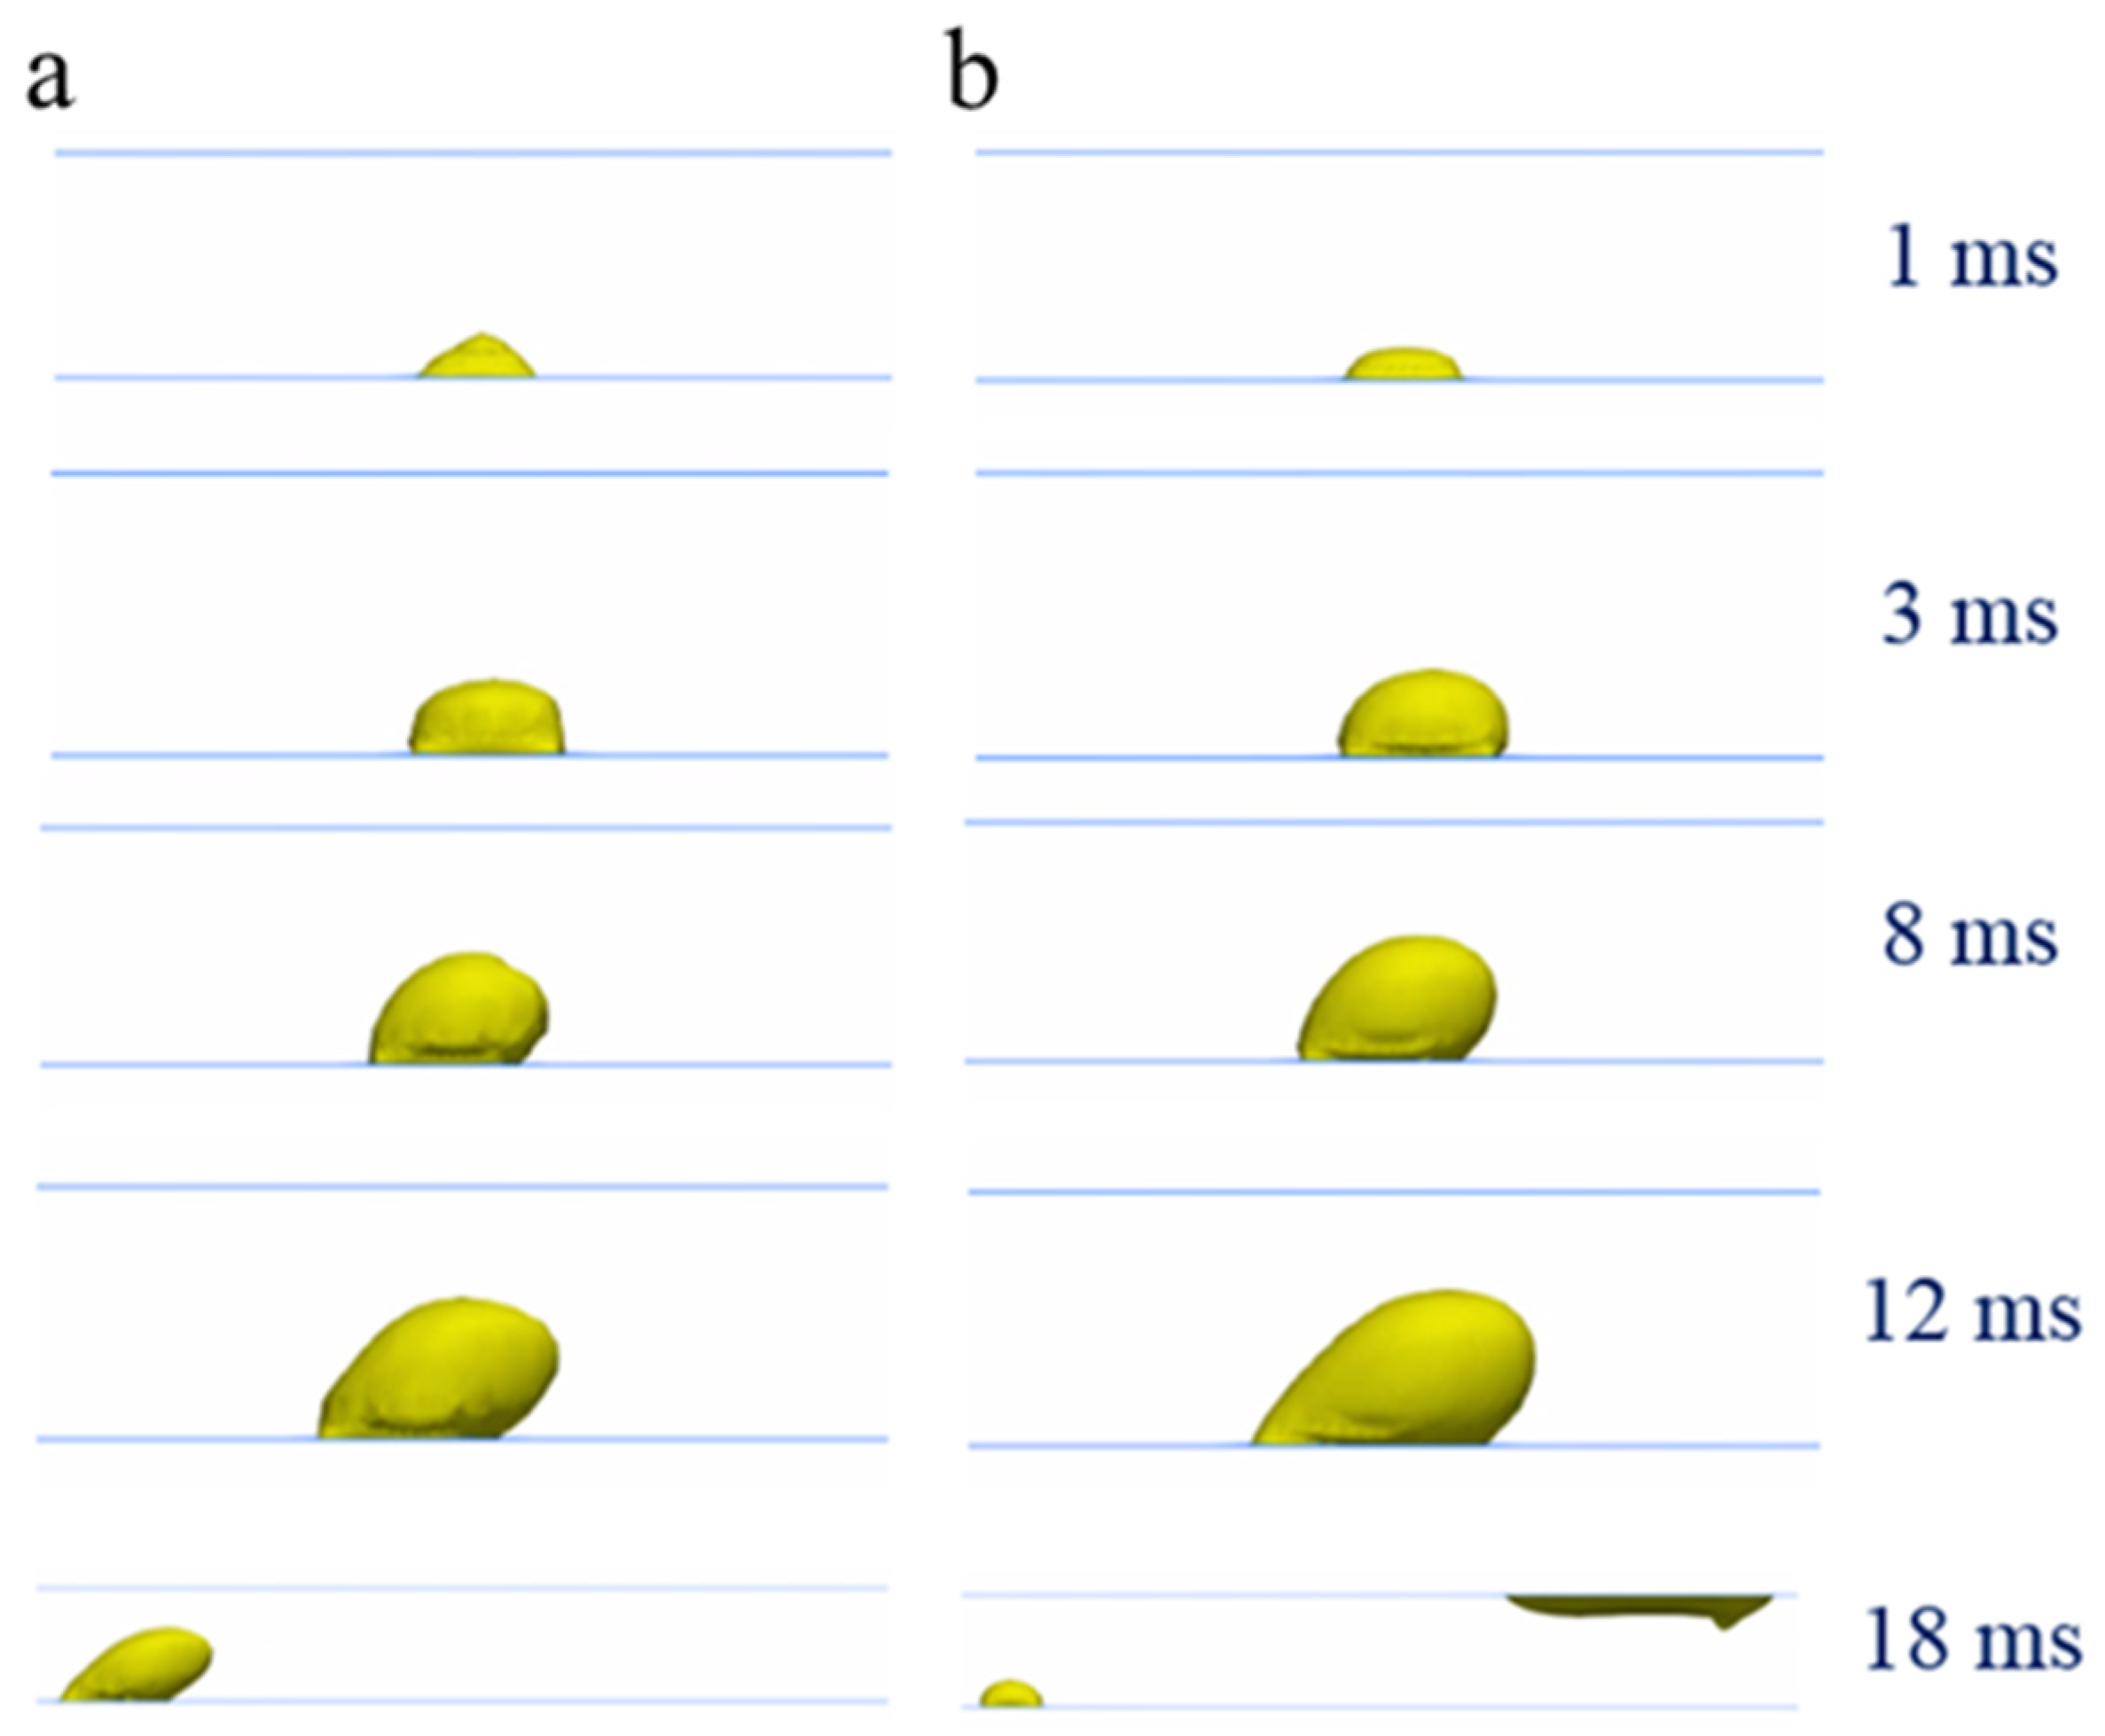
A mesh independence study was performed to ensure that the numerical predictions of droplet morphology, growth behavior, and detachment dynamics were not influenced by mesh resolution. Five structured hexahedral mesh configurations were generated, with characteristic cell sizes of 60, 45, 35, 25, and 15 μm, respectively. For each grid, the complete transient VOF simulation was conducted under identical operating and boundary conditions, and the droplet evolution was examined at several characteristic time instants (1 ms, 3 ms, 8 ms, and 12 ms). For coarse meshes with cell sizes ≥ 35 μm, the simulations consistently failed to capture the liquid–gas interface. The droplets were numerically dispersed shortly after emerging from the breakthrough points, indicating excessive numerical diffusion of the volume fraction field. Such artificial breakup prevented the prediction of physically meaningful droplet growth or detachment processes. When the mesh size was reduced to 25 μm in
Figure 3, the interface became continuous and droplet growth was qualitatively captured; however, the predicted detachment time and interface curvature still deviated from experimental observations due to insufficient spatial resolution near the contact line. Only the finest mesh with a characteristic size of 15 μm in
Figure 3 successfully reproduced all experimentally observed features all the time [
18], including the progressive droplet expansion on the GDL surface, the moment of detachment, and the post-detachment trajectory [
19]. The droplet size and detachment time obtained from this mesh showed excellent agreement with high-speed imaging data [
18], confirming that this resolution is sufficient for accurately resolving the interfacial curvature, capillary forces, and the competition between inertial and surface-tension effects. Based on this systematic assessment, the 15 μm mesh was selected for all subsequent simulations. While this refinement significantly increases computational cost, it ensures that the delicate interface dynamics and capillary-dominated physics are faithfully represented.
2.7. Adaptive Refine Mesh
An adaptive mesh refinement (AMR) strategy based on the OpenFOAM-11 dynamic mesh method was applied using a background cell size of 0.02 mm, one refinement layer, and a maximum of two refinement levels, enabling over an order-of-magnitude reduction in cell count while preserving interface resolution and droplet dynamics comparable to a uniform fine mesh.
2.8. Boundary Conditions and Solver Settings
OpenFOAM-11 software was used, with the interFoam solver [
34,
35]. Geometric parameters and physical properties are defined in
Table 1. Adjustable runtime was used, and the maximum Courant number (
Co, Equation (17)) and maximum alpha Courant number (
alphaCo, Equation (18)) were defined as 0.5 and 0.7, respectively.
where
u is the fluid velocity; Δ
t is the current time step; Δ
x is the mesh feature size; |
phi_f| is the flux of the mesh surface;
V is the mesh volume;
alpha.water is the phase fraction of the current mesh (0–1); and
ε is the small number to avoid the denominator being 0 when
alpha.water ≈ 0. The small number, typically 10
−12, is a numerical stability parameter to prevent the denominator from becoming zero.
For the gas and liquid inlets, uniform velocities with given average values were defined (according to
Table 1). Zero gradient was used at the outlet, with no-slip velocity on the wall. For pressure, the outlet was defined as a fixed value (zero), and all other boundaries were set to zero gradient. The boundary conditions for
alpha.water were defined as follows: gas inlet as uniform (value 0), outlet as zero gradient, gas channel wall as a contact angle of 53°, GDL surface as a contact angle of 140° (but this varies in the parameter study), and liquid inlet as uniform (value 1).
For all simulations in the parameter study, the scotch method was used to decompose the domain, suitable for 48 CPUs. The mesh used in this study achieved optimal computational speed with 48 CPUs.
Table 2 shows that adaptive meshing can save 75% of core time.
The VOF simulations serve as a virtual counterpart to physical experiments, leveraging high-performance computing (HPC) resources. The resultant datasets are expected to inform macroscopic upscaling approaches, such as pore-network modeling (PNM), which can be executed on conventional computational workstations.
4. Typical Force Analysis
To correct and clarify the mechanistic interpretation, four representative force scenarios are presented below with explicit reference to typical breakthrough geometries observed in the present simulations. For each scenario, the dominant force components—streamwise inertial force in Equation (10), transverse aerodynamic force in Equation (11), and vertical/lift force in Equation (12) (the three forces are the three components of inertial force)—are identified, and the resultant interfacial dynamics are discussed. Other forces are one to three orders of magnitude smaller than the aerodynamic force; therefore, the analysis here focuses on the effects of the aerodynamic force.
4.1. Gas Channel Sidewall Flow
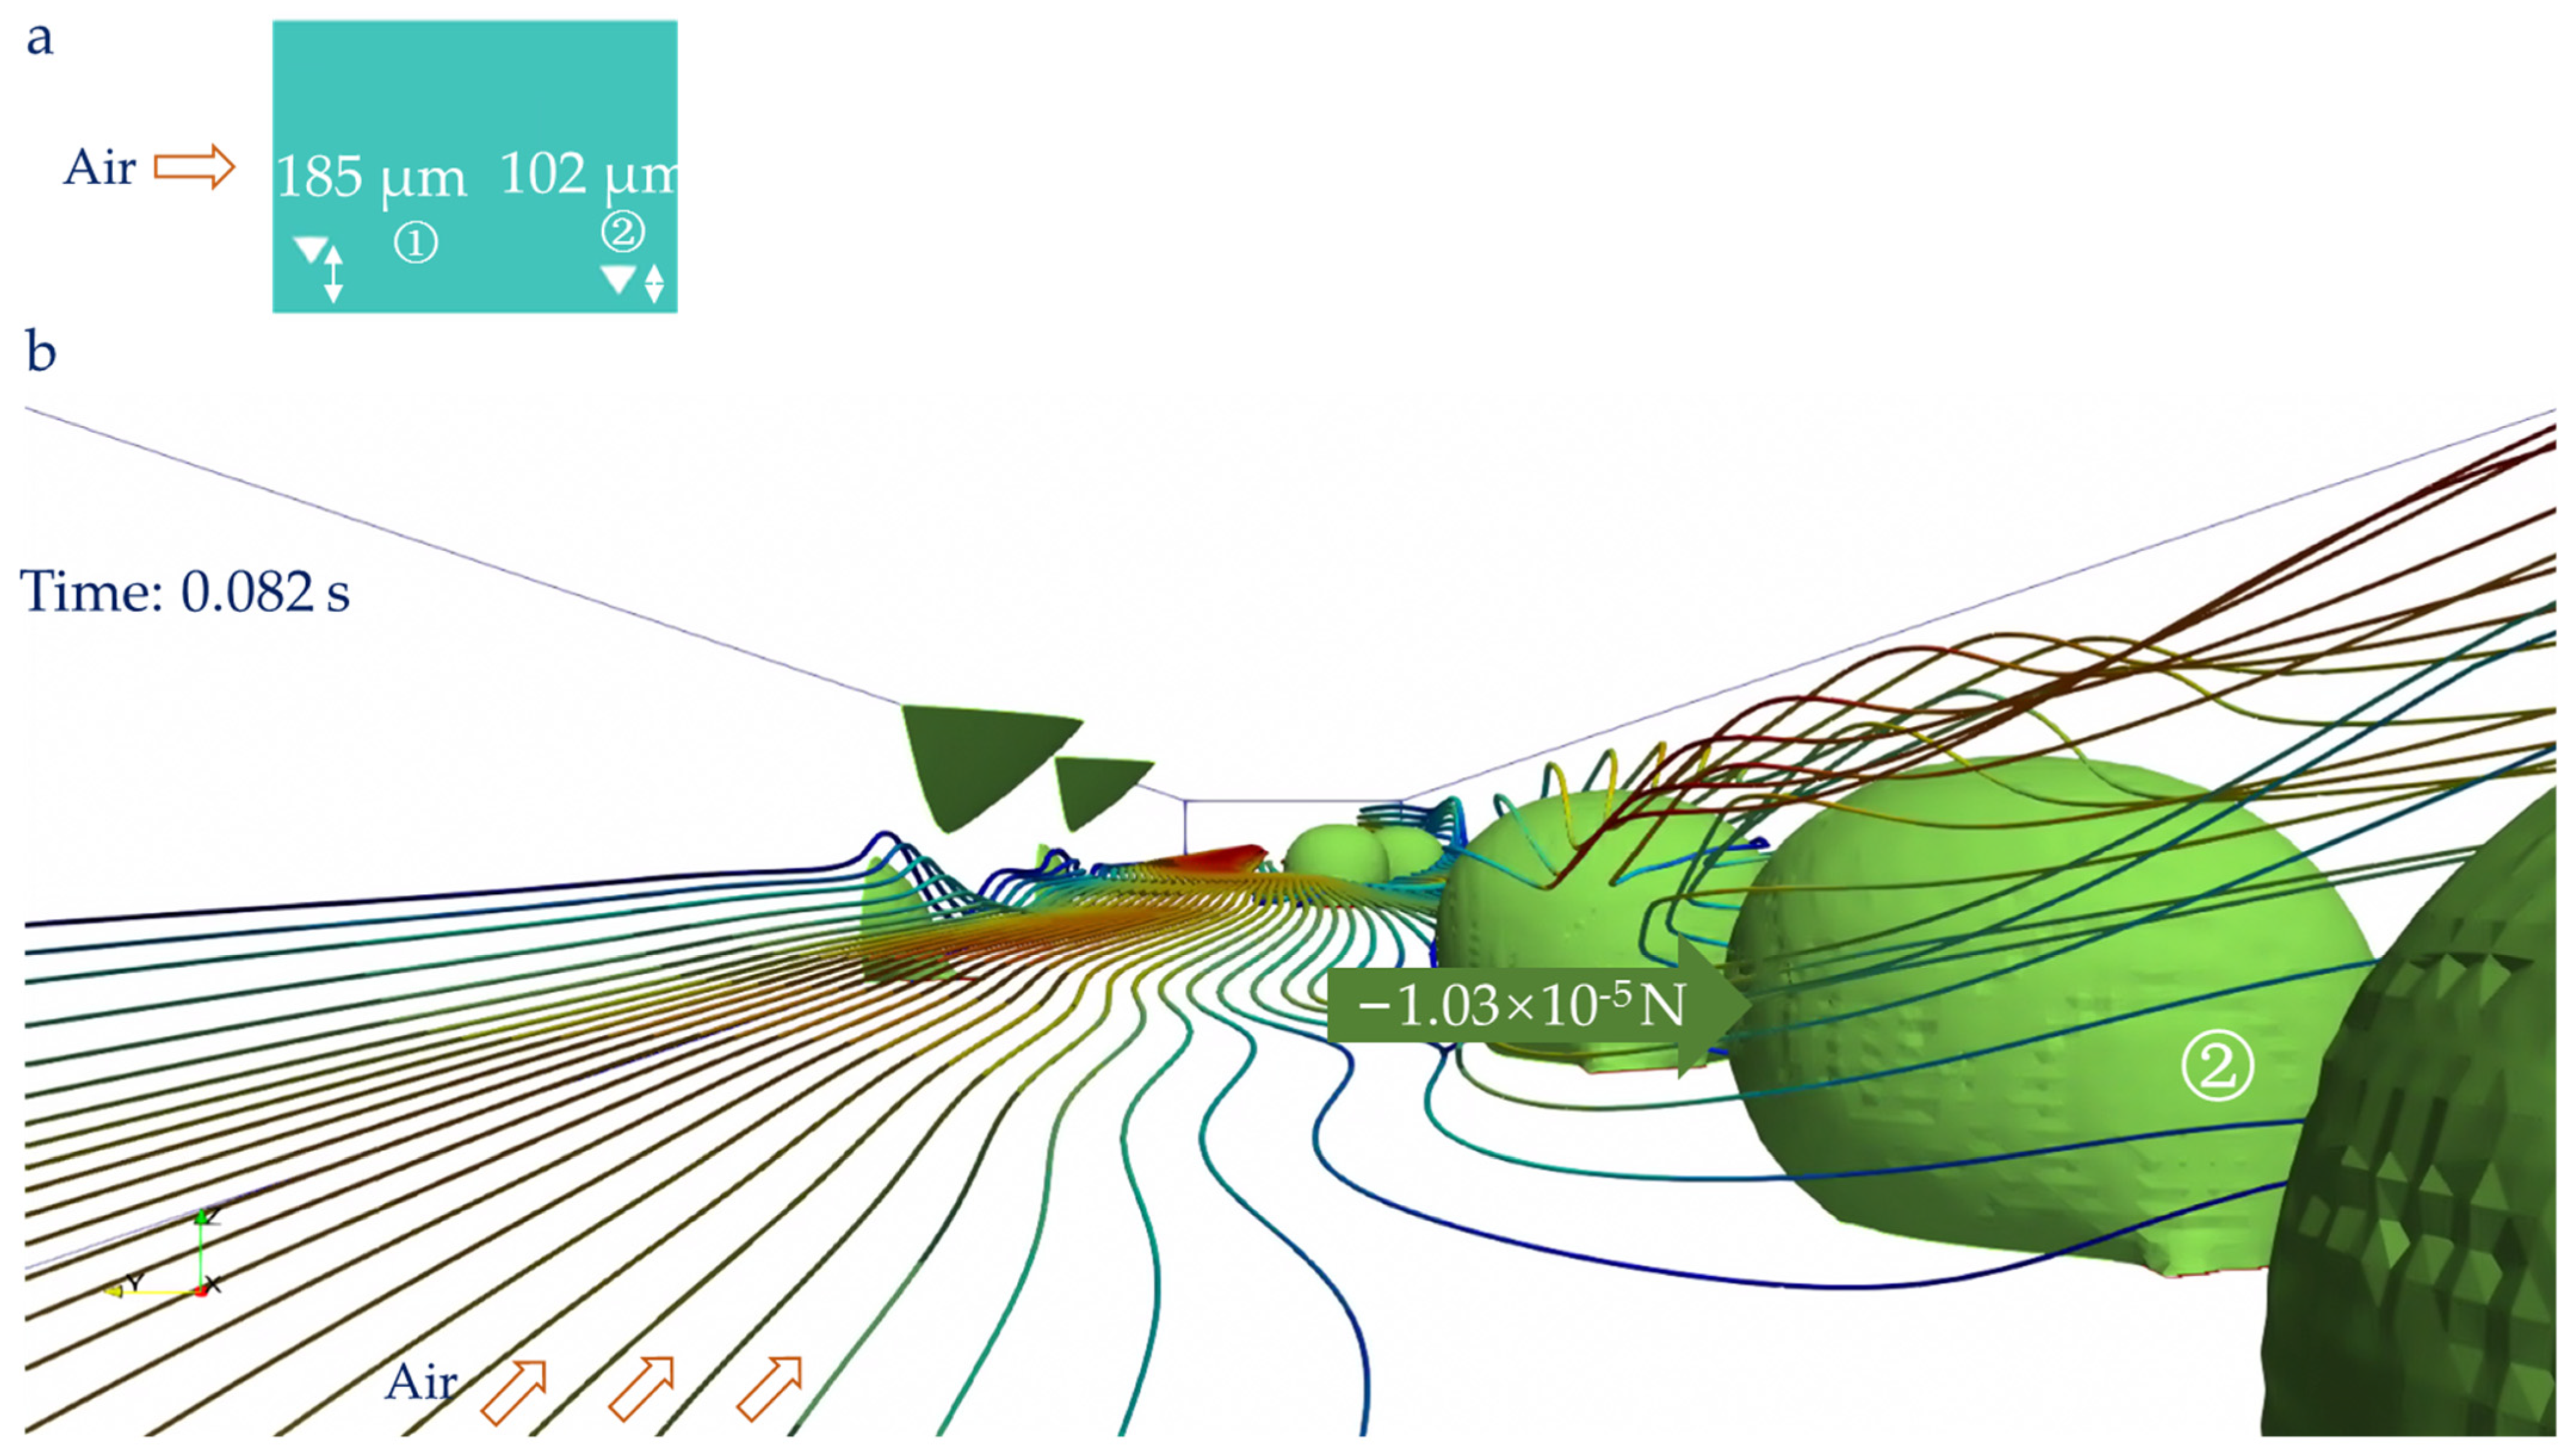
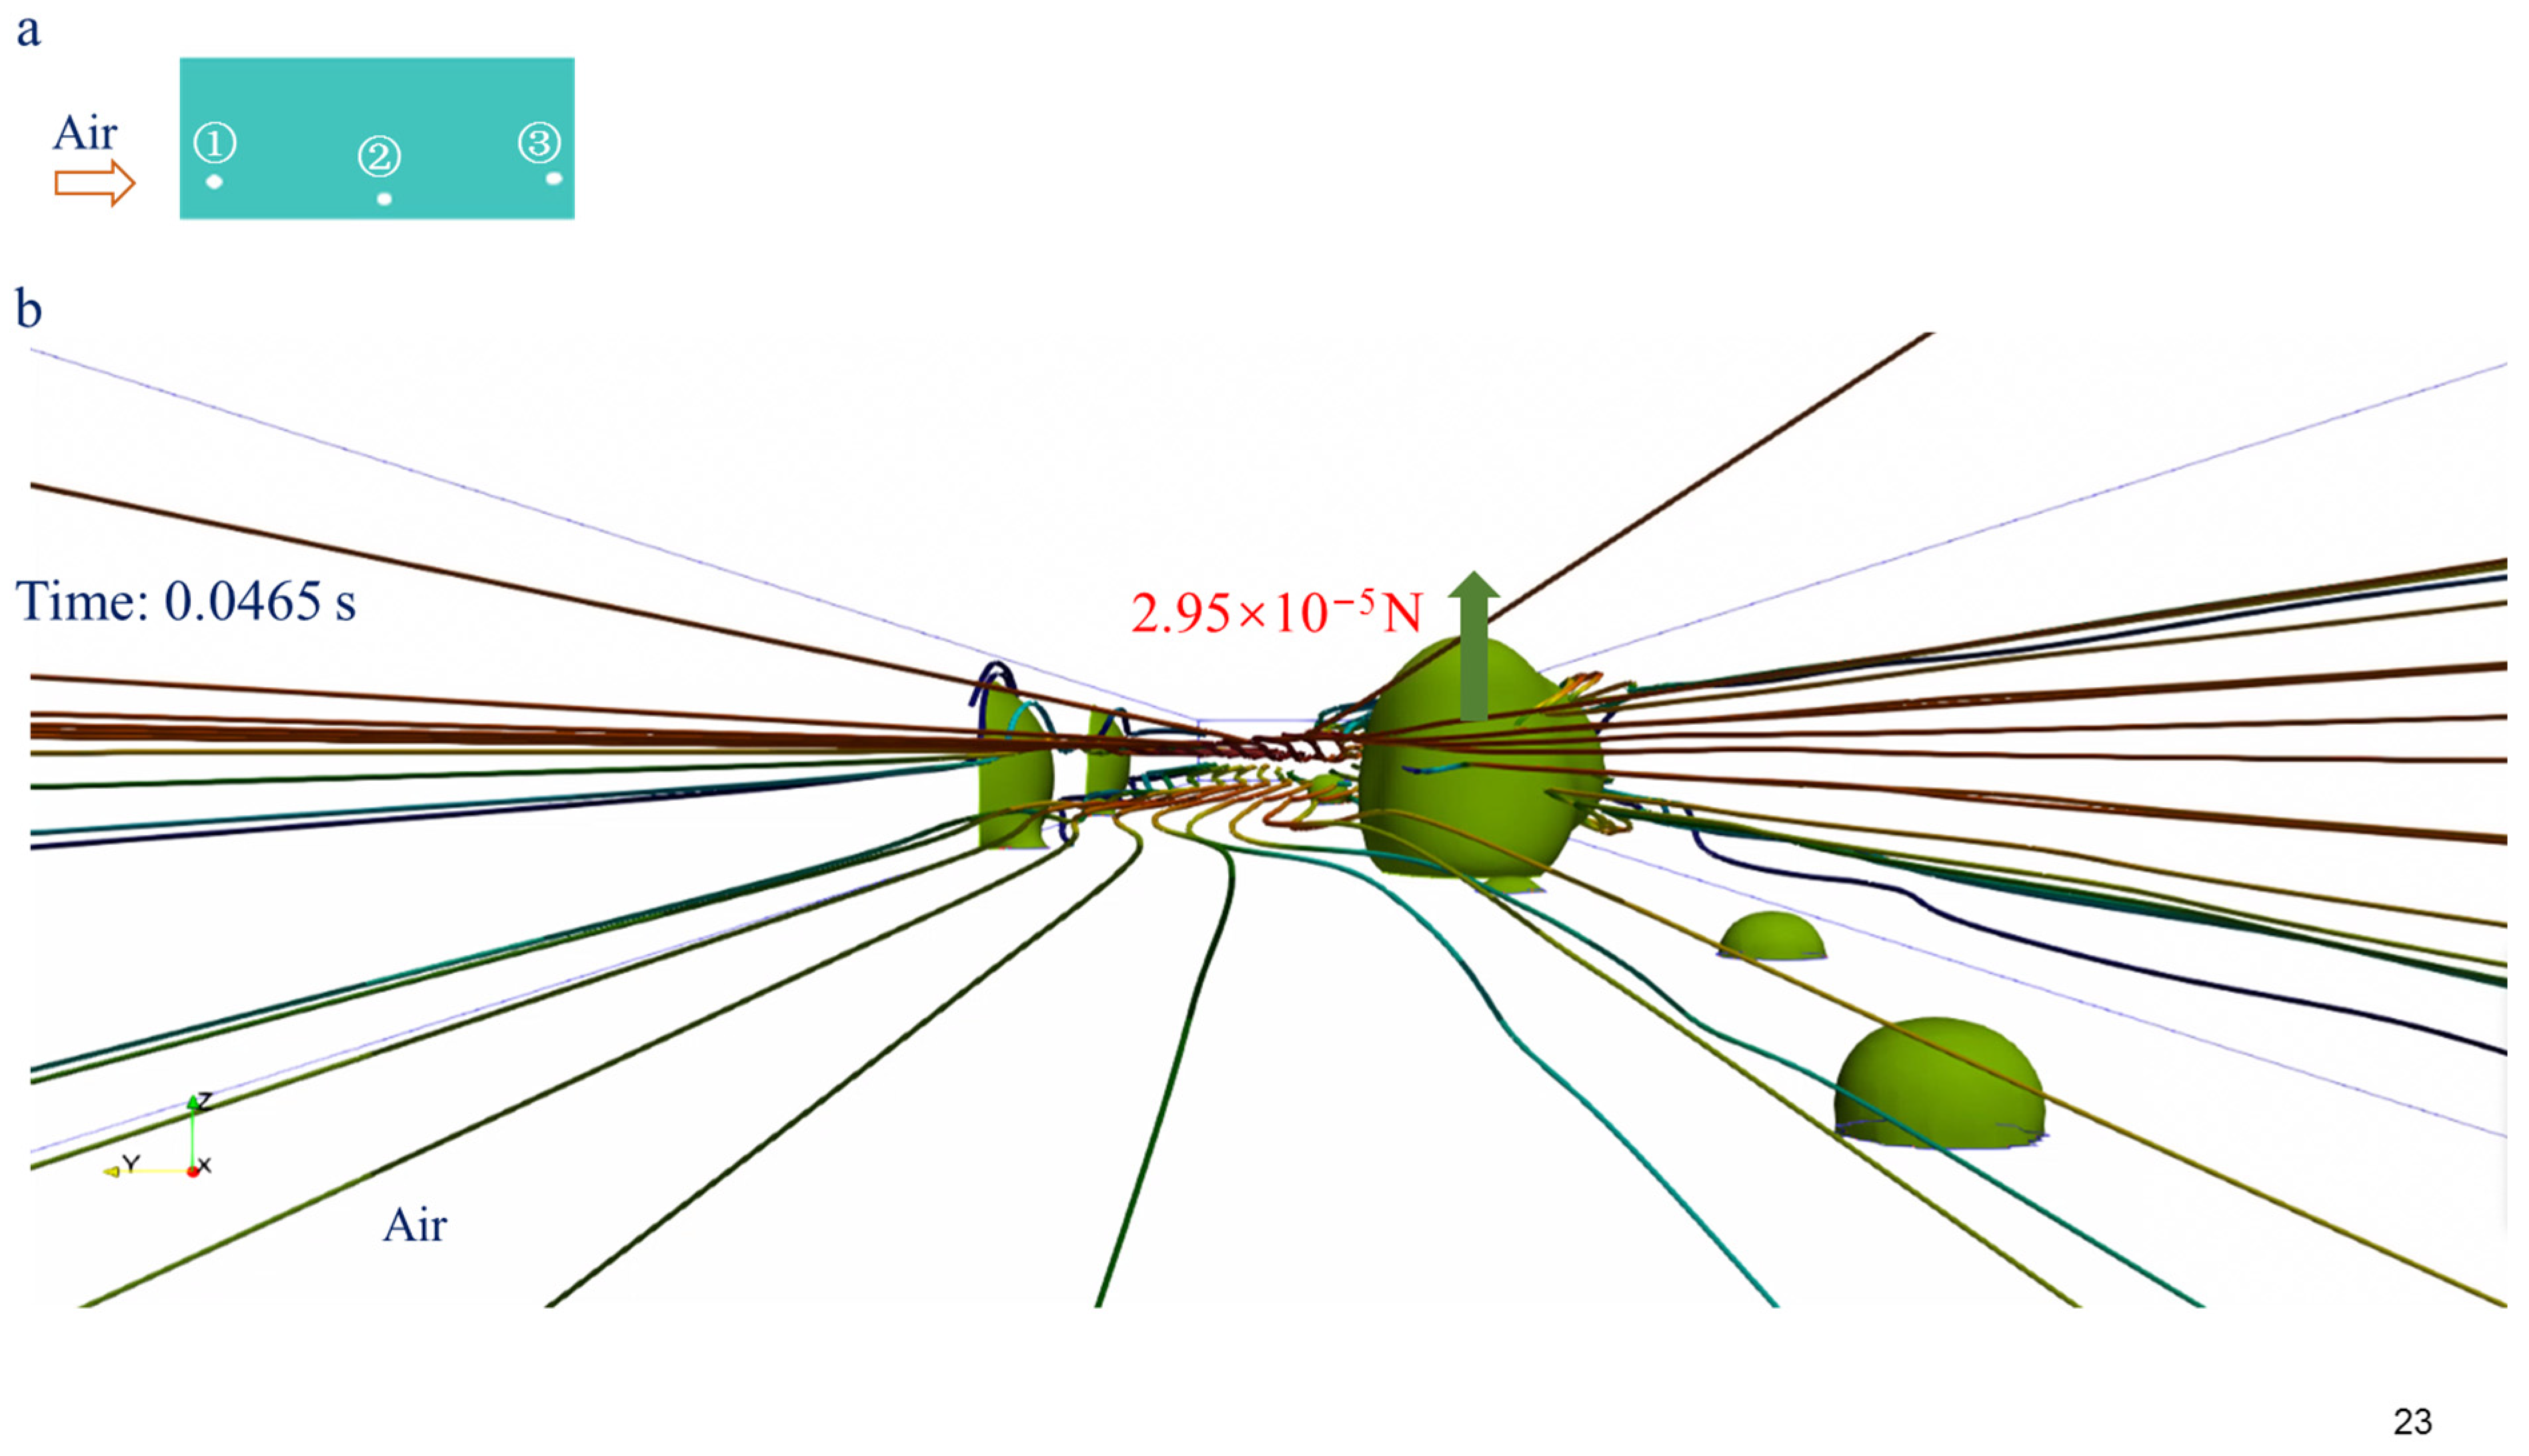
Figure 7 corresponds to droplets originating from triangular breakthrough geometries with an asymmetric windward orientation. For the second triangular inlet (② in
Figure 7), the centroid of the breakthrough opening is located closer to the sidewall, causing the incoming air to preferentially bypass the upper surface of the droplet. This asymmetric bypassing generates a significant transverse aerodynamic inertial force in the negative Y-direction, often comparable to or even exceeding the streamwise component
. The dominant
(−1.03 × 10
−5 N; the negative sign indicates the negative direction of the y-axis) drives pronounced lateral deformation toward the wall and promotes sliding or sidewall-adhering trajectories. Early detachment, directed merging with nearby droplets, and rapid transition to corner flow are therefore frequently observed. This behavior confirms that the asymmetric contact-line distribution and wall proximity inherent to triangular inlets strongly amplify the sensitivity of detachment volume and detachment time to the inlet orientation.
4.2. Gas Channel Corner Flow
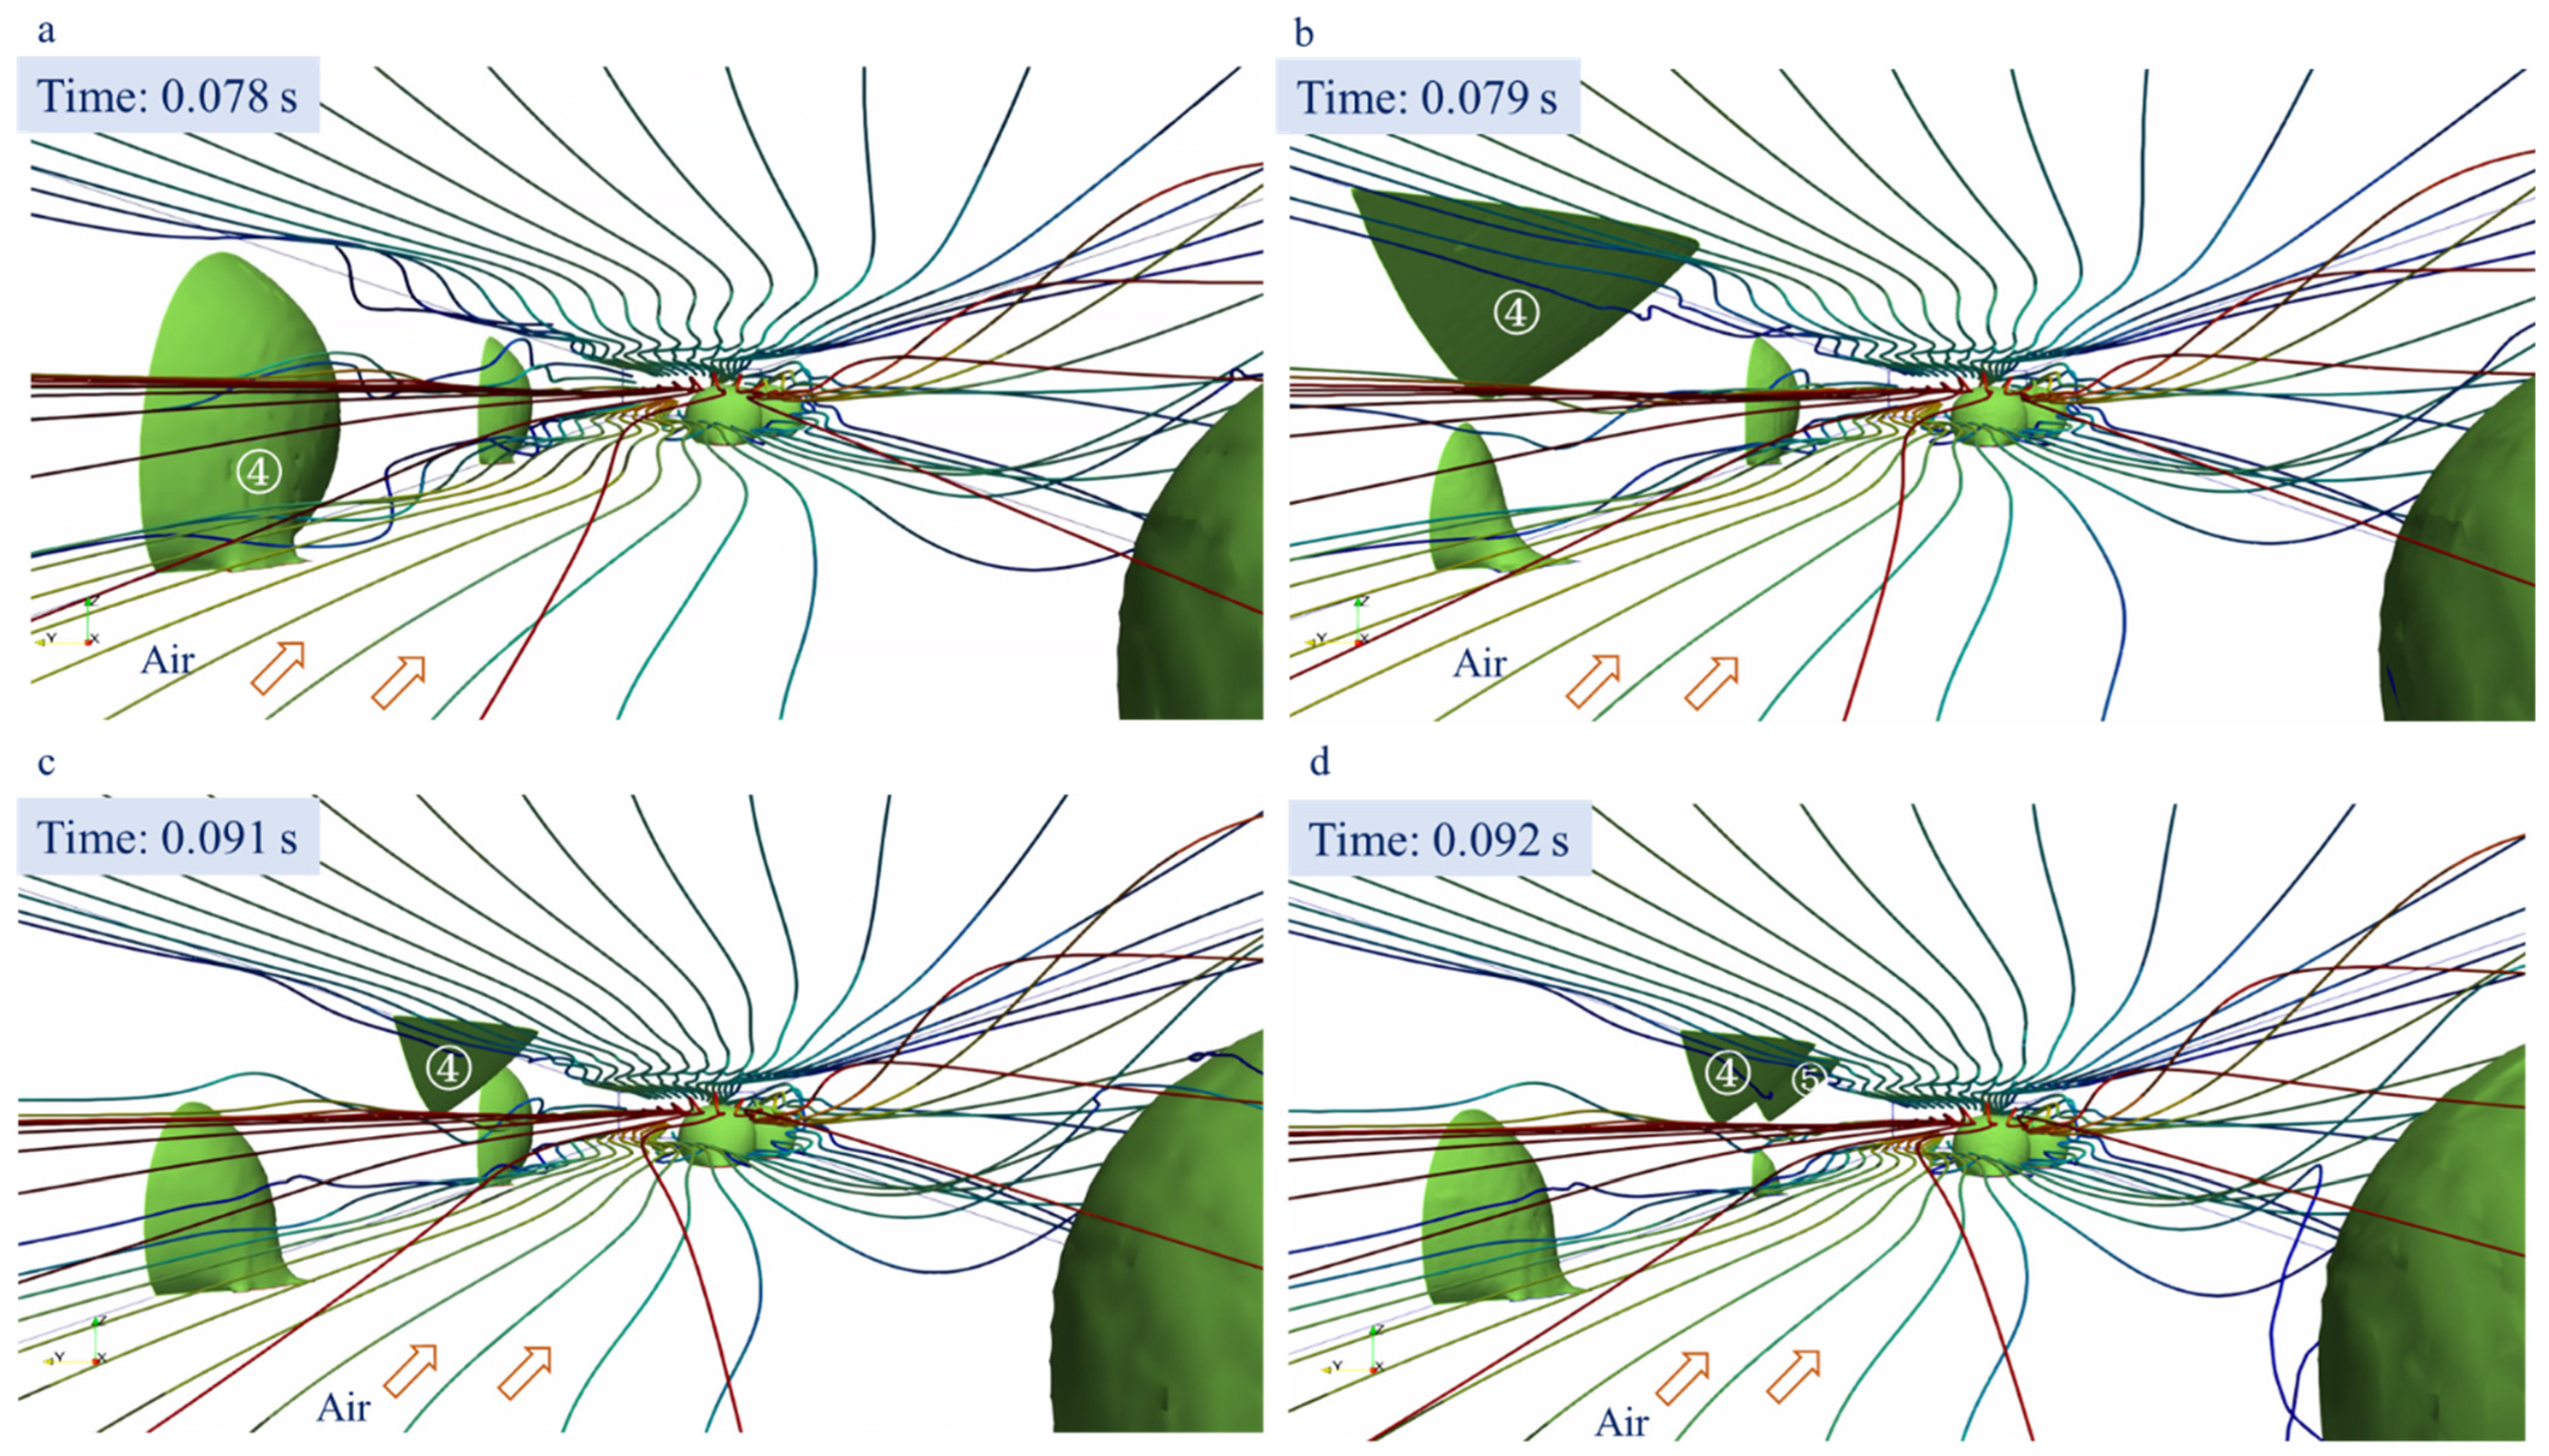
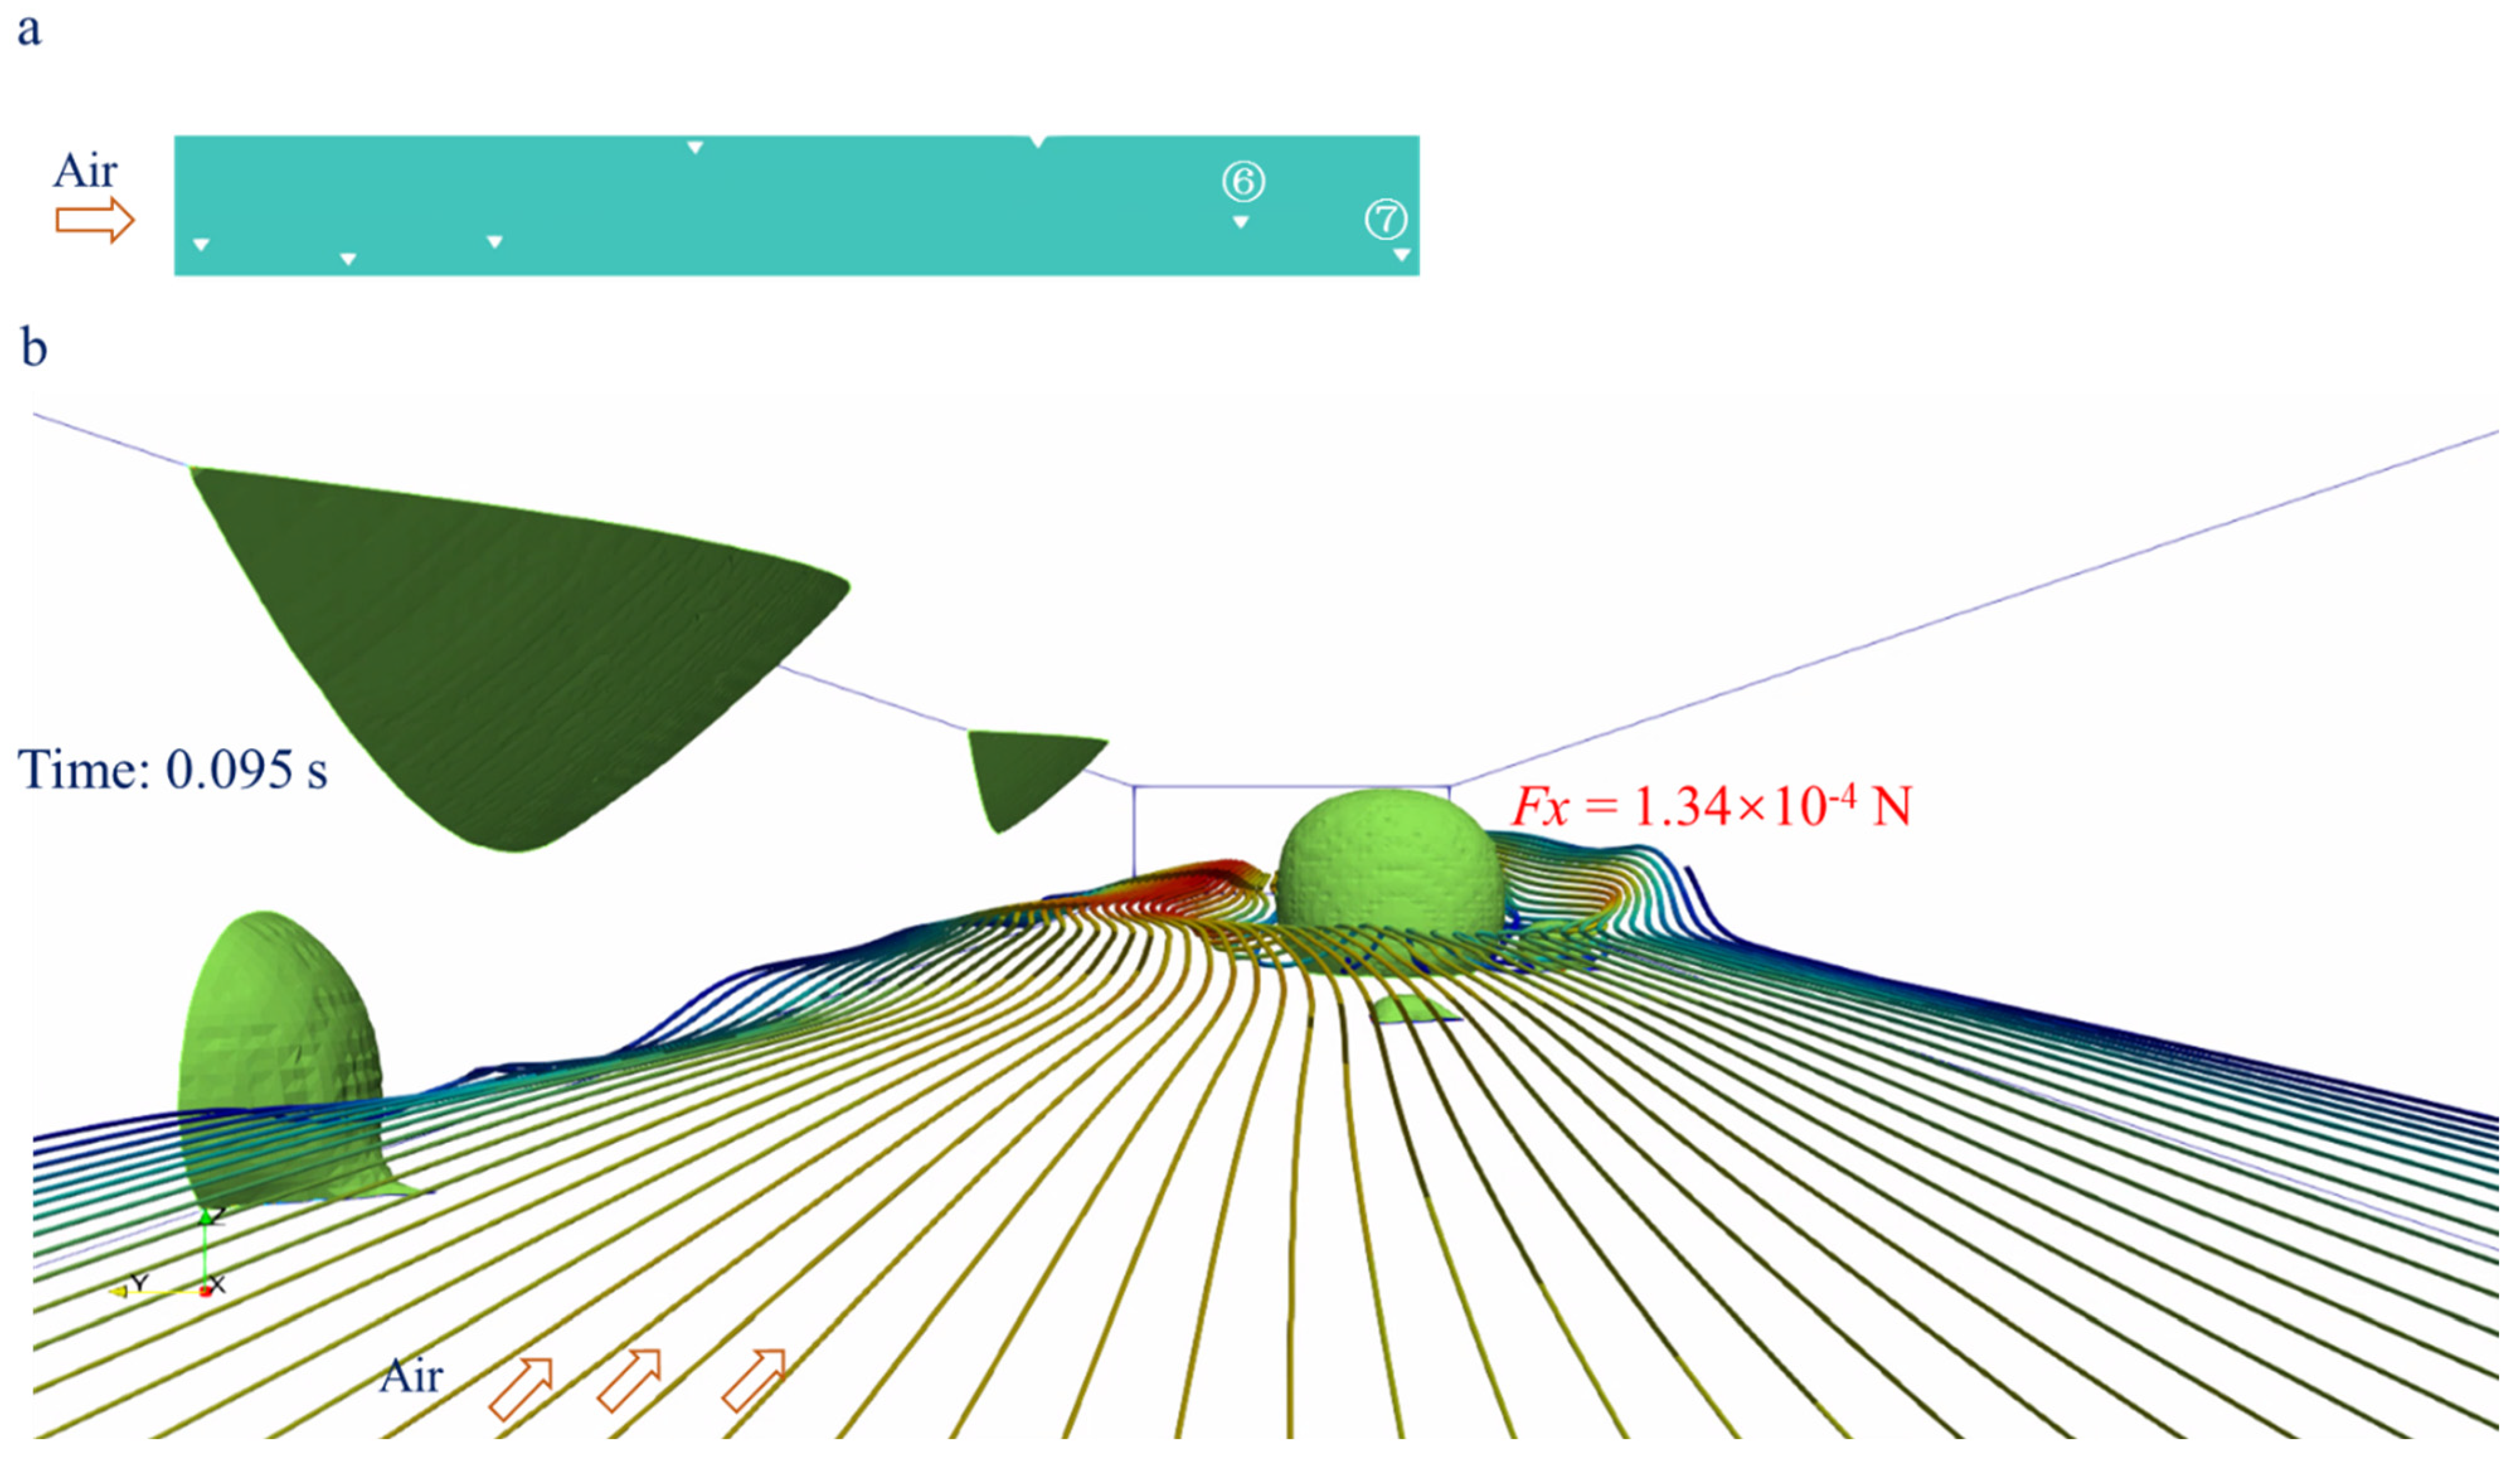
Figure 8 corresponds to breakthrough locations positioned close to the vertical gas channel wall. As the droplet grows, its expanding interface first makes contact with the wall. Because the wall surface is relatively hydrophilic, the local surface-tension forces promote lateral spreading of the liquid along the wall, rather than allowing the droplet to maintain a compact shape. This wall-induced spreading produces a quasi-axisymmetric frontal interface, despite the asymmetric inlet geometry (
Figure 8a, location ④). Consequently, the streamwise inertial force
becomes the dominant aerodynamic component in
Figure 8b,c, while the transverse and vertical forces remain small due to the stabilized, wall-flattened interface, as shown in
Table 5.
The combination of wall contact and hydrophilic spreading results in gradual downstream stretching and highly repeatable detachment volumes and detachment times. Prior to detachment, the droplet evolves in a quasi-static manner, with capillary adhesion along the extended wall contact line counterbalancing
. Detachment finally occurs when
exceeds this capillary retention in
Figure 8b; the droplet moves (
Figure 8c), and then coalescences (
Figure 8d, droplets of location ④and location ⑤). This sequence—initial expansion, wall contact, hydrophilic spreading, and capillary-controlled evolution—explains the stable and predictable drainage behavior observed under different airflow conditions.
4.3. Flow on the Upper Wall of the Gas Channel
The scenario in
Figure 9 occurs for droplets originating from circular breakthrough inlets that generate relatively smooth and symmetric initial interfaces. As the droplet grows, its volume eventually becomes large enough for the upper part of the interface to contact the gas channel ceiling. Once the liquid touches the upper wall, the surface-tension force at the ceiling–droplet contact line acts together with the aerodynamic vertical (lift) force
to pull the droplet upward.
In this configuration, no longer acts solely to deform the interface but instead cooperates with the capillary adhesion at the upper wall. This combined action causes the droplet to migrate toward the ceiling, after which it can either spread along the upper wall or undergo upward detachment into the core flow, depending on the balance between and the capillary retention.
Because circular inlets produce relatively uniform interface curvature, the upward transition is governed primarily by droplet size and the oncoming gas flow rather than geometric irregularity. Once ceiling contact is established, the amplified vertical loading and capillary anchoring often lead to stable upper-wall sliding or the formation of elongated rivulets along the ceiling. This behavior represents a distinct lift-assisted, wall-contact-mediated transport mode.
4.4. Gdl-Surface Flow
Figure 10 shows a situation in regions near the downstream end of the gas channel, where multiple breakthrough points exist but their spacing and operating conditions do not favor droplet merging. In this regime, droplets remain relatively small and continue to move along the GDL surface without coalescing into a larger structure. As a result, the droplet volume never becomes large enough to reach or interact with the upper wall.
Under these conditions, none of the aerodynamic inertial force components—, , or —is dominant. The streamwise force is largely balanced by capillary retention on the GDL, while moderate and only introduce minor perturbations. This balanced-force environment leads to extended residence time on the GDL, slight oscillation of the contact line, and persistent surface sliding rather than detachment or upward migration. The droplets therefore follow a relatively stable, surface-confined trajectory determined by the combined but moderate contributions of , , and , without forming composite droplets or continuous rivulets.
Although the orders of magnitude of the forces acting on the droplets align with those reported by Niblett et al. [
31], atomic force microscopy (AFM) or optical tweezers could be further employed to conduct an in-depth analysis of the forces and validate the simulation results.
5. Conclusions
This study conducted a comprehensive three-dimensional VOF simulation to investigate the effects of breakthrough geometry, operating conditions, and interfacial forces on two-phase flow behavior in a PEFC gas channel. The results demonstrate that liquid–gas interface evolution, droplet morphology, and drainage rate are highly sensitive to the inlet shape, air velocity, wettability, and the number of breakthrough sites.
The airflow velocity governs the overall drainage performance by directly modifying the balance between inertial and capillary forces. Higher air velocities accelerate droplet deformation and detachment, reduce the residence time on the GDL surface, and promote downstream transport or coalescence-driven removal. Conversely, reduced airflow leads to larger droplet volumes and delayed detachment. Breakthrough geometry was found to be equally important: circular and hexagonal openings provide stable and repeatable detachment behavior due to symmetric aerodynamic loading, whereas triangular or sharply edged inlets generate strong transverse or vertical force components, producing early distortion, asymmetric trajectories, and frequent merging events. Breakthrough size, water injection velocity, and contact angle further influence the detachment volume and transition between surface flow, corner flow, and upper-wall sliding.
The force decomposition further clarifies the physical origins of the diverse droplet behaviors observed in this study. Four distinct force scenarios emerge across the different breakthrough conditions. (i) Transverse-force-dominated motion occurs for asymmetric triangular inlets whose proximity to the wall and upper-surface bypassing generate a strong negative-Y inertial component, producing lateral deformation and directed sliding. (ii) Streamwise-dominated detachment arises when droplets expand, contact the sidewall, and spread along the hydrophilic surface; the resulting quasi-axisymmetric interface stabilizes transverse and vertical forces, allowing to govern detachment in a highly predictable manner. (iii) Lift-assisted upward migration appears for large droplets formed at circular inlets once they reach the gas channel ceiling, where capillary adhesion at the upper wall works together with the vertical lift force to drive upward spreading or ceiling-attached rivulet formation. (iv) Balanced-force regimes occur near the downstream GDL surface where droplets remain small and do not merge; here , , and are comparable, suppressing detachment and maintaining a stable surface-sliding motion.
From an engineering perspective, the findings highlight fundamentally different water-management requirements on the cathode of PEFC. On the cathode, rapid and reliable drainage is essential to prevent oxygen transport limitations; therefore, breakthrough shapes that promote early detachment—such as circular openings—and higher local airflow are advantageous for minimizing gas channel blockage. Thus, the statistical distribution of breakthrough shapes and local wettability should be tailored independently on the cathode according to their contrasting water-management objectives.
Overall, this study provides a detailed mechanistic framework for understanding how microscale breakthrough geometries and interfacial forces regulate drainage kinetics and water distribution in the PEFC gas channel. The insights gained here offer guidance for the targeted design of GDL microstructures, breakthrough-shape distributions, and operating strategies to simultaneously enhance cathode drainage, thereby improving the durability and performance of next-generation PEFC.