1. Introduction
Mitigating the most severe consequences of climate change requires rapid and substantial reductions in global greenhouse gas emissions. The Paris Agreement, a legally binding international treaty on climate change, seeks to limit the increase in global average temperature to well below 2 °C above pre-industrial levels [
1]. To achieve this objective, global carbon dioxide emissions must decrease by approximately 45% relative to 2010 levels by 2030, while net-zero emissions must be achieved by 2050.
Traffic is one of the main sources of CO
2 emissions worldwide. The transportation sector is responsible for approximately 24% of all energy-related CO
2 emissions globally [
2]. The transition from conventional internal combustion engine vehicles to electric alternatives, hybrid electric vehicles (PHEVs) and battery electric vehicles (BEVs), represents a key strategy for reducing the carbon footprint of the transportation sector.
More than 260 million passenger cars are currently in operation across the European Union, the majority of which are still powered by petrol or diesel fuels [
3]. To achieve climate neutrality by 2050, a large proportion of these vehicles will need to be replaced by electric or hydrogen-powered alternatives. This transition will require not only the large-scale production of low-emission vehicles but also a substantial expansion of low-carbon electricity and hydrogen generation capacity to support their operation. In this study, we present a methodology for evaluating how different low-carbon energy sources, including wind, solar, and nuclear power, can be combined with energy storage systems to supply electricity for electric vehicles. We also propose a straightforward workflow for quantifying the CO
2 emission reductions achievable through energy storage. Specifically, the methodology assesses how surplus electricity generated from variable renewable energy sources can be stored in batteries and subsequently used for charging electric vehicles, thereby increasing renewable energy utilization and reducing overall emissions. In our methodology, an idealized system was modeled, so our work is rather an upper-bound analysis but not the description of a realistic storage system.
Hungary, a small country in Central Europe, provides an interesting case study for investigating the role of energy storage technologies, such as sodium–sulfur (NaS) batteries, in reducing carbon emissions and increasing the use of renewable electricity for transport decarbonization. The number of electric vehicles (EVs) in Hungary increased nearly tenfold between 2020 and 2026 [
4], and further growth is expected in the coming years. Currently, more than four million passenger cars, vans, and buses are in operation in the country [
5], while only a small fraction—slightly over 100,000 vehicles—are electric. The increasing deployment of battery electric vehicles (BEVs) and plug-in hybrid electric vehicles (PHEVs) offers several environmental benefits, including lower noise levels and the elimination of tailpipe emissions during electric operation, making them particularly effective for reducing urban air and noise pollution.
In parallel with the growth of electric mobility, Hungary has developed a diverse electricity generation portfolio characterized by a rapidly increasing share of solar power. The expansion of photovoltaic capacity has made solar energy one of the country’s most important renewable energy sources. However, the inherent variability of solar generation creates challenges for balancing electricity supply and demand, highlighting the growing importance of large-scale energy storage solutions. This combination of rapidly increasing EV adoption and a high share of variable renewable generation makes Hungary a particularly suitable case for assessing how energy storage can support transport electrification while minimizing life-cycle CO2 emissions.
A major challenge associated with the widespread adoption of battery electric vehicles (BEVs) and plug-in hybrid electric vehicles (PHEVs) is their substantial electricity demand. Supplying this additional demand at many charging locations requires significant investments in electricity generation capacity, charging infrastructure, and transmission and distribution networks.
Currently Hungary runs national programs to upgrade, digitalize, and expand its electricity grid. Strengthening the transmission grid—in addition to the electricity demand of the future EV fleet—is also required because the heat waves in summer are getting more frequent and intense. As a result of this, the electricity consumption of the air conditioning between 6 and 10 p.m.—that can be also seen in the electricity demand data for July used in our calculations—is very likely to grow. Satisfying the energy need for cooling also requires the modernization of both the transmission grid and the power plant fleet.
Another important challenge is the carbon intensity of electricity generation. In 2025, the global average carbon intensity of electricity remained approximately 458 g CO
2-eq/kWh, while the average value in the European Union was about 210 g CO
2-eq/kWh [
6]. Hungary represents an especially interesting case for studying the life-cycle emissions of electric vehicle operation because the carbon intensity of its electricity supply exhibits both daily and seasonal variability, largely due to the high share of solar generation.
Most EV users charge their vehicles at home during the evening hours, typically between 6:00 p.m. and 10:00 p.m. During this period, solar generation is unavailable, resulting in a higher carbon intensity of grid electricity. At the same time, electricity demand is often close to its daily peak, placing additional stress on the power system. Consequently, the climate benefits of large-scale transport electrification will depend not only on the expansion of low-carbon electricity generation but also on the implementation of smart charging strategies and energy storage solutions capable of shifting renewable electricity from periods of excess generation to periods of high demand.
Current research has investigated strategies for integrating electric vehicle charging into modern power systems [
7]: smart charging approaches shift vehicle charging toward periods of lower electricity demand or higher renewable electricity generation, reducing peak load and improving the utilization of renewable energy [
8]. Battery-supported charging stations are also a highly researched, emerging field, because stationary energy storage systems can buffer fast-charging demand, reduce grid connection requirements, and postpone costly network upgrades [
9,
10]. More recently, vehicle-to-grid (V2G) technologies have been proposed to utilize parked electric vehicles as distributed energy storage resources capable of providing ancillary services, peak shaving, and renewable energy balancing [
11].
Although these approaches differ in implementation, they share the common objective of increasing renewable electricity utilization while reducing the environmental impact of transport electrification [
7]. Previous studies have primarily focused on charging optimization, charging infrastructure design, grid integration, or operational performance of storage systems [
7,
8,
9,
10]. Comparatively fewer studies have evaluated how different charging concepts influence the life-cycle CO
2 emissions of electric vehicle operation under realistic national electricity generation mixes [
12,
13,
14].
The present study complements these earlier works by evaluating three charging scenarios using hourly electricity generation data for Hungary. Emphasis is placed on quantifying how stationary NaS battery storage influences renewable electricity utilization and the life-cycle carbon emissions associated with electric vehicle charging.
1.1. Life-Cycle Carbon Emission of Electric Vehicle Usage
Although electric buses, vans, and passenger cars produce no tailpipe emissions during operation, the electricity used to power them may still be associated with significant greenhouse gas emissions. The life-cycle carbon footprint of electric vehicle travel depends primarily on three factors:
- i.
Greenhouse gas emissions associated with vehicle manufacturing (see
Appendix A);
- ii.
The vehicle’s electricity consumption;
- iii.
The life-cycle carbon intensity of the electricity used for charging.
According to the National Laboratory of the Rockies (NLR) [
15], the median life-cycle greenhouse gas emissions associated with the generation of 1 kWh of electricity are:
Coal: 1001 g CO2-eq/kWh;
Natural gas: 486 g CO2-eq/kWh;
Solar power: 43 g CO2-eq/kWh;
Wind power: 13 g CO2-eq/kWh;
Nuclear power: 13 g CO2-eq/kWh.
To illustrate the importance of low-carbon electricity for electric vehicle operation, we calculated the electricity required for different travel distances and the corresponding life-cycle CO
2 emissions of an average electric passenger car with an electricity consumption of 0.189 kWh/km [
16] (
Table 1). For smaller cars with less electricity consumption (e.g., 0.149 kWh/km) the emission is smaller, but for a bigger SUV that requires more electricity the emission is larger. This shows that, if we really want to decrease the CO
2 emission of traffic, small electric vehicles should be used.
For comparison, the well-to-wheel greenhouse gas emissions of conventional petrol vehicles typically range from 151 to 245 g CO
2/km [
17]. In this study, a value of 170 g CO
2/km reported by the UK Government [
18] was used as the reference for petrol vehicle operation.
As shown in
Table 1, an electric vehicle charged exclusively with coal-based electricity can exhibit higher life-cycle CO
2 emissions per kilometer traveled than a conventional petrol vehicle. This highlights the critical importance of decarbonizing electricity generation in parallel with the electrification of road transport.
With an electricity consumption of 0.189 kWh/km, an electric vehicle can travel more than 100 km using 20 kWh of electricity. This range is sufficient for commuting from surrounding towns to the capital and returning home after work. A daily energy supply of 10 kWh enables a driving range of approximately 50 km, which is adequate for most urban travel in Budapest and other Hungarian cities. For example, the Budapest Mobility Survey reported that the average distance traveled by a passenger car on a weekday was 33 km in 2022, increasing to 54 km per day on weekends [
19].
Based on these data, this study assumes a daily electricity demand of 10 kWh per vehicle when estimating the number of EVs that could be supplied by solar power generation and when calculating the associated CO2 emissions. This amount of energy is sufficient to cover most daily trips, including most weekend journeys.
To make our results applicable for a wide range of vehicles and driving conditions, in the
Section 2 and
Section 4 we present modifying factors for our results. Using these data, the charged vehicle number and the avoided CO
2 emissions can be calculated for every vehicle fuel economy and driving behavior from the baseline data provided in the manuscript. These data can be used for a parametric analysis to investigate how the vehicle electricity consumption and daily driven distance influence the charged vehicle number and avoided CO
2 emissions.
The life-cycle carbon emissions associated with electric vehicle operation can be reduced through two principal approaches:
- i.
Establishing sufficient power plant fleet that is able to generate enough energy to operate the EVs and charging the vehicles when there is enough low-carbon electricity;
- ii.
Using energy storage systems to capture low-carbon electricity and make it available for vehicle charging at a later time. This approach reduces the dependence of charging on short-term fluctuations in renewable generation, although it still requires adequate low-carbon electricity production.
Energy storage technologies, including lithium-ion, lead–acid, and sodium–sulfur (NaS) batteries, can help address both generation-related constraints and limitations in grid capacity. Storage systems also enable solar energy generated during the day to be used for EV charging during evening and nighttime hours. Similarly, electricity from wind and nuclear power plants can be stored during periods of low demand and high generation, thereby increasing the share of low-carbon electricity available for vehicle charging.
Thus, the aim of this study is to develop and apply a methodology for assessing how renewable electricity generation and energy storage can support electric vehicle operation, quantify the number of vehicles that can be supplied under different conditions, and evaluate the resulting life-cycle CO2 emission reductions in Hungary. Using an idealized system, our results provide an upper-bound estimate of how combining energy storage with renewable generation can reduce the CO2 emissions associated with electric vehicle use.
1.2. Energy Storage with Batteries
Battery energy storage systems (BESSs) play an important role in integrating variable renewable energy sources into modern electricity systems by storing surplus electricity during periods of high renewable generation and supplying it during periods of increased demand [
9]. Stationary batteries improve grid flexibility and increase the utilization of low-carbon electricity. The BESS is expected to become an important component of future electric vehicle charging infrastructure [
7,
8,
9,
10].
Several battery technologies are currently available for stationary energy storage, including lead–acid, lithium-ion, NaS, and flow batteries. Lithium-ion batteries dominate many commercial applications because of their high energy density and efficiency, although concerns remain regarding the environmental impacts of battery manufacturing and the use of critical raw materials such as lithium and cobalt [
12,
13,
14]. Flow batteries offer long service lifetimes but generally have lower round-trip efficiencies and higher investment costs [
7].
In this study, sodium–sulfur batteries were selected because they are a commercially established technology for large-scale stationary energy storage [
7]. Although lithium-ion batteries currently dominate stationary storage installations, NaS batteries remain an attractive option for long-duration grid-scale energy storage because of their long lifetime and the use of abundant raw materials. These characteristics make them suitable for storing renewable electricity generated during periods of high solar production and supplying this electricity later for EV charging [
9,
10]. Although the methodology presented in this work could also be applied to other stationary battery technologies, NaS batteries provide a representative case for evaluating the environmental benefits of large-scale energy storage.
Batteries—like many devices used for energy storage—have a specific lifespan (cycle number) and the performance degradation of such devices can also be an important factor as the batteries age. In a real life-cycle study all of these parameters must be considered, but the goal of our study was to show the maximum potential of using energy storage to enhance renewable electricity usage, so we decided to provide data for future studies. Here we present data for 100% efficiency and give modifying factors to apply real-life conditions. For example, the modifying factors in
Table 2 and
Table 3 can be used to simulate how the total efficiency of the system decreases as the NaS battery ages.
2. Materials and Methods
The objective of the methodology was to quantify the potential contribution of large-scale sodium–sulfur (NaS) battery storage to electric vehicle charging and to evaluate the associated life-cycle CO2 emission reductions under Hungarian electricity system conditions. The analysis combined hourly electricity generation data from major Hungarian power plants with life-cycle carbon intensity factors for different electricity generation technologies. First, the amount of photovoltaic electricity that could be stored in NaS batteries was estimated for representative weeks of four seasons. The stored energy was then used to determine the number of electric vehicles that could be charged under different charging schedules and storage configurations. Finally, the life-cycle carbon intensity of electricity and the resulting CO2 emissions associated with EV charging were calculated and compared across three scenarios: direct grid charging, grid charging supported by large-scale energy storage, and charging directly from local NaS battery storage. This approach enabled the assessment of both the technical potential of energy storage for supporting electric mobility and its impact on reducing greenhouse gas emissions.
In this study, hourly electricity generation data for major Hungarian power plants, provided by the national transmission system operator MAVIR (Budapest, Hungary) [
20], were used. Four representative weeks from January, April, July, and October 2025 were selected to assess seasonal differences in the amount of photovoltaic electricity that could be stored in sodium–sulfur (NaS) batteries.
To evaluate the theoretical storage potential, it was assumed that 100% of the available solar generation could be captured and stored. The NaS storage system was modeled phenomenologically as a large-scale battery energy storage system that can either charge or discharge in a given hour but cannot charge and discharge simultaneously. In hours when electric vehicles were not being charged, the entire output of the photovoltaic power plants was assumed to be directed to the NaS batteries for storage.
Hourly data were used both to analyze electricity generation patterns and to calculate the life-cycle carbon intensity of electricity. To assess the daily and seasonal variability of avoided CO2 emissions associated with the use of NaS batteries, weekly minimum, maximum, and average values were calculated from the hourly results.
The amount of electricity collected in the NaS battery system for each scenario and day was calculated using Equation (1):
where
Coll. electricityscen (in MWh) is the amount of electricity stored in the NaS battery during its charging phase for a given scenario, and Solgen
x is the generation of the photovoltaic power plants for the
hour.
The number of electric vehicles (
Chavescen) that could be charged for each scenario on each day was calculated using Equation (2):
where daily charging demand of 10 kWh per vehicle was assumed.
Based on the daily results, the minimum, maximum, and average numbers of vehicles charged were determined for each week.
Life-cycle carbon emission calculations were based on the hourly electricity generation of all major Hungarian power plants and the life-cycle emission factors reported by the National Laboratory of the Rockies [
15]. First, the contribution of each electricity generation source to total generation was determined using Equation (3) for each hour:
where
Totgensharen is the share of generation from source (
n),
Genn is the electricity generated by source (
n) and
N is the number of electricity generation alternatives.
The life-cycle carbon intensity of electricity for each scenario was then calculated using Equation (4):
where
Carbintfactn is the life-cycle carbon intensity factor of electricity generated by source (n), expressed in g CO
2-eq/kWh [
15].
The total life-cycle carbon emissions associated with charging all electric vehicles supplied by the stored electricity were calculated using Equation (5):
where a charging power of 2.5 kW per vehicle and a charging duration of four hours were assumed.
The calculations for 10 kWh daily electricity used for charging per vehicle (~50 km driven distance with 0.189 kWh electricity consumption) serve as baseline data for scaling with the modifying factors that adjust the number of charged vehicles to the actual vehicle electricity consumption and driven distance. The number of charged vehicles to make the scaling easier in addition to Figure in
Section 4.4 is presented in numerical format in
Appendix C.
Our results are calculated for 100% total NaS charging and discharging efficiency. If the losses during electricity transmission and battery operating have to be taken into account, the charged vehicle number will be less than for the 100% efficiency case. To incorporate this, we present the modifying factors for the charged vehicle number for 90% and 80% total efficiency too.
The multiplying factors for the charged vehicle number for the three total efficiencies (80%, 90%, 100%) are presented in
Table 2.
Data in
Table 2 shows that, for a specific driven distance, if we drive a smaller car with less consumed electricity, that makes it possible to charge more vehicles. Another possibility is if we decrease the daily driven distance. The total efficiency of collecting and using the electricity generated by the solar power plants also has a quite strong effect on the charged vehicle number. If the losses are big (80% efficiency) far fewer EVs can be charged, which also has an effect on the avoided carbon emission.
To quantify the potential CO2 emission reductions achievable through solar energy storage, three charging scenarios were evaluated:
Baseline scenario: No NaS battery storage is available, and EVs are charged directly from the electricity grid.
Grid-level storage scenario: Photovoltaic electricity is stored in NaS batteries and later discharged into the Hungarian electricity grid. In this case, the stored energy contributes additional low-carbon electricity to the overall grid mix, while all generators and consumers remain connected to the system.
Local storage scenario: Electric vehicles are charged directly from the NaS battery operating in island mode, without drawing electricity from the grid during the charging process.
For Scenarios 2 and 3, charging the NaS battery was represented by removing the corresponding amount of photovoltaic generation from the electricity system. Consequently, both total electricity generation and solar electricity generation were reduced during the charging period. During discharge, the stored electricity was modeled as a separate electricity source with a life-cycle carbon intensity of 75.9 g CO
2-eq/kWh, consisting of 43 g CO
2-eq/kWh associated with solar electricity generation and 32.9 g CO
2-eq/kWh associated with battery storage [
15]. The role of the discharged electricity in the power system depended on the storage configuration considered. In Scenario 2 (grid-level storage), the electricity discharged from the NaS battery was injected into the Hungarian electricity grid and contributed to the overall electricity mix. Consequently, only a fraction of the electricity used for EV charging originated from the NaS battery, while the remainder was supplied by other generation sources. In Scenario 3 (local storage or island mode), EVs were charged directly from the NaS battery, and therefore 100% of the electricity used for charging originated from the stored solar energy.
The stored electricity was assumed to be used for EV charging during three representative charging periods:
Morning: 3–6 a.m.;
Midday: 12–3 p.m.;
Evening: 7–10 p.m.;
The main outputs of the analysis were:
- 4.
The number of electric vehicles whose daily charging demand could be met under each charging scenario.
- 5.
The amount of CO2 emissions avoided through the use of NaS battery storage compared with the baseline scenario.
For estimating CO
2 emission reduction, it was assumed that for the baseline scenario each electric vehicle is charged daily with 2.5 kW power for 4 h. If we scale these results with the data in
Table 2, of course the required power will also be changed.
To capture the seasonal variability of solar generation, one representative month from each season of 2025 was selected (January, April, July, and October). To evaluate daily variability, four weeks of data were analyzed for each month. For each charging period, the minimum, maximum, and average numbers of EVs whose daily charging demand could be met using electricity discharged from the NaS battery were calculated. Using life-cycle carbon intensity factors for electricity generation and storage, the corresponding CO2 emissions associated with EV charging were also estimated for each scenario.
3. Electricity Production and Consumption in Hungary
Solar energy plays an increasingly important role in the Hungarian electricity system. In 2025, per capita solar electricity generation reached approximately 1140 kWh, significantly exceeding the European Union average and amounting to nearly three times the global average [
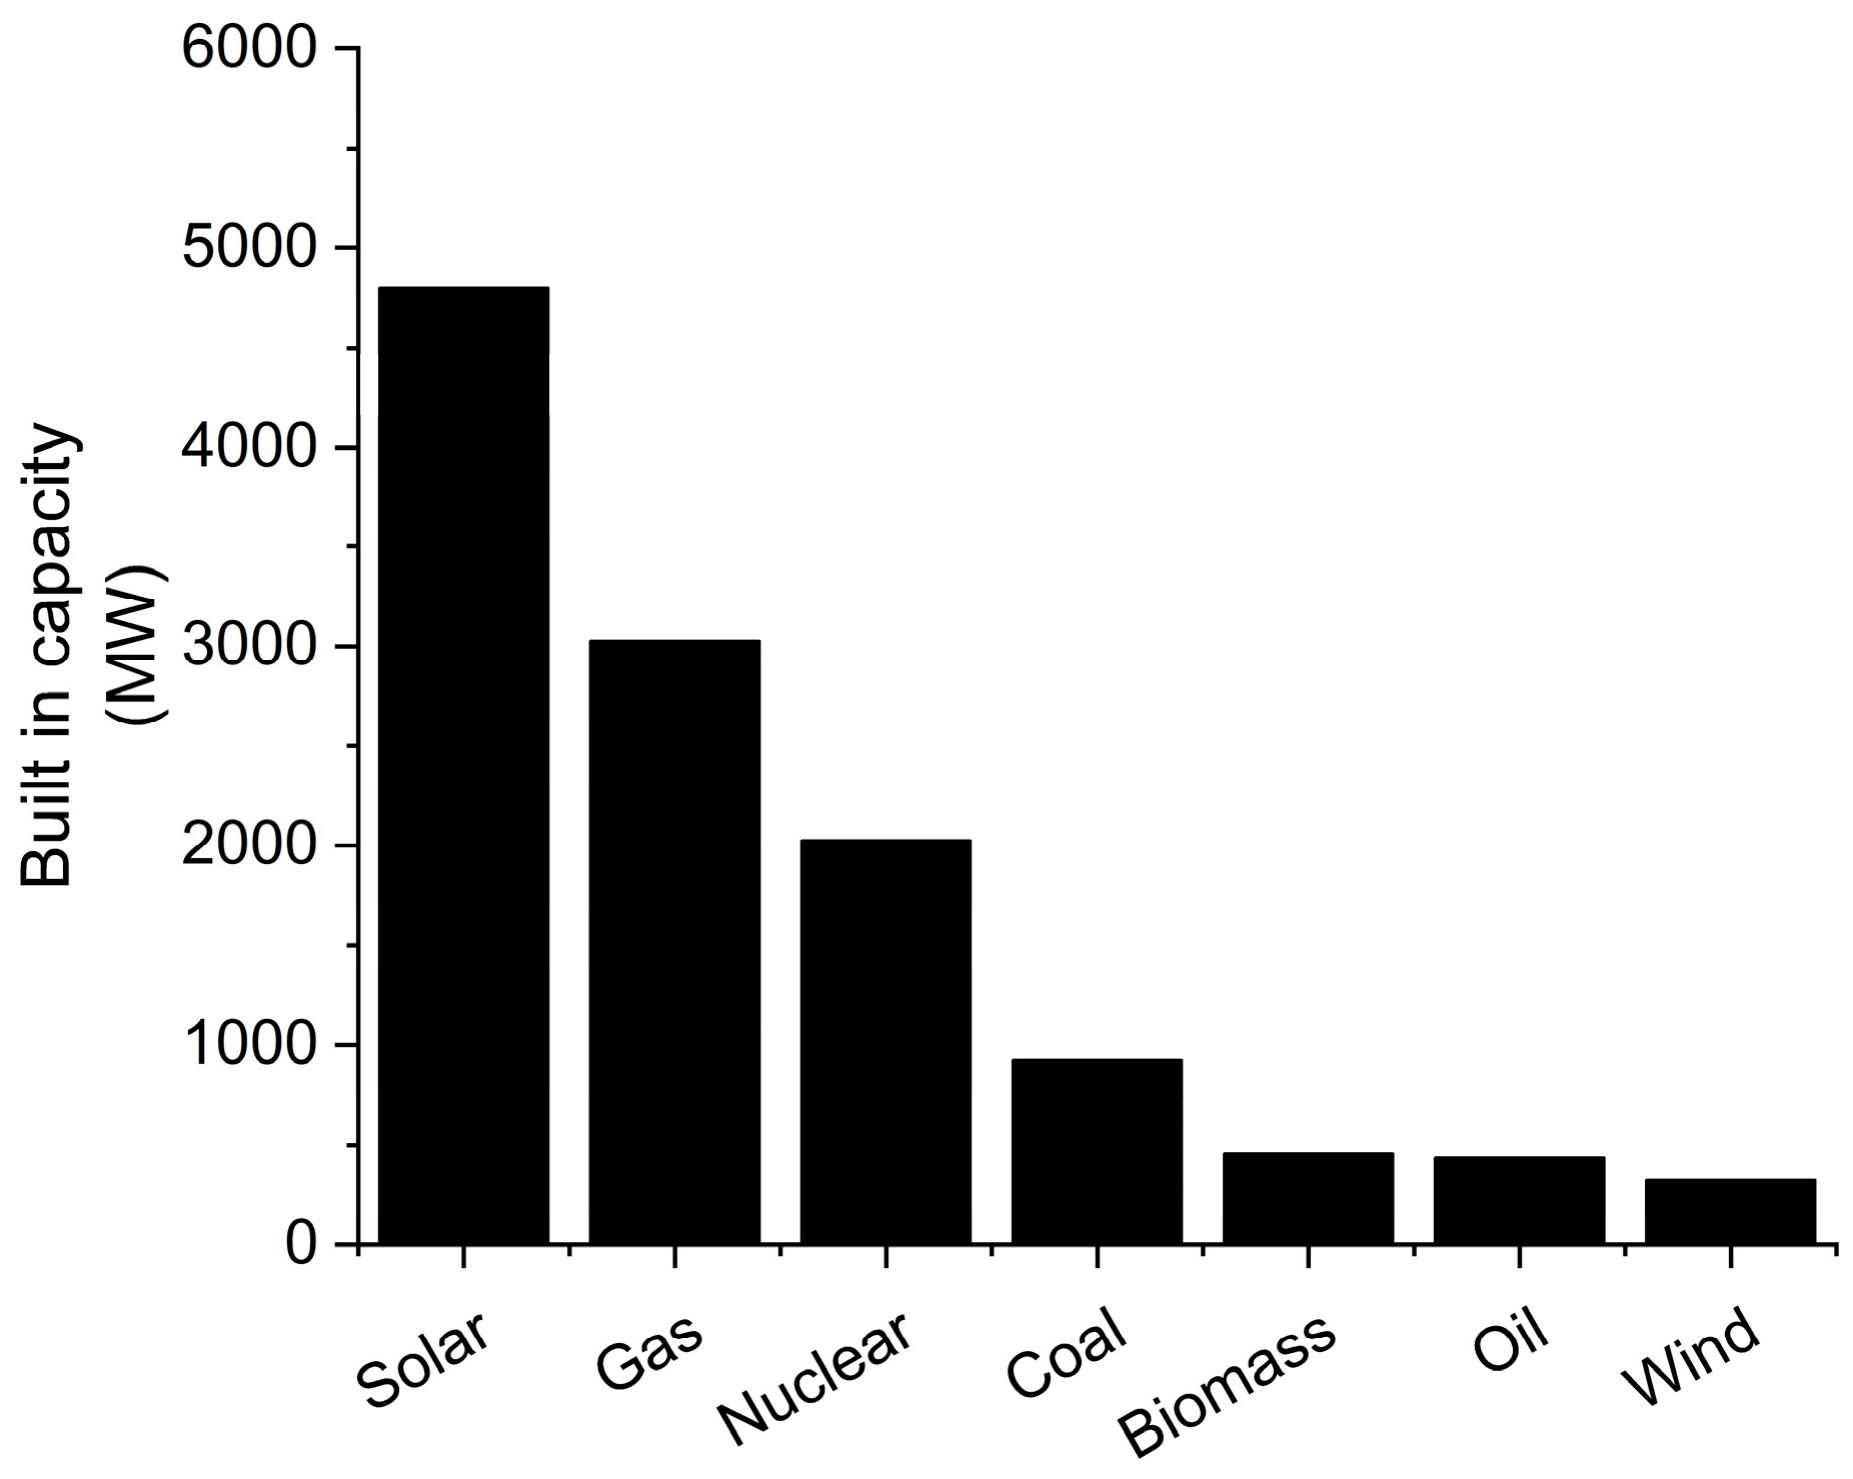
21]. Utility-scale photovoltaic power plants had a combined installed capacity of approximately 4.7 GW (
Figure 1), while residential photovoltaic systems contributed an additional 3 GW of capacity [
20]. As a result, during sunny days around midday, utility-scale solar power plants can generate 3–4 GW of low-carbon electricity. Hungary also benefits from substantial nuclear generation capacity, with its four operating reactors providing a stable supply of low-carbon baseload electricity [
22]. Although the country possesses considerable natural-gas-fired generation capacity, the contribution of other generation technologies, such as coal and wind power, remains relatively small compared with national electricity demand [
20].
Two new nuclear reactors with a combined capacity of 2.4 GW are planned to begin operation in the first half of the 2030s [
23]. According to the National Energy and Climate Plan (NECP) [
24] additional solar and wind installations are expected by 2030 with installed solar capacity reaching 12–13 GW and wind capacity reaching 1–1.3 GW.
The rapid growth of electric mobility is expected to substantially increase electricity demand in Hungary. For example, charging 500,000 electric vehicles simultaneously at a power level of 7 kW would require 3.5 GW of electricity generation capacity. This corresponds to more than half of Hungary’s current average electricity demand, which typically ranges between 5 and 6 GW [
20]. Unfortunately, at many locations the wires and fuses of the houses and flats do not allow delivering much power, so we decided to use only 2.5 kW charging but for a longer time (4 h). Since EV charging often occurs during evening and nighttime hours, when solar generation is unavailable, a large-scale transition to electric mobility will require not only additional low-carbon electricity generation but also solutions capable of shifting renewable electricity from periods of high generation to periods of high demand. Consequently, energy storage systems are expected to play an important role in maximizing the utilization of solar electricity for transport electrification while reducing the carbon intensity of vehicle charging.
In this study, we decided to use lower power for the charging because, in Hungary, in most homes the electricity transmission grid cannot supply 7 KW power for EV charging in addition to the electricity consumption of other devices like washing machines or air conditioners.
At present, Hungary’s electricity storage capacity remains limited relative to both the growing share of solar generation and the future electricity demand of the transport sector. The National Energy and Climate Plan (NECP) targets the deployment of 1 GW of electricity storage capacity by 2030 [
24]. In addition to dedicated stationary storage systems, electric vehicle batteries could also contribute to system flexibility through vehicle-to-grid (V2G) services. For example, if Hungary’s current fleet of approximately 100,000 EVs each provided 10 kWh of flexible storage capacity, the total available storage would reach 1 GWh. If EV adoption increases to approximately 2 million vehicles in the coming decades, the available distributed storage capacity could reach 20 GWh. Such storage capacities could significantly improve the integration of variable renewable generation and increase the amount of low-carbon electricity available for EV charging.
In countries such as Hungary, where geographical and hydrological conditions limit the potential for large-scale pumped hydropower storage, battery technologies, including lithium-ion and sodium–sulfur (NaS) batteries, may provide a cost-effective and scalable solution for integrating variable renewable energy sources and supporting the electrification of transport.
The aim of this study was to develop and apply a methodology for assessing how large-scale energy storage can increase the utilization of renewable electricity for electric vehicle charging and reduce the associated life-cycle CO2 emissions. The novelty of this study lies in the development of a transferable methodology that combines hourly electricity generation data with life-cycle carbon intensity analysis to quantify renewable electricity utilization and CO2 emissions under different EV charging scenarios. Hungary represents a particularly suitable pilot case because its rapidly growing solar generation and electric vehicle fleet coincide with limited hydropower storage potential, making battery-based energy storage technologies such as NaS batteries a promising option for integrating renewable electricity into the transport sector.
4. Results and Discussion
4.1. The Daily and the Seasonal Variability of the Electricity Demand and Generation in Hungary
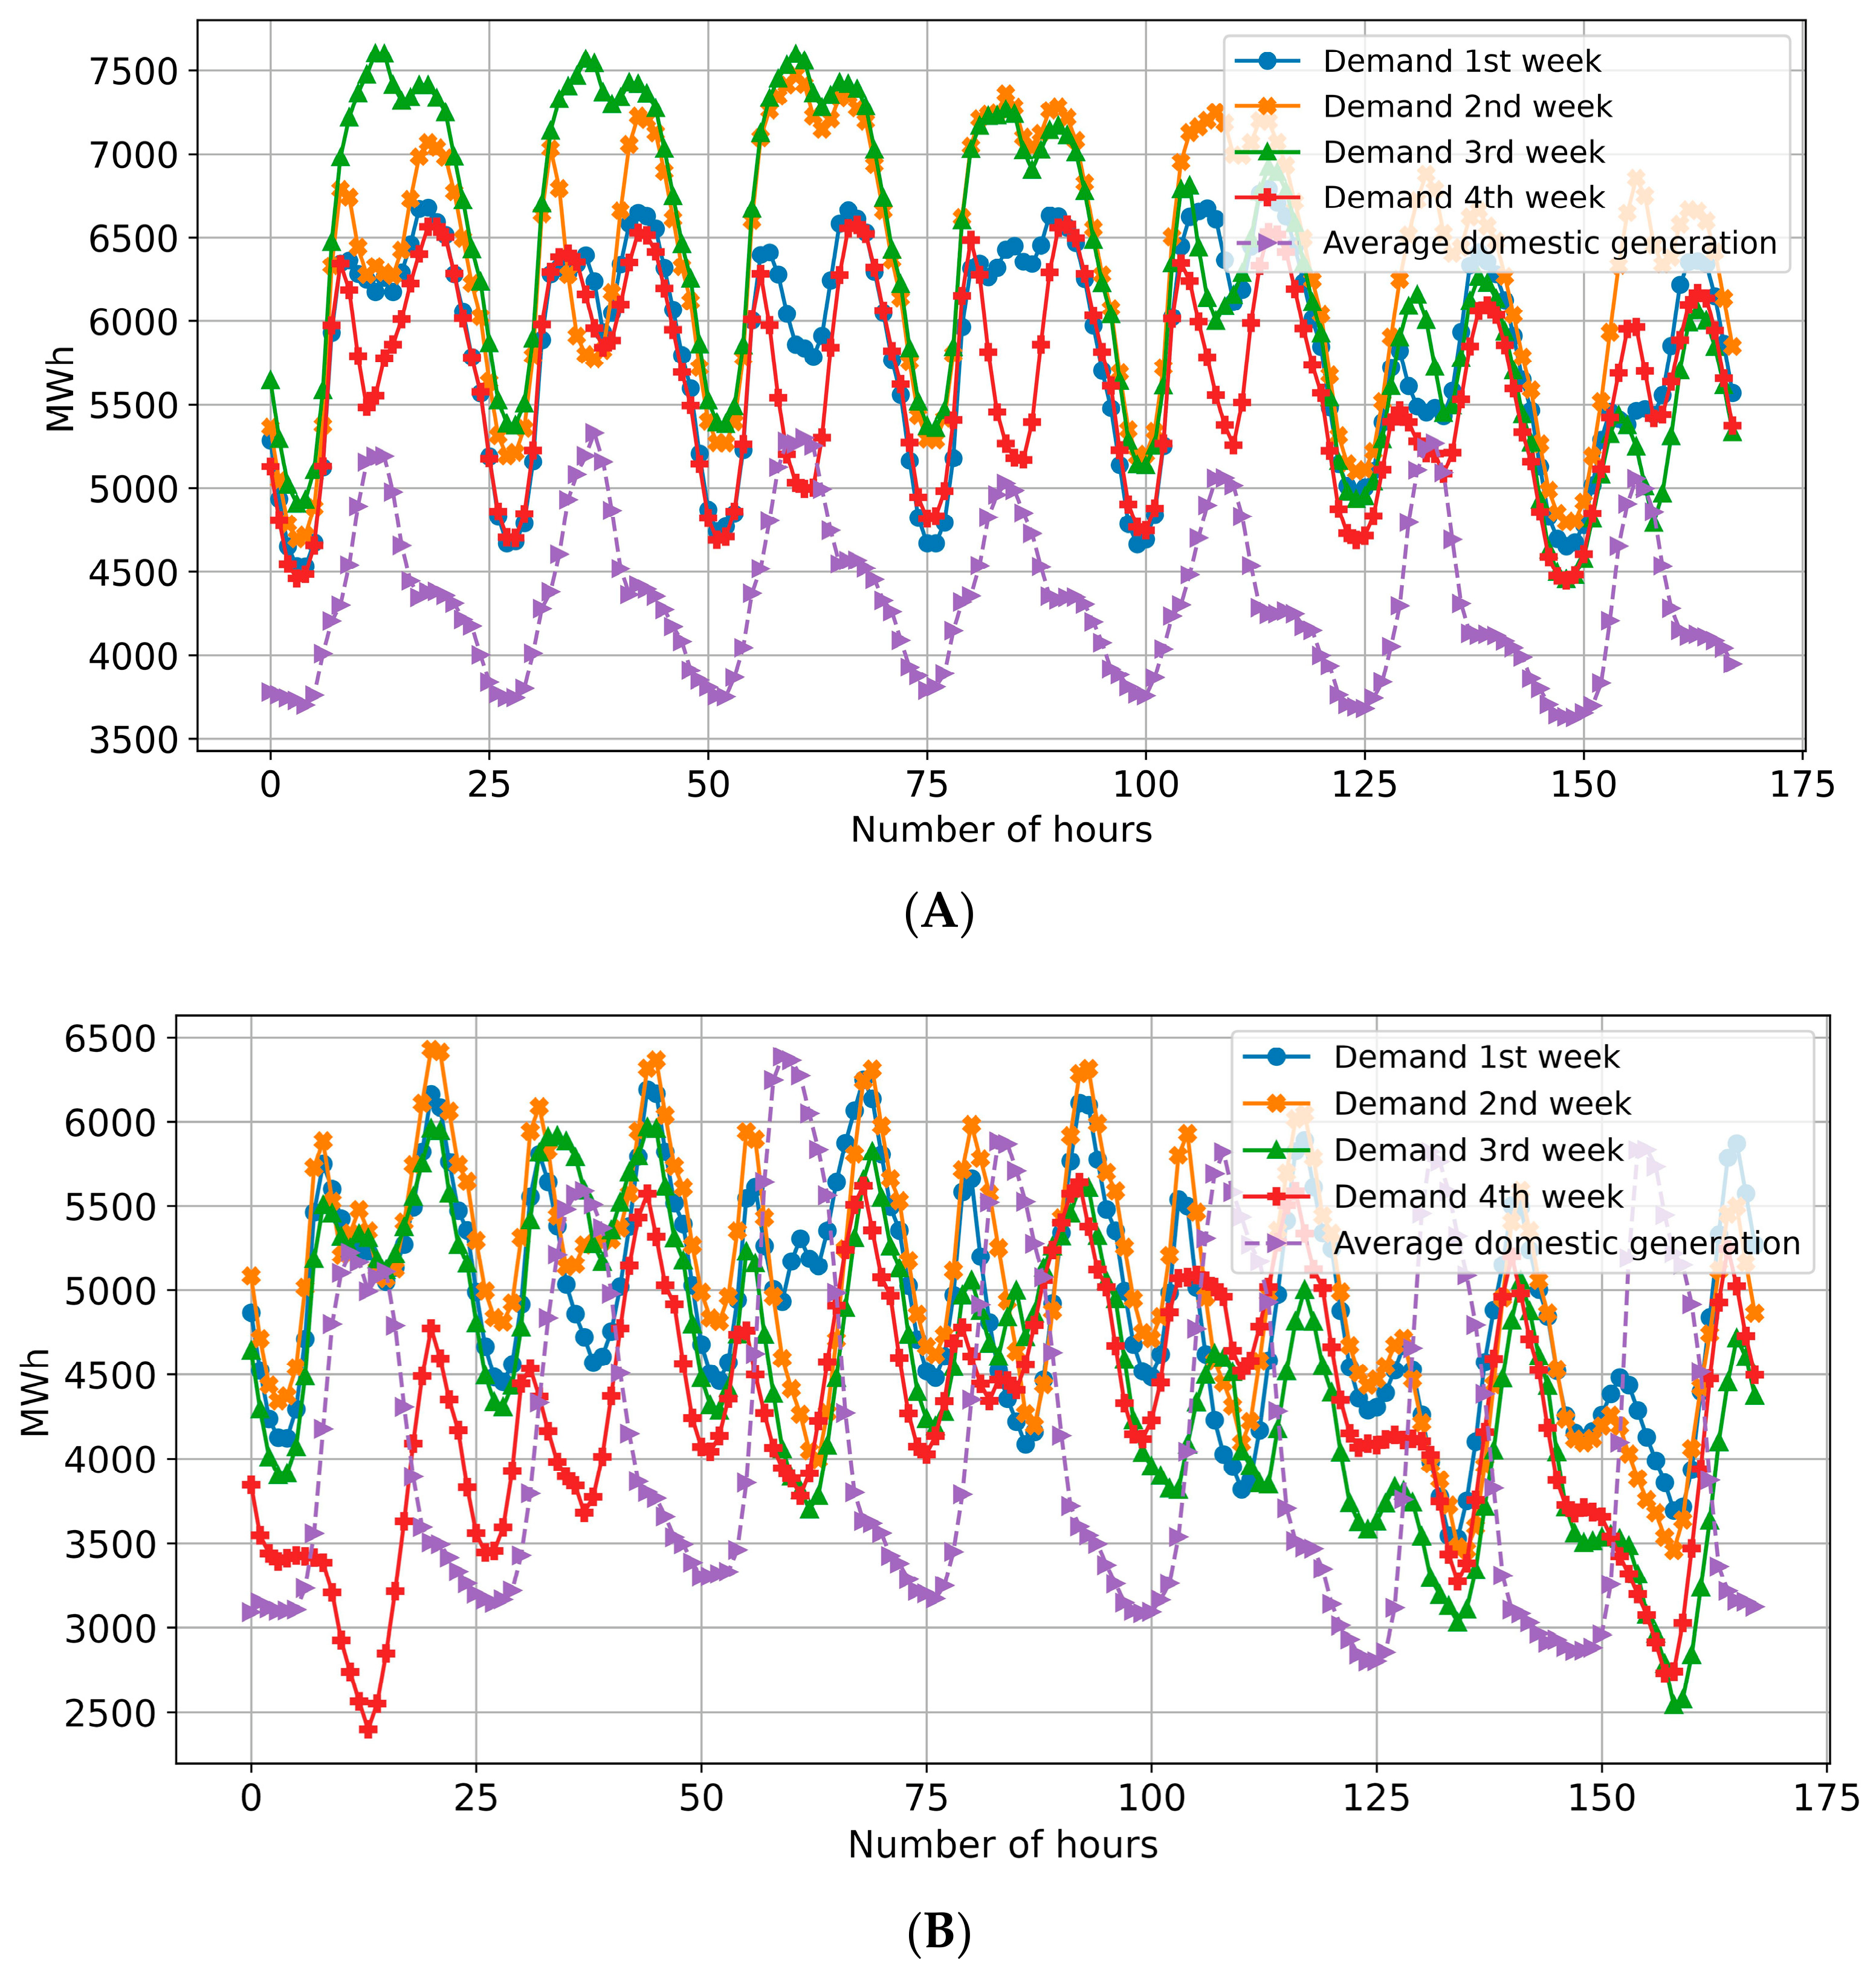
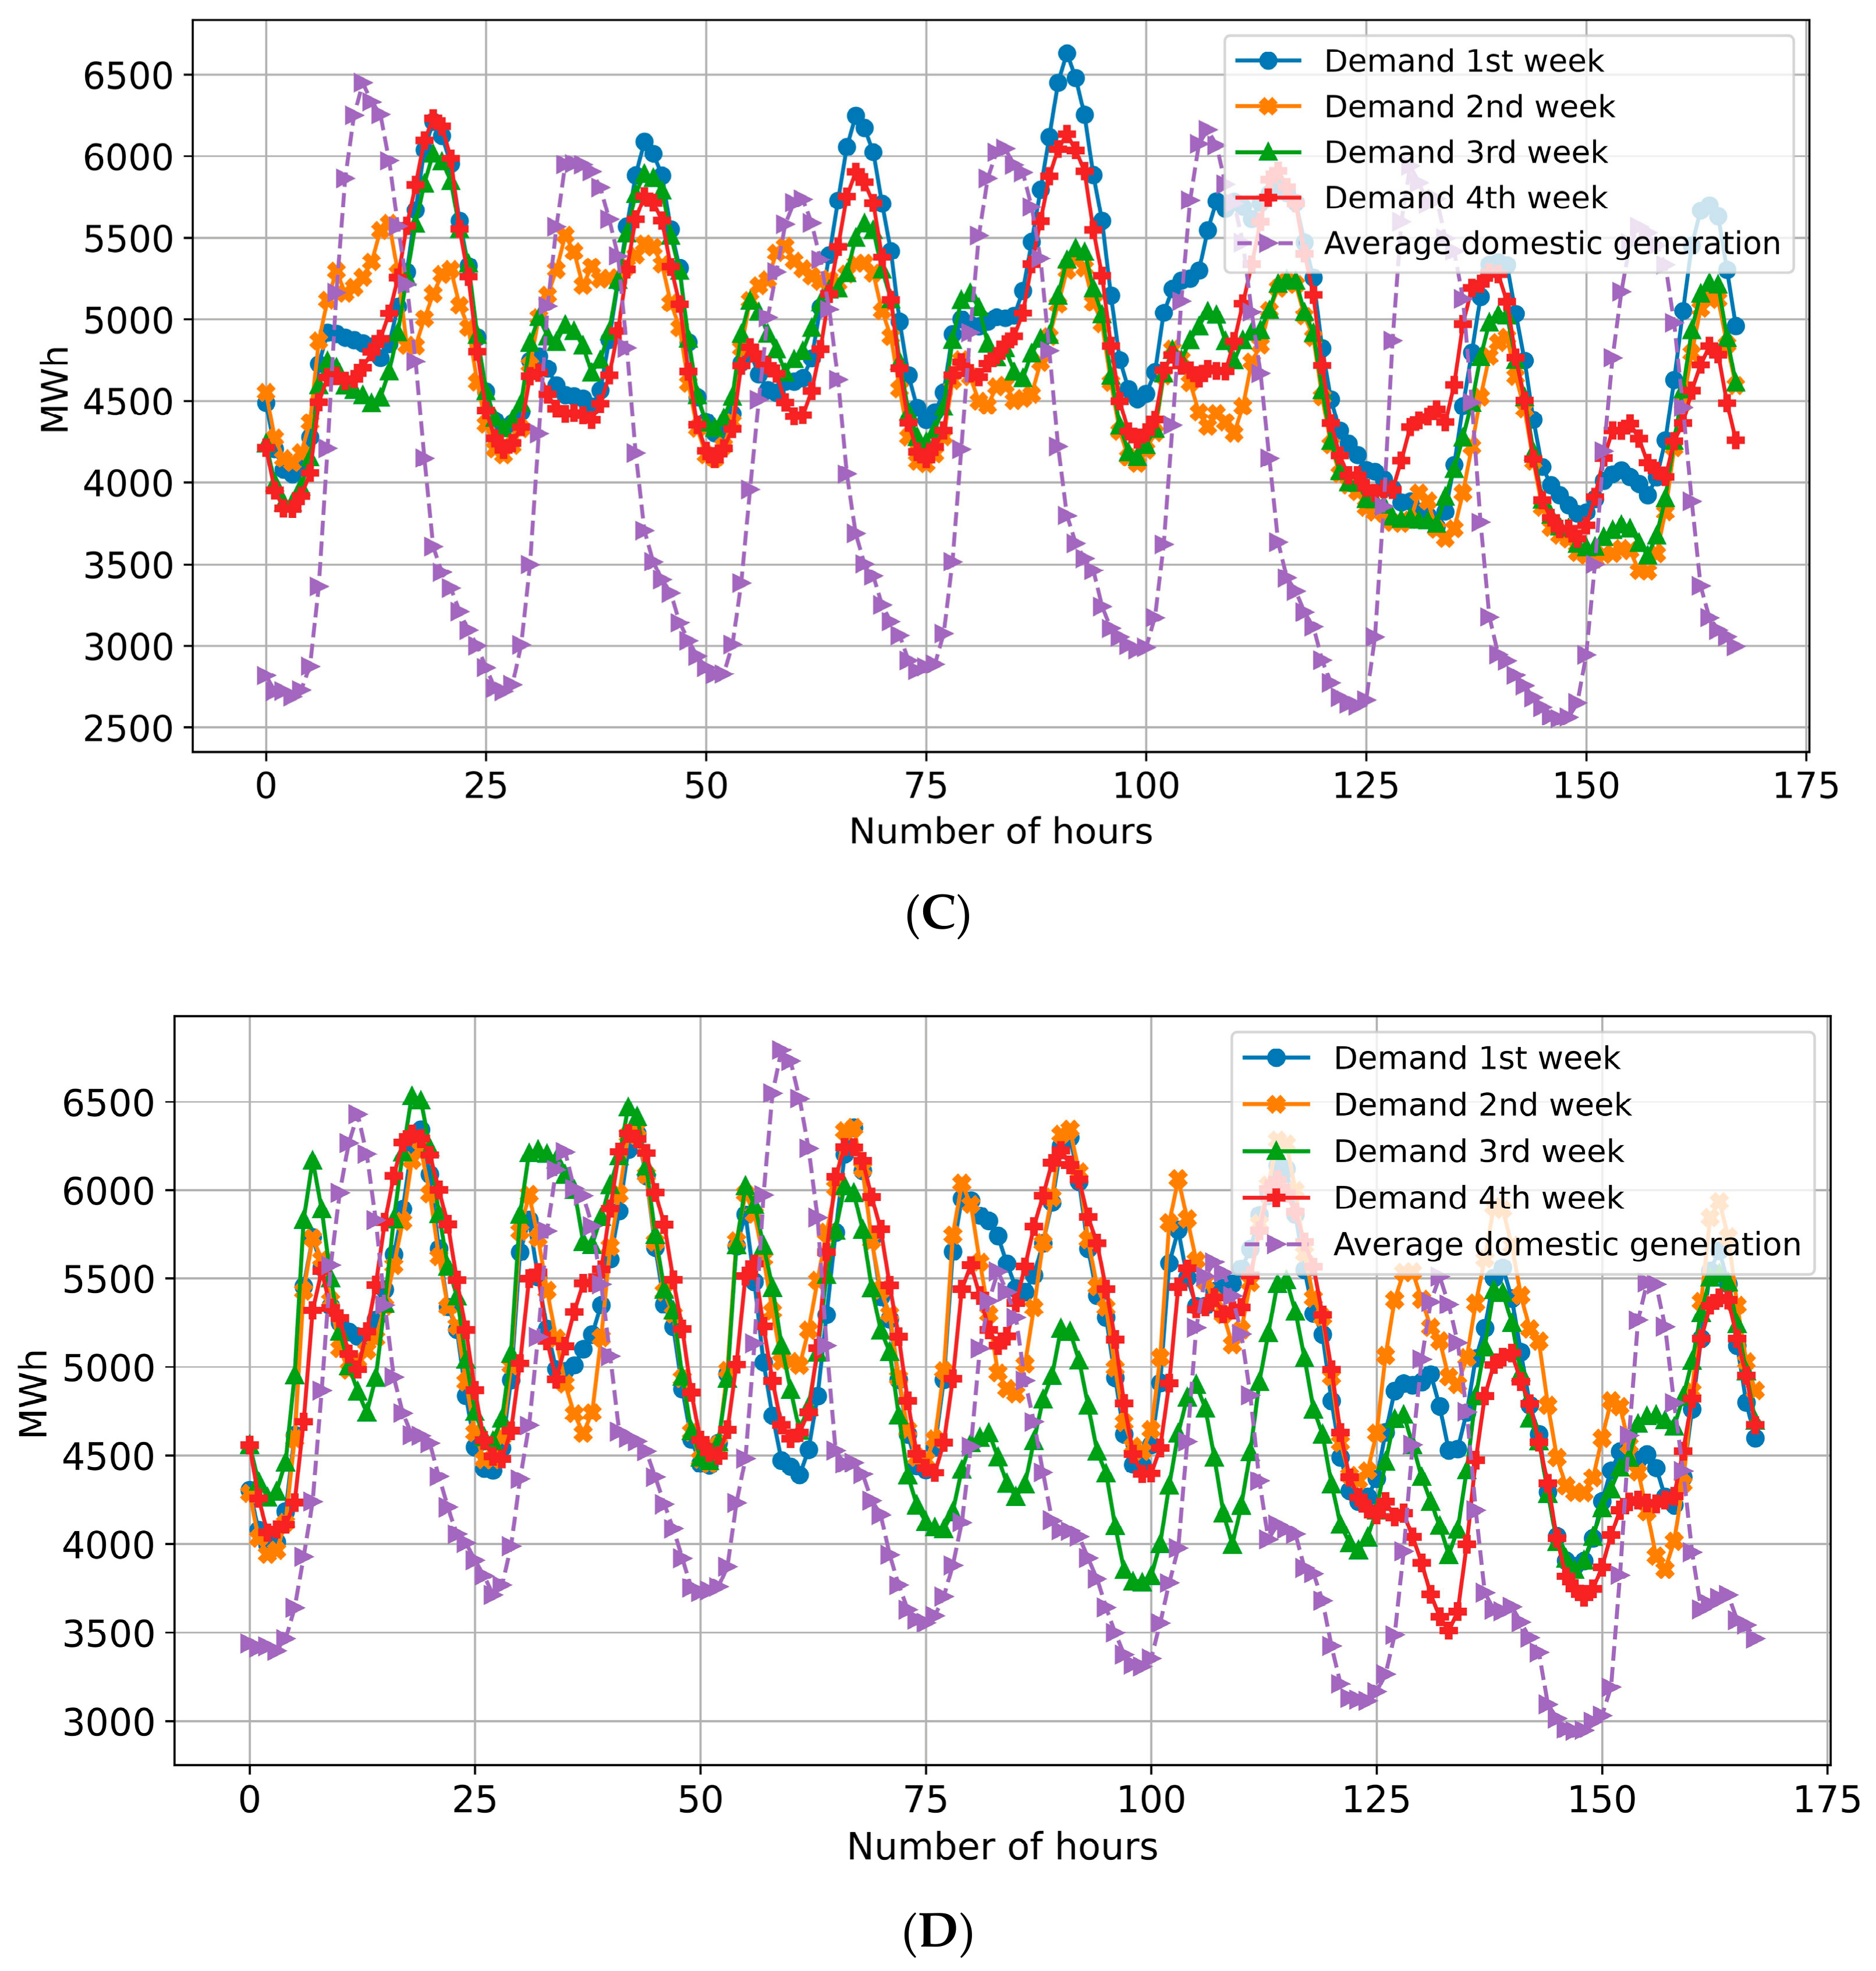
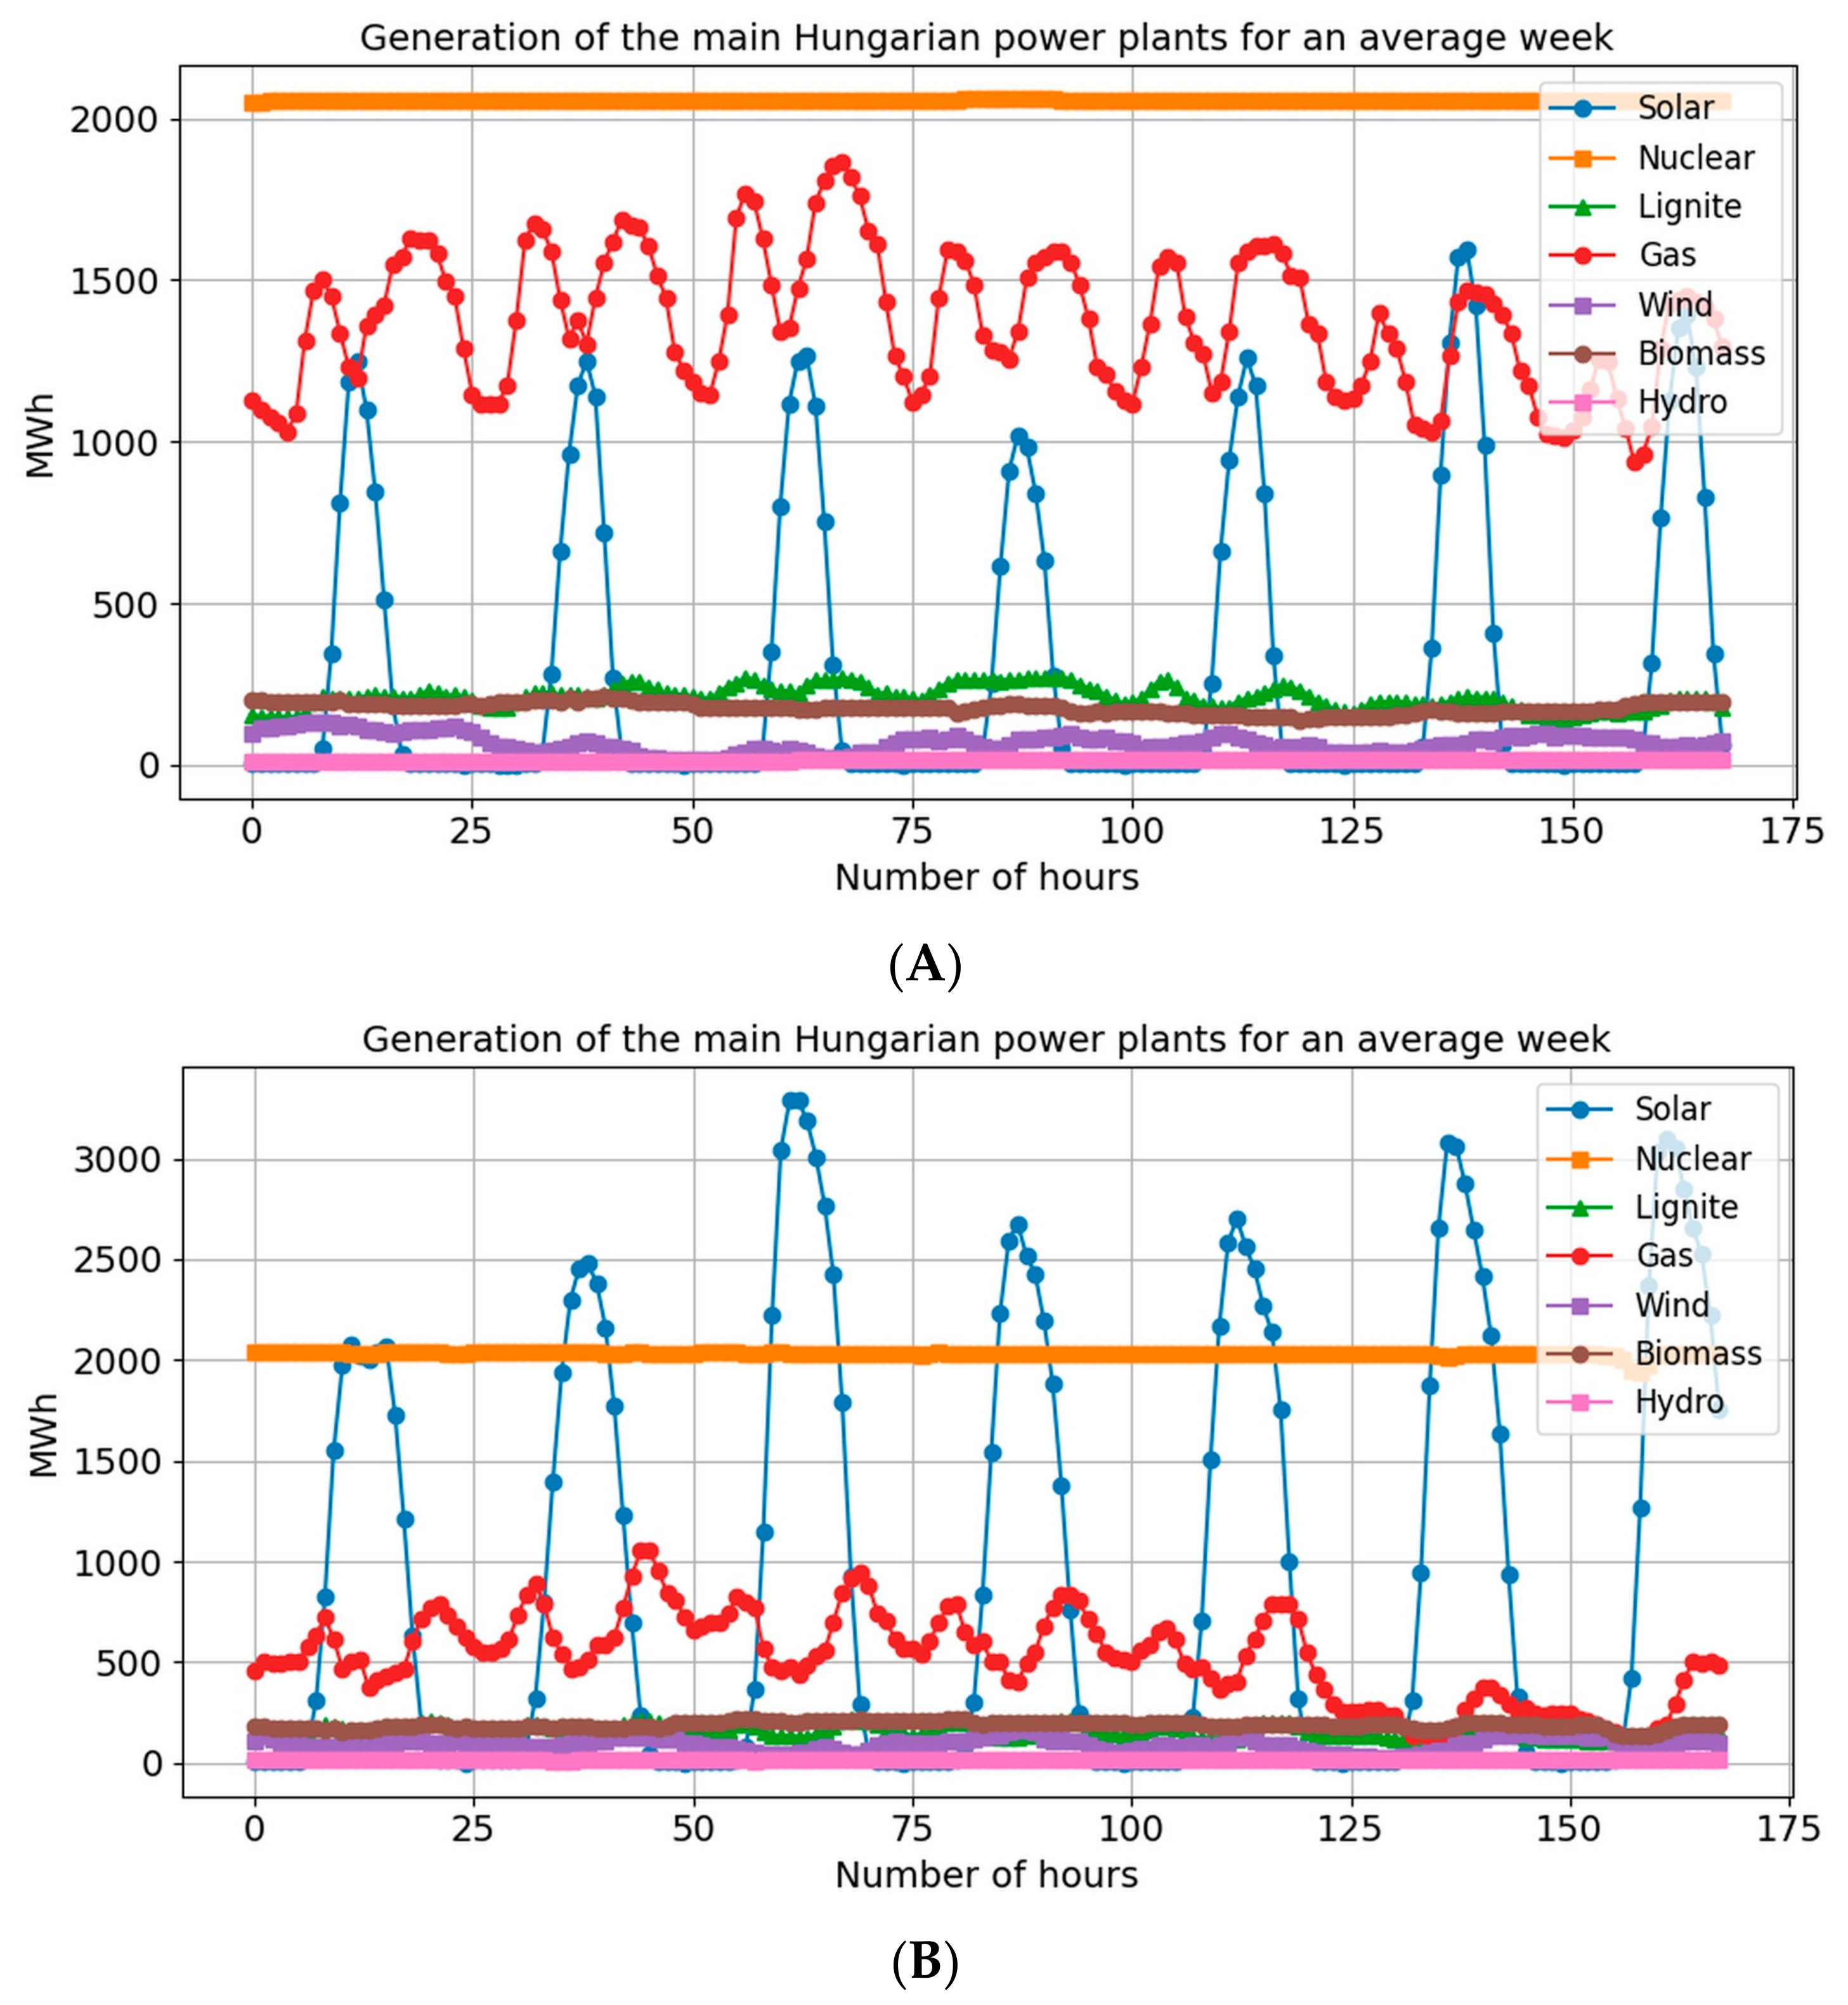
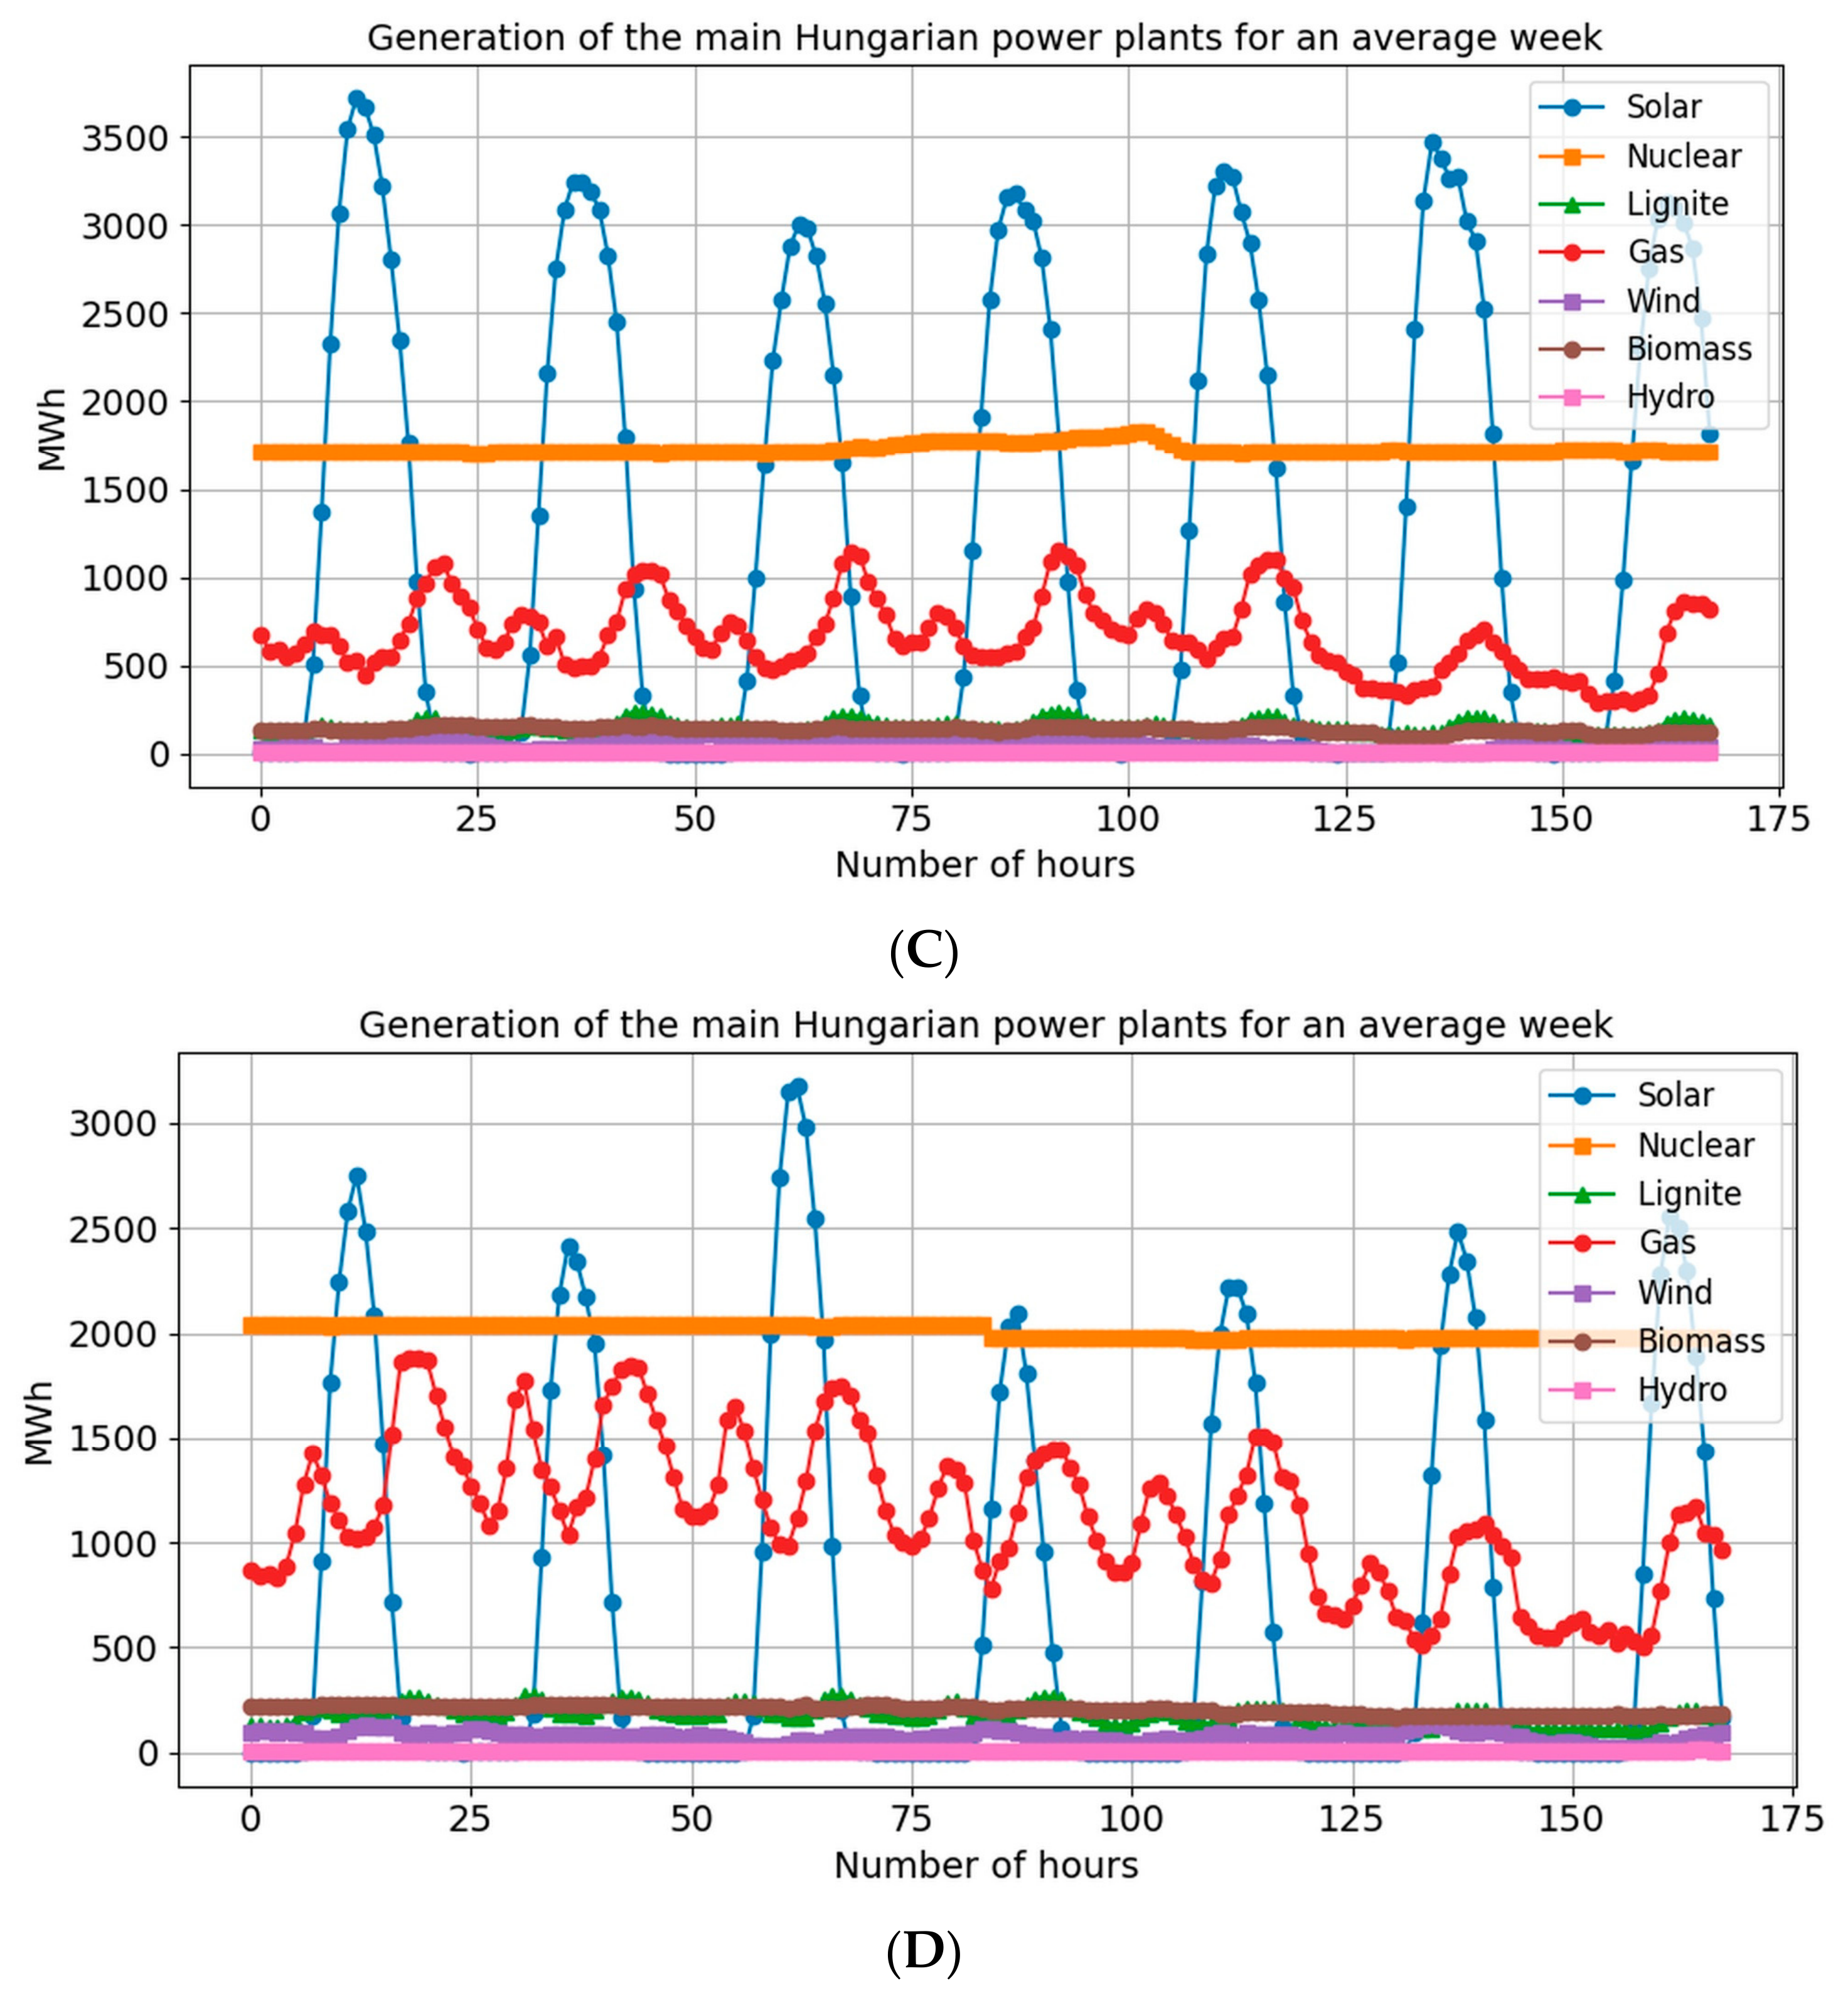
To compare electricity generation and demand during potential electric vehicle charging periods, the average hourly domestic electricity generation was calculated for representative weeks in January, April, July, and October 2025 and compared with the corresponding hourly electricity demand (
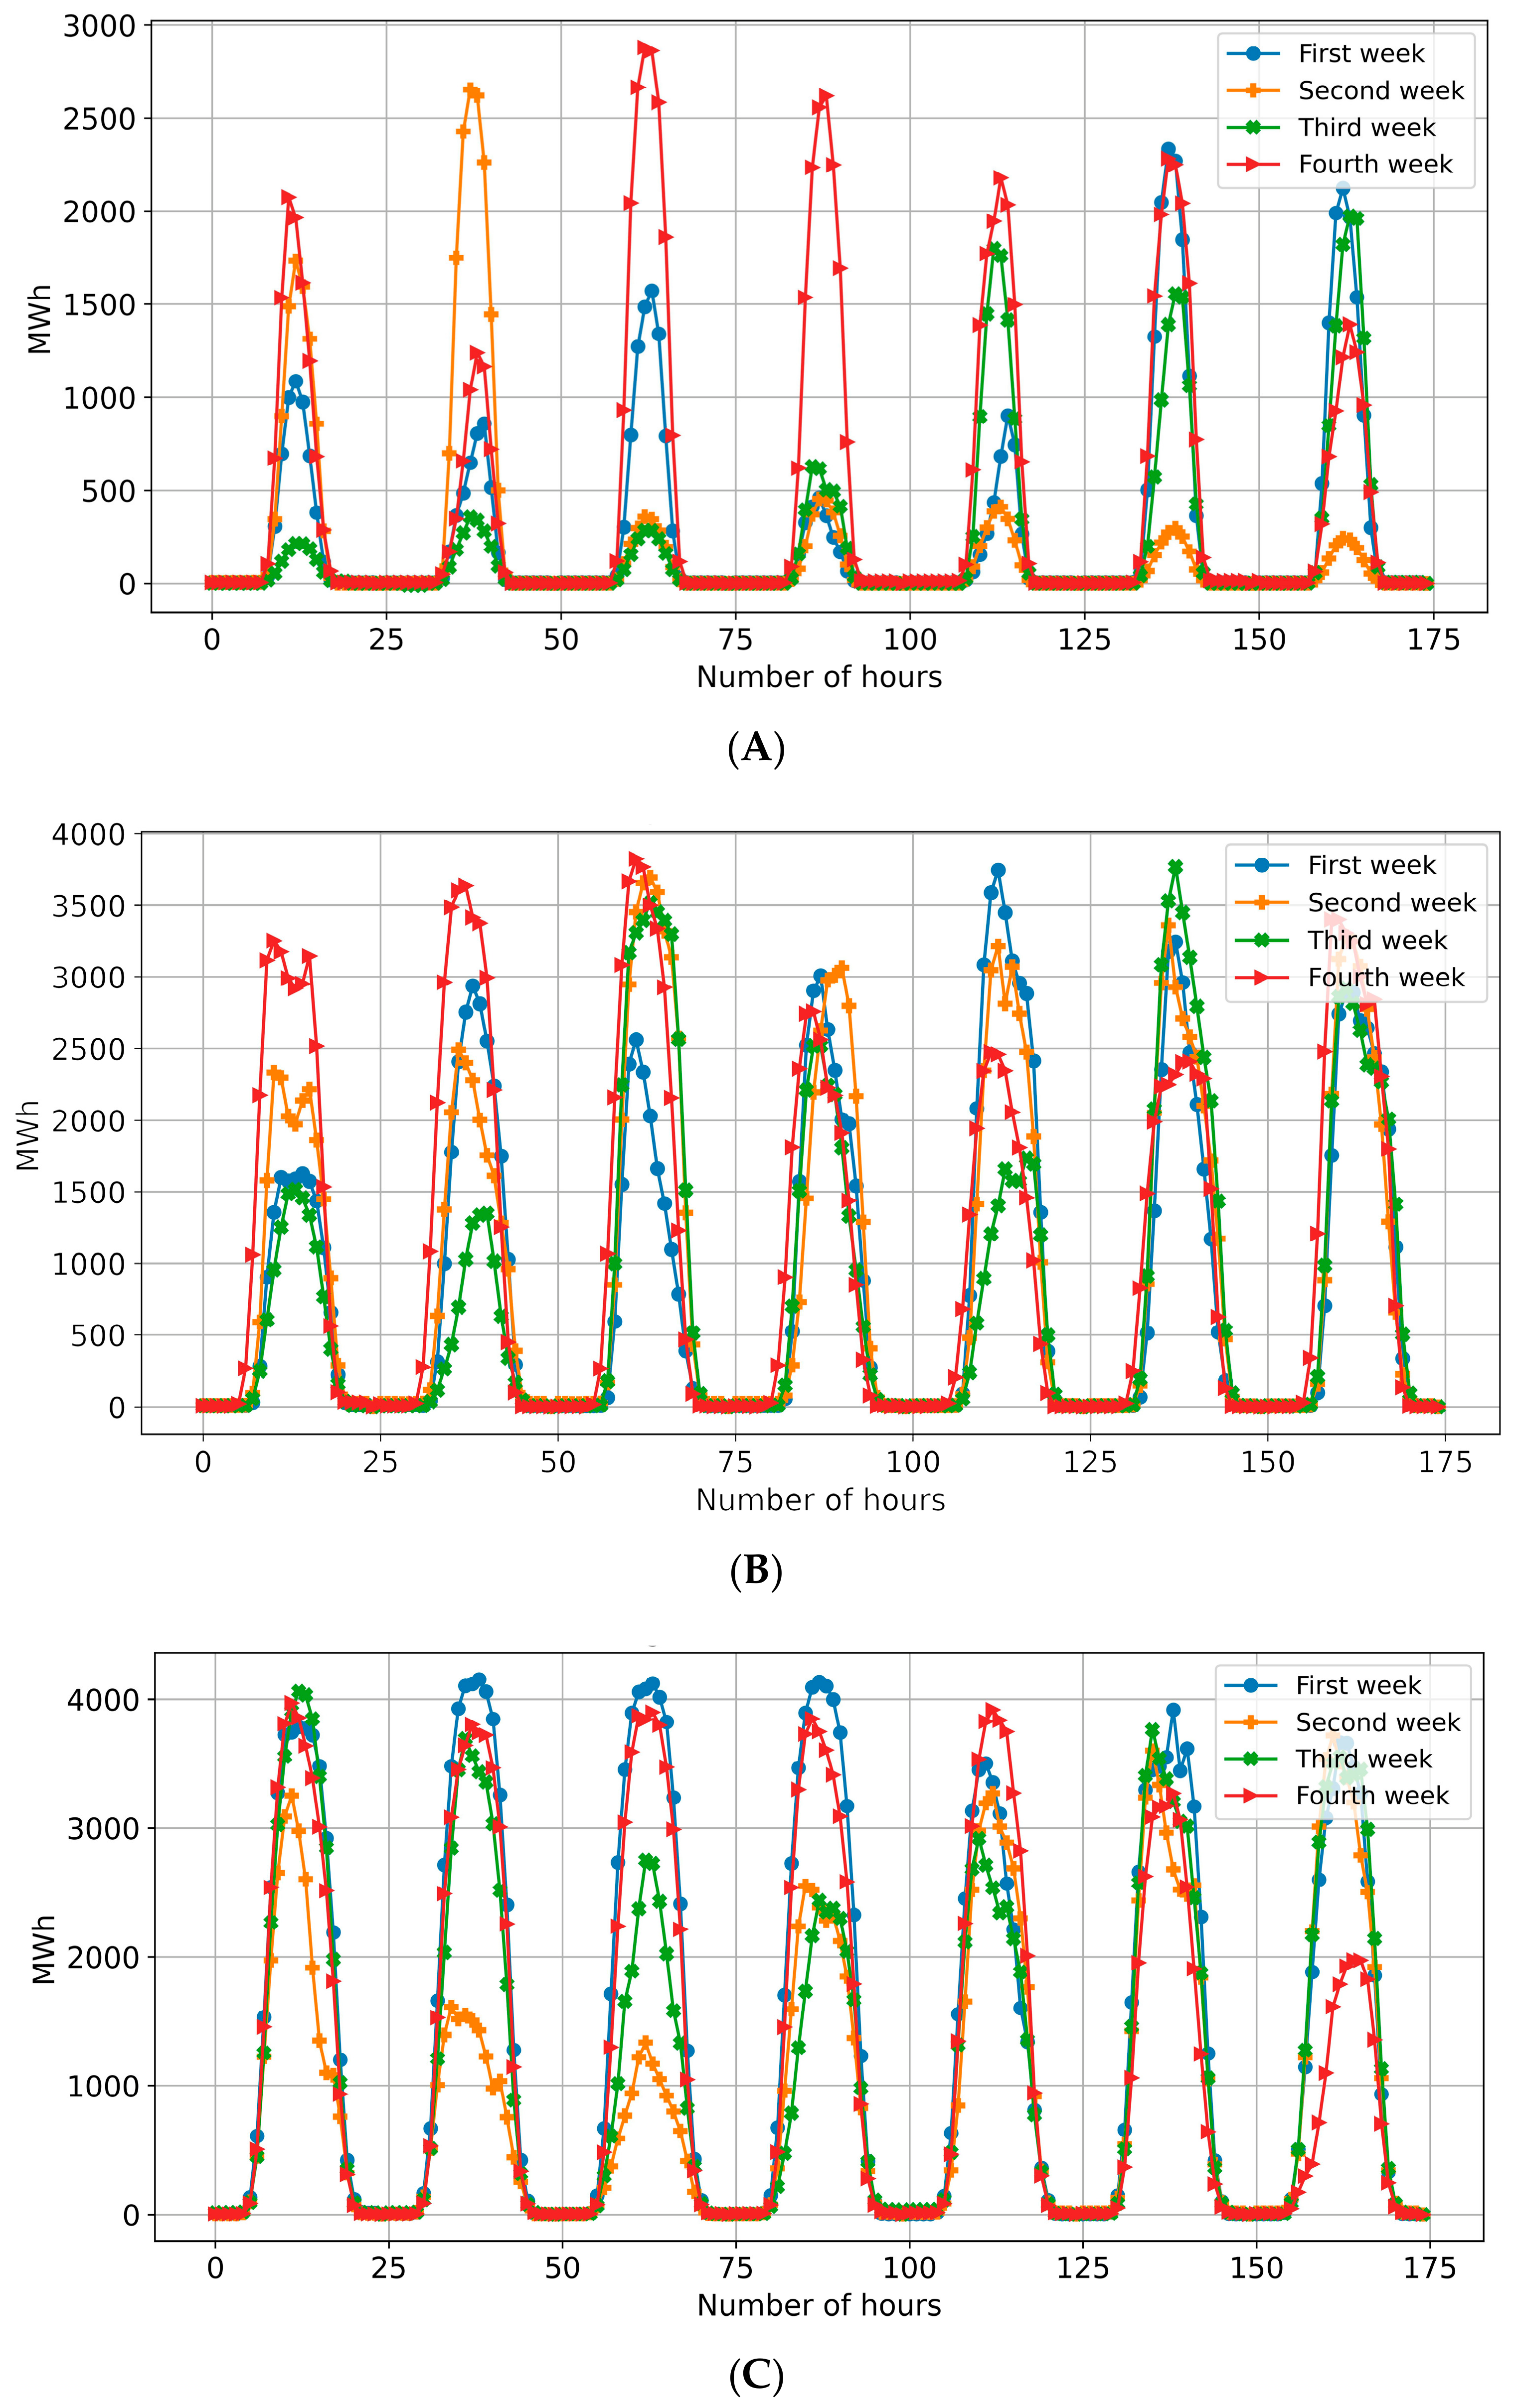
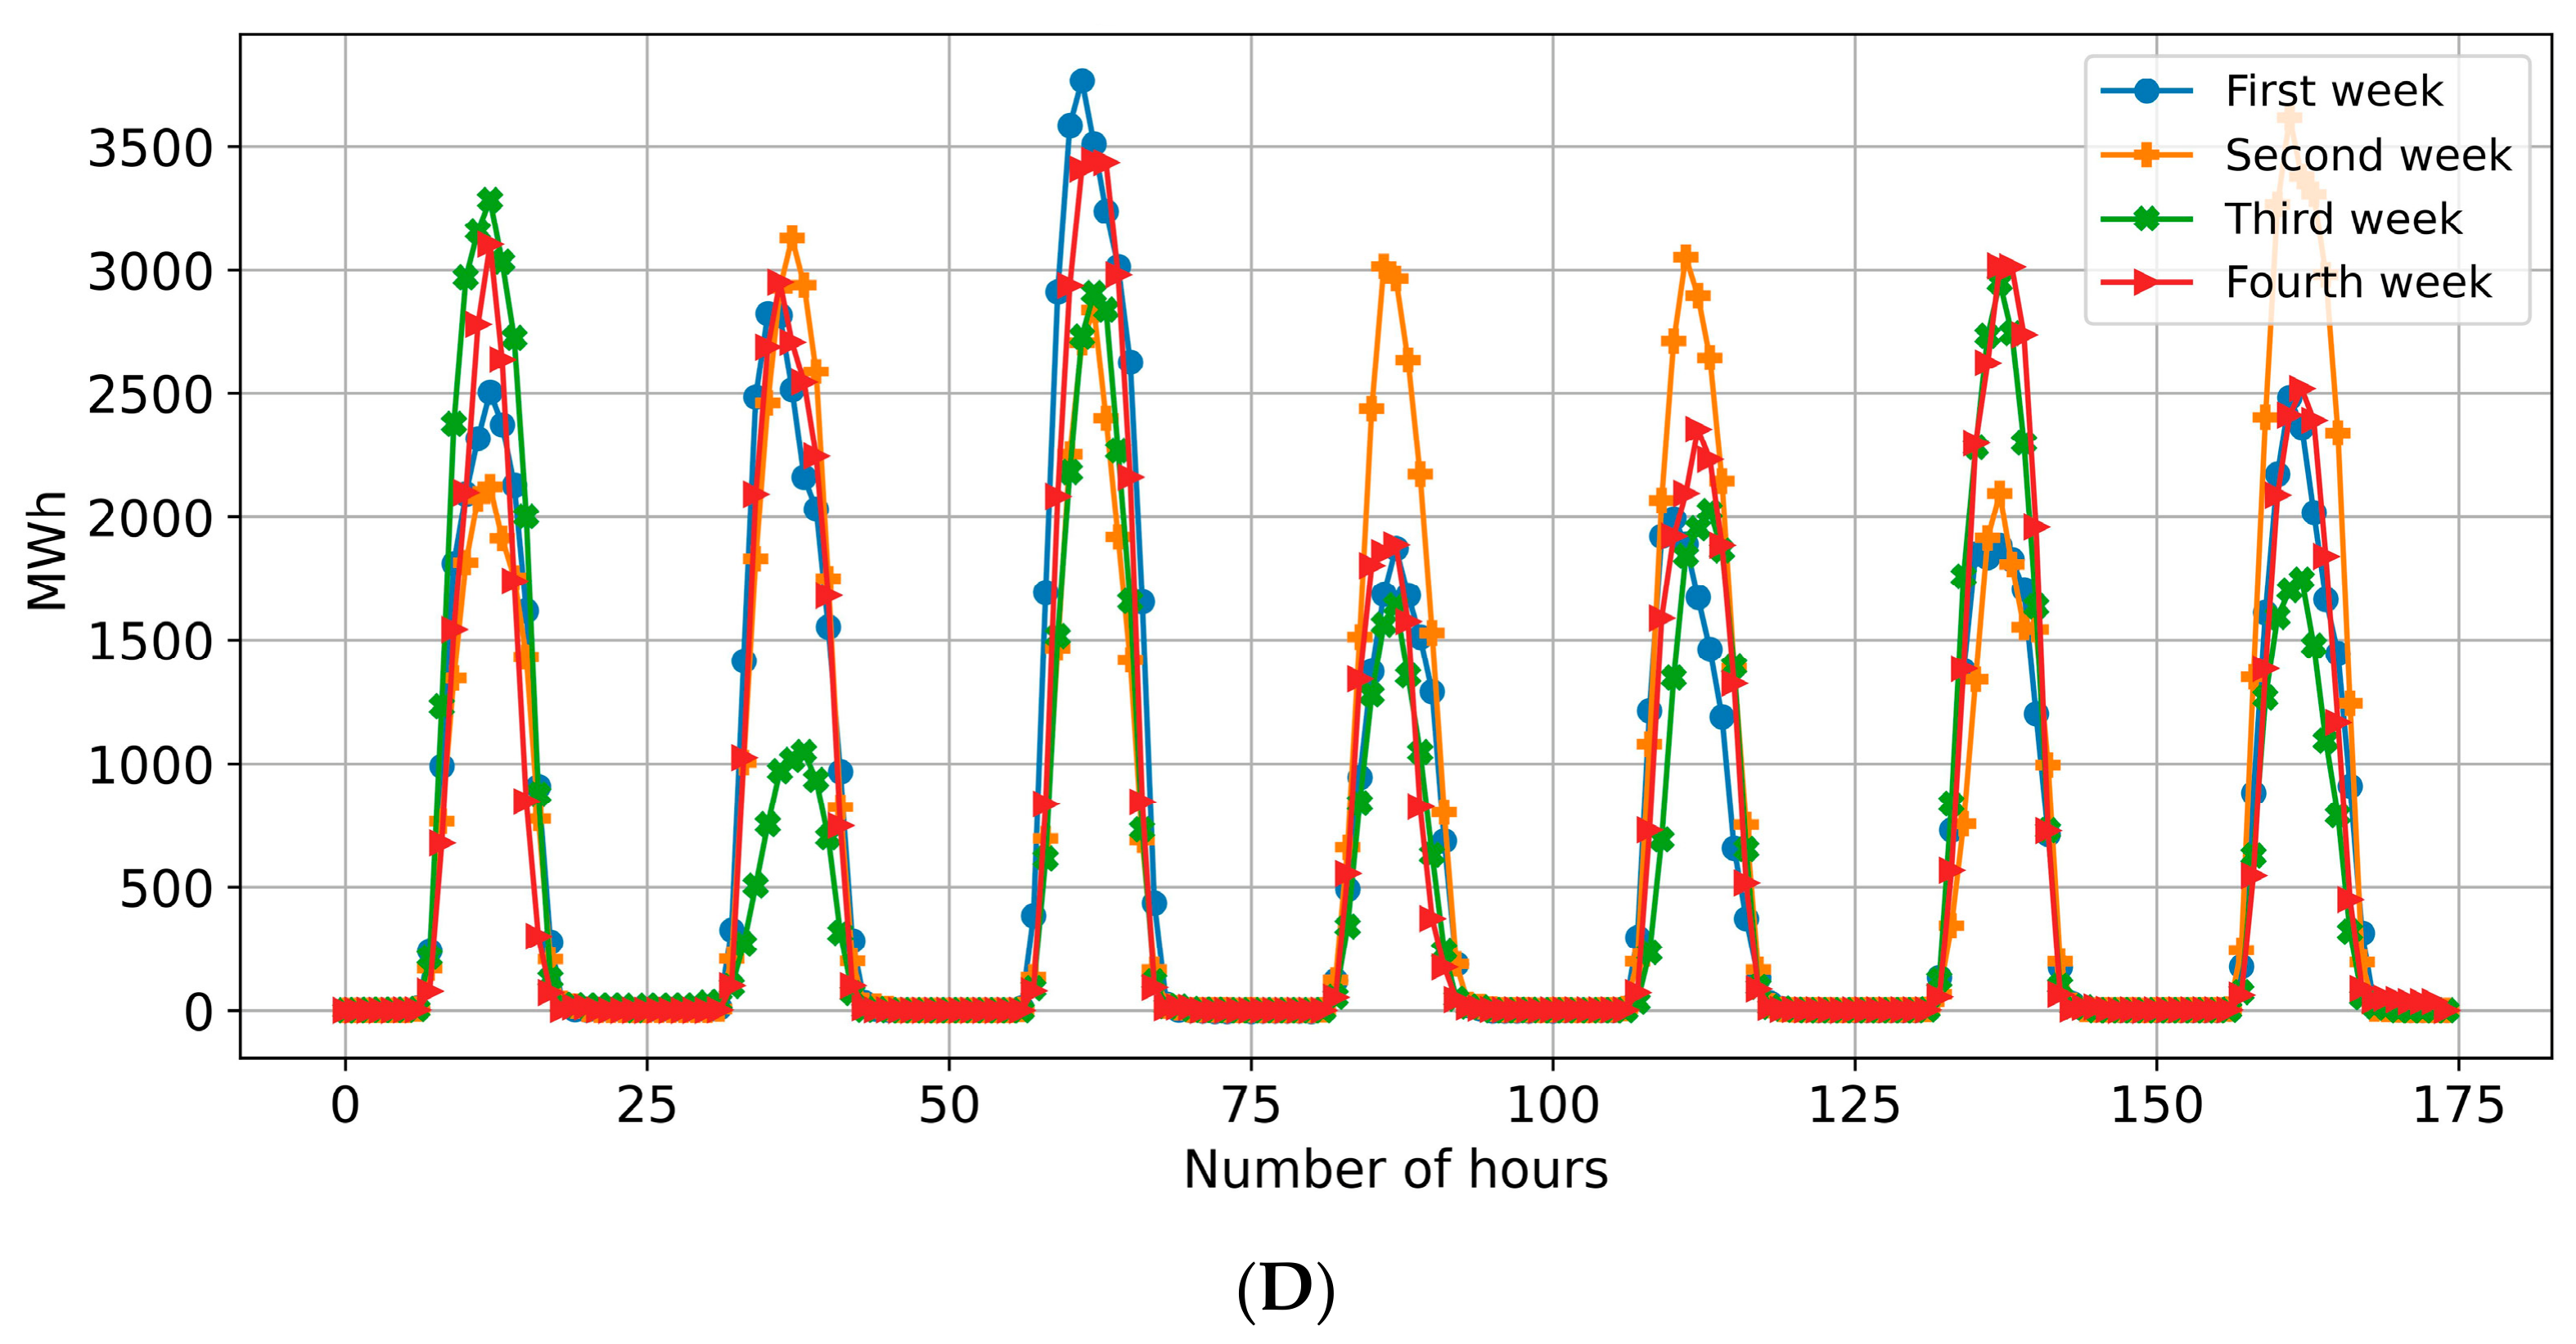
Figure 2A–D). To illustrate the seasonal and day-to-day variability of renewable electricity availability, the weekly generation profiles of photovoltaic power plants for the same periods are presented in
Figure 3A–D.
Despite Hungary’s substantial installed solar generation capacity relative to its peak electricity demand, domestic electricity production is often insufficient to fully satisfy consumption. This is particularly evident during winter, when solar generation is limited and electricity demand is relatively high (
Figure 2A). In contrast, during sunny days in spring, summer, and autumn, photovoltaic and mainly nuclear generation can substantially exceed domestic demand during midday hours (
Figure 2B–D). Such periods of excess renewable generation provide opportunities for energy storage, including battery energy storage systems and pumped hydropower, as well as to produce green hydrogen. These technologies can help shift low-carbon electricity from periods of high generation to periods of increased demand, thereby improving renewable energy utilization and reducing overall carbon emissions.
During winter, the use of heat pumps, electric heating systems, and other electrical appliances often leads to very high electricity demand. During the evening peak period (6–10 p.m.), which was observed throughout all four weeks analyzed in January, the simultaneous charging of 500,000 electric vehicles at 2.5 kW could significantly increase the load on the electricity grid. Distributed battery storage systems, such as NaS batteries deployed close to demand centers, could help mitigate these peak loads and facilitate EV charging even during periods of high electricity demand.
In April (
Figure 2B), electricity demand is generally lower than in January; however, significant electricity imports were still required during periods of high demand. The commissioning of the two new nuclear reactors currently under construction, combined with increasing wind and solar generation and supported by energy storage systems, could create additional low-carbon charging windows for the future electric vehicle fleet. This would increase the availability of low-carbon electricity for transport while reducing dependence on imported electricity.
In July (
Figure 2C), the impact of air-conditioning demand on the electricity system becomes clearly visible. During warm summer periods, residential and commercial cooling substantially increase electricity consumption, particularly during the afternoon and evening hours. As a result, electricity demand remains relatively high despite the significant contribution of solar generation during daytime. For the grid-level storage scenario, the results suggest that charging EVs during late-night and early-morning hours may be the most favorable option, as electricity demand is relatively low before the morning increase in consumption. In contrast, when EVs are charged directly from local NaS battery storage, evening charging can also be an effective solution. In this case, the batteries can be charged using midday solar generation and later discharged during the evening peak period, allowing EV charging to be largely decoupled from grid congestion and periods of high electricity demand.
In October (
Figure 2D), the temporal distribution of the electricity import is similar to that in April. Around midday, the domestic generation was often enough to cover the demand, but in the morning, evening and at night significant electricity import was needed. Energy storage with big, industrial batteries or the batteries of the electric vehicle fleet could decrease the need to import expensive electricity.
4.2. The Variability of the Electricity Production of Solar Power Plants
In January, which represents winter conditions in Hungary, solar electricity generation was generally low (
Figure 3A). Nevertheless, even during this season, several sunny days produced peak photovoltaic outputs exceeding 2 GW. The results also demonstrate the importance of maintaining a diverse electricity generation portfolio, as extended periods of low solar generation can occur. For example, during the last four days of the second week, peak photovoltaic output reached only approximately 10% of the installed solar capacity.
Another challenge is the limited duration of winter daylight. Even under favorable weather conditions, photovoltaic power plants were able to generate substantial amounts of electricity for only 7–8 h per day. At the same time, electricity demand remained relatively high because of increased heating requirements and other seasonal electricity consumption. Consequently, Hungary relied heavily on electricity imports during this period, with imports accounting for up to 30–40% of total consumption in some hours. In addition, fossil-fuel-based generation, particularly from natural gas and coal-fired power plants, made a significant contribution to meeting electricity demand during January (see also
Figure A1A in
Appendix B).
In April (
Figure 3B), solar electricity generation was substantially higher than in January. Except for a single day, peak photovoltaic output exceeded 1.5 GW throughout the period analyzed. On particularly sunny days, such as the third day of the fourth week, solar power plants generated close to 80% of their installed capacity around midday. In addition, the duration of significant solar electricity production was considerably longer than during winter.
During spring, the combination of high photovoltaic generation and stable nuclear power output often enabled domestic electricity generation to fully satisfy national demand during midday hours and in some periods even allowed electricity exports. These conditions create favorable opportunities for energy storage, as low-carbon electricity generated during periods of high solar output can be stored and later used during evening hours when electricity demand is typically higher. Consequently, energy storage can contribute not only to reducing greenhouse gas emissions but also to improving the economic utilization of renewable electricity.
In July (
Figure 3C), the highest photovoltaic electricity generation of the four months analyzed was observed. On most days, solar power plants generated approximately 50–60% of their installed capacity at peak output. However, considerable day-to-day variability remained evident. For example, during the second and third days of the second week, solar generation dropped to levels comparable to those typically observed in winter.
This variability presents a challenge for relying solely on photovoltaic generation to meet electricity demand. One possible solution would be to further expand installed solar capacity. However, providing a consistent 5 GW of solar electricity during midday hours on low-generation days would require a several-fold increase in installed capacity. Such an expansion would result in substantial overproduction during sunny periods, increasing the need for energy storage, demand-side flexibility, or other balancing solutions to effectively utilize the additional renewable generation.
Another important challenge is the temporal mismatch between peak electricity demand and peak photovoltaic generation. For example, in July, the increasing use of air-conditioning systems can lead to periods of very high electricity demand, particularly during the afternoon and evening hours. A similar temporal mismatch may occur for electric vehicle charging, as users often prefer to connect their vehicles to chargers after returning home from work. These patterns indicate that energy storage is essential if solar electricity is to be used more effectively for EV charging and for reducing the carbon emissions associated with space cooling and heating.
In October (
Figure 3D), solar generation showed a pattern similar to that observed in spring. During most of the period analyzed, photovoltaic output exceeded 1.5 GW at peak. However, as in other seasons, substantial day-to-day variability in solar generation was observed during autumn. This variability, combined with fluctuations in electricity demand, strongly influences the operation of the main fossil-fuel-based emitters in Hungary, particularly lignite-fired and natural-gas-fired power plants (see
Appendix B).
4.3. The Carbon Intensity of the Grid Electricity Without Energy Storage
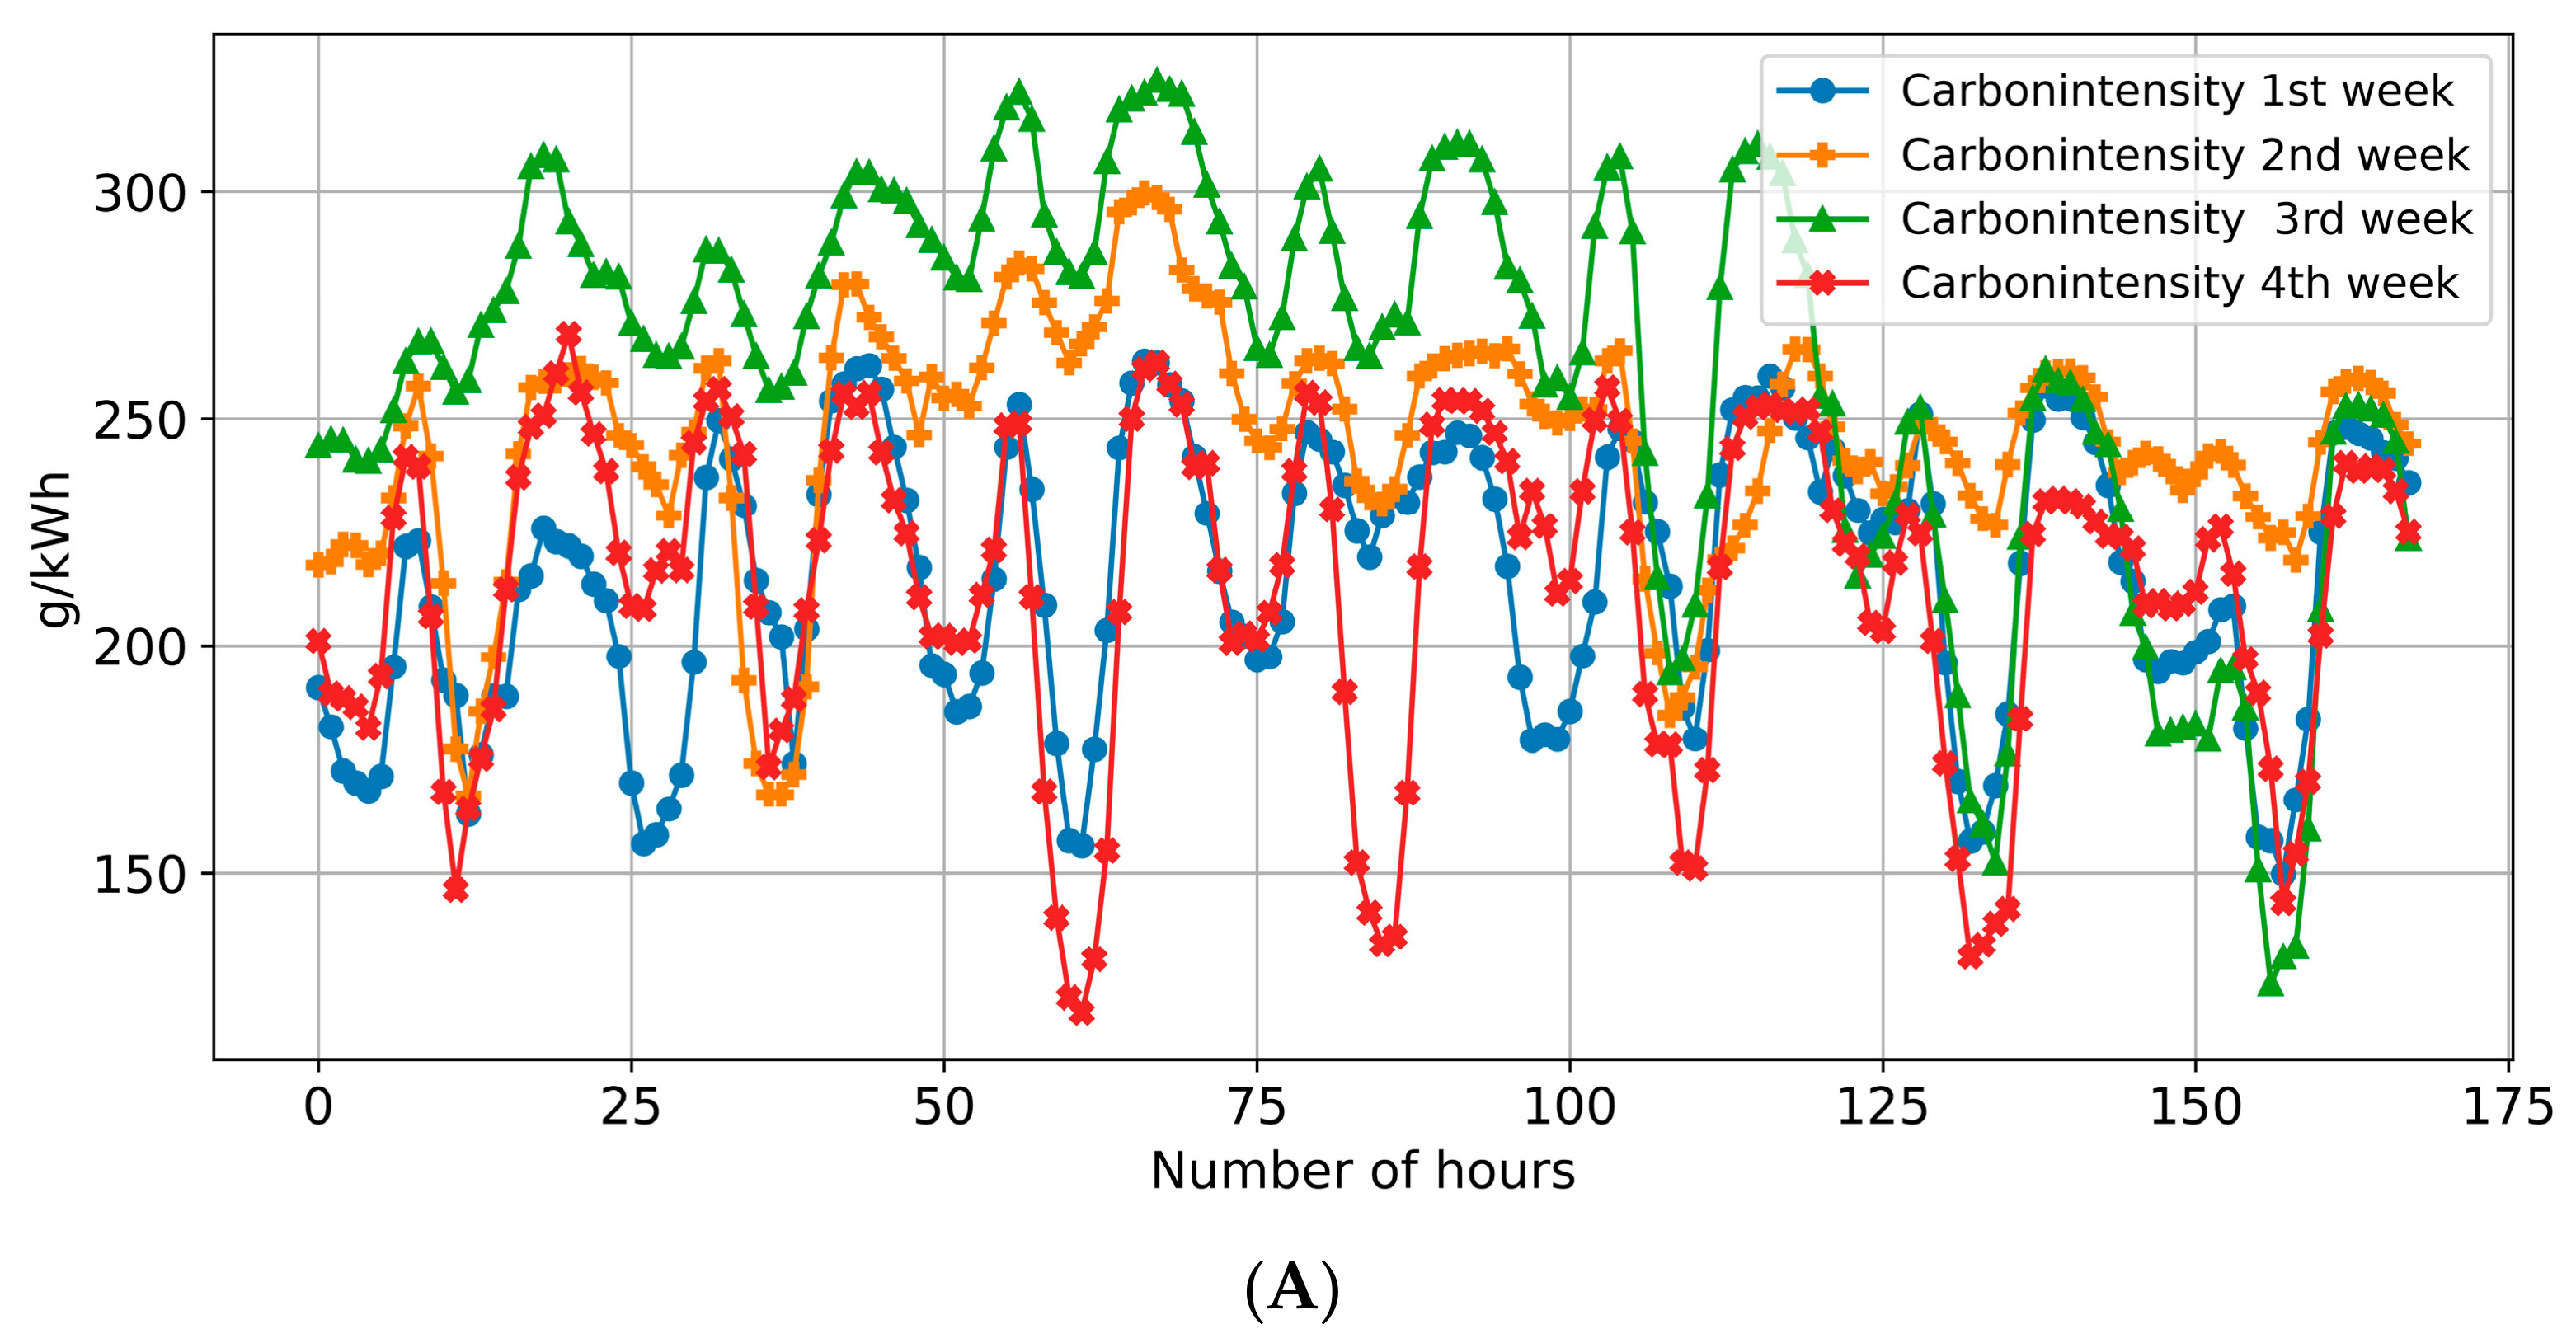
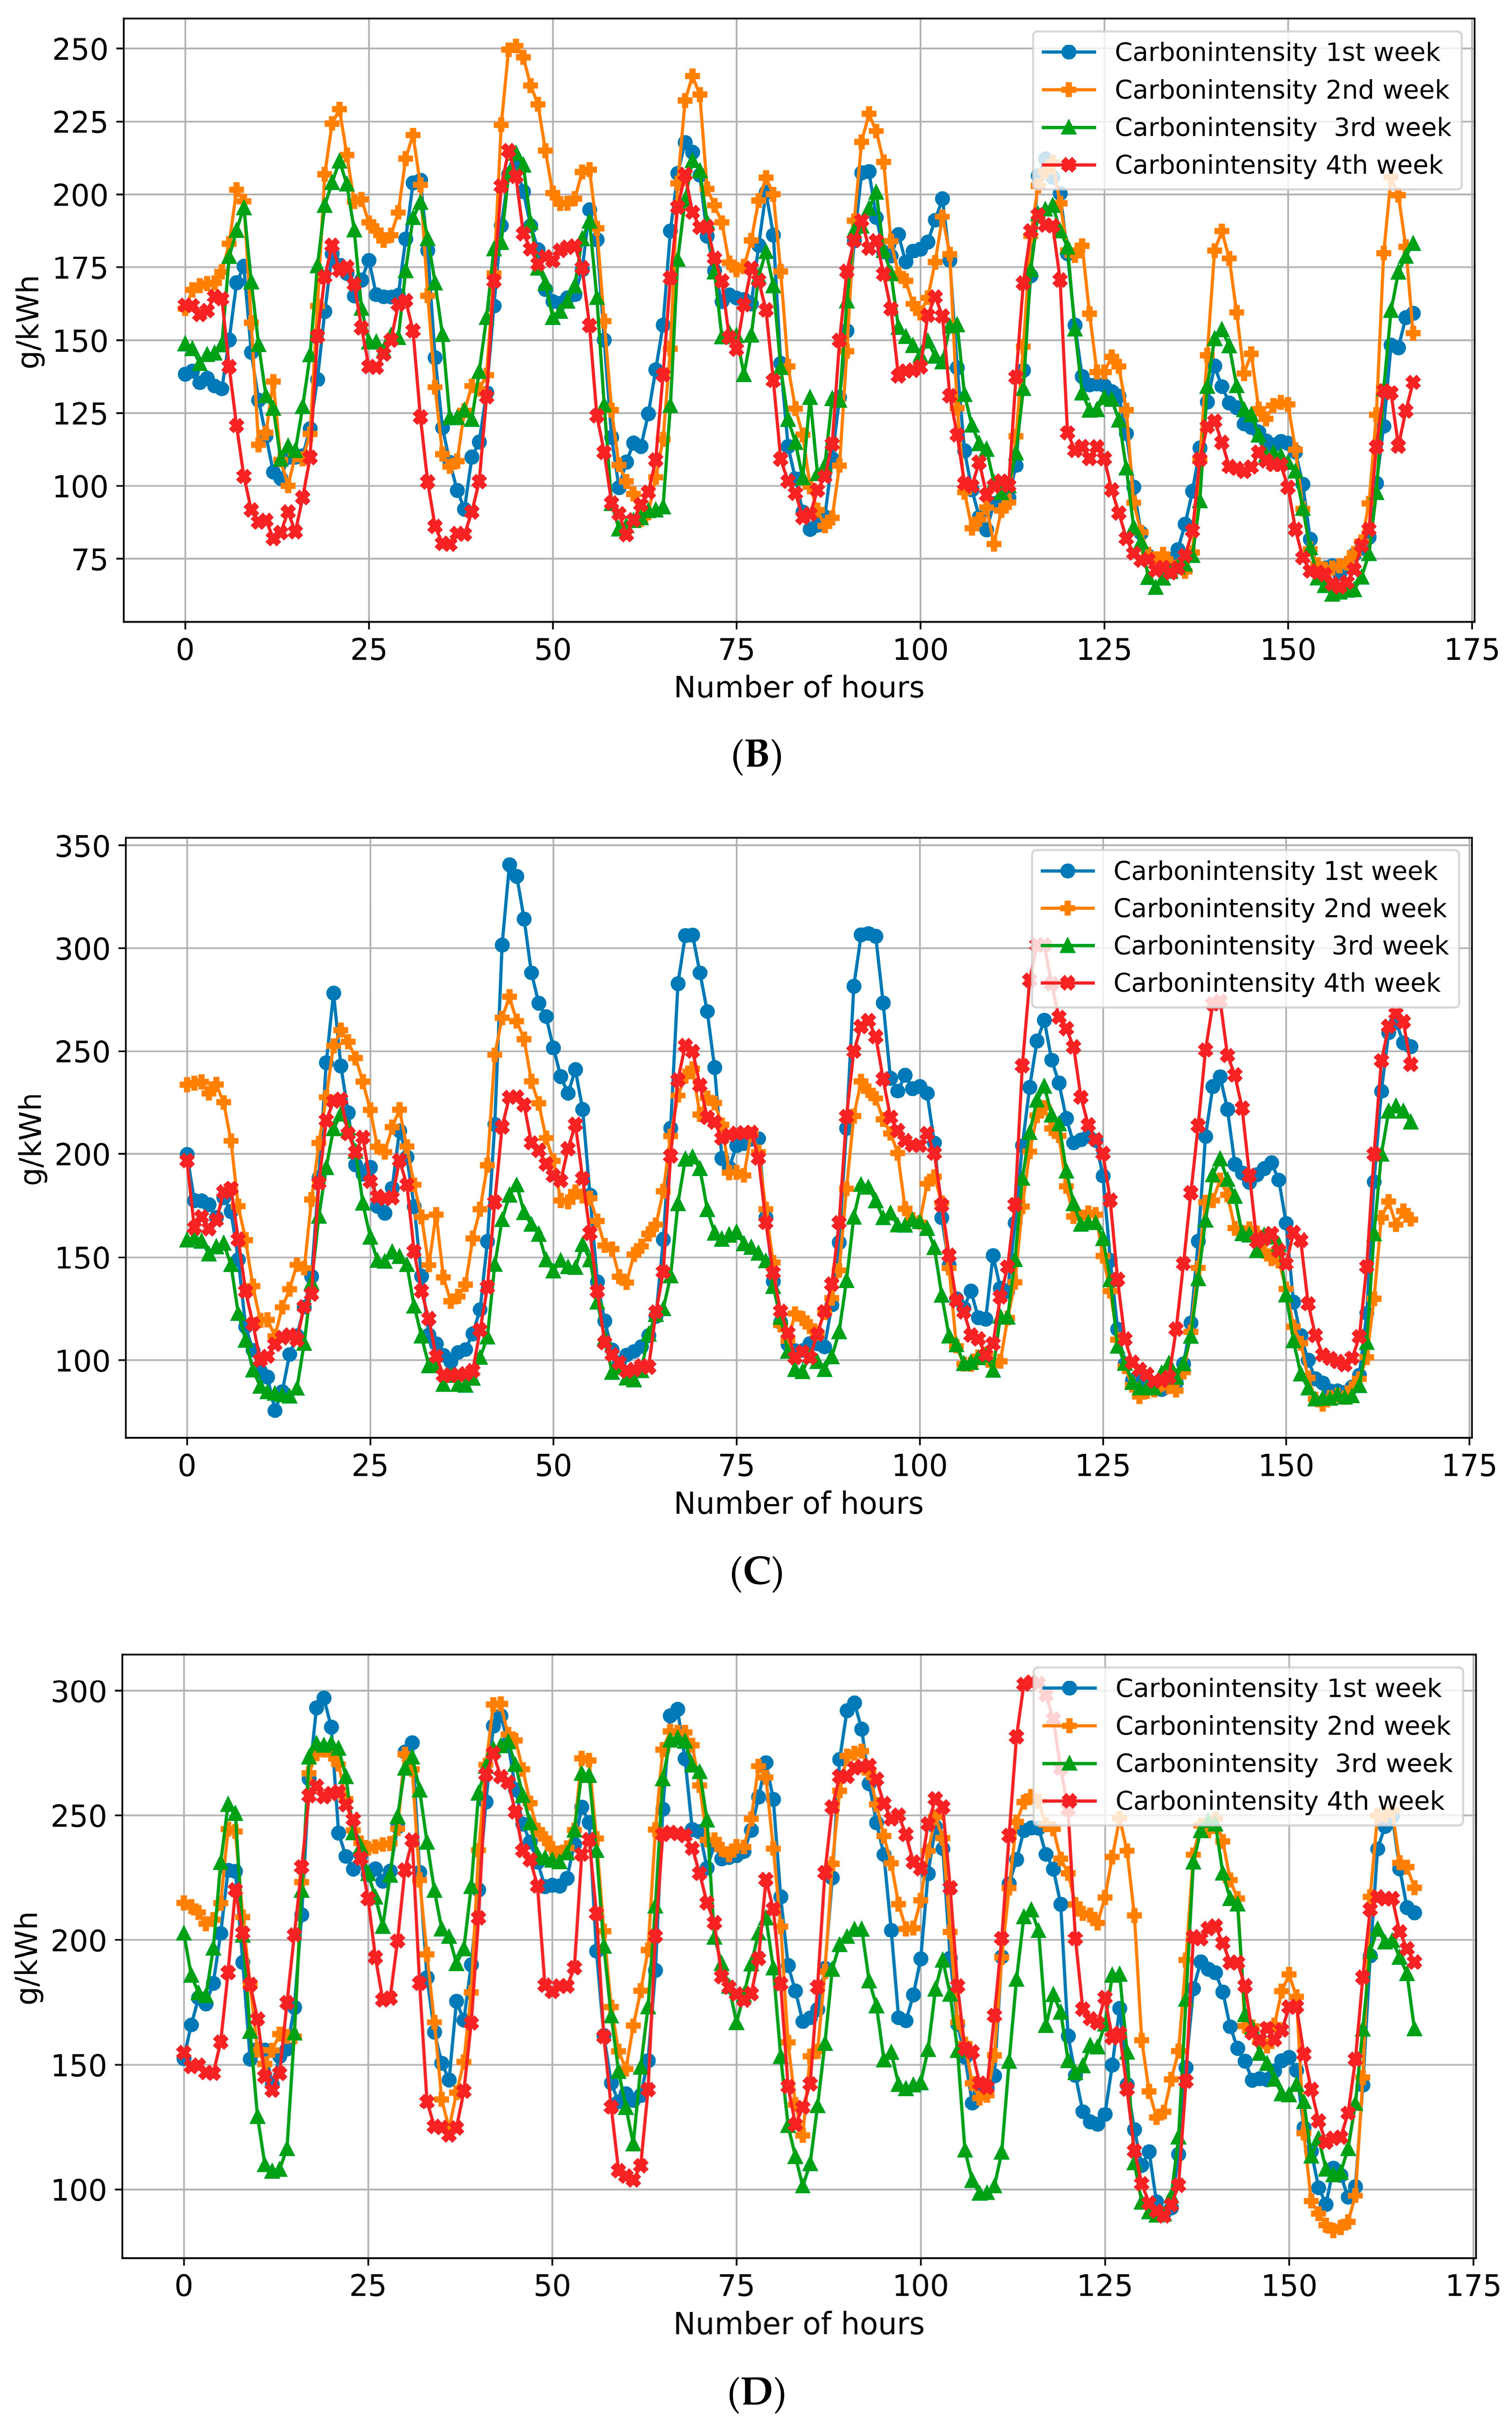
The carbon intensity of electricity generated in Hungary is strongly influenced by both total electricity demand and the share of low-carbon generation sources, particularly solar and nuclear power. As shown in
Figure 4A–D, periods of high solar generation are associated with substantially lower grid carbon intensity. During these “low-carbon hours,” typically between 10:00 a.m. and 2:00 p.m., life-cycle CO
2 emissions per kilowatt-hour were often significantly lower than during evening peak periods. In some cases, the carbon intensity of electricity was only half that observed during the “high-carbon hours” between 6:00 p.m. and 10:00 p.m., when solar generation was unavailable and a larger share of electricity demand had to be supplied by fossil-fuel-based generation and imports.
During the evening demand peak, natural-gas-fired power plants played a particularly important role in balancing the Hungarian electricity system. Based on the average values for the four weeks analyzed, gas-fired generation occasionally exceeded 1.25 GW in both January and October (see
Appendix B). The consistently high contribution of these power plants indicates that their output rarely fell below 25–30% of the installed gas-fired generation capacity during these months.
The results highlight the importance of using low-carbon electricity for EV charging if substantial greenhouse gas emission reductions are to be achieved. During late-night hours, the carbon intensity of grid electricity was often relatively low due to reduced electricity demand and the high share of nuclear generation in the electricity mix. Under the grid-level storage scenario, charging EVs during these periods could further reduce life-cycle emissions, as electricity stored in NaS batteries during periods of high solar generation can be discharged when the carbon intensity of the grid is already relatively low. Consequently, EV charging during late-night hours can result in significantly lower life-cycle CO2 emissions than charging during evening peak periods characterized by higher carbon intensity.
In April and July (
Figure 4B,C), the carbon intensity of electricity was generally lower than in January. The contribution of natural-gas-fired power plants was substantially reduced, with generation often remaining below 500 MW. Higher gas-fired generation occurred primarily during periods of elevated electricity demand, low solar output, and limited availability of low-cost electricity imports. As a result, low-carbon electricity sources, particularly solar and nuclear power, accounted for a larger share of total generation during these months, leading to a lower overall carbon intensity of the electricity mix. The high level of photovoltaic generation also resulted in exceptionally low grid carbon intensity during midday hours, even in the absence of energy storage. These findings demonstrate the technical feasibility of reducing the life-cycle CO
2 emissions associated with electric vehicle operation through direct charging with low-carbon grid electricity, as discussed in the Introduction. However, realizing this potential requires EV charging to be aligned with periods of high renewable electricity generation. In practice, such temporal synchronization is often difficult to achieve because vehicle charging demand is typically driven by user behavior and daily mobility patterns rather than by the availability of low-carbon electricity.
In July, the carbon intensity of electricity during the low-carbon hours was similarly low compared to that observed in April (
Figure 4B) and October (
Figure 4D), frequently falling below 150 g CO
2-eq/kWh. In contrast, the highest carbon intensity values—often exceeding 250 g CO
2-eq/kWh—were recorded during the evening hours in both July and October. These periods coincided with increased residential electricity demand, driven primarily by the widespread use of air-conditioning systems in summer and electric heating systems during cooler autumn days. As solar generation was unavailable during these hours, a larger share of electricity demand had to be met by higher-carbon generation sources and imports, resulting in a substantially higher carbon intensity of grid electricity.
4.4. Variability in the Number of Electric Vehicles Charged Exclusively by Solar Power Generation
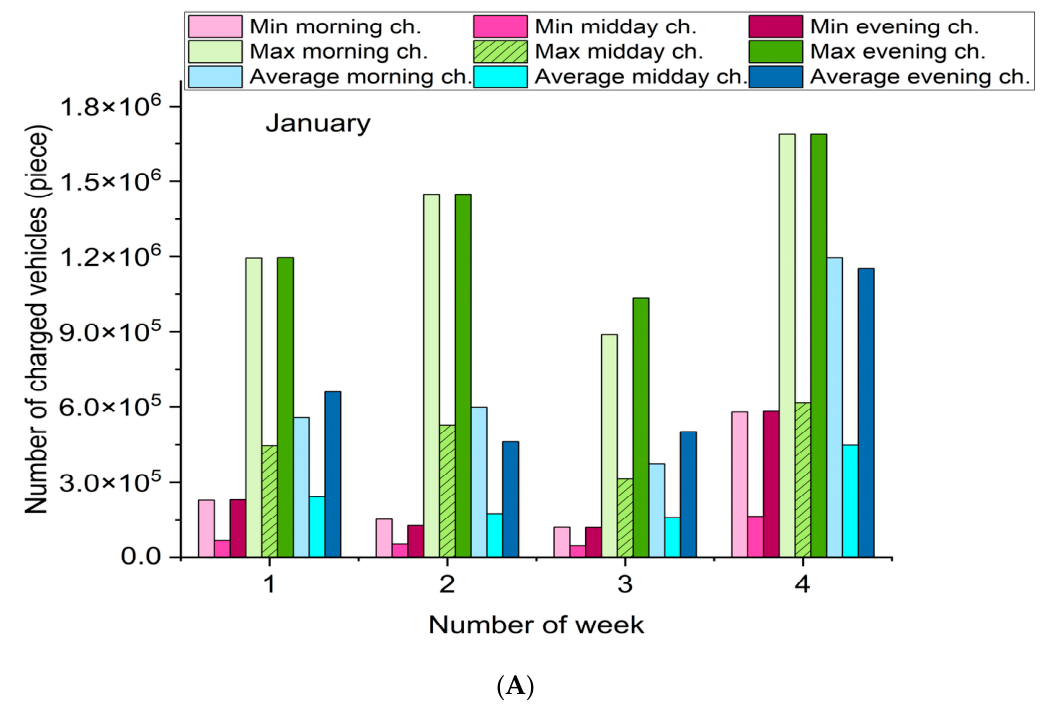
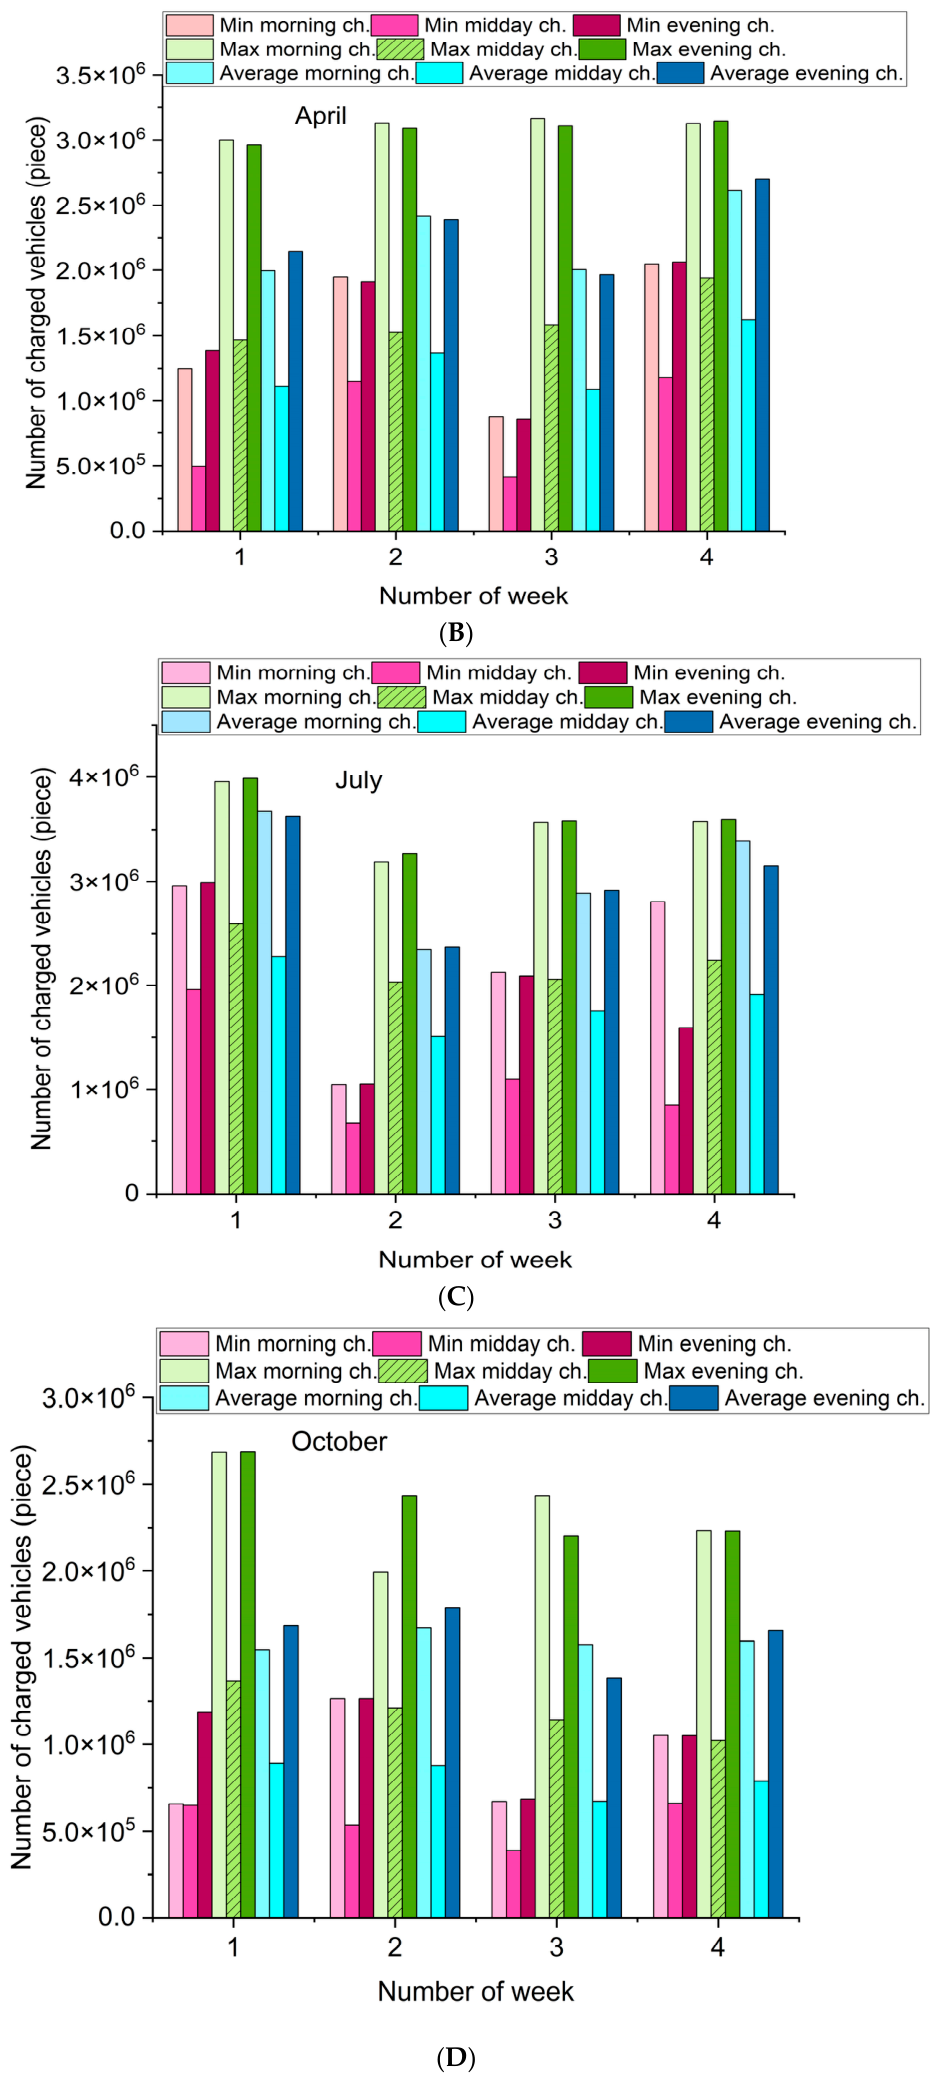
To assess the potential contribution of domestic solar power plants to the operation of a future electric vehicle (EV) fleet, it is essential to evaluate the temporal variability in the number of vehicles that could be charged using only solar-generated electricity. As mentioned in the Introduction, these results serve as an upper-bound estimate. For this analysis, an EV charging demand of 2.5 kW over a 4 h charging period was assumed. The number of vehicles that could be simultaneously charged was determined for each week of representative months from all four seasons. For each week, the minimum, maximum, and average number of chargeable vehicles were calculated based on the electricity generated by domestic solar power plants. The results are presented in
Figure 5A–D.
At present, Hungary has approximately 100,000 electric vehicles (EVs). Assuming that the entire electricity generation from solar power plants can be stored and subsequently used for charging, the current EV fleet could be supplied during almost every week of the year, even when considering the minimum number of chargeable vehicles, which corresponds to the least favorable day of each week. The only exception occurs for midday charging during the first three weeks of January (
Figure 5A). However, in this case the available charging capacity could be significantly increased if solar generation were used directly for EV charging while the NaS storage system is simultaneously discharged. Such an operational strategy would substantially improve the feasibility of midday charging.
If the EV fleet expands to 500,000 vehicles, representing approximately 12% of the current combined fleet of electric and internal combustion engine (ICE) vehicles, solar generation alone would frequently be insufficient, or only marginally sufficient, to meet the charging demand in January. This is evident from both the average and minimum numbers of chargeable vehicles. These results indicate that, during winter months, additional low-carbon electricity sources would be required to reliably support a fleet of this size.
A more extensive electrification scenario, corresponding to approximately half of the current ICE vehicle fleet being replaced by EVs (around two million vehicles), would require substantially greater electricity supply. Based on the average number of chargeable vehicles, such demand could only be met during most weeks of July (
Figure 5C) and during some weeks in April and October (
Figure 5B,D). In contrast, charging a fleet of this magnitude solely from solar generation would not be feasible during any week of January (
Figure 5A).
In addition to solar power generation, wind turbines and nuclear power plants—either conventional large reactors (LRs) or small modular reactors (SMRs)—could play a key role in enabling the full electrification of the Hungarian passenger vehicle fleet. Applying the same methodological framework used in this study for solar power plants to wind and nuclear generation technologies would provide further insights into their potential contribution.
4.5. The Influence of Carbon Intensity and Charged Number of Vehicles to the CO2 Emission Decrement
Taking one vehicle with one specific driven distance and one type of fuel consumption, the two main important variables that influence the carbon emission of electric vehicle charging and the avoided CO2 emission when using industrial battery storage are the number of charged vehicles in the four hours of the EV charging period and the g/kWh carbon intensity of the used electricity.
The number of charged vehicles—caused by the strongly variable collected electricity amount—has a seasonal, weekly, and daily variation. The average charged vehicle number for the evening charge is 694,027 for January. In April, more than three times more (2,299,771), in July 4.3 times more (3,015,687), and in October 2.3 times more (1,597,417) EVs can be charged than in January. For local storage, because for this case the carbon intensity of the used electricity is constant, the vehicle number is the only influencing variable. For grid-level storage the ratios of the carbon intensity of the grid electricity with or without storage are not so much influenced by the seasons as the variation of the charged vehicle numbers. This is an outcome of the fact that in Hungary nuclear power also generates much low-carbon electricity. In July, as indicated in
Table 3, the carbon intensity of electricity with storage is 50–60% of the emission without it but the charged vehicle number is more than four times higher. This shows that here mainly the number of charged vehicles is influencing the avoided carbon emission. It is worth noticing that higher solar generation in summer has two effects that act synergistically: I. More EVs can be charged. II. The higher energy amount with low carbon intensity in the NaS can reduce carbon emission more compared to the use of high carbon intensity electricity caused by air conditioner usage. This can explain why the highest CO
2 emission decrements can be achieved in July.
In spring and autumn, the effect of the lowered carbon intensity is less, as shown in
Table 3. Fewer EVs can be charged as in summer. This data shows that in all seasons to avoid more CO
2 emissions, primarily the charged number of EVs should be increased.
In our study we only calculated the CO2 emission avoided by using electric vehicles charged with or without energy storage. If we compare the CO2 emission to the emission of petrol cars for the same total driven distance, the importance of vehicle electrification in climate efforts becomes even more significant.
4.6. Use of Industrial Energy Storage to Reduce the Carbon Emissions of Electric Vehicle Charging
Electric vehicles can be charged directly from NaS batteries, which offers several advantages. First, the electricity used for charging has a low carbon intensity, estimated as 43 g CO
2-eq/kWh for generation and 33 g CO
2-eq/kWh for storage [
15]. This combined value is generally lower than the carbon intensity of grid electricity in Hungary and in most EU countries [
6]. Second, local battery-supported charging can reduce the need for long-distance, high-power electricity transmission. Local distribution grids are often unable to provide megawatt-scale power at locations such as parking areas equipped with several 250–350 kW fast chargers. In addition, new solar power plants in Hungary may face connection limitations due to insufficient transmission grid capacity. In such cases, NaS or other battery systems charged during periods of high photovoltaic production and discharged locally for EV charging could provide a technically feasible solution.
Large-scale industrial energy storage systems, such as battery farms or pumped-storage hydropower plants, may also be connected directly to the transmission grid, supplying low-carbon electricity to a wider range of consumers. In this configuration, EV charging does not need to take place near the storage site. Instead, the discharged electricity contributes to reducing the overall carbon intensity of grid electricity by increasing the share of low-carbon supply.
When low-carbon electricity previously stored in the NaS battery is discharged, it generally reduces the carbon intensity of the electricity used for EV charging. The extent of this reduction can be quantified by comparing the carbon intensity of the electricity supplied during charging with and without the contribution of energy storage.
As shown in
Table 3, in January the use of energy storage can reduce the CO
2 emissions associated with EV charging by approximately 5–28%, depending on the week and charging period. More favorable results are observed in April, when emission reductions exceed 30% in most morning and evening charging periods. In July, the benefits of energy storage are even more pronounced: on several days, the greenhouse gas emissions associated with EV charging can be reduced by approximately 50%. Even during the two least favorable weeks of the month, nearly 40% of the emissions can be avoided in the morning and evening charging periods. In October, the use of NaS batteries decreases the average carbon intensity of EV charging by approximately 30–35% for both morning and evening charging periods.
4.7. The Variability of the Avoided Carbon Emission from EV Charging Enabled by Solar Power Generation and Battery Energy Storage
To quantify the environmental benefits of battery energy storage, the avoided CO2 emissions associated with EV charging were evaluated under two different storage configurations:
- i.
Grid-level storage—the reduction in CO2 emissions achieved when EVs are charged from the electricity grid that incorporates energy storage, compared with the reference case without storage.
- ii.
Local storage—the reduction in CO2 emissions achieved when EVs are charged directly from a NaS battery charged using solar-generated electricity, compared with the same reference case without storage.
The avoided CO
2 emissions were determined by comparing the carbon intensity of electricity used for EV charging in each storage configuration with that of the corresponding baseline scenario. Since the morning and evening charging periods enabled the largest number of vehicles to be charged (
Figure 5), the results presented in this section focus exclusively on these two charging periods.
4.8. Challenges and Opportunities with Grid-Level Storage
The increasing penetration of renewable generation and EVs presents new challenges for power system operation. In addition to maintaining the balance between electricity generation and demand, the grid must accommodate the high and often concentrated power demand associated with EV charging. Smart charging and stationary battery energy storage can improve grid flexibility by shifting charging to periods of high renewable generation or low electricity demand, reducing peak loads, and postponing costly distribution network improvements [
9,
10].
At the same time, the deployment of stationary battery storage requires advanced energy management and inverter control strategies to coordinate the battery operation and maintain voltage stability and power quality. These control systems are a focus of current smart grid research and are essential for the large-scale integration of distributed energy storage. An emerging approach, vehicle-to-grid (V2G) technology provides an additional source of flexibility by allowing parked EVs to temporarily supply electricity back to the grid. In practice, future charging infrastructure will likely combine smart charging, stationary battery storage, advanced control systems, and V2G according to local grid conditions and charging demand [
7,
8].
4.9. The Practical Significance of Local Storage
Scenario 3 is an idealized reference case rather than a specific engineering design for future charging infrastructure. Charging a large number of EVs directly from a single large stationary battery would require substantial investments in power electronics, protection systems, and energy management. Therefore, the main purpose of this scenario is to illustrate the upper-bound environmental benefits that could be achieved if EV charging were supplied entirely from stored renewable electricity.
In practical applications, similar functionality is more likely to be realized using distributed battery energy storage systems installed at charging stations or charging hubs. These batteries can serve as local energy buffers between renewable generation, the electricity grid, and EV chargers, thereby reducing peak grid demand, improving renewable energy utilization, and avoiding or postponing expensive grid reinforcement [
9,
10]. Consequently, Scenario 3 provides a useful benchmark for evaluating the environmental potential of battery-supported EV charging while remaining closely related to practical charging concepts such as battery-buffered charging stations, smart charging, and V2G.
4.10. Modifying the Avoided Carbon Emission Data with the Vehicle Electricity Consumption and the Daily Driven Distance
As mentioned earlier, the goal of our work was to provide results for one specific car and one driven distance and 100% total efficiency (baseline scenario) that can be later easily scaled by the actual car fleet, driving behavior and total efficiency.
Regarding the avoided carbon emission for the local storage, when the EVs are charged directly from the NaS, only the multiplying factors in
Table 2 have to be used. For this charging mode, the carbon intensity of the used electricity is not influenced by the total efficiency, so only the number of charged vehicles has to be modified.
For the grid-level storage, when the NaS only adds low-carbon electricity to the grid, in addition to the scaling of the charged vehicle number, the carbon intensity of the electricity also has to be modified. If the efficiency is less than 100%, less low-carbon electricity can be discharged from the NaS during the EV charge, so the carbon intensity of electricity is a bit higher. Of course, the effect of this is lower than the effect on the charged vehicle number because here the solar power gives only a part of the carbon intensity. In Hungary, there is stable nuclear generation with approximately 2 GW power. As a result of this, especially in winter, the carbon intensity of electricity is usually only 2–3% higher when there is only 80% total efficiency. For the grid-level storage, to incorporate the effect of total efficiency lower than 100% on the carbon intensity of electricity, in addition to values in
Table 2, a second multiplying factor, the values in
Table 4, has to be applied.
4.10.1. January 2025
To provide a more intuitive interpretation of the avoided CO
2 emissions, the results were expressed in terms of equivalent emissions from conventional passenger vehicles and household electricity consumption. Specifically, the avoided emissions were converted into the number of petrol-powered cars emitting 170 g CO
2/km that would generate the same amount of CO
2 over an annual driving distance of 10,000 km (
Table 5). In addition, the avoided emissions were compared to the annual electricity-related emissions of households assuming a monthly electricity consumption of 210 kWh and a grid carbon intensity of 200 g CO
2/kWh. These comparisons help illustrate the practical significance of the emission reductions achieved using NaS battery storage.
As shown in
Table 5, avoiding 1000 tons of CO
2 emissions is equivalent to the annual emissions of approximately 588 petrol-powered passenger vehicles or the yearly electricity-related emissions of around 2000 households. These results demonstrate that the integration of NaS batteries or other large-scale energy storage technologies can substantially enhance the environmental benefits of transport electrification. Compared with a scenario in which conventional petrol and diesel vehicles are simply replaced by EVs charged using relatively carbon-intensive grid electricity during morning or evening charging periods, the use of low-carbon stored electricity can lead to significantly greater reductions in greenhouse gas emissions.
An examination of the daily avoided CO
2 emissions associated with NaS energy storage (
Table 6) shows that, during two weeks in January, more than 1000 tons of CO
2 emissions could have been avoided on sunny days using grid-level NaS energy storage. Even greater reductions were achieved when EVs were charged directly from the NaS battery, reaching 2000–2500 tons of avoided CO
2 emissions on some days. In contrast, during cloudy periods the benefits were substantially lower, with avoided emissions typically ranging from approximately 15 to 250 tons for grid-level storage and from 250 to 900 tons for direct EV charging from the NaS battery.
4.10.2. April 2025
In April, the maximum daily avoided CO
2 emissions achieved through grid-level storage were 1.75–3.62 times higher than those observed during the corresponding weeks of January, while the average avoided emissions were 1.69–6.70 times greater (
Table 7). During the second week of April, direct EV charging from the NaS battery could have avoided approximately 2000–3000 tons of CO
2 emissions per day. As shown in
Table 3, an avoided emission of 3 kt of CO
2 is equivalent to the annual electricity-related emissions of approximately 6000 households, highlighting the substantial emission reduction potential of large-scale energy storage combined with low-carbon electricity generation.
4.10.3. July 2025
Among the four months investigated, July exhibited the highest potential for greenhouse gas emission reductions (
Table 8). This can be attributed to the combination of exceptionally high solar power generation, which enabled the charging of more than three million electric vehicles on sunny days, and the relatively high carbon intensity of grid electricity during morning and evening periods, when electricity demand and gas-fired generation are typically elevated.
Even in the grid-level storage configuration, average avoided CO
2 emissions ranged from approximately 1600 to 5100 tons per day using NaS battery storage (
Table 8). Compared to the corresponding weeks of January, the average avoided emissions were 3.6–16.5 times higher. When EVs were charged directly from the NaS battery, the emission reduction potential increased further, reaching average avoided CO
2 emissions of approximately 2400–6900 tons per day.
4.10.4. October
In October 2025, the amount of electricity available for storage in the NaS battery was substantially lower than in July due to reduced solar power generation. Nevertheless, significant emission reductions could still be achieved. Based on the average values for the grid-level storage configuration, the avoided CO
2 emissions were 1.2–5.8 times higher than those observed during the corresponding weeks of January (
Table 9).
The results presented in
Table 6,
Table 7,
Table 8 and
Table 9 indicate that, particularly during the summer months, the combination of solar power generation and energy storage offers substantial potential for supporting the operation of electric vehicles while reducing greenhouse gas emissions.
Under favorable weather conditions, even during winter, the use of energy storage can result in significant daily emission reductions. On some days, the avoided CO2 emissions are equivalent to the annual emissions of approximately 1200 petrol-powered passenger vehicles or the yearly electricity-related emissions of around 4000 households.
The study shows that, on a typical summer day, large-scale energy storage can support the charging of approximately three million electric vehicles, achieving a daily CO2 reduction of 3296 thousand tons, with the reduction effect being particularly significant during peak grid carbon intensity periods in the evening. For winter, on average approximately 700,000 EVs could be charged, resulting in a lower, but still significant, daily emission reduction of 437.
5. Conclusions
Electric vehicles (EVs) are widely recognized as a key technology for reducing greenhouse gas emissions from the transport sector, which is essential for achieving climate neutrality by 2050. However, the environmental benefits of transport electrification can only be fully realized if the future EV fleet is supplied with enough low-carbon electricity generated from renewable and/or nuclear energy sources.
In this study, a simple methodological framework was developed to quantify both the variability in the number of electric vehicles that can be charged and the associated CO2 emission reductions achievable using low-carbon electricity generation and industrial-scale energy storage. To provide the theoretically maximum values we used 100% of the solar generation and assumed that the storage capacity and the durability of the transmission grid do not limit the usage of the NaS battery or the EV charging. Of course, establishing such big energy storage that can store all of the generation of the Hungarian solar power plants and constructing the hardware and software necessary to coordinate both the charge of the industrial energy storage and the EVs require significant investment. The goal of our calculations was to provide theoretical maximum number of vehicles that can be charged using only the generation of the solar power plants. Our results also serve as the achievable maximal CO2 emission that can be modified with different scaling factors. In addition to showing how such EV operations can help to strongly decrease CO2 emissions of traffic, it is also worth noticing that replacing petrol and diesel cars could also help to make Hungary less dependent on oil imports.
Hungary was selected as a pilot case to demonstrate the applicability of the methodology using real-world solar generation and electricity carbon intensity data. The results show that the current Hungarian solar power fleet, with an installed capacity of approximately 4.7 GW, is not sufficient on its own to support the charging demand of a future fleet of two million electric vehicles during winter or on many cloudy days throughout the year. Even during summer, periods of unfavorable weather conditions can substantially limit the number of vehicles that can be supplied solely by solar generation.
The Hungarian case study illustrates the importance of complementing solar power with other low-carbon electricity sources, such as wind energy and nuclear power, to ensure a reliable electricity supply for large-scale transport electrification under varying meteorological conditions. Furthermore, even when EV charging can be partially aligned with periods of high solar generation, limitations in transmission and distribution grid capacity may become a significant constraint on the operation of a large future EV fleet. Consequently, the integration of energy storage technologies, together with a diversified portfolio of low-carbon generation sources and adequate grid infrastructure, will be essential for maximizing the climate benefits of transport electrification. For wind and solar power plants the temporal availability and the fact that the generation is not parallel with the consumption can be solved, if NaS batteries or other storage technologies are used to collect the low-carbon generation. In addition, a distributed network of batteries can reduce the load of the grid and make it possible to charge bigger EV fleets by maximizing the low-carbon and renewable electricity usage.
The results highlight the considerable potential of combining solar power generation with large-scale energy storage to reduce the greenhouse gas emissions associated with electric mobility. In July, the use of grid-level energy storage can reduce the carbon intensity of EV charging by approximately 40–50%. Under favorable weather conditions, this corresponds to daily avoided emissions of 5–7 kilotons of CO2. Such an emission reduction is equivalent to the annual emissions of approximately 3000–4000 petrol-powered passenger vehicles, assuming an emission factor of 170 g CO2/km and an annual driving distance of 10,000 km.
Naturally, during winter months and extended cloudy periods, solar power alone cannot provide sufficient energy to support the charging demand of millions of electric vehicles. Nevertheless, even under these less favorable conditions, the use of battery energy storage can still result in substantial emission reductions. On some winter days, the avoided CO2 emissions are equivalent to the annual emissions of several hundred conventional petrol vehicles, demonstrating that energy storage can provide environmental benefits throughout the year.
The quantitative results of this study suggest that, in Hungary, prioritizing the deployment of energy storage systems serving evening charging needs may yield higher carbon emission reduction benefits per unit capacity than at other times. Therefore, a time-weighted factor could be considered in the design of capacity markets or emission reduction incentive policies.
As a continuation of this work, the developed methodology will be extended to assess the contribution of additional low-carbon electricity sources, particularly wind and nuclear power, to the charging of future electric vehicle fleets. Future studies will investigate the extent to which these technologies can support the electrification of up to half of the current internal combustion engine vehicle fleet, while also quantifying their potential for reducing greenhouse gas emissions under different charging and energy-system scenarios.
Limitations of the Study
This study focused on the development of a simple methodological framework for assessing the variability in the number of electric vehicles that can be charged using electricity generated from low-carbon sources.
The main simplifications were: I. the NaS battery system was treated as a single aggregated storage unit that is either charged or discharged at a given time. Consequently, simultaneous charging of some battery units and discharging of others was not considered. II. The capacity of the NaS battery system was not constrained. III. The analysis assumed that the electricity transmission and distribution network is always capable of supplying all electric vehicles that could theoretically be charged using the available solar power generation. Grid capacity constraints may limit the extent to which renewable electricity can be utilized for EV charging, particularly during periods of high demand or in regions with insufficient network infrastructure. IV. Electricity imports were not considered in the analysis. V. Only the output of large-scale industrial photovoltaic power plants was included due to the limited availability of detailed production data for household-scale systems. VI. This study is not a real life-cycle analysis, because battery degradation and other factors like storage lifespan were not directly considered in the manuscript. VII. Life-cycle carbon emission calculations were based on median emission factors reported by the National Laboratory of the Rockies. Actual life-cycle emissions may differ depending on the technologies employed and their operational efficiencies. VIII. Due to the lack of literature data about the sodium–sulfur battery, the carbon emission associated with battery storage was calculated from the NLR data determined for Li-ion batteries.