Article

Energy Technology Innovation, Fossil Fuel-Based Electricity Generation, and Environmental Sustainability: Empirical Evidence from Major Emitting Economies

1
Business School, Shanghai Jian Qiao University, No. 1111 Huchenghuan Road, Pudong New Area, Shanghai 201306, China
2
Department of International Economics, Institute of Economics and Finance, The John Paul II Catholic University of Lublin, 20-950 Lublin, Poland
3
Institute of Journalism and Management, The John Paul II Catholic University of Lublin, 20-950 Lublin, Poland
*
Author to whom correspondence should be addressed.
Energies 2026, 19(14), 3412; https://doi.org/10.3390/en19143412
Submission received: 13 June 2026 / Revised: 12 July 2026 / Accepted: 18 July 2026 / Published: 20 July 2026

Abstract

This study examines the association between the fossil fuel share in electricity generation, energy-related climate change mitigation technologies, and CO2 emissions in four selected major emitting economies—China, the United States, India, and Russia—over the period 1990–2023. Using an extended STIRPAT framework, the analysis considers both consumption-based and territorial CO2 emissions per capita to distinguish between demand- and production-side perspectives on environmental responsibility. The fossil fuel electricity variable is measured as the combined share of electricity generated from coal, oil, and gas in total electricity generation and is further disaggregated into coal-, oil-, and gas-based shares. Energy-related technological innovation is proxied by the share of climate change mitigation technologies related to energy generation, transmission, or distribution among environment-related technologies. The baseline ECM and Driscoll–Kraay fixed-effects estimates indicate that the aggregate fossil fuel share in electricity generation is positively associated with both emissions measures, while the technology variable is negatively associated with emissions. However, the FMOLS estimates are less consistent, suggesting that long-run coefficients are sensitive to estimator choice. Country-level disaggregated estimates reveal substantial heterogeneity across fuels and countries, with coal-based electricity generation showing the most consistent positive association with emissions in China, India, and the United States. The findings suggest that electricity sector decarbonization in major emitters should prioritize coal substitution, renewable-energy deployment, grid modernization, and targeted energy-technology innovation, while climate responsibility assessments should consider both territorial and consumption-based emissions.

1. Introduction

Environmental degradation caused by greenhouse gas (GHG) emissions remains a central challenge for sustainable development. Rapid industrialization, economic growth, and expanding energy demand have increased reliance on fossil fuels and intensified CO2 emissions from production and consumption activities [1,2]. A key source of this pressure is the electricity sector, where many large economies still rely heavily on coal, oil, and gas. Although low-carbon energy transitions have accelerated, fossil fuel-based electricity generation continues to shape national emission trajectories and remains central to debates on energy security, technological innovation, and climate responsibility [3]. Understanding the environmental role of electricity generated from fossil fuels is therefore important for designing credible decarbonization strategies.
Most empirical studies examine the relationship between aggregate energy use, economic growth, and emissions. While useful, this approach may conceal the specific role of the electricity generation mix, where coal, oil, and gas differ substantially in carbon intensity and policy relevance. Previous electricity sector studies show that emissions depend not only on the scale of electricity production, but also on the composition of the power mix, particularly the relative shares of renewable and non-renewable sources, with coal remaining the most carbon-intensive component of many power system [4,5,6]. At the same time, recent energy system studies increasingly emphasize integrated low-carbon technologies, hydrogen-based storage, cogeneration, grid modernization, operational flexibility, and economic feasibility as important elements of the energy transition. Recent system-level assessments of hybrid and cogeneration configurations further show that technological innovation must be evaluated not only in terms of environmental performance, but also in terms of energy efficiency, system integration, and economic viability [7,8,9]. However, an important gap remains. Existing studies typically examine aggregate energy consumption, fossil fuel use, technological innovation, or emissions accounting frameworks separately. Relatively few studies jointly assess whether the fossil fuel share in electricity generation remains associated with emissions after accounting for energy-related technological innovation and distinguishing between consumption-based and territorial emissions. Moreover, aggregate measures of fossil fuel electricity dependence often conceal the potentially different roles of coal, oil, and natural gas.
The distinction between consumption-based CO2 emissions and territorial CO2 emissions is important for evaluating environmental responsibility. Territorial emissions assign emissions to the country where they are produced, whereas consumption-based emissions capture emissions embodied in final demand and trade. Recent emissions-accounting research shows that production- and consumption-based perspectives can lead to different interpretations of national responsibility, especially in trade-intensive economies, global value chains, and interconnected electricity systems [10,11,12]. For this reason, examining both consumption-based and territorial CO2 emissions provides a more complete assessment of the environmental implications of the fossil fuel share in electricity generation.
This study addresses this gap by examining China, the United States, India, and Russia over the period 1990–2023. The selected countries represent major emitting economies with large electricity systems and substantial dependence on fossil fuels in the power sector; therefore, the sample is interpreted as a focused group of major emitters rather than an exhaustive global ranking [13]. Accordingly, the study addresses three research questions. First, is a higher fossil fuel share in electricity generation associated with higher consumption-based and territorial CO2 emissions after controlling for income, population density, and energy-related technological innovation? Second, is energy-related climate change mitigation technology associated with lower emissions, and does this relationship differ between the two emissions accounting approaches? Third, do the estimated associations vary across coal, oil, and natural gas and across the four selected economies?
The central premise of this article is that the emissions implications of economic activity in major emitting economies cannot be fully understood without distinguishing between the scale of economic activity and the composition of electricity generation. GDP per capita captures the scale dimension of economic development, whereas the fossil fuel share in electricity generation captures the composition of the power mix. Aggregate energy indicators may obscure this distinction and may also conceal the heterogeneous roles of coal, oil, and natural gas. The study therefore extends the STIRPAT framework by integrating electricity sector fossil fuel dependence, energy-related climate change mitigation technologies, and alternative emissions accounting measures [1,14].
This study contributes to the literature in four ways. First, it distinguishes the scale effect associated with economic activity from the composition effect associated with the fossil fuel share in electricity generation, rather than relying only on aggregate energy-consumption indicators. Second, it incorporates climate change mitigation technologies related specifically to energy generation, transmission, or distribution into an extended STIRPAT framework. Third, it compares consumption-based and territorial emissions in order to determine whether the empirical relationships depend on the emissions accounting perspective. Fourth, it disaggregates the fossil fuel share in electricity generation into coal, oil, and gas and supplements the panel analysis with country-level estimates. By combining these elements, the study provides evidence on how electricity sector fossil fuel dependence, energy-related technological innovation, and emissions accounting choices are jointly related to environmental sustainability in major emitting economies.
The remainder of the paper is organized as follows. Section 2 reviews the relevant literature. Section 3 presents the data, conceptual framework, and econometric methodology. Section 4 reports and discusses the empirical results, including baseline estimates, robustness checks, and disaggregated fossil fuel electricity findings. Section 5 concludes with policy implications, limitations, and directions for future research.

2. Literature Review

Energy remains a fundamental input to economic growth, industrial development, and social welfare, yet its environmental consequences depend strongly on how energy is produced, transmitted, and consumed. In particular, electricity generation occupies a central position in the energy–emissions nexus because power systems remain highly dependent on fossil fuels in many economies. Earlier decomposition studies show that electricity output, the fossil fuel intensity of the generation mix, and the energy efficiency of power production are key determinants of CO2 emissions from the electricity sector [4]. Cross-country evidence similarly confirms that fossil fuel-based electricity production is closely associated with carbon emissions and economic growth, although the strength of this relationship differs across income groups and stages of development [15]. Against this background, this section reviews three related strands of literature: the emission implications of fossil fuel-based electricity generation, the role of energy technology innovation in emission reduction, and the distinction between territorial and consumption-based emissions accounting.

2.1. Fossil Fuel-Based Electricity Generation and Carbon Emissions

Among fossil fuels, coal-fired electricity generation is consistently identified as the most carbon-intensive source of power-sector emissions. Life-cycle evidence shows that coal-based thermal power plants emit substantially more greenhouse gases than natural gas plants, although gas-based generation remains a fossil fuel source and cannot be treated as fully compatible with long-term decarbonization [16,17]. Studies on India and other emerging economies further suggest that coal will continue to play an important role in electricity systems unless renewable energy deployment, grid modernization, and storage technologies expand rapidly [18]. At the same time, the potential role of natural gas as a transition fuel is debated, because methane leakage, infrastructure constraints, and lock-in effects may reduce its climate benefits [19,20]. The persistence of fossil fuel-based electricity generation is also shaped by broader macroeconomic, geopolitical, and institutional conditions. Growing economic, geopolitical, and political uncertainty typically delays investments and reinforces a “wait-and-see” approach, which limits the expansion of generation capacity and may perpetuate dependence on fossil fuels [21,22,23]. However, the effects of uncertainty are not uniform across countries. In economies with stronger institutions—particularly in the G7—the effect of uncertainty on energy transitions may differ across institutional contexts and support a more stable transition, whereas in economies with weaker institutional frameworks, the effects are less favorable and more likely to exacerbate investment delays [24,25,26]. For the U.S. and China, the literature points to differing responses of the generation mix to shocks: in China, the role of renewable energy is growing in response to geopolitical risks, while in the U.S., there is greater expansion of fossil fuels and nuclear power [21]. Although uncertainty is not examined directly in the empirical part of this study, this literature helps contextualize the investment conditions under which electricity systems either remain fossil fuel dependent or move toward low-carbon technologies.
Recent empirical studies have increasingly moved from total energy consumption toward a more specific analysis of electricity generation sources [27]. Yilmaz and Sensoy [5], using a STIRPAT framework for 20 high-emitting countries, show that fossil fuel use in electricity production is an important component of the emissions–growth–population nexus. Jun et al. [6] have examined the world’s top ten emitters and found that non-renewable electricity production increases CO2 emissions, whereas renewable electricity production and green innovations help reduce them. These findings support the view that the environmental impact of electricity depends not only on the scale of electricity production, but also on the composition of the power mix. Consequently, reducing emissions from the electricity sector requires not only limiting the role of fossil fuels, but also accelerating the development and diffusion of energy technologies that enable a cleaner and more flexible power system.

2.2. Energy Technology Innovation as a Pathway to Decarbonization

A second strand of literature, which constitutes an important point of reference for the present study, examines technological innovation as a mechanism for reducing emissions. The literature identifies several energy technology innovations that are particularly relevant for environmental sustainability, including renewable energy sources, energy storage, the electrification of transportation and industry, carbon capture and storage, and energy efficiency technologies [28]. Research shows that these innovations typically reduce emissions and improve system efficiency, but their impact depends on the scale of implementation, the energy mix, and life-cycle costs [25,29,30]. In this article, however, the term energy technology innovation is used in a specific operational sense. It does not refer to all technological change, nor to digitalization in general. It is proxied by climate change mitigation technologies related to energy generation, transmission, or distribution (TREG). This operationalization is narrower than the broader literature on green innovation, but it is appropriate for the present study because it focuses on technologies directly linked to the decarbonization of electricity systems. Conceptually, these innovations can be systematized into five functional groups: low-carbon electricity generation technologies, including solar, wind, hydro, geothermal, biomass, and other renewable technologies; technologies that reduce emissions from fossil electricity generation, including higher-efficiency thermal generation and carbon capture, utilization, and storage; transmission and distribution technologies, including smart grids, grid automation, power electronics, and interconnection infrastructure; flexibility and storage technologies, including batteries, pumped hydro, hydrogen-based storage, and demand response; and digital and AI-enabled energy management technologies that improve forecasting, dispatch, grid balancing, and efficiency.
The growing role of artificial intelligence and data centers illustrates the dual relationship between digitalization and energy system decarbonization. On the one hand, AI and data centers are becoming increasingly important drivers of electricity demand. In the United States, China, and the EU, the literature shows a common pattern: rapid growth in AI and datacenter electricity demand is tightening the challenge of decarbonization, although the scale and regional distribution of the problem differ across economies [31,32]. In the U.S., forecasts point to data centers reaching roughly 10–12% of national electricity use by 2030, with particularly acute grid stress in Virginia and Texas/ERCOT [33,34,35]. In China, datacenter electricity use is projected to increase substantially, while the “Eastern Data and Western Computing” initiative is presented as a way to shift load geographically and support net-zero goals [36,37]. For the EU, the evidence highlights concentration in a few hotspots such as Ireland, while also noting a gap in explicit CO2 emissions projections for the region [33,34].
On the other hand, digital and AI-enabled technologies may support decarbonization when they improve system flexibility, optimize electricity consumption, and facilitate the integration of renewable energy. Across major economies, the literature converges on a shared reconciliation strategy: make digital demand more flexible while cleaning up the power supply [38,39]. Reported measures include carbon-aware scheduling, workload shifting, smarter cooling and operations, and integration with renewables, storage, and hybrid systems [40,41,42]. China’s regional load-shifting approach is explicitly linked to emissions reduction, while U.S.-focused work emphasizes operational flexibility to reduce curtailment and reserve stress. More broadly, transparency and mandatory reporting are framed as necessary to make these measures scalable and credible, especially where current statistics and region-specific emissions estimates remain incomplete [7]. Thus, although datacenter expansion itself is primarily a source of additional electricity demand, AI-enabled energy management technologies are relevant to the innovation–emissions literature because they can improve forecasting, dispatch, grid balancing, and demand-side flexibility.
This operational distinction is also reflected in empirical studies, which show that the environmental effects of innovation depend not only on the overall level of technological advancement, but also on the specific type of energy technology being developed. For example, Wang and Zhu [43] find that renewable energy technology innovation contributes to CO2 emission abatement in China, while fossil energy technology innovation is less effective in reducing emissions. Cheng and Yao [44] also show that renewable energy technology innovation reduces carbon intensity in Chinese provinces, especially in the long run, although the effects differ across regions. These findings suggest that the type of innovation matters: green and renewable energy innovation is more likely to support decarbonization than innovation that merely improves fossil fuel technologies.
The innovation–emissions relationship is also heterogeneous across countries and institutional contexts. Studies on developed economies, emerging economies, BRICS, E7, and G7 countries show that green innovation, energy productivity, environmental taxes, and renewable energy technologies can improve environmental quality, but their effects depend on income levels, governance quality, policy support, and the absorptive capacity of each economy [45,46,47]. Spatial econometric studies further indicate that energy technology innovation may generate spillover effects, reducing emissions not only locally but also in neighboring regions through technology diffusion and policy learning [43].

2.3. Territorial and Consumption-Based Emissions Accounting

Another important development in the literature concerns the distinction between territorial or production-based emissions and consumption-based emissions. Territorial or production-based accounting attributes emissions to the country or region where they are physically generated. Although this approach is widely used in national inventories and policy assessment, it may underestimate the carbon responsibility of economies that rely heavily on imported electricity, energy-intensive goods, or intermediate inputs. Consumption-based accounting addresses this limitation by assigning emissions to final consumers and by capturing emissions embodied in trade [10]. Multi-regional input-output studies show that embodied emissions can represent a substantial share of national carbon footprints, particularly in trade-intensive economies [48].
This accounting distinction is especially relevant for the power sector and for economies integrated through electricity trade and global value chains. Cross-border electricity flows can shift emissions from consuming regions to producing regions, thereby creating differences between territorial and consumption-based emission measures. Qu et al. [11] show that global electricity trade generates virtual CO2 emission flows across countries and regions. Tranberg et al. [49] argue that real-time carbon accounting based on electricity flow tracing can more accurately attribute emissions to consumers in interconnected electricity markets. More recent work by Ling et al. [12] further highlights the need for comprehensive consumption-based carbon accounting frameworks for power systems, particularly under low-carbon transition policies.
The choice of emissions accounting framework also matters for the assessment of green and energy-related technological innovation. If innovation reduces emissions within national borders but shifts carbon-intensive production or electricity generation abroad, its environmental effect may appear stronger in territorial accounts than in consumption-based accounts. Conversely, consumption-based indicators can reveal whether technological progress is associated with genuine decarbonization of final demand or merely with the relocation of emissions. However, only a limited number of studies directly link green technology innovation with both consumption-based and territorial emissions. Razzaq et al. [50], using a quantile-on-quantile approach for BRICS economies, show that the relationship between green technology innovation and carbon emissions is asymmetric and varies across the distribution of both variables. Their study is especially relevant because it considers both consumption-based and territorial emissions, demonstrating that the effects of green innovation may differ depending on the emissions accounting framework. Nevertheless, this literature remains relatively limited compared with the broader literature on territorial CO2 emissions.

2.4. Research Gap and Contribution of the Present Study

Overall, the reviewed literature points to three main conclusions. First, fossil fuel-based electricity generation, especially coal-fired generation, remains a major driver of CO2 emissions in large and emerging economies. The CO2 emissions implications of electricity production depend not only on the scale of electricity generation, but also on the composition of the power mix and the persistence of fossil fuel-based generation capacity. Second, energy-related technological innovation can contribute to emission reduction, but its effects are heterogeneous. Renewable energy and green technologies are more likely to support decarbonization than innovations that merely improve the efficiency of fossil fuel technologies, while digital and AI-enabled technologies may support the transition only when they improve system flexibility, dispatch, forecasting, and the integration of low-carbon electricity. Third, territorial and consumption-based emissions accounting can lead to different interpretations of environmental responsibility, particularly in economies involved in cross-border electricity trade, global value chains, and the import of energy-intensive goods.
Despite these advances, the existing literature still leaves an important gap. Most studies examine fossil fuel-based electricity generation, energy technology innovation, or emissions accounting frameworks separately. Relatively few studies jointly examine whether fossil fuel-based electricity generation remains associated with both consumption-based and territorial CO2 emissions after accounting for energy-related technological innovation within an extended STIRPAT framework. This gap is important because a decline in territorial emissions does not necessarily imply a decline in emissions embodied in consumption, and technological innovation may have different effects depending on how emissions are measured. The present study addresses this gap by jointly examining fossil fuel-based electricity generation, energy technology innovation, and the distinction between territorial and consumption-based CO2 emissions.

3. Materials and Methods

3.1. Data and Variables

We use annual panel data for China, the United States, India, and Russia over the period 1990–2023. The sample period is determined by data availability. The dataset forms a country–year panel with four cross-sectional units. Because broader rankings of major emitters may include the EU27 as a regional bloc, the selected countries should be interpreted as a focused group of major emitting economies rather than an exhaustive ranking of all global emitters. The empirical analysis uses two dependent variables: consumption-based CO2 emissions per capita (CBEC) and territorial CO2 emissions per capita (TBEC). The fossil fuel share in electricity generation (EGF) is measured as the combined share of electricity generated from coal, oil, and gas in total national electricity generation. Its disaggregated components are the coal share in electricity generation (EGC), the oil share in electricity generation (EGO), and the gas share in electricity generation (EGG), each measured as a percentage of total national electricity generation. Population density (PD) and GDP per capita (YC) are included as control variables, while energy-related technological innovation is proxied by climate change mitigation technologies related to energy generation, transmission, or distribution (TREG).
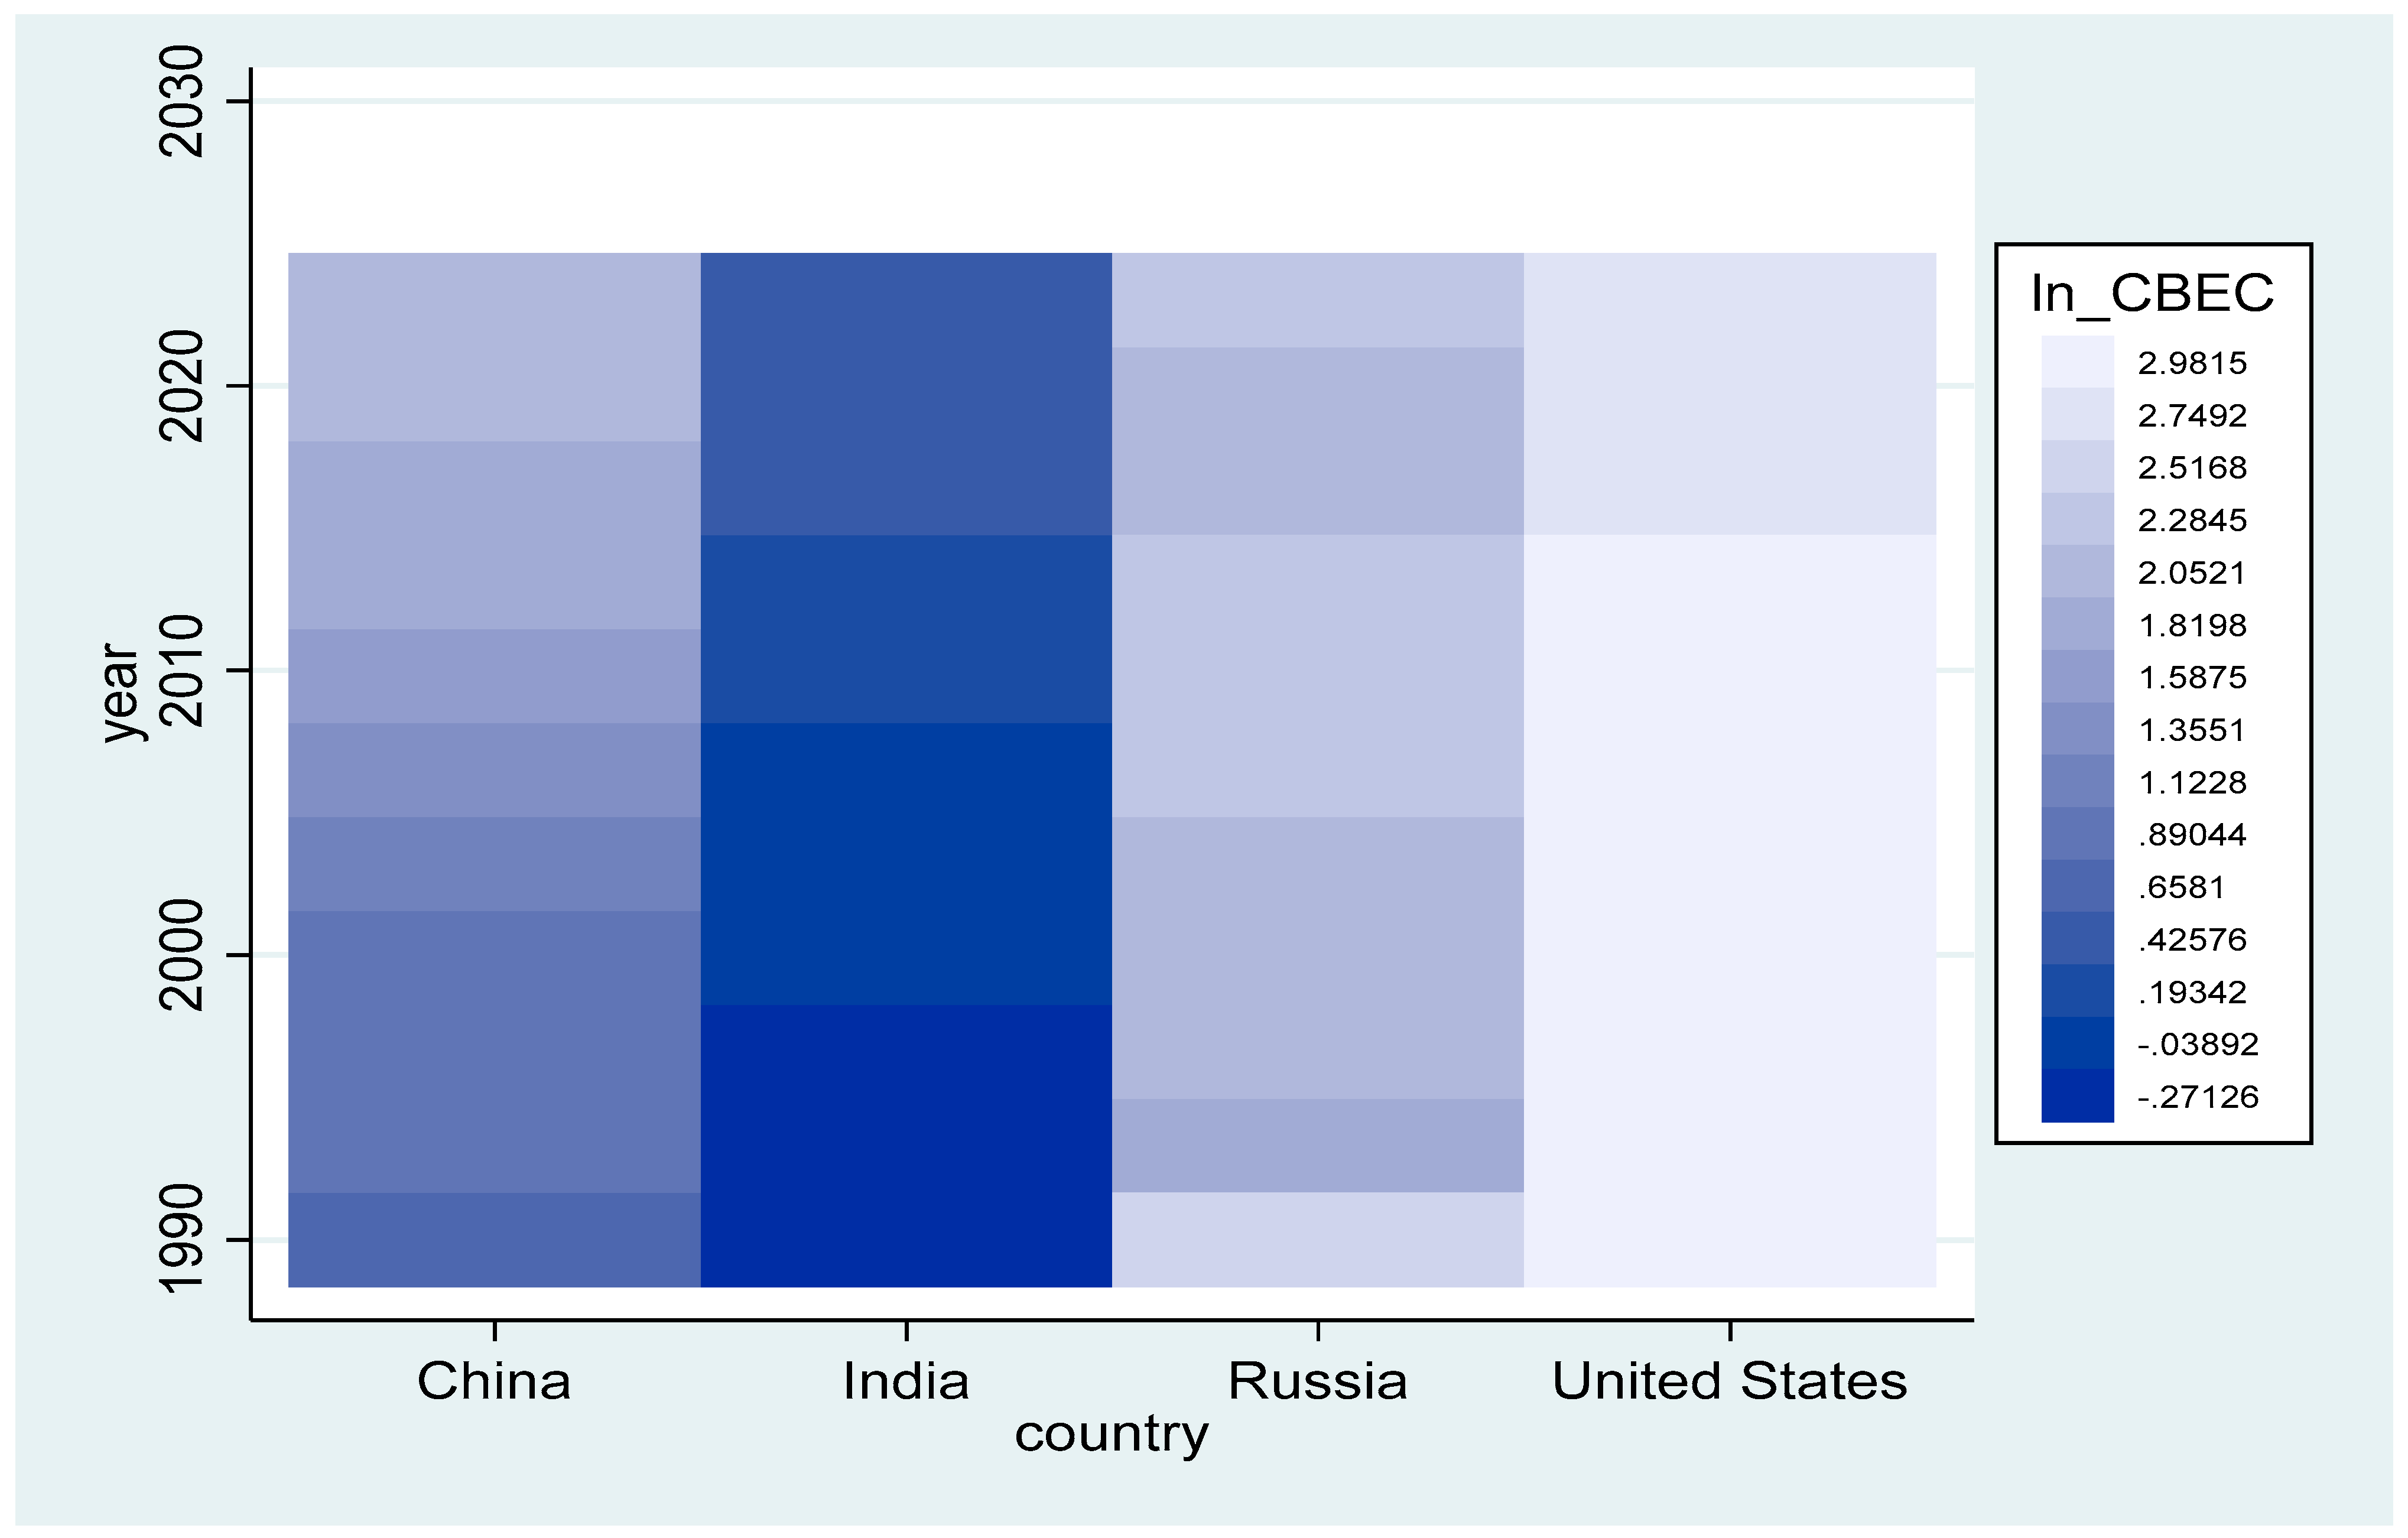
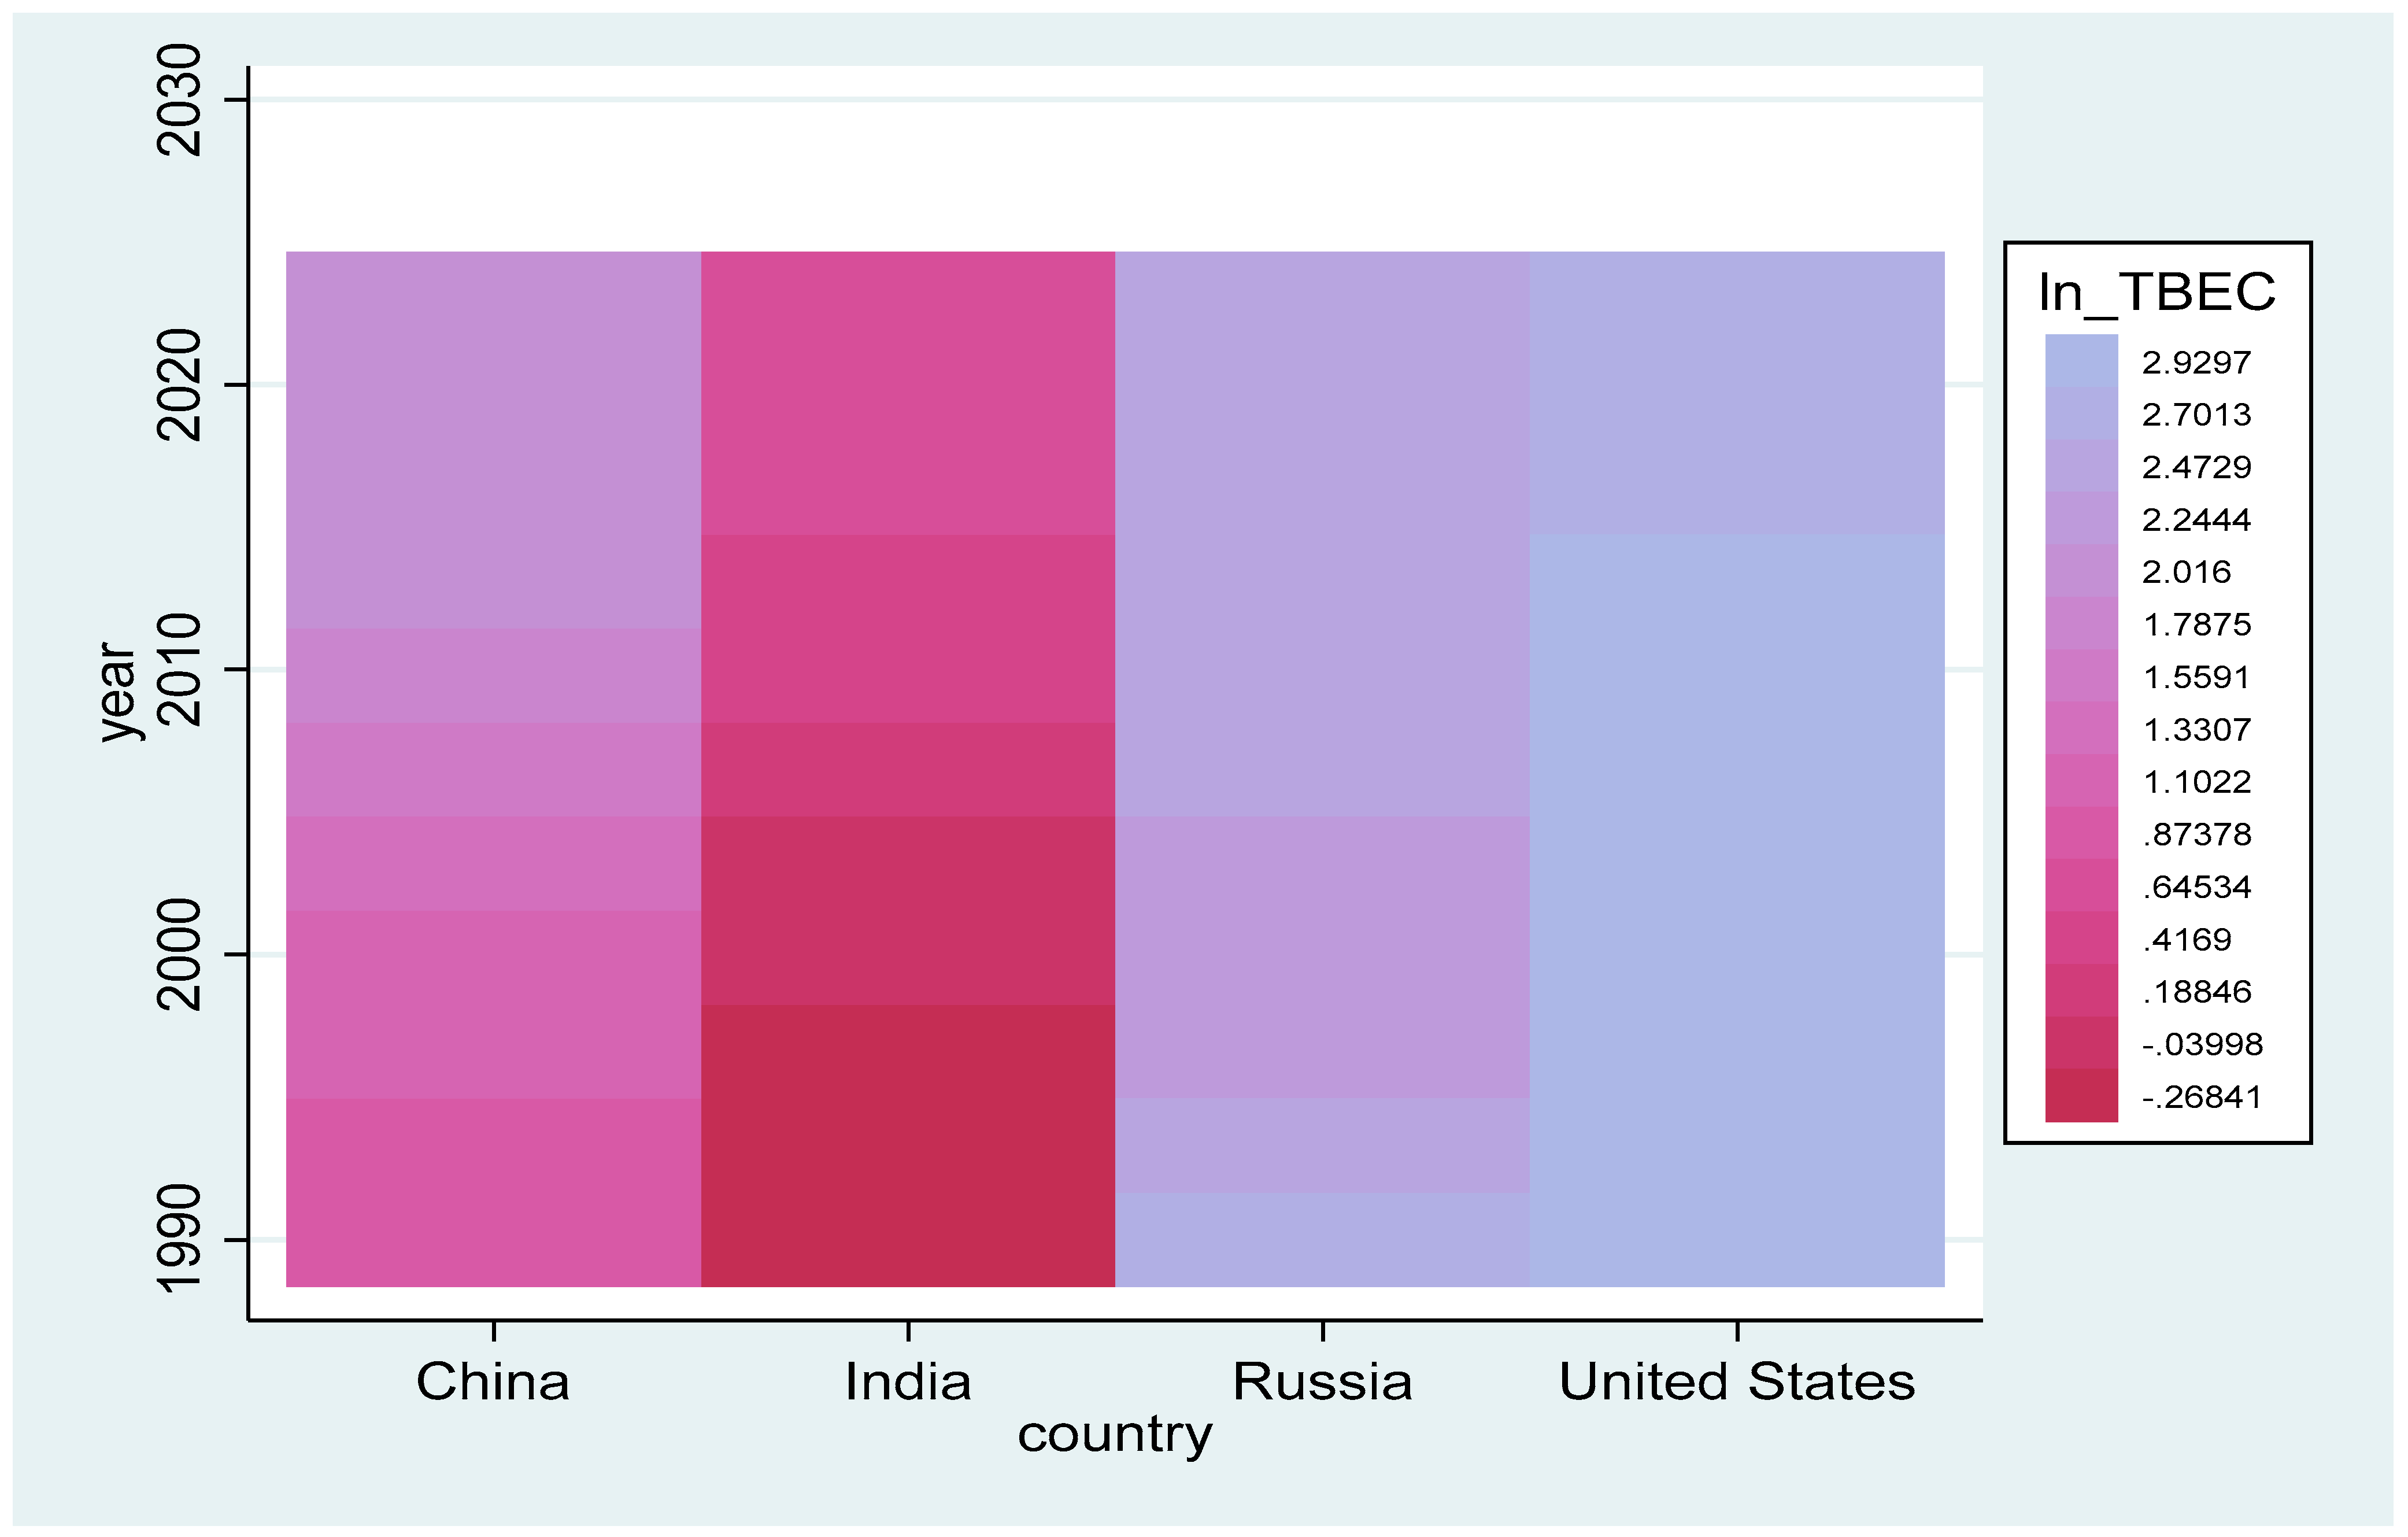
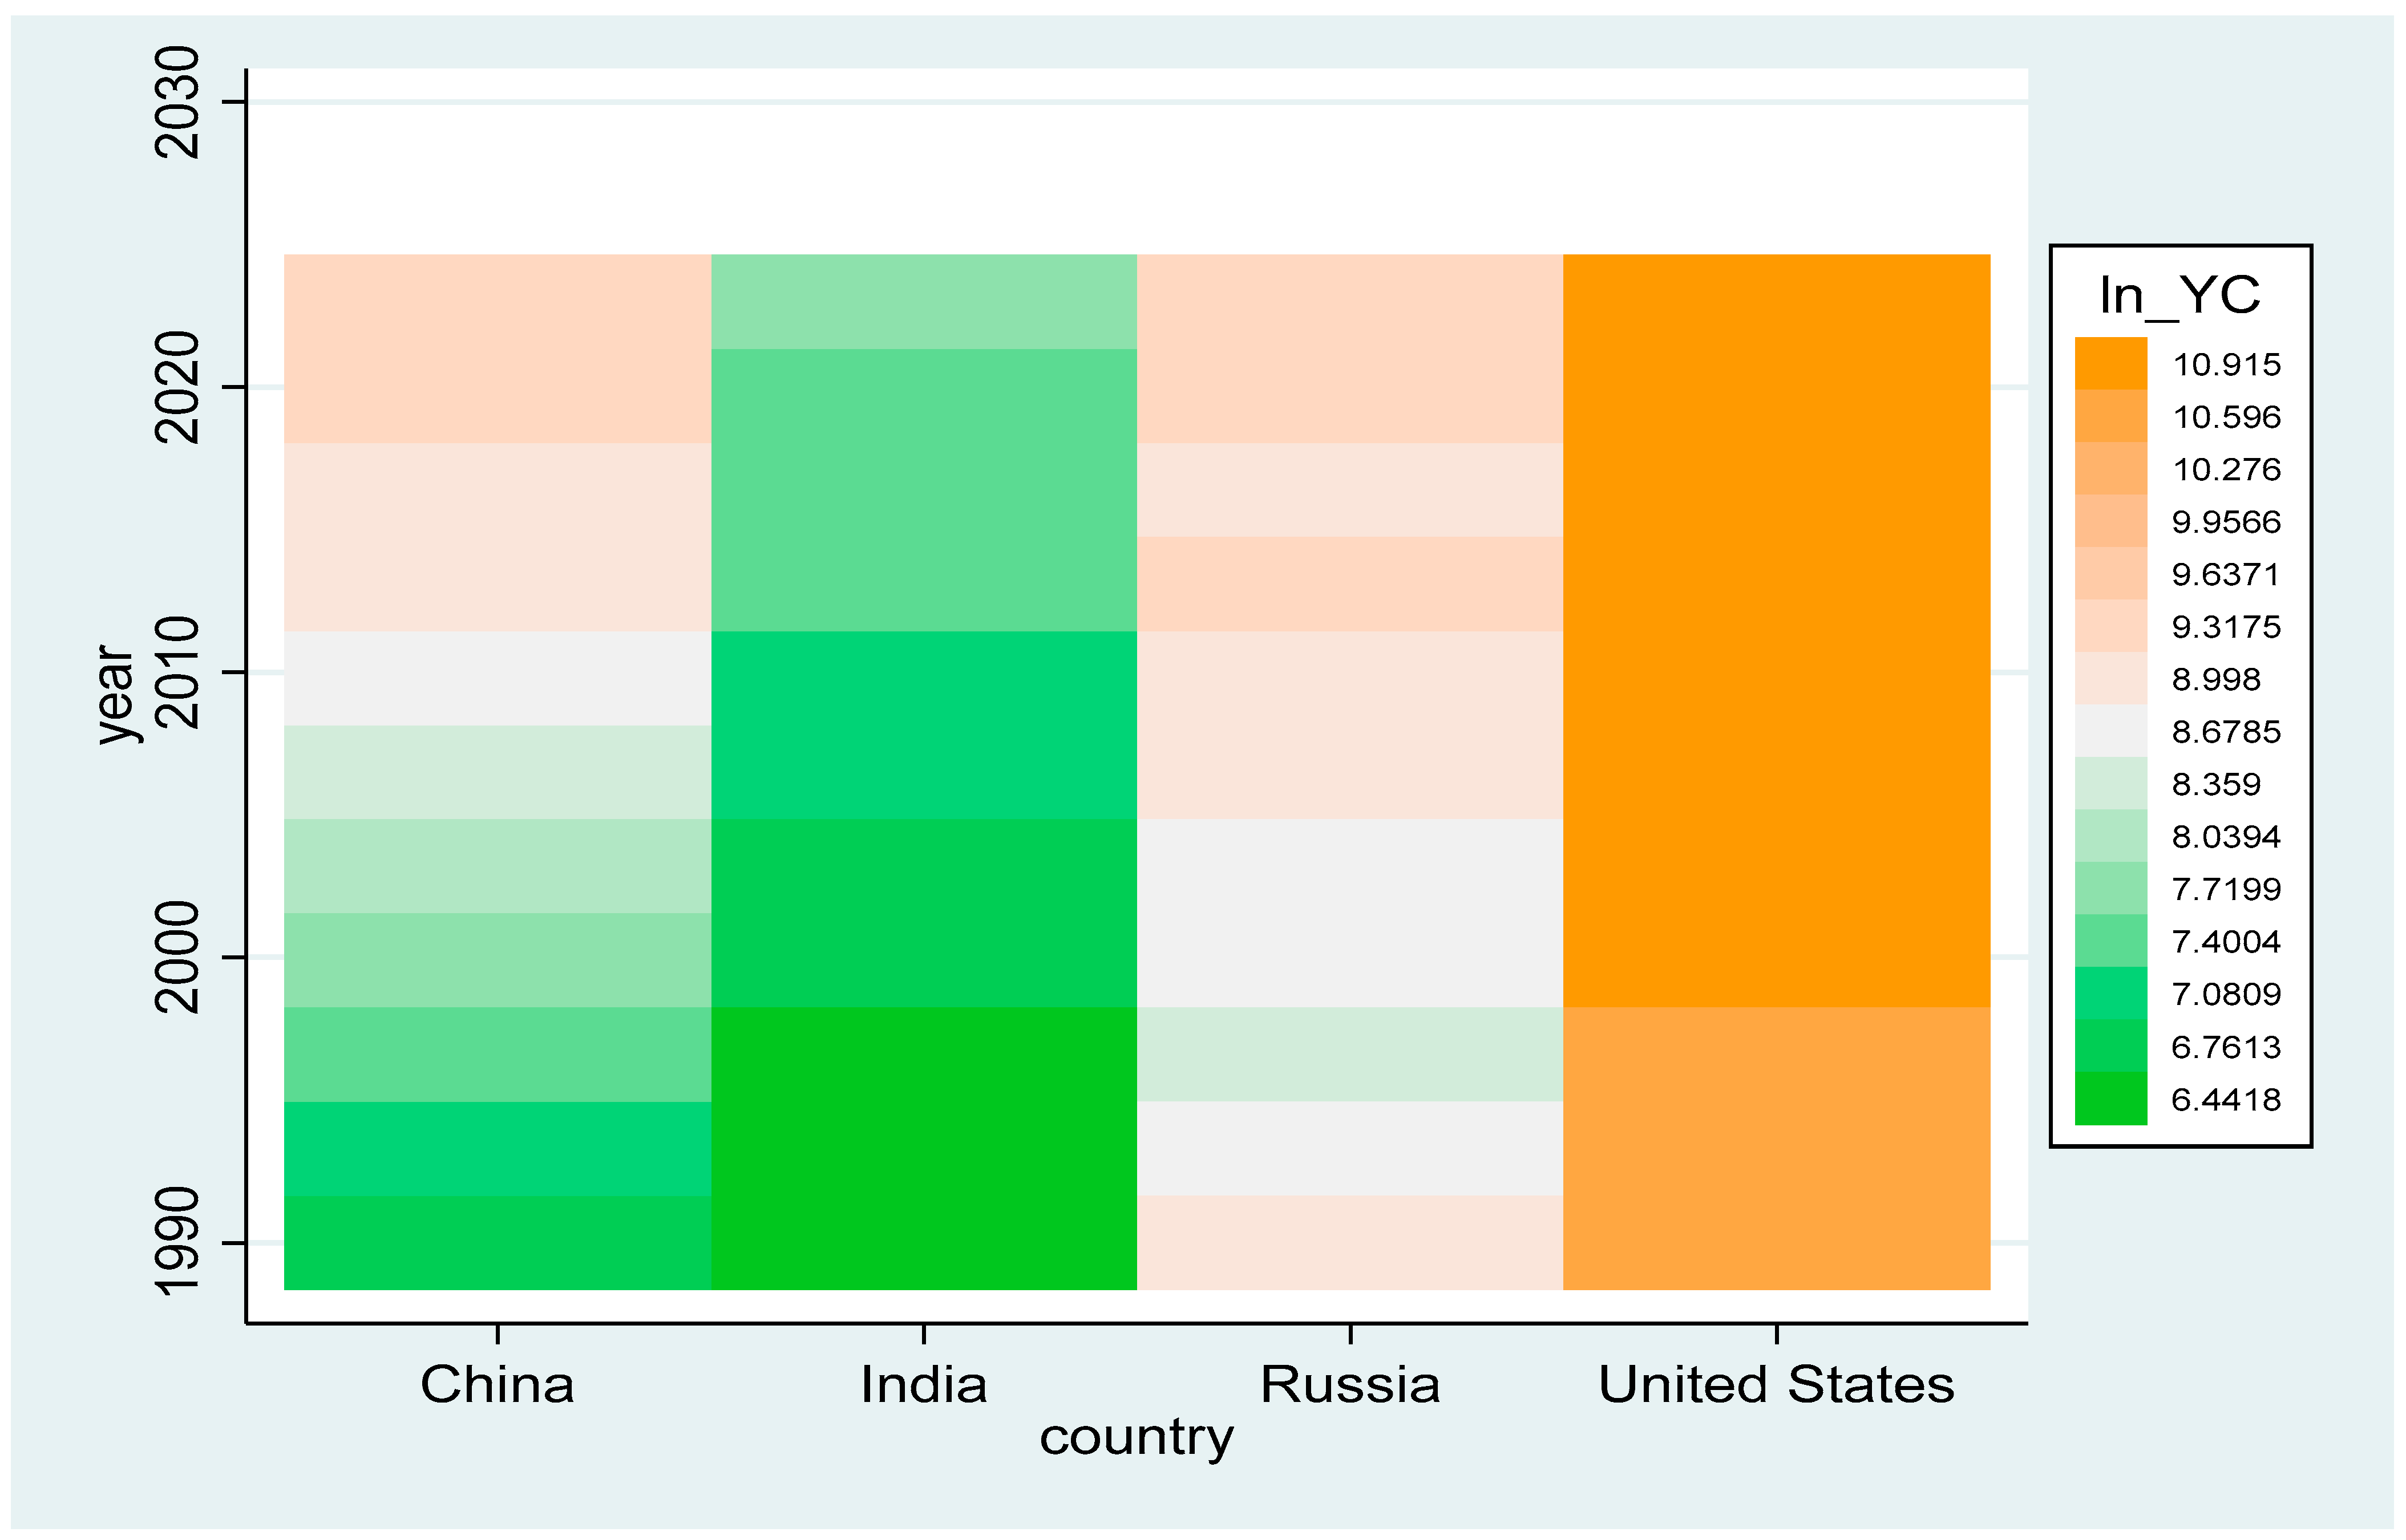
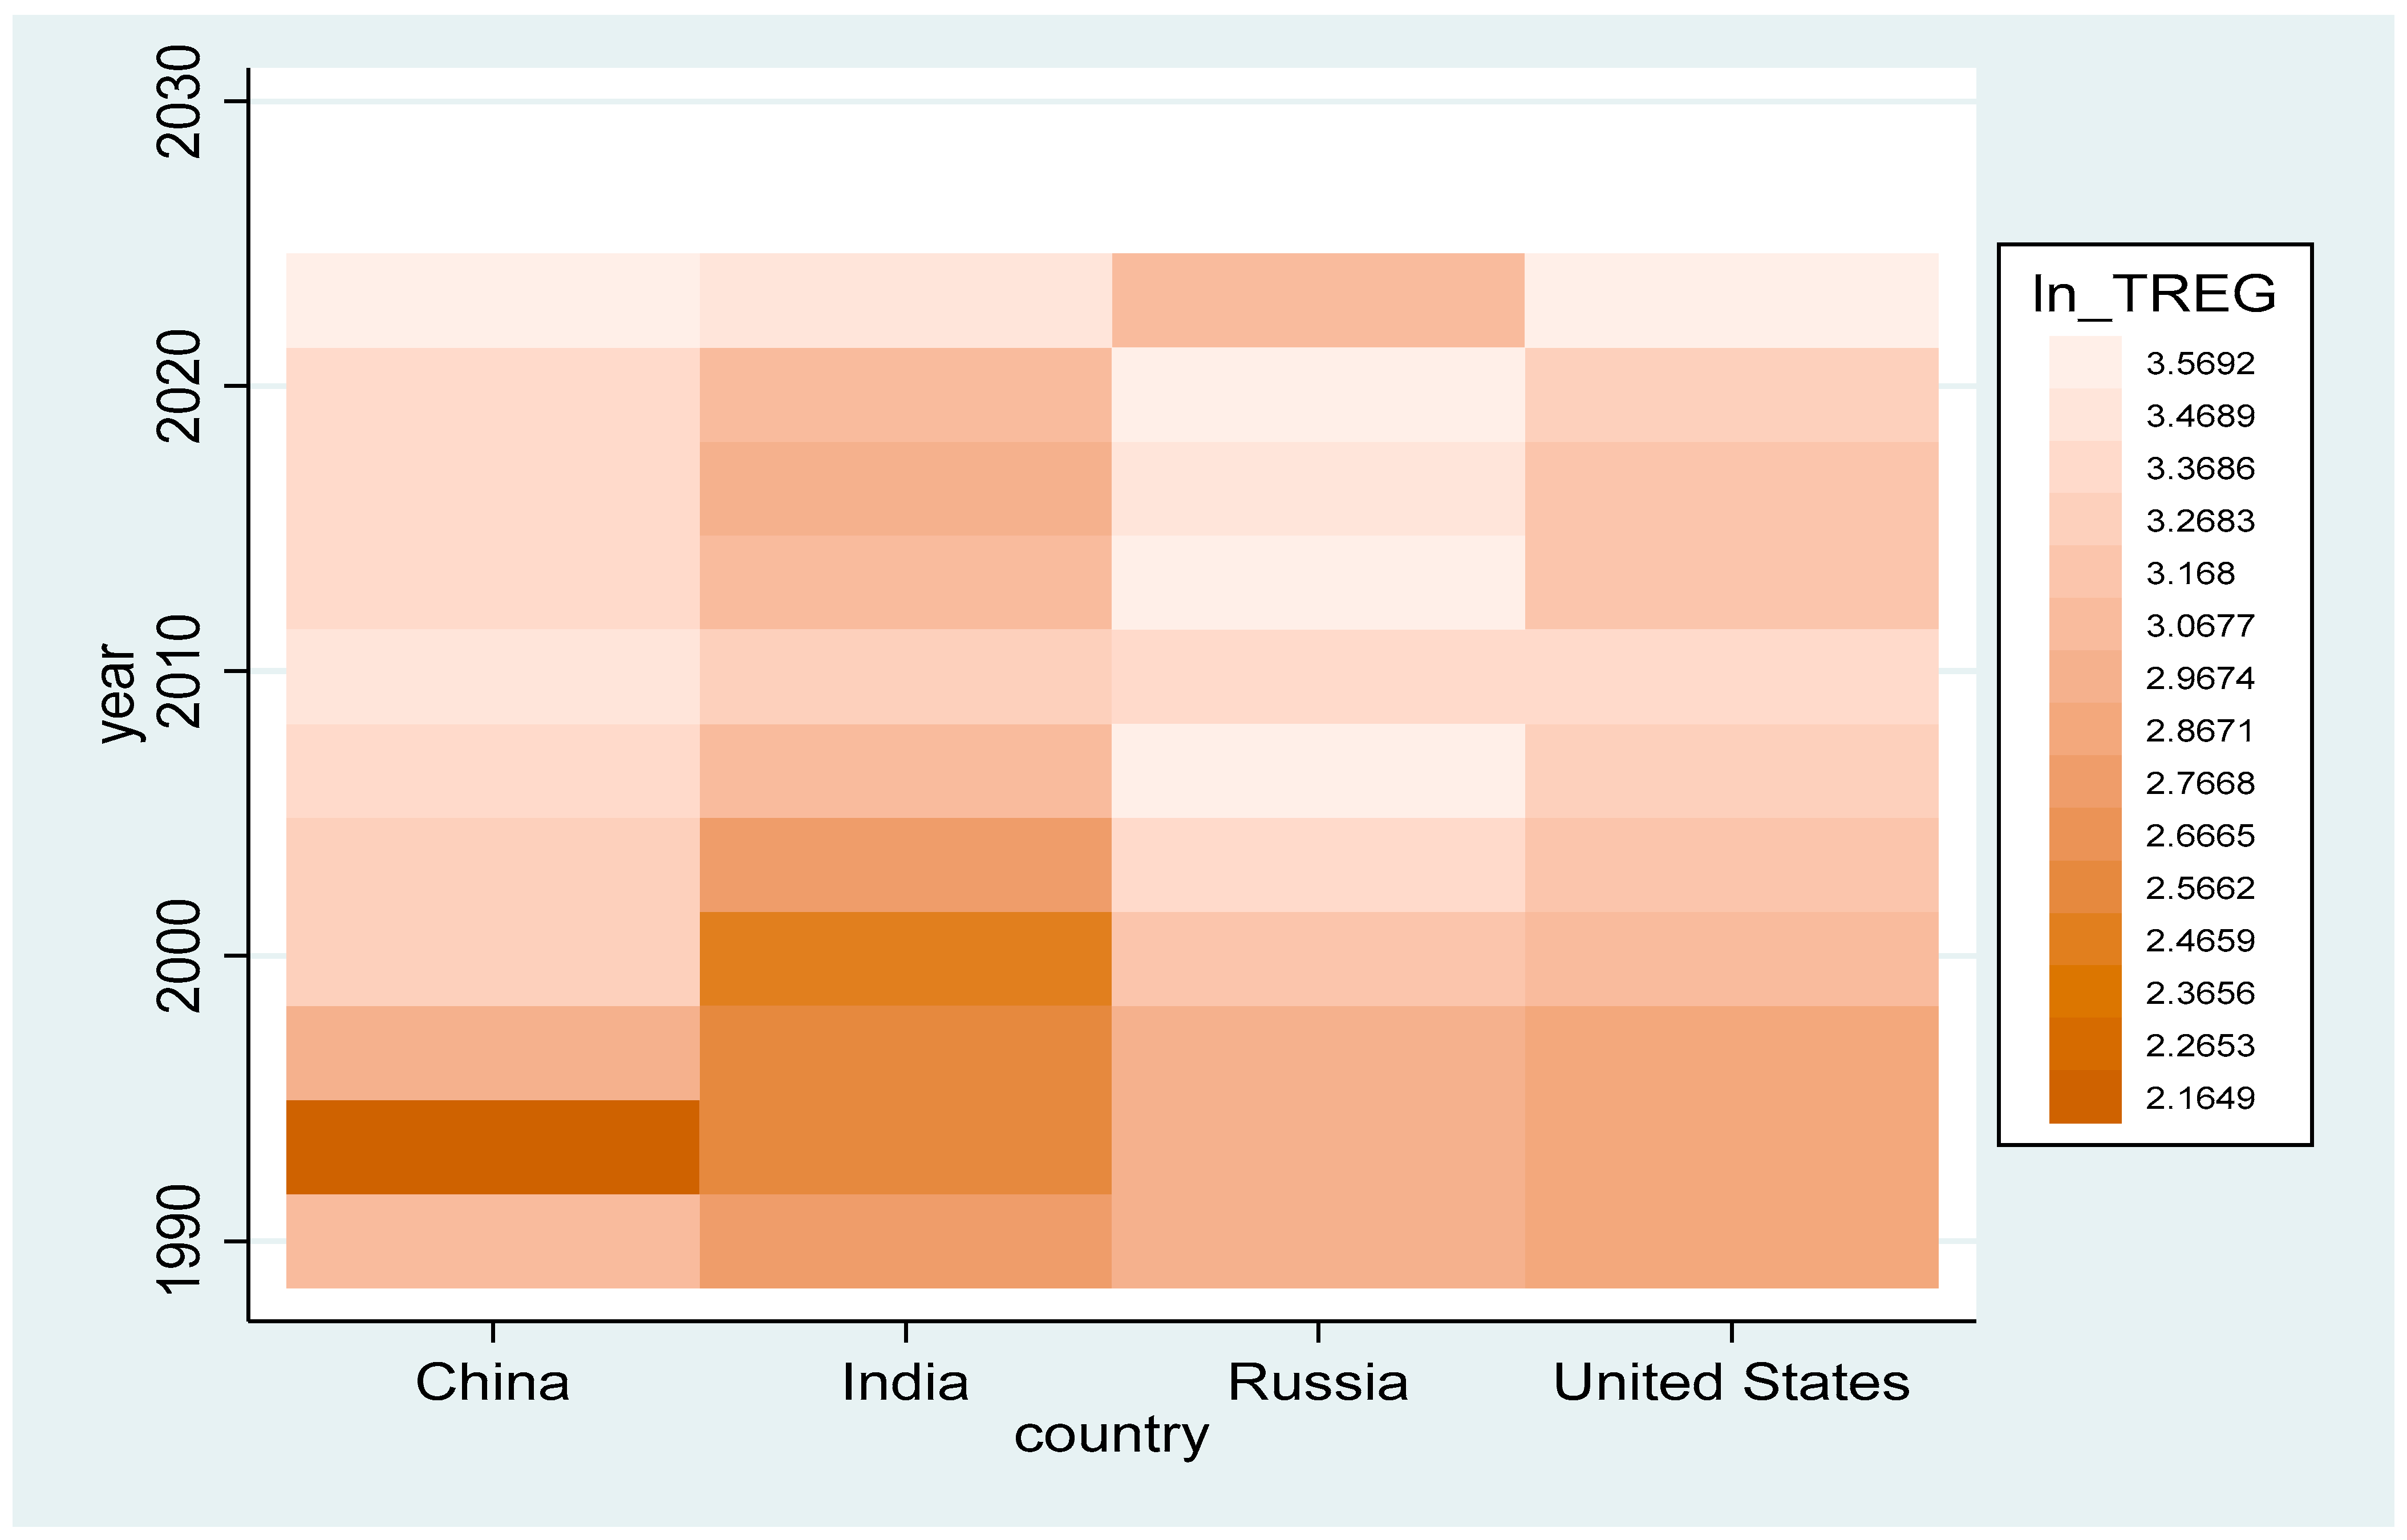
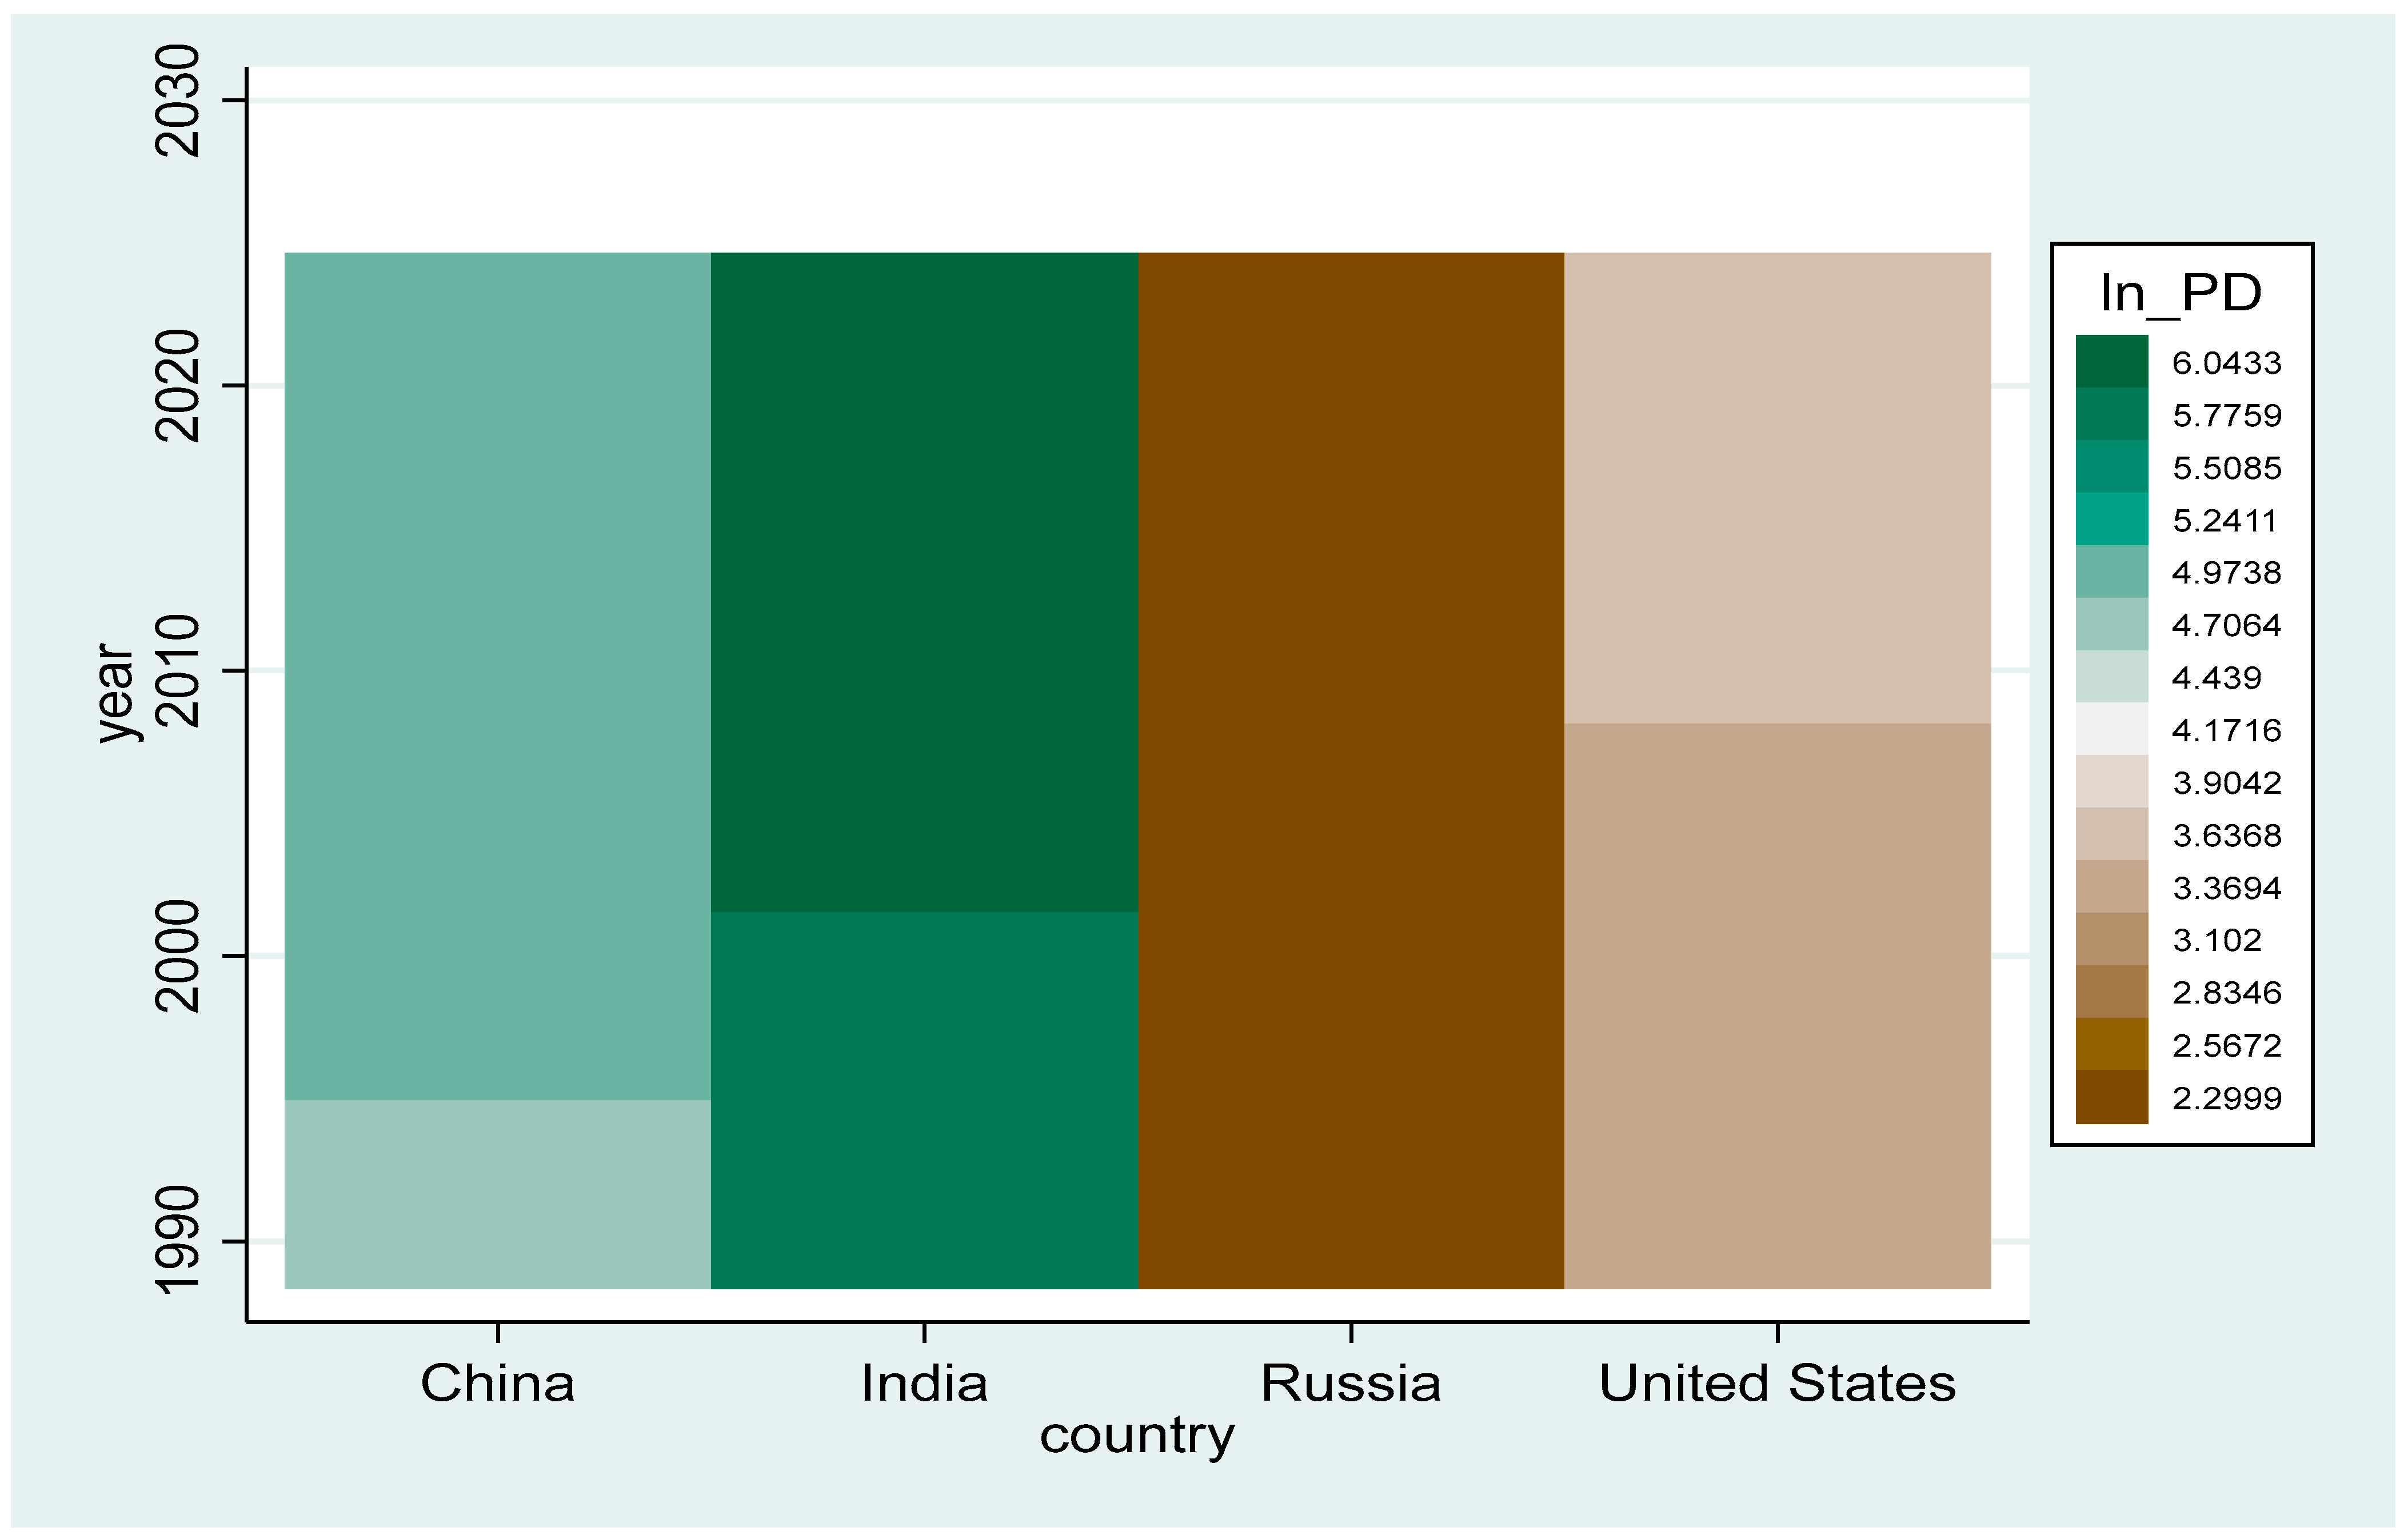
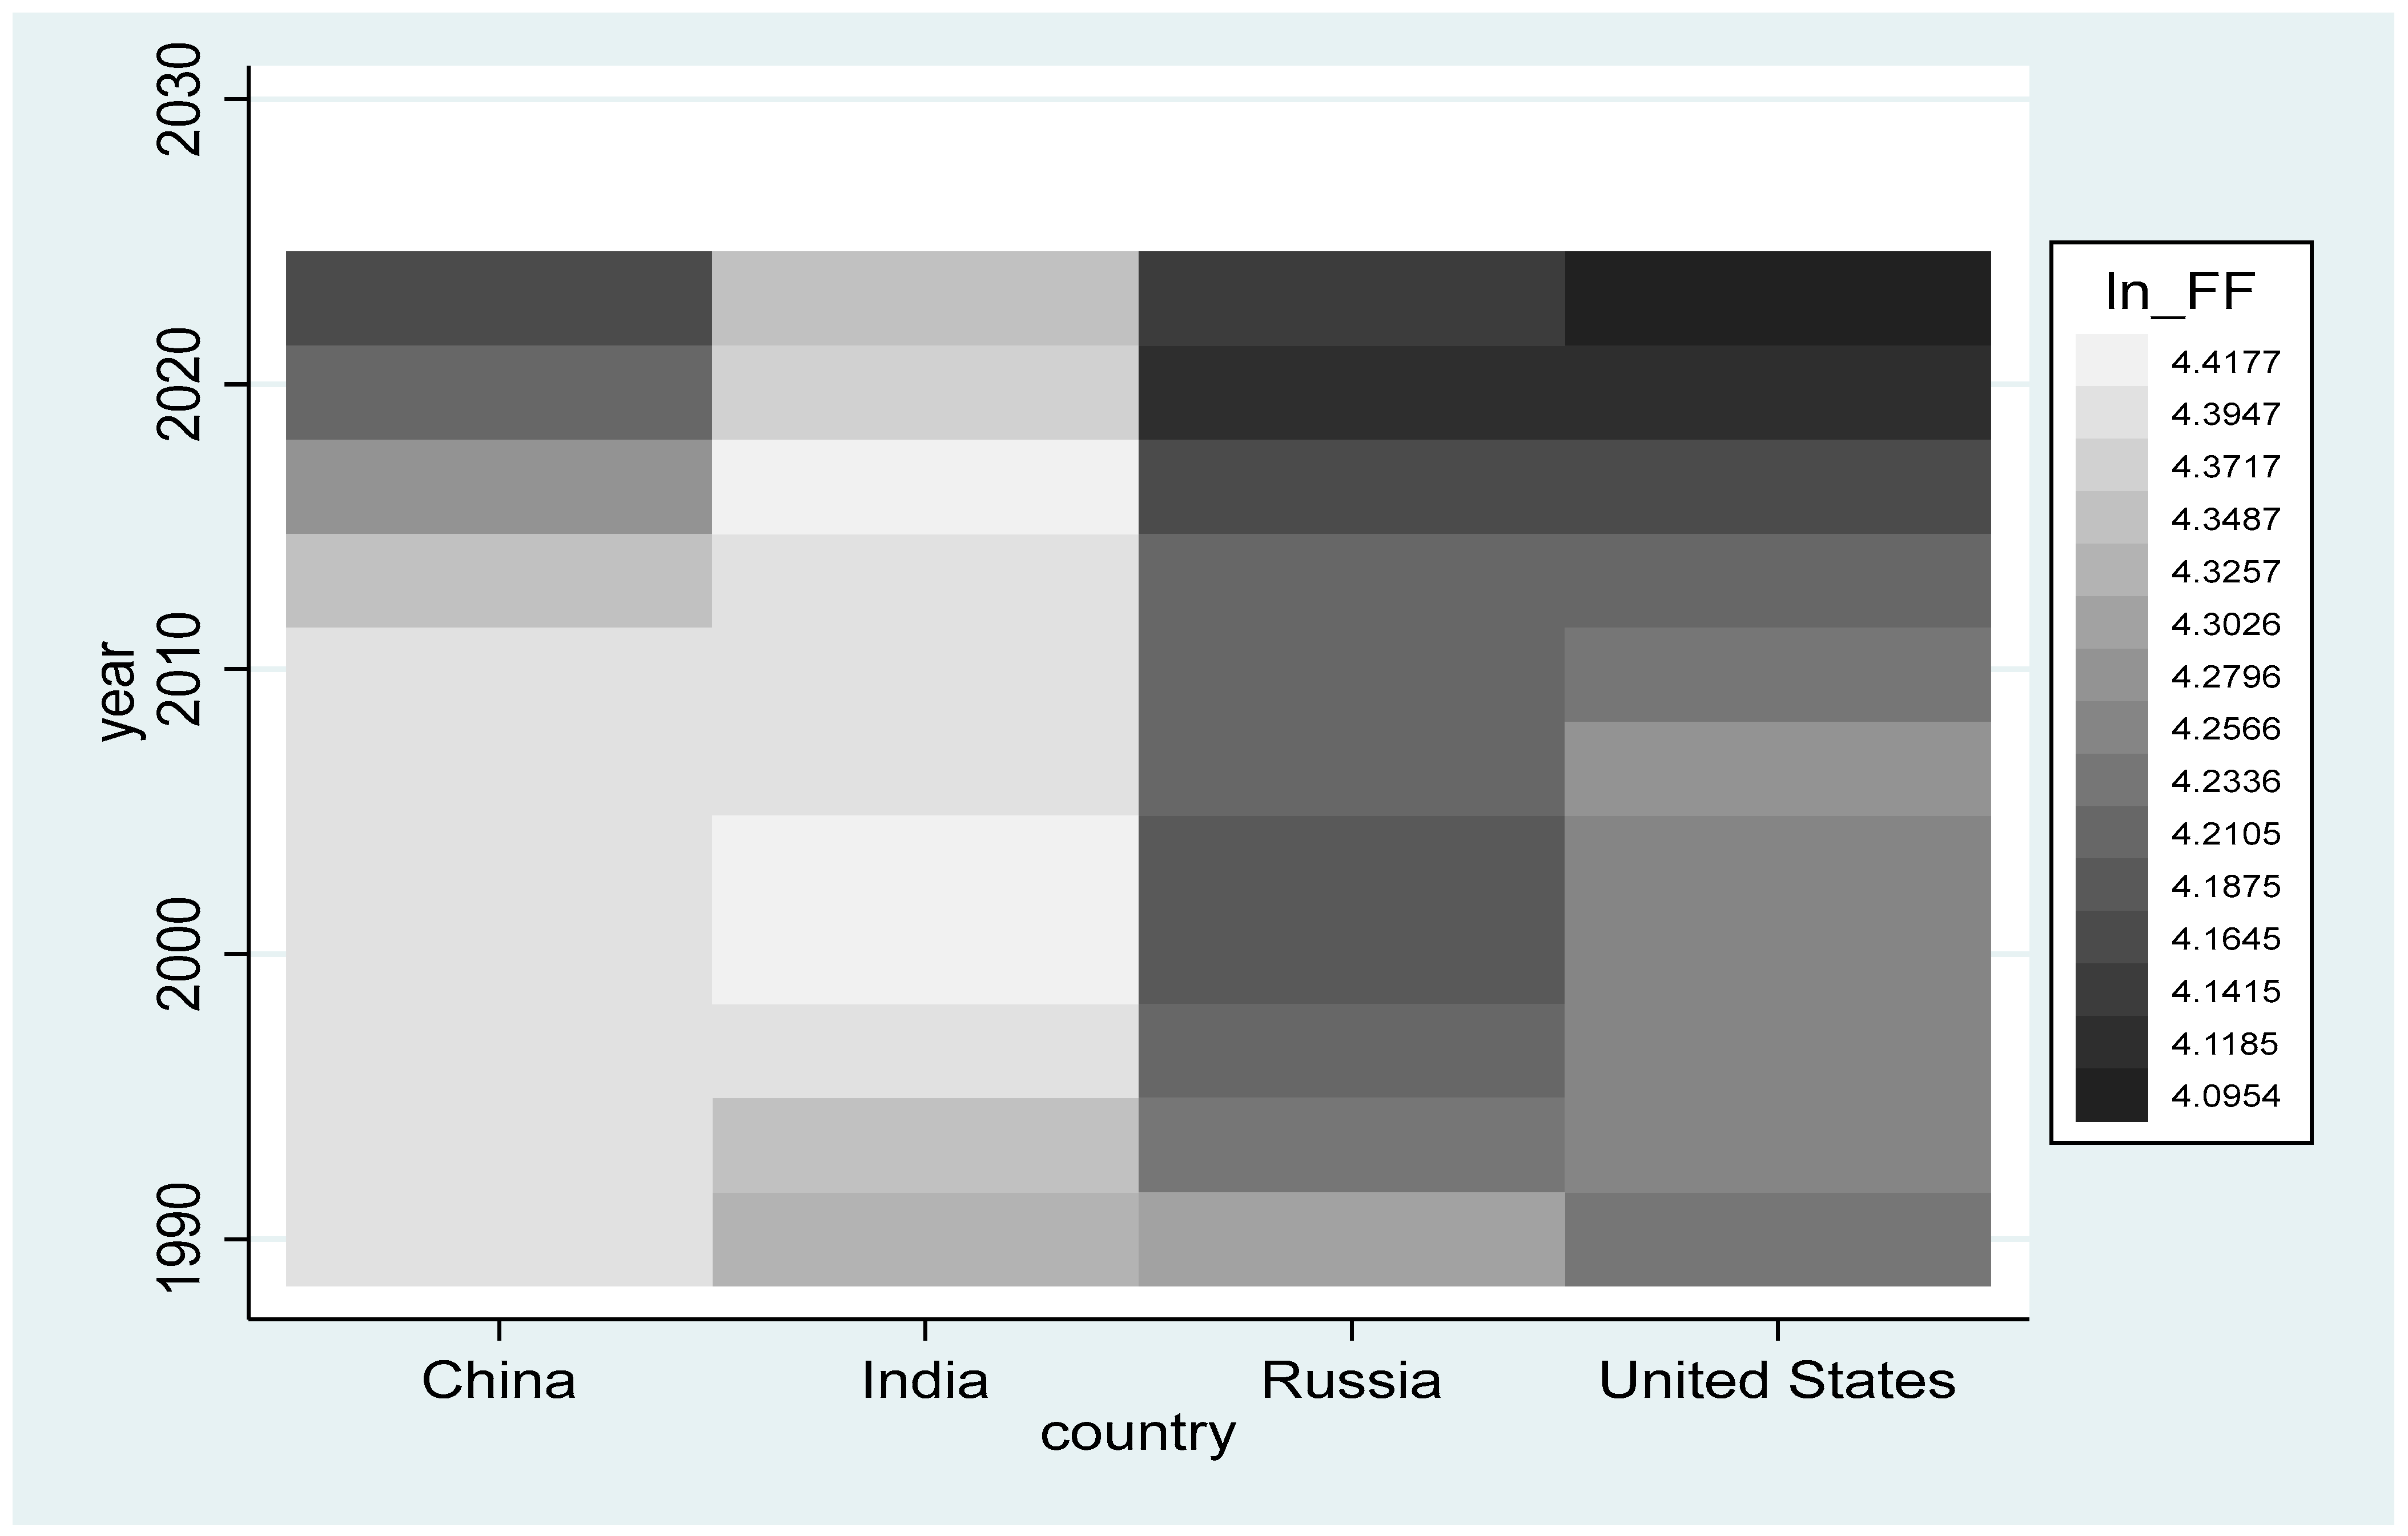
CBEC and TBEC are obtained from Our World in Data and the Global Carbon Budget [8], EGF and its components are obtained from Ember Yearly Electricity Data [51], PD and YC are taken from the World Development Indicators, and TREG is obtained from the OECD Data Explorer. All variables are transformed into natural logarithms before estimation. Table 1 reports the variable definitions and descriptive statistics for the full panel, while Appendix A presents heatmaps showing cross-country and temporal heterogeneity in the selected variables.
In Table 1 the two dependent variables, consumption-based CO2 emissions per capita and territorial CO2 emissions per capita, show very similar distributions. This indicates that, across the full panel, territorial emissions are on average somewhat higher than consumption-based emissions, although both measures display comparable variation. Population density and GDP per capita show substantial dispersion, reflecting considerable demographic and income heterogeneity among the four countries. Among the electricity generation variables, aggregate fossil fuel-based electricity generation has a high mean value and a very low standard deviation, indicating that fossil fuels remain a consistently important component of electricity generation across the sample.
However, the disaggregated variables reveal stronger differences across fossil fuel sources. Coal-based electricity generation has the highest mean among the individual fossil components, whereas gas-based electricity generation shows the largest dispersion. The negative minimum values for CBEC, TBEC, EGO, and EGG result from the natural logarithmic transformation of original values below one and should not be interpreted as negative emissions or negative electricity shares.

3.2. Conceptual Framework and Model Specification

Following Dietz and Rosa [52], we employ an extended STIRPAT framework derived from the IPAT identity, where environmental impact (I) is modeled as a function of population (P), affluence (A), and technology (T).
I = P · A · T  
Taking natural logarithms gives the following log-linear form:
l n I i t = β 0 + β 1 l n P i t + β 2 l n A i t + β 3 l n T i t + μ i t  
where i denotes the country, t denotes the year, and μ i t is the error term.
In this study, environmental impact is proxied alternatively by consumption-based CO2 emissions per capita (CBEC), following Jiang et al., Hasanov et al. and Ali et al. [1,53,54], and territorial CO2 emissions per capita (TBEC). Population (P) is represented by population density (PD), while affluence (A) is measured by GDP per capita (YC). Technology (T) is captured by climate change mitigation technologies related to energy generation, transmission, or distribution (TREG) rather than broader patent measures used in earlier studies [53,55,56]. In contrast to broader indicators of technological innovation, TREG focuses specifically on energy-related mitigation technologies and is therefore closely aligned with the electricity sector focus of this study.
We extend the baseline STIRPAT specification by adding the fossil fuel share in electricity generation (EGF), an electricity sector indicator capturing the extent to which the national power generation mix depends on coal, oil, and gas. EGF is measured as the combined share of electricity generated from coal, oil, and gas in total national electricity generation. This extension allows the model to examine whether a higher fossil fuel share in the electricity generation mix is associated with higher CO2 emissions after controlling for population density, income, and energy-related technological innovation. Earlier STIRPAT-based studies have typically used coal consumption, aggregate fossil fuel energy use, or broad energy indicators to examine the energy–emissions nexus [1,57]. By contrast, this study focuses specifically on the structure of electricity generation by incorporating the fossil fuel share in the power mix. The expected sign of EGF is positive, because a higher share of electricity generated from coal, oil, and gas is expected to be associated with higher CO2 emissions. The empirical models are specified as follows:
l n C B E C i t = β 0 + β 1 l n P D i t + β 2 l n Y C i t + β 3 l n T R E G i t + β 4 l n E G F i t + μ i t  
l n T B E C i t = β 0 + β 1 l n P D i t + β 2 l n Y C i t + β 3 l n T R E G i t + β 4 l n E G F i t + μ i t  
The first specification uses consumption-based CO2 emissions per capita as the dependent variable (CBEC), while the second uses territorial CO2 emissions per capita (TBEC). This comparison allows the analysis to distinguish between consumption-based and territorial perspectives on environmental responsibility.
The expected sign of GDP per capita is positive, as higher income levels are generally associated with greater energy demand and economic activity. The expected sign of EGF is also positive, because a higher share of electricity generated from coal, oil, and gas should increase CO2 emissions. The expected sign of TREG is negative, as energy-related mitigation technologies can improve energy efficiency, support cleaner electricity generation, and reduce emissions. The sign of population density is theoretically ambiguous: higher density may increase emissions through greater energy and infrastructure demand, but it may also reduce emissions through agglomeration effects, more efficient urban systems, and stronger incentives for technological change.
In additional specifications, the aggregate fossil fuel share in electricity generation (EGF) is replaced by its three fuel-specific components: the coal share in electricity generation (EGC), the oil share in electricity generation (EGO), and the gas share in electricity generation (EGG). Each component is measured as a percentage of total national electricity generation. This disaggregation allows the analysis to examine whether the association between fossil fuel dependence in the electricity mix and CO2 emissions is mainly linked to coal, oil, or gas. Because these variables capture the composition of the electricity generation mix rather than the absolute volume of electricity produced from each fuel, the estimated coefficients should be interpreted as relationships between fuel shares in the power mix and emissions.

3.3. Econometric Strategy

The empirical strategy proceeds in several steps. Because the dataset has a small cross-sectional dimension and a relatively longer time dimension, we first examine cross-sectional dependence and slope heterogeneity before selecting the appropriate unit-root, cointegration, and estimation procedures. Ignoring cross-sectional dependence may lead to biased inference, especially when countries are affected by common global shocks, energy market conditions, technological changes, or climate policy developments.
First, we apply Pesaran’s cross-sectional dependence (CD) [58] test to examine whether the panel units are correlated across countries. Second, we test for slope homogeneity using the Pesaran–Yamagata slope homogeneity test [59]. The null hypothesis assumes homogeneous slope coefficients across cross-sectional units. Rejection of this null would indicate that the relationship between emissions and the explanatory variables differs across countries, supporting the use of methods and interpretations that allow for heterogeneity [1,57]. Next, we examine the stationarity properties of the variables. Given the possibility of cross-sectional dependence, we rely primarily on Pesaran’s cross-sectionally augmented Dickey–Fuller (CADF/CIPS) approach [60]. Then, we test for panel cointegration using the Pedroni panel cointegration test [61]. Given the small cross-sectional dimension of the panel, the cointegration results are interpreted cautiously and are treated as indicative evidence of long-run association rather than definitive proof.
After examining cointegration, we estimate an error correction model (ECM) to capture both long-run equilibrium relationships and short-run dynamics. The ECM includes the lagged error correction term (ECT), which is obtained from the residuals of the estimated long-run relationship. The coefficient of the ECT measures the speed at which emissions adjust back toward their long-run equilibrium after a short-run deviation. A negative and statistically significant ECT coefficient indicates convergence toward the long-run equilibrium. The ECM models specification can be written as follows:
l n C B E C i t = α 1 + λ E C T i t 1 + γ 1 Δ l n P D i t + γ 2 Δ l n Y C i t + γ 3 Δ l n T R E G i t + γ 4 Δ l n E G F i t + ε i t  
l n T B E C i t = α 1 + λ E C T i t 1 + γ 1 Δ l n P D i t + γ 2 Δ l n Y C i t + γ 3 Δ l n T R E G i t + γ 4 Δ l n E G F i t + ε i t  
where is the first-difference operator, E C T i t 1 is the lagged error correction term, λ is the adjustment coefficient, and ε i t is the error term. The short-run coefficients γ 1 γ 4 capture the immediate effects of changes in the explanatory variables on emissions.
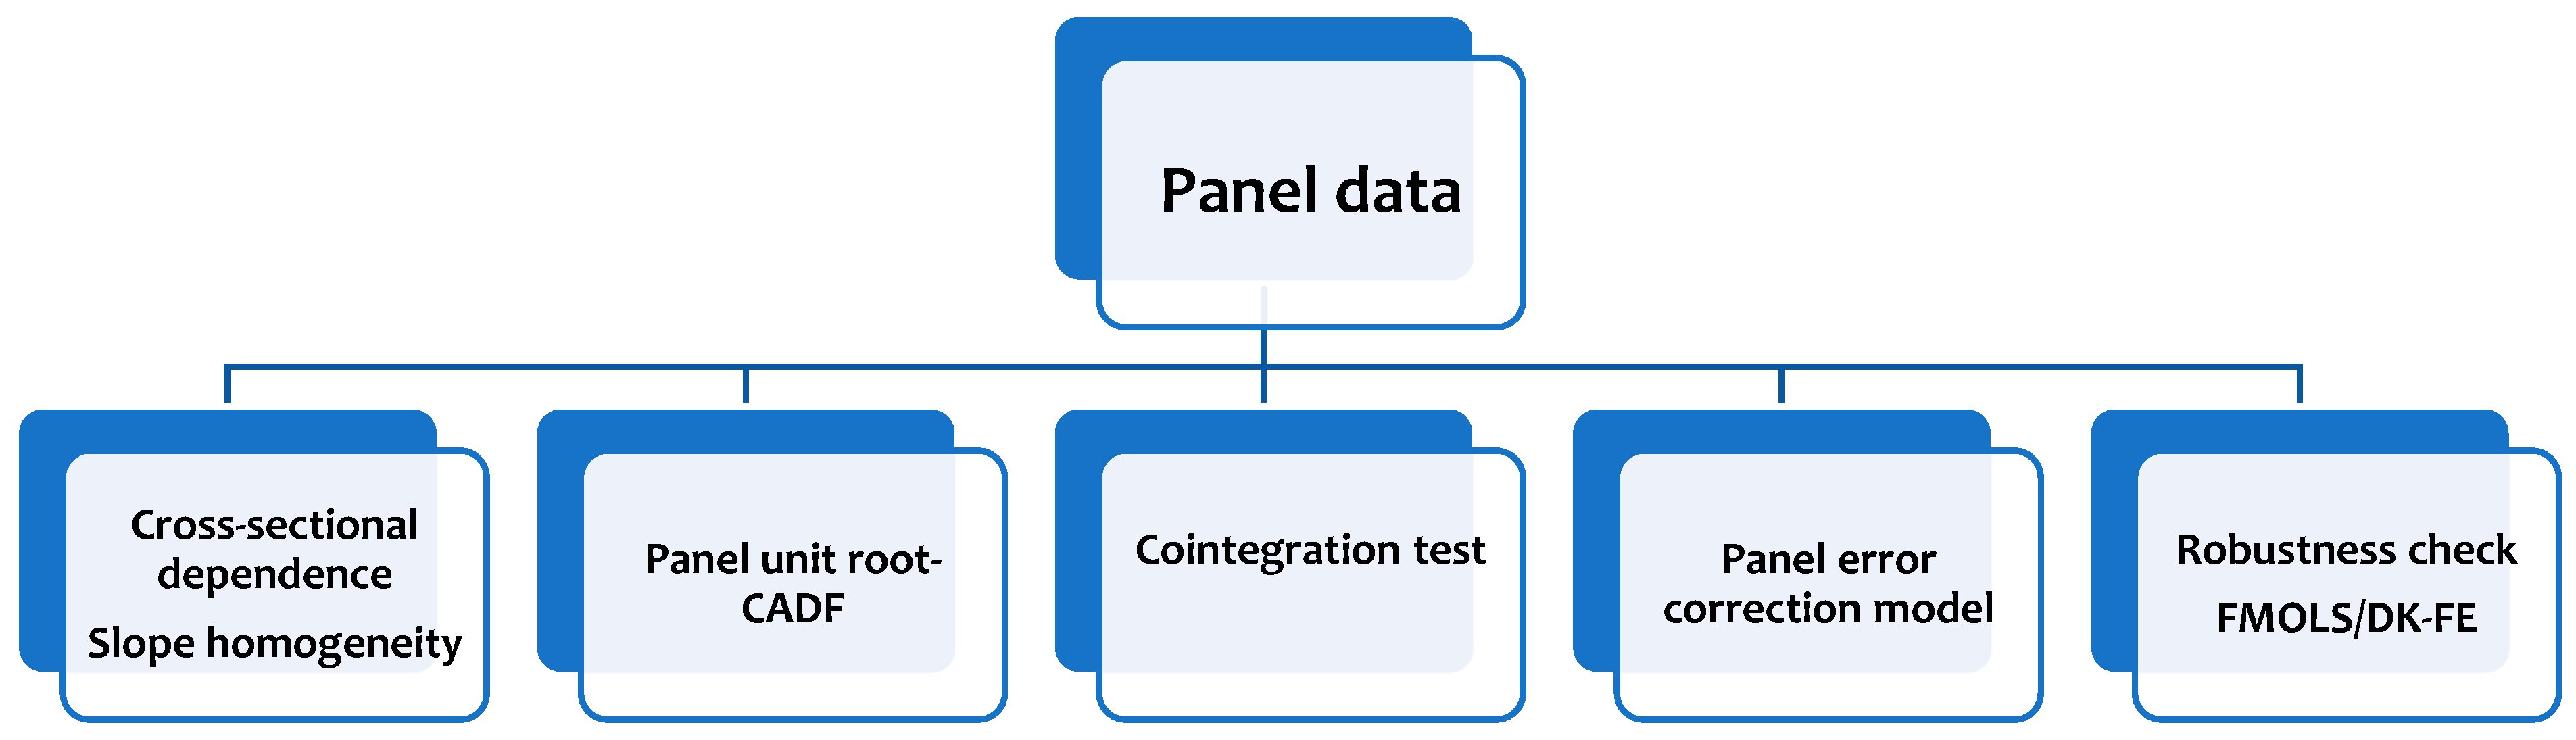
To assess the robustness of the baseline results, we also estimate Driscoll–Kraay fixed-effects (DK-FE) [62] models and fully modified ordinary least squares (FMOLS) models [63]. DK-FE is useful because it provides standard errors that are robust to heteroskedasticity, serial correlation, and cross-sectional dependence. FMOLS is used as an additional long-run estimator because it accounts for potential endogeneity and serial correlation in cointegrated panel relationships. This strategy is regarded as appropriate [57]. Moreover, Rahman et al. [64] argued and empirically demonstrated that FMOLS is one of the most suitable methods for estimating long-run elasticities, as it accounts for potential endogeneity and autocorrelation in the data. Overall, these robustness checks help evaluate whether the main findings are stable across alternative estimation approaches. This methodological workflow is presented in Figure 1.
Finally, the disaggregated analysis replaces the aggregate fossil fuel share in electricity generation with its three fuel-specific components: the coal share in electricity generation, the oil share in electricity generation, and the gas share in electricity generation. Each component is measured as a percentage of total national electricity generation.

4. Empirical Results and Discussion

4.1. Diagnostic Tests

Testing for cross-sectional dependence is a crucial step in panel data analysis because ignoring dependence across cross-sectional units may lead to biased inference. We apply Pesaran’s CD test [58]. As shown in Table 2, the null hypothesis of cross-sectional independence is rejected at the 1% significance level for TBEC, YC, TREG, and EGF, indicating the presence of cross-sectional dependence among panel members. However, the null hypothesis is not rejected for CBEC at conventional significance levels, while the result for PD is only marginal at the 10% level.
Table 3 reports Pesaran and Yamagata’s slope homogeneity test. The null hypothesis of slope homogeneity is rejected for both models, indicating heterogeneous slope coefficients. Given the small cross-sectional dimension of the panel, the slope heterogeneity results should be interpreted cautiously.
After identifying cross-sectional dependence, stationarity is examined using the Im–Pesaran–Shin unit root test and Pesaran’s cross-sectionally augmented Dickey–Fuller approach, including the CADF and CIPS tests. Table 4 reports the unit root test results. Overall, the variables exhibit mixed orders of integration; therefore, the subsequent long-run analysis should be interpreted with caution.
Table 5 presents the Pedroni panel cointegration test results with trend. The test proposes the alternative hypothesis that the variables exhibit cointegration across all panels. For Model 1, two of the three reported statistics reject the null hypothesis of no cointegration, suggesting partial evidence of a long-run relationship. For Model 2, the evidence is weaker and more mixed, as only one statistic rejects the null at conventional significance levels, while the ADF statistic is marginal.
Overall, the diagnostic tests provide a basis for proceeding with the long-run and short-run empirical analysis, but they also indicate that the results should be interpreted with appropriate caution. The subsequent ECM and robustness estimates should be viewed as evidence of empirical associations under these diagnostic conditions rather than as unconditional confirmation of stable long-run causal relationships.

4.2. Baseline ECM Estimates

To assess the long-run and short-run determinants of consumption-based CO2 emissions per capita (CBEC) and territorial CO2 emissions per capita (TBEC), error correction models are estimated, and the baseline results are reported in Table 6. The long-run estimates indicate that GDP per capita (YC) and the fossil fuel share in electricity generation (EGF) are positively and statistically significantly associated with both emissions measures, whereas population density (PD) and energy-related technological innovation (TREG) enter the models with negative coefficients. Because EGF is measured as the combined share of electricity generated from coal, oil, and gas in total national electricity generation, its coefficient should be interpreted as reflecting the relationship between the fossil fuel composition of the power mix and CO2 emissions, rather than the effect of the absolute volume of fossil fuel electricity production. In the CBEC specification, PD is negative and statistically significant, while in the TBEC specification its coefficient remains negative but statistically insignificant. This finding is consistent with the ecological modernization perspective, according to which population concentration and urban development may contribute to improved environmental performance through more efficient infrastructure, innovation, and resource use [65]. Although this result differs from the evidence reported by Rahman and Alam [66] for Bangladesh, it is broadly consistent with recent findings for Pakistan, BRICS countries, and Middle East and North Africa (MENA) economies [1,65,67].
YC is positive and statistically significant in both the CBEC and TBEC models, indicating that economic expansion in the selected economies remains associated with higher emissions. The positive coefficient in the CBEC model is consistent with Ali et al. [54], who argue that fossil fuel use continues to increase with economic growth. This suggests that, despite technological progress and climate policy efforts, income growth in these major emitting economies is still accompanied by higher consumption-based environmental pressure.
The distinction between CBEC and TBEC is important for interpreting these results. Afionis et al. [10] argue that production-based accounting assigns emissions responsibility to the location where emissions are generated, whereas consumption-based accounting attributes embodied emissions to final consumers. Andrew et al. [48] show that emissions embodied in imports may constitute a substantial share of national carbon footprints, implying that territorial inventories can understate the emissions responsibility of trade-intensive economies. This distinction is particularly relevant for electricity systems, because cross-border power flows can shift emissions between producing and consuming regions. Qu et al. [11] show that global electricity trade generates virtual CO2 emission flows that affect country-level emission factors. Tranberg et al. [49] similarly document substantial differences between production- and consumption-based carbon intensities in European electricity markets, while Ling et al. [12] emphasize the importance of consumption-based carbon accounting frameworks for low-carbon power system transitions. These studies support the separate interpretation of CBEC and TBEC rather than treating them as interchangeable indicators of environmental pressure.
The coefficient of the error correction term is −0.407 and is statistically significant in Model 1, which refers to consumption-based emissions. In Model 2, which refers to territorial CO2 emissions, the coefficient is also negative, at −0.041, but only marginally significant at the 10% level. The negative and statistically significant coefficient in Model 1 confirms the existence of a stable long-run equilibrium relationship among the variables. Its magnitude suggests that approximately 40.69% of the short-run disequilibrium in consumption-based emissions is corrected within one period, compared with only 4.12% in the territorial-based emissions model. Therefore, the adjustment toward long-run equilibrium is considerably faster in Model 1 than in Model 2.
The technology variable (TREG), defined as climate change mitigation technologies related to energy generation, transmission, or distribution as a percentage of environment-related technologies, exhibits a negative and statistically significant coefficient in both models. This suggests that energy-related technological innovation can help reduce emissions from consumption by improving energy efficiency and supporting the transition away from carbon-intensive energy sources. Previous studies have also shown that environment-related technologies can reduce emissions through cleaner production, energy efficiency, and lower dependence on fossil fuels [1,68]. Energy-related technological progress may also lower energy intensity and increase the share of renewable energy in total energy use. Modernized grids, energy-efficient equipment, and cleaner production technologies can support a structural shift toward more sustainable energy systems [54,68]. Over time, green technology patents and energy efficiency innovations may therefore improve environmental quality.
Finally, the fossil fuel share in electricity generation (EGF), measured as the combined share of electricity generated from coal, oil, and gas in total national electricity generation, has a positive and statistically significant coefficient in both the CBEC and TBEC models. Within the baseline ECM estimates, this result indicates that greater dependence on fossil fuels in the electricity generation mix is strongly associated with higher emissions in the selected major emitting economies. The magnitude of the EGF coefficient suggests that the composition of the electricity generation mix remains central to environmental pressure, particularly where coal continues to play a substantial role in power generation. These findings support the need to reduce fossil fuel dependence in electricity systems by accelerating the transition toward cleaner energy sources, improving energy efficiency, and expanding renewable energy technologies [69,70,71]. Because coal-fired electricity has a much higher carbon footprint than renewable energy sources, the technology and fuel structure used in electricity generation are crucial for lowering the environmental impact of power production.
The strong EGF coefficient is also in line with the electricity sector literature summarized in the updated review. Malla [4] shows that electricity output and the fossil fuel structure of generation were major contributors to CO2 emissions in large power systems across the Asia-Pacific region and North America. Halkos and Gkampoura [15] confirm that fossil fuel-based electricity production is closely linked with emissions and growth across income groups. Yilmaz and Sensoy [5], using a STIRPAT model for high-emitting countries, and Jun et al. [6], studying the world’s top emitters, also show that the emissions effect depends strongly on whether electricity is generated from renewable or non-renewable sources. Life-cycle evidence further supports the centrality of coal: Agrawal et al. [16] report substantially higher GHG emissions from imported coal power than from natural-gas combined-cycle generation in India, and Turconi et al. [17] show that direct plant operation dominates life-cycle emissions for fossil electricity technologies. Although gas may reduce emissions relative to coal in some settings, Alvarez et al. [19] warn that methane leakage can weaken climate benefits, while Yang et al. [20] show that pipeline constraints limit the feasibility of large-scale coal-to-gas switching. Therefore, the positive EGF result should be read mainly as evidence against continued fossil dependence, with coal remaining the most problematic source.

4.3. Robustness Checks

Given the evidence of cross-sectional dependence in several variables, we employ Driscoll–Kraay fixed-effects estimates as a robustness check, because this approach provides standard errors that are robust to cross-sectional dependence, heteroskedasticity, and serial correlation. In addition, FMOLS is used as an alternative long-run estimator because the diagnostic tests provide partial evidence of cointegration. The results are reported in Table 7. The DK-FE estimates broadly support the baseline ECM results. In both emissions models, GDP per capita and the fossil fuel share in electricity generation (EGF) remain positive and statistically significant, while energy-related technological innovation (TREG) remains negative and statistically significant. Population density is negative in both models, but statistically significant only in the CBEC specification. These results indicate that the main baseline findings are robust to the use of Driscoll–Kraay standard errors. However, the FMOLS estimates provide more mixed evidence. GDP per capita remains positive and statistically significant in both models, and PD remains negative and statistically significant. In contrast to the baseline ECM and DK-FE results, TREG is positive and statistically significant, while EGF is negative and statistically significant in both emissions models. Because EGF is measured as the combined share of electricity generated from coal, oil, and gas in total national electricity generation, the negative FMOLS coefficient should be interpreted cautiously and may reflect estimator sensitivity, long-run specification issues, or the compositional nature of electricity mix shares rather than a simple negative emissions effect of fossil fuel electricity dependence. Overall, the robustness checks support the positive association between income and emissions, while the estimated associations for the fossil fuel share in electricity generation and energy-related technological innovation are less stable across alternative long-run specifications.

4.4. Country-Level Disaggregated Estimates

Finally, to examine fuel-specific heterogeneity, the aggregate fossil fuel share in electricity generation is decomposed into three components. Each component is measured as a percentage of total national electricity generation; therefore, the country-level FMOLS coefficients reported in Table 8 should be interpreted as associations between fuel shares in the electricity mix and CO2 emissions rather than as effects of the absolute volume of electricity produced from each fossil fuel. The four countries differ substantially in terms of development level, electricity system structure, and fossil fuel dependence, while remaining among the world’s largest CO2 emitters. According to Ember Yearly Electricity Data [51], the United States relied heavily on coal in the early 1990s, when coal accounted for more than 50% of total electricity generation, followed by natural gas and oil. By 2023, the coal and oil shares had declined substantially, while the gas share had increased markedly. China also remained highly dependent on coal in its electricity mix: the coal share was already dominant in 1990, increased further in the mid-2000s, and remained high in 2023 despite some decline. Russia differs from China and India because natural gas accounts for a much larger share of its electricity mix, while coal and oil represent smaller but still relevant shares. India, by contrast, has continued to rely strongly on coal, with the coal share remaining dominant in total electricity generation. These descriptive patterns indicate that, although all four countries continue to use fossil fuels extensively in the power sector, the composition of fossil fuel dependence in the electricity mix differs substantially across national power systems.
BP Energy Outlook 2025 similarly suggests that the emissions pathways of these economies depend strongly on the pace of energy system transformation, particularly in the power sector [72]. In the United States, BP projects a continued decline in net emissions, associated with a declining role of more carbon-intensive fuels, especially coal, and the growing importance of lower-carbon and renewable energy sources, while natural gas remains an important part of the energy system. In China, renewable energy deployment is expected to expand substantially under both the current trajectory and the below 2° scenario. In India, energy demand is projected to continue rising due to robust economic growth and increasing prosperity, while coal remains the largest energy source under the current trajectory scenario. These scenario results reinforce the importance of examining fossil fuel-based electricity generation not only in aggregate terms, but also by fuel type and country-specific power sector structure.
The results in Table 8 reveal substantial cross-country heterogeneity. GDP per capita (YC) is positive and statistically significant in all country-level specifications, indicating that higher income levels remain associated with higher consumption-based and territorial CO2 emissions. Population density (PD), however, shows a less uniform pattern. It is negative and statistically significant in the United States and China for both CBEC and TBEC, negative in India, although only weakly significant in the TBEC model, and positive and statistically significant for Russia in the TBEC specification. These differences suggest that the emissions effect of demographic concentration depends on country-specific patterns of urbanization, infrastructure, energy demand, and production structure.
Among the disaggregated fossil fuel electricity variables, the coal share in electricity generation emerges as the fossil fuel component most consistently associated with higher emissions. EGC is positive and statistically significant for both CBEC and TBEC in the United States, China, and India. Because EGC is measured as the share of electricity generated from coal in total national electricity generation, this result should be interpreted as evidence that a higher coal share in the electricity mix is associated with greater emissions, rather than as an estimated effect of the absolute volume of coal-fired electricity output. The association is particularly strong in China and India, where electricity systems remain highly dependent on coal. However, the Russian results differ from this pattern, as the EGC coefficient is positive but statistically insignificant in both emissions models. Therefore, the disaggregated estimates indicate that the coal share in electricity generation is the most robust fossil fuel correlate of emissions in three of the four countries, but they do not imply a uniform coal-related relationship across all country-level specifications.
The dominance of EGC in the United States, China, and India is consistent with technology transition evidence from India and other emerging systems. Hiremath et al. [18] show that coal can remain in power sector roadmaps even under low-carbon scenarios, but coal-CCS remains costly and faces trade-offs relative to solar and wind. This strengthens the policy relevance of the disaggregated results: reducing emissions in major emitters requires not only lowering aggregate fossil fuel electricity but specifically accelerating substitution away from coal-based generation through renewable deployment, storage expansion, and grid modernization.
The estimated associations for the gas and oil shares in electricity generation are more heterogeneous. The gas share in electricity generation is negative and statistically significant in the United States, suggesting that a higher gas share may be associated with lower emissions when it substitutes for more carbon-intensive electricity sources. In contrast, EGG is positive and statistically significant in India, while it is statistically insignificant in China and mostly insignificant in Russia. The oil share in electricity generation (EGO) also produces mixed results: it is positive and significant in the United States for CBEC and weakly significant for TBEC, positive and significant in Russia for both emissions measures, insignificant in China, and negative in India for CBEC while insignificant for TBEC.
Overall, the disaggregated estimates refine the interpretation of the baseline findings. They show that coal-based electricity is the main fossil fuel component associated with emissions in the United States, China, and India, whereas Russia displays a different pattern in which oil-based electricity generation is more clearly associated with both CBEC and TBEC. This finding is consistent with previous evidence on the energy production-income–emissions nexus, which emphasizes the importance of fossil fuel dependence in explaining environmental pressure [73].
The country-level estimates also show that the effect of energy-related technological innovation (TREG) is not stable across specifications. TREG is statistically insignificant in the United States, China, and India, and it is negative and statistically significant only for Russia in the CBEC model. This mixed result can be interpreted in light of recent innovation literature. Z. Wang and Zhu [43] show that renewable energy technology innovation contributes to CO2 abatement, while fossil-energy technology innovation is less effective. Cheng and Yao [44] similarly find that renewable energy technology innovation reduces carbon intensity in Chinese provinces, although the effect is heterogeneous. Evidence for developed and emerging economies points in the same direction: Xie and Jamaani [45] report that green innovation, renewable energy, energy productivity, and environmental taxes mitigate emissions in G7 countries, while Onifade and Alola [46] and Onifade et al. [47] show that environmental-related technological innovation and renewables matter for environmental quality in E7 economies. At the same time, Razzaq et al. [50] find asymmetric and quantile-dependent links between green technology innovation and both consumption-based and territorial emissions in BRICS. These studies help explain why TREG may reduce emissions in some contexts but does not show a uniform effect across all country-level FMOLS specifications in this study.

5. Conclusions and Policy Recommendations

Because the fossil fuel share in electricity generation remains closely associated with CO2 emissions, this study examined the relationships between the electricity generation shares of coal, oil, and gas, energy-related climate change mitigation technologies, and CO2 emissions per capita in China, the United States, India, and Russia over the period 1990–2023. Using an extended STIRPAT framework, the analysis compared consumption-based and territorial CO2 emissions. Given the diagnostic evidence, the results are interpreted as conditional empirical associations rather than as definitive causal effects. The baseline ECM and Driscoll–Kraay fixed-effects estimates suggest that the aggregate fossil fuel share in electricity generation is positively associated with both CBEC and TBEC, whereas the FMOLS results indicate that this long-run coefficient is sensitive to estimator choice. The country-level disaggregated estimates further show that the coal share in electricity generation is the fossil fuel component most consistently positively associated with emissions in the United States, China, and India, while the associations for oil and gas are more heterogeneous. GDP per capita is consistently positively associated with emissions, whereas the relationship between population density and emissions varies across accounting approaches and country-level specifications. TREG is negatively associated with emissions in the baseline ECM and DK-FE estimates, but this relationship is not robust across all long-run and country-level specifications.
The theoretical contribution of this study is to extend the conventional STIRPAT framework by treating the electricity generation mix as a distinct structural and technological channel through which population-related pressures, affluence, and technology are translated into environmental pressure. In this sense, the study contributes not by proposing a new emissions theory, but by refining the STIRPAT framework for electricity sector decarbonization and by showing how emissions accounting choices can affect the interpretation of environmental sustainability in major emitting economies.
This research contributes from the perspective of policymakers and institutional actors. We pay special attention to climate policy agencies can benefit from the joint use of CBEC and TBEC because the two indicators reveal different dimensions of emissions responsibility: territorial accounts capture domestic production-based emissions, whereas consumption-based accounts help identify emissions embodied in final demand and trade. In this sense, the practical contribution of the study is to translate the empirical distinction between coal, gas, oil, technological innovation, and emissions accounting perspectives into decision-relevant evidence for energy ministries, regulators, grid operators, climate agencies, and innovation policy institutions.
The comparison of electricity mix and energy transition in China, the United States, India, and Russia show that the four economies should not be treated as a homogeneous group of major emitters. China and India are coal-constrained transition cases: coal remains central to their electricity systems and continues to be closely associated with emissions, although China combines coal dependence with stronger renewable energy expansion, grid development, and technological capacity, whereas India faces additional constraints from rapid electricity demand growth, power sector lock-ins, grid integration, and energy access needs. The United States differs because coal decline has been accompanied by a larger role for natural gas and renewables, as well as stronger innovation, smart-grid, and regulatory capacity; however, its transition remains exposed to gas lock-in, grid bottlenecks, water-related constraints, and policy uncertainty. Russia represents a fossil path-dependence case, where the electricity system is less uniformly coal-driven and more strongly shaped by oil- and gas-related resource dependence, slower decarbonization momentum, and persistent fossil-based infrastructure. These differences imply country-specific priorities: coal substitution, renewable integration, storage, and grid reform in China and India; coordinated coal phase-down, gas risk management, renewable expansion, and grid modernization in the United States; and fossil-resource diversification, efficiency improvements, and power system modernization in Russia.
Due to the scope and analytical limitations of a single article, the detailed policy recommendations are limited to two countries: the United States, as an economy characterized by a high level of technological advancement, and India, which in recent years has been among the most dynamically developing economies in Asia. For the United States, the policy implications of coal and gas electricity generation point to a managed transition rather than a simple fuel-switching strategy. The supporting evidence emphasizes that coal-fired electricity remains highly CO2-intensive, whereas the climate advantage of gas depends on methane leakage, plant efficiency, and upstream supply-chain conditions. Therefore, U.S. policy should continue prioritizing coal retirement and the phase-out of high-emitting plants, but gas should be treated only as a limited transition fuel, accompanied by strict methane monitoring, lifecycle emissions accounting, and clear safeguards against gas infrastructure lock-in. At the same time, the insignificant TREG coefficient in the U.S. country-level estimates and the broader evidence on heterogeneous innovation effects suggest that innovation policy should be more targeted: public R&D, tax incentives, and regulatory support should focus on renewable integration, grid flexibility, storage, demand response, advanced methane monitoring, and efficiency improvements in lagging regions and plant types rather than on generic energy innovation. Because U.S. electricity markets differ substantially across states in fuel prices, market structure, substitution elasticities, regulatory stringency, and innovation capacity, federal and state policies should be coordinated to limit emissions leakage and avoid shifting generation from regulated to less-regulated jurisdictions.
For India, the policy implications point to a coal-first but renewables-led transition strategy. The country-level estimates show that coal-based electricity generation is positively and statistically significantly associated with both consumption-based and territorial CO2 emissions in India, while gas-based electricity generation is also positively associated with both emissions measures; this suggests that India should not rely on coal-to-gas substitution as the central decarbonization pathway. Instead, rising electricity demand should be met primarily through renewable energy expansion, supported by grid modernization, storage, and demand-side flexibility. The most policy-relevant priority is to avoid new coal lock-in by preventing coal capacity expansion from becoming the default response to demand growth, while gradually retiring or reducing the use of high-emitting coal assets where system reliability allows. Solar PV and wind should form the core of India’s renewable scale-up, because they offer the strongest large-scale substitution potential, but they need to be complemented by solar–wind hybrids, battery storage, pumped hydropower, selective biomass or biogas hybrids, stronger transmission infrastructure, and demand response to manage intermittency and reduce reliance on coal for peak and balancing needs. Clean and distributed electrification is also important, because expanding energy access through coal-based supply would embed long-lived emissions in new demand centers. Therefore, India’s policy package should combine renewable capacity targets, grid connection upgrades, storage incentives, concessional finance, distribution sector reform, demand-response mechanisms, and region-specific planning.
This study has several limitations that should be considered when interpreting the findings. First, the analysis focuses on China, the United States, India, and Russia over the period 1990–2023. Although these countries are highly relevant major emitters with large fossil fuel-dependent electricity systems, the sample is small and should be interpreted as a focused comparative panel rather than as a globally representative group of all major emitting economies. Second, the fossil fuel-based electricity variables are measured as shares of total electricity generation, not as absolute volumes of electricity produced from coal, oil, and gas. The results therefore capture the composition of the electricity mix rather than the scale of fossil fuel-based electricity production. Third, the econometric results should be interpreted cautiously because the diagnostic tests indicate only partial evidence of cointegration. The ECM and robustness estimate therefore provide evidence of conditional empirical associations rather than definitive causal relationships or universally stable long-run equilibria. Fourth, the robustness checks reveal estimator sensitivity. The baseline ECM and Driscoll–Kraay fixed-effects estimates are broadly consistent, but the FMOLS results differ for the fossil fuel electricity share and the technology variable. This suggests that some long-run coefficients are sensitive to estimator choice and to the compositional nature of electricity mix shares. Finally, the policy implications should be read as directional rather than prescriptive. Future research should extend the country sample, use more disaggregated technology indicators, incorporate absolute electricity generation volumes and cross-border embodied emissions, and apply nonlinear, heterogeneous, and causally oriented empirical methods.


Author Contributions

Conceptualization, Z.U.R., B.J. and R.S.; methodology, Z.U.R., B.J. and R.S.; software, Z.U.R. and B.J.; validation, Z.U.R. and B.J.; formal analysis, Z.U.R. and B.J.; investigation, Z.U.R., B.J. and R.S.; data curation, Z.U.R. and B.J.; writing—original draft preparation, Z.U.R., B.J. and R.S.; writing—review and editing, Z.U.R. and B.J.; visualization, Z.U.R. and B.J.; supervision, Z.U.R. and B.J.; project administration, B.J.; funding acquisition, B.J. All authors have read and agreed to the published version of the manuscript.

Funding

The APC was funded by The John Paul II Catholic University of Lublin.

Data Availability Statement

The data (variables) can be found at publicly available databases: consumption-based CO2 emissions and territorial-based CO2 emissions are available from Our World in Data and the Global Carbon Budget; shares of electricity generated from coal, oil, and gas in total electricity generation, including the aggregate fossil fuel share and its coal, oil, and gas components, are available from Ember Yearly Electricity Data; population density and GDP per capita in constant 2015 US$ are available from the World Bank World Development Indicators; and climate change mitigation technologies related to energy generation, transmission, or distribution are available from the OECD Data Explorer (all accessed on 15 January 2026). The final panel dataset was constructed by the authors for China, the United States, India and Russia for the period 1990–2023. The processed dataset used in the empirical analysis is available from the corresponding author upon reasonable request.

Acknowledgments

During the preparation of this manuscript, the authors used OpenAI ChatGPT (GPT-5) and OpenAI Codex (GPT-5-based coding agent) for language editing, manuscript structure checking, and drafting assistance for selected editorial statements. The authors have reviewed and edited the output and take full responsibility for the content of this publication.

Conflicts of Interest

The authors declare no conflicts of interest.

Abbreviations

The following abbreviations are used in this manuscript:
ADFAugmented Dickey–Fuller test
BRICSBrazil, Russia, India, China, and South Africa
CADFCross-sectionally augmented Dickey–Fuller test
CDCross-sectional dependence
CIPSCross-sectionally augmented IPS panel unit root test
CO2Carbon dioxide
E7Emerging seven economies
ECMError correction model
ECTError correction term
EGCShare of electricity generated from coal
EGFCombined share of electricity generated from coal, oil, and gas
EGGShare of electricity generated from gas
EGOShare of electricity generated from oil
FGLSFeasible generalized least squares
FMOLSFully modified ordinary least squares
GDPGross domestic product
GHGGreenhouse gas
IPATImpact, population, affluence, and technology
OECDOrganization for Economic Co-operation and Development
OLSOrdinary least squares
PDPopulation density
STIRPATStochastic impacts by regression on population, affluence, and technology
SUREGSeemingly unrelated regression
TREGClimate change mitigation technologies related to energy generation, transmission, or distribution
YCGDP per capita

Appendix A. Heatmaps of Study Variables by Country and Years

Figure A1. Heatmap of log consumption-based CO2 emissions (CBEC) by country and years.
Energies 19 03412 g0a1
Figure A2. Heatmap of log territorial-based CO2 emissions (TBEC) by country and years.
Energies 19 03412 g0a2
Figure A3. Heatmap of log GDP per capita (YC) by country and years.
Energies 19 03412 g0a3
Figure A4. Heatmap of log climate change mitigation technologies related to energy generation, transmission, or distribution (TREG) by country and years.
Energies 19 03412 g0a4
Figure A5. Heatmap of log population density (PD) by country and years.
Energies 19 03412 g0a5
Figure A6. Heatmap of the log fossil fuel share in electricity generation (FF/EGF) by country and year.
Energies 19 03412 g0a6

References

  1. Jiang, Q.; Rahman, Z.U.; Zhang, X.; Islam, M.S. An Assessment of the Effect of Green Innovation, Income, and Energy Use on Consumption-Based CO2 Emissions: Empirical Evidence from Emerging Nations BRICS. J. Clean. Prod. 2022, 365, 132636. [Google Scholar] [CrossRef] [Scilit]
  2. Ahmad, M.; Khan, Z.; Rahman, Z.U.; Khan, S. Does Financial Development Asymmetrically Affect CO2 Emissions in China? An Application of the Nonlinear Autoregressive Distributed Lag (NARDL) Model. Carbon Manag. 2018, 9, 631–644. [Google Scholar] [CrossRef] [Scilit]
  3. Maka, A.O.M.; Alabid, J.M. Solar Energy Technology and Its Roles in Sustainable Development. Clean Energy 2022, 6, 476–483. [Google Scholar] [CrossRef] [Scilit]
  4. Malla, S. CO2 Emissions from Electricity Generation in Seven Asia-Pacific and North American Countries: A Decomposition Analysis. Energy Polic. 2009, 37, 1–9. [Google Scholar] [CrossRef] [Scilit]
  5. Yilmaz, E.; Sensoy, F. Effects of Fossil Fuel Usage in Electricity Production on CO2 Emissions: A STIRPAT Model Application on 20 Selected Countries. Int. J. Energy Econ. Polic. 2022, 12, 224–229. [Google Scholar] [CrossRef] [Scilit]
  6. Jun, W.; Mughal, N.; Kaur, P.; Xing, Z.; Jain, V.; Cong, P.T. Achieving Green Environment Targets in the World’s Top 10 Emitter Countries: The Role of Green Innovations and Renewable Electricity Production. Econ. Res.-Èkon. Istraž. 2022, 35, 5310–5335. [Google Scholar] [CrossRef] [Scilit]
  7. Wang, Y.; Han, T.; Wei, Y. Building Accurate Energy-Use Statistics for Data Centers. Engineering 2026, 60, 336–342. [Google Scholar] [CrossRef] [Scilit]
  8. Friedlingstein, P.; O’Sullivan, M.; Jones, M.W.; Andrew, R.M.; Bakker, D.C.E.; Hauck, J.; Landschützer, P.; Quéré, C.L.; Li, H.; Luijkx, I.T.; et al. Global Carbon Budget 2025. Earth Syst. Sci. Data Discuss. 2025, 2025, 3211–3288. [Google Scholar] [CrossRef] [Scilit]
  9. Wei, J.; Chen, Z.; Zhang, Y.; Zhang, W.; Li, J.; Lora, E.E.S.; Venturini, O.J.; Kozlov, A.N.; Isa, Y.M. An Adjustable Heat-to-Power Ratio Combined Heat and Power System Integrating Biomass Gasification, Solid Oxide Fuel Cell, and Gas Turbine: Energy, Exergy, Economic, and Exergoeconomic (4E) Analyses. Int. J. Hydrogen Energy 2026, 244, 155706. [Google Scholar] [CrossRef] [Scilit]
  10. Afionis, S.; Sakai, M.; Scott, K.; Barrett, J.; Gouldson, A. Consumption-based Carbon Accounting: Does It Have a Future? Wiley Interdiscip. Rev. Clim. Change 2017, 8, e438. [Google Scholar] [CrossRef] [Scilit]
  11. Qu, S.; Li, Y.; Liang, S.; Yuan, J.; Xu, M. Virtual CO2 Emission Flows in the Global Electricity Trade Network. Environ. Sci. Technol. 2018, 52, 6666–6675. [Google Scholar] [CrossRef] [Scilit] [PubMed]
  12. Ling, C.; Yang, Q.; Wang, Q.; Bartocci, P.; Jiang, L.; Xu, Z.; Wang, L. A Comprehensive Consumption-Based Carbon Accounting Framework for Power System towards Low-Carbon Transition. Renew. Sustain. Energy Rev. 2024, 206, 114866. [Google Scholar] [CrossRef] [Scilit]
  13. Crippa, M.; Guizzardi, D.; Pagani, F.; Banja, M.; Muntean, M.; Schaaf, E.; Quadrelli, R.; Martin, A.R.; Taghavi-Moharamli, P.; Koykka, J.; et al. GHG Emissions of All World Countries—2025 Report; EUR 40443; Publications Office of the European Union: Luxembourg, 2025.
  14. Ding, Q.; Khattak, S.I.; Ahmad, M. Towards Sustainable Production and Consumption: Assessing the Impact of Energy Productivity and Eco-Innovation on Consumption-Based Carbon Dioxide Emissions (CCO2) in G-7 Nations. Sustain. Prod. Consum. 2021, 27, 254–268. [Google Scholar] [CrossRef] [Scilit]
  15. Halkos, G.E.; Gkampoura, E.-C. Examining the Linkages among Carbon Dioxide Emissions, Electricity Production and Economic Growth in Different Income Levels. Energies 2021, 14, 1682. [Google Scholar] [CrossRef] [Scilit]
  16. Agrawal, K.K.; Jain, S.; Jain, A.K.; Dahiya, S. Assessment of Greenhouse Gas Emissions from Coal and Natural Gas Thermal Power Plants Using Life Cycle Approach. Int. J. Environ. Sci. Technol. 2014, 11, 1157–1164. [Google Scholar] [CrossRef] [Scilit]
  17. Turconi, R.; Boldrin, A.; Astrup, T. Life Cycle Assessment (LCA) of Electricity Generation Technologies: Overview, Comparability and Limitations. Renew. Sustain. Energy Rev. 2013, 28, 555–565. [Google Scholar] [CrossRef] [Scilit]
  18. Hiremath, M.; Viebahn, P.; Samadi, S. An Integrated Comparative Assessment of Coal-Based Carbon Capture and Storage (CCS) Vis-à-Vis Renewable Energies in India’s Low Carbon Electricity Transition Scenarios. Energies 2021, 14, 262. [Google Scholar] [CrossRef] [Scilit]
  19. Alvarez, R.A.; Pacala, S.W.; Winebrake, J.J.; Chameides, W.L.; Hamburg, S.P. Greater Focus Needed on Methane Leakage from Natural Gas Infrastructure. Proc. Natl. Acad. Sci. USA 2012, 109, 6435–6440. [Google Scholar] [CrossRef] [Scilit] [PubMed]
  20. Yang, S.; Hastings-Simon, S.; Ravikumar, A.P. Pipeline Availability Limits on the Feasibility of Global Coal-to-Gas Switching in the Power Sector. Environ. Sci. Technol. 2022, 56, 14734–14742. [Google Scholar] [CrossRef] [Scilit] [PubMed]
  21. Zhu, Z.; Hunjra, A.I.; Alharbi, S.S.; Zhao, S. Global Energy Transition under Geopolitical Risks: An Empirical Invest. Energy Econ. 2025, 145, 108495. [Google Scholar] [CrossRef] [Scilit]
  22. Haas, C.; Kempa, K.; Moslener, U. Dealing with Deep Uncertainty in the Energy Transition: What We Can Le from the Electricity and Transportation Sectors. Energy Policy 2023, 179, 113632. [Google Scholar] [CrossRef] [Scilit]
  23. Flouros, F.; Pistikou, V.; Plakandaras, V. Geopolitical Risk as a Determinant of Renewable Energy Investments. Energies 2022, 15, 1498. [Google Scholar] [CrossRef] [Scilit]
  24. Yasmeen, R.; Shah, W.U.H. Energy Uncertainty, Geopolitical Conflict, and Militarization Matters for Renewable and Non-Renewable Energy Development: Perspectives from G7 Economies. Energy 2024, 306, 132480. [Google Scholar] [CrossRef] [Scilit]
  25. Dai, J.; Mehmood, U.; Nassani, A.A. Empowering Sustainability through Energy Efficiency, Green Innovations, and the Sharing Economy: Insights from G7 Economies. Energy 2025, 318, 134768. [Google Scholar] [CrossRef] [Scilit]
  26. Xi, J.; Boateng, S.A.; Sackitey, G.M.; Karikari, F.A.; Fumey, M.P. Political Economy of Renewable Energy Transitions: Technology-Specific Responses to Geopolitical Risk and Political Stability in G7 Economie. J. Environ. Manag. 2025, 394, 127453. [Google Scholar] [CrossRef] [Scilit] [PubMed]
  27. Jóźwik, B.; Topcu, B.A.; Doğan, M. The Impact of Nuclear Energy Consumption, Green Technological Innovation, and Trade Openness on the Sustainable Environment in the USA. Energies 2024, 17, 3810. [Google Scholar] [CrossRef] [Scilit]
  28. Dash, A.K.; Panda, S.P.; Sahu, P.K.; Jóźwik, B. Do Green Innovation and Governance Limit CO2 Emissions: Evidence from Twelve Polluting Countries with Panel Data Decision Tree Model. Discov. Sustain. 2024, 5, 198. [Google Scholar] [CrossRef] [Scilit]
  29. Bie, Z.; Lin, Y.; Li, G.; Jin, X.; Hua, B. Smart Grid in China: A Promising Solution to China’s Energy and Enviro Issues. Int. J. Environ. Stud. 2013, 70, 702–718. [Google Scholar] [CrossRef] [Scilit]
  30. Jayabal, R. Towards a Carbon-Free Society: Innovations in Green Energy for a Susta Future. Results Eng. 2024, 24, 103121. [Google Scholar] [CrossRef] [Scilit]
  31. Chen, Z.-M.; Xiong, Q.; Duan, J.; Chen, Z.; Guo, S. AI Carbon Footprint in China Sets to Double Post-2030 Carbon Peaking. Energy Econ. 2025, 150, 108880. [Google Scholar] [CrossRef] [Scilit]
  32. Jha, R.; Jha, R.; Islam, M. Forecasting US Data Center CO2 Emissions Using AI Models: Emissions Re Strategies and Policy Recommendations. Front. Sustain. 2024, 5, 1507030. [Google Scholar] [CrossRef] [Scilit]
  33. Nøland, J.K.; Hjelmeland, M.N.; Korpås, M. Will Energy-Hungry AI Create a Baseload Power Demand Boom? IEEE Access 2024, 12, 110353–110360. [Google Scholar] [CrossRef] [Scilit]
  34. Melnatami, C.C. AI Data Centers and U.S. Grids: A 2026–2030 Regional Forecast. In Proceedings of the IEEE Green Technologies Conference, Boulder, CO, USA, 25–27 March 2026. [Google Scholar]
  35. Paccou, R.; Wijnhoven, F. Exploring the AI Electricity Crisis Scenario: A Case Study of Texas-ER COT. Next Energy 2025, 8, 100341. [Google Scholar] [CrossRef] [Scilit]
  36. Fan, Y.; Wilson, C.; Kamiya, G.; Mastrucci, A. Data Centre Energy Demand Projections within Shared Socioeconomic Path. Energy Clim. Change 2026, 7, 100253. [Google Scholar] [CrossRef] [Scilit]
  37. Zhang, N.; Duan, H.; Guan, Y.; Yang, J.; Shan, Y. The “Eastern Data and Western Computing” Initiative in China Contribut es to Its Net-Zero Target. Engineering 2025, 52, 256–261. [Google Scholar] [CrossRef] [Scilit]
  38. Altamira, L.M.; Viegand, J.; Polverini, D.; Huang, B.; Flucker, S. The Role of Data Centres in Reducing Energy Consumption through Policy Measures. In Proceedings of the Eceee Summer Study Proceedings, Hyères, France, 6–11 June 2019. [Google Scholar]
  39. Cao, Z.; Zhou, X.; Hu, H.; Wang, Z.; Wen, Y. Toward a Systematic Survey for Carbon Neutral Data Centers. IEEE Commun. Surv. Tutor. 2022, 24, 895–936. [Google Scholar] [CrossRef] [Scilit]
  40. Hankendi, C.; Coşkun, A.K.; Sovacool, B.K. Why Transparency Matters for Sustainable Data Centers and Carbon-neutr al Artificial Intelligence (AI). iScience 2025, 28, 113705. [Google Scholar] [CrossRef] [Scilit] [PubMed]
  41. Chopdar, S.; Sruthi, Y.; George, D.; Kumar, M.; Fernandez, I.G. Carbon-Aware AI Workload Scheduling with Renewable Energy Sources. In Proceedings of the ICECONF 2025—2025 2nd International Conference on Artifi cial Intelligence and Knowledge Discovery in Concurrent Engineering, Chennai, India, 9–10 October 2025. [Google Scholar] [CrossRef] [Scilit]
  42. Du, B.; Jia, H.; Li, Y.; Zhang, N.; Liang, D. Estimating the Carbon Emission Reduction Potential of Using Carbon-Ori Demand Response for Data Centers: A Case Study in China. iEnergy 2025, 4, 54–64. [Google Scholar] [CrossRef] [Scilit]
  43. Wang, Z.; Zhu, Y. Do Energy Technology Innovations Contribute to CO2 Emissions Abatement? A Spatial Perspective. Sci. Total Environ. 2020, 726, 138574. [Google Scholar] [CrossRef] [Scilit] [PubMed]
  44. Cheng, Y.; Yao, X. Carbon Intensity Reduction Assessment of Renewable Energy Technology Innovation in China: A Panel Data Model with Cross-Section Dependence and Slope Heterogeneity. Renew. Sustain. Energy Rev. 2021, 135, 110157. [Google Scholar] [CrossRef] [Scilit]
  45. Xie, P.; Jamaani, F. Does Green Innovation, Energy Productivity and Environmental Taxes Limit Carbon Emissions in Developed Economies: Implications for Sustainable Development. Struct. Change Econ. Dyn. 2022, 63, 66–78. [Google Scholar] [CrossRef] [Scilit]
  46. Onifade, S.T.; Alola, A.A. Energy Transition and Environmental Quality Prospects in Leading Emerging Economies: The Role of Environmental-related Technological Innovation. Sustain. Dev. 2022, 30, 1766–1778. [Google Scholar] [CrossRef] [Scilit]
  47. Onifade, S.T.; Bekun, F.V.; Phillips, A.; Altuntaş, M. How Do Technological Innovation and Renewables Shape Environmental Quality Advancement in Emerging Economies: An Exploration of the E7 Bloc? Sustain. Dev. 2022, 30, 2002–2014. [Google Scholar] [CrossRef] [Scilit]
  48. Andrew, R.; Peters, G.P.; Lennox, J. Approximation and regional aggregation in multi-regional input–output analysis for national carbon footprint accounting. Econ. Syst. Res. 2009, 21, 311–335. [Google Scholar] [CrossRef] [Scilit]
  49. Tranberg, B.; Corradi, O.; Lajoie, B.; Gibon, T.; Staffell, I.; Andresen, G.B. Real-Time Carbon Accounting Method for the European Electricity Markets. Energy Strat. Rev. 2019, 26, 100367. [Google Scholar] [CrossRef] [Scilit]
  50. Razzaq, A.; Wang, Y.; Chupradit, S.; Suksatan, W.; Shahzad, F. Asymmetric Inter-Linkages between Green Technology Innovation and Consumption-Based Carbon Emissions in BRICS Countries Using Quantile-on-Quantile Framework. Technol. Soc. 2021, 66, 101656. [Google Scholar] [CrossRef] [Scilit]
  51. Ember; Energy Institute. Electricity Generation from Fossil Fuels—Ember. Our World in Data. 2026. Available online: https://archive.ourworldindata.org/20260710-182139/grapher/electricity-fossil-fuels.html (accessed on 10 July 2026).
  52. Dietz, T.; Rosa, E.A. Effects of Population and Affluence on CO2 Emissions. Proc. Natl. Acad. Sci. USA 1997, 94, 175–179. [Google Scholar] [CrossRef] [Scilit] [PubMed]
  53. Hasanov, F.J.; Khan, Z.; Hussain, M.; Tufail, M. Theoretical Framework for the Carbon Emissions Effects of Technological Progress and Renewable Energy Consumption. Sustain. Dev. 2021, 29, 810–822. [Google Scholar] [CrossRef] [Scilit]
  54. Ali, S.; Dogan, E.; Chen, F.; Khan, Z. International Trade and Environmental Performance in Top Ten-emitters Countries: The Role of Eco-innovation and Renewable Energy Consumption. Sustain. Dev. 2021, 29, 378–387. [Google Scholar] [CrossRef] [Scilit]
  55. Abbasi, K.R.; Hussain, K.; Haddad, A.M.; Salman, A.; Ozturk, I. The Role of Financial Development and Technological Innovation towards Sustainable Development in Pakistan: Fresh Insights from Consumption and Territory-Based Emissions. Technol. Forecast. Soc. Change 2022, 176, 121444. [Google Scholar] [CrossRef] [Scilit]
  56. Ullah, A.; Dogan, M.; Pervaiz, A.; Bukhari, A.A.A.; Akkus, H.T.; Dogan, H. The Impact of Digitalization, Technological and Financial Innovation on Environmental Quality in OECD Countries: Investigation of N-Shaped EKC Hypothesis. Technol. Soc. 2024, 77, 102484. [Google Scholar] [CrossRef] [Scilit]
  57. Jiang, Q.; Rahman, Z.U.; Zhang, X.; Guo, Z.; Xie, Q. An Assessment of the Impact of Natural Resources, Energy, Institutional Quality, and Financial Development on CO2 Emissions: Evidence from the B&R Nations. Resour. Policy 2022, 76, 102716. [Google Scholar] [CrossRef] [Scilit]
  58. Pesaran, M.H. General Diagnostic Tests for Cross-Sectional Dependence in Panels. Empir. Econ. 2021, 60, 13–50. [Google Scholar] [CrossRef] [Scilit]
  59. Pesaran, M.H.; Yamagata, T. Testing Slope Homogeneity in Large Panels. J. Econ. 2008, 142, 50–93. [Google Scholar] [CrossRef] [Scilit]
  60. Pesaran, M.H. A Simple Panel Unit Root Test in the Presence of Cross-section Dependence. J. Appl. Econ. 2007, 22, 265–312. [Google Scholar] [CrossRef] [Scilit]
  61. Pedroni, P. Critical Values for Cointegration Tests in Heterogeneous Panels with Multiple Regressors. Oxf. Bull. Econ. Stat. 1999, 61, 653–670. [Google Scholar] [CrossRef] [Scilit]
  62. Driscoll, J.C.; Kraay, A.C. Consistent Covariance Matrix Estimation with Spatially Dependent Panel Data. Rev. Econ. Stat. 1998, 80, 549–560. [Google Scholar] [CrossRef] [Scilit]
  63. Pedroni, P. Fully modified OLS for heterogeneous cointegrated panels. In Advances in Econometrics; Emerald Group Publishing Limited: Leeds, UK, 2001; pp. 93–130. [Google Scholar] [CrossRef] [Scilit]
  64. Rahman, Z.U.; Khattak, S.I.; Ahmad, M.; Khan, A. A Disaggregated-Level Analysis of the Relationship among Energy Production, Energy Consumption and Economic Growth: Evidence from China. Energy 2020, 194, 116836. [Google Scholar] [CrossRef] [Scilit]
  65. Kostakis, I.; Armaos, S.; Abeliotis, K.; Theodoropoulou, E. The Investigation of EKC within CO2 Emissions Framework: Empirical Evidence from Selected Cross-Correlated Countries. Sustain. Anal. Model. 2023, 3, 100015. [Google Scholar] [CrossRef] [Scilit]
  66. Rahman, M.M.; Alam, K. Clean Energy, Population Density, Urbanization and Environmental Pollution Nexus: Evidence from Bangladesh. Renew. Energy 2021, 172, 1063–1072. [Google Scholar] [CrossRef] [Scilit]
  67. Hussain, M.; Khan, J.A. The Nexus of Environment-Related Technologies and Consumption-Based Carbon Emissions in Top Five Emitters: Empirical Analysis through Dynamic Common Correlated Effects Estimator. Environ. Sci. Pollut. Res. 2023, 30, 25059–25068. [Google Scholar] [CrossRef] [Scilit] [PubMed]
  68. Hussain, J.; Khan, A.; Zhou, K. The Impact of Natural Resource Depletion on Energy Use and CO2 Emission in Belt & Road Initiative Countries: A Cross-Country Analysis. Energy 2020, 199, 117409. [Google Scholar] [CrossRef] [Scilit]
  69. Bento, J.P.C.; Moutinho, V. CO2 Emissions, Non-Renewable and Renewable Electricity Production, Economic Growth, and International Trade in Italy. Renew. Sustain. Energy Rev. 2016, 55, 142–155. [Google Scholar] [CrossRef] [Scilit]
  70. Ahmad, M.; Raza, M.Y. Role of Public-Private Partnerships Investment in Energy and Technological Innovations in Driving Climate Change: Evidence from Brazil. Environ. Sci. Pollut. Res. 2020, 27, 30638–30648. [Google Scholar] [CrossRef] [Scilit] [PubMed]
  71. Gielen, D.; Boshell, F.; Saygin, D.; Bazilian, M.D.; Wagner, N.; Gorini, R. The Role of Renewable Energy in the Global Energy Transformation. Energy Strat. Rev. 2019, 24, 38–50. [Google Scholar] [CrossRef] [Scilit]
  72. BP p.l.c. Country and Regional Insights: Bp Energy Outlook. 2025. Available online: https://www.bp.com/press-and-publications/energy-outlook/country-and-regional-insights (accessed on 17 July 2026).
  73. Rahman, Z.U.; Cai, H.; Khattak, S.I.; Hasan, M.M. Energy Production-Income-Carbon Emissions Nexus in the Perspective of N.A.F.T.A. and B.R.I.C. Nations: A Dynamic Panel Data Approach. Econ. Res.-Èkon. Istraž. 2019, 32, 3384–3397. [Google Scholar] [CrossRef] [Scilit]
Figure 1. Methodological workflow.
Energies 19 03412 g001
Table 1. Variable definitions and descriptive statistics of log-transformed variables.
VariableDescriptionMeanStd. Dev.MinMax
CBECConsumption-based CO2 emissions per capita from fossil fuels and industry; land-use change emissions are excluded.1.63771.1049−0.39393.1138
TBECTerritorial-based CO2 emissions per capita from fossil fuels and industry;
land-use change emissions are excluded.
1.75601.0948−0.403143.0632
PDPopulation density (people per sq. km of land area).4.13951.44212.16516.1814
YCGDP per capita (constant 2015 US$).8.74011.48736.276411.085
TREGClimate change mitigation technologies related to energy generation, transmission, or distribution (% of environment-related technologies).3.13150.38081.53863.6884
EGFShare of electricity generated from coal, oil, and gas fuels (measured as a percentage of total electricity produced in the country).4.28860.09894.07934.4480
EGCShare of electricity generated from coal (measured as a percentage of total electricity produced in the country).3.76900.62352.67314.3939
EGOShare of electricity generated from oil (measured as a percentage of total electricity produced in the country).0.65300.9262−1.65152.4742
EGGShare of electricity generated from gas (measured as a percentage of total electricity produced in the country).2.19051.5729−1.37303.9171
Source: Authors’ calculations. All reported values are expressed in natural logarithms.
Table 2. Pesaran cross-sectional dependence test.
StatisticCBECTBECYCTREGPDEGF
CD statistic−1.072 −2.826 12.761 6.6111.7566.311
p-value0.284<0.001<0.001<0.0010.079<0.001
Notes: CD ~ N(0,1). Small p-values indicate rejection of the null hypothesis of CD.
Table 3. Pesaran–Yamagata slope homogeneity test.
StatisticModel 1: CBECp-ValueModel 2: TBECp-Value
Delta statistic13.550<0.00118.105 <0.001
Adj. delta statistic14.931<0.00119.951 <0.001
Notes: The null hypothesis assumes slope homogeneity. Small p-values indicate rejection of the null hypothesis.
Table 4. Panel unit root test results.
VariableLevel t-BarLevel p-ValueDiff. t-StatisticDiff. p-Value
CBEC−3.931<0.001−4.986<0.001
TBEC−3.5260.004−3.0750.003
YC−3.926<0.001−3.0030.005
TREG−3.3420.011−4.390<0.001
PD−4.027<0.001−1.9110.390
EGF−2.9680.077−4.615<0.001
Notes: Diff. denotes first difference. The null hypothesis assumes a unit root. Small p-values indicate rejection of the null hypothesis.
Table 5. Panel cointegration test results.
TestStatisticModel 1: CBECModel 2: TBEC
Pedroni testModified Phillips–Perron t−0.20710.7678
(0.4180)(0.2213)
Phillips–Perron t−2.6822−3.0115
(0.0037)(0.0013)
ADF t−2.6589−1.4498
(0.0039)(0.0736)
Notes: p-values are reported in parentheses. H0: no cointegration. Small p-values indicate rejection of H0.
Table 6. Baseline error correction model (ECM) estimation results.
VariableModel 1: CBECModel 2: TBEC
Coeff.Std. Err.p-ValueCoeff.Std. Err.p-Value
Long-run
PD−0.3080.1440.035 **−0.0860.1470.558
YC0.7170.033<0.001 ***0.7290.034<0.001 ***
EGF1.54570.207<0.001 ***2.0040.211<0.001 ***
TREG−0.1080.0340.002 ***−0.1040.0340.003 ***
ECM
ECT (-1)−0.4070.070<0.001 ***−0.0410.0230.079 *
D_PD−2.6242.3960.276−0.9690.7860.220
D_YC0.9020.212<0.001 ***0.6260.069<0.001 ***
D_EGF1.1330.4570.015 **0.6430.150<0.001 ***
D_TREG−0.0830.023<0.001 ***−0.0060.0070.420
Notes: D_ denotes first differences. *, **, and *** denote significance at the 10%, 5%, and 1% levels, respectively.
Table 7. Robustness check results: DK-FE and FMOLS estimates.
Estimator/VariableModel 1: CBECModel 2: TBEC
Coeff.t-StatCoeff.t-Stat
DK-FE
PD−0.3079 **−2.55−0.0861−0.64
YC0.7166 ***19.490.7286 ***21.24
EGF1.5456 ***8.212.0042 ***8.66
TREG−0.1084 ***−4.91−0.1039 ***−3.69
FMOLS
PD−4.16 ***−53.89−1.68 ***−44.92
YC1.08 ***81.690.96 ***100.08
EGF0.97 ***45.811.29 ***73.04
TREG−0.07 ***−7.77−0.02 ***−3.54
Notes: **, and *** denote significance at the 5%, and 1% levels, respectively.
Table 8. Country-level FMOLS estimates for fossil fuel shares in electricity generation.
VariableModel 1: CBECModel 2: TBEC
Coeff.Std. Err.p-ValueCoeff.Std. Err.p-Value
USA
PD−1.363610.349760.0006−0.918000.321450.0083
YC1.342270.14134<0.0010.902010.12991<0.001
TREG0.018760.021770.3965−0.003800.020000.8508
EGC0.255550.02502<0.0010.236960.02299<0.001
EGG−0.129290.057870.0343−0.197730.053180.0010
EGO0.065440.015880.00030.026620.014590.0797
Cons.−7.487980.64582<0.001−3.938280.59356<0.001
China
PD−10.03621.24351<0.001−11.39571.21532<0.001
YC1.412230.13375<0.0011.612820.13072<0.001
TREG−0.012040.017370.4943−0.001880.016980.9123
EGC0.710480.178570.00051.208240.17453<0.001
EGG0.018930.022440.4066−0.032140.021930.1548
EGO0.026950.026800.32390.018390.026190.4889
Cons.36.18854.69399<0.00139.20024.58759<0.001
Russia
PD2.11053.111750.50364.039760.860540.0001
YC0.668580.195800.00210.613240.05414<0.001
TREG−0.209910.070130.0060−0.009100.019390.6428
EGC0.544820.474160.26100.073100.131120.5819
EGG1.166730.663530.09050.269630.183490.1537
EGO0.108600.048030.03240.166110.01328<0.001
Cons.−13.853610.90990.2154−13.24173.017100.0002
India
PD−1.861570.31729<0.001−0.676350.317290.0751
YC1.184550.12350<0.0010.897580.12350<0.001
TREG0.018160.011080.11330.010910.011080.3998
EGC0.664500.160450.00030.863250.160450.0001
EGG0.166130.02072<0.0010.090030.020720.0008
EGO−0.043170.013880.0045−0.025600.013880.1209
Cons.−0.238421.174930.8408−5.907251.174930.0002
Notes: EGC, EGG, and EGO denote the shares of electricity generated from coal, gas, and oil, respectively.
Disclaimer/Publisher’s Note: The statements, opinions and data contained in all publications are solely those of the individual author(s) and contributor(s) and not of MDPI and/or the editor(s). MDPI and/or the editor(s) disclaim responsibility for any injury to people or property resulting from any ideas, methods, instructions or products referred to in the content.