1. Introduction
Ultra-high-voltage (UHV) and extra-high-voltage (EHV) direct-current transmission technologies serve as the core means for large-scale clean energy consumption and long-distance power transmission. As the core equipment of direct-current transmission systems, the safe and reliable operation of the thyristor levels within converter valves directly determines the stability of the entire system. The Anode Saturable Reactor (ASR) is an indispensable protection and modulation element in thyristor converter valves, which achieves dynamic regulation of inductance through the magnetic saturation characteristics of the iron core: at the instant of converter valve turn-on, the unsaturated iron core provides large inductance to limit the rate of current rise (di/dt), thereby protecting the thyristor from current surges; as the conduction current increases and the iron core reaches saturation, the inductance drops rapidly, thus reducing the reactive power consumption of the system [
1,
2].
However, ASRs face severe electromagnetic–thermal–mechanical coupled stress challenges during long-term operation. On one hand, periodically varying magnetic fields drive continuous vibration of the iron core through magnetostrictive effects and Maxwell electromagnetic forces. Prolonged intense vibration can lead to attenuation of fastener preload, loosening of the iron core, and wear of air gap spacers, which in turn cause mechanical damage and drift of electrical parameters in the reactor. On the other hand, winding losses, together with hysteresis and eddy current losses in the iron core, result in significant temperature rise and the formation of localized high-temperature hot spots. Prolonged exposure to elevated temperatures causes thermal aging of insulating filling materials such as epoxy resin and polyurethane. A post-accident inspection conducted at an operational site in 2022 revealed multiple forms of damage in one reactor, including casing cracks, filler overflow, epoxy resin cracking, damage to the inter-lamination insulation of the iron core, and fracture of clamping bands, which fully demonstrates the serious threat posed by the aforementioned coupled degradation mechanisms to the safe operation of the equipment.
Considerable research has already been conducted by scholars on the vibration characteristics and temperature rise characteristics of ASRs. In terms of vibration characteristics, related work has primarily focused on simulation analysis and experimental verification of vibration mechanisms. Existing studies have calculated the magnetic flux density distribution and vibration response of the core through magnetic–structural multi-physics coupled finite element models [
3,
4,
5]. Ref. [
3] established a multi-physics coupled simulation model from the perspective of the overall structure, analyzed the differences in vibration characteristics of cores at different positions as well as the contributions of the magnetostrictive effect and Maxwell electromagnetic forces within a vibration period, and validated the simulation results through experimental testing. With regard to the engineering applications of multi-physics coupling characteristics of ASRs, related scholars have conducted in-depth research from three dimensions: structural optimization, fault diagnosis, and acoustic extension. Ref. [
6] optimized the core and vibration isolation structure through electromagnetic-harmonic response simulation, effectively suppressing abnormal deformation and vibration of the reactor. Ref. [
7] achieved qualitative characterization of the vibration response under fastener loosening faults by equivalently degrading the Young’s modulus of the core. Ref. [
8] constructed a fully coupled electromagnetic–mechanical–acoustic model, enabling accurate prediction of periodic vibration noise from a single core. However, for the shell-type ASRs with multi-layer casting structures, existing research lacks comparative analysis of vibration evolution patterns between healthy and defective states.
In recent years, extensive research has been conducted on loss mechanisms and efficiency optimization in power electronic equipment and electromagnetic energy conversion systems, providing important references for thermal characteristic analysis and condition assessment of such equipment. Similar loss and thermal analysis methods have also been widely applied to other magnetic components, such as transformers and reactors, where core loss distribution, hot-spot formation, and their relationship with structural parameters have been extensively investigated [
9,
10,
11,
12]. Regarding the temperature rise characteristics of ASRs, some scholars have established comprehensive heat dissipation models incorporating water cooling, heat conduction, convection, and radiation based on simulation methods, obtaining the internal steady-state temperature distribution and analyzing the causes of core hot spots [
13,
14,
15,
16,
17]. It was found that the thermal conductivity of the filling material is the primary bottleneck limiting heat dissipation [
13]. In terms of loss calculation, core losses under actual operating conditions were simulated, and it was verified that core losses are not only concentrated at the instant of converter valve turn-on, but also exist during the turn-off and blocking processes [
18,
19]. The aforementioned studies have laid an important foundation for temperature rise simulation; however, most existing work has focused solely on normal operating conditions, with relatively little analysis of how internal structural defects in ASRs, such as air gap reduction, affect the temperature rise distribution.
In current engineering practice, defect monitoring of ASRs in converter valves relies primarily on two approaches: infrared thermography inspection, which evaluates thermal states by measuring the temperature distribution on the casing surface, and manual inspection conducted after shutdown. Both methods are offline or passive in nature, making early fault warning difficult to achieve. In recent years, some studies have attempted to detect core looseness by collecting vibration acceleration signals through vibration sensors or by applying acoustic fingerprint recognition techniques, achieving certain progress. Through the adoption of data-driven and signal processing approaches, deep learning algorithms such as CNN and GAN [
20,
21] and advanced time–frequency analysis methods such as VMD and optimized S-transform [
22,
23,
24,
25] have been introduced, effectively enabling feature extraction and classification recognition of internal looseness defects in ASRs. However, such methods are subject to the constraints imposed by the high-voltage environment of converter valves, making engineering implementation considerably difficult. Non-invasive online condition monitoring methods currently remain an unexplored area.
Based on the above background, this paper systematically analyzes the monitorable quantities capable of characterizing defects in ASRs from three perspectives: vibration signals, thermal signals, and electrical signals.
Section 2 analyzes the vibration characteristics of ASRs under normal operation and under structural defect conditions.
Section 3 compares the temperature rise characteristics between the defect-free condition and the condition with reduced air gap defects.
Section 4 investigates the effects of air gap reduction on electrical parameters.
Section 5 presents the conclusions.
2. Vibration Characteristics Analysis
As a key component of the converter valve bridge arm, the ASR is primarily used to limit the rate of current change during the commutation process and to improve the operating characteristics on the valve side. Due to the periodic alternating conduction of converter valves, a pulsed current with significant non-sinusoidal characteristics flows through the ASR internally, which under ideal conditions can be equivalent to a pulsed current with a duty cycle of 1/3. The extremely high rate of current change produced by this transient pulsed current causes the magnetic state of the iron core to switch rapidly between saturated and unsaturated conditions, thereby exciting intense broadband pulsed electromagnetic vibration. If such complex structural vibrations are not effectively controlled over the long term, problems such as attenuation of fastener preload, slight displacement of the iron core, and spacer wear are highly likely to occur, posing a serious threat to the safe and stable operation of converter valves. Therefore, it is of great importance to conduct a systematic and in-depth analysis of the vibration characteristics of ASRs under pulsed operating conditions [
6,
7,
8,
26,
27].
2.1. Analysis of Vibration Mechanisms
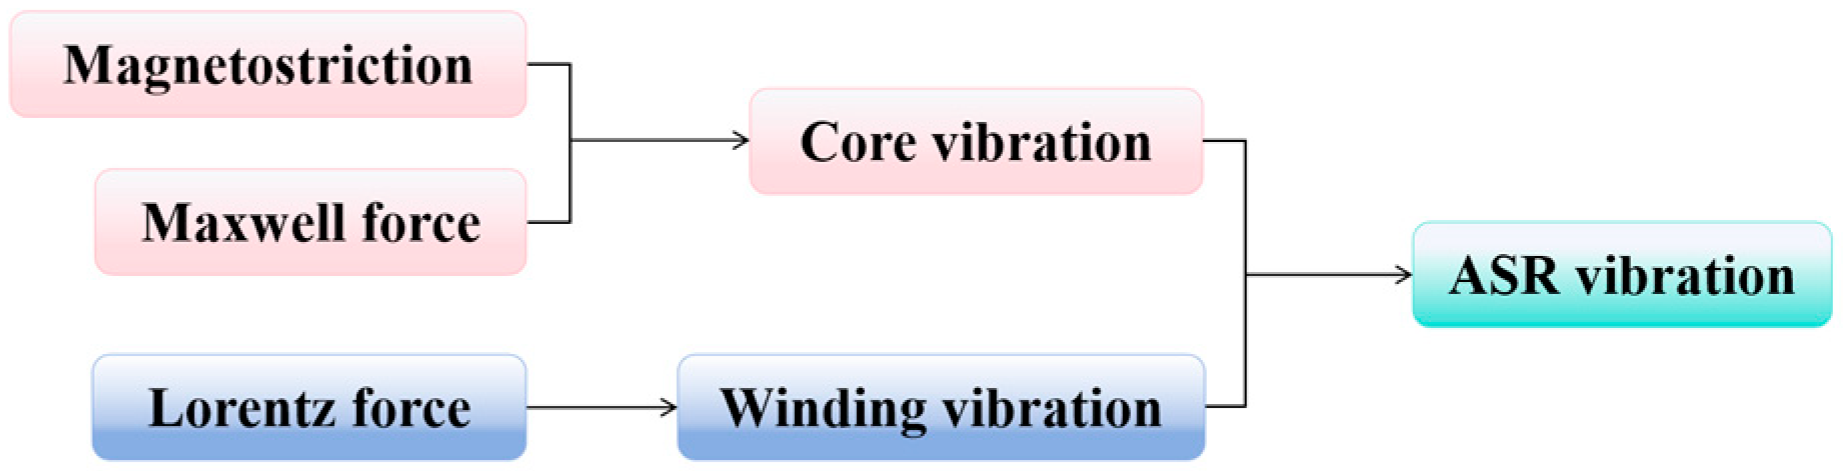
The vibration of ASRs used in converter valves originates primarily from two sources: iron core vibration and winding vibration [
8], as illustrated in
Figure 1.
Iron core vibration is driven jointly by the magnetostrictive effect and Maxwell electromagnetic forces. The magnetostrictive effect refers to the phenomenon whereby, during the magnetization of ferromagnetic materials, the orientation of internal magnetic domains undergoes periodic changes, causing the iron core to produce slight periodic expansion and contraction deformation along the direction of the magnetic field. Maxwell electromagnetic forces are generated at the interface between the iron core and the air gap where magnetic flux passes through. Due to the significant difference in magnetic permeability between the iron core and the air gap, the magnetic flux forms a non-uniform distribution at the interface, thereby producing periodically varying electromagnetic attractive forces on the iron core surfaces on both sides of the air gap. Winding vibration originates primarily from the Lorentz forces acting on the conductors in the leakage magnetic field. Since the winding exhibits high mechanical strength and large structural damping after epoxy casting treatment, its vibration amplitude is relatively small. The overall vibration of ASRs is dominated by iron core vibration. Therefore, this paper focuses primarily on the vibration induced by the iron core.
2.2. Establishment of the Vibration Model
2.2.1. Model Parameters
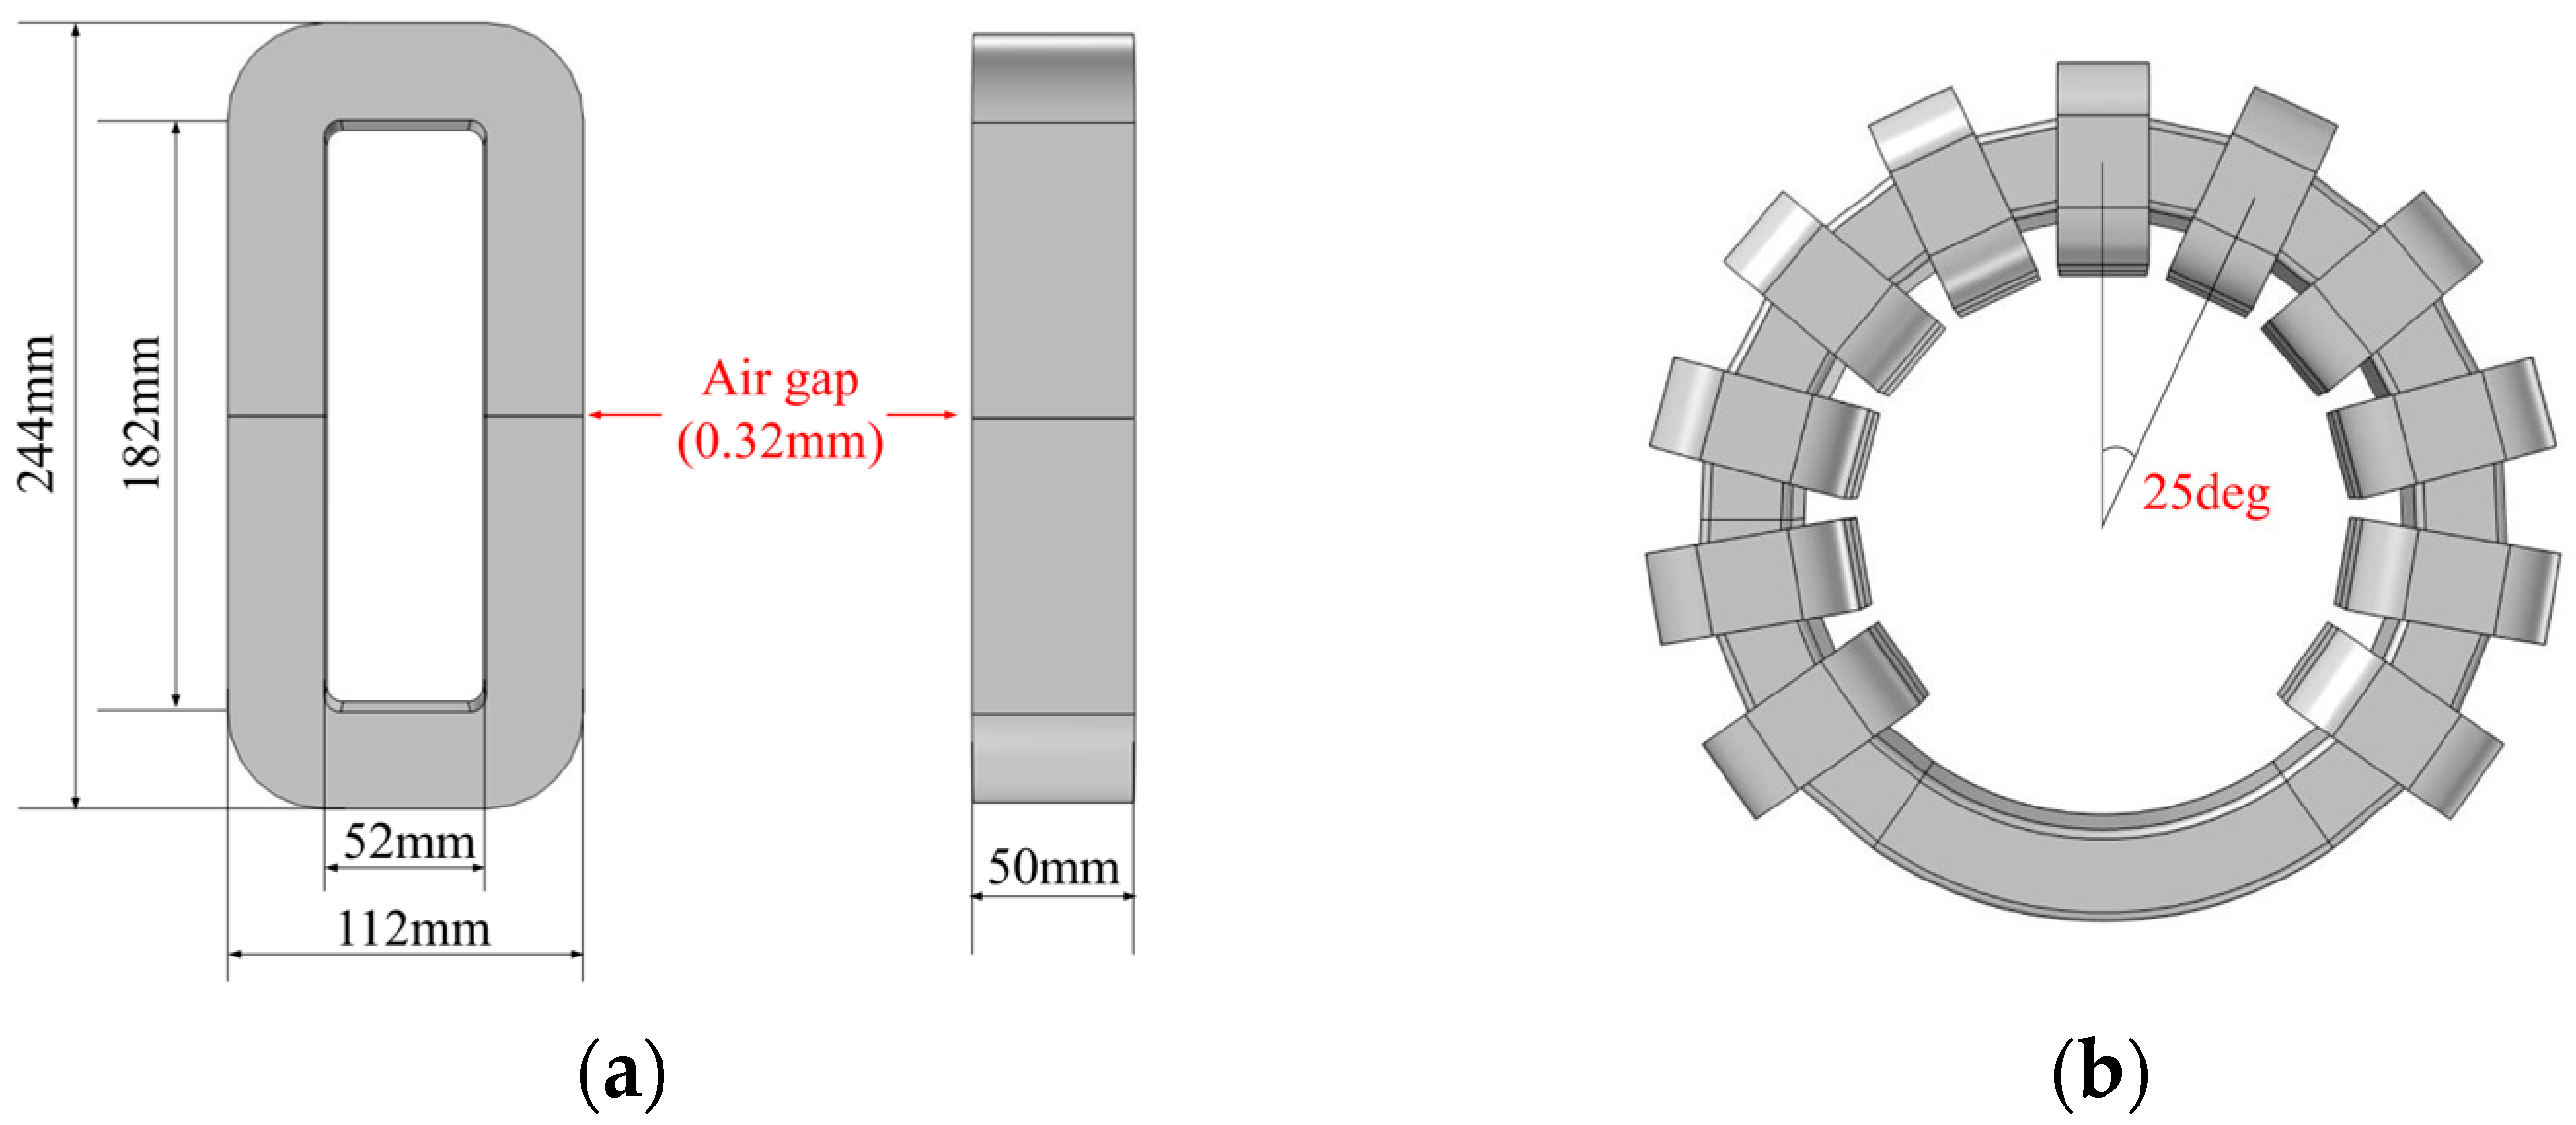
The ASR studied in this paper consists of 11 pairs of iron cores and a 4-turn winding, with an air gap of 0.32 mm. The cores are arranged at equal angular intervals of 25° around the central axis [
28]. The core geometry, spatial arrangement, and the location and size of the air gaps are illustrated in
Figure 2. Based on the equipment drawings, an electromagnetic–mechanical simulation model was established using COMSOL Multiphysics (Version 6.2), as shown in
Figure 3. The model consists of the iron core, windings, cooling water channels, epoxy resin, polyurethane, and the shell. Epoxy resin fills the space between the core and the windings, while polyurethane fills the space between the main structure and the shell; hollow water-cooling channels are embedded within the windings. To represent the constraining effect of the clamping band, a 2 mm thin layer is introduced on the outer surface of the core. The gap between adjacent cores is filled with PET insulating spacers, and the bottom cover plate is fixed as a boundary constraint to reflect the actual installation condition.
2.2.2. Material Parameters and Operating Condition Settings
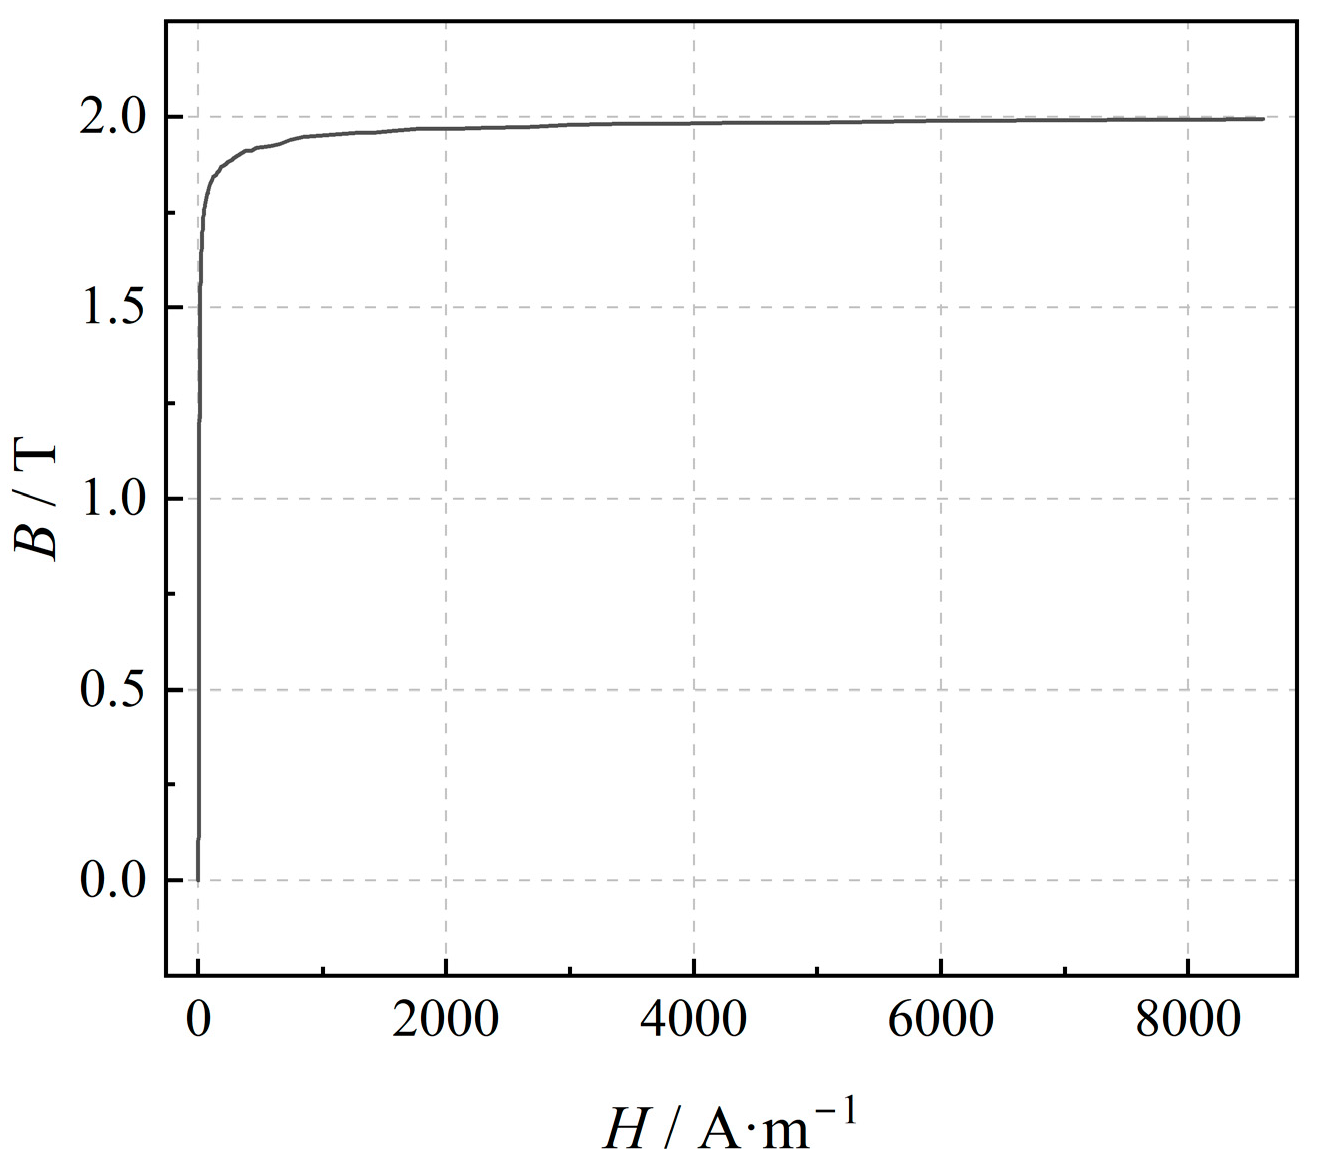
Figure 4 presents the magnetization curve of the silicon steel sheet used in the ASR core, where
B denotes the magnetic flux density and
H denotes the magnetic field strength. The nonlinear magnetic properties of the core material were characterized using the measured
B-
H curve. The curve data were imported into COMSOL Multiphysics and implemented through linear interpolation to describe the magnetic saturation behavior of the silicon steel during the simulation process. In calculating the magnetostrictive strain, the saturation magnetostriction coefficient
λs and the saturation magnetization
Ms were set to 2.5 × 10
−5 and 1.6 × 10
6 A/m, respectively. The mechanical parameters of each component are listed in
Table 1.
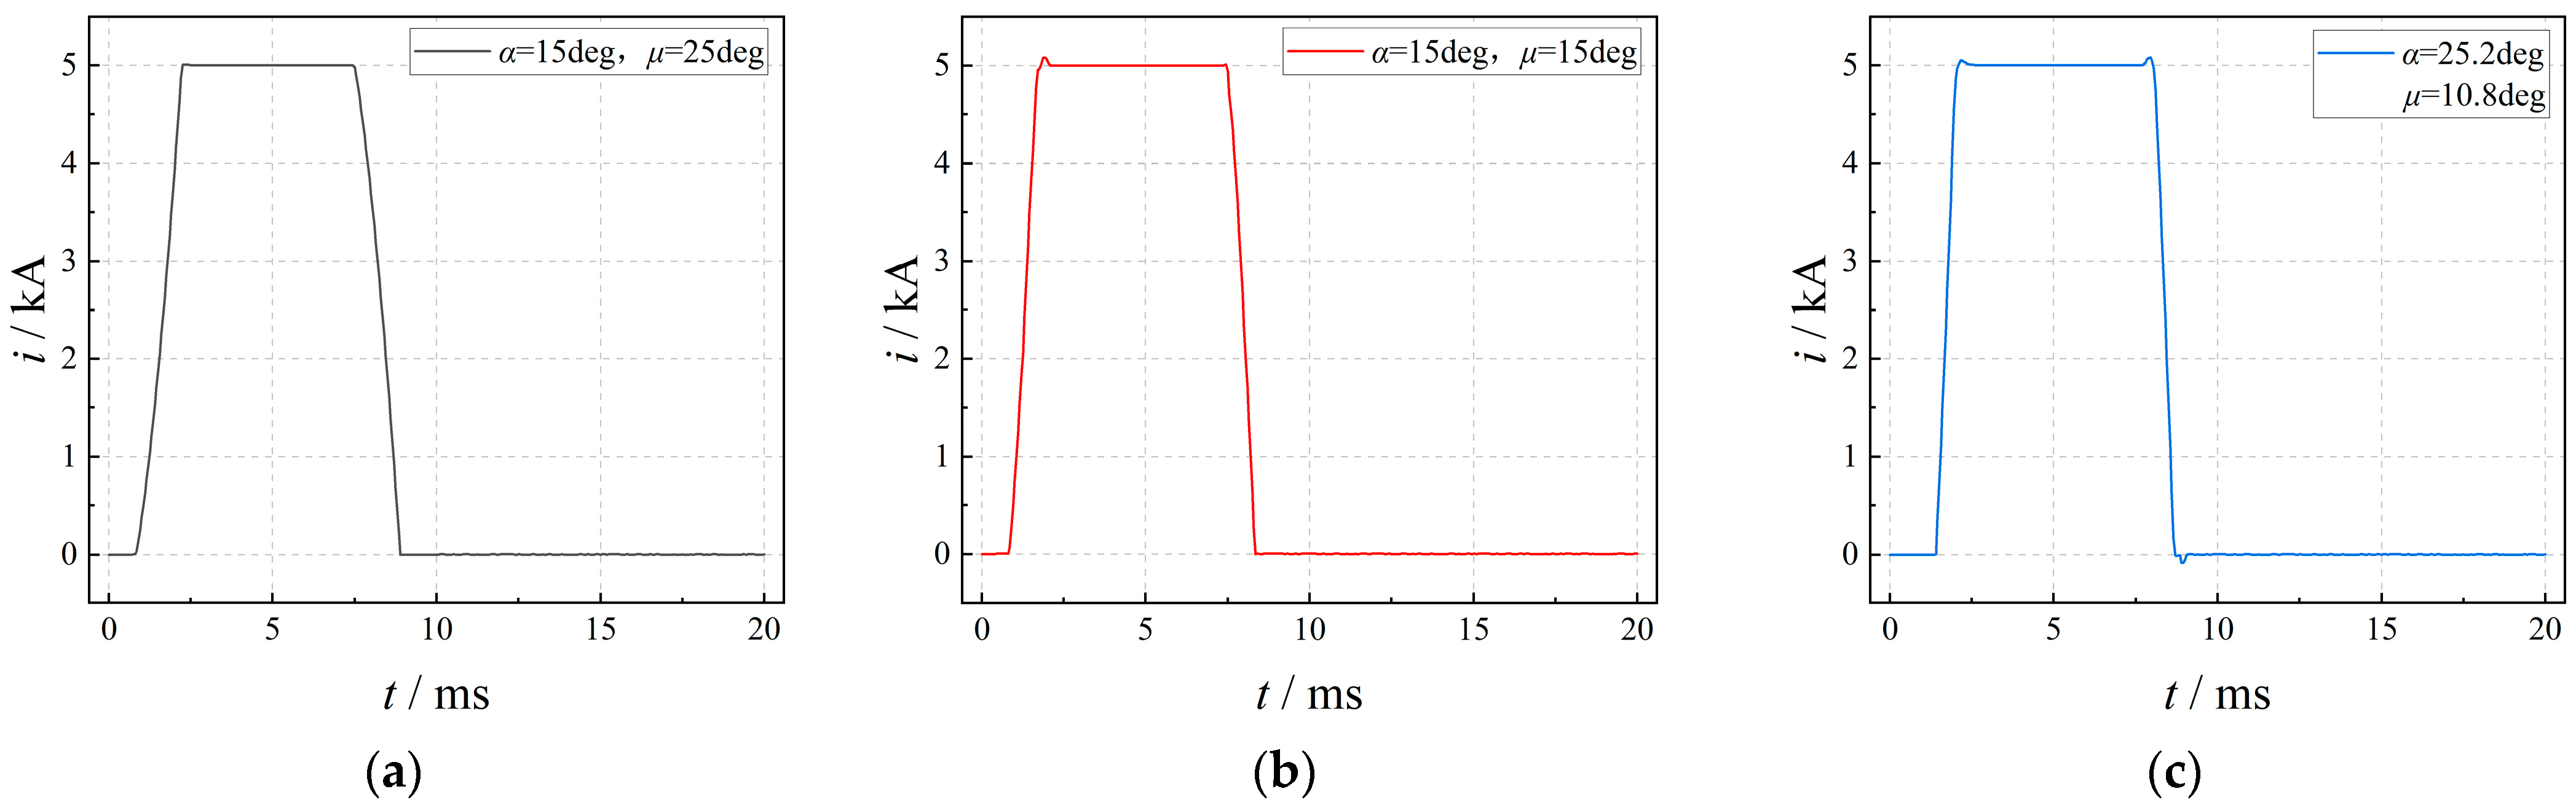
In the simulation, a pulsed current excitation with an amplitude of 5 kA and a duty cycle of 1/3 was applied. Three operating conditions were constructed by adjusting the thyristor firing angle
α and the commutation angle
μ: Condition 1 (
α = 15°,
μ = 25°), Condition 2 (
α = 15°,
μ = 15°), and Condition 3 (
α = 25.2°,
μ = 10.8°). The corresponding current waveforms are shown in
Figure 5, where
i denotes the instantaneous current of the saturable reactor. The rise time
tr, fall time
tf, and corresponding current variation rate (d
i/d
t) under each operating condition are summarized in
Table 2.
2.2.3. Mesh Generation and Load Application
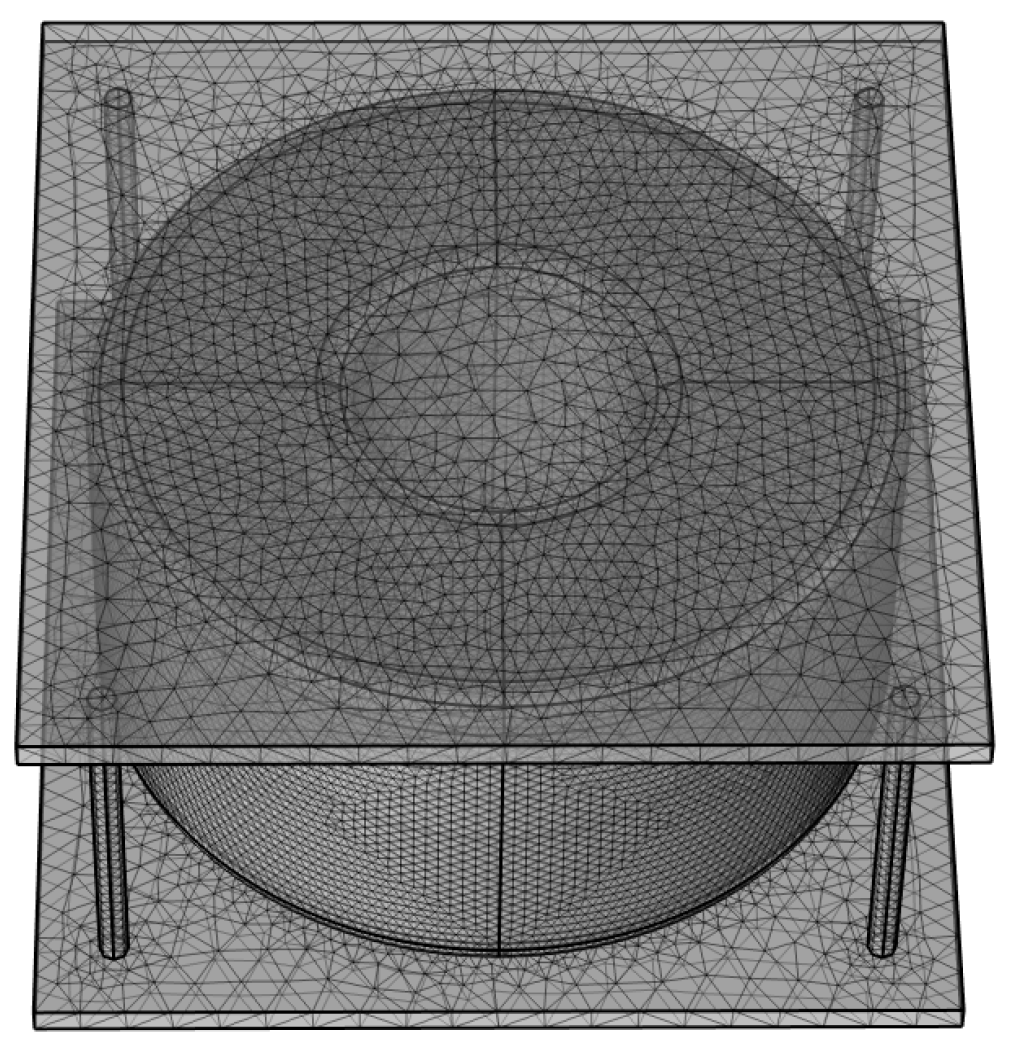
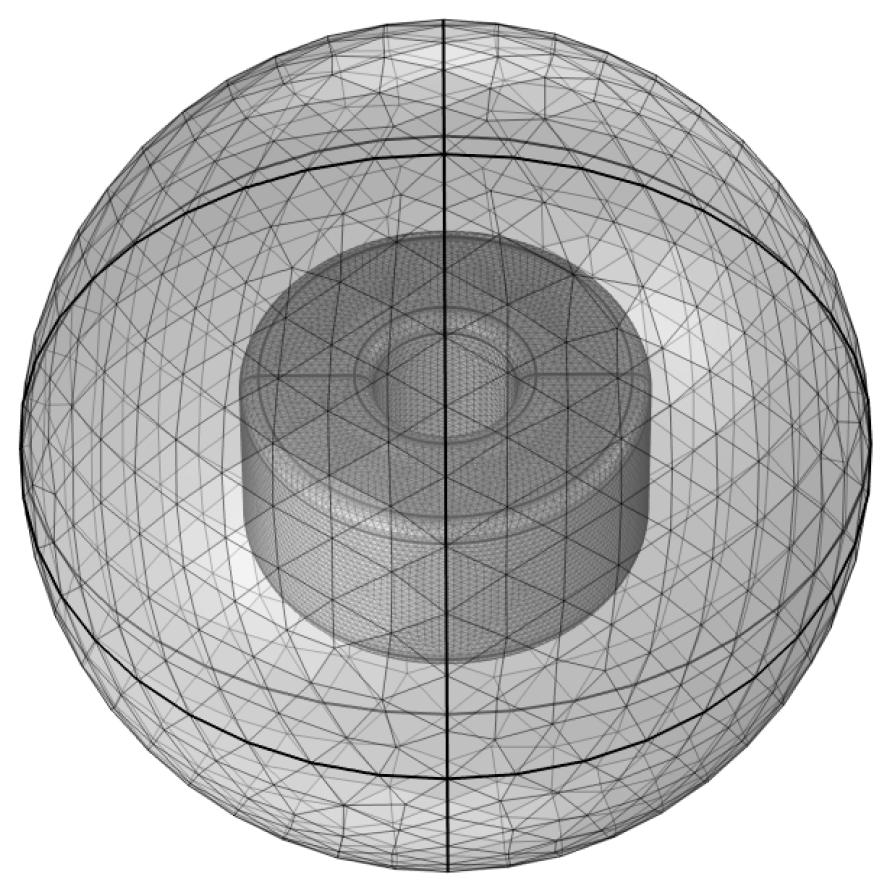
A zone-based meshing strategy was adopted in this study. Free tetrahedral elements were employed throughout the model. In regions subject to large electromagnetic field gradients and stress concentration, such as the iron core, air gaps, and the thin layer, a finer mesh was applied to improve the computational accuracy of the electromagnetic and structural fields. For the windings, the potting materials, and large-volume structures located away from the primary vibration region, a relatively coarser mesh was used. This strategy effectively reduces the number of mesh elements and the associated computational cost while maintaining solution accuracy, thereby improving the computational efficiency of the multiphysics coupling simulation. The resulting mesh of the model is shown in
Figure 6. The complete mesh after partitioning comprises 659,017 domain elements, 150,292 boundary elements, and 14,017 edge elements.
Considering that the vibration displacement amplitude of the iron core under normal operating conditions is extremely small and does not cause significant changes in the air gap, the equivalent length of the magnetic circuit, or the magnetic flux distribution, a one-way coupling method was adopted in this paper for vibration analysis. Specifically, the instantaneous spatiotemporal distribution of the magnetic field within the ASR over one vibration period was first obtained from the electromagnetic physics interface. Based on this magnetic field solution, both the magnetostrictive strain of the core and the Maxwell electromagnetic force were calculated. The magnetostrictive strain was then introduced into the solid mechanics interface as a prestrain, while the Maxwell electromagnetic force was transferred to the solid mechanics interface using the General Extrusion operator in COMSOL Multiphysics. The vibration response of the ASR was subsequently calculated within the solid mechanics model [
8]. This approach effectively reduces computational complexity while ensuring calculation accuracy. The simulation time step was set to 5 × 10
−5 s, with a total duration of 0.02 s (one power-frequency cycle). The lowest point on the outer side of the central core was selected as the reference measurement point for the structural vibration response.
2.3. Vibration Characteristics Under Normal Operating Conditions
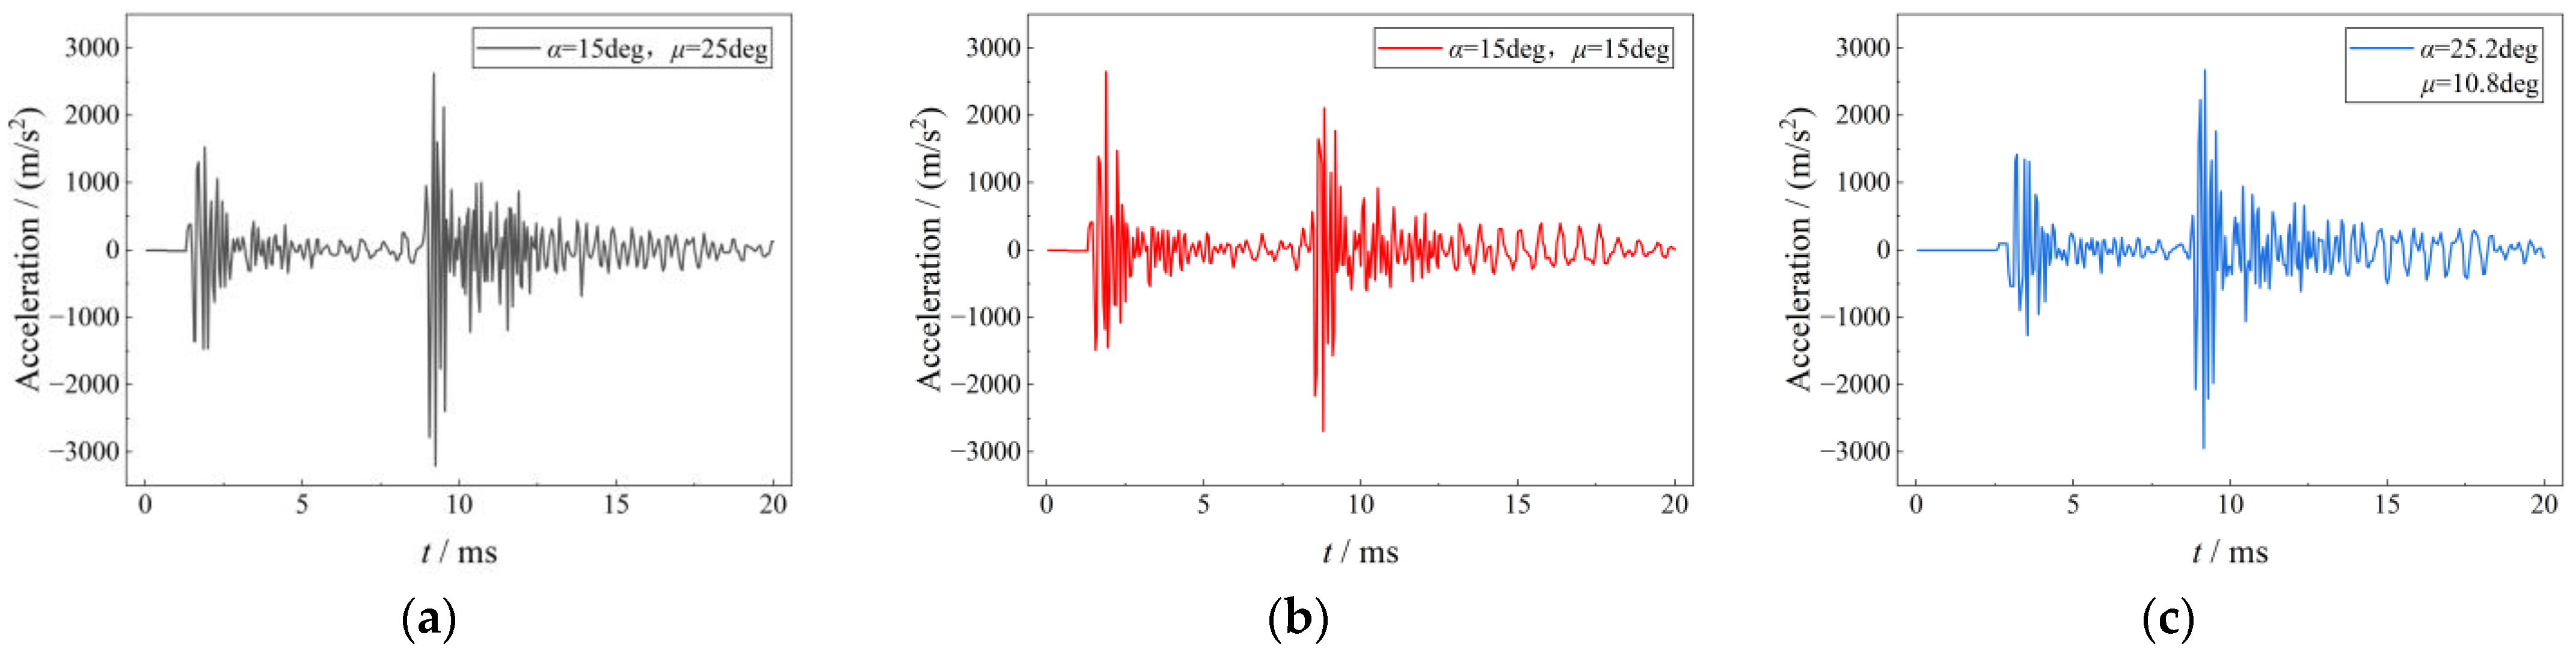
Figure 7 presents the vibration characteristics of the ASR under three operating conditions. The results indicate that the core vibration exhibits a pronounced dual-peak feature under all three conditions. The first vibration peak corresponds to the rapid establishment of magnetic flux density during the current rise phase, at which point the magnetostrictive effect and Maxwell electromagnetic forces are simultaneously enhanced, thereby inducing transient deformation of the iron core. The second vibration peak corresponds to the current decline phase. During the current decline phase, a larger d
i/d
t is present and the core has already entered magnetic saturation, resulting in more intense variations in electromagnetic forces. Consequently, the peak value of the second vibration peak is higher than that of the first. After the current returns to zero, the excitation source disappears and the structure enters a free decay vibration phase, gradually stabilizing under the combined effects of material damping and structural constraints.
2.4. Vibration Characteristics Under Loose Core Conditions
During the long-term operation of ASRs, the fastening structure is continuously subjected to periodic electromagnetic stress. Taking the operating condition of
α = 15°,
μ = 15° as an example, as shown in
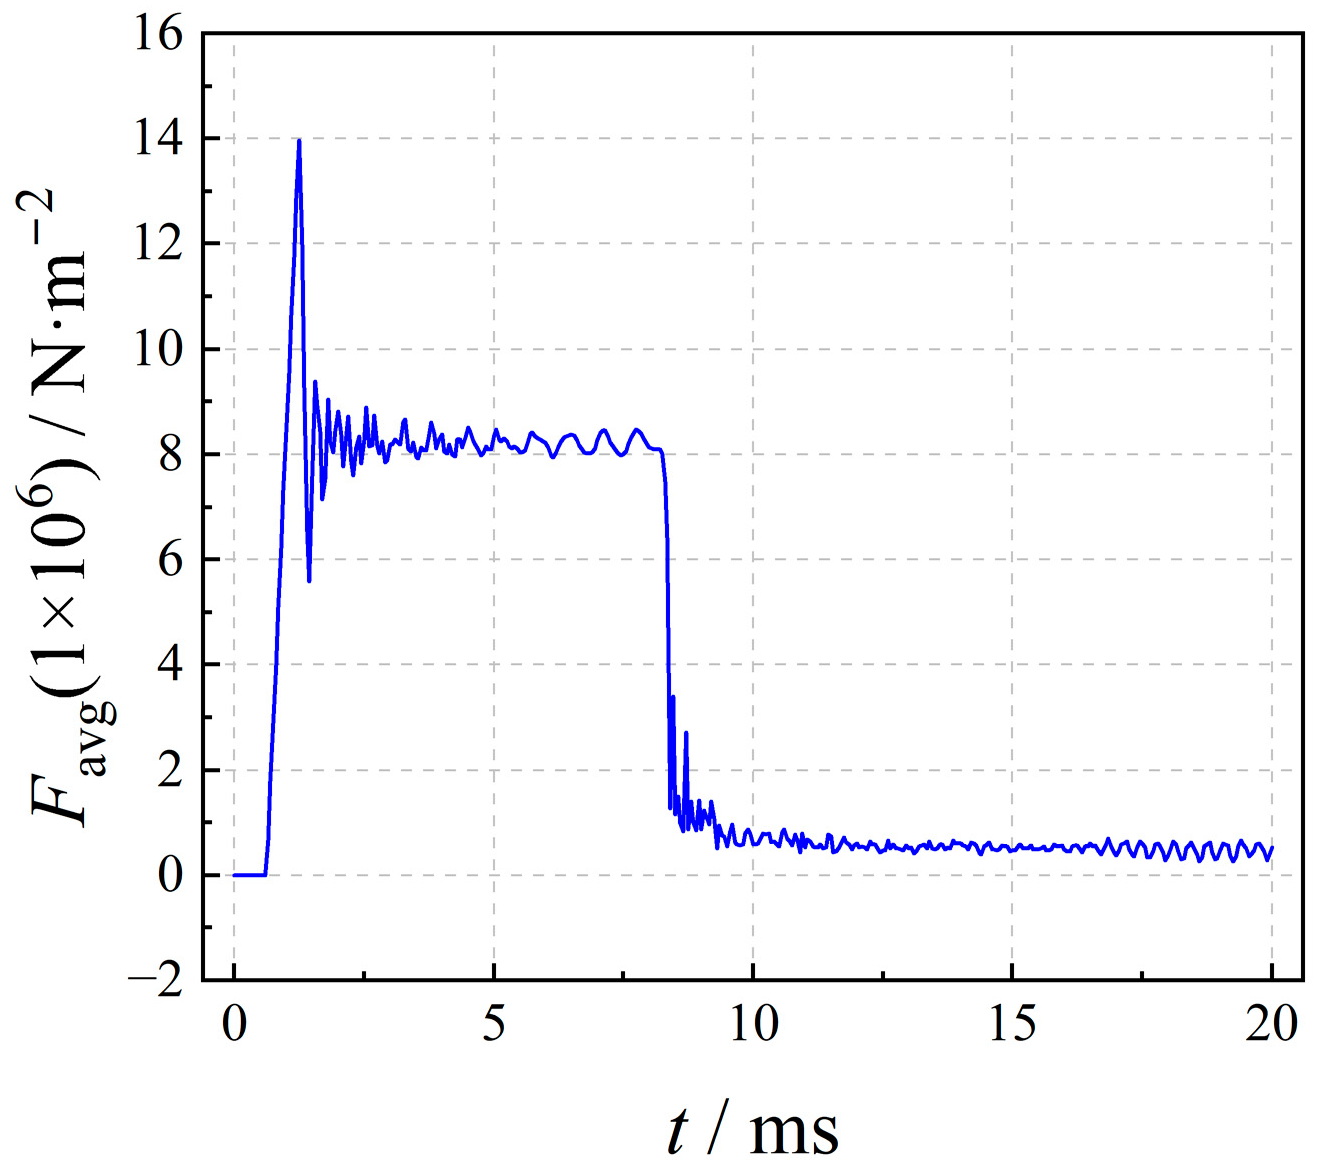
Figure 8, the average stress peak of the clamping band (
Favg) within one operating period can reach 1.4 × 10
7 N/m
2. Under prolonged alternating stress, the preload of the fastening bolts may gradually attenuate, further leading to localized core looseness.
When the fastening bolts become loose, the preload acting on the core decreases. According to the generalized Hooke’s law, stress and strain satisfy a linear relationship, so the change in strain caused by the change in stress can be equivalently represented as a change in the Young’s modulus. Therefore, in the simulation model, the equivalent Young’s modulus of the core was adjusted to reflect the variation in preload, thereby characterizing different degrees of looseness fault [
7].
In the formula, σ—stress; ε—strain; E—Young’s modulus.
In the simulation, different degrees of looseness were modeled by reducing the equivalent Young’s modulus of the core, with the corresponding relationships given in
Table 3 [
7,
8]. Considering that the probability of two or more pairs of cores loosening simultaneously in actual operation is extremely low, only the Young’s modulus of a single pair of cores was varied in the simulation, with all excitations taken under the condition of
α = 15°,
μ = 15°.
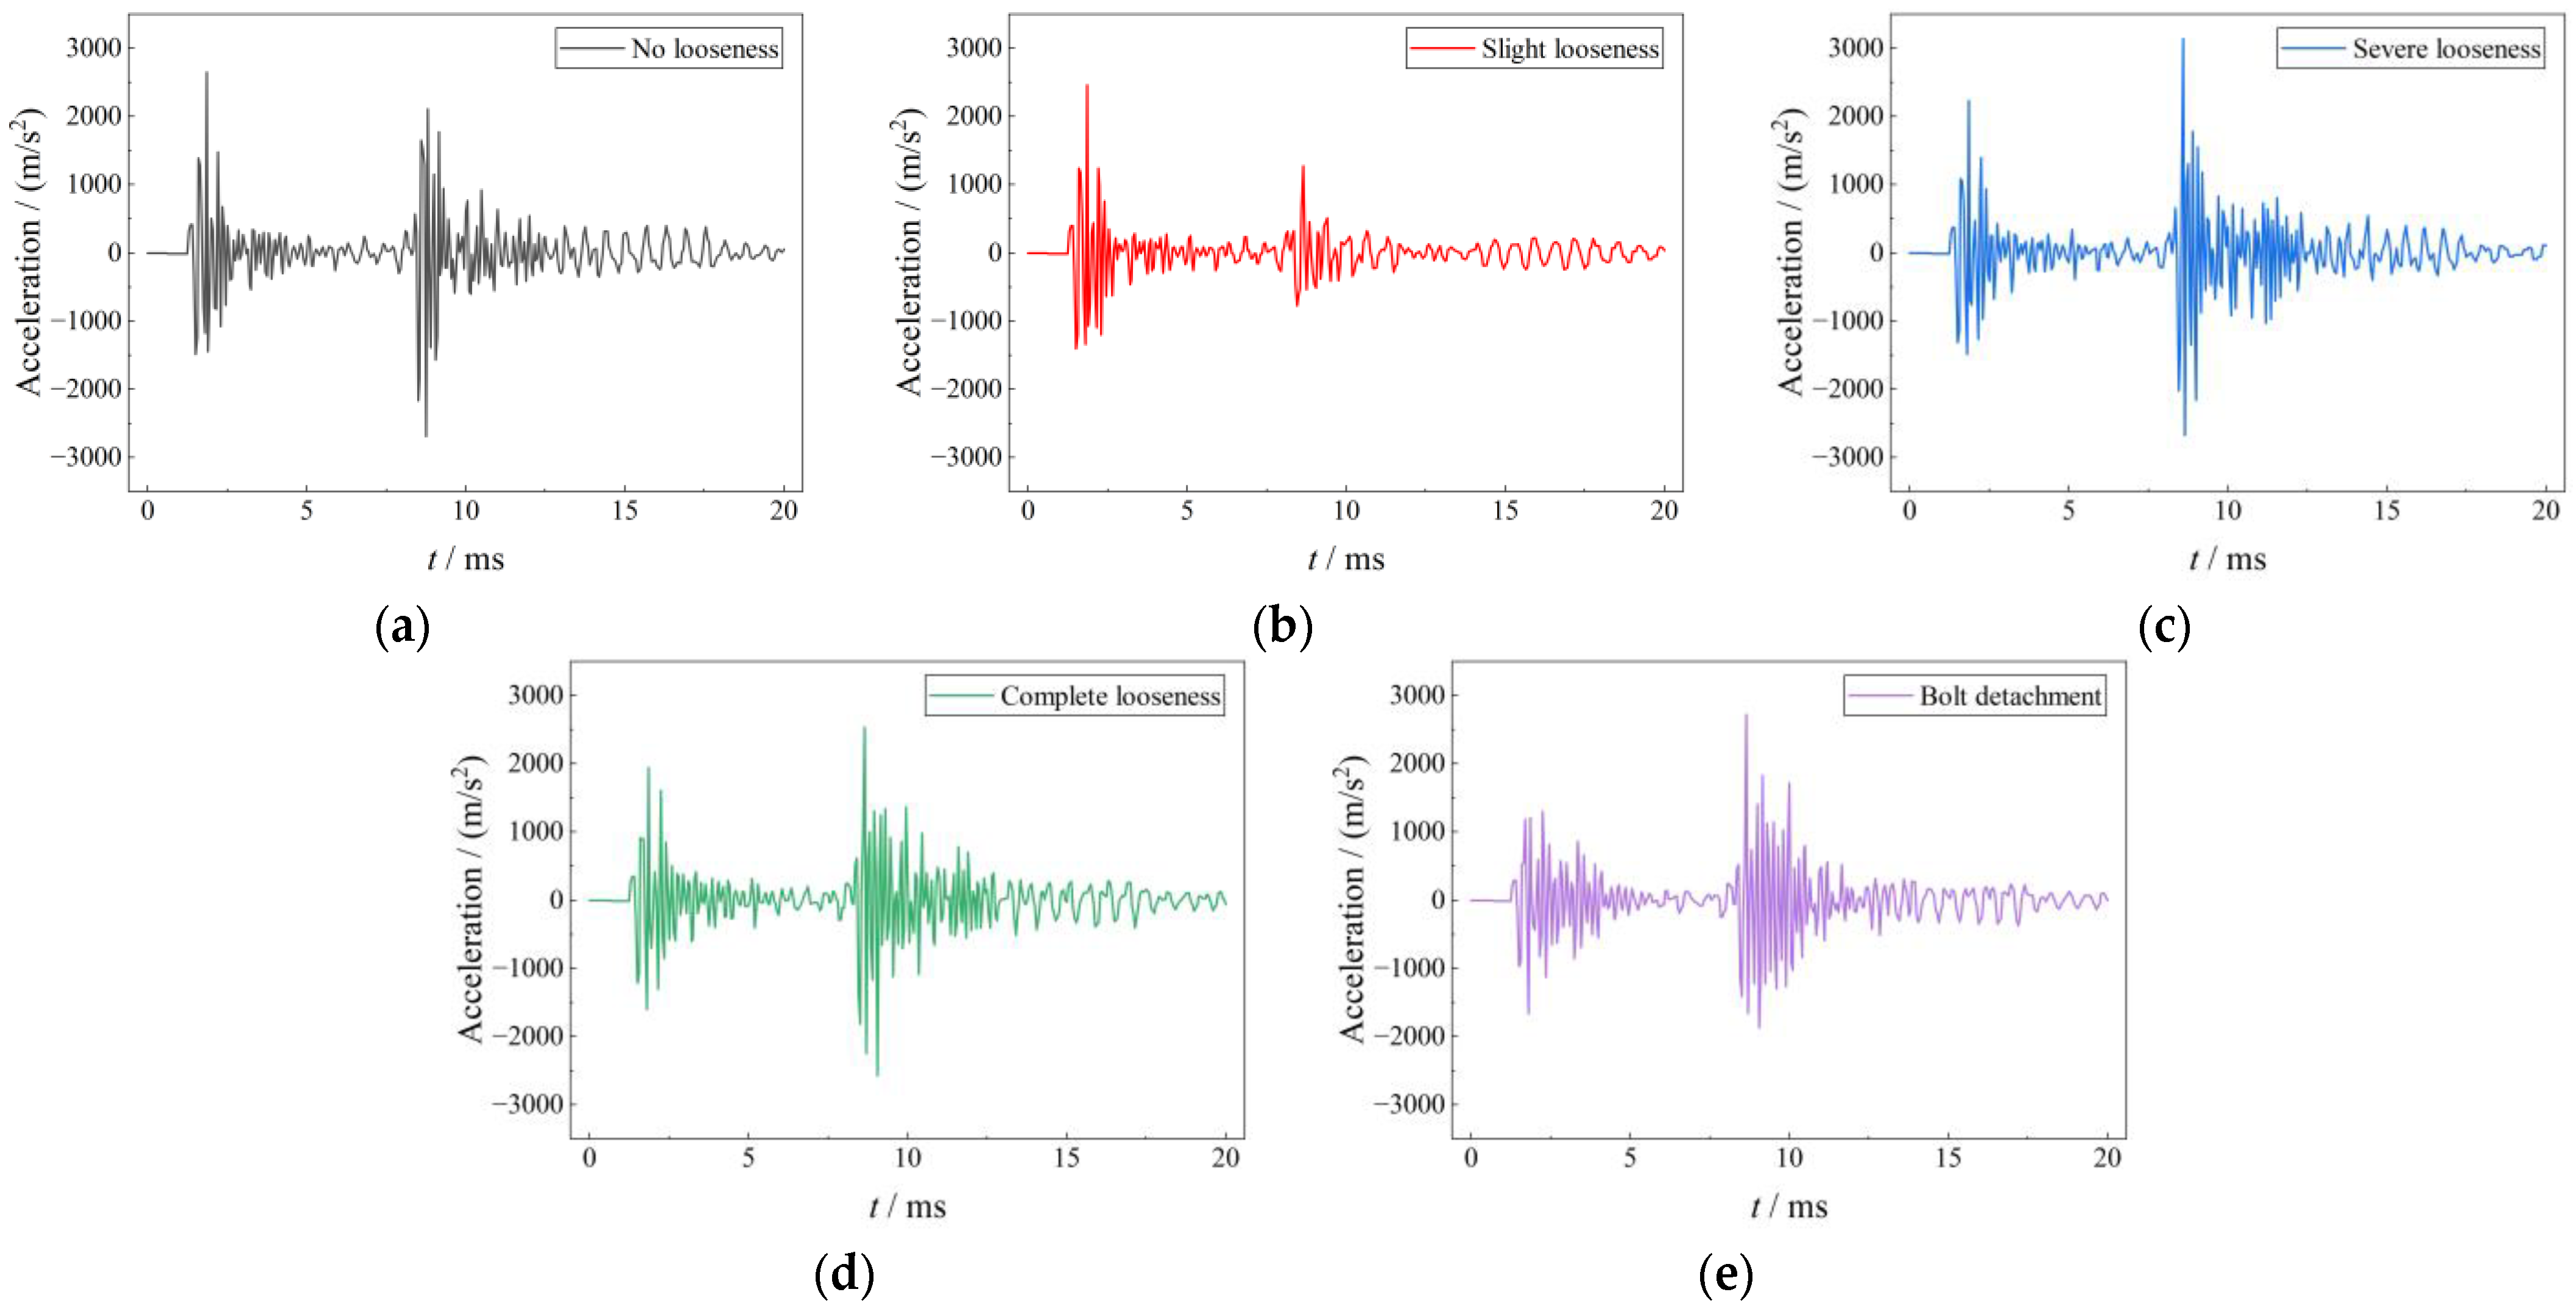
Figure 9 presents the vibration characteristics of the core under different degrees of looseness. As the Young’s modulus decreases, two types of trends are observed in the vibration response. The first vibration peak decreases with decreasing Young’s modulus, and the observed trend is consistent with the experimental findings reported in Ref. [
7]. This is attributed to the fact that the intrinsic magnetostrictive strain remains essentially unchanged, while the stress generated under a lower Young’s modulus is reduced, resulting in a corresponding decrease in vibration amplitude. The variation pattern of the second vibration peak is less pronounced, which is presumed to be due to the vibration response at this stage being more significantly influenced by the modal characteristics of the core.
When the Young’s modulus is reduced to 100 GPa, a pronounced slow-decay characteristic appears in the vibration response, manifested as a significant increase in the duration of residual vibration and a notable reduction in the vibration decay rate. This phenomenon indicates that under conditions of severely insufficient fastening prestress, both the overall structural stiffness and the damping dissipation capacity are degraded, making it difficult for the vibration energy generated by electromagnetic excitation to dissipate rapidly. The energy continues to propagate among the core laminations and contact interfaces. Prolonged exposure to this state may further aggravate the accumulation of structural fatigue and damage to air gap spacers, increasing the risk of localized failure.
2.5. Vibration Characteristics Under Polyurethane Hardening
Owing to its enclosed structure, the shell-type ASR exhibits poor heat dissipation, making it prone to the formation of high-temperature regions around the core during operation. Prolonged thermal exposure causes thermal aging of the polyurethane filled around the core, leading to an increase in its Young’s modulus and a transition from an elastic to a hard, brittle state [
29]. As a damping and vibration-absorbing element, the hardening of polyurethane reduces its capacity to absorb and dissipate vibrational energy. This causes vibrational energy to be transmitted more directly through the structure, shifting the vibration behavior of the core from a “well-damped, low-amplitude vibration” to an “underdamped, severe vibration.” Taking the condition of
α = 15°,
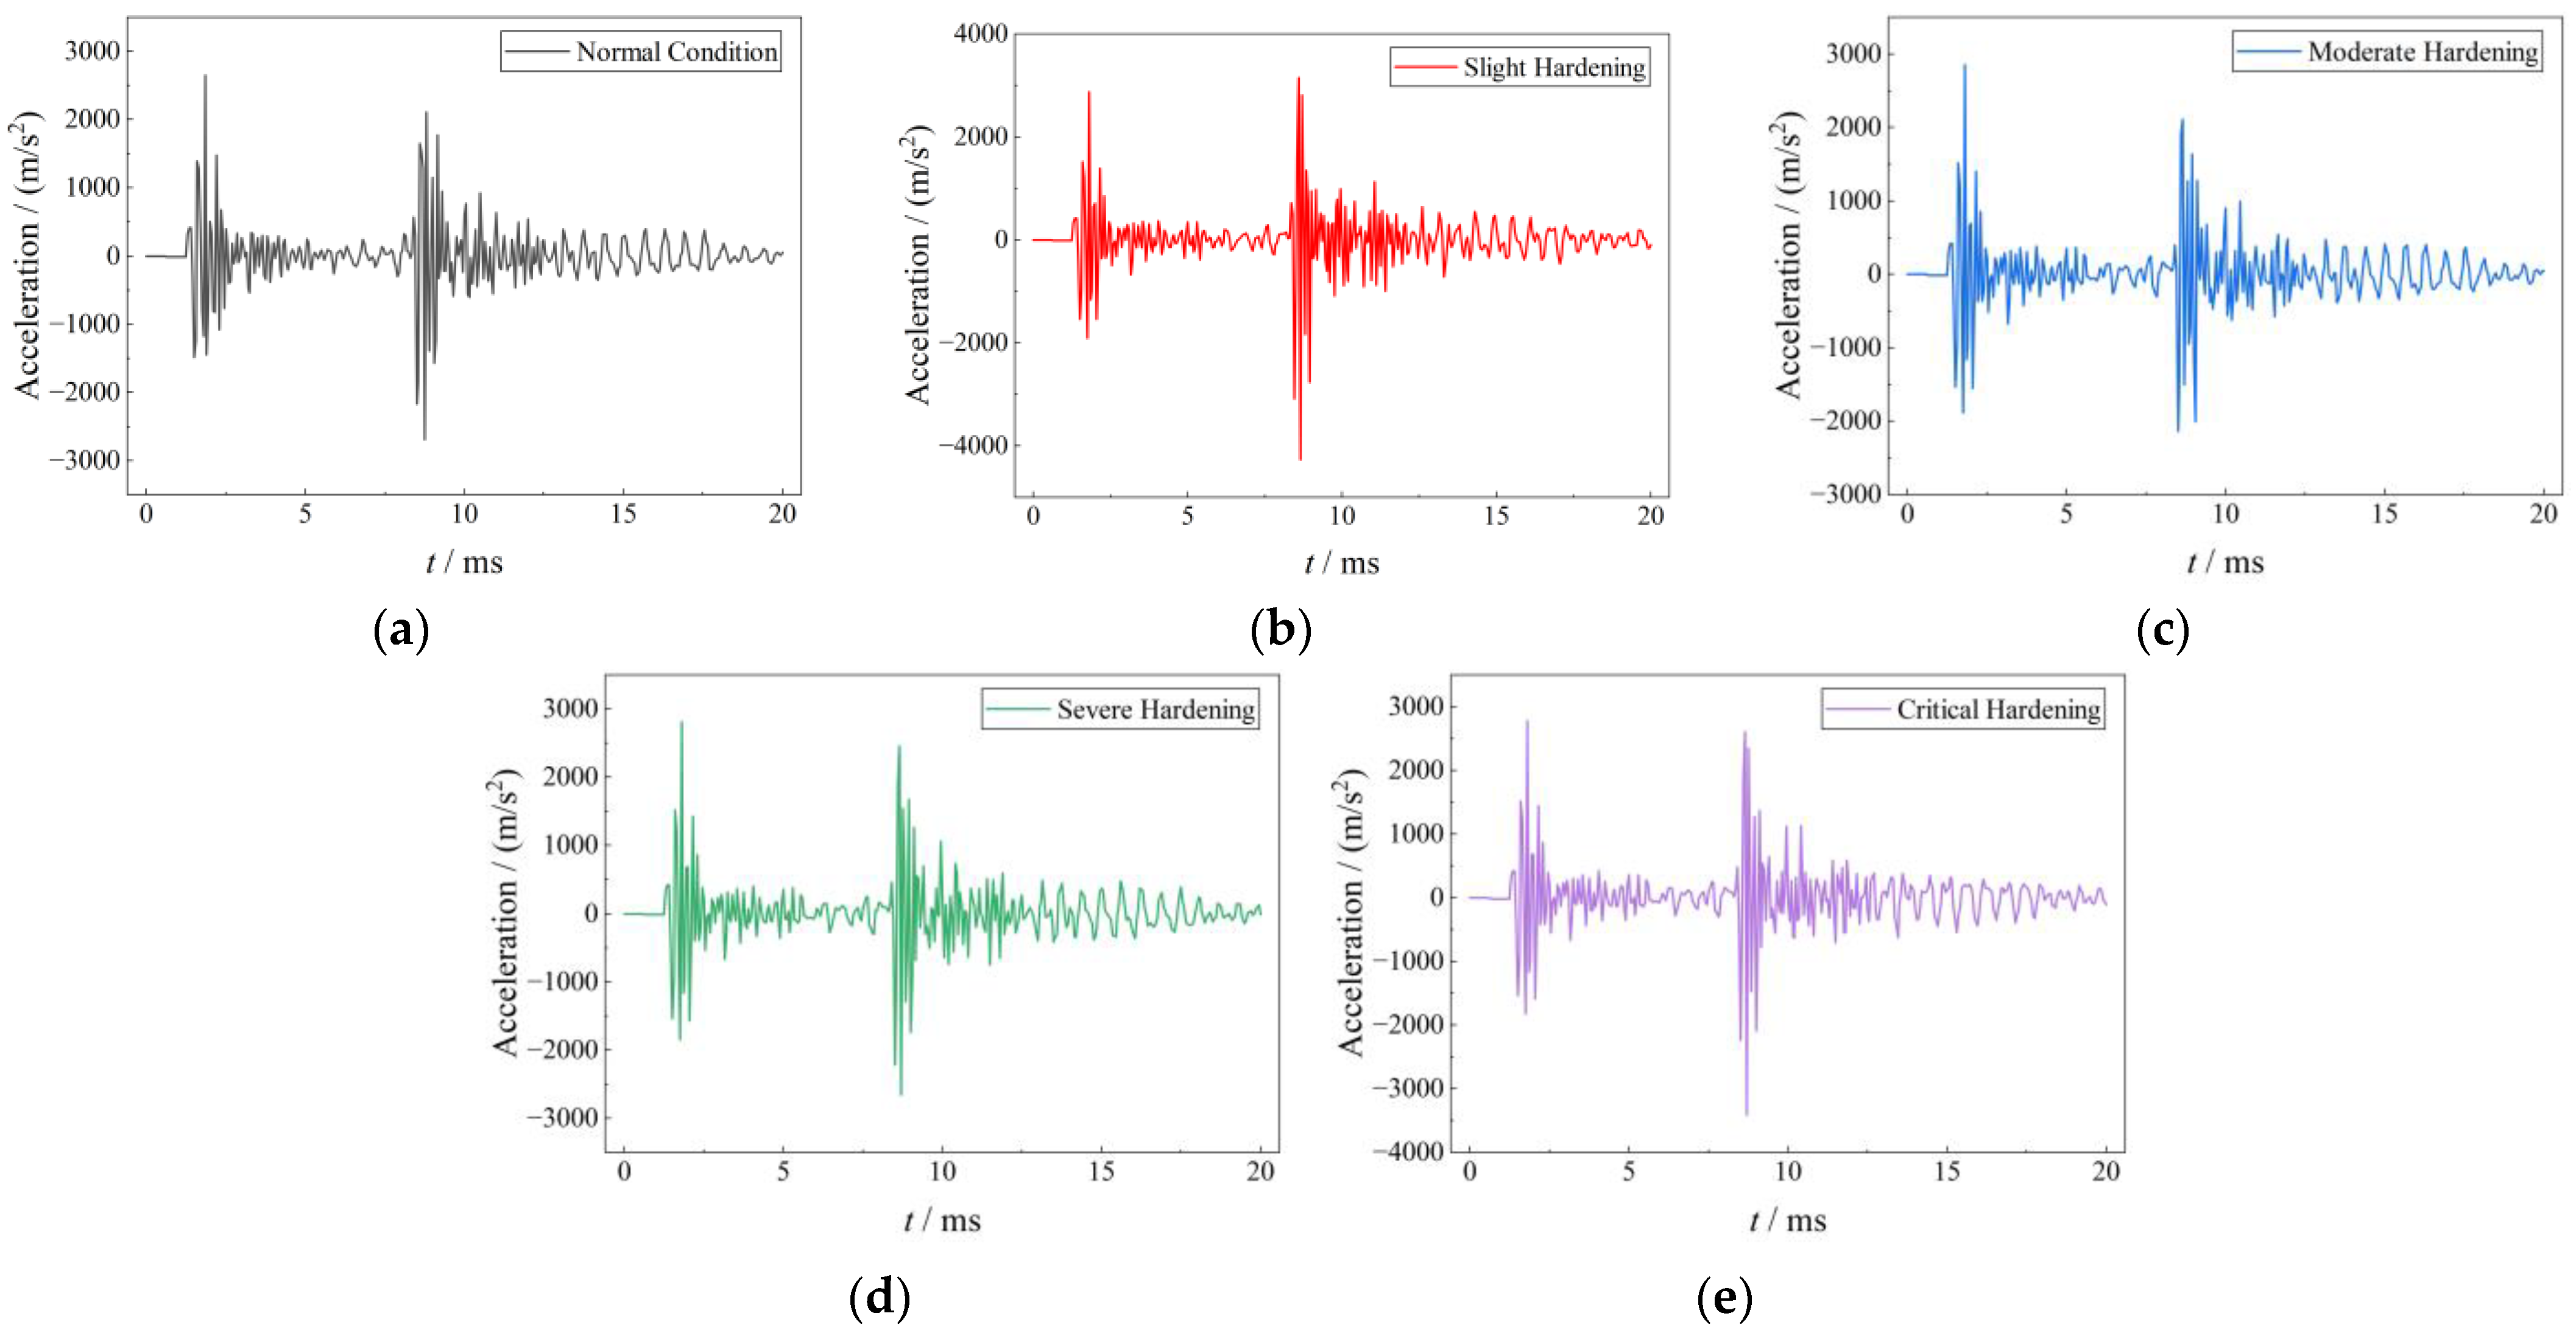
μ = 15° as an example, the effect of polyurethane hardening was analyzed by increasing the Young’s modulus of the polyurethane surrounding five pairs of cores—the central core pair and the two pairs on each side—to 105%, 110%, 120%, and 130% of its original value, corresponding to four hardening states: Slight Hardening, Moderate Hardening, Severe Hardening, and Critical Hardening. Considering the lack of published quantitative data regarding the mechanical property evolution of aged polyurethane in ASRs, the selected stiffness increase levels were used to qualitatively investigate the influence of hardening severity on vibration characteristics.
Figure 10 presents the vibration characteristics of the core under different degrees of polyurethane hardening. As the degree of polyurethane hardening increases, the peak vibration acceleration generally exhibits an increasing trend. Polyurethane serves a structural support and vibration-buffering role within the ASR, and an increase in its elastic modulus significantly reduces its damping capacity, causing the energy storage and release process of the core and fastening components under pulsed electromagnetic excitation to become increasingly rigid, such that vibrational energy is less able to dissipate rapidly through internal material losses. Consequently, the hardening of polyurethane weakens the vibration-damping performance of the system and increases the intensity of vibrational impact experienced by the core and structural components, thereby aggravating the risk of fatigue damage and interfacial cracking.
3. Temperature Rise Characteristics Analysis
As indicated by the analysis in
Section 2, prolonged vibration impact can cause frictional wear of the core air gap spacers (PET insulating spacers), resulting in a gradual reduction in air gap size. A reduction in air gap leads to decreased magnetic reluctance and magnetic flux concentration in the magnetic circuit, which in turn alters the core loss distribution and temperature rise characteristics. In this chapter, air gap reduction is taken as a typical defect mode, and the core loss and temperature rise distribution are compared between the defect-free condition and the defective condition, so as to evaluate the capability of thermal signals in characterizing defects.
3.1. Heat Sources and Heat Dissipation Pathways
During operation, ASRs used in converter valves are subjected to large pulsed current excitation over extended periods, which generates significant electromagnetic losses internally and further causes temperature rise. The heat sources primarily consist of two components: winding copper losses and core losses. Winding losses originate from the Joule heat generated by conductor resistance, and their magnitude depends mainly on the operating current and conductor resistance, which can be calculated by the following formula.
In the formula, Idc—direct current transmission current; lw—winding length; σCu—electrical conductivity of the winding material; Sw—cross-sectional area of the winding; μ—commutation angle; PCu—winding copper losses.
Compared to winding losses, the formation mechanism of core losses is considerably more complex. Under the action of an alternating magnetic field, the magnetic domains within ferromagnetic materials undergo continuous reversal and movement, giving rise to hysteresis losses, eddy current losses, and anomalous losses. Among these, hysteresis losses originate from the energy dissipation during magnetization reversal; eddy current losses are generated by circulating currents induced within the core by the alternating magnetic field; and anomalous losses are associated with microscopic magnetic domain motion and high-frequency harmonic effects. Since the current waveform during actual operation of converter valves exhibits pronounced non-sinusoidal characteristics, core losses display strong transient features and are primarily concentrated during the turn-on and turn-off phases of the converter valve.
Core losses were calculated using the time-domain Bertotti loss separation model, in which the total loss is decomposed into three components: hysteresis loss
ph(
t), classical eddy current loss
pc(
t), and anomalous loss
pe(
t) [
15,
19]. Compared to the traditional Steinmetz empirical formula, the time-domain Bertotti model is better capable of capturing the transient loss characteristics caused by rapid variations in magnetic flux density under non-sinusoidal excitation conditions, and is therefore more suitable for loss analysis of ASRs used in converter valves. In the calculation, the parameter
γ was taken as 2, and the three parameters
kh,
kc and
ke were taken as 80.690, 0.036, and 1.758 W·m
−3 [
19].
In the formula, kh, kc, ke, γ—loss coefficients related to material and structure/(W·m−3); Bm—peak magnetic flux density; B(t)—instantaneous magnetic flux density; θ—phase angle between B and the irreversible component of the magnetic field Hi in the equivalent elliptical loop method; ph(t)—hysteresis loss; pc(t)—classical eddy current loss; pe(t)—anomalous loss.
Considering that the time required to establish thermal equilibrium is far greater than the time scale of electromagnetic transient processes, directly using millisecond-level instantaneous losses for long-duration temperature rise simulation would result in extremely high computational costs [
15]. Therefore, in this paper, the instantaneous core losses were integrated and the period-averaged core loss was adopted as the equivalent heat source, the expression of which is given as follows, where
ttotal denotes one complete period,
pFe(
t) denotes the instantaneous core loss, and
PFe represents the core loss within one period:
As shown in
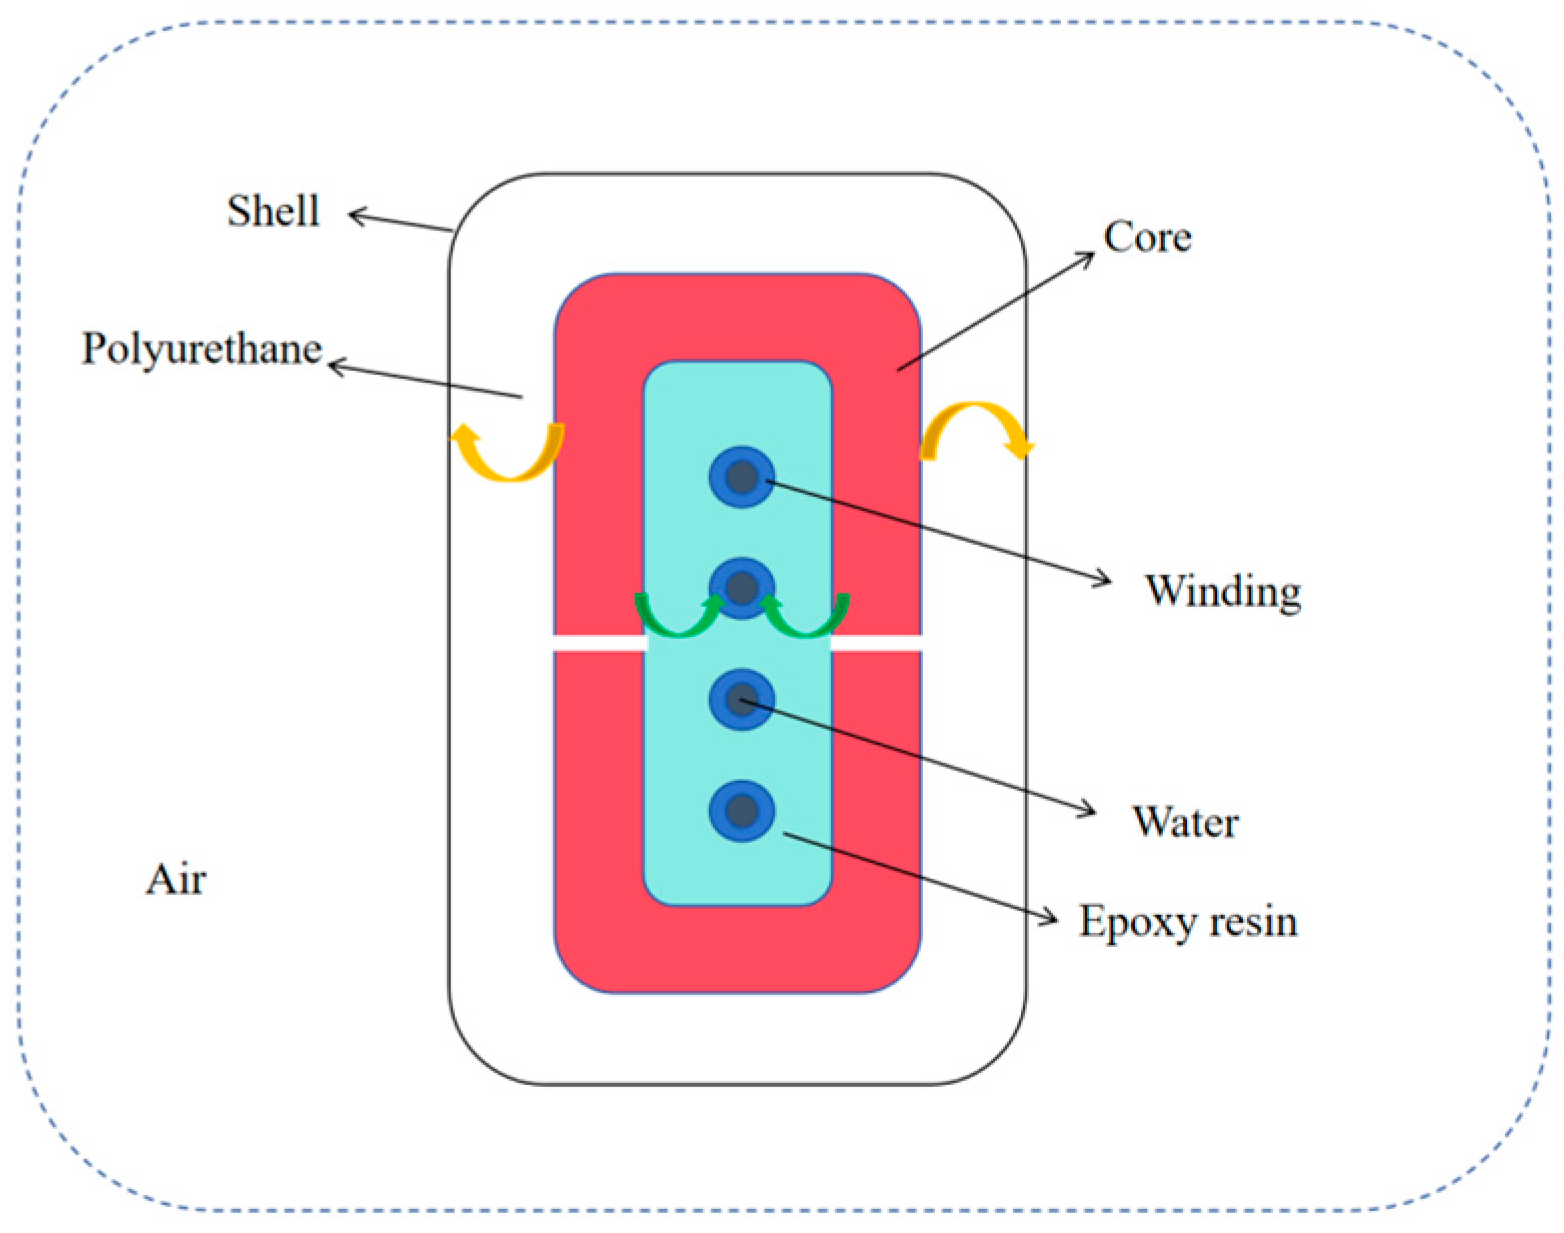
Figure 11, heat generated within the ASR is primarily transferred outward through conduction and convection. The windings adopt a hollow conductor structure, through which cooling water is circulated for forced convective heat dissipation. Therefore, the heat generated by the windings is primarily carried away by the cooling water. The heat generated by the core is dissipated primarily through two pathways: one portion is conducted through the epoxy resin to the winding region and subsequently carried away by the cooling water; the other portion is transferred through the polyurethane to the shell, and is further dissipated to the surrounding environment through natural convective heat transfer with air. Due to the relatively low thermal conductivity of epoxy resin and polyurethane, heat tends to accumulate in the core region, particularly at the central position, leading to the formation of localized high-temperature hot spots. Therefore, the spatial arrangement of the core and the thermal conductivity of the insulating filling materials have a significant influence on the temperature rise distribution of the ASR.
3.2. Model Establishment
A temperature field model was established using the finite element software COMSOL Multiphysics. The overall structure is consistent with the vibration simulation model in
Section 2, comprising components including the core, windings, epoxy resin, polyurethane, and shell, with hollow water-cooling channels arranged inside the windings to simulate the cooling process during actual operation. The thermal property parameters of each material are listed in
Table 4.
In the temperature field model, the effects of winding copper losses, core losses, and cooling water heat dissipation on temperature rise were primarily considered. Winding heat sources and core heat sources were set up respectively to simulate the temperature rise of the ASR under three operating conditions: Condition 1 (α = 15°, μ = 25°), Condition 2 (α = 15°, μ = 15°), and Condition 3 (α = 25.2°, μ = 10.8°). Specifically, a pulsed current excitation with an amplitude of 5 kA and a duty cycle of 1/3 was applied to the windings to construct the instantaneous electromagnetic field distribution. The winding losses and core losses under the corresponding operating conditions were calculated based on the spatiotemporal distribution of the electromagnetic field, and subsequently incorporated into the temperature field to compute the temperature distribution of the ASR.
The winding heat source was calculated according to Equation (2). Considering that the resistivity of the copper conductor varies with temperature, the electrical conductivity of copper was further set to vary dynamically with temperature in the simulation, the expression of which is as follows:
In the formula, σCu—electrical conductivity of the winding material; T—winding temperature.
The core heat source adopted the period-averaged loss calculated using the time-domain Bertotti loss separation model described previously. The specific calculation method was based on the instantaneous magnetic field variations within the core, and the calculation procedure is detailed in
Section 3.1. The cooling water heat dissipation was simulated using the equivalent negative heat source method [
15], and the cooling parameters were selected according to the actual operating conditions of the ASR, the expression of which is as follows:
In the formula, Qw—thermal power of water during flow/W; dM/dt—mass flow rate of water/kg·s−1, taken as 0.83 kg/s; Tin, Tw—inlet temperature and real-time temperature of the cooling water respectively/°C, with the cooling water inlet temperature set to 42 °C; Vw—volume of water within the water pipe/m3; Cpw—specific heat capacity of water/J·(kg·K)−1.
In the simulation, a natural convective boundary condition for air was applied to the outer surface of the ASR shell to simulate the heat dissipation process between the equipment and the surrounding environment. The ambient temperature was set to 25 °C, and the convective heat transfer coefficient was taken as 10 W·(m2·K)−1. The initial temperature of the model was uniformly set to 20 °C.
For regions with concentrated magnetic flux or heat sources, such as the iron core, windings, and air gaps, a finer mesh was applied to improve the computational accuracy of the electromagnetic and structural fields. For large-volume structures without heat sources, such as the potting materials, a relatively coarser mesh was used. The resulting mesh of the model is shown in
Figure 12. The complete mesh after partitioning comprises 794,754 domain elements, 166,827 boundary elements, and 14,246 edge elements.
The total simulation duration of the temperature field was set to 18 h, with a time step of 0.2 h, so as to analyze the complete temperature variation pattern of the ASR from the initial heating stage to the thermally stable state.
3.3. Temperature Rise Analysis Under Defect-Free Conditions
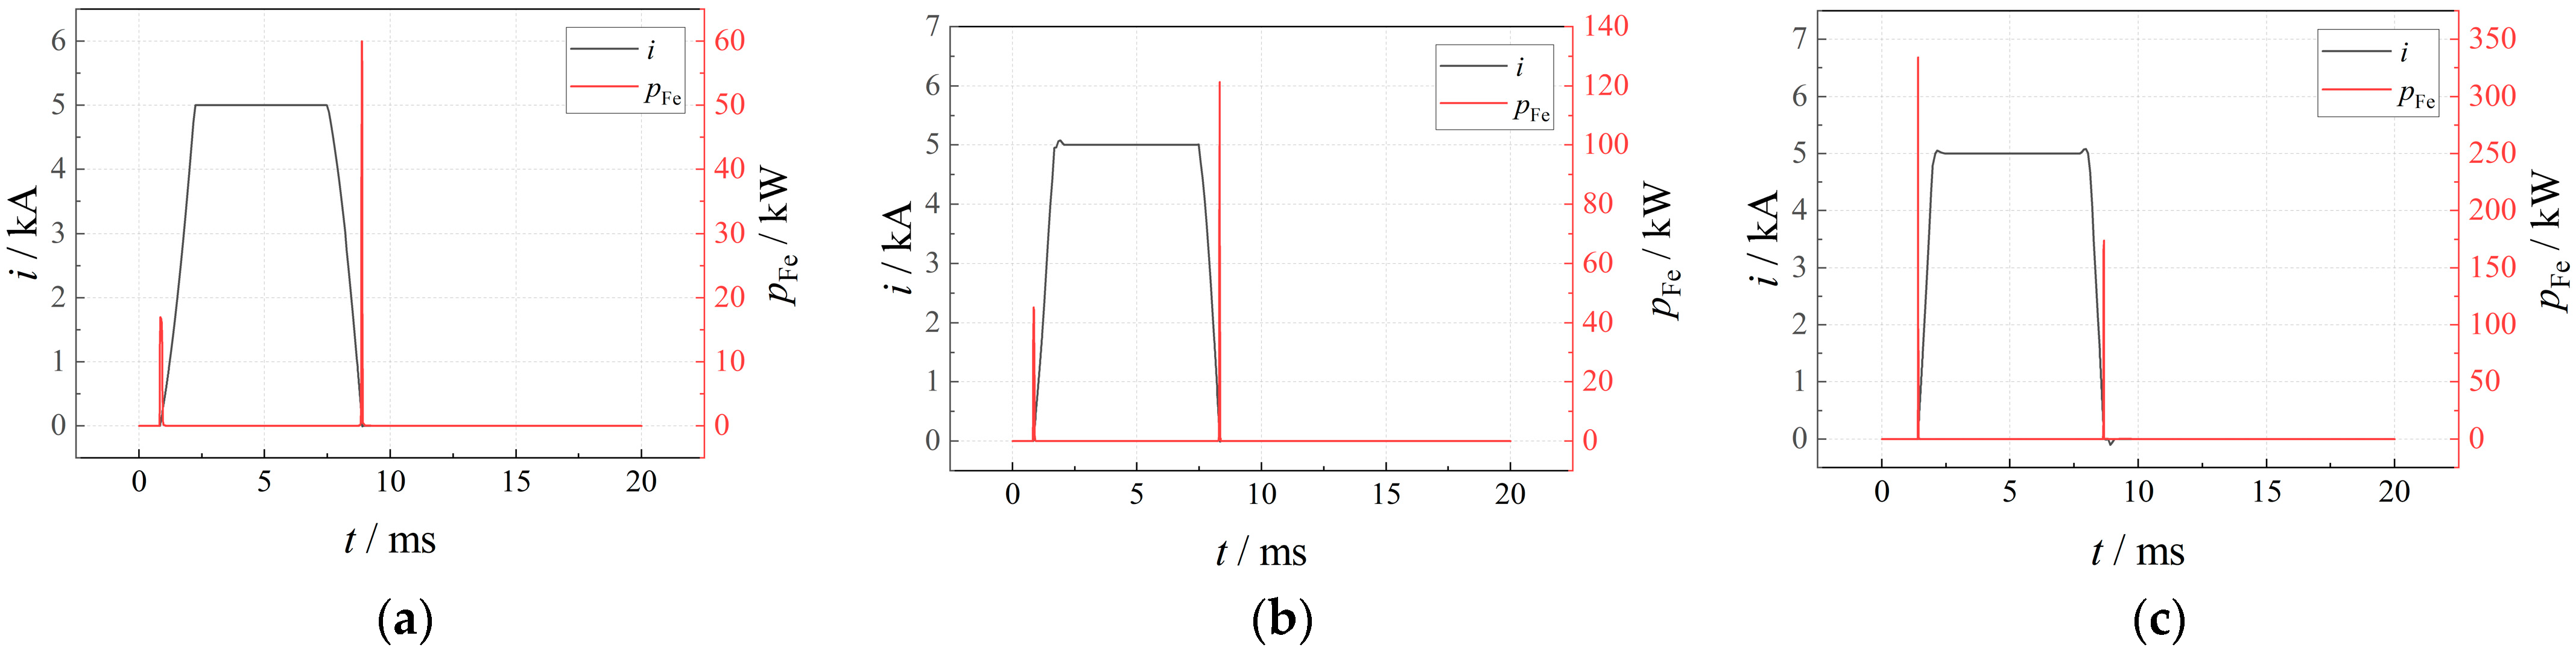
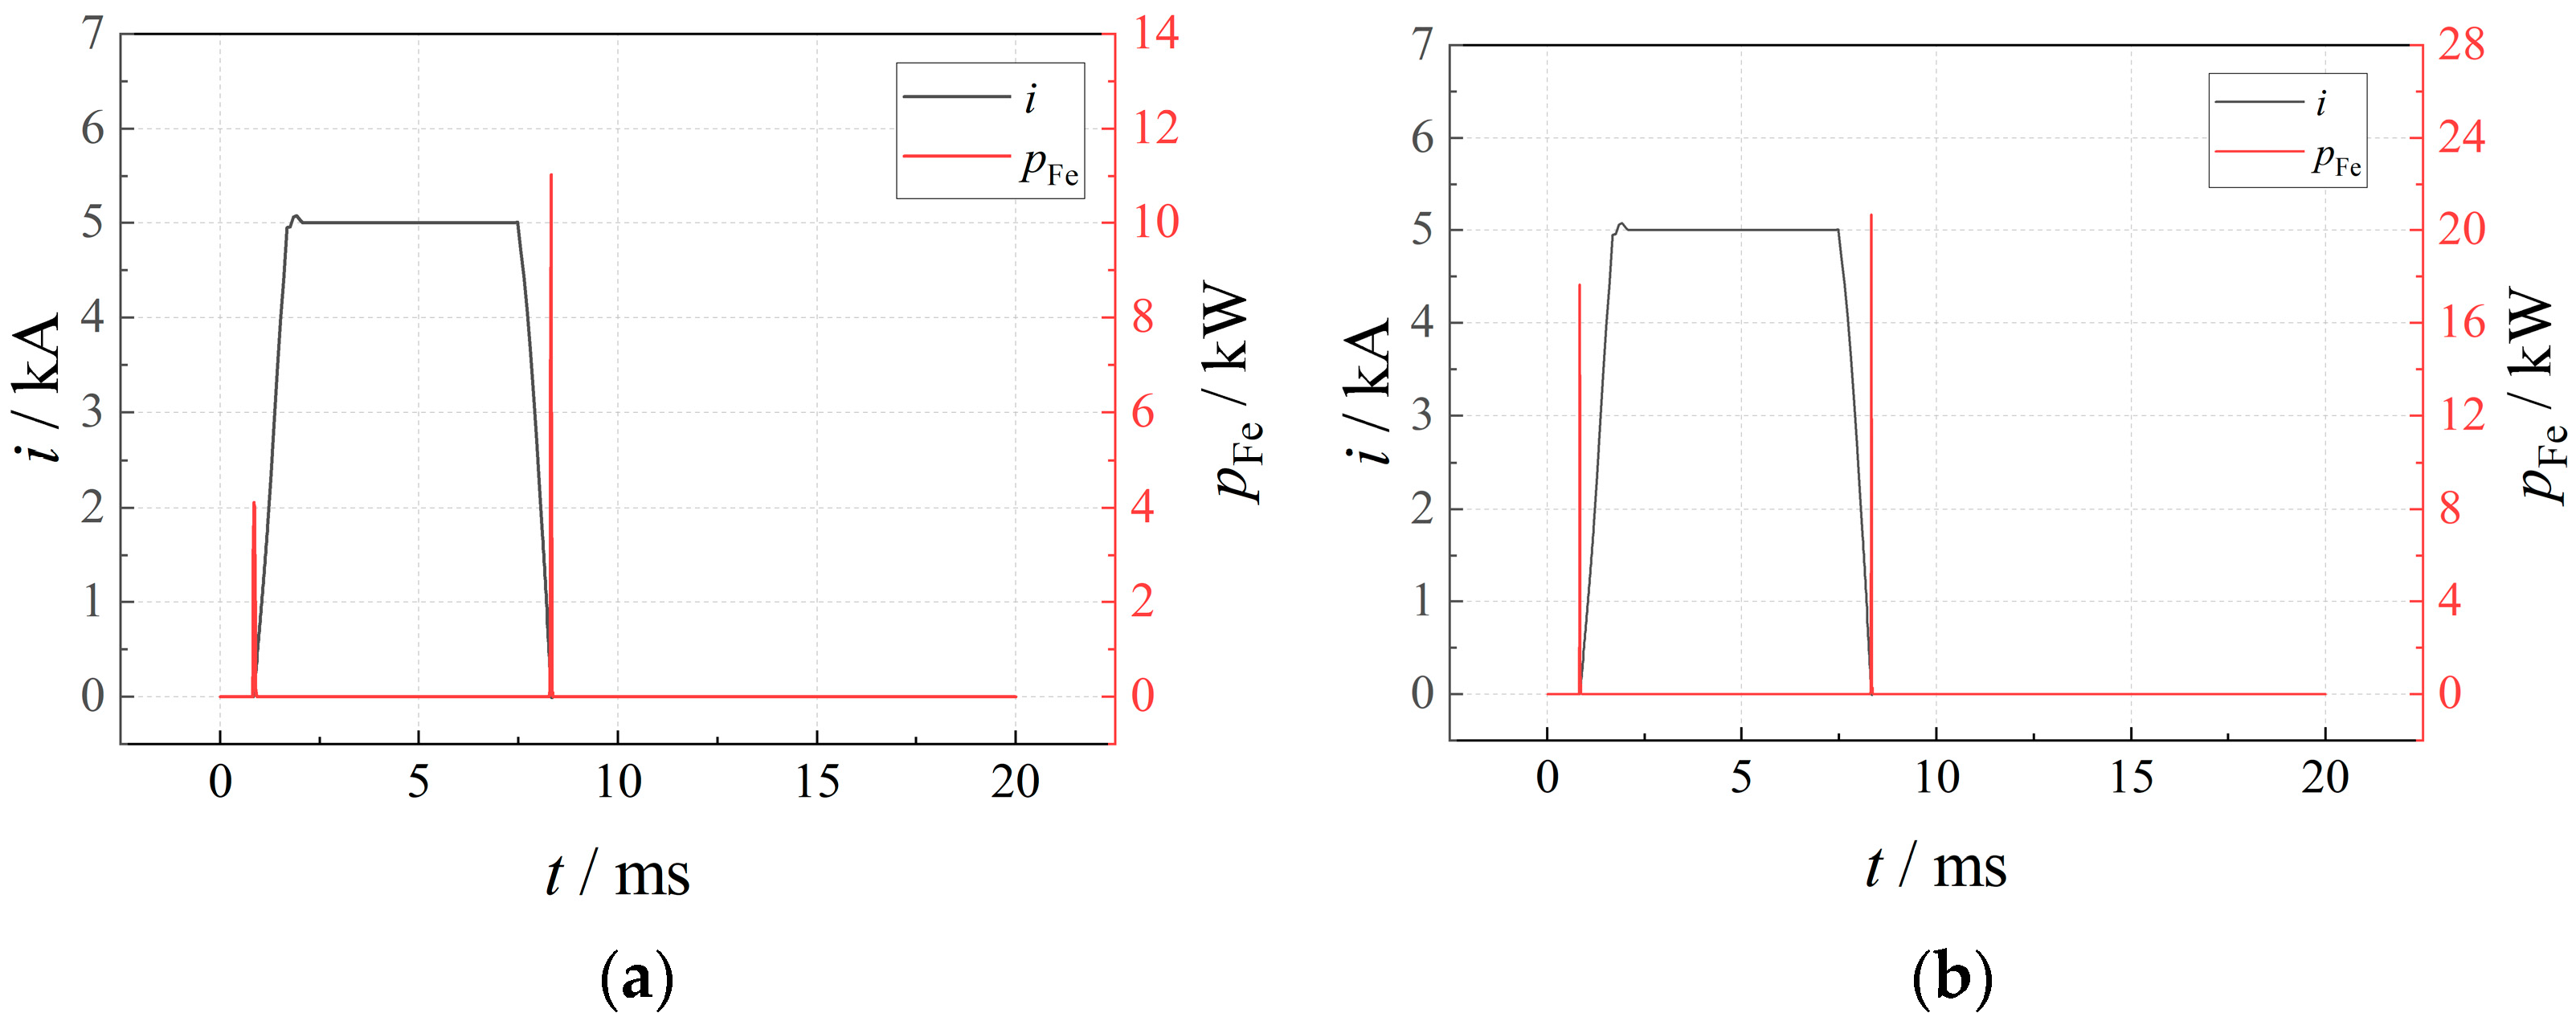
Figure 13 presents the core losses under three operating conditions, where
i denotes the instantaneous current flowing through the ASR windings and
pFe denotes the instantaneous core loss. The results indicate that core losses are primarily concentrated during the turn-on and turn-off phases of the converter valve. This is attributed to the fact that during the rapid variation in current, the magnetic flux density within the core varies drastically with time, leading to significant increases in hysteresis losses, eddy current losses, and anomalous losses. As the commutation angle decreases, the current rise time gradually shortens and the rate of current change increases markedly, resulting in a corresponding rise in the peak instantaneous core loss. Specifically, under the condition of
α = 15°,
μ = 25°, the period-averaged core loss is approximately 220 W; when the commutation angle is reduced to 15°, the average loss increases to 260 W; and under the condition of
α = 25.2°,
μ = 10.8°, the average loss further increases to approximately 400 W. The results indicate that the rate of current change is an important factor influencing the core loss of ASRs.
Taking the temperature field simulation results under the condition of
α = 25.2° and
μ = 10.8° as an example,
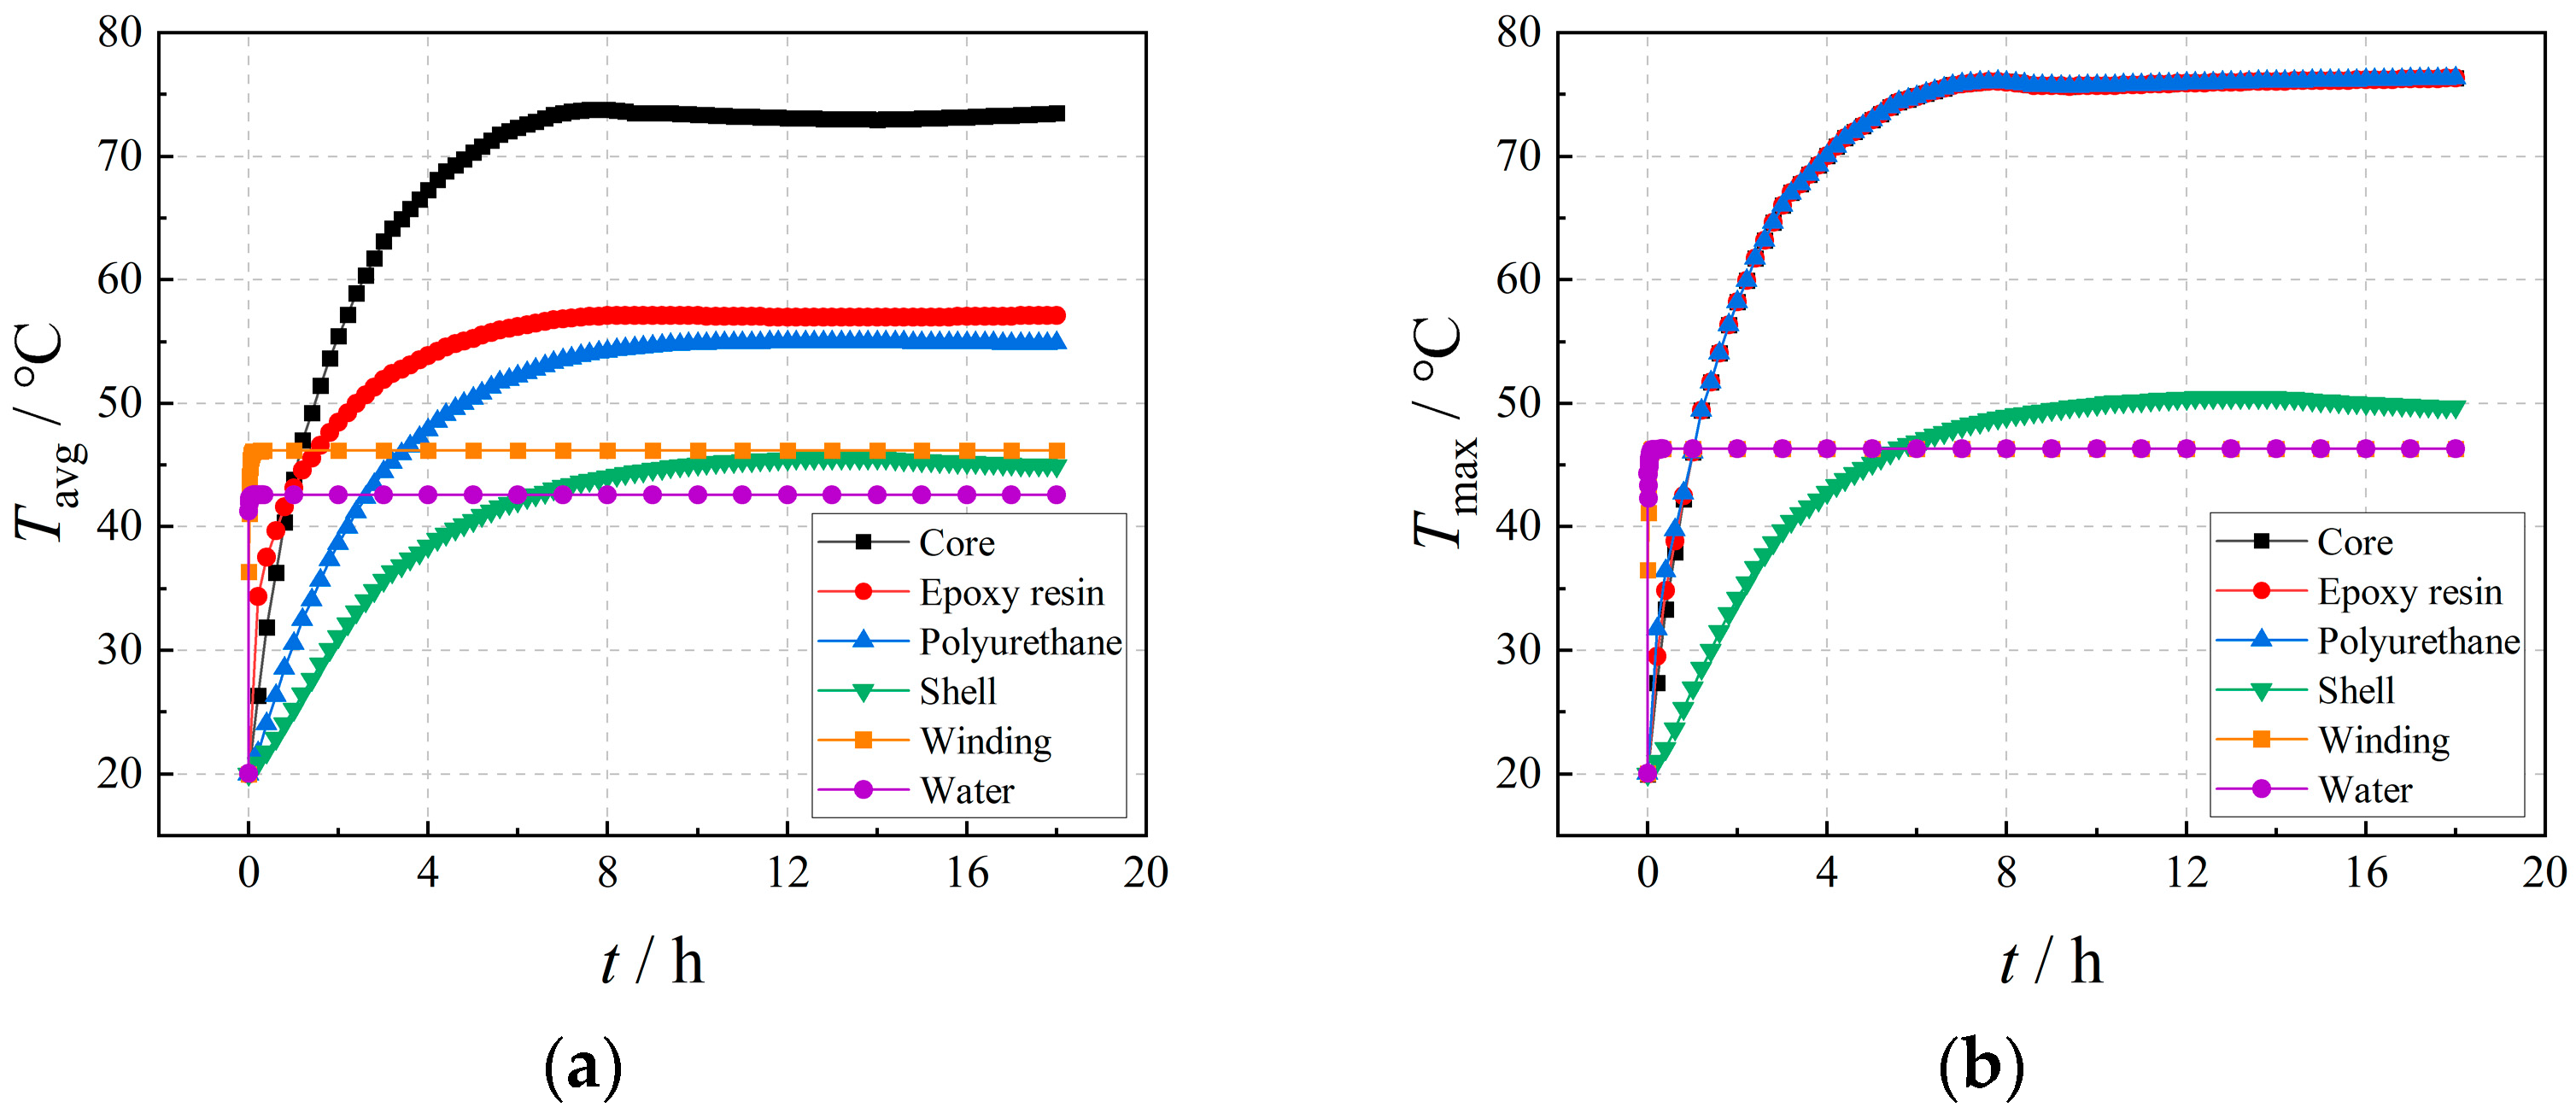
Figure 14 presents the variation in the average and maximum temperatures of each component over time, where
Tavg denotes the average temperature and
Tmax denotes the maximum temperature.
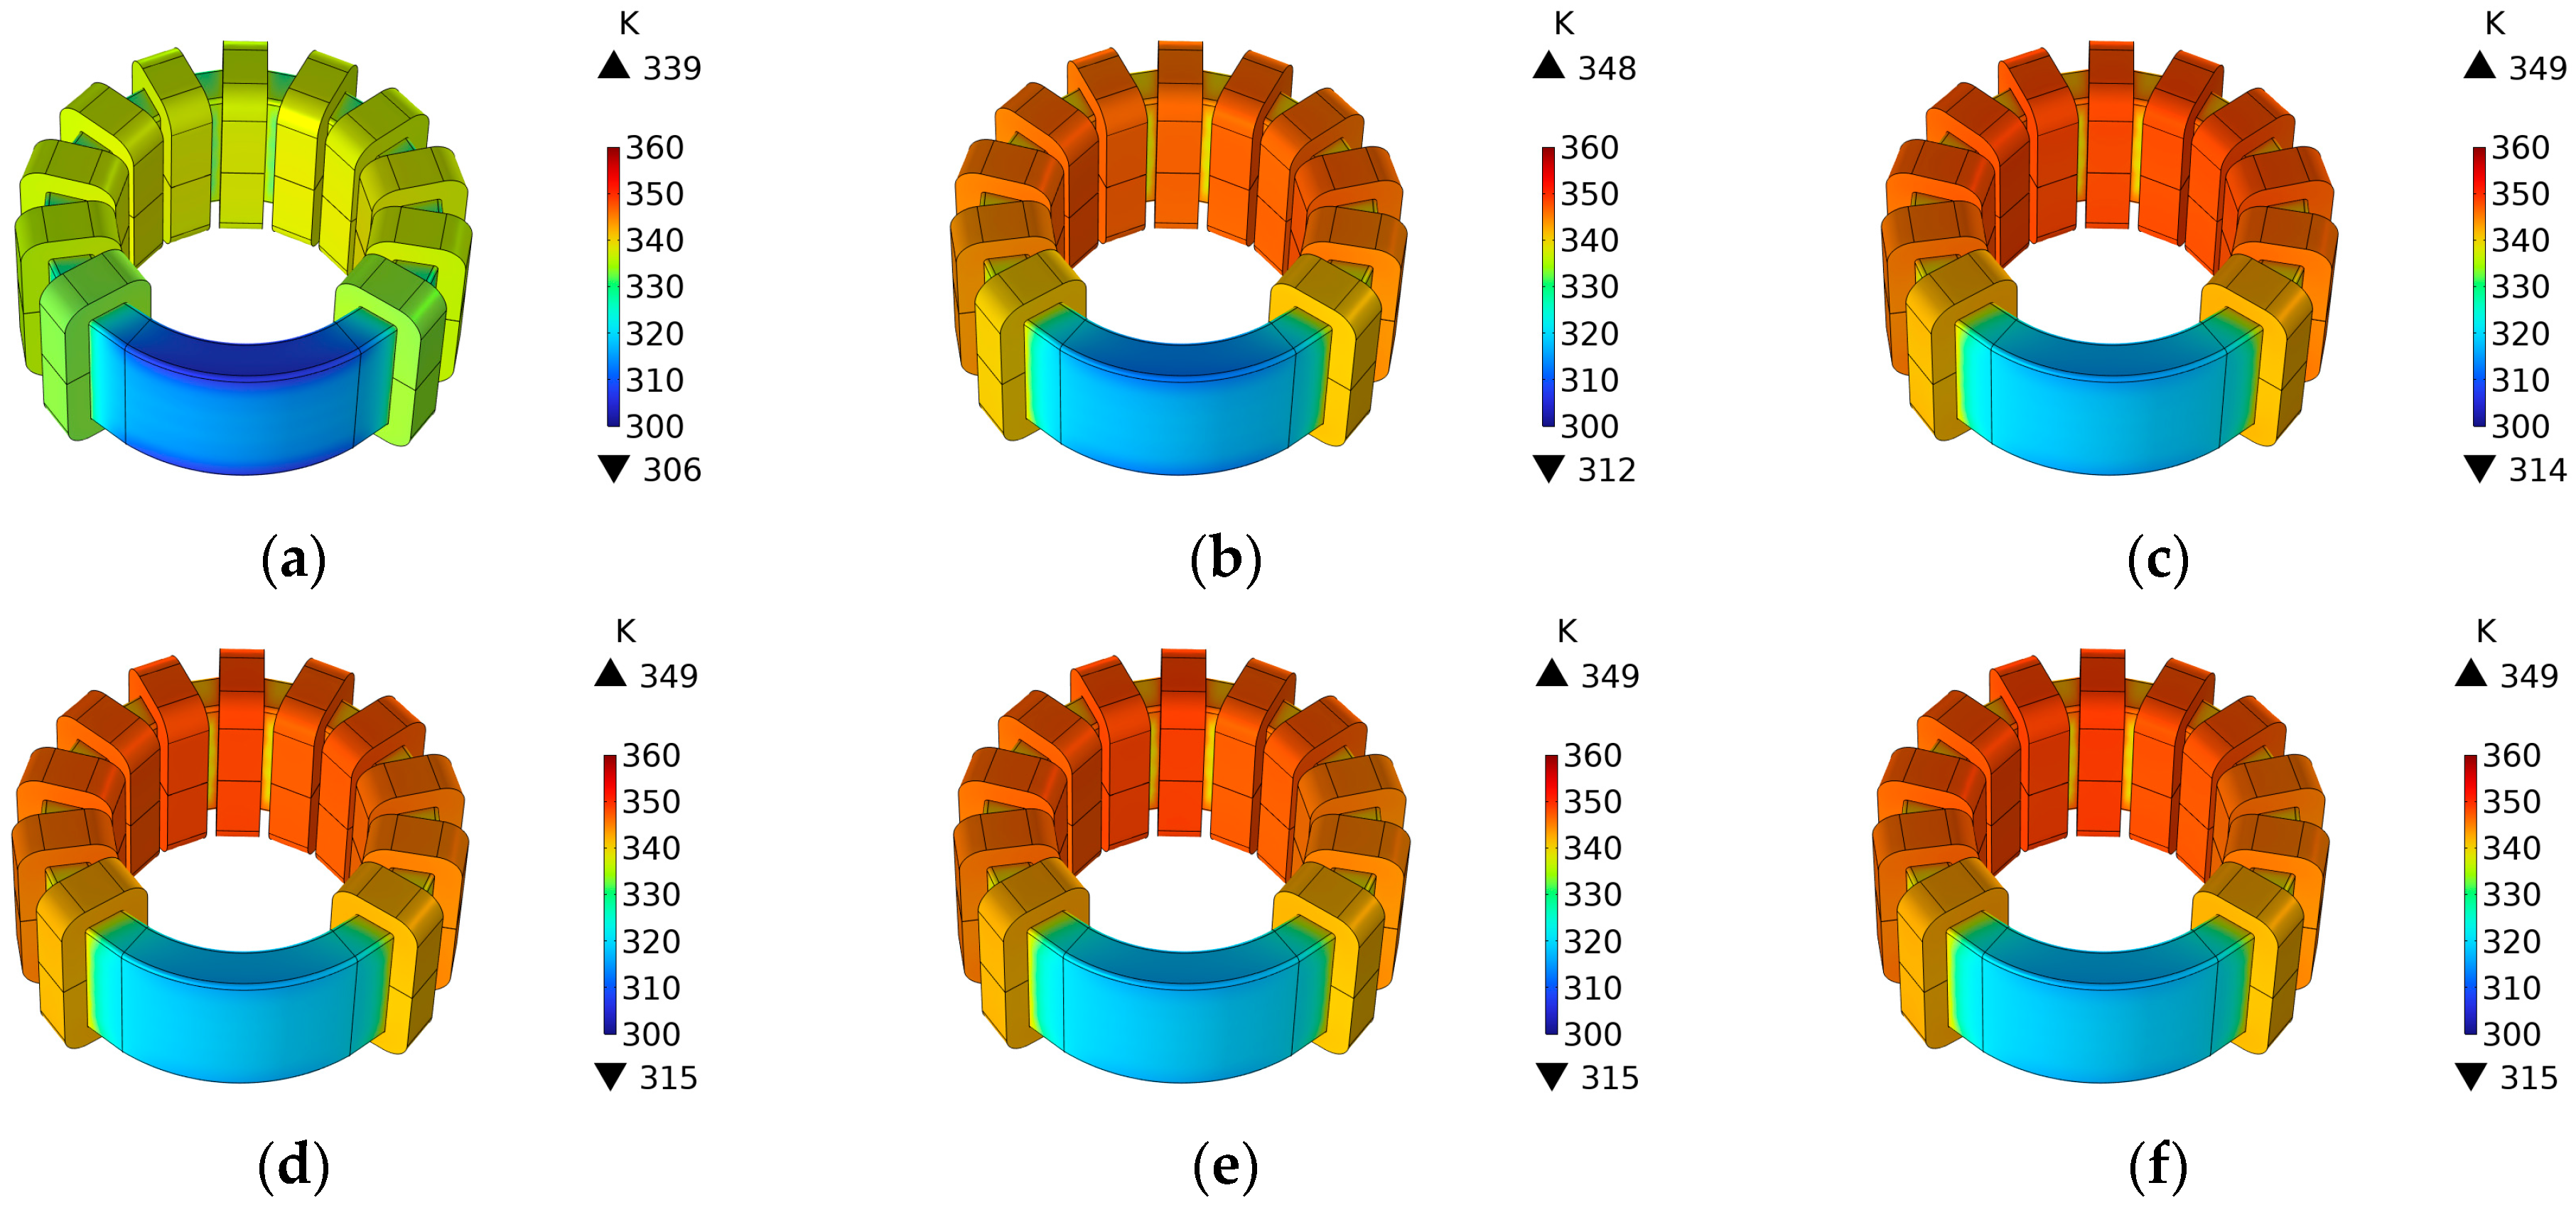
Figure 15 illustrates the evolution of the temperature distribution within the core over time.
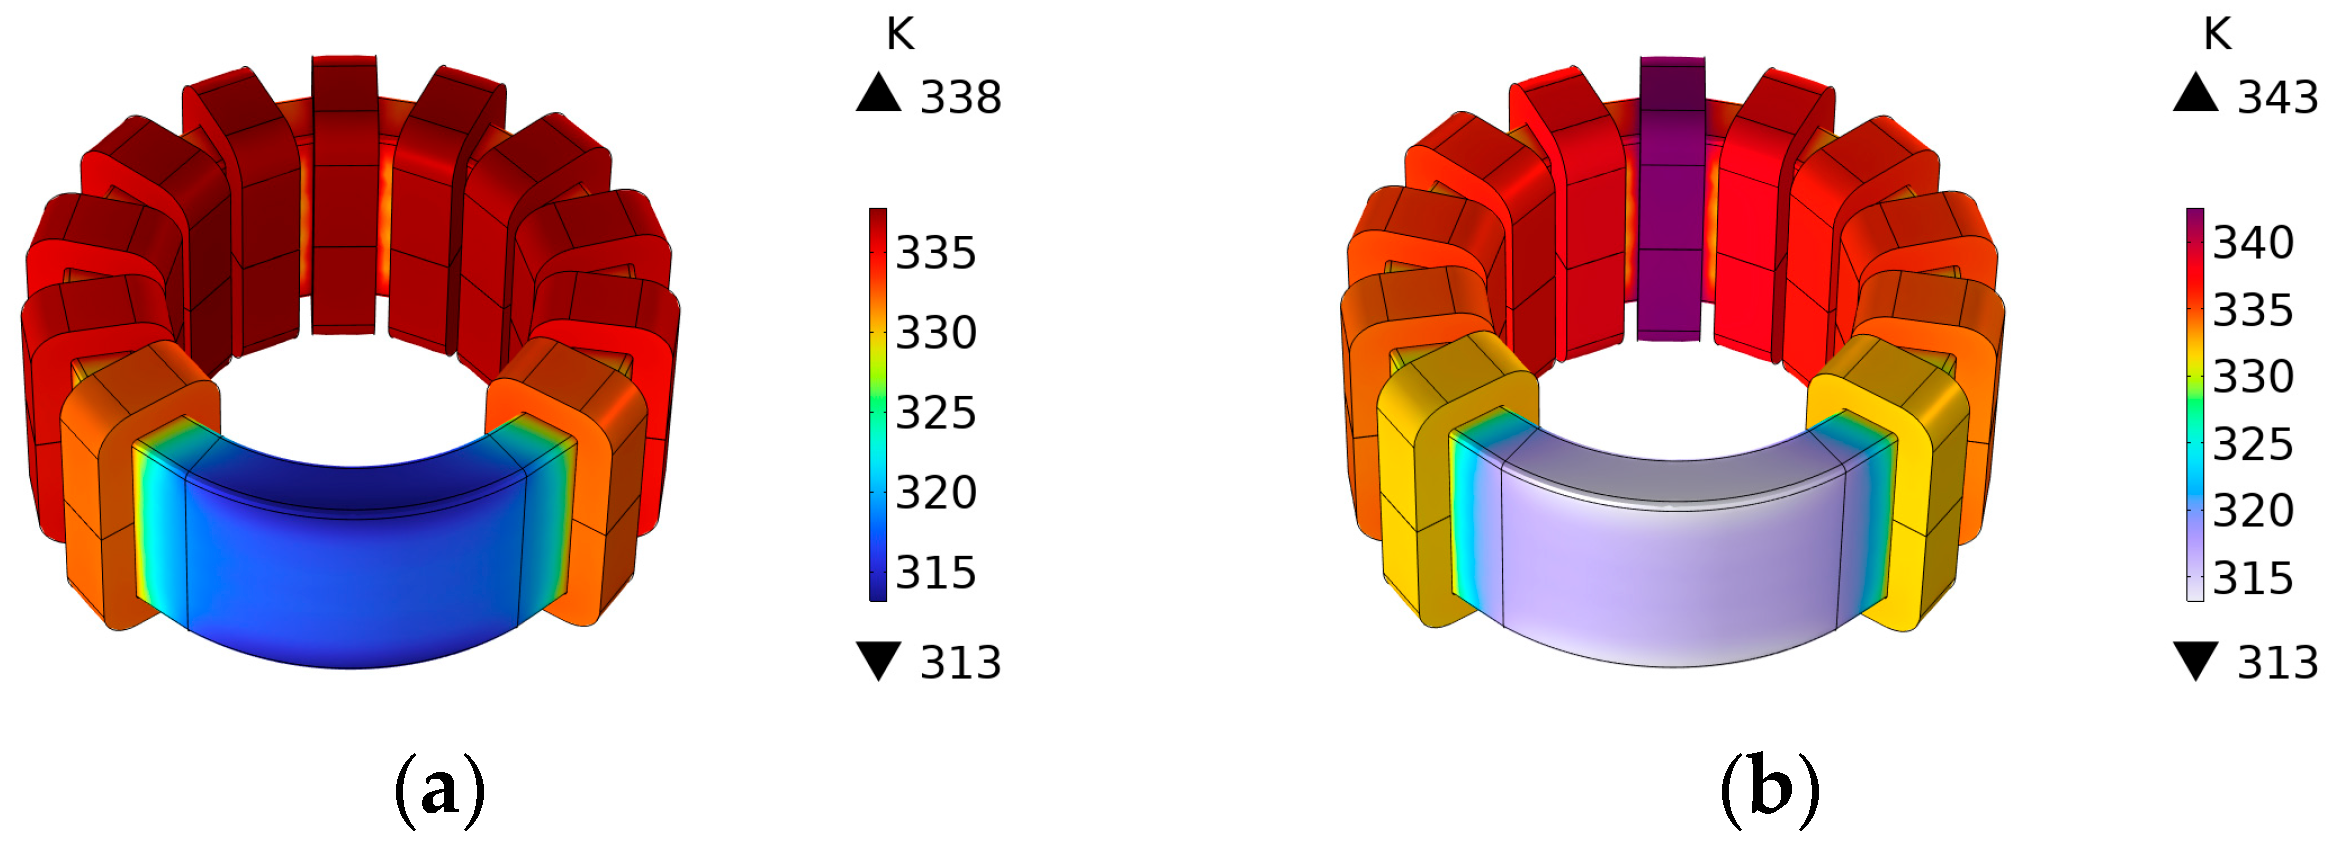
In terms of the average temperature of each component, the overall temperature field of the ASR gradually increases over time and reaches thermal stability after approximately 12 h. Owing to the continuous heat dissipation provided by the internal cooling water, the winding region maintains a relatively low overall temperature and reaches thermal equilibrium within a shorter time; in contrast, the heating process of the core and the insulating filling regions is considerably slower, requiring a longer time to reach a stable state. In terms of the maximum temperature of each component, the temporal evolution exhibits a pattern similar to that of the average temperature. However, because the core is in close contact with both the epoxy resin and the polyurethane, the maximum temperatures of these three components are very close to one another. The maximum temperatures of the winding and the cooling water are also very close. In contrast, since the shell is not in direct contact with the heat sources, its maximum temperature is markedly lower than the maximum temperature of the polyurethane. In terms of spatial distribution, the temperature is highest at the central core region and decreases gradually from the center toward both sides, and the observed trend is consistent with the experimental findings reported in Ref. [
15]. This is primarily attributed to the poor heat dissipation conditions of the central core, where heat tends to accumulate more readily, while the peripheral cores have access to more heat dissipation pathways, resulting in a pronounced central high-temperature hot spot.
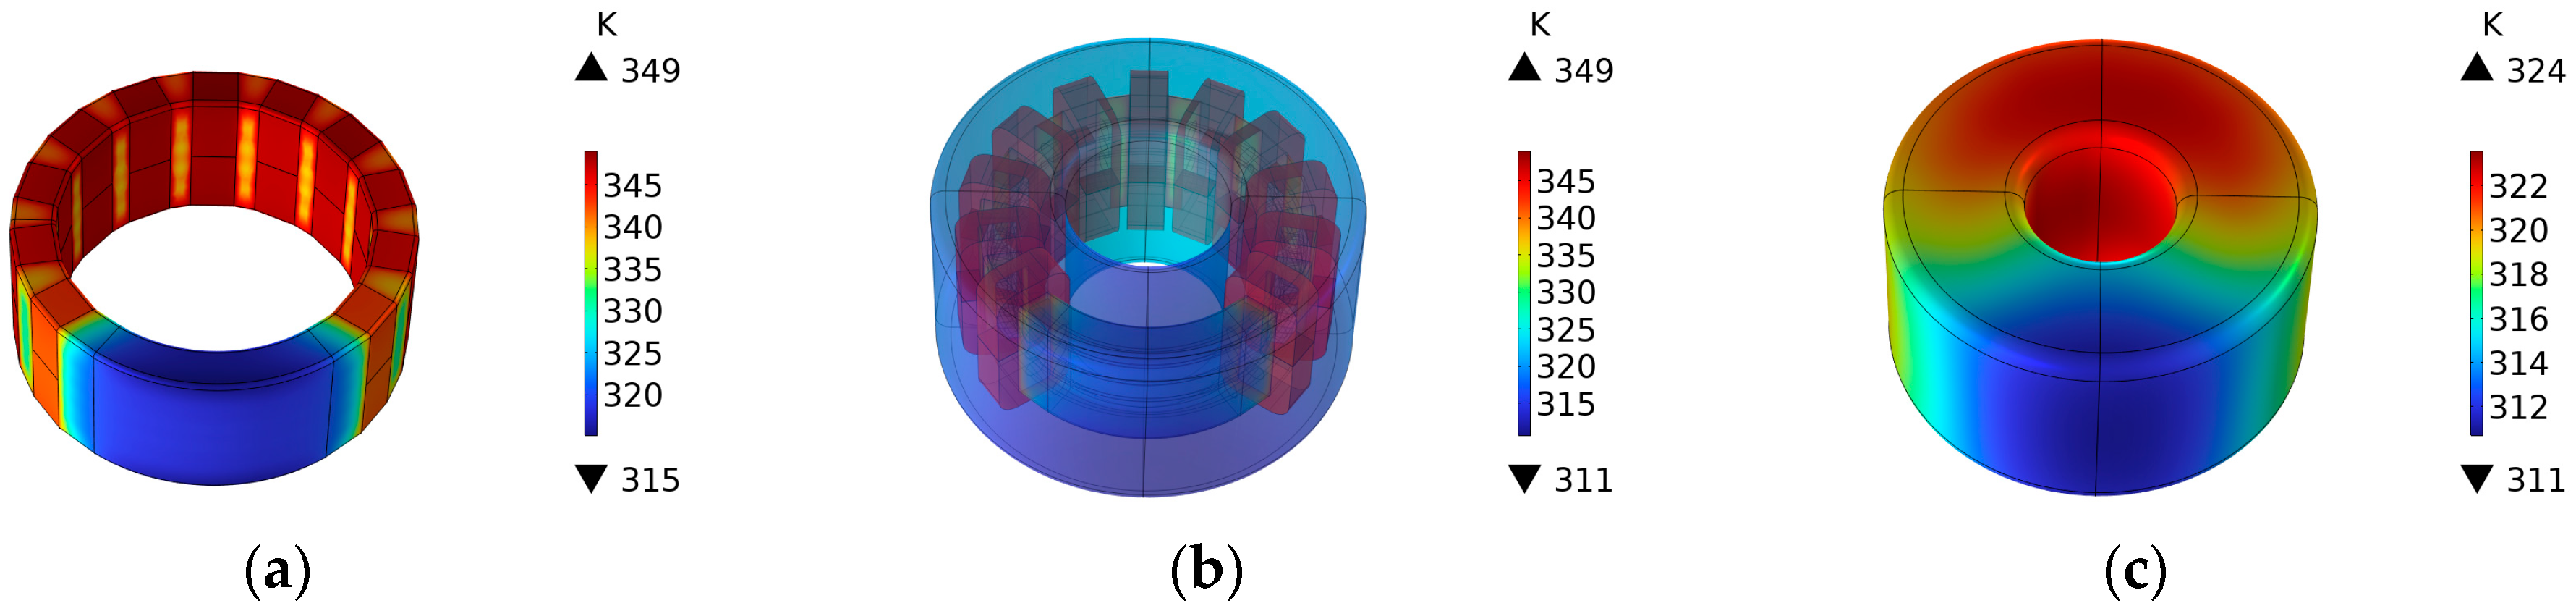
Figure 16 presents the temperature distribution of the epoxy resin, polyurethane, and shell at 12 h. Significant temperature gradients also exist within both the epoxy resin and polyurethane. The maximum temperature difference between the region of polyurethane close to the core and the region close to the shell can reach 38 °C, while the maximum temperature difference within the epoxy resin approaches 30 °C, indicating pronounced heat accumulation within the insulating filling materials. It is therefore evident that the central core and the epoxy resin and polyurethane regions in direct contact with it are more susceptible to thermally induced deformation and structural damage.
Table 5 presents the average temperature (
Tavg) and maximum temperature (
Tmax) of each component under different operating conditions. After reaching thermal steady state, both
Tavg and
Tmax increase noticeably with increasing core losses. For the core,
Tavg rises from 58.5 °C to 73.5 °C, while
Tmax increases from 61.5 °C to 76.3 °C as the operating condition changes from
α = 15°,
μ = 25° to
α = 25.2°,
μ = 10.8°. Similar temperature growth can also be observed in the epoxy resin and polyurethane. In particular, the average temperature of the polyurethane increases from 46.2 °C to 54.9 °C, while its maximum temperature rises from 61.5 °C to 76.3 °C. These results indicate that a higher current variation rate leads to increased core losses, resulting in more pronounced heat accumulation and higher temperature levels within the ASR. Furthermore, the maximum temperatures are consistently higher than the corresponding average temperatures, suggesting the existence of localized hot spots inside the reactor structure.
Overall, the temperature rise distribution of ASRs is closely related to the core loss characteristics, which in turn are significantly influenced by the operating conditions of the converter valve and the rate of current change. The central core region, having the poorest heat dissipation conditions, is more prone to the formation of localized high-temperature hot spots. Under long-term operation, this may lead to aging of the epoxy resin, degradation of polyurethane performance, and increased structural thermal stress, thereby exerting an adverse effect on the operational reliability of the ASR.
3.4. Comparison of Core Loss and Temperature Rise Under Air Gap Reduction Defect
As indicated by the analysis in
Section 2, periodic electromagnetically induced vibrations exist within ASRs. Prolonged vibration leads to wear and reduction in the air gap spacers. Therefore, defective operating conditions were configured in this section to investigate the temperature rise when internal defects occur in the ASR. Specifically, the air gap of the central pair of cores was reduced from the normal value of 0.32 mm to 0.1 mm, while the air gaps of the remaining cores were kept unchanged, so as to simulate a localized air gap degradation defect. The excitation current was set to the current under the condition of
α = 15°,
μ = 15°.
When the air gap of a local core is reduced, the magnetic permeance of the magnetic circuit in that region increases, and the magnetic flux tends to concentrate through that region, resulting in a local magnetic flux density significantly higher than that of the other cores. Core losses consequently increase, giving rise to localized temperature rise concentration.
Figure 17 presents a comparison of the core losses of the central pair of cores before and after the air gap change.
Figure 18 presents the temperature distribution of the core before and after the air gap change at 18 h.
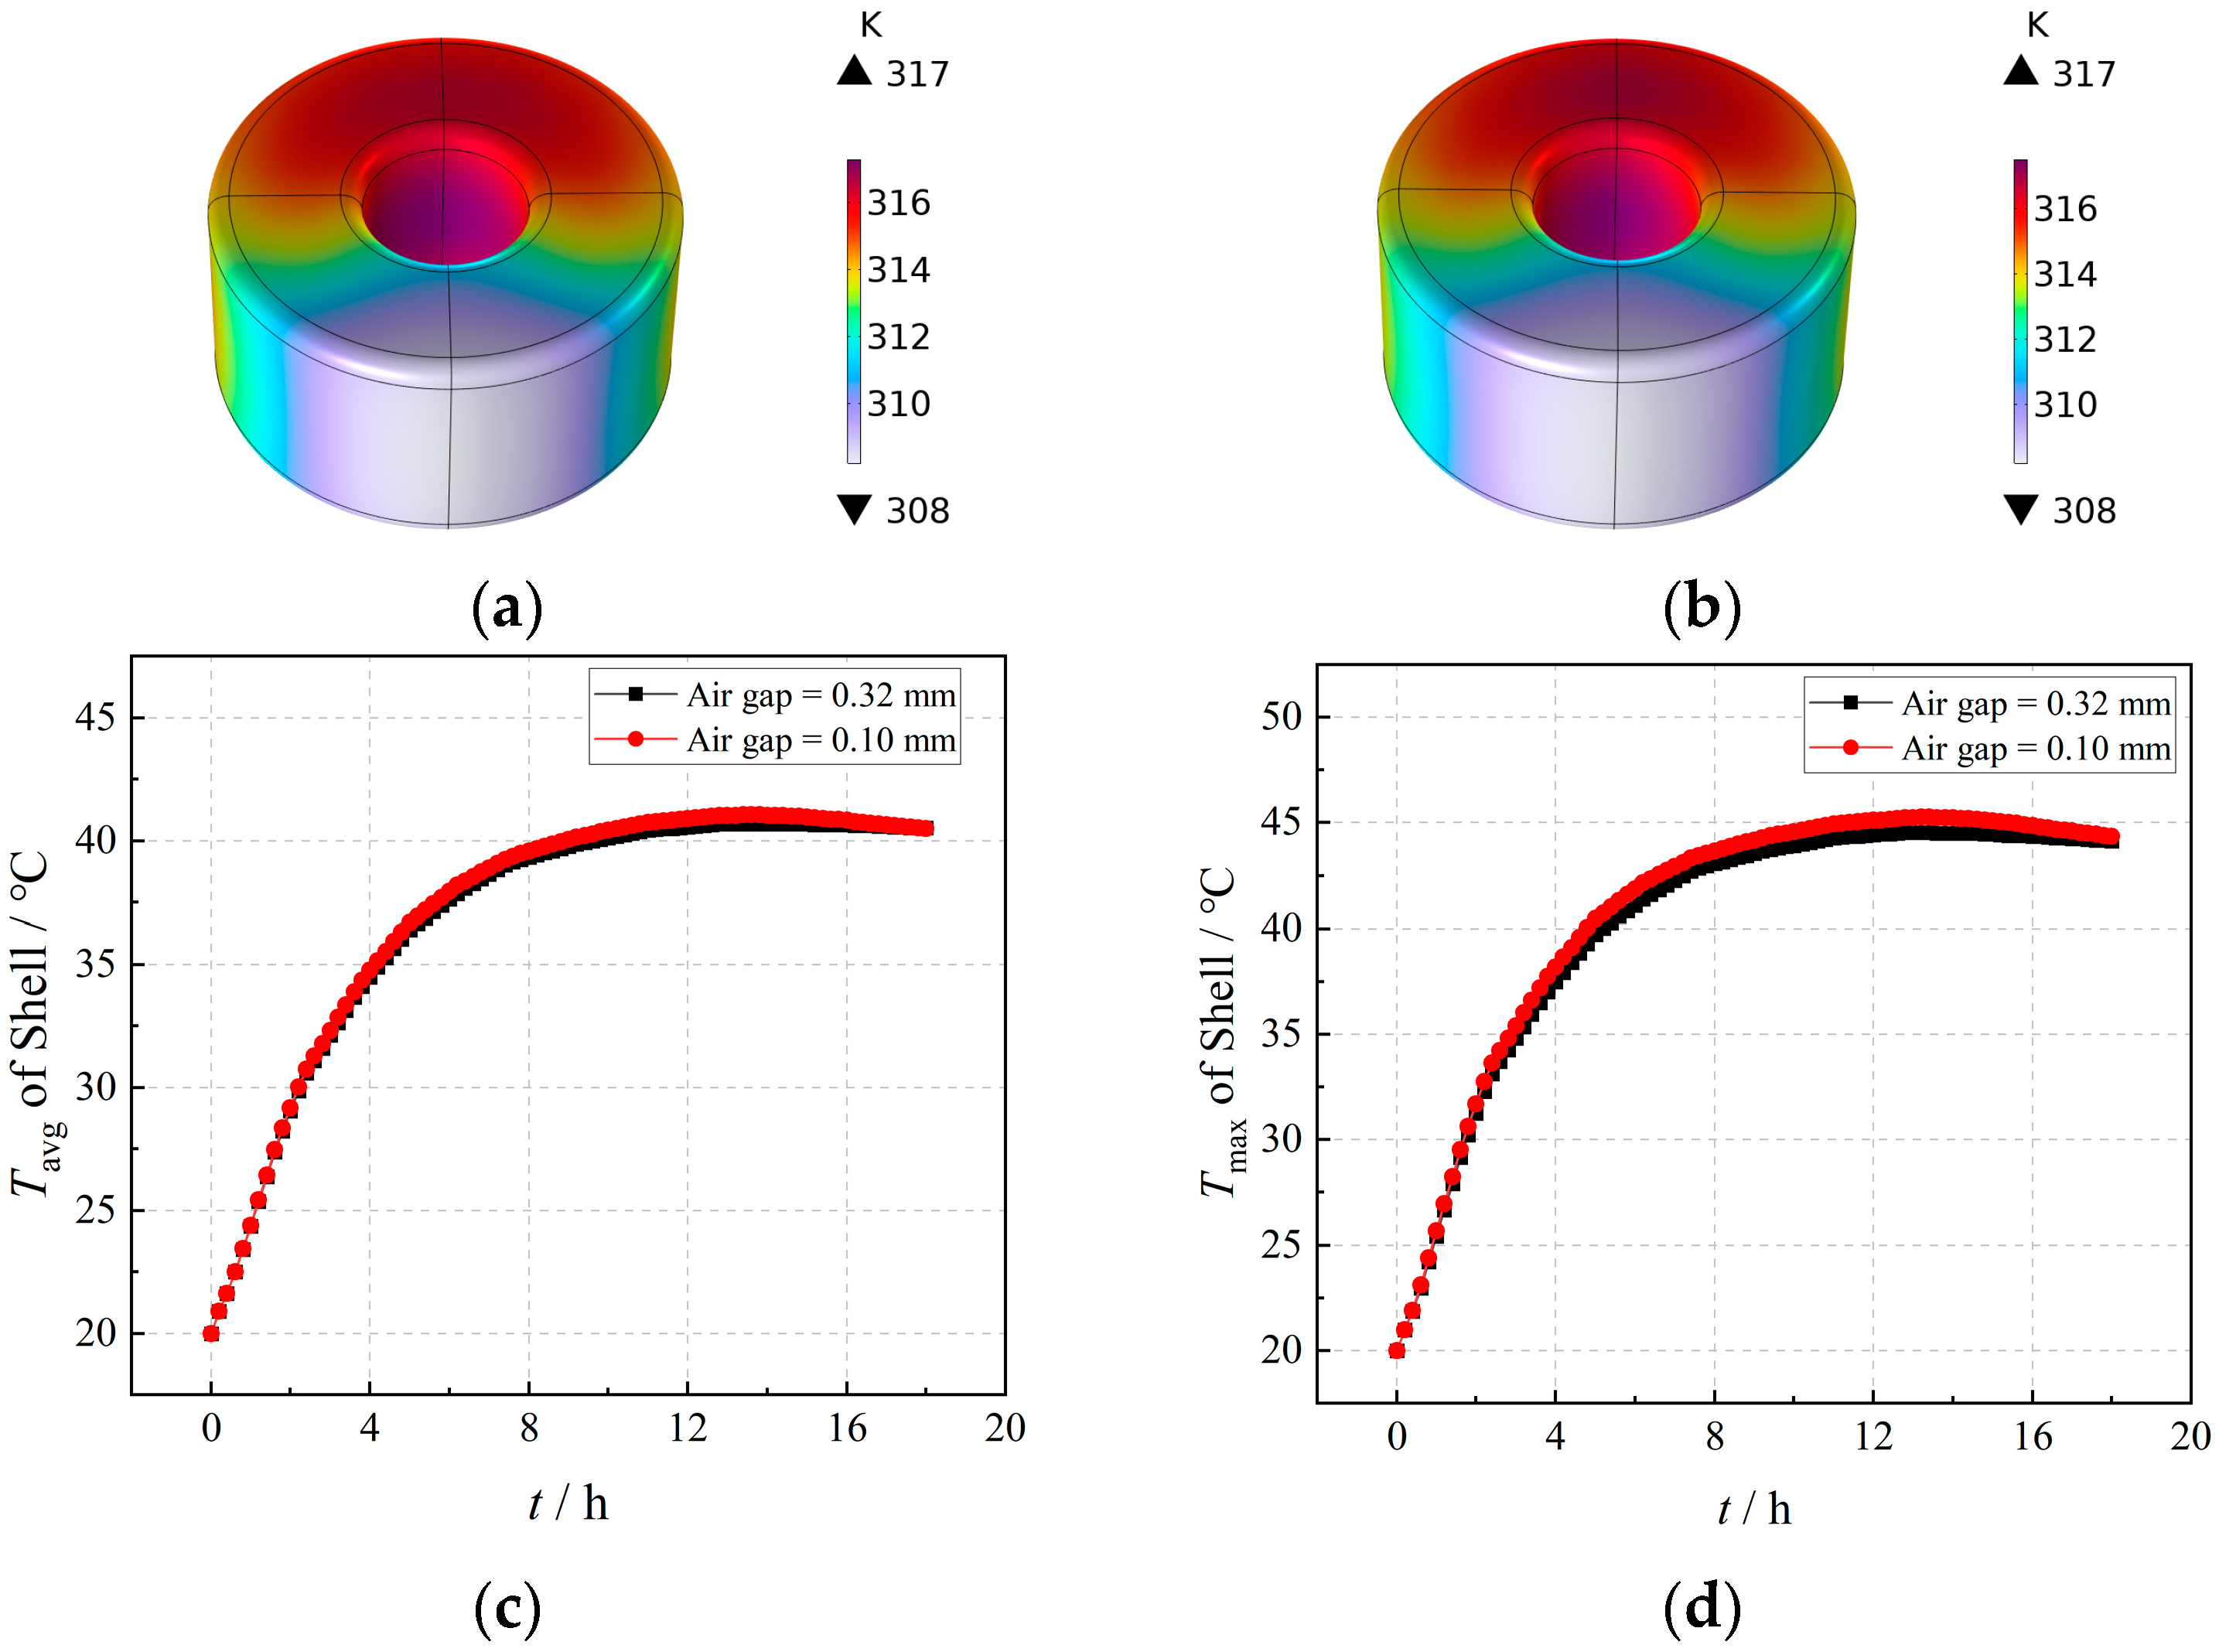
Figure 19 presents the temperature distribution and average temperature of the shell before and after the air gap change at 18 h.
The results indicate that after the air gap reduction, the period-averaged loss of the corresponding core pair increases from 22.76 W to 33.68 W, representing an increase of approximately 47.9%. The modified loss was re-imported into the temperature field model for simulation. At thermal equilibrium, the temperature of the central core is approximately 5 °C higher than that of the adjacent cores, forming a pronounced localized high-temperature hot spot. As discussed in
Section 2.5, the thermal aging of the filling materials weakens the vibration-damping performance of the system and increases the intensity of vibrational impact experienced by the core and structural components. Building on this, the continuous accumulation of localized temperature rise will further accelerate the thermal aging of the filling and insulating materials in that region, which in turn promotes further wear of the air gap spacers under the combined effects of thermal stress and vibration. As the air gap is further reduced, magnetic flux becomes increasingly concentrated in the local region, resulting in higher core losses and more severe localized heating. The elevated temperature may accelerate the thermal aging of surrounding materials, such as polyurethane and spacers, thereby degrading their mechanical support and vibration damping capabilities. This degradation can lead to increased vibration levels and a higher risk of further air-gap wear. Consequently, air-gap degradation, localized heating, material aging, and vibration enhancement may interact with each other during long-term operation, forming a positive feedback mechanism that accelerates the deterioration of the ASR. It is worth noting that the internal localized temperature rise caused by air-gap reduction has only a limited influence on the shell temperature.
The temperature distribution and average shell temperature at 18 h exhibit only limited differences before and after the air-gap degradation. It should be emphasized that this conclusion is drawn specifically for the shell-type ASR configuration and operating conditions investigated in this study, in which the core is enclosed by epoxy resin, polyurethane, and an outer shell, resulting in long and indirect heat transfer paths between the internal heat sources and the shell surface. Under such conditions, the simulation results suggest that shell temperature measurements or external infrared thermography may have limited sensitivity to the localized loss increase caused by internal air-gap anomalies. Therefore, for the shell-type ASR investigated in this study, relying solely on external thermal monitoring may not provide sufficient capability for the early detection of such internal defects.
4. Effects of Air Gap Reduction on Electrical Parameters
Under the combined long-term effects of electrical, thermal, and mechanical stresses, core loosening and air gap spacer wear lead to a gradual reduction in the air gap size within ASRs. As the air gap decreases, the magnetic reluctance of the corresponding flux path drops sharply, causing the magnetic flux to concentrate through that path and resulting in significant changes in the unsaturated inductance characteristics. The previous section has confirmed that during the evolution of air gap defects, the temperature rise characteristics of the ASR shell exhibit no significant changes, implying that it is difficult for conventional approaches such as infrared thermography and manual shutdown inspection to effectively detect such internal latent faults. To overcome the limitations of existing thermal characteristic monitoring, there is an urgent need to identify sensitive electrical monitoring quantities capable of characterizing internal air gap defects in ASRs. Given that variations in air gap size are directly mapped to macroscopic electrical parameters, this section focuses on investigating the effects of air gap reduction on electrical parameters such as unsaturated inductance and frequency sweep impedance through simulation, with the aim of identifying electrical online monitoring indicators with high sensitivity and engineering feasibility.
4.1. Effects of Air Gap Variation on Unsaturated Inductance
The air gap is a critical structural parameter in the magnetic circuit of ASRs that determines the distribution of magnetic reluctance and the saturation characteristics. The core is composed of high-permeability materials with extremely low magnetic reluctance, whereas the permeability of the air gap is only approximately equal to the permeability of free space μ0, and therefore the air gap plays a dominant role in the total magnetic reluctance of the magnetic circuit. When the air gap is reduced, the total magnetic reluctance of the magnetic circuit decreases, the flux linkage that can be established per unit current increases substantially, and the unsaturated inductance value rises accordingly. In the simulation, only a single pair of cores was selected as the variable to analyze the effect of its air gap variation on the overall unsaturated inductance of the ASR.
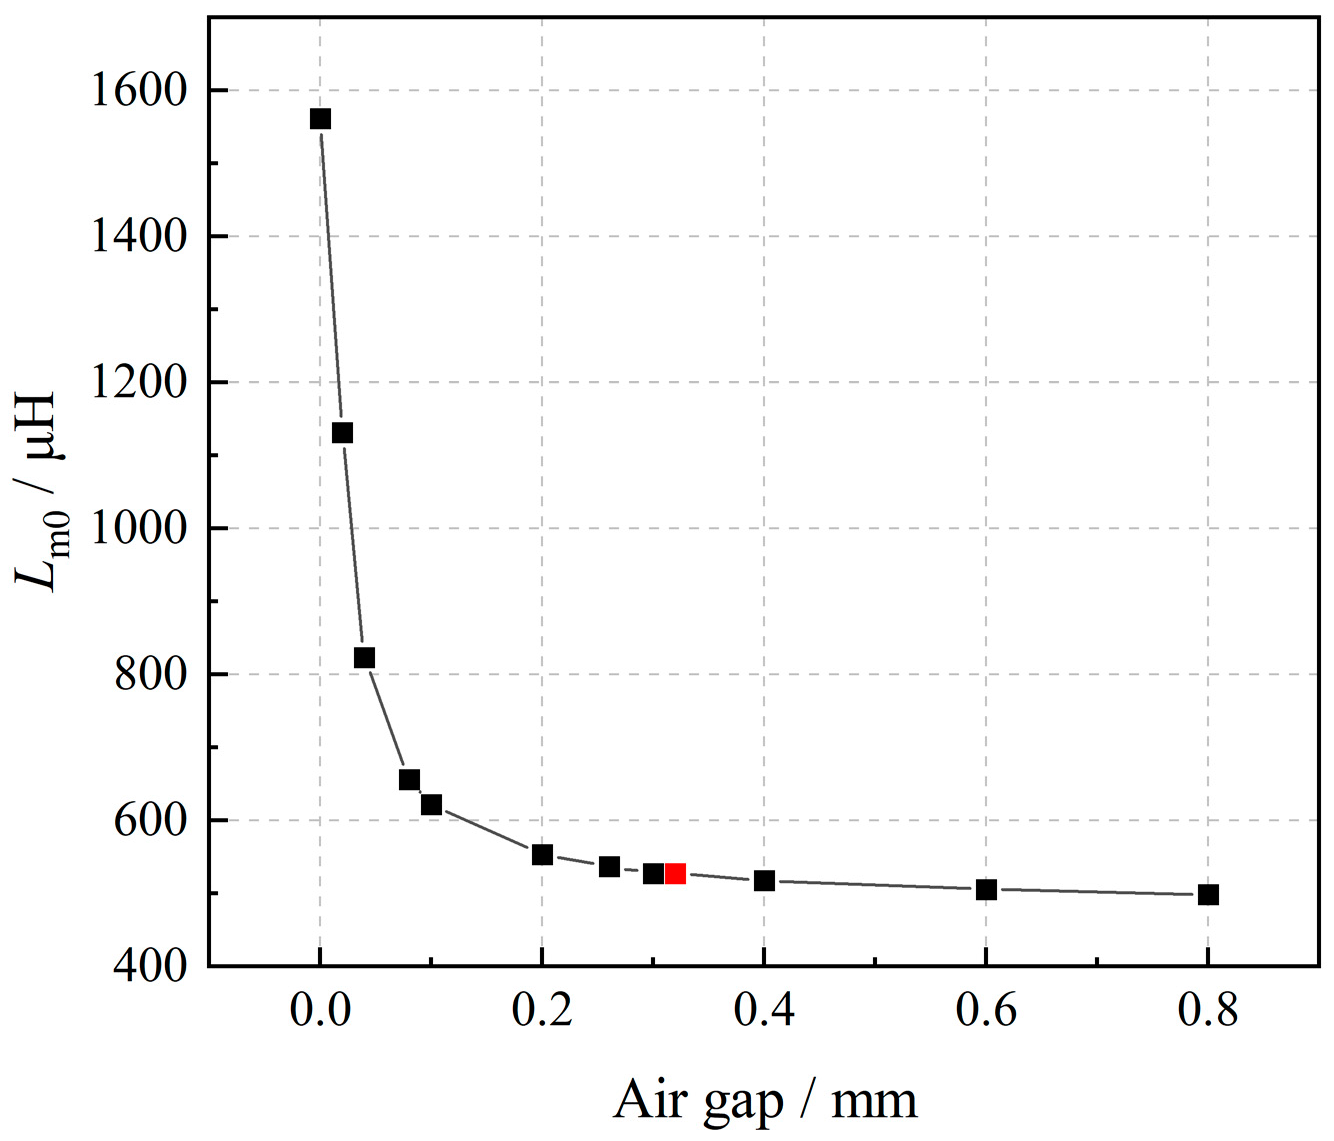
Under normal operating conditions, the air gap is 0.32 mm, corresponding to an unsaturated inductance value of approximately 500 μH, as indicated by the red data point in
Figure 20. This value is consistent with the measured unsaturated inductance of practical ASRs reported in engineering applications, indicating that the developed model can reasonably reproduce the electromagnetic characteristics of the reactor under normal operating conditions. The simulation results reveal a pronounced nonlinear relationship between the air gap size and the unsaturated inductance
Lm0. When the air gap is greater than approximately 0.2 mm, the inductance increases only slightly as the air gap decreases, exhibiting a relatively gradual variation. When the air gap is reduced to below 0.2 mm, the inductance value increases sharply, and the curve displays a pronounced nonlinear steep rise characteristic. The nonlinear increase in unsaturated inductance at small air gaps can be attributed to the rapid reduction in the magnetic reluctance of the magnetic circuit. As the air gap decreases, the reluctance contributed by the gap is significantly reduced, resulting in a more efficient magnetic flux path and a higher magnetic flux density within the core. Consequently, the magnetic flux linkage established under the same excitation current increases at an accelerated rate, leading to a nonlinear rise in unsaturated inductance. The results indicate that even a minor variation in the air gap of a single pair of cores can have a significant effect on the overall unsaturated inductance of the ASR, confirming that unsaturated inductance is highly sensitive to the air gap condition and can serve as an effective monitoring indicator for air gap wear and structural loosening.
4.2. Effects of Air Gap Variation on Frequency Sweep Impedance
In addition to unsaturated inductance, the frequency-domain impedance characteristics of ASRs are also capable of reflecting the effects of air gap variation. In the low-frequency range, the impedance is dominated by the resistive component, and the effect of permeance variation caused by air gap changes on the total impedance is relatively weak, making it difficult to effectively distinguish between different air gap states. As the frequency increases, the proportion of inductive reactance in the total impedance gradually increases, and the effect of air gap variation on the impedance becomes progressively more apparent. In this paper, the small-signal frequency sweep method was employed for analysis: a sinusoidal alternating current excitation with a small amplitude was applied to the ASR, and while maintaining the core in an unsaturated state, the excitation frequency was varied incrementally to obtain the variation pattern of impedance magnitude with air gaps at different frequencies.
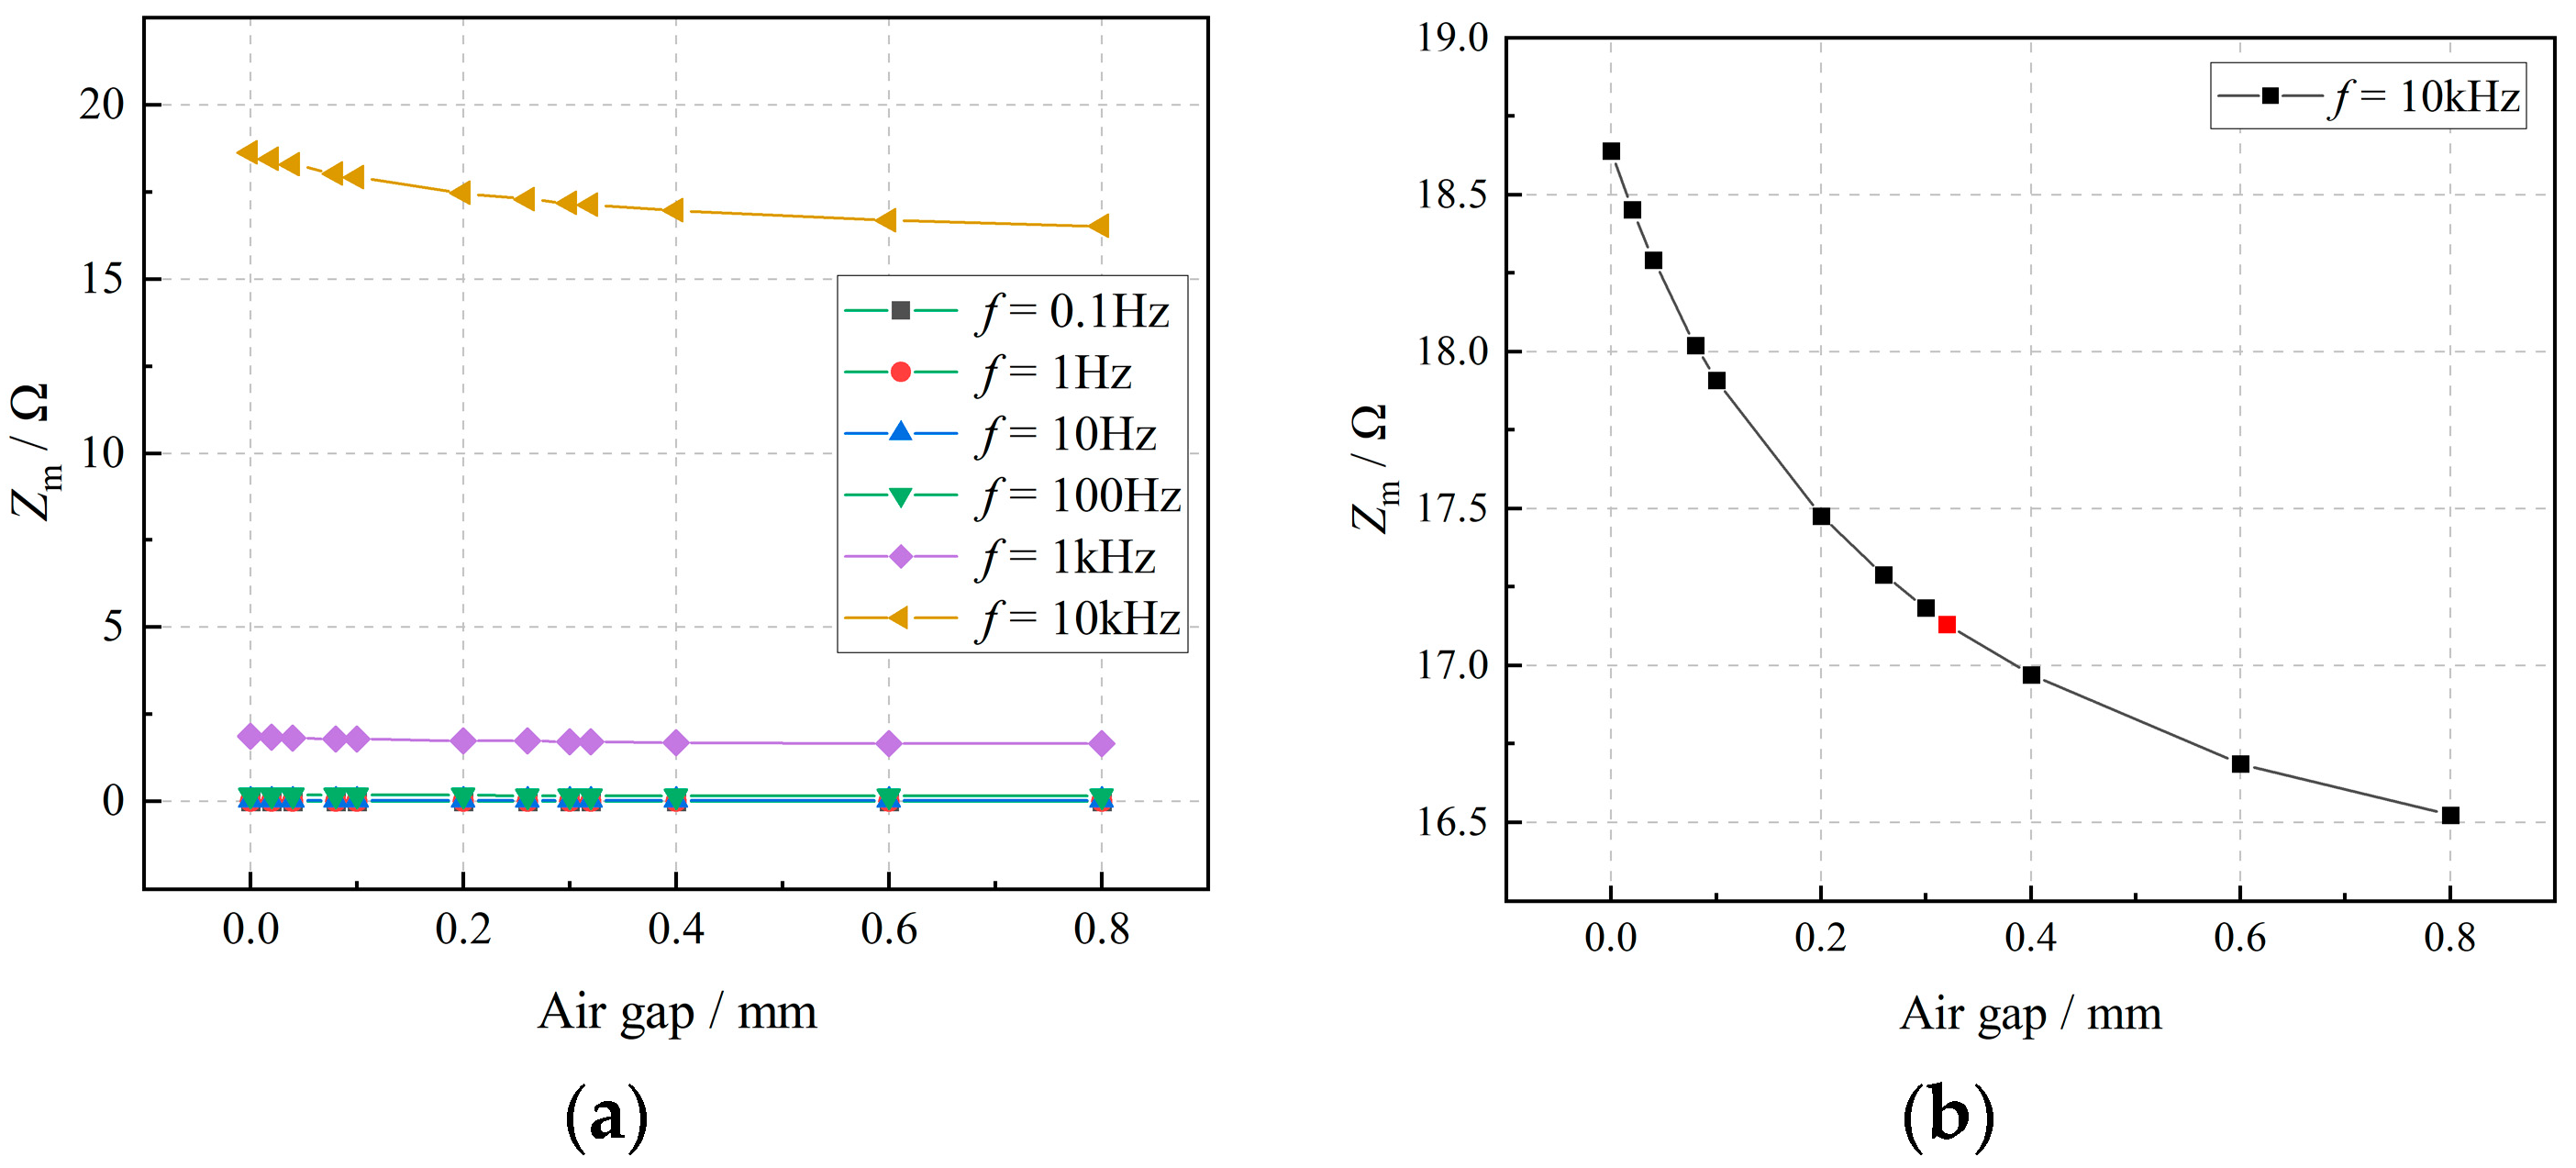
Figure 21 presents the effect of the air gap size of a single core pair on the frequency sweep impedance of the ASR. The results indicate that in the frequency range below 100 Hz, the differences in impedance magnitude
Zm with respect to air gap variation are extremely insignificant, suggesting that the low-frequency range is insensitive to air gap changes. As the frequency increases, the inductive reactance component gradually increases and the effect of air gap variation on the impedance becomes progressively more pronounced.
Figure 21b illustrates the variation in the frequency-sweep impedance of the ASR with air-gap size at 10 kHz. The red dot represents the impedance magnitude at 10 kHz under the normal air-gap condition. Within the investigated frequency range, 10 kHz provides the most pronounced impedance variation among different air-gap states and is therefore selected as a representative diagnostic frequency. In addition, the selected frequency lies within a range that can be readily achieved using existing frequency response analysis and impedance monitoring techniques. Therefore, the impedance magnitude at 10 kHz not only exhibits high sensitivity to air-gap variation but also shows potential for practical implementation in condition monitoring applications. Therefore, 10 kHz can be selected as a characteristic frequency for air-gap condition diagnosis.
4.3. Feasibility Analysis of Online Electrical Parameter Monitoring
This section proposes two signals that can be used for online condition monitoring of ASRs. The unsaturated inductance can be obtained by acquiring the voltage and current signals at the terminals of the reactor, combined with parameter identification methods. The high-frequency impedance can be obtained by drawing on frequency response analysis (FRA) and online impedance monitoring techniques, in which a small-amplitude high-frequency test signal is injected and the corresponding response signal is measured. Since the amplitude of the test signal is small relative to the operating current, its effect on the normal operation of the equipment is limited. Notably, FRA-based techniques have already been engineering-validated for online winding deformation monitoring in large power transformers [
30,
31], suggesting that the extension of similar principles to ASR condition monitoring is technically plausible. Nevertheless, several engineering challenges remain to be addressed under the high-voltage operating environment of converter valves, including electromagnetic interference suppression, signal isolation between the high-voltage and measurement sides (e.g., via optical fiber or isolation transformers), and the measurement accuracy of small signals superimposed on large operating currents. With continued advances in online monitoring technology and high-voltage measurement techniques, the proposed electrical-parameter-based condition assessment approach is expected to possess engineering application potential, although further validation under realistic high-voltage valve operating conditions is still required.