1. Introduction
The safe and stable operation of power facilities is essential for national economic development and the reliable functioning of modern society. With the continuous expansion of power infrastructure in the western plateau regions of China, electrical equipment is increasingly exposed to harsh environmental conditions, including low air pressure, strong ultraviolet radiation, and large diurnal temperature variations. These conditions pose substantial challenges to the insulation performance of power equipment. As critical transmission and distribution equipment, air-insulated switchgear (AIS) is more susceptible to dust pollution, manufacturing defects, component loosening caused by transportation vibration, and long-term aging during operation than fully enclosed equipment. These factors may distort the internal electric field and induce partial discharge (PD). Although PD does not usually cause immediate insulation breakdown at the initial stage, it continuously degrades dielectric materials and accelerates insulation aging, eventually increasing the risk of insulation failure. Therefore, investigating the PD characteristics of AIS in high-altitude environments and developing effective online monitoring methods are of both theoretical significance and engineering value for improving early fault warning capability, ensuring the safe operation of plateau power systems, and reducing operation and maintenance costs.
Several electrical and acoustic methods have been widely used for PD detection. The pulse current method is a classical and standardized technique for measuring apparent charge and pulse characteristics, and it is suitable for laboratory calibration and quantitative analysis [
1,
2,
3,
4]. However, its anti-interference capability in complex field environments is limited, and accurate localization of PD sources remains difficult.
The ultra-high-frequency (UHF) method detects high-frequency electromagnetic radiation generated by PD and has been widely investigated for switchgear and gas-insulated switchgear (GIS) monitoring [
5,
6,
7,
8,
9,
10,
11,
12]. It has strong resistance to low-frequency electromagnetic interference, but its performance can be affected by electromagnetic-wave reflection, attenuation, resonance, and sensor installation position inside the cabinet. The transient earth voltage (TEV) method is convenient for non-intrusive field detection of medium-voltage switchgear [
13,
14,
15,
16], but it is susceptible to external electromagnetic interference and has limited localization capability. The ultrasonic method can detect pressure waves generated by PD and exerts a certain localization capability [
17,
18,
19,
20,
21,
22], but acoustic signals may experience limitations such as refraction, reflection, and attenuation in complex switchgear structures.
PD detection in AIS differs substantially from that in gas-insulated switchgear (GIS). GIS is typically sealed or quasi-sealed and filled with SF
6- or SF
6-based gas mixtures; thus, UHF detection and SF
6 decomposition product analysis have been extensively investigated. In contrast, AIS mainly uses air as the insulation medium and is not fully sealed. The generation, accumulation, diffusion, and detection of PD-induced gases in AIS are therefore more strongly affected by cabinet structure, ventilation, humidity, dust, and local airflow. Consequently, gas-based PD diagnosis methods developed for GIS cannot be directly applied to AIS without further verification. Gas analysis evaluates the insulation condition of equipment by detecting the types, concentrations, and temporal evolution of characteristic gases generated during PD. Regarding GIS, many studies have focused on SF
6 decomposition products and demonstrated that gas components can provide useful information for PD-type recognition [
23,
24,
25]. For AIS, Gui et al. studied the characteristic decomposition components generated in AIS cabinets under PD conditions and showed that air discharge can also produce characteristic gases with diagnostic significance [
26]. Zhang et al. analyzed fault-derived gases in switchgear through experimental simulations, and Zhou investigated characteristic gas components related to switchgear faults [
27,
28]. These studies indicate the potential of gas-component analysis for AIS insulation diagnosis.
Traditional gas detection methods mainly include infrared spectroscopy and gas chromatography. Infrared spectroscopy is suitable for the rapid detection of specific gases, while gas chromatography has high precision in component separation and quantitative analysis [
25,
26,
27,
28]. However, these methods usually require precision instruments with high cost and large volume, which limits their online application in switchgear cabinets. Therefore, low-cost and integrated gas-sensor-based online detection methods have attracted increasing attention. For example, Wang et al. prepared hierarchical flower-like WO
3 nanostructures and verified their gas-sensing properties [
29], and Chu et al. studied screening methods for NO
2-sensitive materials [
30].
Overall, gas-component analysis has advantages such as resistance to electromagnetic interference and potential sensitivity to hidden insulation defects, showing promising prospects for AIS PD diagnosis. However, existing studies mainly focus on characteristic gas detection and preliminary diagnosis. The generation and removal mechanisms of air-discharge products, rules for gas evolution under different pressure conditions, and stable recognition criteria for different PD types still require further investigation.
Based on the above research background, this paper investigates the PD characteristics and online detection method of AIS under high-altitude and low-pressure conditions. The proposed method is evaluated over a pressure range corresponding to simulated altitudes of 0–5000 m. The paper is organized as follows:
Section 2 establishes a numerical model to analyze the decomposition mechanism of air discharge and the pressure-dependent generation of CO and NO
2.
Section 3 presents air PD experiments under different pressure and defect conditions and analyzes the relationship between defect type and the CO/NO
2 concentration ratio.
Section 4 develops a gas-sensor-based online detection prototype and verifies the proposed PD-type recognition method.
Section 5 summarizes the main conclusions and discusses future research directions.
2. Simulation Study on Characteristic Products of Air Partial Discharge
Air discharge is a complex process involving numerous physicochemical reactions and the formation of various gas species. During discharge, the gas enters a plasma state, and numerical simulation can provide insight into the underlying reaction mechanisms. In this section, the Plasma Module in COMSOL Multiphysics V6.1 is used to investigate the air discharge process, with emphasis on the concentrations, formation pathways, and removal processes of decomposition products. The simulation is not intended to replace empirical reaction rate data; rather, it integrates electron-impact reactions, heavy-species reactions, pressure effects, and product evolution into a unified discharge model. This enables comparison of the relative generation and stability of different gas products under controlled low-pressure conditions and provides a mechanistic basis for selecting characteristic gases for subsequent experiments.
2.1. Modeling of the Air Partial Discharge Process
As a typical multicomponent mixed gas discharge phenomenon, air discharge involves the continuous generation of excited species, charged particles, and free radicals at the microscopic level. During this process, interactions among gas components continuously trigger complex physicochemical changes, resulting in highly complicated kinetic behaviors. In the initial stage of the discharge, free electrons in the air gain kinetic energy under the applied electric field and collide with gas molecules, producing a massive number of free electrons and positive ions. Driven by the electric field, these charged particles subsequently undergo continuous elastic and inelastic collisions with gas molecules, triggering a series of chain ionization reactions that result in an “electron avalanche”. Furthermore, the air discharge process is accompanied by the generation of various highly reactive free radicals, such as oxygen and nitrogen radicals. Due to their high chemical reactivity, these radicals readily react with other ambient gas molecules, leading to the formation of new chemical compounds.
To accurately and comprehensively simulate the microscopic process of air discharge, this study couples a plasma chemical reaction model with a fluid dynamics model. The Boltzmann equation is utilized to calculate the critical parameters required for this hybrid numerical model.
The fluid dynamics model focuses on describing the variations in macroscopic physical quantities, including electron density, electron temperature, the mass fraction and momentum of heavy species, and the distribution of the electric field. Conversely, the plasma chemical reaction model emphasizes the microscopic perspective, concentrating on the generation and dissipation of species during the discharge process. This includes ionization reactions that generate positive ions, dissociation reactions that produce various free radicals and atoms, and heavy-species reactions that form new substances. The Boltzmann equation calculates electron transport parameters (e.g., electron mobility and electron diffusion coefficient) and chemical reaction rate coefficients based on gas molecule collision cross-section data and the two-term approximation.
2.2. Establishment of the Hybrid Numerical Model
2.2.1. Calculation of Electron Transport Parameters and Reaction Rate Coefficients
When employing the hybrid numerical model to analyze the physical processes of air discharge, it is crucial to determine key electron transport parameters and energy transfer coefficients. The electron energy distribution function (EEDF) serves as the foundation for acquiring these parameters. Commonly used EEDF models include Druyvesteyn, Maxwellian, and Generalized distributions. The Druyvesteyn distribution primarily accounts for elastic collisions between electrons and air molecules while disregarding inelastic collisions, making it suitable for low-pressure conditions dominated by elastic collisions. The Maxwellian and Generalized distributions are typically applicable to plasmas in thermodynamic equilibrium systems. However, air partial discharge falls into the category of non-equilibrium low-temperature plasma discharge, rendering these three distribution assumptions potentially inapplicable. In non-equilibrium discharges, the electron energy distribution cannot be adequately described by these simplified models; instead, an accurate EEDF must be derived by solving the Boltzmann equation. The general form of the Boltzmann equation can be expressed as Equation (1):
where
is the electron energy distribution function;
is the electron velocity vector;
is the spatial electric field;
is the spatial magnetic field;
is the particle charge;
is the particle mass;
is the gas particle number density;
is the collision integral operator, which represents the scattering of electrons or ions in the velocity space after colliding with the background gas, considering all elastic and inelastic collision processes; and
is the collision cross-section. Each cross-section characterizes the probability of a specific collision process at the microscopic particle level.
The average electron energy can be obtained by integrating the electron energy distribution function:
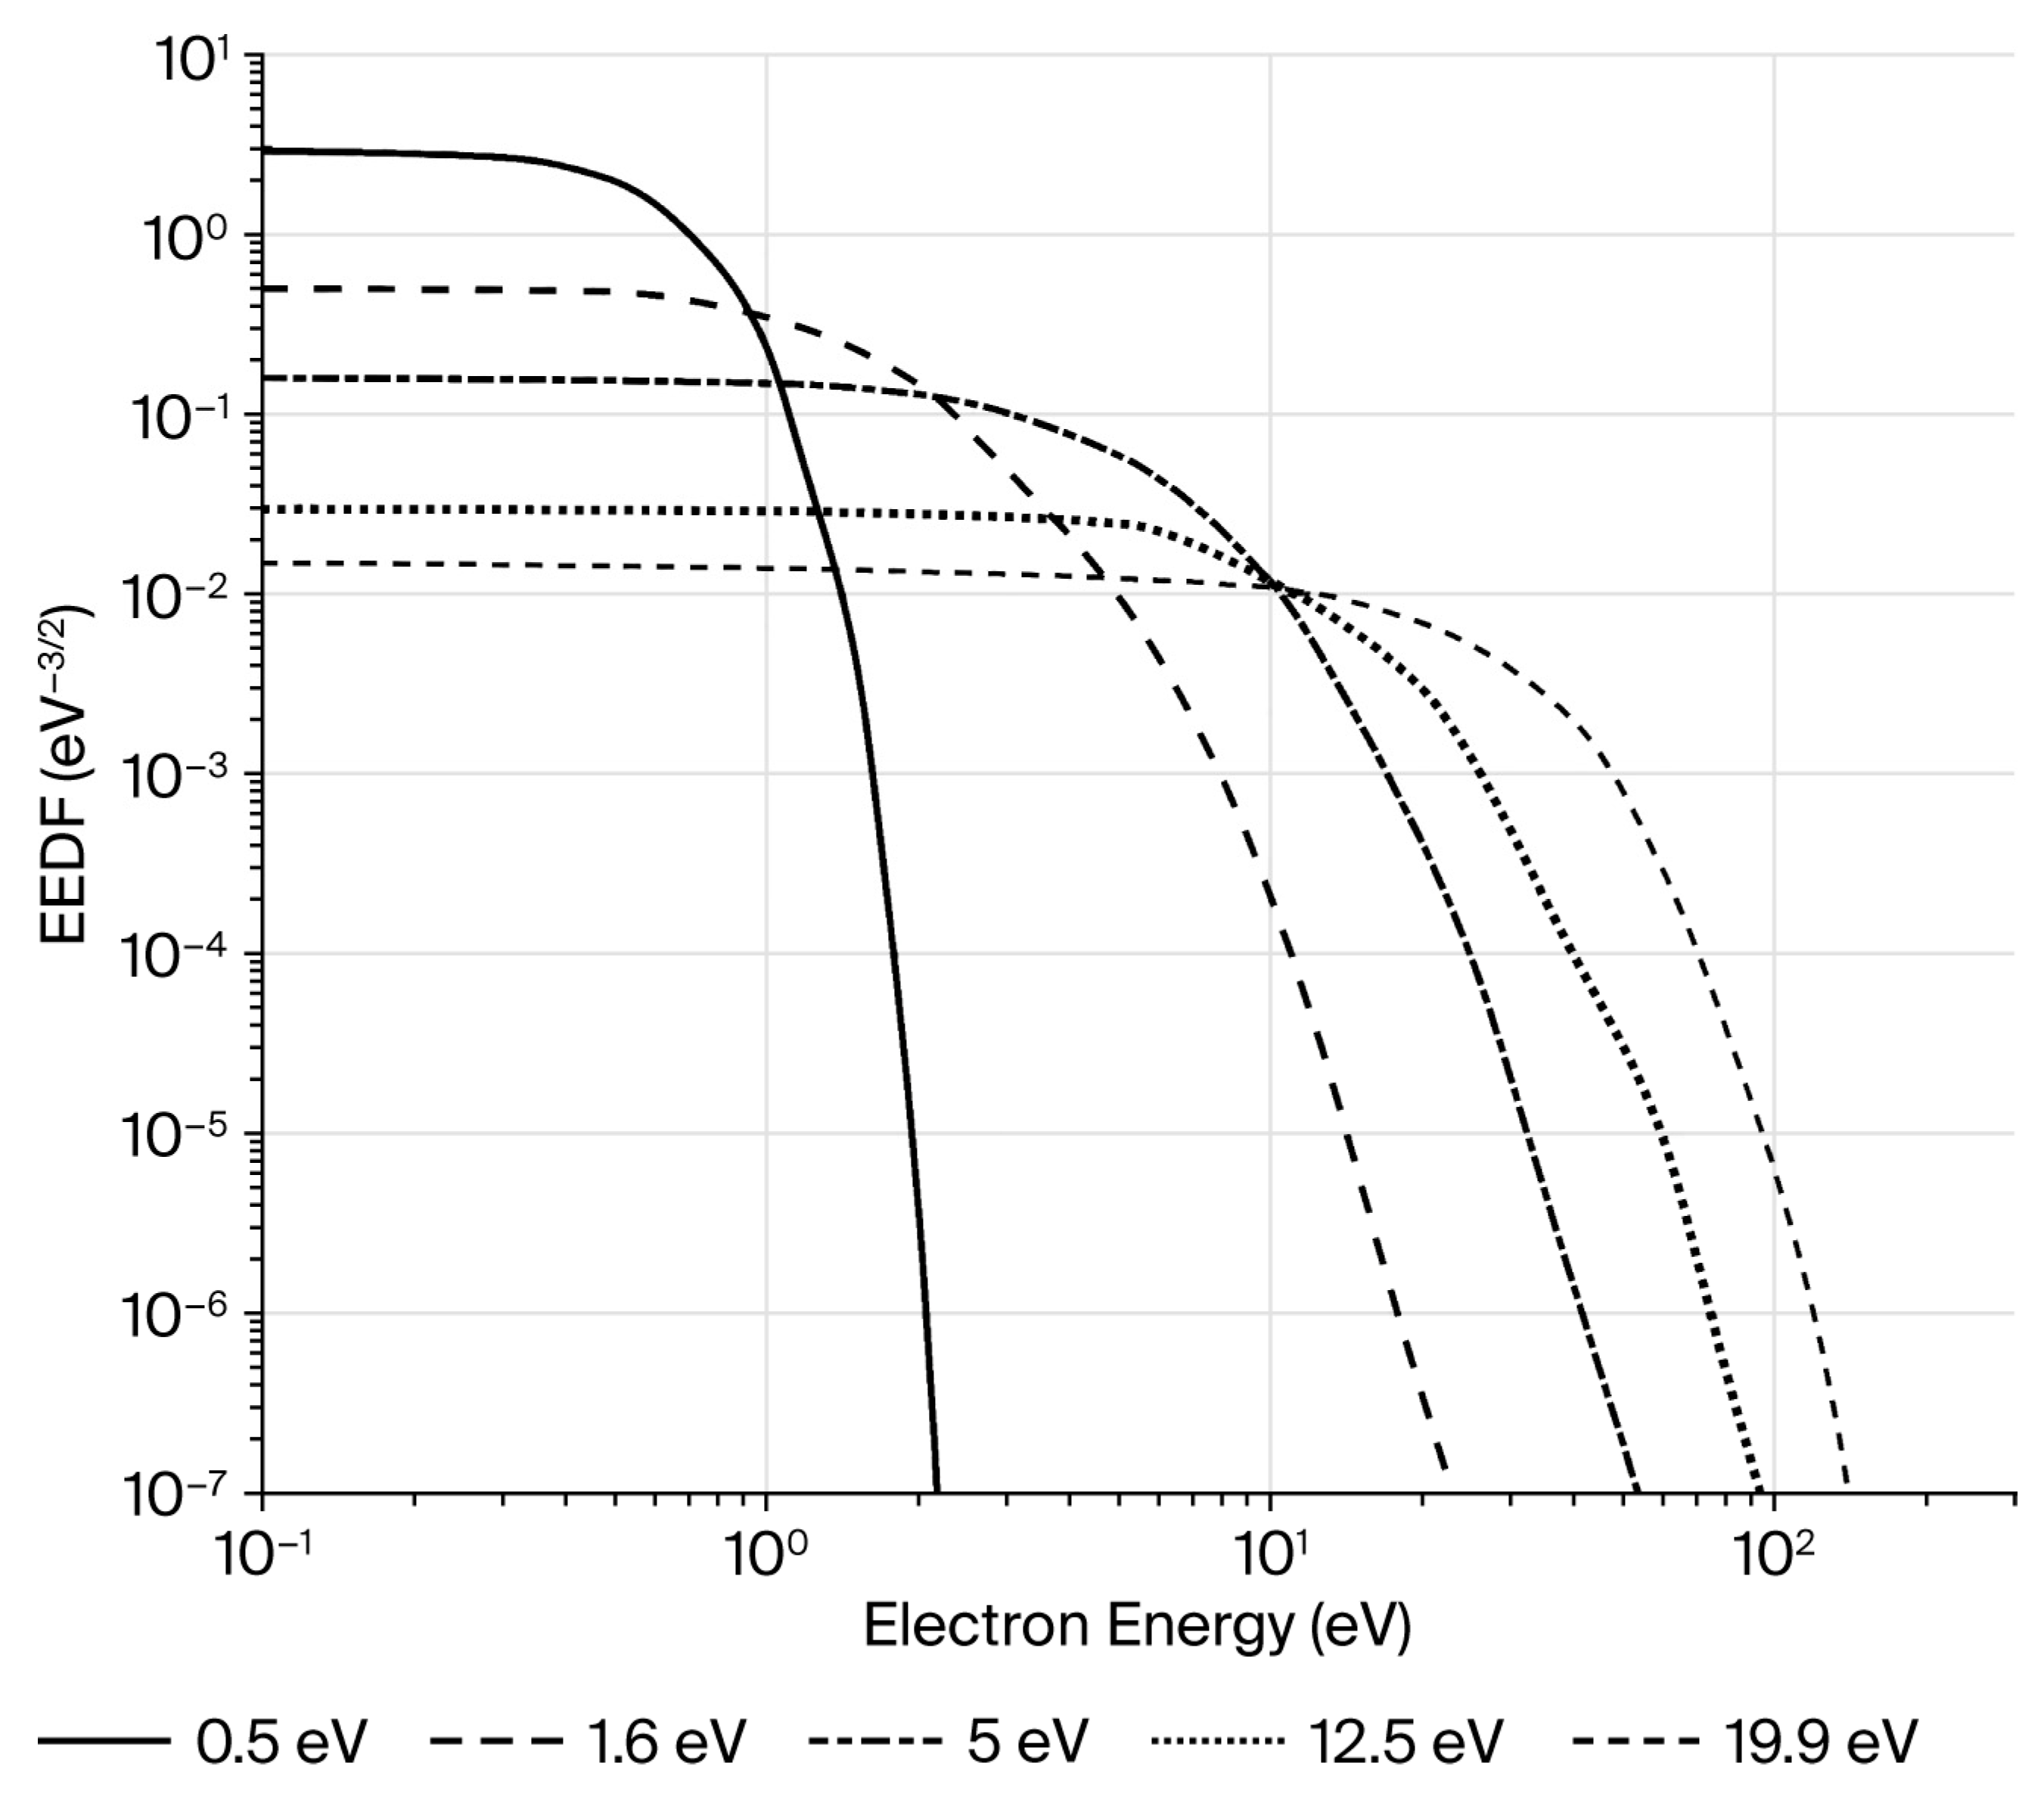
Figure 1 illustrates the electron energy distribution functions (EEDFs) at an air temperature of 300 K for mean electron energies of 0.5 eV, 1.6 eV, 5.0 eV, 12.5 eV, and 19.9 eV, respectively. The majority of electrons are distributed within the low-energy range of 0–10 eV, whereas high-energy electrons with energies higher than 20 eV account for a relatively small proportion. As the mean electron energy increases, the proportion of high-energy electrons also increases, which enhances the probability of electron-impact dissociation and ionization reactions.
The electron transport parameters can be calculated using Equations (3) and (4):
where
is the electron mobility, and
is the electron diffusion coefficient.
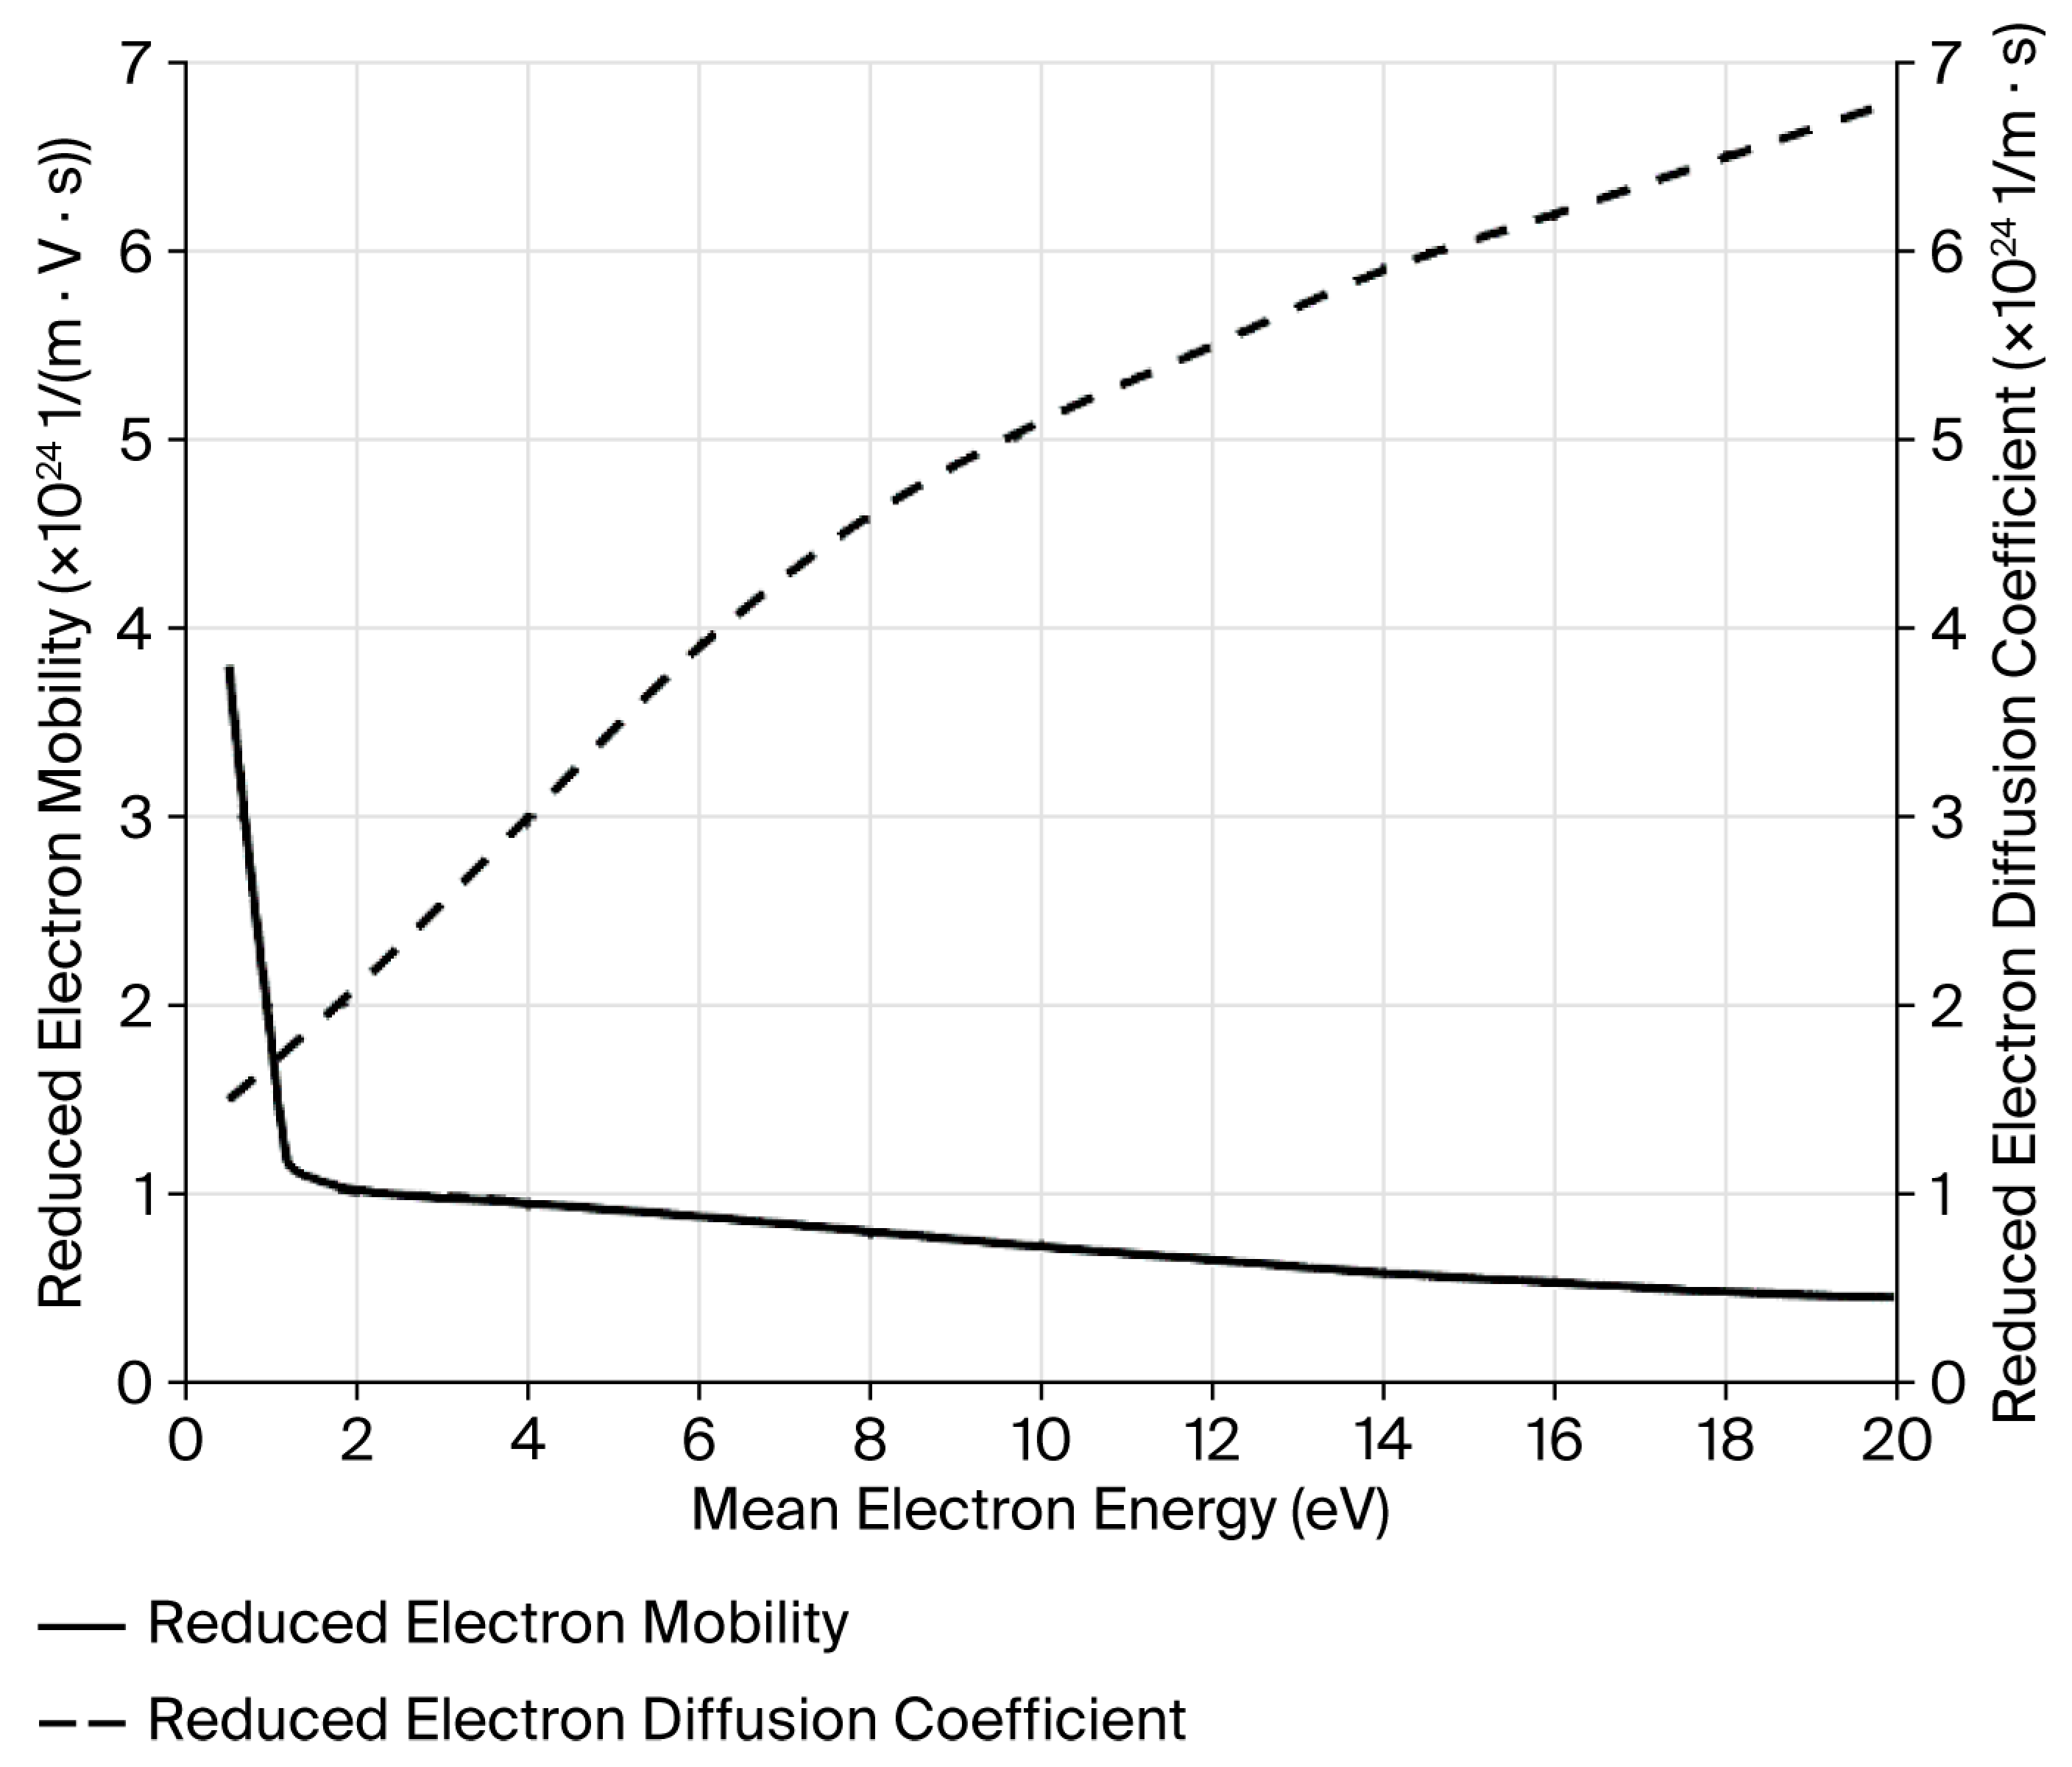
Figure 2 shows that variations in reduced electron mobility and reduced electron diffusion coefficient are functions of the mean electron energy. To facilitate this comparison, the two parameters are plotted using scaled ordinates. When the mean electron energy is lower than 1 eV, the reduced electron mobility decreases rapidly with increasing mean electron energy. When the mean electron energy exceeds 1 eV, the decreasing trend becomes more gradual.
In contrast, the reduced electron diffusion coefficient increases rapidly when the mean electron energy is lower than 1 eV. When the mean electron energy is between 1 and 2 eV, the reduced electron diffusion coefficient remains approximately constant. When the mean electron energy further increases from 2 to 20 eV, the reduced electron diffusion coefficient rises again. This is mainly because the increase in electron temperature enhances the random thermal motion of electrons, thereby promoting electron diffusion.
Similarly, the energy transfer parameters and reaction rate coefficients can be obtained from the electron energy distribution function (EEDF):
where
is the electron energy mobility;
is the electron energy diffusion coefficient; and
is the rate coefficient for the reaction.
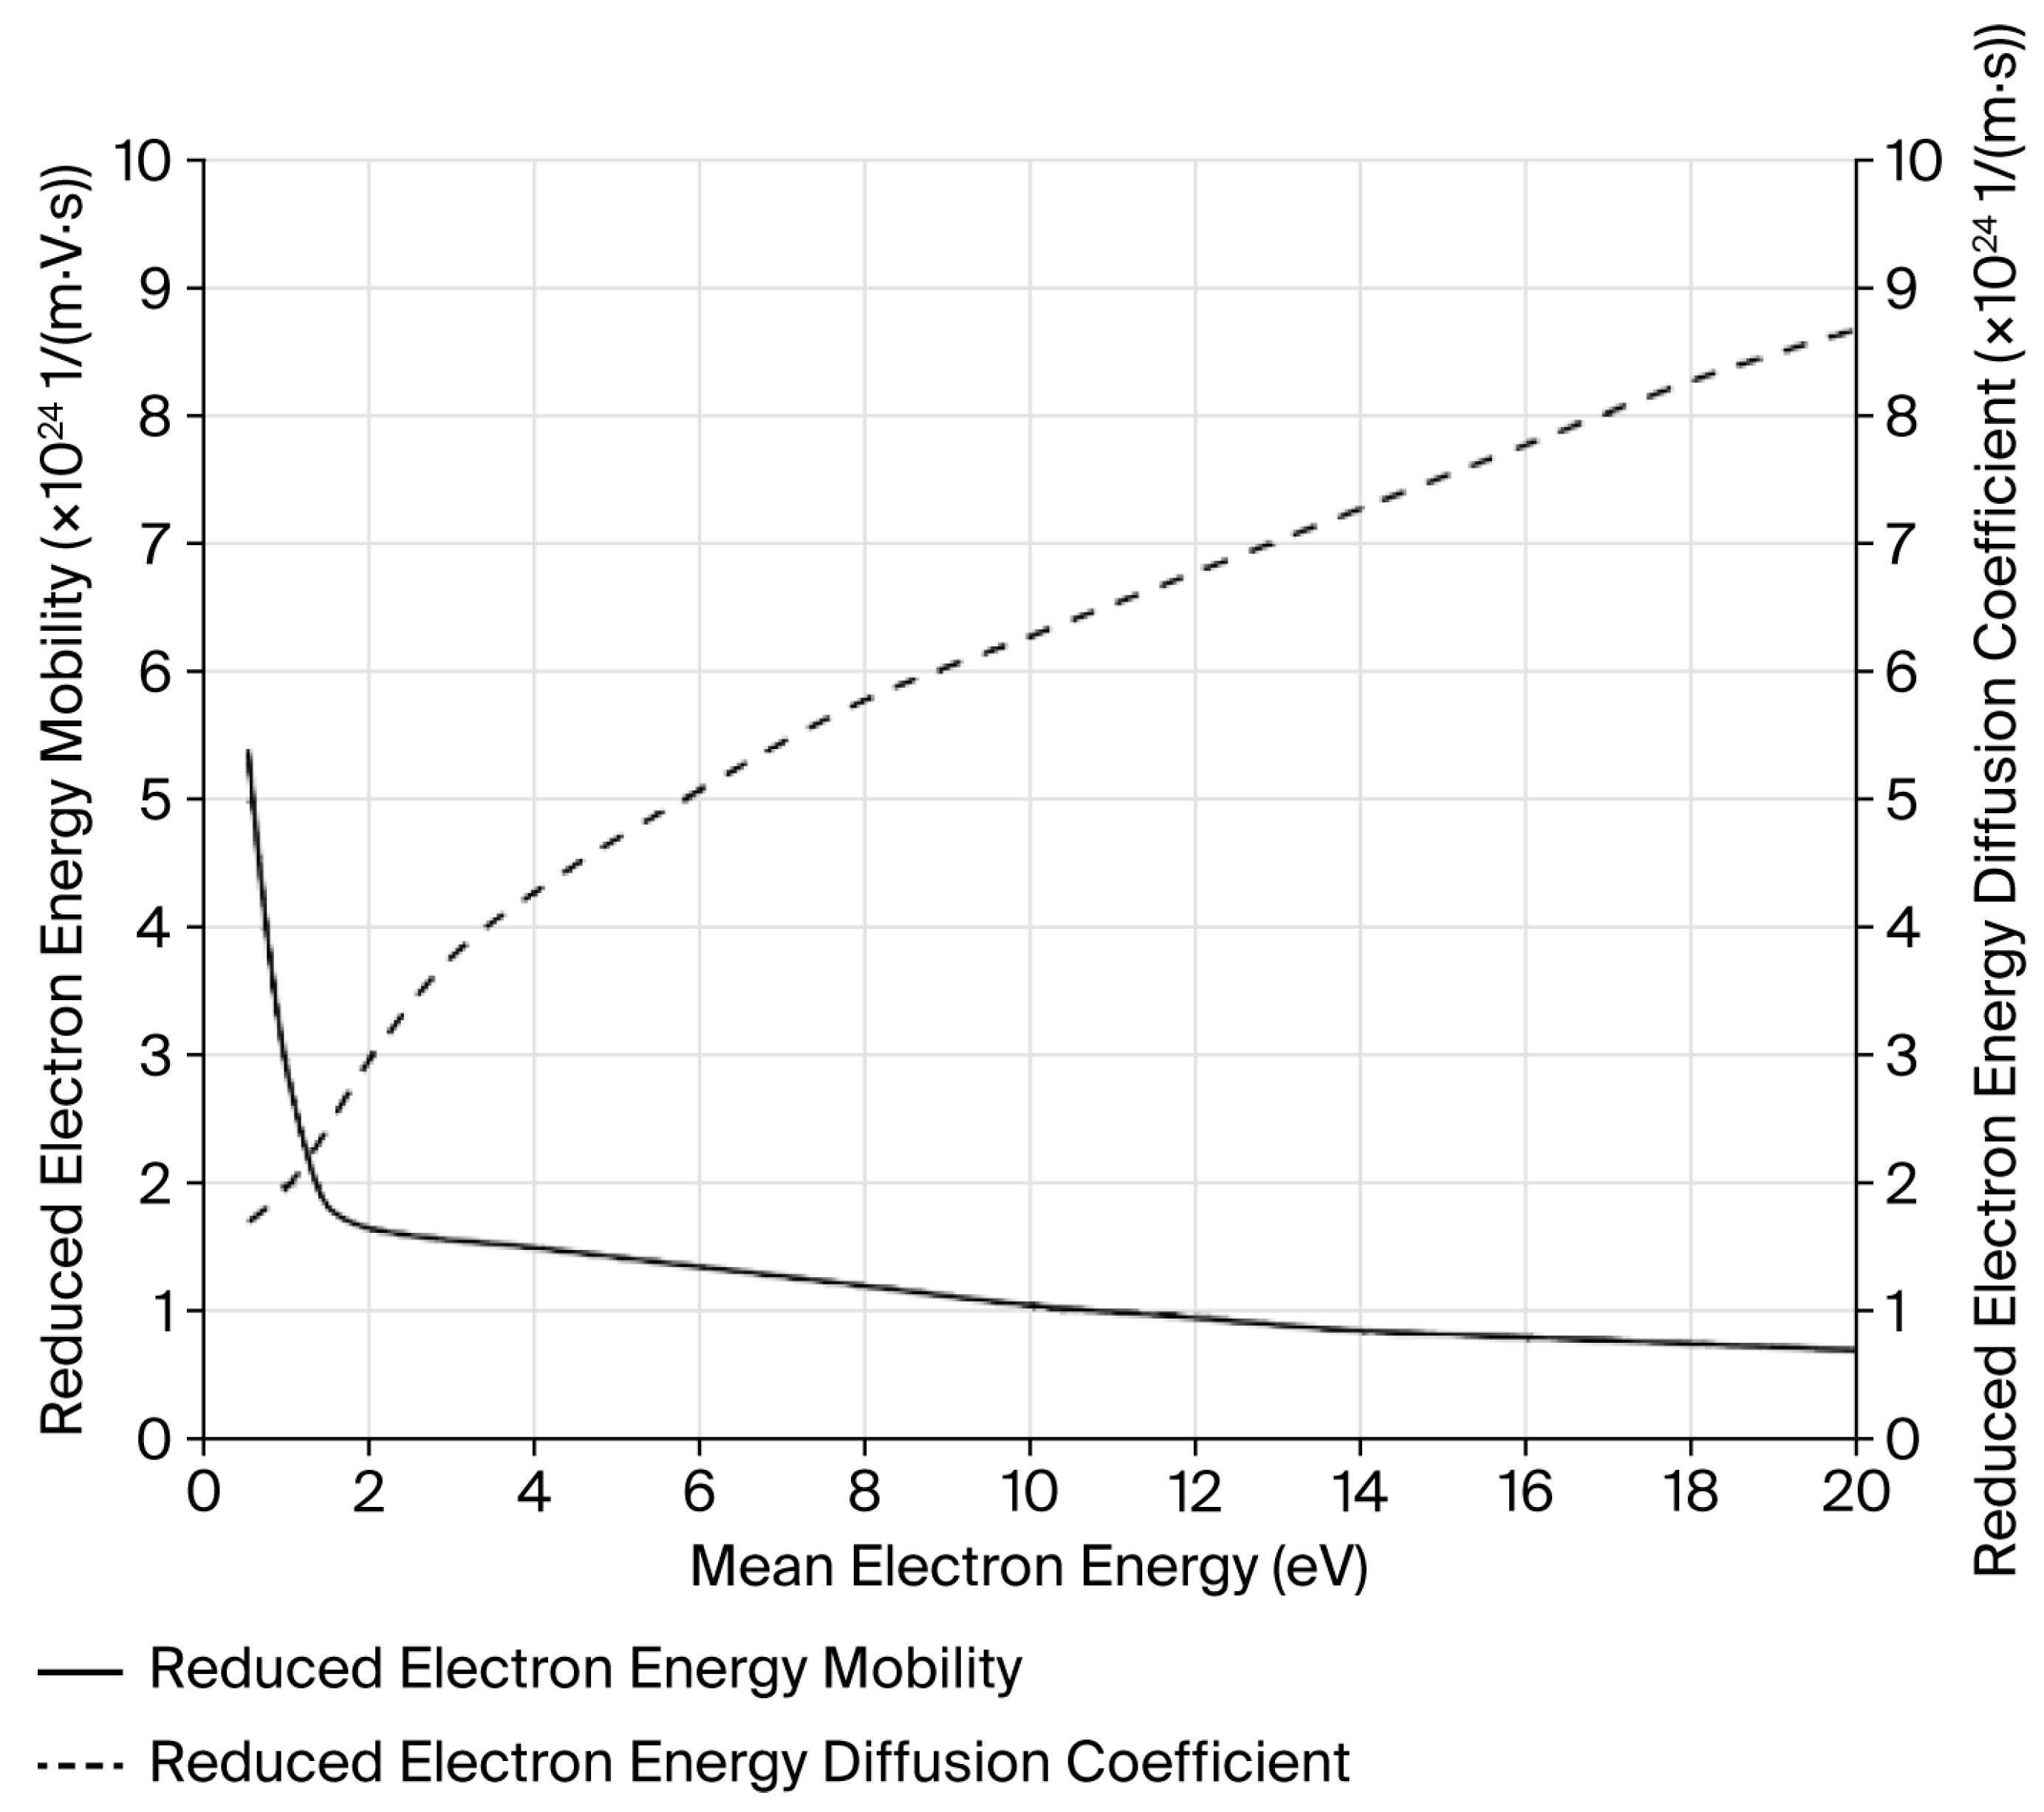
Figure 3 illustrates the relationship between the reduced electron energy mobility (
) and the reduced electron energy diffusion coefficient (
) as a function of the mean electron energy. The trend of variation in reduced electron energy mobility with respect to the mean electron energy is similar to that of the reduced electron mobility. Similarly, the trend of variation in the reduced electron energy diffusion coefficient with respect to the mean electron energy is similar to that of the reduced electron diffusion coefficient. As electrons acquire more energy, their degree of directional movement weakens, leading to a decrease in reduced electron energy mobility and an increase in the reduced electron energy diffusion coefficient.
2.2.2. Governing Equations of the Fluid Dynamics Model
The fluid dynamics model describes the physical phenomena that occur during the air discharge process through a set of normalized partial differential equations (PDEs), including the behaviors of electrons and heavy species, energy exchange, and the electric field distribution. These equations involve electron continuity, species transport, momentum conservation, energy balance, and the relationship between the electric field and charge.
The electron continuity equation fundamentally describes the spatial distribution and motion of electrons. This equation typically contains an inertial term (reflecting changes in electron momentum) and a convective term (reflecting the spatial transport of electrons caused by drift and diffusion). Under corona discharge conditions, due to frequent collisions between electrons and gas molecules, the electron momentum rapidly reaches a steady-state distribution adapted to the local electric field. Therefore, the electron inertial effect is negligible, and the inertial term can be omitted.
Simultaneously, because the mean free path of electrons is extremely small, the distance traveled by an electron between two consecutive collisions is very short and negligible compared to the macroscopic scale of the entire discharge space. This implies that the macroscopic motion of electrons is primarily governed by electric field-driven drift and concentration gradient-induced diffusion, rather than the intrinsic inertial motion of the electrons themselves. Consequently, the convective term can be neglected in the electron continuity equation.
The simplified electron continuity equation can be expressed as Equation (8):
where
is the electron number density;
is the electron ionization coefficient;
is the electron drift coefficient;
is the electron attachment coefficient;
is the electron-ion recombination coefficient;
is the positive ion number density;
is the electron dissociation coefficient; and
is the initial electron density.
In the fluid dynamics model, the diffusion and migration terms in the heavy species transport equation are typically employed to describe the random thermal motion of particles and their migration driven by the electric field. However, under the specific conditions of corona discharge, the contributions of these terms to the overall species transport process are relatively minor and can therefore be neglected. The simplified transport equation for heavy species can be expressed as follows:
where
is the gas density;
is the mass fraction of species
k;
is the fluid velocity vector;
is the diffusive flux;
is the rate of change in species
k induced by chemical reactions;
is the multicomponent diffusion coefficient;
is the thermal diffusion coefficient;
is the gas temperature; and
is the diffusional driving force.
During the corona discharge process, the relationship between the electric potential and the electric field is given by Poisson’s equation:
where
is the electric potential, and
is the permittivity.
2.2.3. Chemical Reaction Model
Air primarily consists of nitrogen, oxygen, and a minor fraction of carbon dioxide. In air discharge plasmas, a wide variety of excited-state atoms and molecules are generated, alongside diverse ions. Chemical reactions during the air discharge process can be broadly classified into two main categories: the first involves the participation of electrons, known as electron-impact reactions; the second involves interactions between neutral species and ions, commonly referred to as heavy-species reactions.
Charged particles, accelerated by the electric field, collide in the air with gas molecules, breaking their chemical bonds and dissociating them into N atoms, O atoms, CO,
ions,
ions, and
ions. This process is primarily governed by electron-impact reactions; specific reactions are summarized in
Table 1.
The rate coefficients for reactions R1–R4 and R7 in the above table are calculated by substituting the cross-section data of N
2 and O
2 [
31,
32], obtained from the LXCat database, into the equation
. The rate coefficients for reactions R5 and R6 are adopted from References [
33] and [
34], respectively.
Electron-impact reactions dissociate gas molecules into several new species, which subsequently react with gas components in the air to generate various new gaseous species. For example, O oxidizes N into NO and NO
2 and reacts with O
2 to form O
3. These processes are primarily governed by heavy-species reactions; specific reactions are detailed in
Table 2. The reaction rate coefficients for these processes are sourced from Reference [
35].
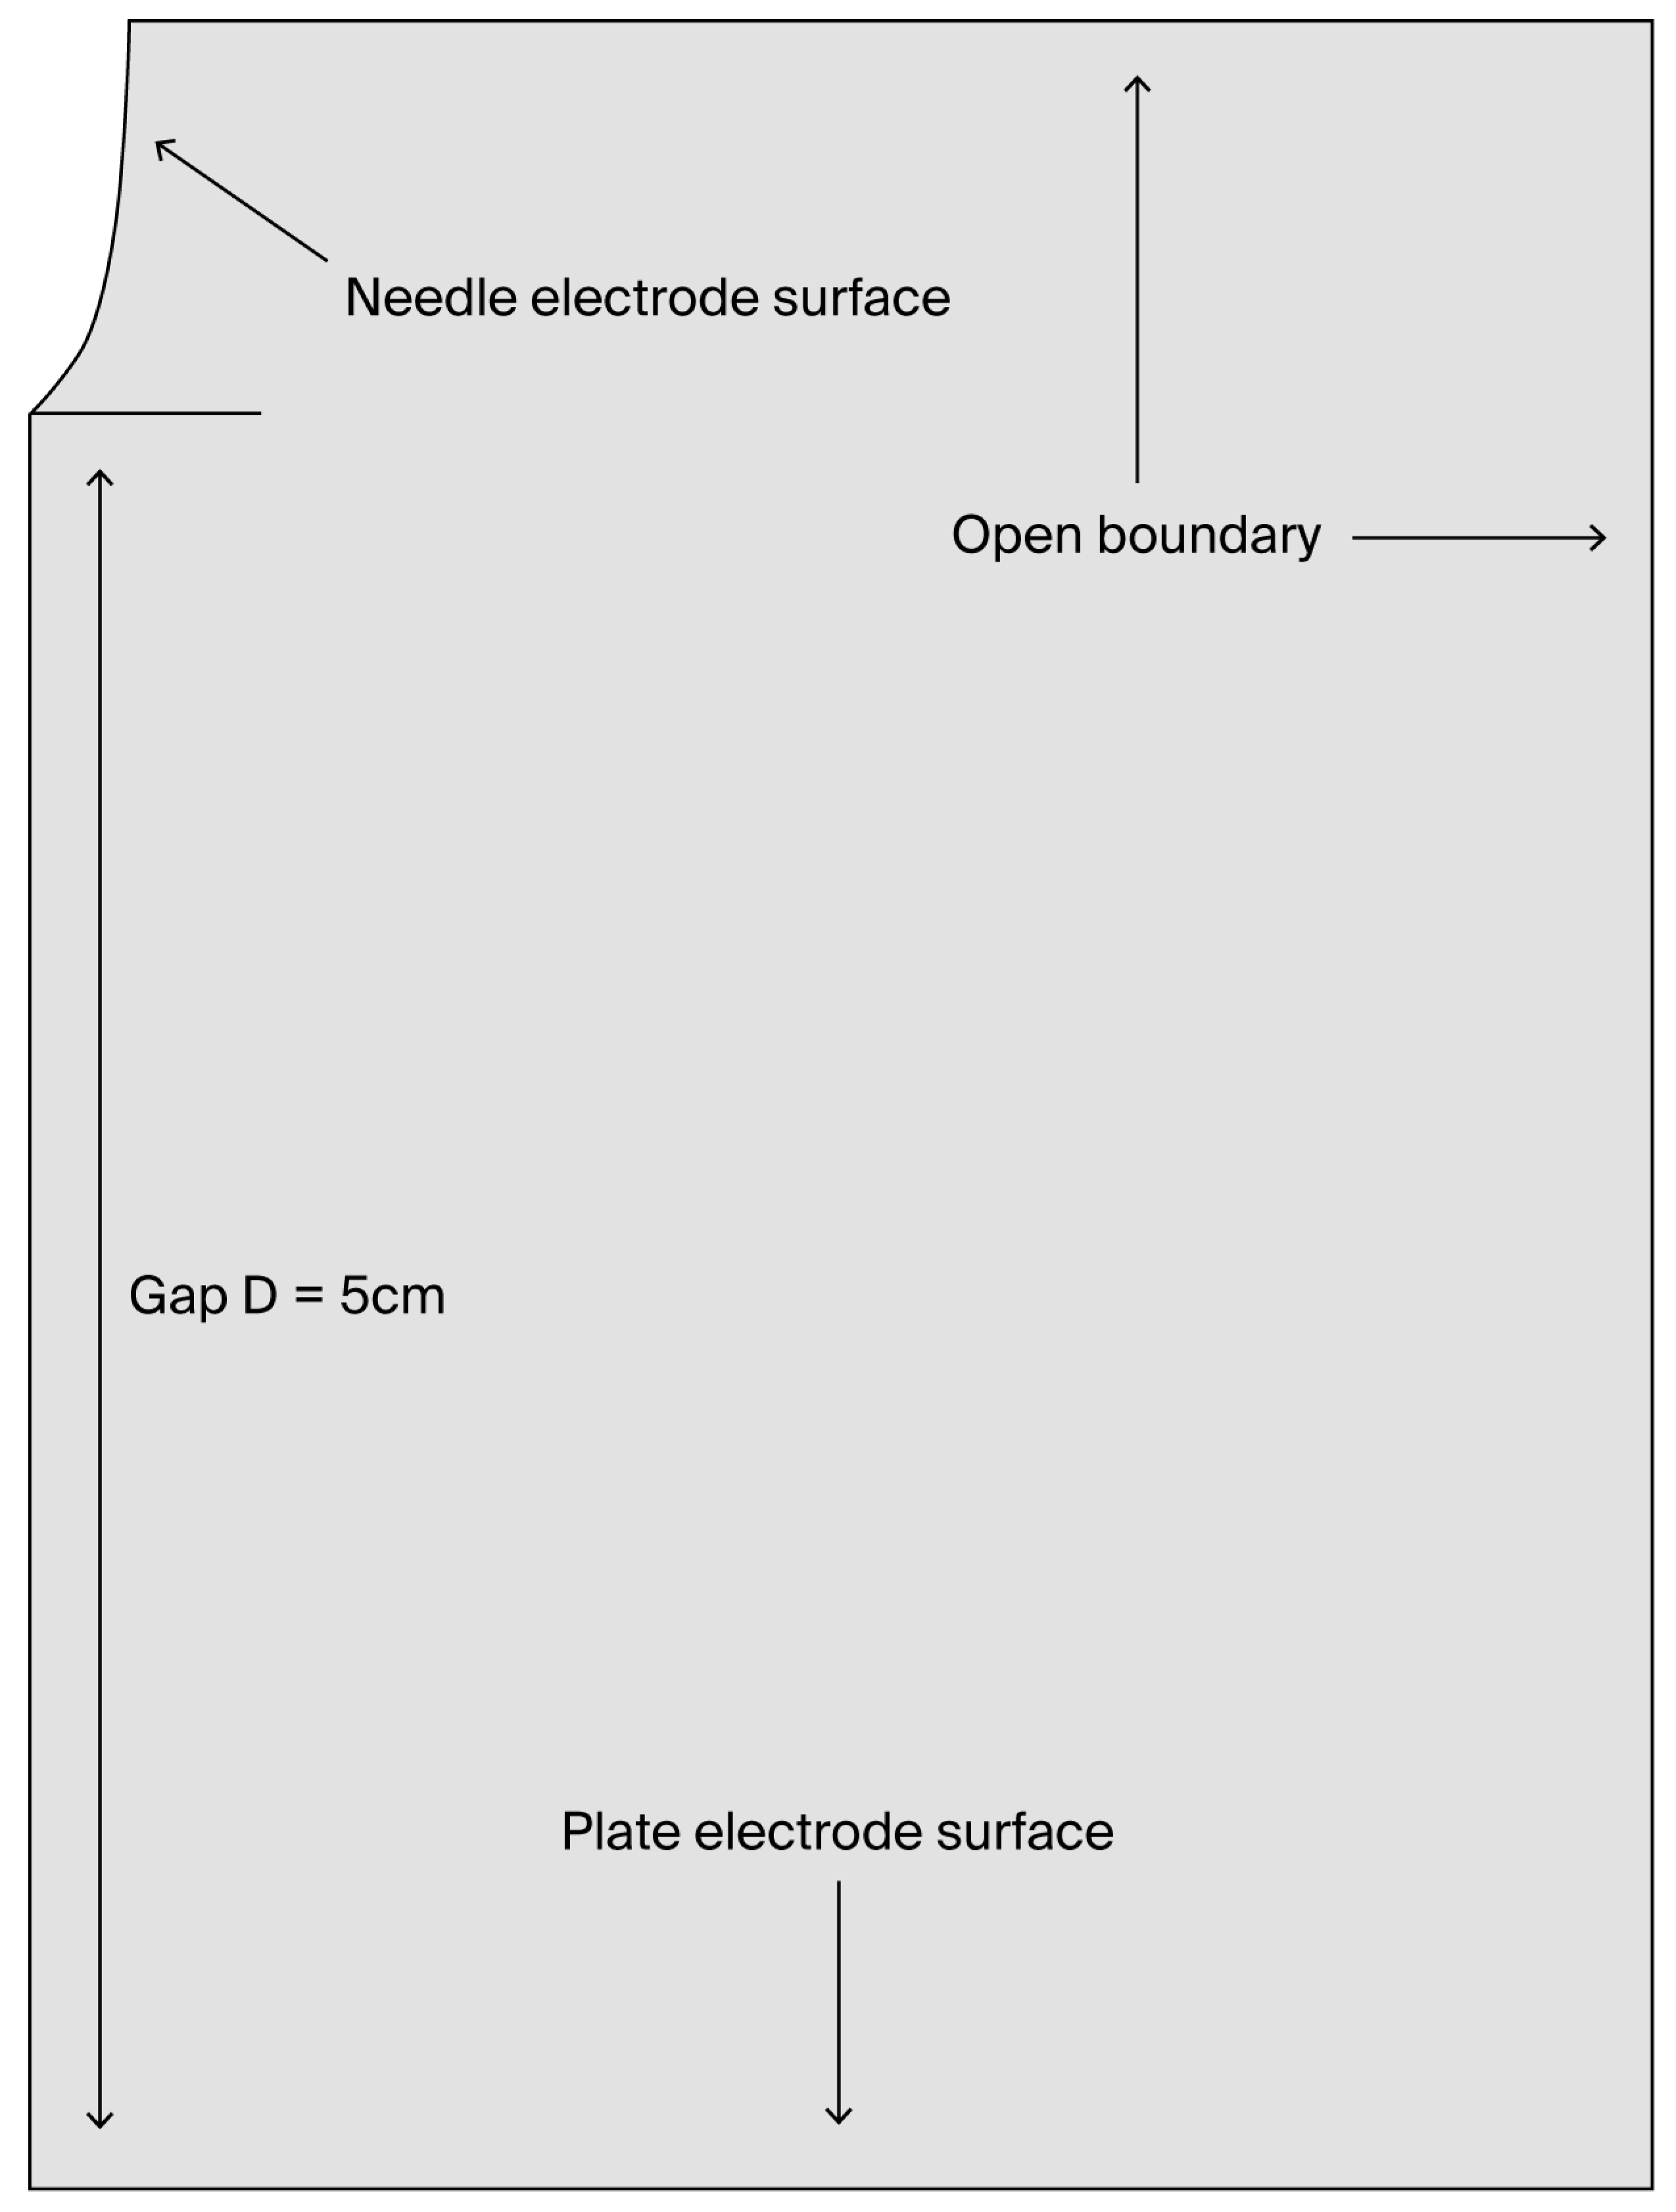
To simplify the calculations, the geometric model of the air partial discharge electrode is established as a 2D axisymmetric model, as shown in
Figure 4. The upper left-hand part shows the high-voltage electrode terminal, where the electric potential is set to 10 kV. The bottom shows the grounded terminal, and the open boundary type is set to “Insulation”.
The primary gas components in air are oxygen and nitrogen, with a small amount of carbon dioxide. In addition, trace amounts of ozone and nitrogen oxides are present. The initial volume fractions are set as follows: 8 × 10⁻⁹ for ozone, 2 × 10⁻⁸ for nitrogen dioxide, 0.21 for oxygen, 0.78 for nitrogen, and 4 × 10⁻⁴ for carbon dioxide. The initial volume fractions of all other gas species are set to 0.
The mesh is generated using free triangular elements. Because the distortion of the electric field is concentrated near the elliptical electrode, and most reactions occur in this region, the mesh was locally refined near the elliptical high-voltage electrode and its adjacent region. Here, the electric-field gradient and reaction rate are relatively high. A coarser mesh was used in the remaining low-gradient regions to balance computational accuracy and efficiency. The simulation time step is set to 10−10 s.
2.3. Analysis of Simulation Results
The simulation time scale mainly reflects the microscopic generation process of primary discharge products in the plasma region. In practical gas monitoring, the detected concentrations correspond to the accumulation and diffusion of relatively stable products over seconds to hours. Therefore, the simulation results are used to explain the initial formation mechanisms of characteristic gases, while the experimental sections focus on gas accumulation behavior over longer monitoring periods.
Mechanisms of Discharge Product Formation and Removal
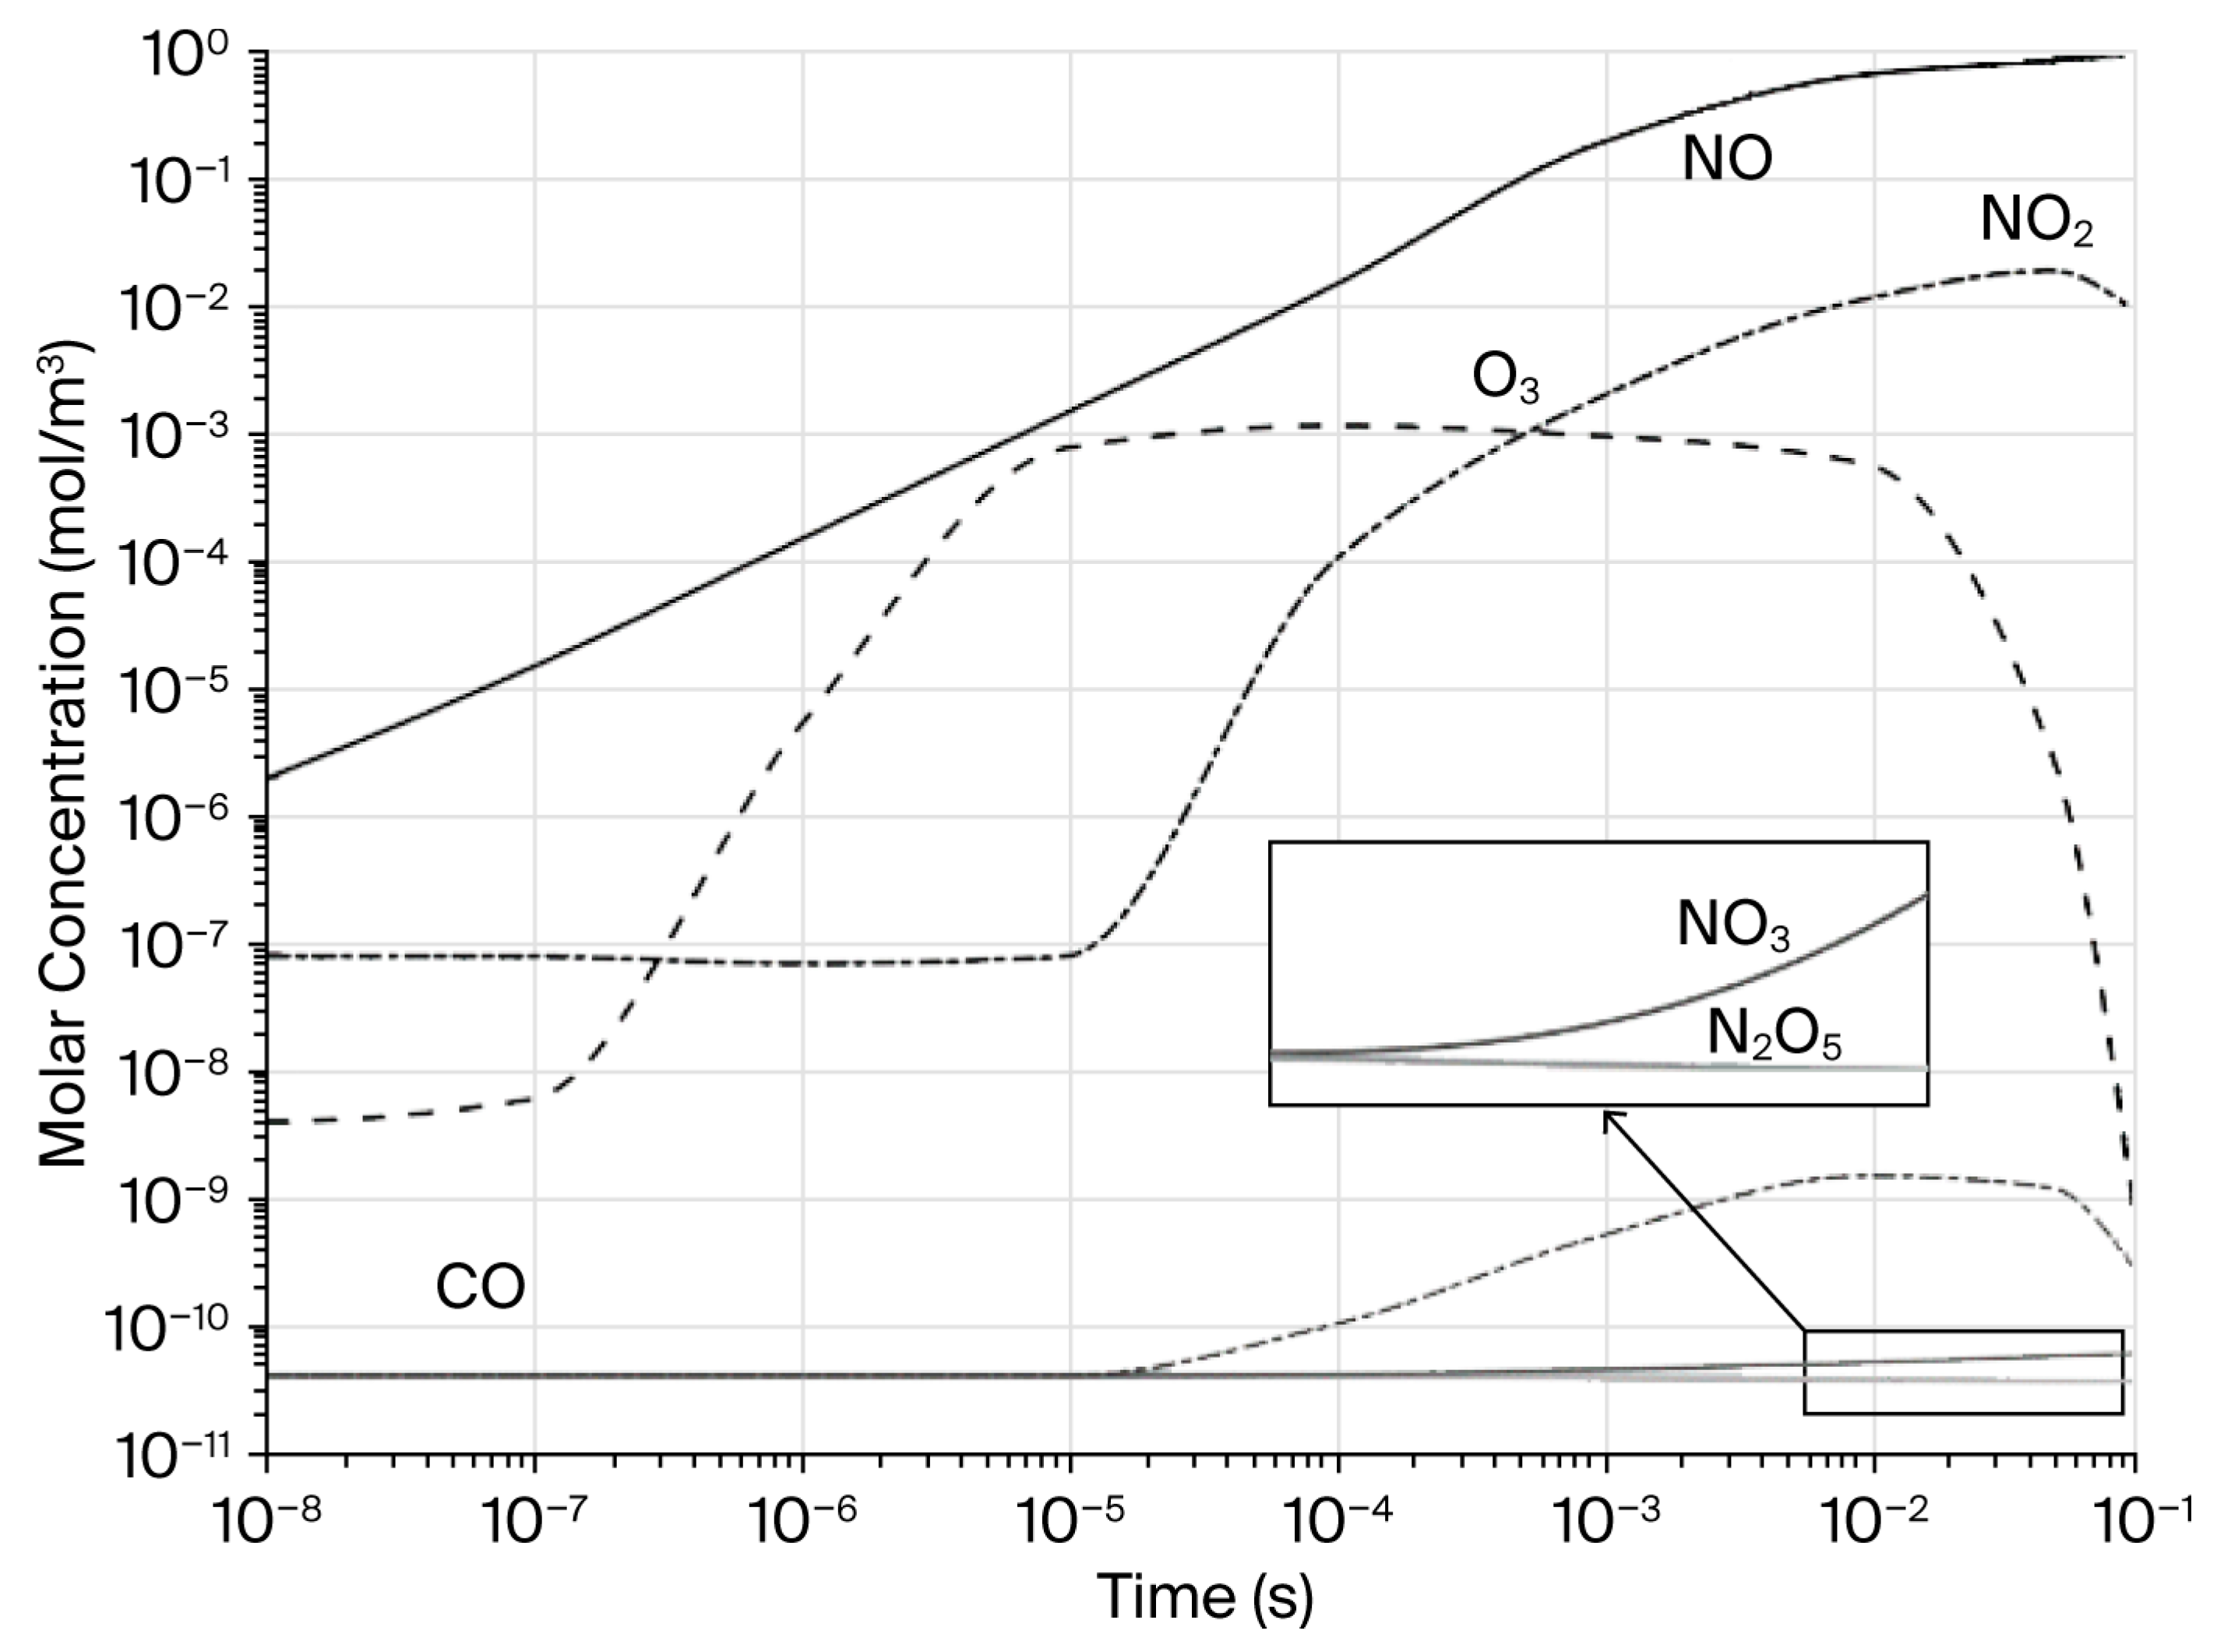
Figure 5 illustrates the concentration profiles of various decomposition products during the air-discharge process. The products generated from partial air discharge in the present model include O
3, NO, NO
2, NO
3, N
2O
5, and CO. The formation sequence of these products is NO → O
3 → NO
2 → CO → NO
3 → N
2O
5, and the order of their peak concentrations is C(NO) > C(NO
2) > C(O
3) > C(CO) > C(NO
3) > C(N
2O
5). Specifically, the concentration of O
3 rapidly increases in the initial stage of discharge, after which its rate of increase gradually decreases. The concentrations of NO
3 and N
2O
5 remain at relatively low levels, which is much lower than those of other products.
The products considered in the present model include O3, NO, NO2, NO3, N2O5, and CO. O3 and NO are important intermediate products, but their concentrations are strongly affected by rapid secondary reactions. NO3 and N2O5 remain at relatively low levels, which makes stable detection difficult. In the simulation, CO is mainly generated from the electron-impact dissociation of background CO2. In experimental defect models involving epoxy resin, additional CO may also be produced through carbon-related oxidation reactions caused by discharge-induced degradation of the insulation material. Therefore, CO reflects both air-plasma chemistry and the participation of carbon-containing insulation materials. H2 and hydrocarbons were not included in the present air-plasma model because the simulation mainly focuses on air-discharge chemistry. Their possible formation related to solid-insulation decomposition will be further investigated in future work.
The detectability of the selected gases was also considered. Among the simulated products, O3 and NO are important intermediate species in air discharge, but their concentrations may be strongly affected by rapid secondary reactions. In contrast, CO and NO2 show relatively better stability and accumulation characteristics, making them more suitable for gas-based monitoring over a certain discharge duration. In addition, CO and NO2 can be detected by commercially available gas sensors, which supports the feasibility of using the CO/NO2 concentration ratio as a diagnostic feature under the tested conditions. Therefore, CO and NO2 were selected as characteristic gases for subsequent experimental analysis.
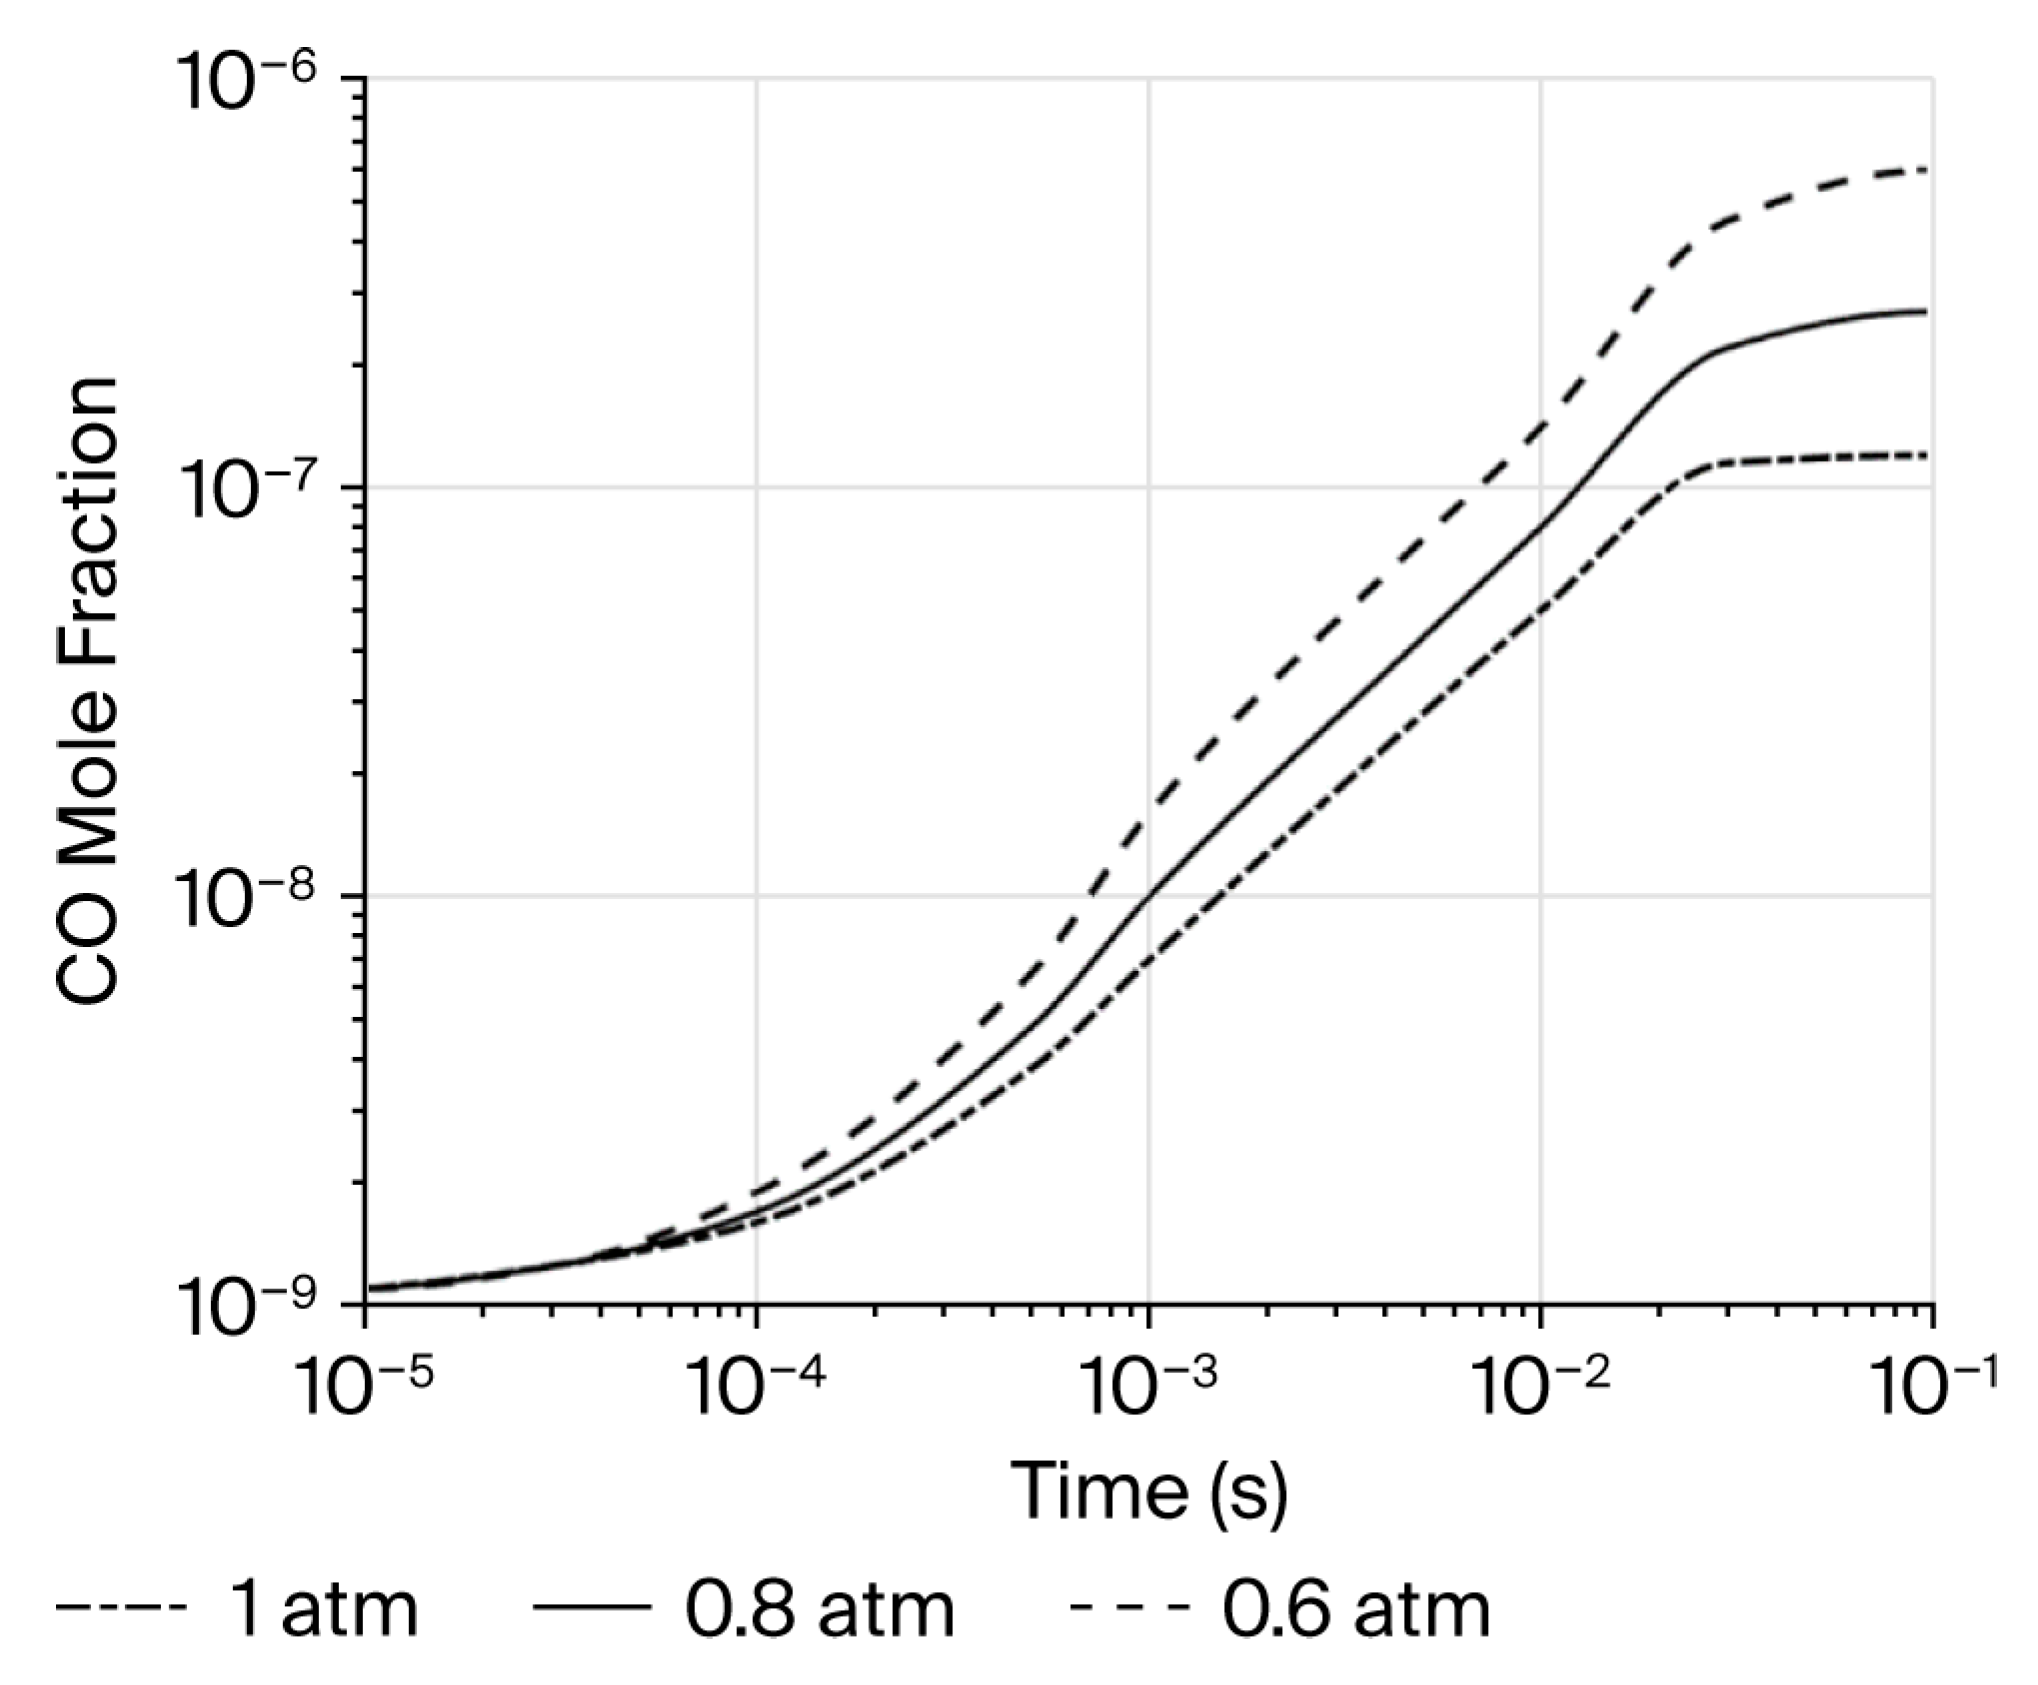
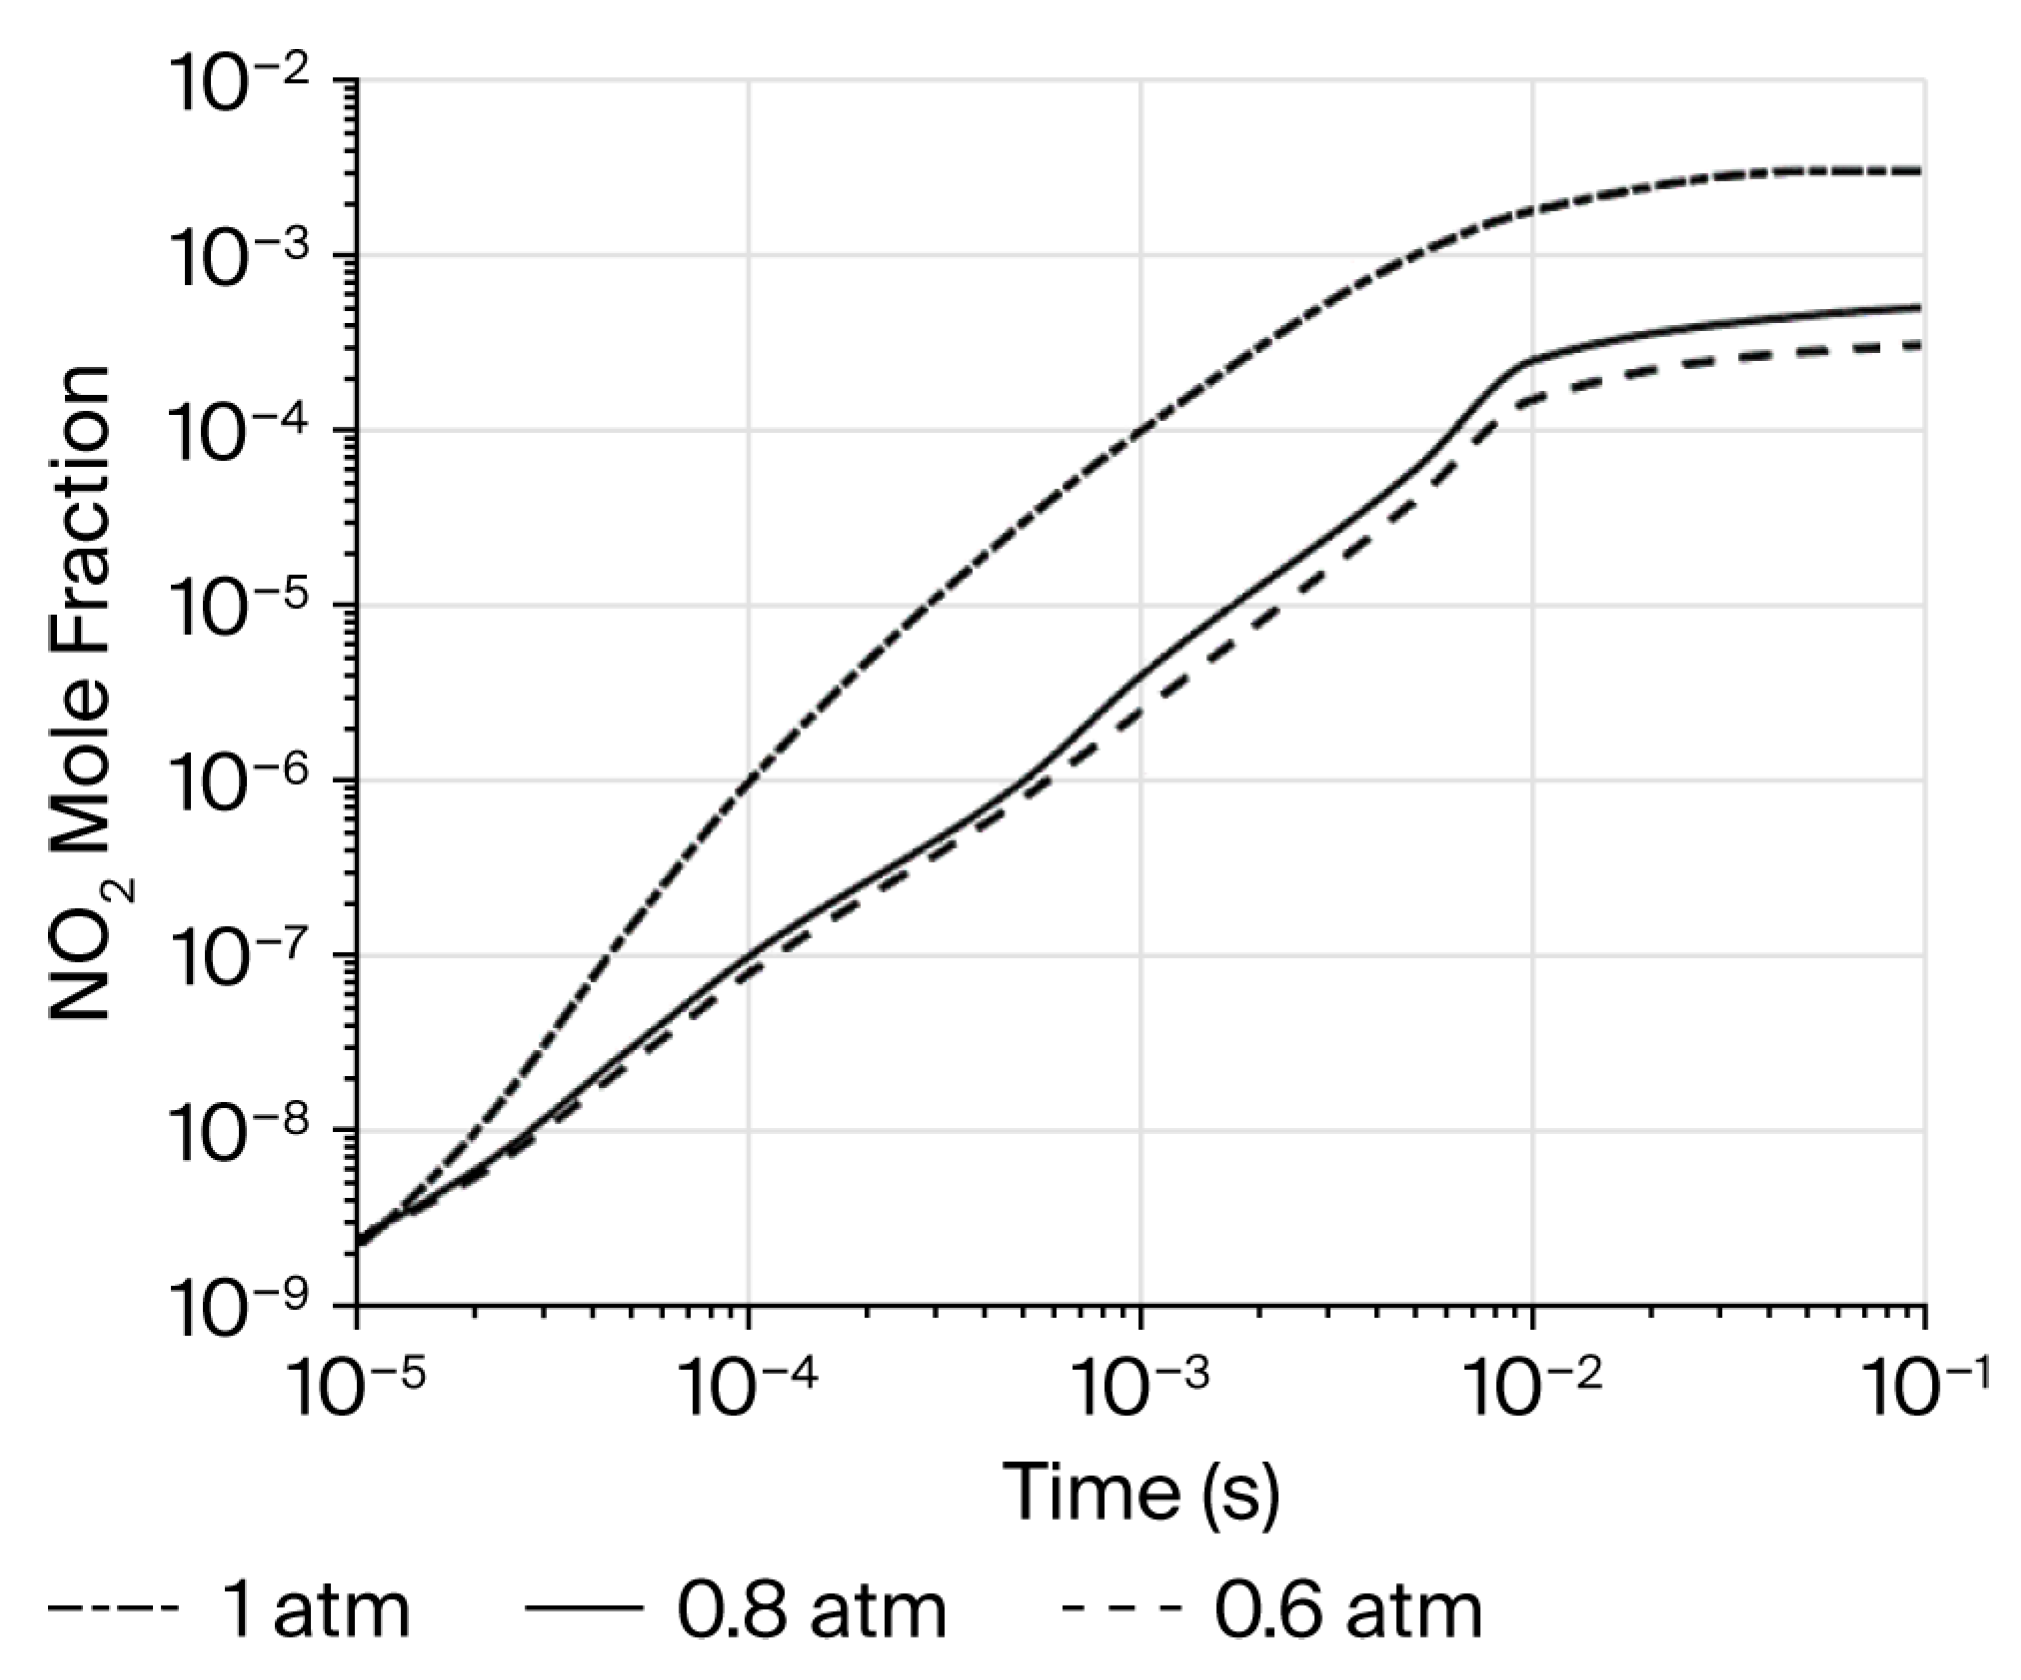
Figure 6 and
Figure 7 present the mole fraction variations in CO and NO
2 at gas pressures of 1 atm, 0.8 atm, and 0.6 atm, respectively. As the gas pressure decreases, the mole fractions of both CO and NO
2 increase.
For CO, its primary formation pathway is the electron-impact dissociation reaction of CO2 (R6). As the gas pressure decreases, electron energy increases, which promotes reaction R6, thereby leading to a higher CO mole fraction. For NO2, its formation pathway involves several steps: first, electrons undergo dissociation reactions with N2 and O2 to produce N and O atoms, respectively (R3 and R4); subsequently, three-body collision reactions between O, O2, and N2 lead to the formation of O3 (R23 and R24); concurrently, N is oxidized by O2 and O3 to form NO (R8 and R9); finally, NO reacts with O3 to generate NO2 (R18). Since the dissociation reactions of N2 and O2 are the initial steps for NO2 formation, a decrease in gas pressure promotes these dissociation reactions, leading to an increase in intermediate products N, O, NO, and O3. This, in turn, promotes subsequent intermediate reactions, ultimately resulting in a higher mole fraction of NO2.
3. Experimental Study on Air Partial Discharge Under Different Defects and Air Pressures
Actual switchgear may develop insulation defects due to manufacturing imperfections, transportation vibration, installation deviation, and long-term aging during service. Typical defects include metal protrusions, voids or air gaps in solid insulation, and surface contamination or degradation. In addition, the internal air pressure of AIS varies with altitude, which affects the inception and development of PD. To investigate air discharge characteristics under different pressure conditions and establish correlations between discharge decomposition products and discharge types, an air discharge simulation experimental platform was constructed. Air PD experiments were conducted under different pressure and defect conditions, and the gas products generated were quantitatively analyzed.
3.1. Experimental Platform and Detection Devices
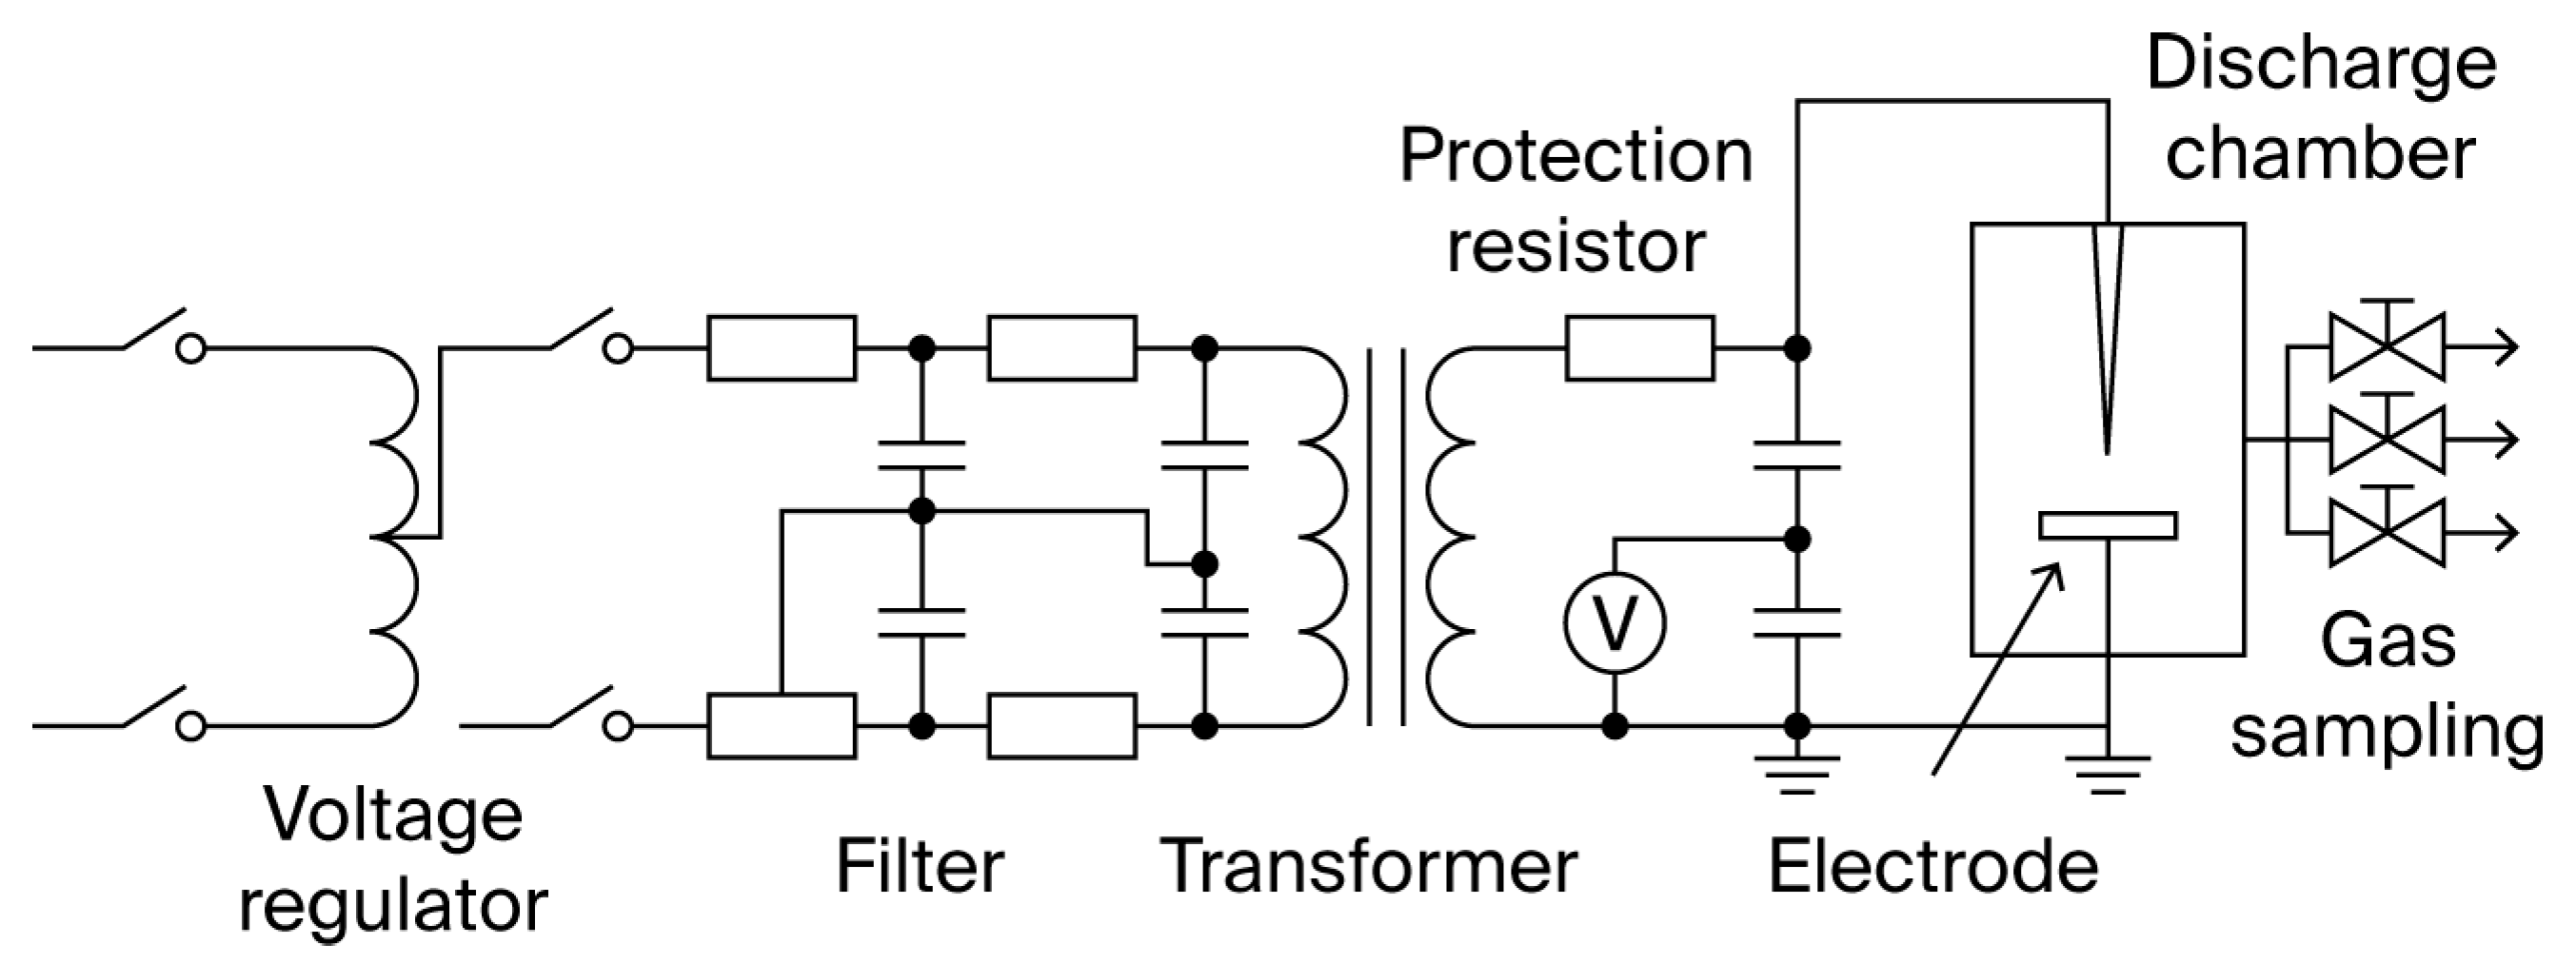
A schematic diagram of the air discharge experimental platform is shown in
Figure 8. The platform primarily consists of a discharge chamber, a capacitive voltage divider, a protective resistor, a transformer, a filter, and a voltage regulator. A 220 V input power frequency voltage is first filtered and then stepped up by a transformer. The transformer has a rated capacity of 30 kVA and an adjustable output voltage range of 0–150 kV. Different altitude environments are simulated by varying the pressure inside the discharge chamber.
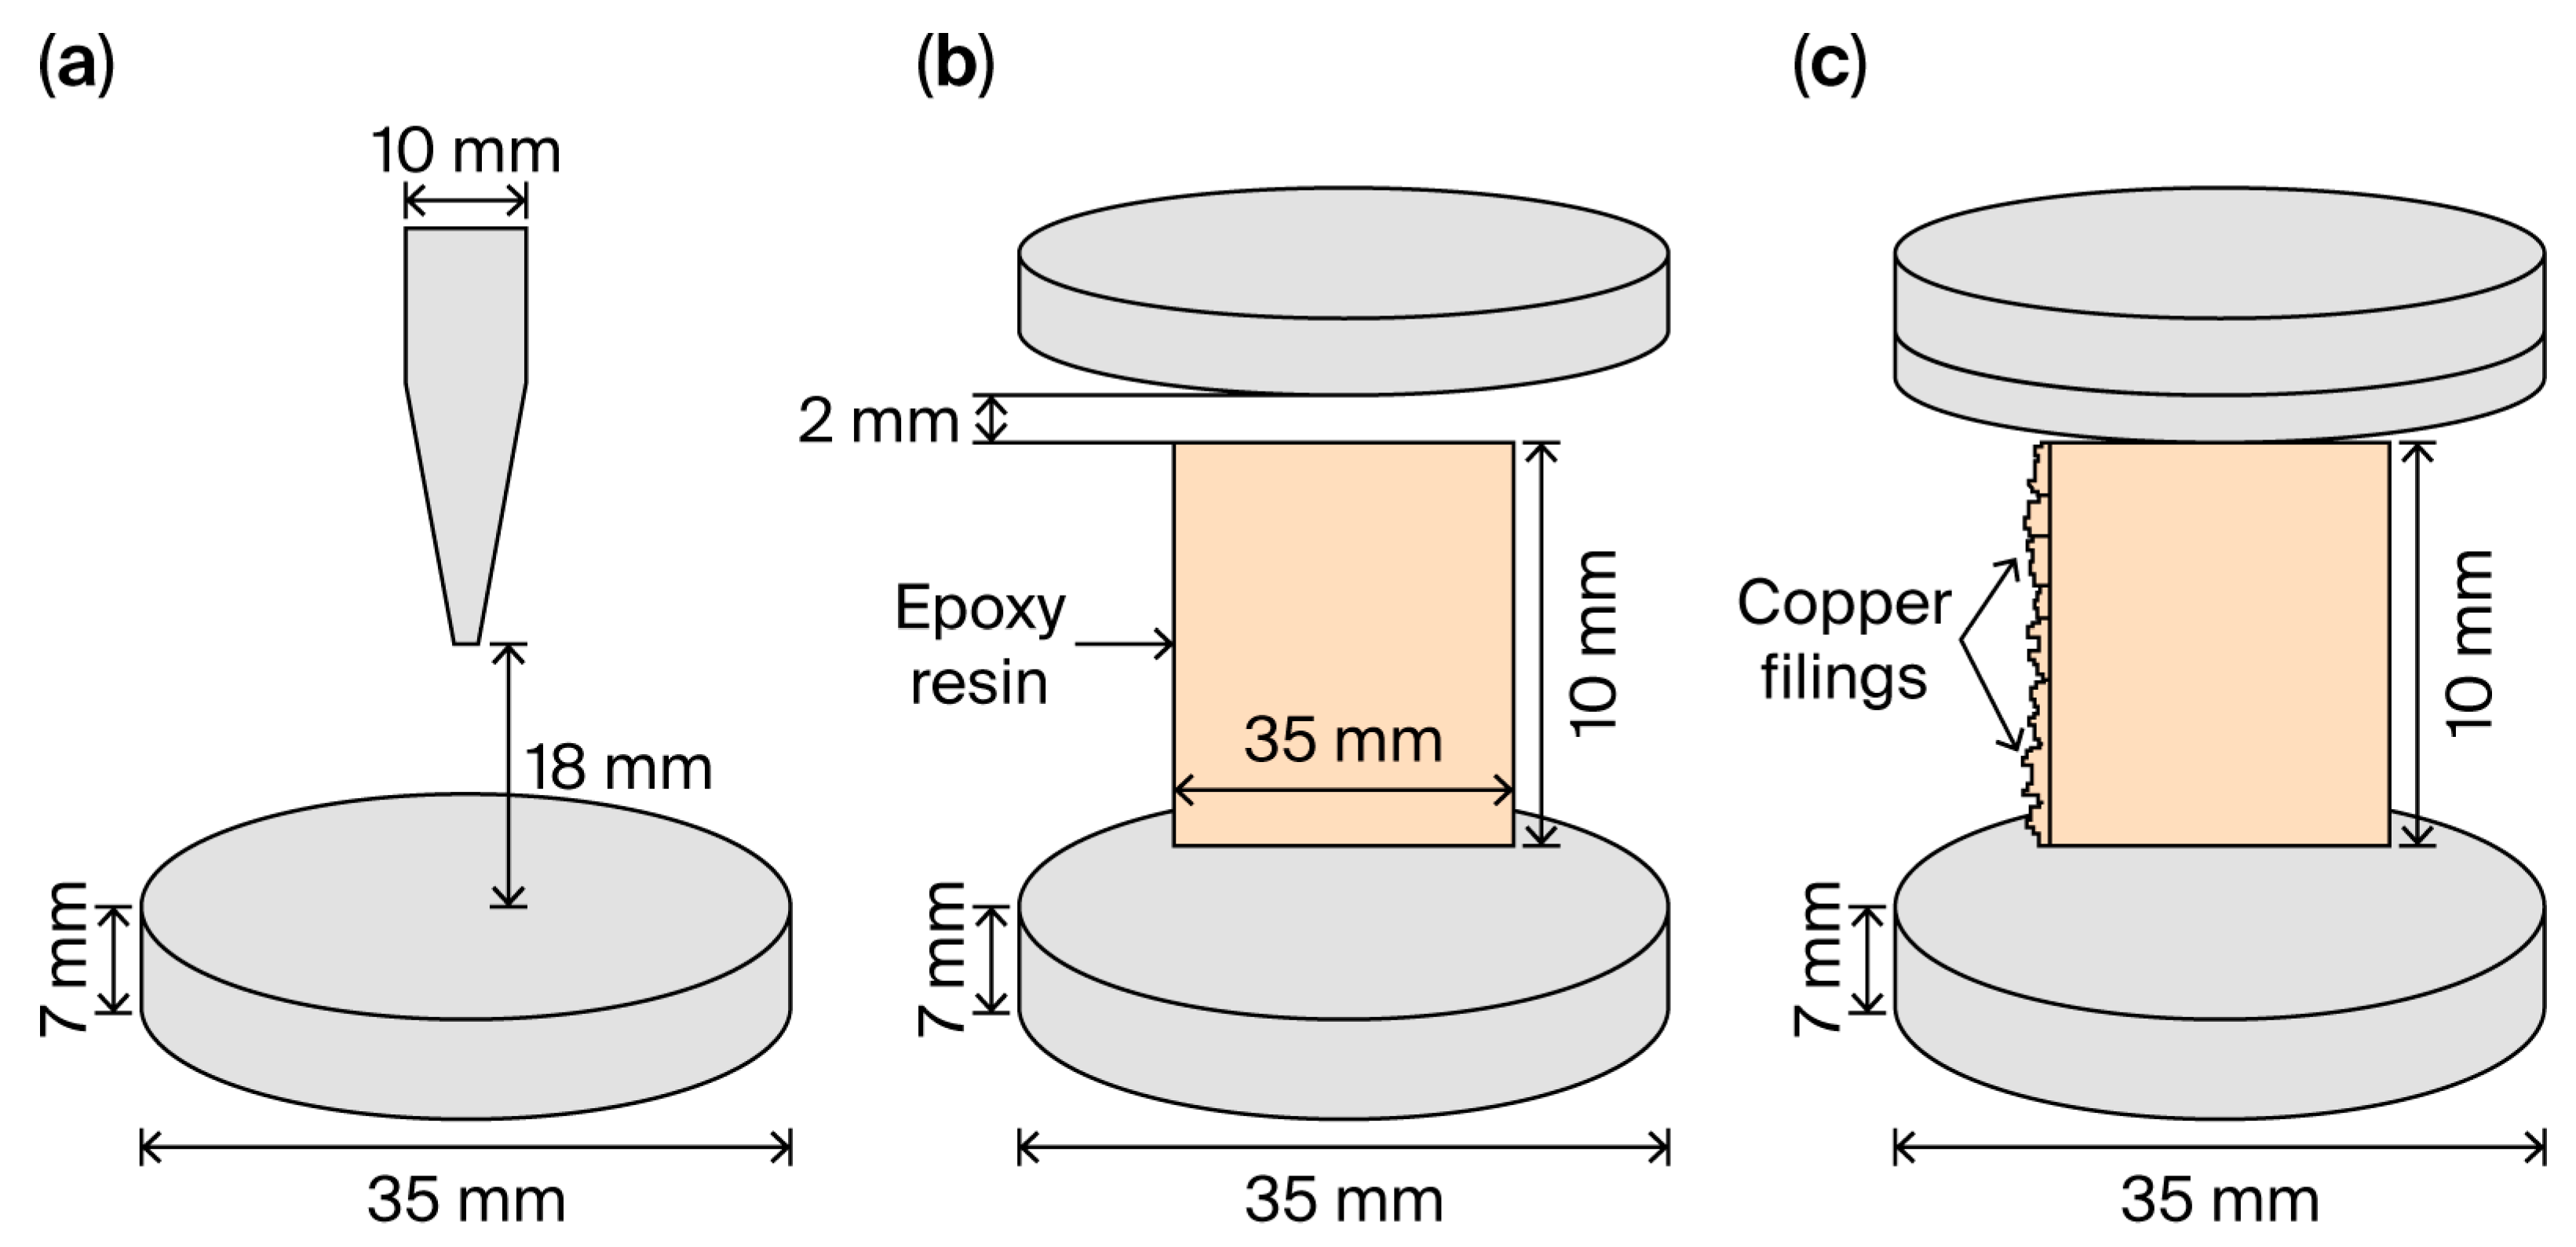
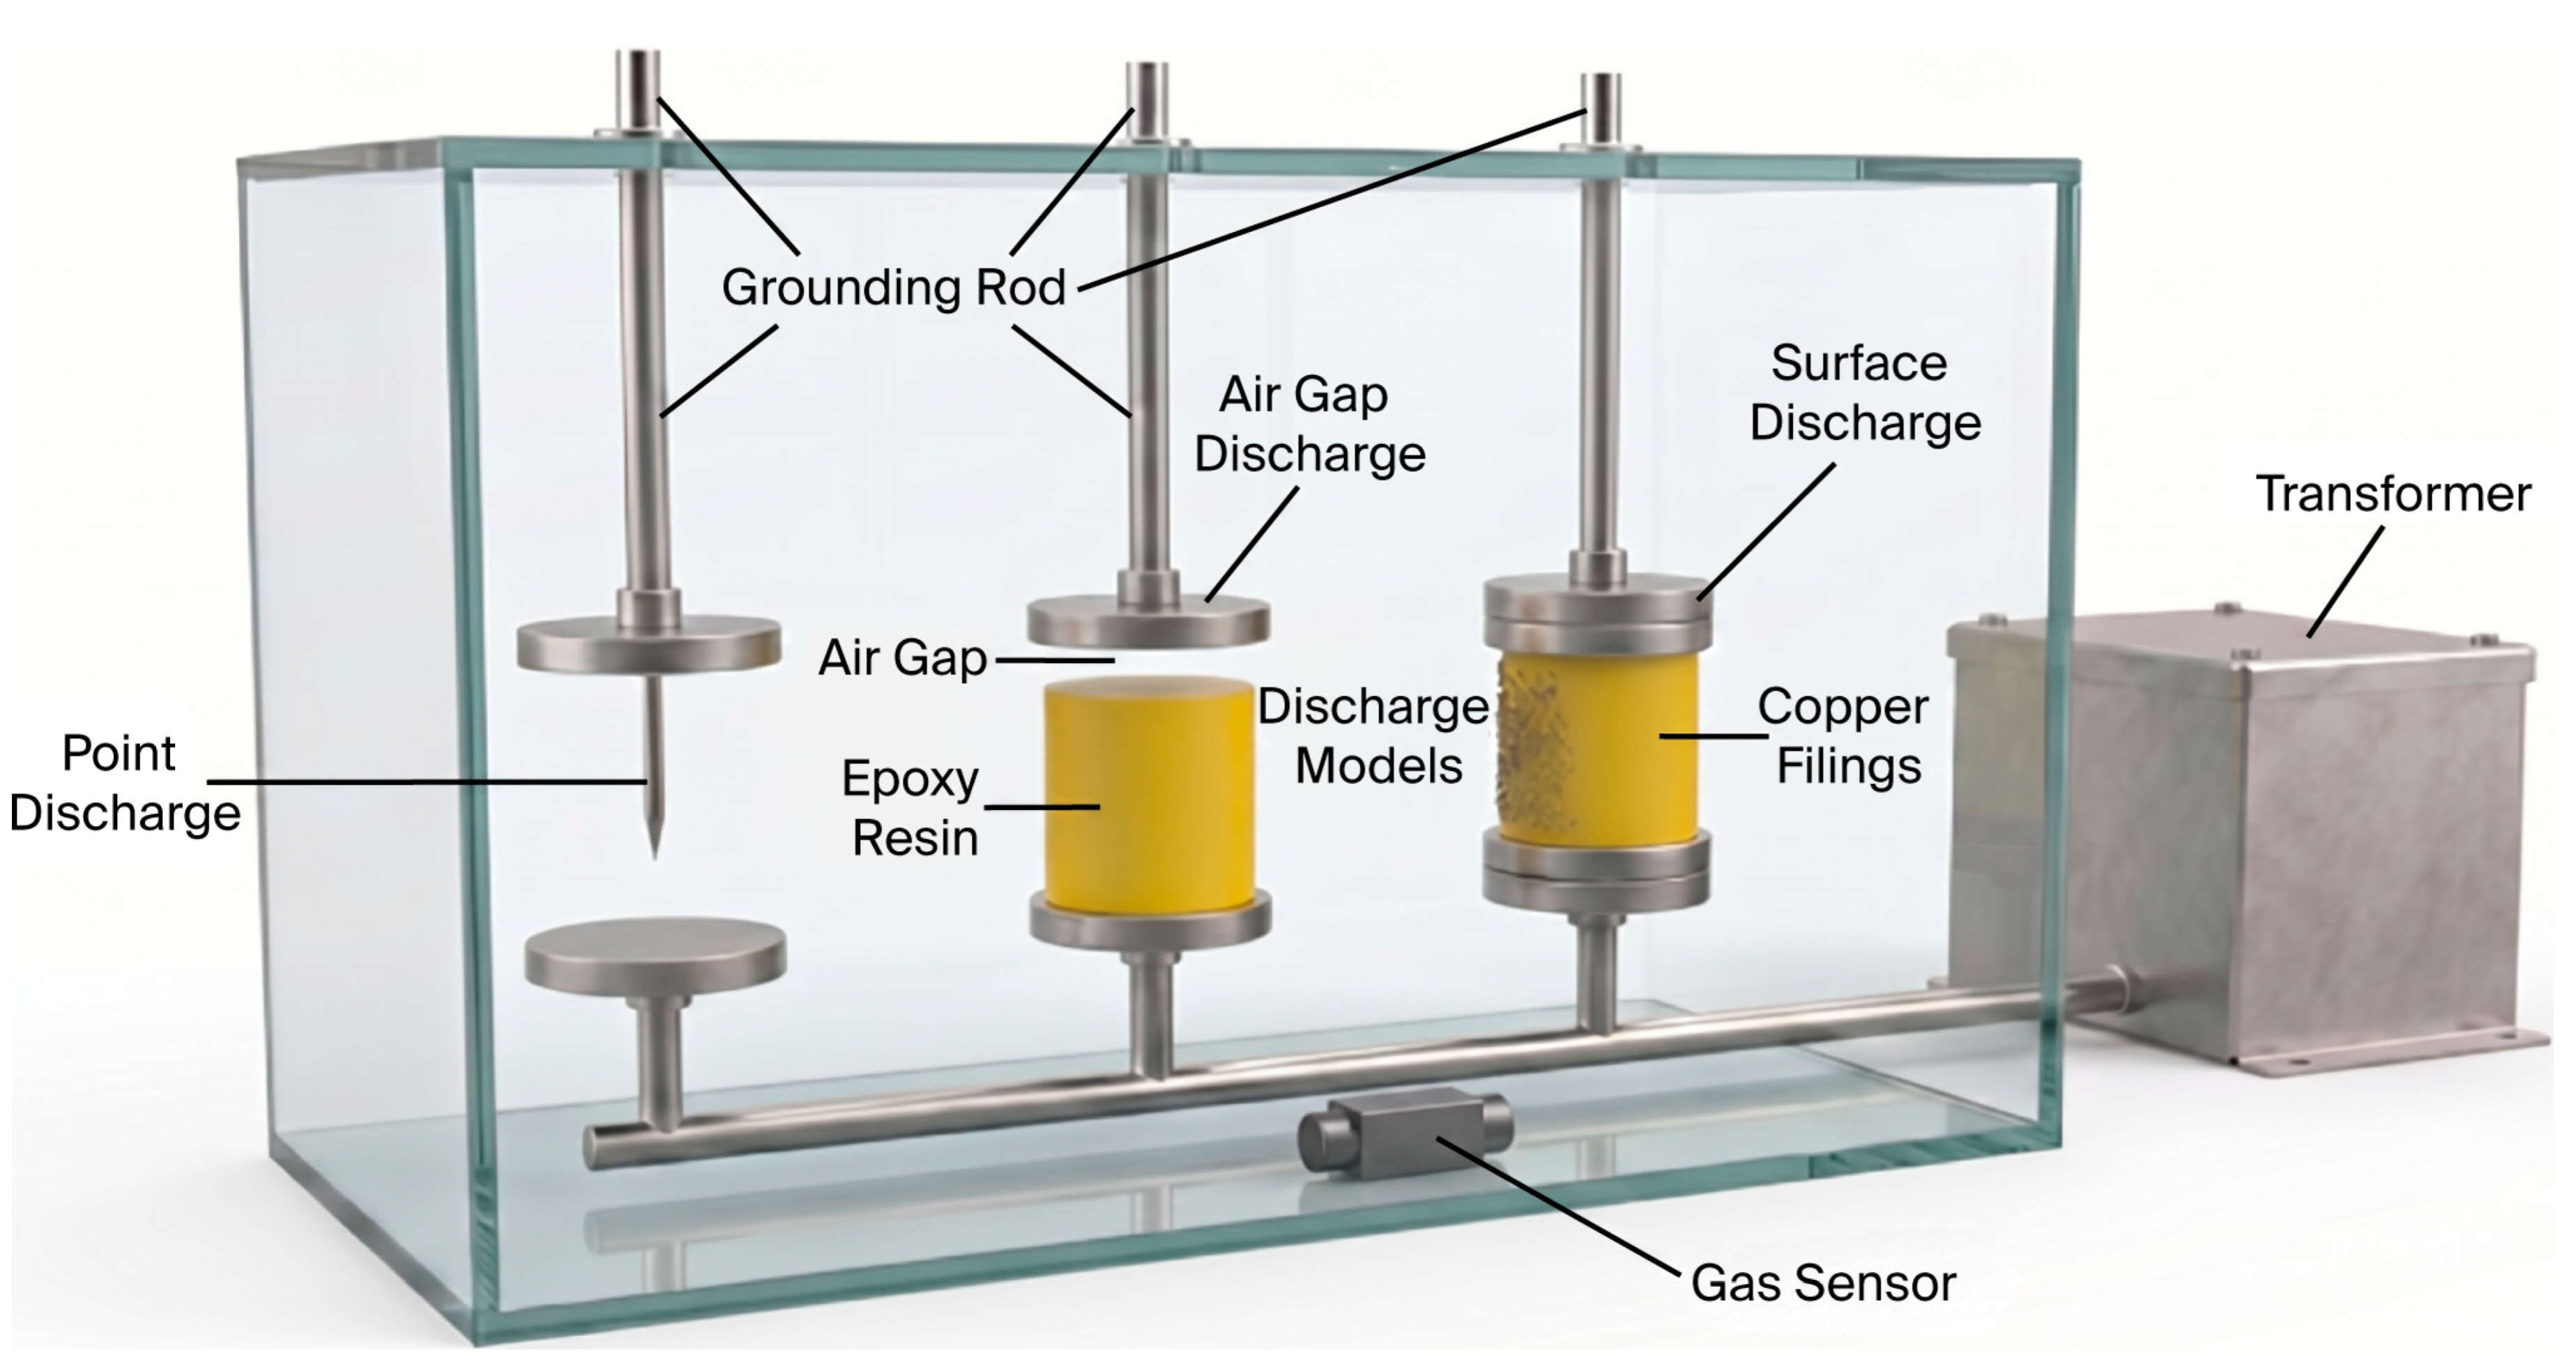
In practical AIS operation, typical insulation defects include metal protrusions on conductors, loosened contacts, voids or air gaps inside solid insulation, surface contamination, dust deposition, moisture-induced surface degradation, and aging of epoxy resin insulators. These defects typically lead to three representative PD modes: corona discharge caused by metal protrusions, internal or air-gap discharge caused by void-type defects, and surface discharge along contaminated or degraded insulation surfaces. Therefore, these three defect models were selected in this study to represent common AIS insulation faults, as shown in
Figure 9.
Air-discharge decomposition products include O
3, NO, NO
2, NO
3, N
2O
5, and CO. According to the simulation results in
Section 2, CO and NO
2 show relatively high detectability and better stability compared to highly reactive species such as NO
3 and N
2O
5. Therefore, this study focuses on the compositional characteristics of CO and NO
2. Fourier transform infrared spectroscopy and gas chromatography are employed for quantitative detection. Because the FTIR spectrometer used in this study has limited sensitivity to CO, and the gas chromatograph has difficulty separating NO
2 from the gas mixture, FTIR spectroscopy and gas chromatography are used to measure the NO
2 and CO concentrations, respectively.
3.2. Study on Variations in CO and NO2 Concentrations Under Different Defect Types
Air partial discharge simulation experiments were conducted using the established air-discharge experimental platform and fabricated physical models of typical insulation defects. Before each experiment, the discharge chamber was evacuated and then filled with dry air to the target pressure. Dry reduced the influence of humidity on discharge chemistry and gas detection; thus, the effects of pressure and defect type could be isolated. The influence of humidity is an important factor in practical AIS operation and will be investigated in future work.
The tested altitude-pressure conditions were 0 m/101.3 kPa, 1000 m/89.9 kPa, 2000 m/79.5 kPa, 3000 m/70.1 kPa, 4000 m/61.6 kPa, and 5000 m/54.0 kPa. If the actual laboratory pressure values differed slightly from the standard atmospheric-pressure values, the recorded experimental pressure was used for data analysis.
The discharge voltage was set to 10 kV at 50 Hz using a voltage regulation platform and was maintained consistently for a specified duration to ensure continuous discharge within the chamber. After a set time, the voltage was reduced to 0 to terminate the discharge. Gas was then drawn into sealed gas sampling bags using a handheld gas sampling pump. The sampling bags, made of polytetrafluoroethylene (PTFE), possess excellent corrosion resistance and do not react with corrosive gases such as NO2, thus ensuring sample integrity. After sampling, the chamber was evacuated using a vacuum pump, and the gas samples were transferred to a Fourier transform infrared spectrometer and a gas chromatograph for NO2 and CO concentration analysis, respectively.
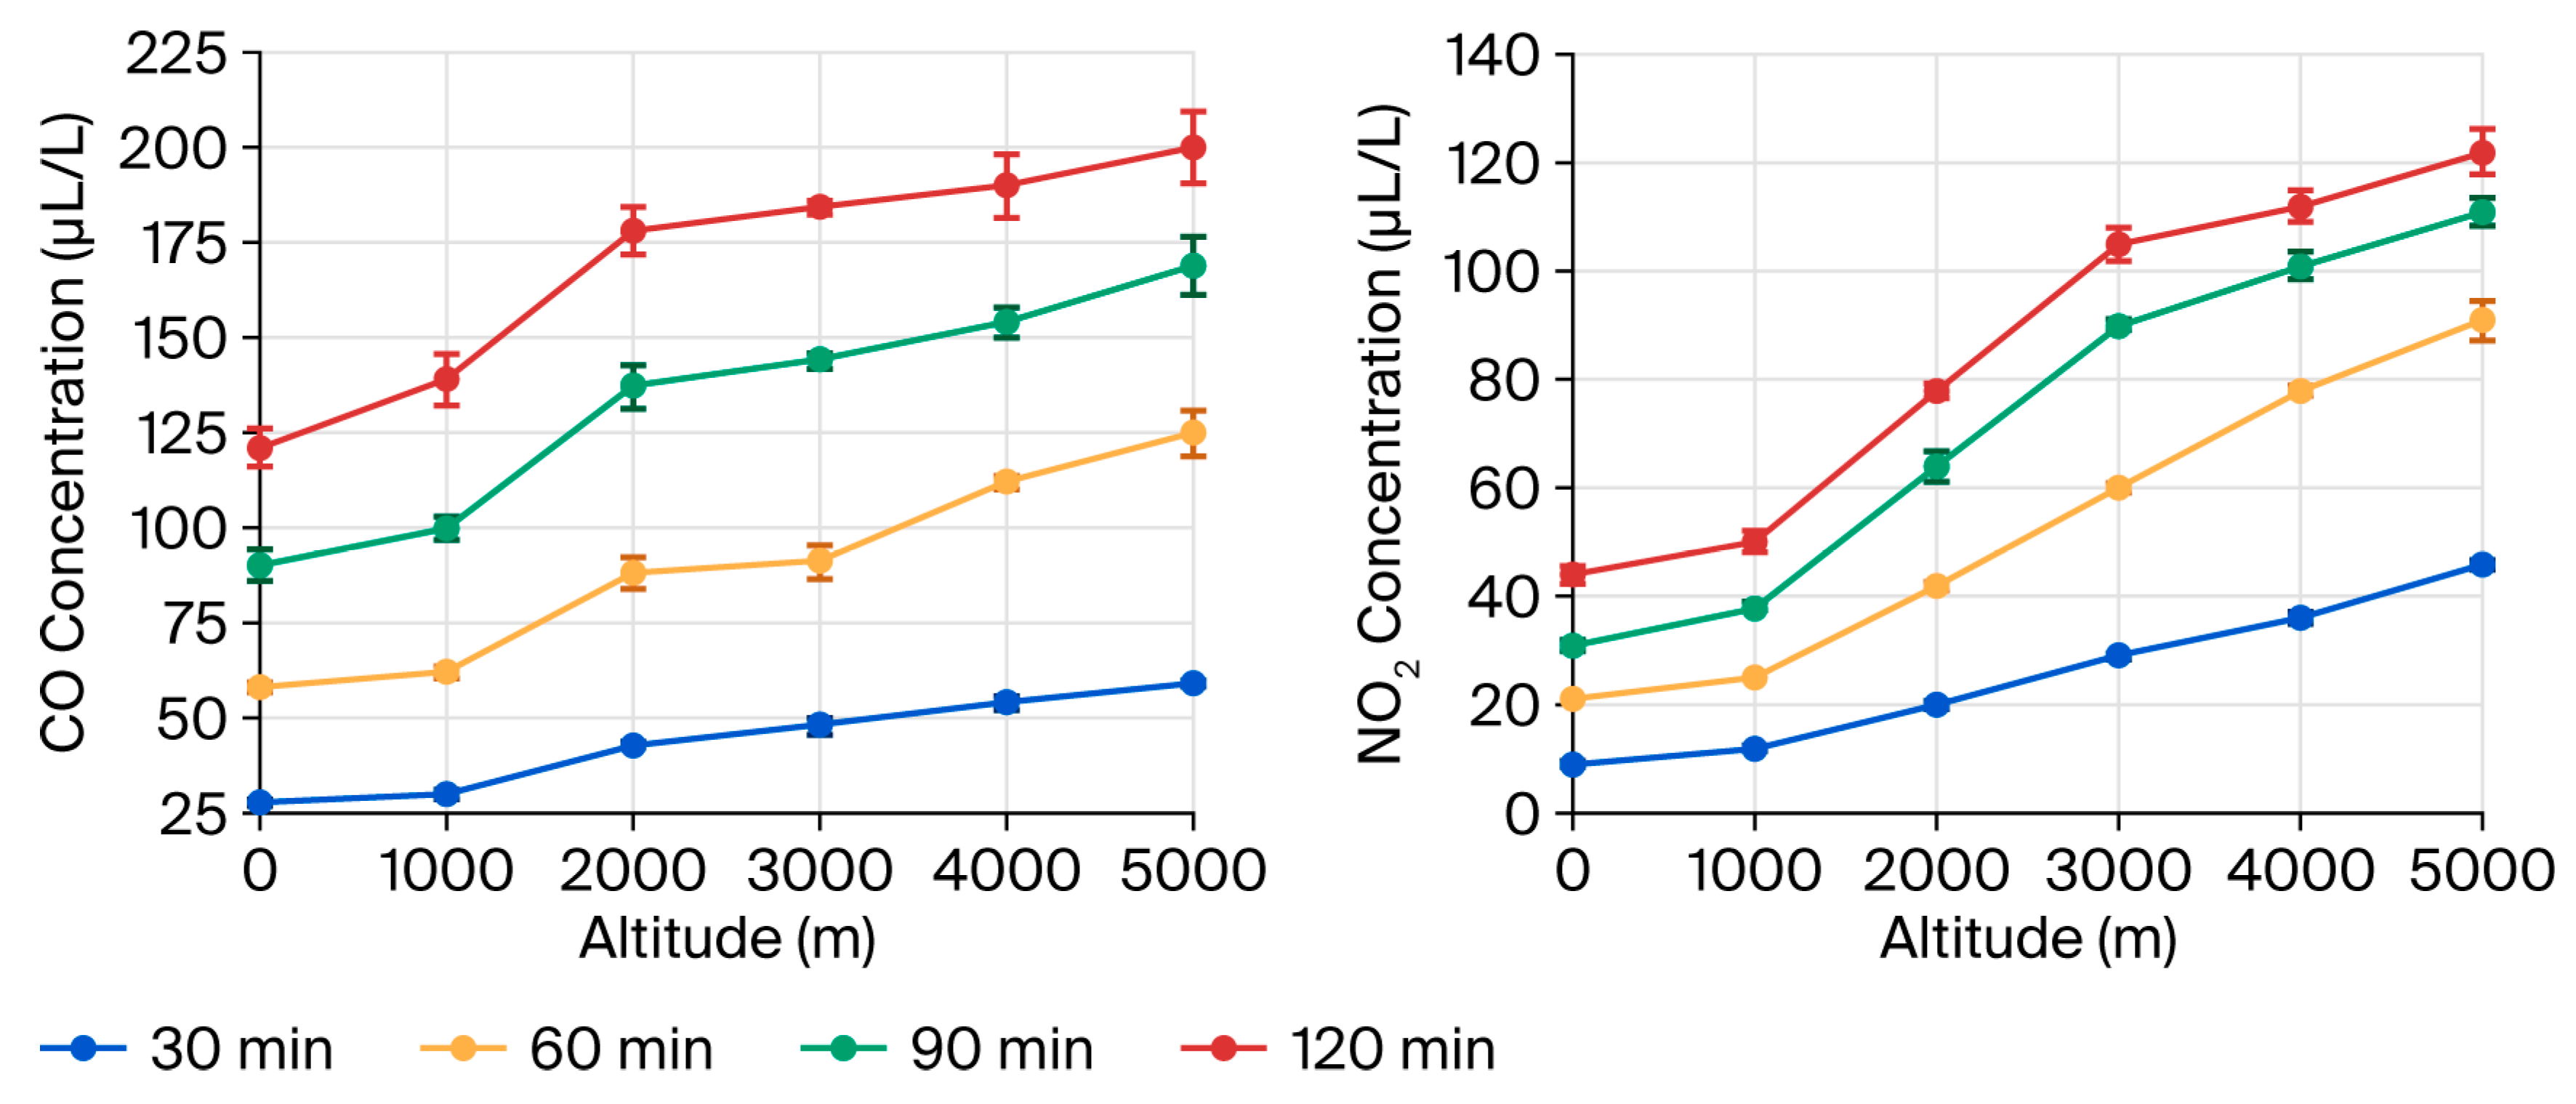
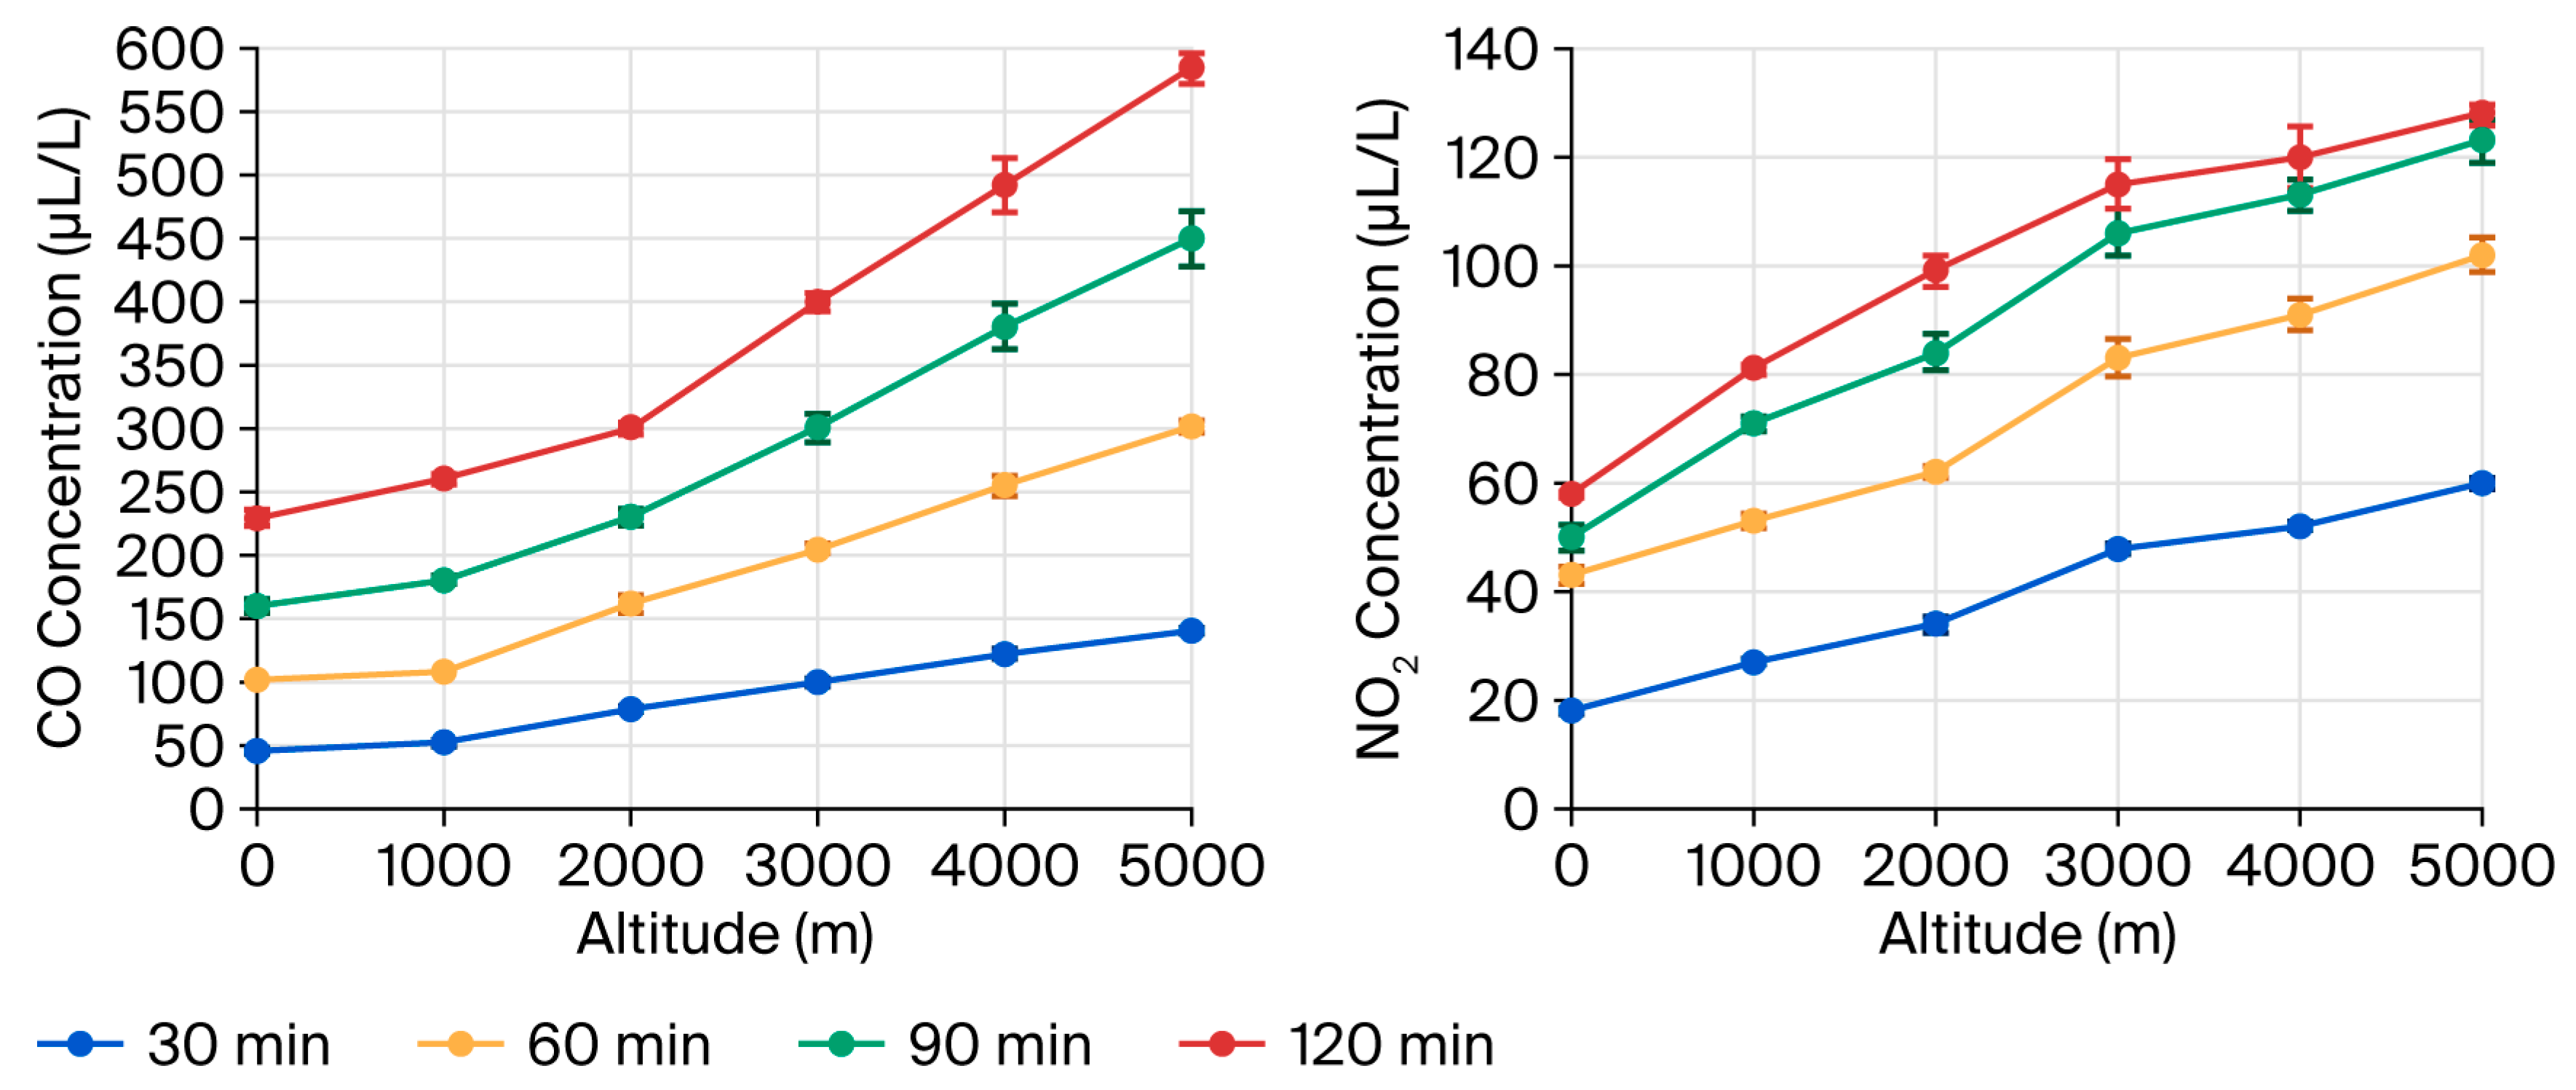
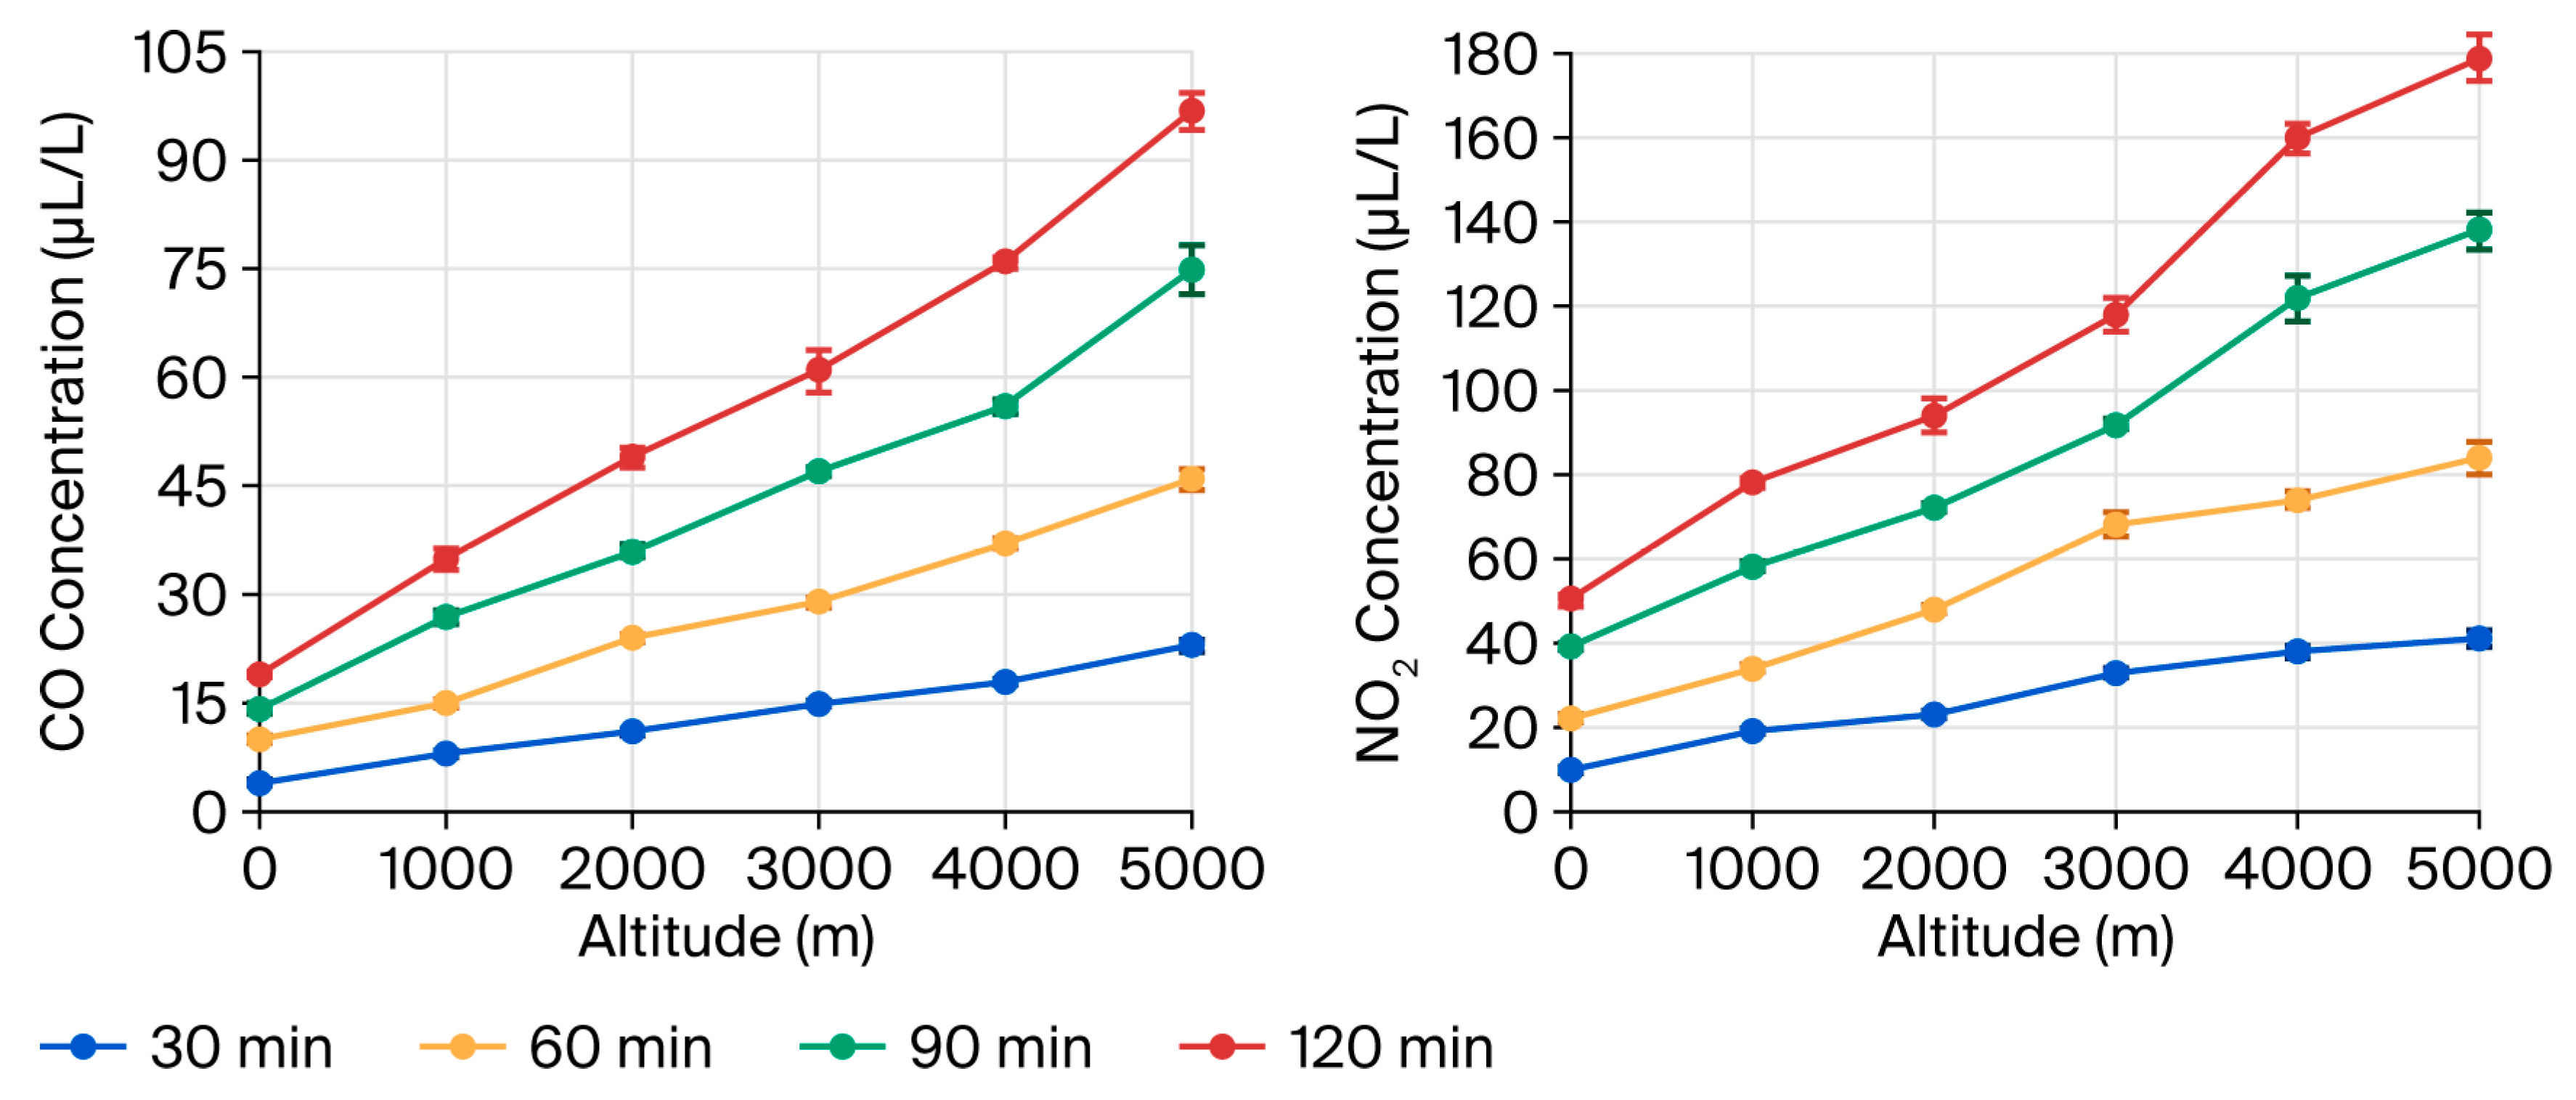
For each defect type and pressure condition, the experiment was repeated ten times. The concentration values plotted in
Figure 10,
Figure 11 and
Figure 12 represent the average values of repeated measurements, and the error bars represent the corresponding standard deviations.
Temporal and Altitude-Dependent CO and NO2 Concentration Profiles for Different Discharge Types
Figure 10,
Figure 11 and
Figure 12 illustrate the temporal variations in CO and NO
2 concentrations produced by three types of defect discharges at different altitudes. For each defect type and pressure condition, the experiment was repeated ten times. The concentration values plotted in
Figure 10,
Figure 11 and
Figure 12 represent the average values of repeated measurements, and the error bars represent the corresponding standard deviations.
As shown in
Figure 10, for tip discharge, the CO concentration increased with the simulated altitude. As altitude increases, air pressure decreases, and the gas molecular density becomes lower. Under the same applied voltage, the mean electron free pathway increases, allowing electrons to gain more energy from the electric field between collisions. The increased electron energy promotes the generation of CO.
Under the metal protrusion defect, CO may be generated through two main pathways. First, energetic electron bombardment and localized discharge may promote the release or oxidation of carbon-containing species from the electrode surface or surrounding materials by O, O2, and O3 to form CO. Second, CO can be directly produced through electron-impact dissociation of background CO2. Therefore, a higher electron energy at lower pressure accelerates the generation of CO.
The NO2 concentration also increased with simulated altitude. NO2 formation involves several intermediate steps. First, N2 and O2 are dissociated by energetic electrons to produce N and O atoms. These reactive species then participate in the formation of NO and O3; NO is subsequently oxidized by O3 to form NO2. At lower altitudes, the shorter mean electron free pathway and lower average electron energy suppress the dissociation of N2 and O2. As altitude increases and pressure decreases, higher electron energy promotes the dissociation of N2 and O2, thereby increasing the formation of NO, O3, and ultimately NO2.
As shown in
Figure 11, the CO concentration also increased with simulated altitude, which became more pronounced at higher altitudes. This behavior differs from that observed for tip discharge, where the increasing trend was relatively stable. The difference is mainly associated with the involvement of the epoxy resin insulator in the air-gap discharge process. Compared to the metal protrusion model, the epoxy resin provides abundant carbon sources. During discharge, energetic electrons and reactive species continuously attack the insulation material, causing local degradation and carbon-related oxidation reactions. In addition, corrosive discharge products such as NO
x may further promote chemical degradation of the insulation surface. The combined electrical and chemical aging effects accelerate insulation deterioration and enhance CO generation.
The NO2 concentration under the air-gap discharge model increased with simulated altitude but tended to saturate at higher altitudes. This saturation was more evident than that observed in the metal protrusion case. A possible reason for this is that the unique structure of the air gap confines discharge products within a narrow cylindrical region with a thickness of approximately 1 mm, making diffusion to the surrounding region more difficult. Consequently, NO2 accumulates locally in the discharge region. Elevated NO2 concentrations may further promote its conversion to NO3 and N2O5, thereby reducing the net accumulation rate of NO2 and producing a saturation-like trend.
For insulator surface discharge, the CO concentration increased steadily with simulated altitude, and the increasing trend became more pronounced at higher altitudes. At an altitude of 0 m, the mean electron free pathway is relatively short, and the electron energy is insufficient to effectively dissociate CO2 or strongly degrade the insulation material to generate CO. Therefore, the increase in CO concentration remains limited even when the discharge duration is extended. As altitude increases, reduced pressure increases the mean electron free pathway and average electron energy, thereby promoting CO2 dissociation and carbon-related oxidation reactions on the epoxy resin surface. At 5000 m, the higher electron energy further intensifies the interaction between the discharge and the insulation surface, resulting in a more significant increase in CO concentration.
The NO2 concentration generated by surface discharge increased approximately linearly with discharge duration. At a discharge time of 120 min, the NO2 concentration was between those observed for the metal protrusion and air-gap discharge models. Because the discharge occurs along the insulator surface, the discharge region is relatively large, and gas exchange is stronger than that in the confined air-gap model. Therefore, NO2 does not exhibit a clear saturation trend with increasing discharge time under the surface discharge condition.
3.3. Relationship Between Discharge Types and Gas Component Characteristics
The intensity of air PD and the associated reaction pathways vary with altitude and insulation defect type, leading to different NO2 and CO concentration characteristics. However, establishing a direct correspondence between discharge products and discharge types is difficult when only absolute gas concentrations are considered. Therefore, this study uses the CO/NO2 concentration ratio as a diagnostic feature. This ratio reflects the various influences of insulation defects on CO and NO2 generation and can be used to classify PD types under the tested conditions.
The concentration ratios of CO to NO
2 produced by the three types of discharge are shown in
Table 3,
Table 4 and
Table 5.
Table 3 presents the characteristic data for the ratio of CO to NO
2 concentrations generated under metal protrusion defects (tip discharge). In this type of discharge, the CO concentration is consistently higher than the NO
2 concentration; as a result, all concentration ratio values are greater than 1 (with an average value of approximately 2.05). From an altitude perspective, as the altitude gradually increases, the concentration ratio between CO and NO
2 shows an overall decreasing trend. However, from a temporal perspective, there is no obvious correlation between the CO to NO
2 concentration ratio and the increase in discharge time for tip discharge.
Table 4 shows the variation in the CO/NO
2 concentration ratio under insulator air-gap discharge. Similar to tip discharge, the CO concentration generated by air-gap discharge was significantly higher than the NO
2 concentration, and all ratios were greater than one. However, the most notable feature of this discharge type was the CO/NO
2 concentration ratio, which increased significantly with discharge time, reaching a maximum value of 4.57 at 5000 m after 120 min of discharge. This time-dependent increasing trend provides an important basis for distinguishing air-gap discharge from tip discharge.
Table 5 presents the CO/NO
2 concentration ratio under insulator surface discharge. In contrast to the previous two discharge types, the CO concentration generated by surface discharge was consistently lower than the NO
2 concentration, and all calculated ratios were lower than one, ranging from 0.36 to 0.57. Similar to tip discharge, the ratio under surface discharge did not exhibit a clear time-dependent trend. For the epoxy-resin-based surface discharge model used in this study, the CO/NO
2 ratio remained below one. This feature can be used to identify this type of surface discharge under the tested conditions. However, recalibration may be required for insulation materials with substantially different carbon contents.
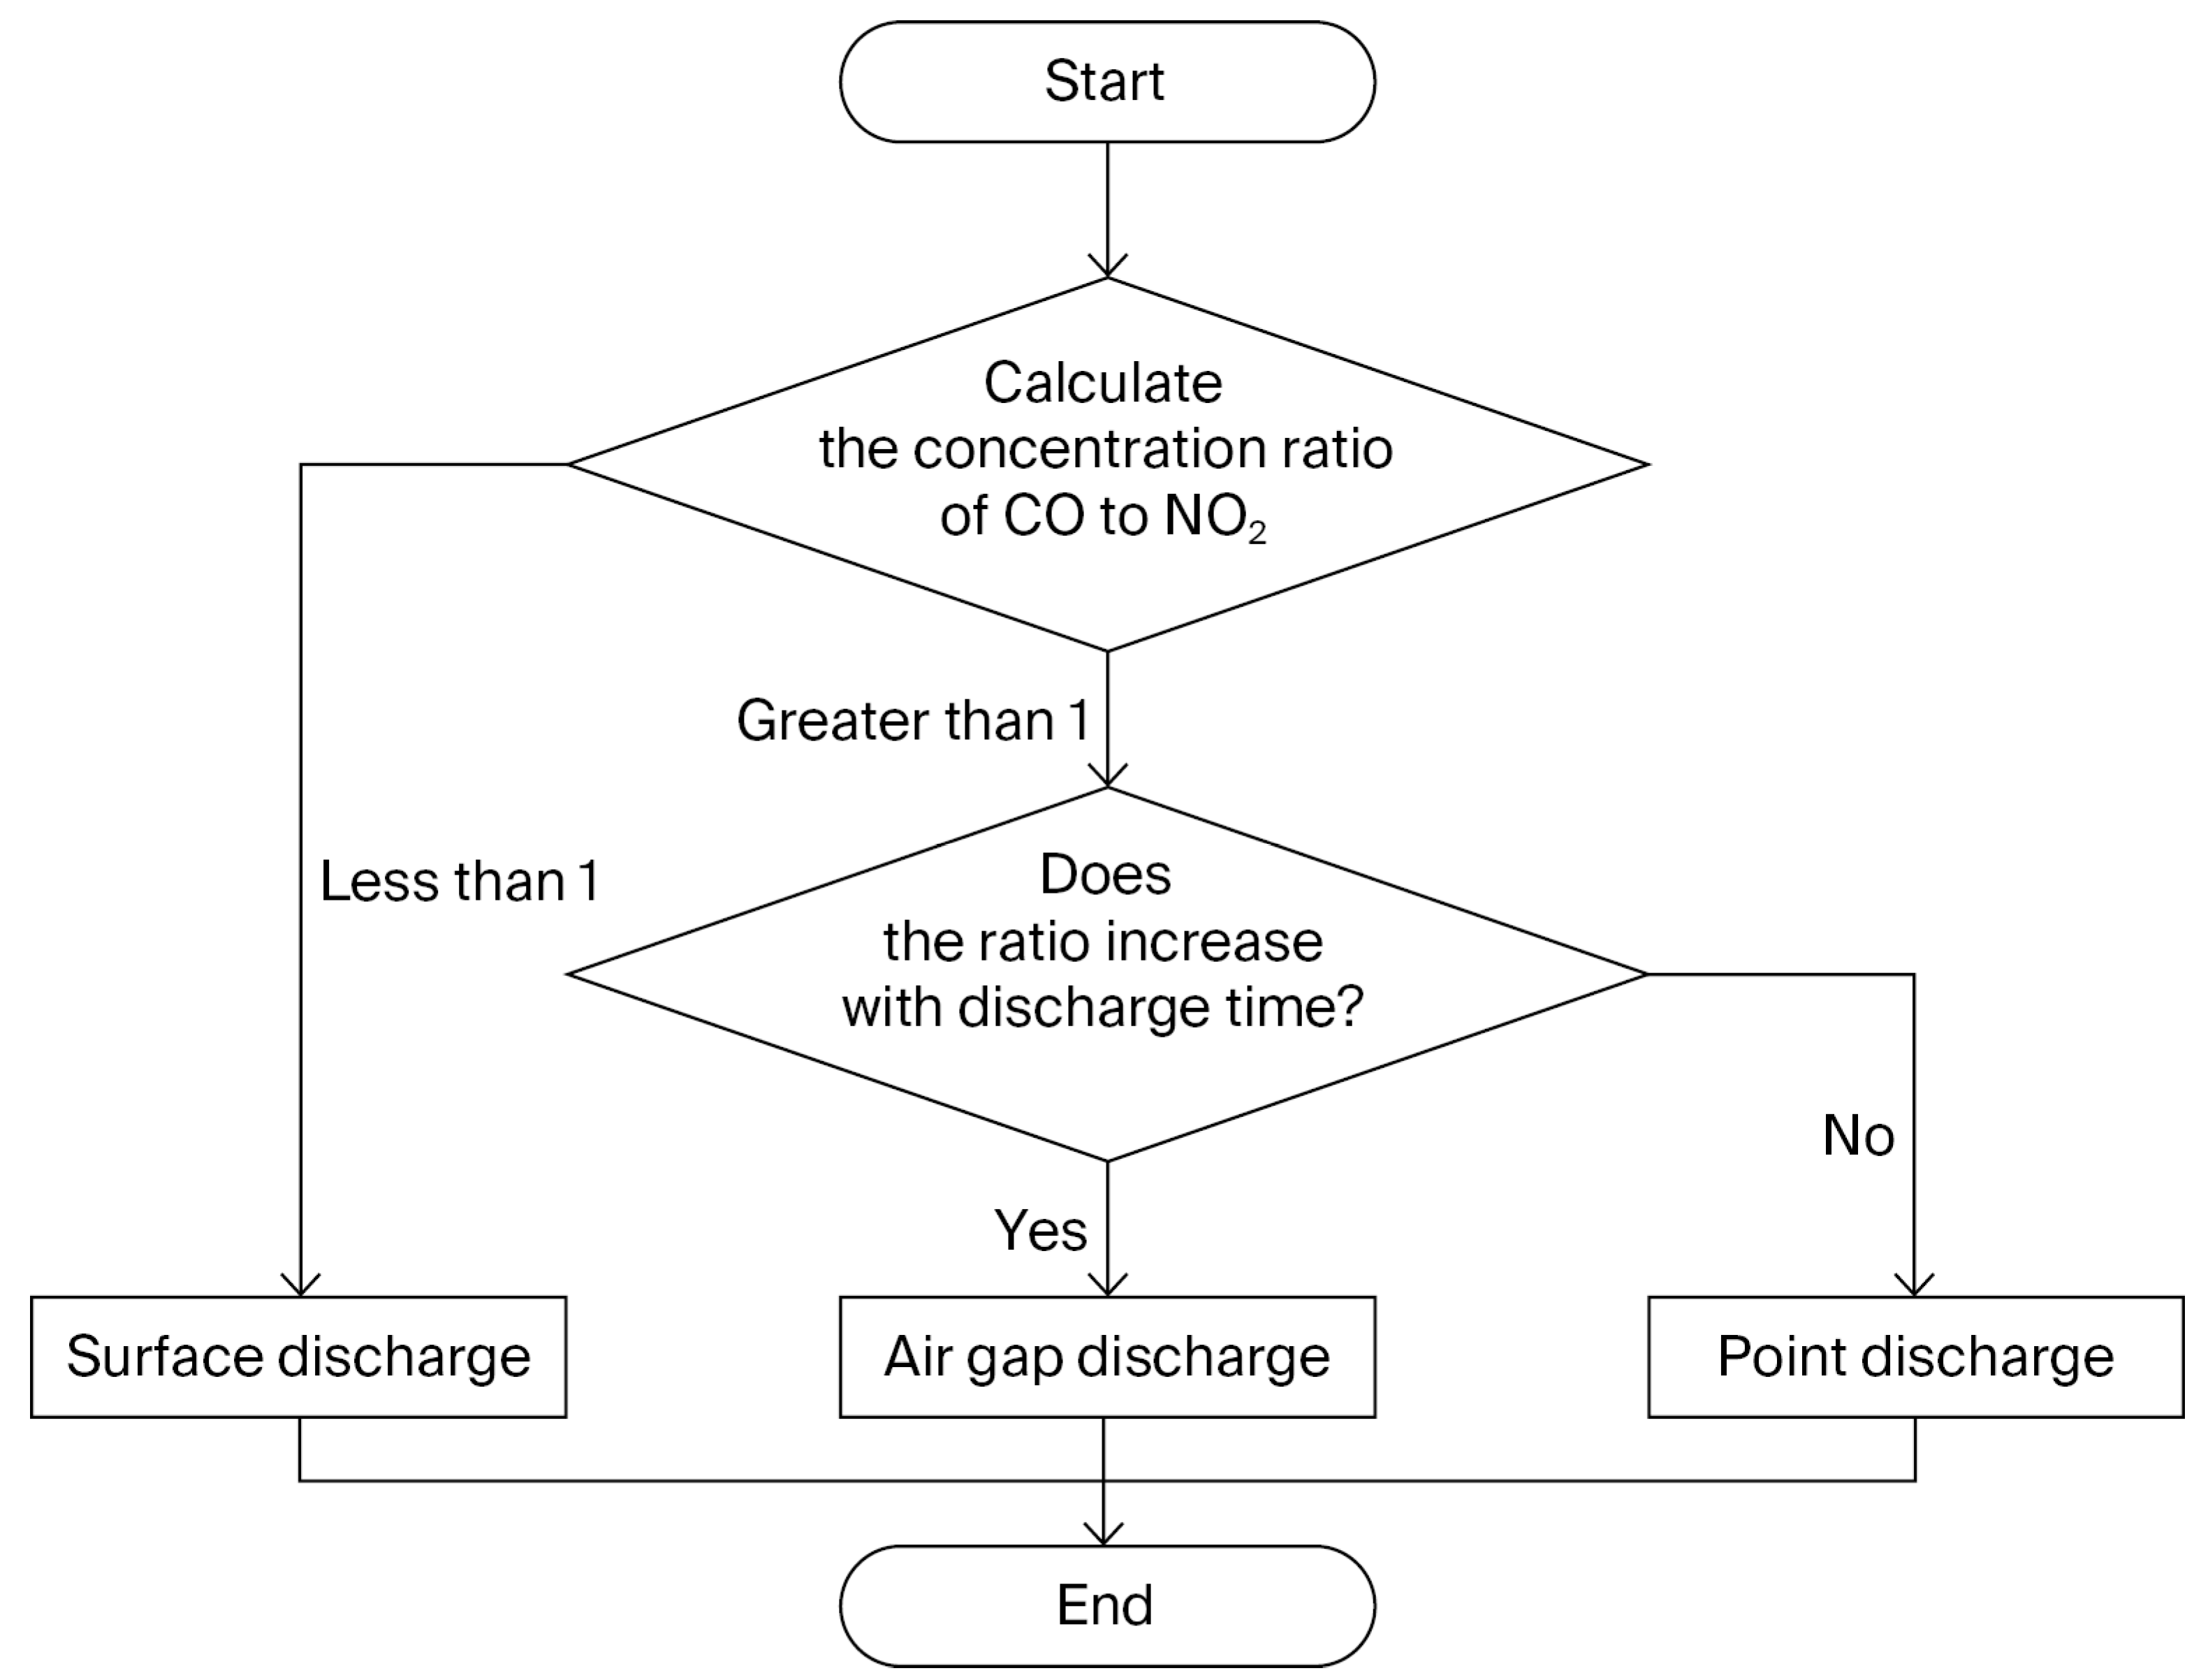
In summary, based on the evolution patterns of CO and NO
2 concentrations generated under different PD types, a method for identifying different air partial discharge types can be established, as shown in
Figure 13. In this laboratory study, CO and NO
2 concentrations were measured at 30 min intervals to establish the time-dependent gas-ratio characteristics. In practical online monitoring, the sampling interval can be shortened according to sensor response time, fault severity, and monitoring requirements. The CO/NO
2 concentration ratio is first calculated. If the calculated ratio is lower than 1, the defect can be inferred as the epoxy-resin-based surface discharge model under the tested conditions. If the calculated ratio is greater than 1, the relationship between the CO/NO
2 concentration ratio and discharge time is evaluated further. If the ratio increases with discharge time, the discharge is inferred as the air-gap discharge; otherwise, it is inferred as tip discharge.
4. Experimental Study on Fault Diagnosis of Air Switchgear Based on Gas Component Analysis
Section 3 of this study focuses on obtaining gas-composition data under different PD types and pressure conditions to establish the relationship between the CO/NO
2 ratio and typical discharge defects. In this section, experiments were conducted in a switchgear-like chamber with gas-sensor-based detection and analysis. The aim was to verify the feasibility and applicable scope of the proposed CO/NO
2 ratio method for online AIS insulation monitoring under laboratory conditions.
4.1. Experimental Setup
The measurement procedure was as follows. First, one of the three defect models was selected and mounted on the grounded conductor rod of the switchgear simulation setup. During each test, only one defect model was connected, while the conductor rods equipped with the other defect models were completely withdrawn to avoid mixed discharge signals. The grounded conductor rod was then pushed into the switchgear model to adjust the distance between the defect model and the high-voltage conductor.
After the defect model was installed, the applied voltage was increased to 10 kV using the voltage regulator and maintained for 30 min. During this period, partial discharge occurred around the selected defect model, and the generated CO and NO2 gradually accumulated and diffused inside the switchgear-like chamber. After the discharge duration was completed, the gas detection device was installed at the designated detection point in the lower part of the switchgear model, approximately below the discharge source. This position was selected according to the gas diffusion behavior observed in the laboratory setup.
The CO and NO2 sensors in the detection device converted the gas response into electrical signals through the signal-conditioning circuit. The analog signals were collected by the ADC and processed by the microcontroller. The sensor response was recorded continuously for 120 s. The corresponding CO and NO2 concentration-related responses were then obtained according to the sensor response–concentration relationship, and the CO/NO2 concentration ratio was calculated to identify the discharge type.
After each measurement, the detection device was removed, and the sensors were exposed to ambient air until their response values returned to the baseline. The next test was conducted only after baseline recovery to reduce the influence of residual gases and sensor memory effects.
The source of gas generation was located in the central fluid domain. CO and NO
2 diffuse from high-concentration regions to low-concentration regions and may migrate toward both the upper and lower parts of the switchgear model. Under the presented laboratory configuration, the gases showed a stronger tendency to diffuse downward due to the model’s structure and the sampling arrangement. Therefore, the gas sensors were installed in the lower part of the switchgear model, approximately below the discharge source, as indicated in
Figure 14.
4.2. Design of Partial Discharge Detection Device
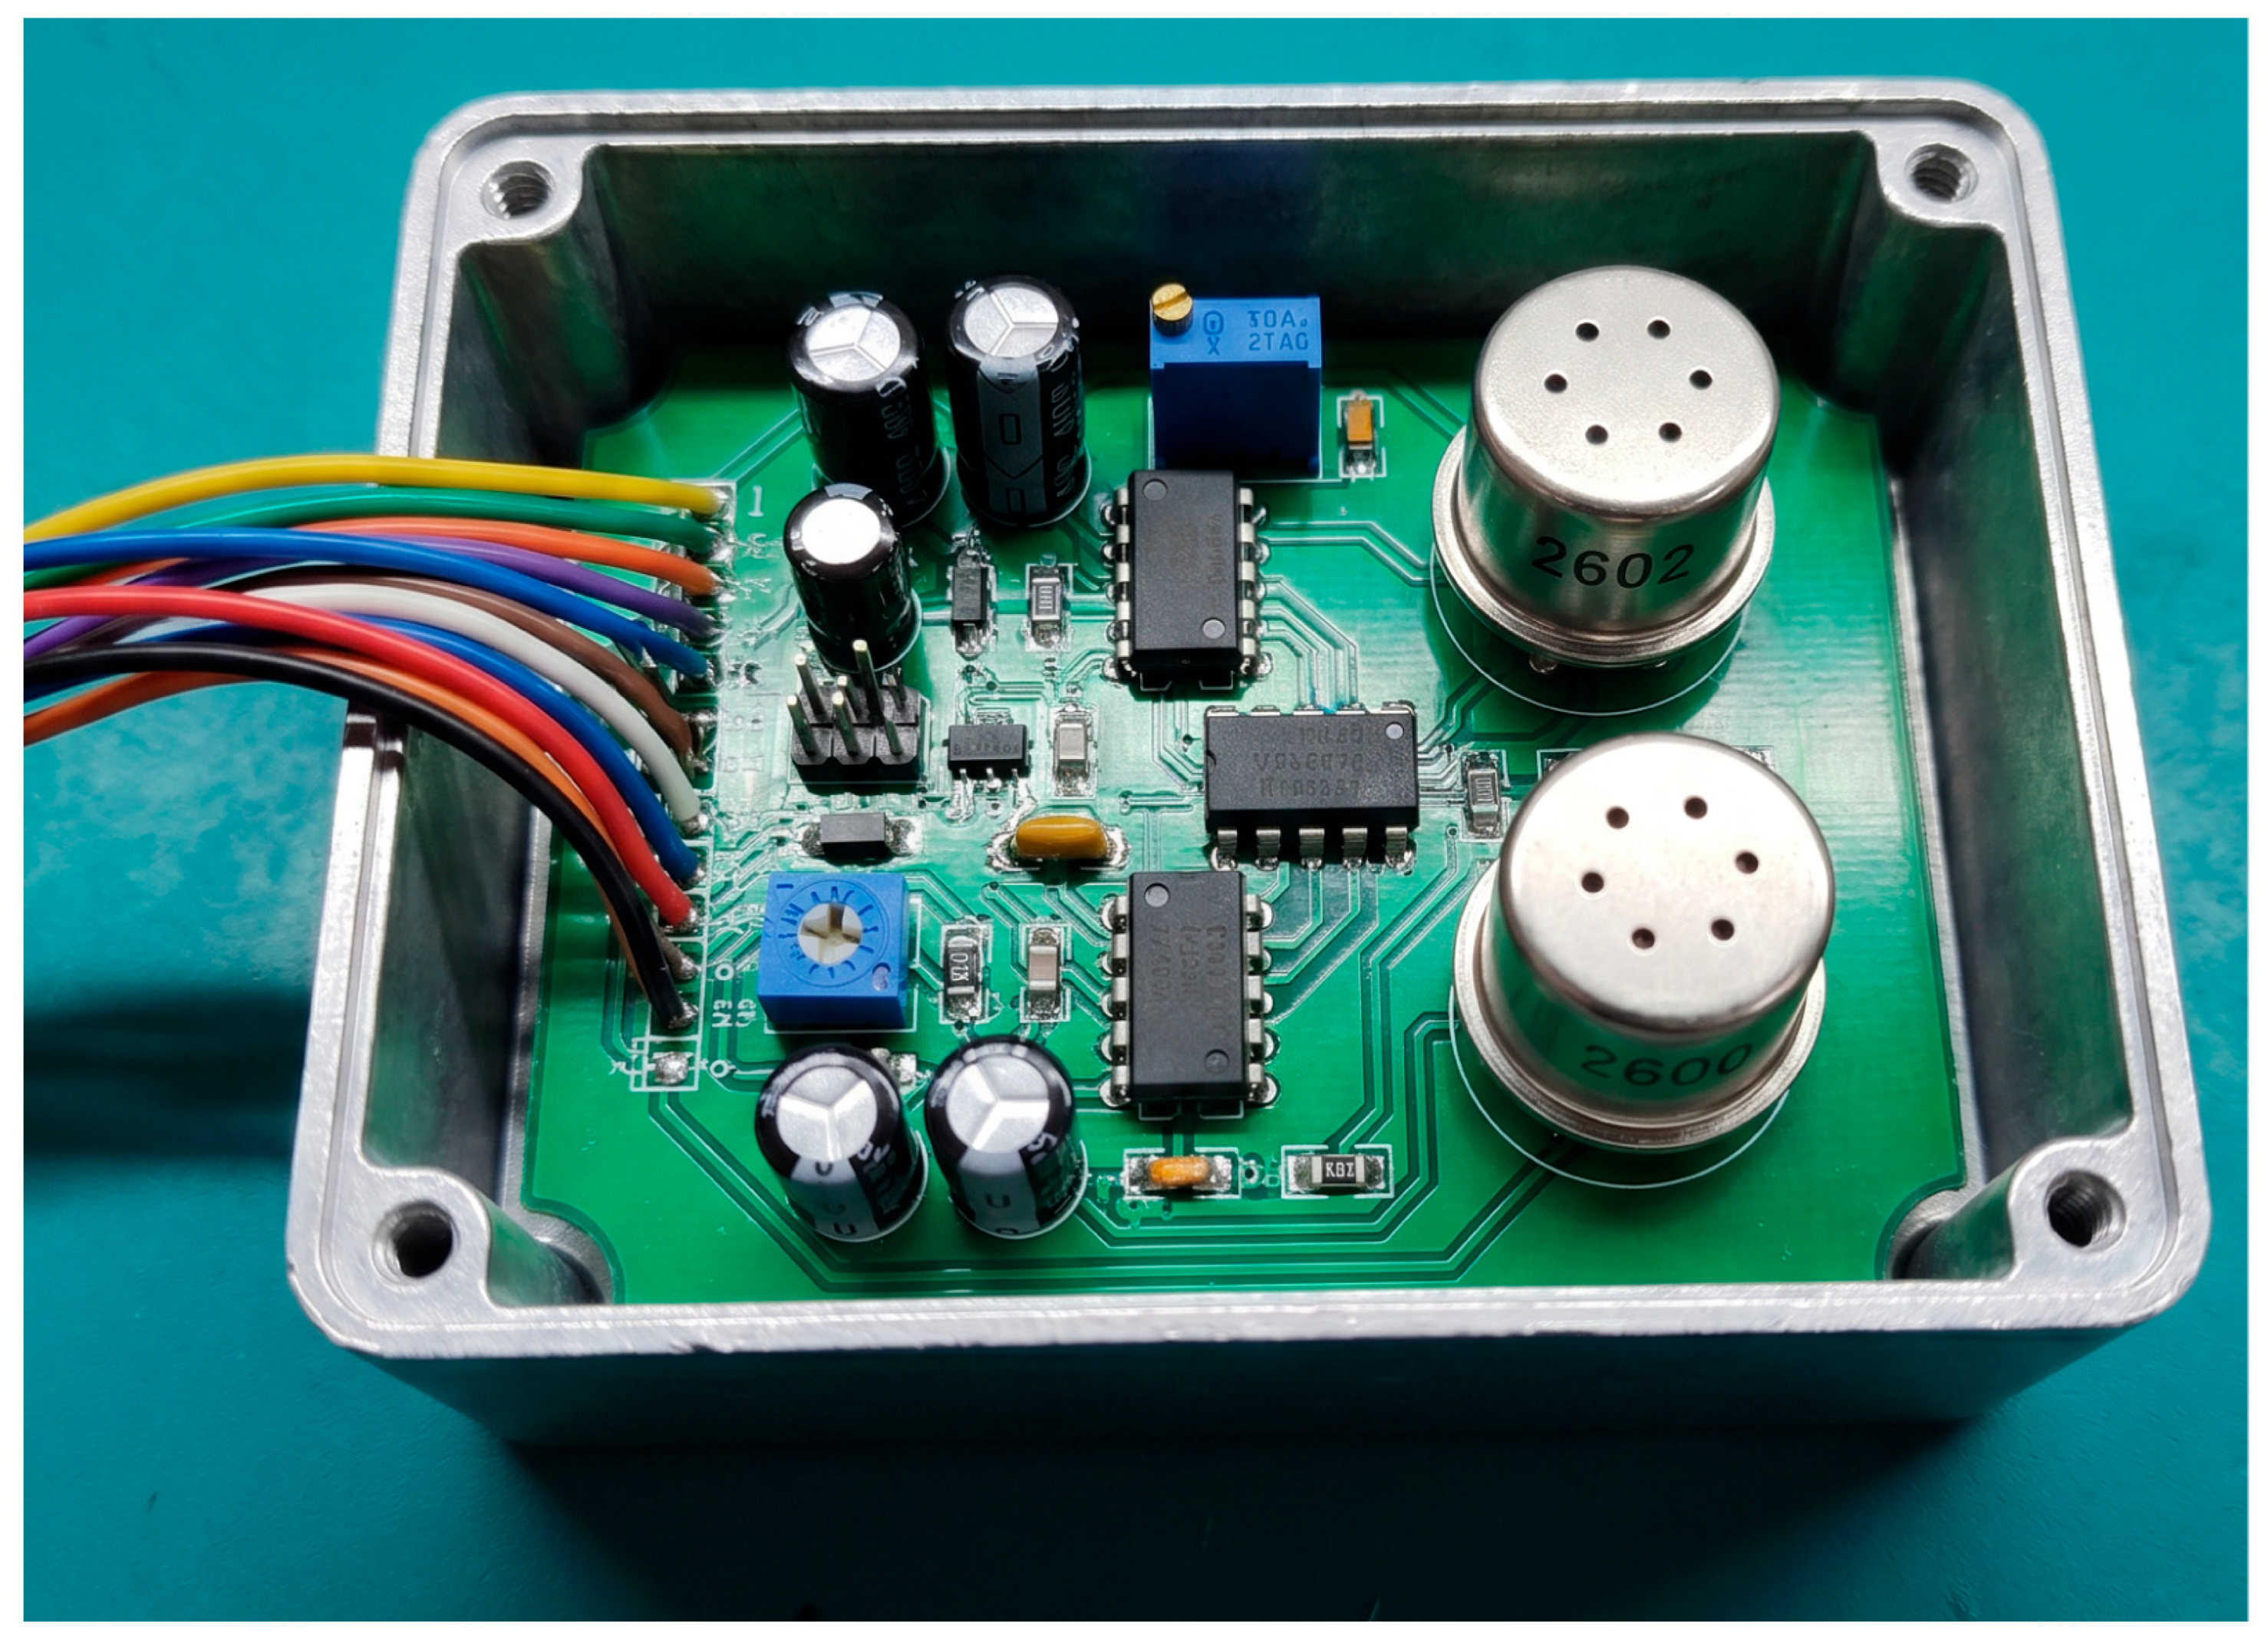
Figure 15 shows the hardware block diagram of the developed detection device. The device comprises CO and NO
2 gas sensors, signal-conditioning circuits, an analog-to-digital converter, a microcontroller unit, a power-supply module, and a communication/alarm module. The microcontroller calculates the CO/NO
2 ratio and implements the recognition logic described in
Section 3.
Figure 15 shows the developed gas detection device used in the switchgear simulation experiment. The device mainly consists of CO and NO
2 gas sensors, signal-conditioning circuits, a data acquisition module, a microcontroller, a power supply module, a display/communication module, and an alarm/output unit. During measurement, the CO and NO
2 sensors convert the gas response into electrical signals. These signals are then amplified and filtered by the signal-conditioning circuit, digitized by the data acquisition module, and processed by the microcontroller. The processed data are used to calculate the CO/NO
2 concentration ratio and identify the corresponding discharge type.
Due to size limitations, only two semiconductor sensors could be installed inside the detection device. To achieve simultaneous detection of CO and NO
2 concentrations, gas sensors with appropriate sensitivity to these two gases were selected. In this study, Figaro TGS2600 was selected as the CO-related sensor, and TGS2602 was selected as the NO
2-related sensor. The relationship between sensor response and gas concentration is shown in
Table 6.
The device is connected to an external 24 V DC power supply, which powers the entire circuit via an isolated power supply. The operational amplifier, analog section of the ADC, and sensor heating circuit are powered by a dedicated analog voltage. A DC–DC converter chip, LM2596-5.0, is used to convert 24 to 5 V to power this part of the circuit. For the microcontroller unit and the digital section of the ADC, a low-dropout linear regulator, AMS1117-3.3 (EVVO, Hongkong, China), is used to convert the 5 V supply to 3.3 V. Finally, a REF2925 (TI, Dallas, TX, USA) voltage reference chip is used to convert 5 V to 2.5 V, serving as the ADC reference voltage.
4.3. Detection Results for Different Discharge Types
This section validates the effectiveness of the gas component analysis technique to distinguish different insulation faults, as proposed in
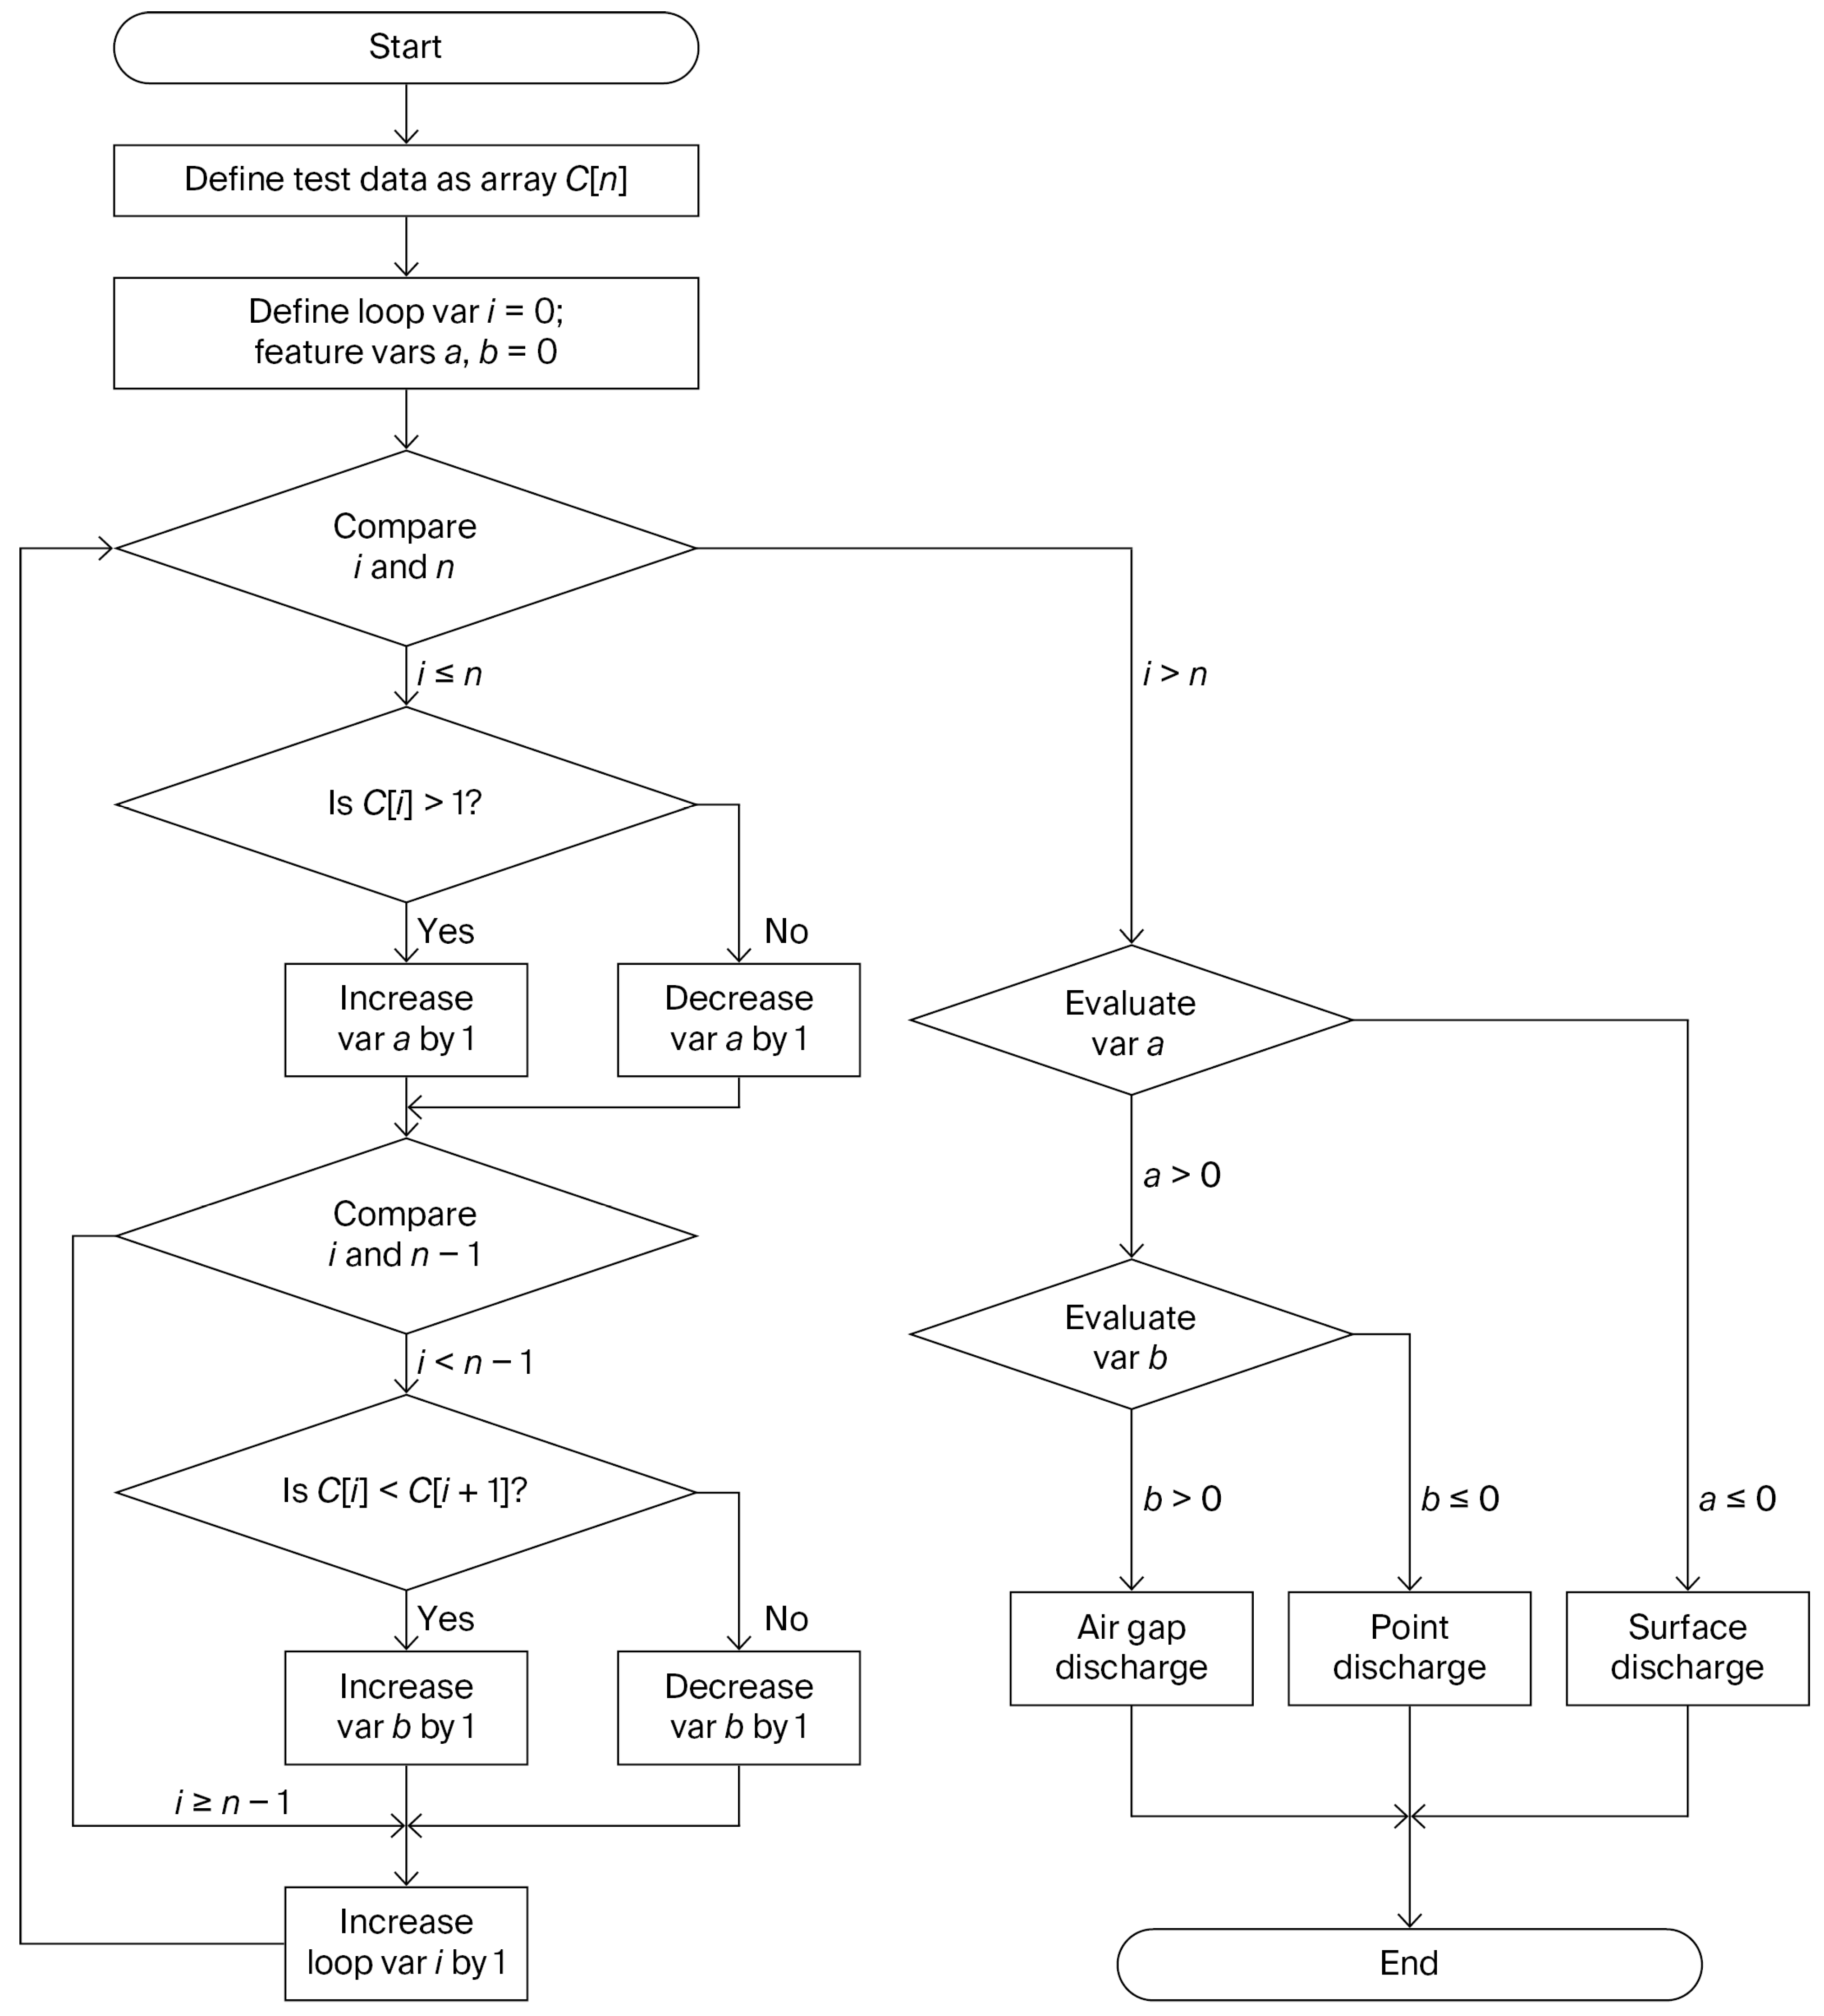
Section 3. A validation method is applied to the data obtained from the tests using the partial discharge detection device for fault identification. By comparing the identification results with known fault types, the recognition accuracy was calculated. This process is implemented via a software program, the flowchart of which is presented in
Figure 16.
The input array in the figure represents a sample dataset of the CO to NO2 concentration ratios measured for a specific discharge type. The dataset is grouped by discharge time, where “n” denotes the number of discharge time groups. Given that this experiment measured concentration ratios for six discharge time groups (0.5 h, 1 h, 1.5 h, 2 h, 2.5 h, and 3 h), the value of “n” ranges from two to six. Variables “a” and “b” are feature variables used to determine the discharge type. In this program, the sample dataset is first input into array C, and variables “a” and “b” are initialized. Subsequently, each element in array C is iterated using a loop. In each iteration, the value of variable “a” is updated based on the comparison between the current element and one; the value of variable “b” is updated based on the comparison between the current element and the next element. After the loop is complete, the discharge type is determined based on the final values of “a” and “b”.
Recognition precision was defined as the percentage of samples correctly classified into a specific discharge type compared to the number of samples predicted to belong to that type. Recognition accuracy was defined as the percentage of correctly classified samples among all the samples studied.
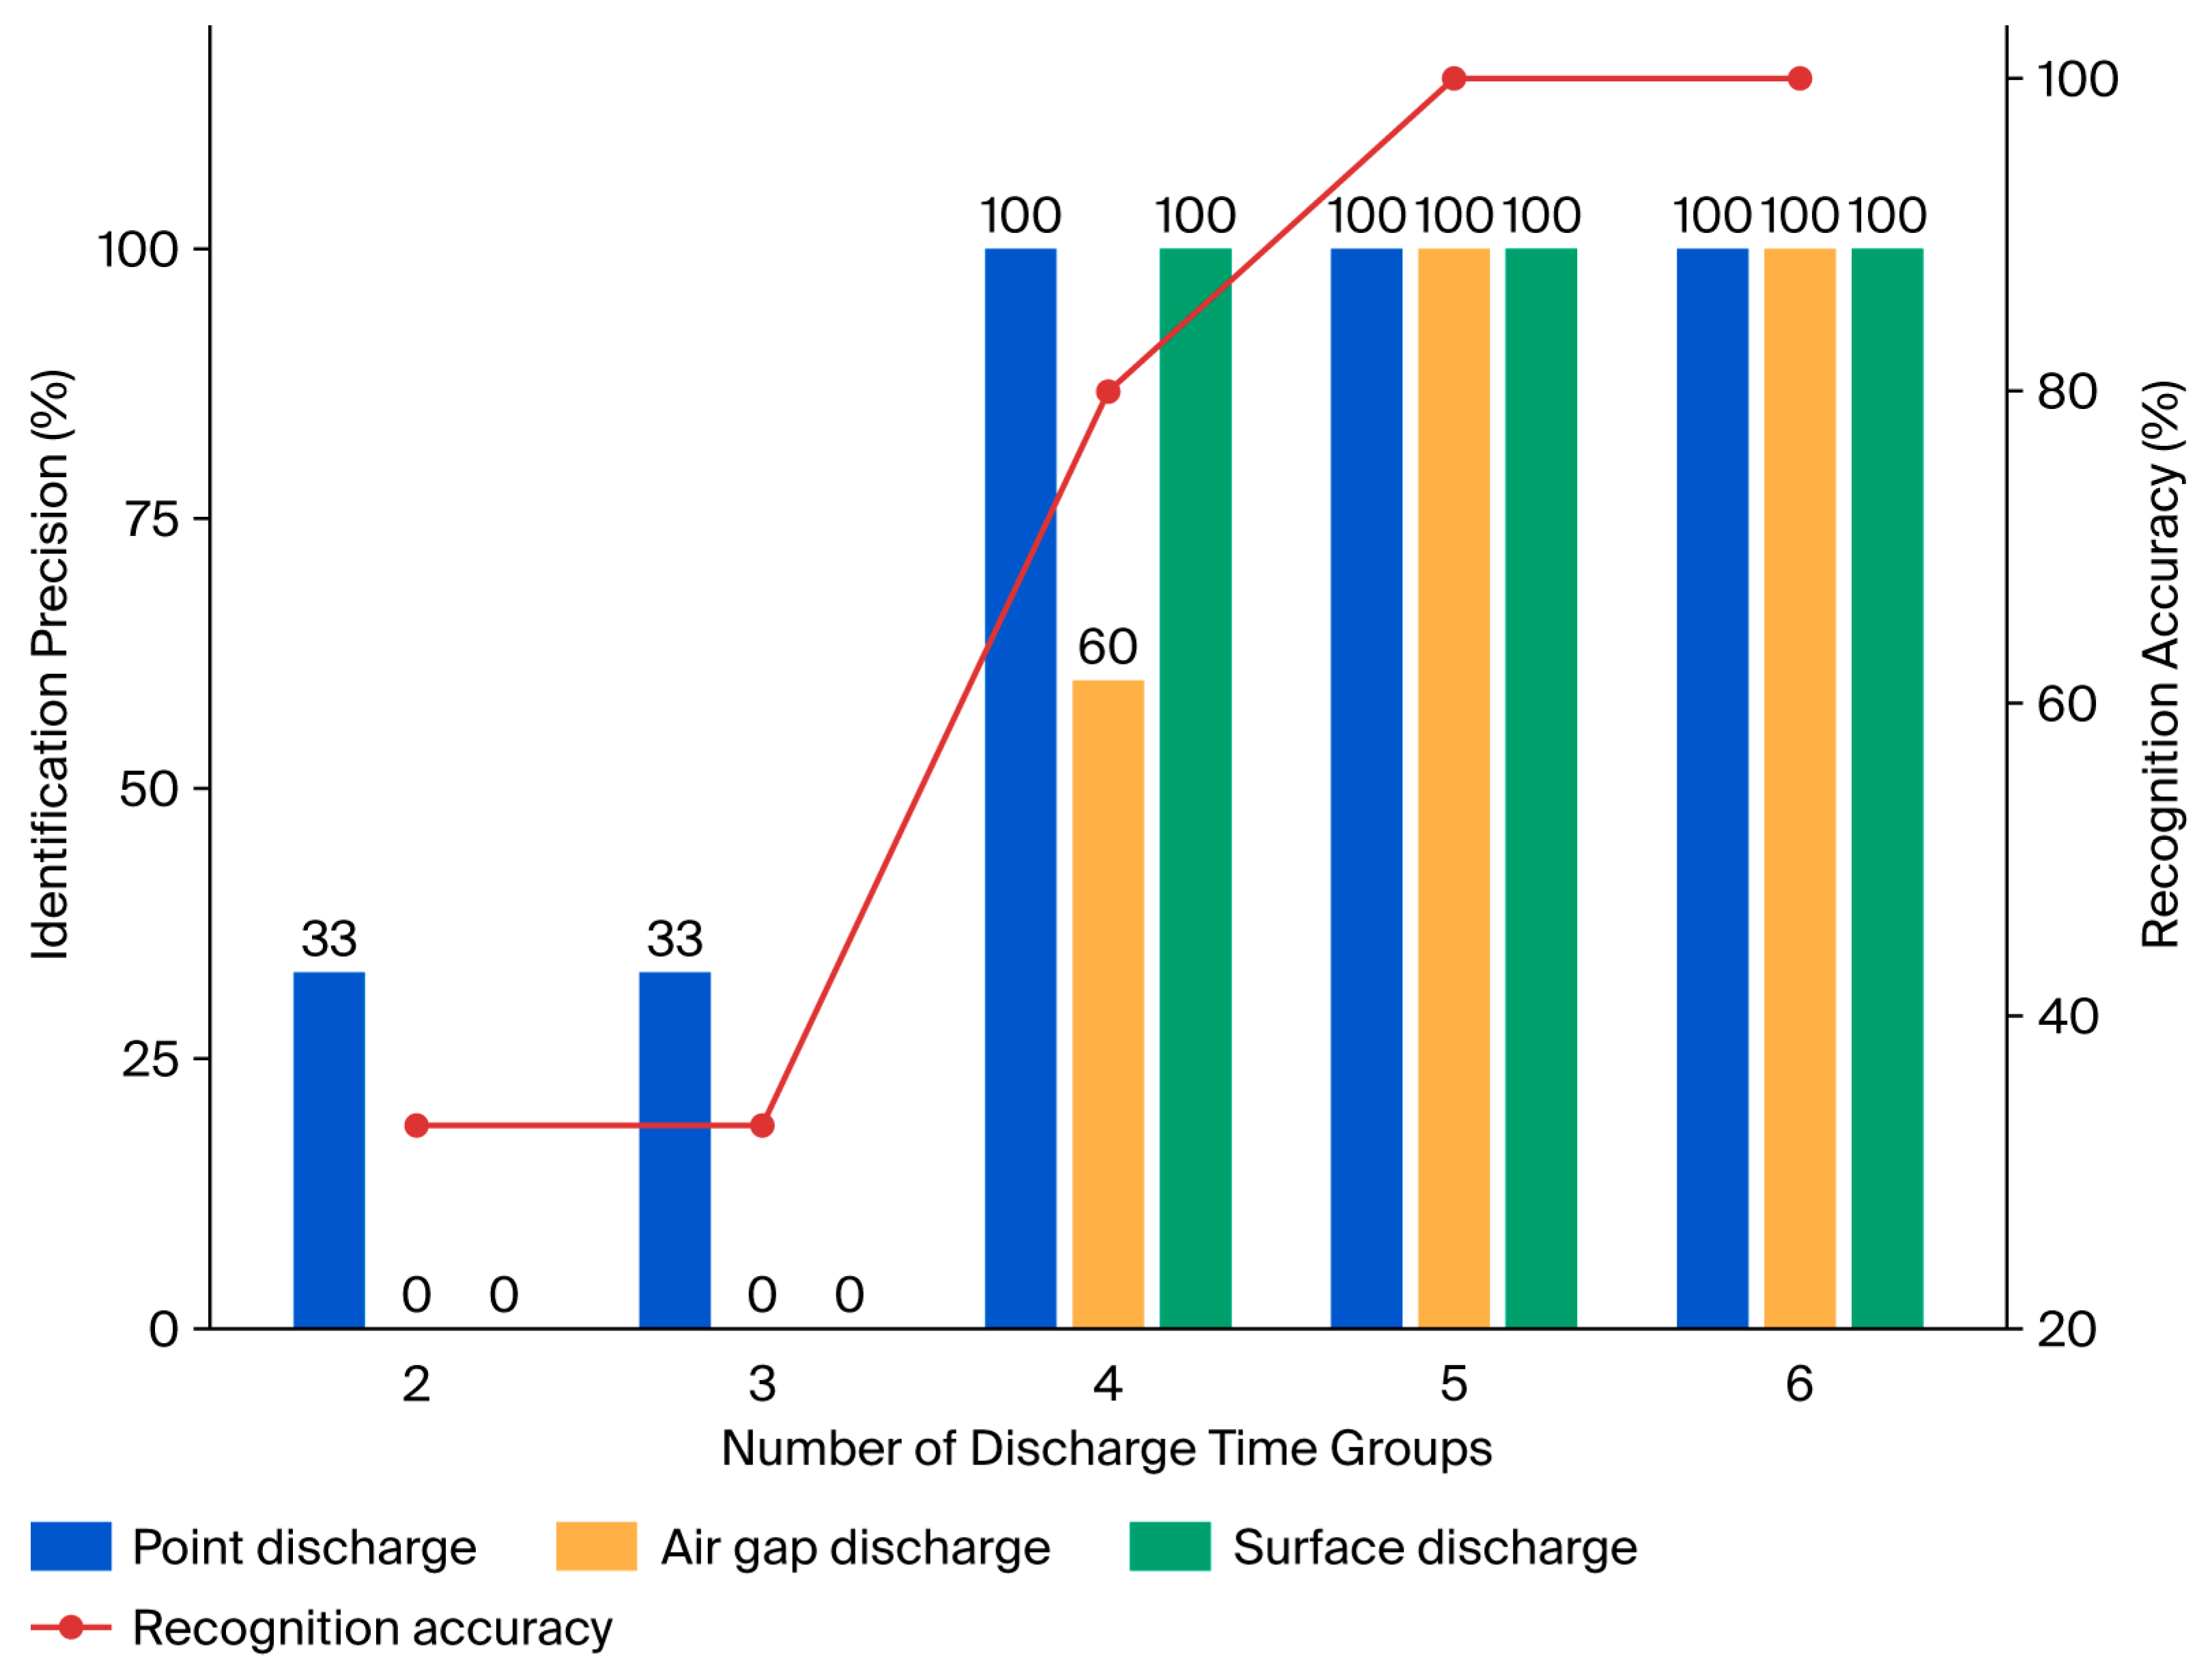
Figure 17 shows the relationship between the number of discharge-time groups included in the sample dataset and the recognition precision and accuracy.
When only two or three discharge-time groups were used, the recognition precision was 33% for corona discharge and 0% for both air-gap and surface discharge, resulting in an overall recognition accuracy of only 33%. This poor performance was mainly caused by the large uncertainty in the CO/NO2 concentration ratio measured at the early discharge stage of 0.5 h, which weakened the correspondence between the ratio and the discharge type. The low recognition accuracy at the early stage indicates that the proposed gas-ratio method is less reliable when gas concentrations are still low, and measurement uncertainty is relatively high. Therefore, this method is more suitable for accumulated gas monitoring over a certain time period than for instantaneous early-stage fault detection. For rapidly developing insulation failures, this technique should be combined with fast-response electrical PD detection methods such as TEV, UHF, pulse-current, or ultrasonic detection.
When four discharge-time groups were included, the method achieved 100% recognition precision for corona discharge and surface discharge, 60% recognition precision for air-gap discharge, and an overall recognition accuracy of 78%. When five or more discharge-time groups were included, the proposed method achieved 100% recognition precision and accuracy for the three single-defect models tested under laboratory conditions.
Although the proposed CO/NO2 ratio method showed promising laboratory results, its practical application still requires further consideration to test humidity levels, airflow disturbance, mixed defects, insulation material differences, sensor cross-sensitivity, and long-term field stability. Future work will focus on multi-point sensing, sensor-array-based compensation, and field validation under practical AIS operating conditions.
5. Conclusions
This study investigated a PD-type recognition method for AIS based on the CO/NO2 gas concentration ratio. The main conclusions are as follows:
A hybrid numerical model of air partial discharge was established to analyze the formation of discharge products. Among the considered products, CO and NO2 showed relatively high feasibility for detection and better stability than highly reactive species such as NO3 and N2O5. Reducing the pressure increased the average electron energy and promoted the generation of CO and NO2.
Experiments using three typical AIS defect models showed that the CO/NO2 ratio exhibited distinct characteristics for different discharge types. Under the tested conditions, the ratio was higher than 1 for corona discharge and air-gap discharge. By contrast, it was lower than 1 for the epoxy-resin-based surface discharge model. Air-gap discharge could be further distinguished by the increasing trend of the CO/NO2 ratio with discharge time.
A low-cost sensor-based prototype was developed to verify the feasibility of online recognition. Laboratory tests showed that the proposed method achieved 100% recognition accuracy when five or more discharge-time groups were used for the three tested single-defect models. However, recognition accuracy at the early stage was limited by low gas concentrations and measurement uncertainty.
The proposed method should be regarded as an auxiliary diagnostic approach for AIS insulation monitoring. Its practical application requires further investigation to test the airflow disturbance, humidity effects, mixed defects, insulation materials with different carbon contents, sensor cross-sensitivity, and long-term field stability.