Review

Hydrothermal Carbonization of Marine Biowaste: A Focused Review of Hydrochar Production, Characterization, and Applications


by
Tatwadhika Rangin Siddhartha
1,2,
Frederik Ronsse
2 and
Philippe M. Heynderickx
1,2,*
1
Center of Green Chemistry and Environmental Biotechnology (GREAT), Ghent University Global Campus, Incheon 21985, Republic of Korea
2
Department of Green Chemistry and Technology, Faculty of Bioscience Engineering, Ghent University, 653 Coupure Links, B-9000 Ghent, Belgium
*
Author to whom correspondence should be addressed.
Energies 2026, 19(13), 3124; https://doi.org/10.3390/en19133124
Submission received: 31 May 2026 / Revised: 25 June 2026 / Accepted: 27 June 2026 / Published: 1 July 2026

Abstract

Marine biowaste (fish and crustacean processing residues) is produced in tens of millions of tons annually, yet remains dramatically underutilized as a feedstock. Hydrothermal carbonization offers a technically attractive valorization route for these high-moisture, non-lignocellulosic materials, converting them to carbon-enriched hydrochar without the energy-intensive pre-drying required by pyrolysis. This focused review treats marine animal waste as the primary studies and micro- and macroalgal hydrothermal carbonization as a comparative benchmark to understand how the current research is going, the impact of production parameters, potential application, and possible research gaps to explore. Crustacean waste yields substantially more hydrochar (37–69%) than fish waste (15–34%) under equivalent conditions, driven by calcium carbonate retention in the solid phase. Unactivated hydrochars have low BET surface areas (<30 m2/g) and modest adsorption capacities (~10 mg/g). Acid deashing followed by KOH activation at 700 °C unlocks nanoporous structures with BET surface areas up to 680 m2/g and oxytetracycline adsorption capacities of 61.3 mg/g. Critical research gaps include the absence of techno-economic analysis, limited life-cycle assessment, and non-standardized reporting conventions. These must be addressed before upscaling to industrial viability can be achieved.

1. Introduction

The global seafood industry generates staggering volumes of solid waste. Fish processing alone discards between 35 and 65% of the live mass of harvested fish as inedible fractions, including heads, tails, viscera, fins, skin, and bones, while crustacean processing leaves between 29 and 61% of raw weight as shell residues composed predominantly of chitin and calcium carbonate [1,2,3,4]. At the global scale, fishery production exceeded 185 million metric tons in 2022 [3], of which approximately 20 million metric tons were lost as processing waste, if calculated based on the inedible parts mentioned before. In the European Union, the fish processing industry generates approximately 5 million metric tons of solid by-products annually, while Asia accounts for the largest share globally, with countries such as China, South Korea, Vietnam, Thailand, and India representing major seafood-processing hubs [3].
Current industrial management of marine processing waste relies on a portfolio of conventional strategies, none of which fully satisfies the dual imperatives of environmental compliance and resource recovery. In addition, the waste generation could appear at the upstream stage (fishery production, market, etc.) or be generated at the downstream, consumer level. The latter would be rather trickier to handle. The most widely practiced valorization route is the production of fishmeal and fish oil, in which residues are steam-cooked, pressed, dried, and ground to yield a protein-rich animal feed supplement and a refined oil co-product [1,2,5]. While commercially established in Norway, Chile, Peru, and Southeast Asia, the fishmeal route is energy-intensive: pre-drying feedstocks with moisture contents of 60 to 80% on a wet basis demands significant thermal energy input, and the drying step alone can account for 50 to 70% of total process energy consumption [6,7,8,9]. Furthermore, market absorption of fishmeal is increasingly constrained by saturation in the aquaculture sector, growing competition from insect- and plant-based protein alternatives, and biosafety concerns regarding the accumulation of persistent organic pollutants in rendered products [10,11,12]. Direct land spreading of marine biowaste as an organic fertilizer offers nitrogen and calcium value but is restricted to narrow seasonal application windows, is subject to ammonia volatilization losses, and is not feasible at the scale of industrial processing hubs in coastal industrial zones.
Thermal disposal routes face specific constraints, since marine biowaste incineration is energetically unattractive when applied to raw residues with moisture contents between 60 and 80% [7,9,13]: auxiliary fuel is required to sustain combustion, and the net energy recovery is substantially negative unless extensive pre-drying is performed, which reintroduces the same drying energy penalty encountered in fishmeal production [14]. In many jurisdictions, direct landfilling of untreated biowaste (especially the particularly liquid and semi-solid fractions) is prohibited or progressively restricted. Within the European Union, the Landfill Directive mandates diversion of biodegradable waste from landfill, and the Waste Framework Directive requires member states to prioritize recovery over disposal. At the international level, ocean dumping of fish processing residues, historically common in coastal regions of Asia and South America, has been restricted under the MARPOL Convention and the 1996 London Protocol, effectively eliminating disposal options that were once the default for shore-side processors [15,16,17].
These limitations collectively underscore the absence of a scalable, energy-efficient, wet-process valorization technology for marine biowaste that can operate without pre-drying, accommodate heterogeneous feedstock compositions spanning both fish and crustacean streams, and produce a value-added solid product with clear market applications. Hydrothermal carbonization (HTC) addresses all these requirements simultaneously and has accordingly attracted growing research attention as a pathway for marine biowaste valorization [18,19].
Hydrothermal carbonization is a thermochemical process that converts moist biomass into a carbon-enriched solid product, hydrochar, under subcritical water conditions, typically at temperatures between 160 and 250 °C and autogenous pressures between 1 and 4 MPa [20,21,22,23]. Because the reaction medium is liquid water, the process is inherently suited to wet feedstocks, eliminating the energy-intensive pre-drying step that renders pyrolysis economically unattractive for high-moisture materials such as marine processing waste [22,24,25]. The product slate comprises three fractions: a carbon-enriched solid hydrochar, an aqueous process water containing dissolved organic compounds and nutrients, and a small gas fraction consisting primarily of CO2 alongside minor contributions from CH4 and H2 [23,24,26,27]. The hydrochar retains much of the feedstock carbon in a more stable, aromatic form suitable for solid fuel applications, soil amendment, or—following activation—high-performance adsorption. The particular suitability of hydrothermal carbonization for non-lignocellulosic biomass has been recognized in the broader literature [8,28], and marine biowaste represents one of the most challenging yet rewarding feedstock classes within this category.
Hence, this review will dig deeper into research on HTC of marine biowaste. This review adopts a focused two-tier scope. Tier 1 comprises peer-reviewed studies on hydrothermal carbonization of marine animal waste including fish waste from multiple species and fractions, as well as crustacean waste from shrimp, crab, and lobster shells. It constitutes approximately 26 in-scope articles identified in the Web of Science Core Collection. Comparative benchmark studies comprise selectively drawn studies on hydrothermal carbonization of micro- and macroalgae, approximately 340 Web of Science papers, used to contextualize the results for yields, BET surface area, elemental composition, and adsorption performance, where the primary dataset is sparse. Explicitly excluded from the primary scope are aquatic vascular plants such as water hyacinth, cattail, duckweed, reed, mangrove, and macrophytes.
The review addresses four research questions:
RQ1. How does the unique biochemical composition of marine animal waste—particularly its high protein, chitin, and mineral content—influence hydrochar properties under comparable hydrothermal carbonization conditions?
RQ2. How do process parameters, specifically temperature, residence time, and water-to-biomass ratio, affect the physicochemical properties of hydrochars derived from marine animal waste, and how do these compare to algal benchmarks?
RQ3. To what extent do pretreatment strategies, such as acid demineralization and enzymatic hydrolysis, modify feedstock composition and subsequently determine hydrochar quality and application potential?
RQ4. How does post-treatment activation transform marine biowaste hydrochar into high-performance carbonaceous adsorbents, and what is the relationship between preparation pathway and adsorption performance for aquatic pollutants?
In order to address the proposed research questions, the corresponding literature search was conducted in the Web of Science Core Collection in April 2026, applying a document type filter for articles and a language filter for English. Two parallel search queries were executed. The Tier 1 targeted marine animal waste feedstocks using Boolean combinations of terms including “hydrothermal carbonization,” “hydrochar,” “fish waste,” “shrimp waste,” “crab,” “crustacean,” “seafood waste,” “mussel,” and “bivalve,” yielding approximately 26 in-scope articles after screening. Tier 2, the benchmark studies, targeted algal hydrothermal carbonization using “microalgae,” “macroalgae,” “seaweed,” “Spirulina,” “Chlorella,” “kelp,” and related terms, yielding approximately 340 articles, including review articles that were used selectively for quantitative comparison to the primary studies.
Inclusion criteria for the Tier 1 were: marine animal origin feedstock; primary hydrothermal carbonization or hydrochar production focus; and a peer-reviewed journal article in English. Exclusion criteria were: lignocellulosic aquatic plants; commercial chitin or chitosan without marine-source linkage; co-HTC where the marine biomass fraction is a minor additive; and non-English publications. Table 1 summarizes the screening process of the study.

2. Hydrothermal Carbonization of Animal Marine Biowaste

Hydrothermal carbonization of marine biowaste is governed by four interacting parameters. Temperature (150–250 °C) is the most influential: rising severity decreases hydrochar yield as organic matter dissolves into the aqueous phase while increasing carbon content and heating value through progressive dehydration and decarboxylation, establishing a fundamental yield–quality trade-off [20,29,30]. Pressure is autogenous and rises with temperature, maintaining water in the liquid phase essential for subcritical reaction chemistry without independent control [20,31,32]. Residence time is typically optimal at 1 to 2 h for protein-rich feedstocks, beyond which yield declines without meaningful improvement in hydrochar quality, reflecting the rapid kinetics of protein hydrolysis and Maillard condensation under subcritical conditions [9,33,34]. The water-to-biomass ratio (W:B) governs intermediate dilution and heat transfer; however, the inherently high moisture content of raw marine biowaste partially self-adjusts the effective process water volume [7].
Marine animal waste is biochemically different from terrestrial lignocellulosic biomass in three important respects. First, it is protein- and lipid-rich: fish waste contains 50 to 60% protein and 15 to 25% lipid on a dry basis, providing abundant nitrogenous precursors and hydrophobic organic matter that fundamentally alter the reaction pathways active during hydrothermal carbonization [8,35,36,37]. Second, crustacean waste is chitin-rich: chitin, the structural polysaccharide of arthropod exoskeletons with the chemical structure poly-β-(1→4)-N-acetyl-D-glucosamine, is a nitrogen-containing biopolymer absent in terrestrial plants, and its hydrothermal hydrolysis products are the essential reactant for the Maillard pathway unique to marine biowaste [38,39,40]. Third, crustacean waste is mineral-heavy: calcium carbonate constitutes a large fraction of crustacean exoskeletons, resulting in raw ash contents between 25 and 60% on a dry basis that profoundly affect hydrothermal carbonization product yields and hydrochar chemistry [7,41]. In the marine context, the absence of lignin is essentially the baseline: neither fish waste, crustacean shells, nor algae contains lignin, the terrestrial-plant-specific aromatic cross-linked polymer whose thermochemical behavior dominates the hydrothermal carbonization literature for biomass.

2.1. Reaction Chemistry

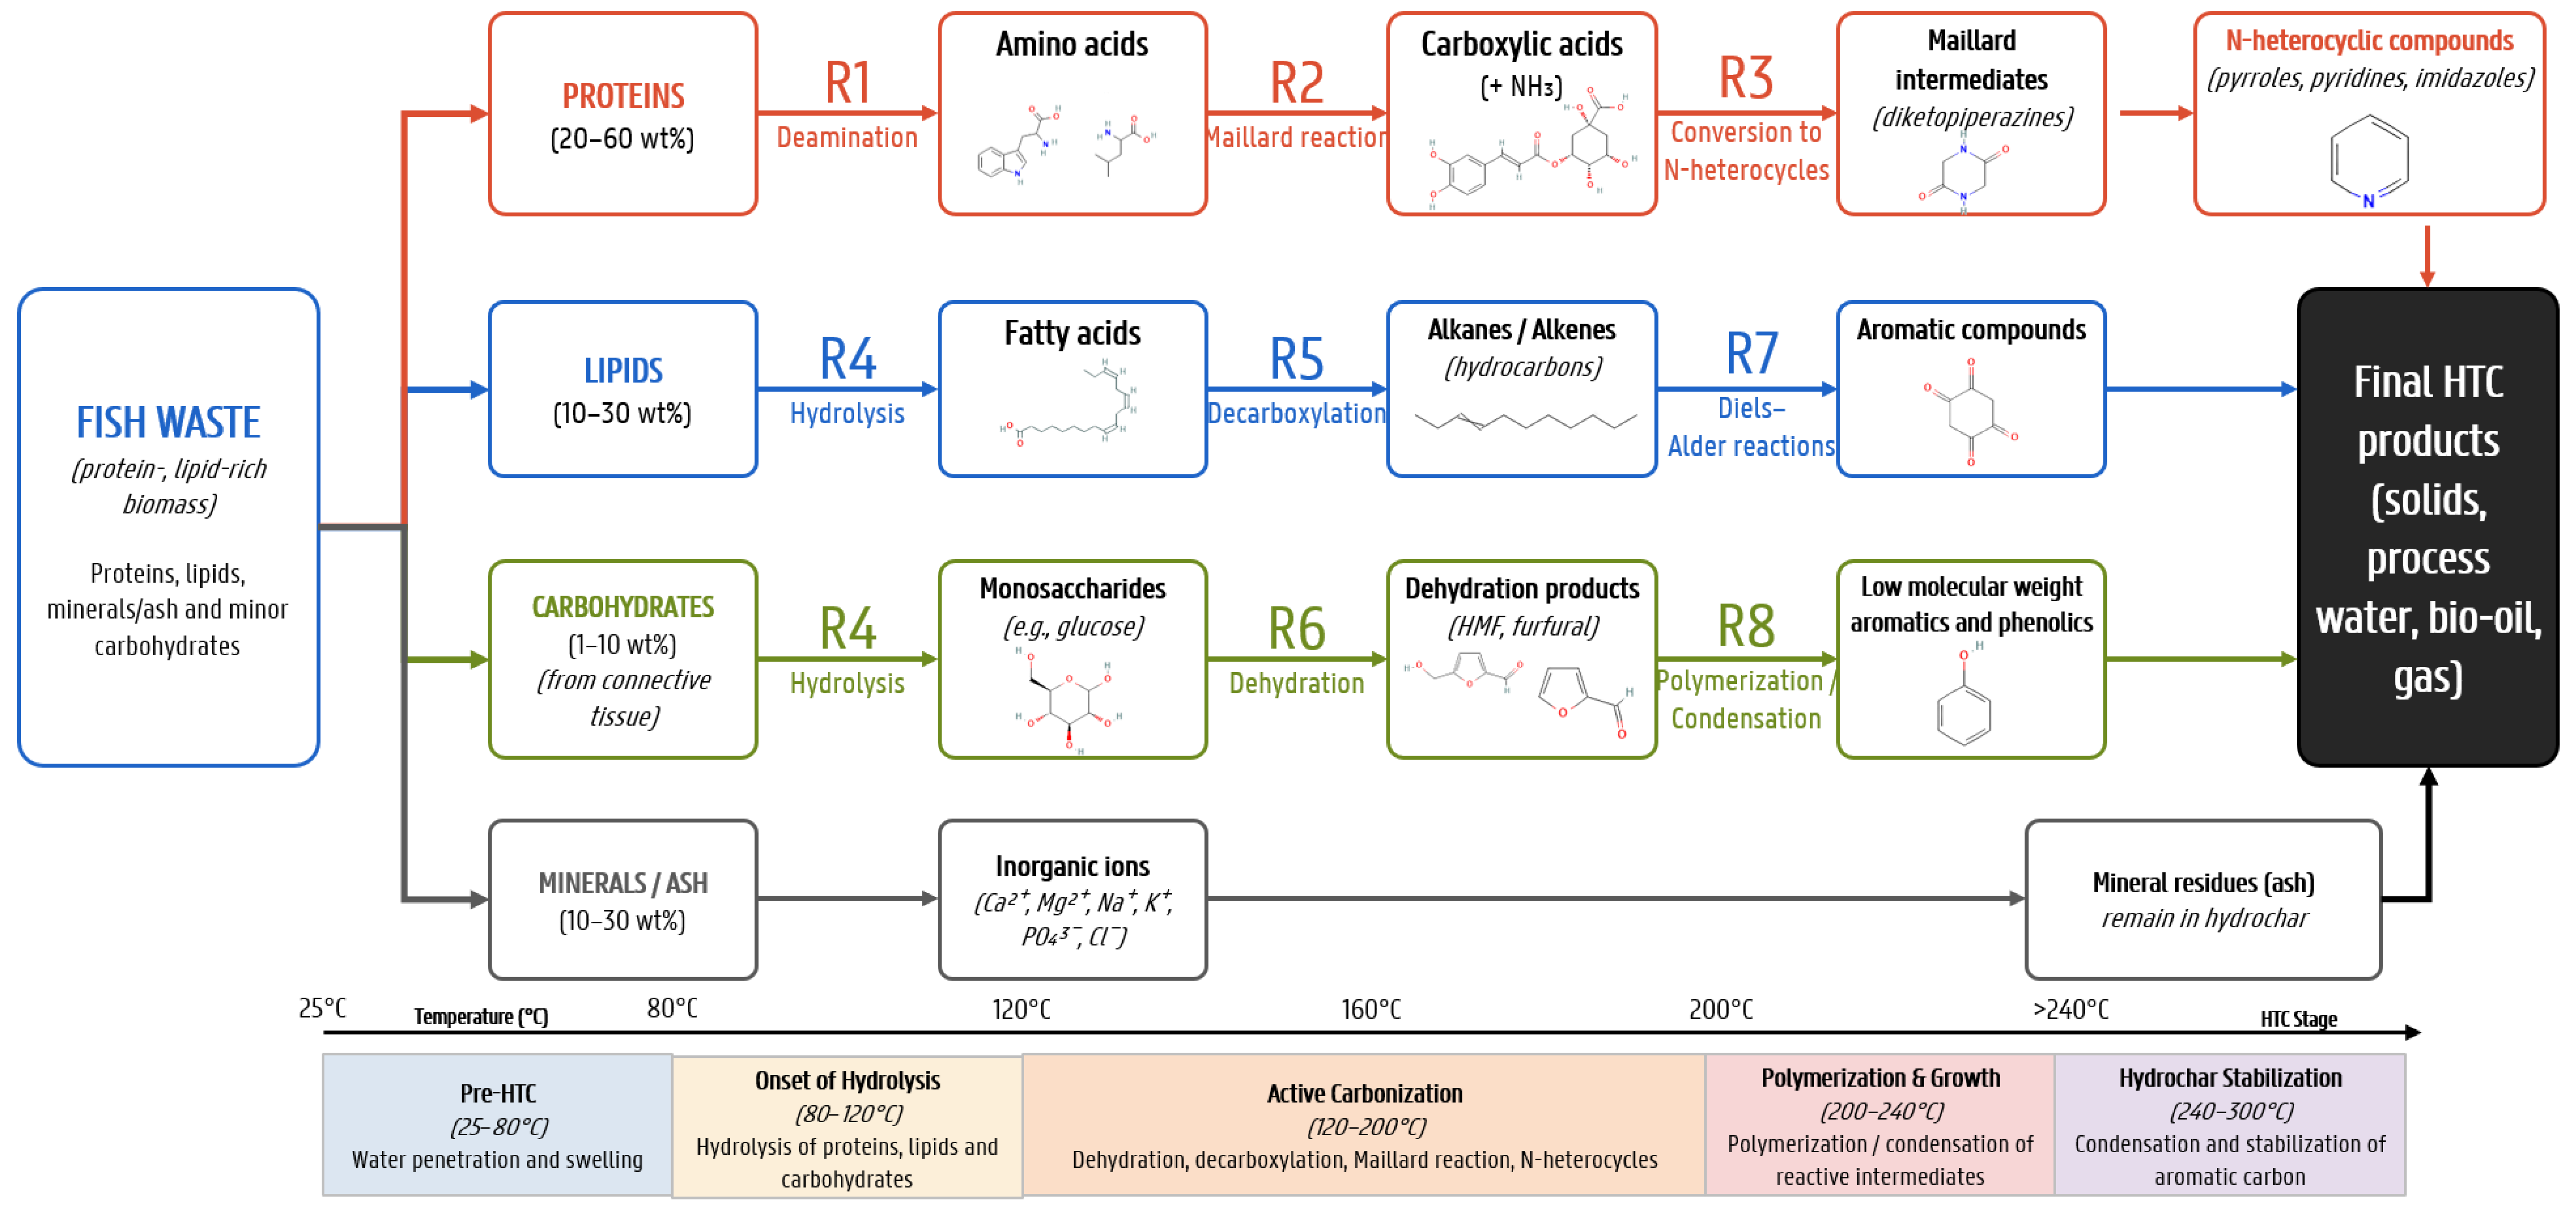
The conversion of non-lignocellulosic biomass, like marine animal biowaste, during hydrothermal carbonization proceeds through three parallel reaction networks that converge into a polyaromatic solid hydrochar, as shown in Figure 1. Proteins, the dominant fraction at 20–60 wt%, are first hydrolyzed by subcritical water before undergoing deamination (R1), releasing NH3 into the process water alongside carboxylic acid fragments. These amino acid residues simultaneously participate in Maillard condensation (R2) with reducing sugars to form diketopiperazines, which are cyclic dipeptides that serve as the primary nitrogen-bearing Maillard intermediates [42,43]. Above 180 °C, these diketopiperazines are converted to N-heterocyclic compounds (R3), principally pyrroles and pyridines, which become covalently incorporated into the hydrochar lattice and account for the characteristically elevated nitrogen content of marine biowaste hydrochars [42]. Lipids follow a distinct pathway: glycerides are hydrolyzed (R4) to free fatty acids, which lose CO2 by decarboxylation (R5) to yield unsaturated aliphatic hydrocarbons; these unsaturated species undergo Diels–Alder cycloaddition (R7) and subsequent dehydrogenation to produce aromatic compounds integrated into the growing carbon matrix [20]. Carbohydrates, though a minor fraction in fish waste, are hydrolyzed (R4) to monosaccharides that undergo acid-catalyzed dehydration (R6) to produce HMF and furfural; these furan derivatives then condense and polymerize (R8) into low-molecular-weight phenolics and aromatics serving as soluble hydrochar precursors [20,26]. The mineral fraction passes through the process chemically unchanged, accumulating as ash in the hydrochar solid. These pathways are temperature-staged: hydrolysis and deamination dominate between 80 and 120 °C; active carbonization, including dehydration, decarboxylation, and Maillard chemistry, from 120 to 200 °C; polymerization and Diels–Alder ring formation between 200 and 240 °C; and final condensation into the stabilized aromatic hydrochar structure above 240 °C [42].
Not all reaction pathways depicted in Figure 1 carry equal evidential weight. The protein hydrolysis, deamination, and Maillard condensation routes (R1 to R3) are the most robustly supported: the sequential hydrolysis of polypeptides to free amino acids, followed by decarboxylation, deamination, and self-rearrangement to N-heterocyclic compounds, has been traced mechanistically in protein-rich non-lignocellulosic biowaste [42,44,45], and is confirmed by XPS nitrogen speciation, FTIR amide band analysis, and N-heterocycle detection in marine biowaste hydrochars [46,47].
The lipid decarboxylation routes (R4, R5) are supported from model compound HTC of seaweed literature without direct verification in other marine biowaste HTC systems [44]. The Diels–Alder route (R7) is not a lipid-associated pathway but is mechanistically linked to carbohydrate-derived furan intermediates (5-HMF and furfural) produced during polysaccharide dehydration, and should be interpreted accordingly [20,26,42].
The carbohydrate dehydration pathway (R6, R8) is well established for lignocellulosic feedstocks, and Zhuang et al. (2019) provide mechanistic evidence that analogous dehydration and furanization reactions proceed in protein-polysaccharide-rich non-lignocellulosic systems [42]. Direct confirmation in fish-derived hydrochars remains limited, given the minor carbohydrate fraction; however, crustacean feedstocks containing chitin and chitosan provide a meaningful polysaccharide substrate, making this pathway more than purely inferential for that feedstock class.

2.2. Feedstock Characterization

Fish processing generates inedible fractions totaling 35 to 65% of live weight, comprising heads, viscera, skin, fins, and bones. These fractions are dominated by protein (40–70% dry basis), lipid (5–30%), and ash (5–20%), with species variability—particularly lipid content between fatty pelagic and lean demersal species—influencing organic matter partitioning during hydrothermal carbonization [48,49]. Fresh fish waste slurries carry 60–81% moisture on a wet basis [7], making pre-drying for pyrolysis energetically prohibitive and establishing hydrothermal carbonization as the natural processing pathway; protein-derived amino acids serve as the primary precursors for nitrogen retention and Maillard condensation, while lipids partition preferentially into the liquid phase.
Crustacean shells are compositionally distinct, containing 15–40% chitin, 30–50% calcium carbonate, and 25–40% protein on a dry basis, yielding ash contents of 25–60% that substantially exceed those of fish waste [2,5]. The persistent calcium carbonate during hydrothermal carbonization depresses the carbon fraction of the hydrochar while driving the characteristically high solid yields of 37 to 69% observed for this feedstock class. Chitin (the second most abundant natural biopolymer) undergoes partial deacetylation and depolymerization under subcritical conditions, generating intermediates that participate in Maillard-type condensation and incorporate nitrogen into the hydrochar matrix as amines, amides, and pyrrolic-N functionalities that govern adsorption selectivity [40].
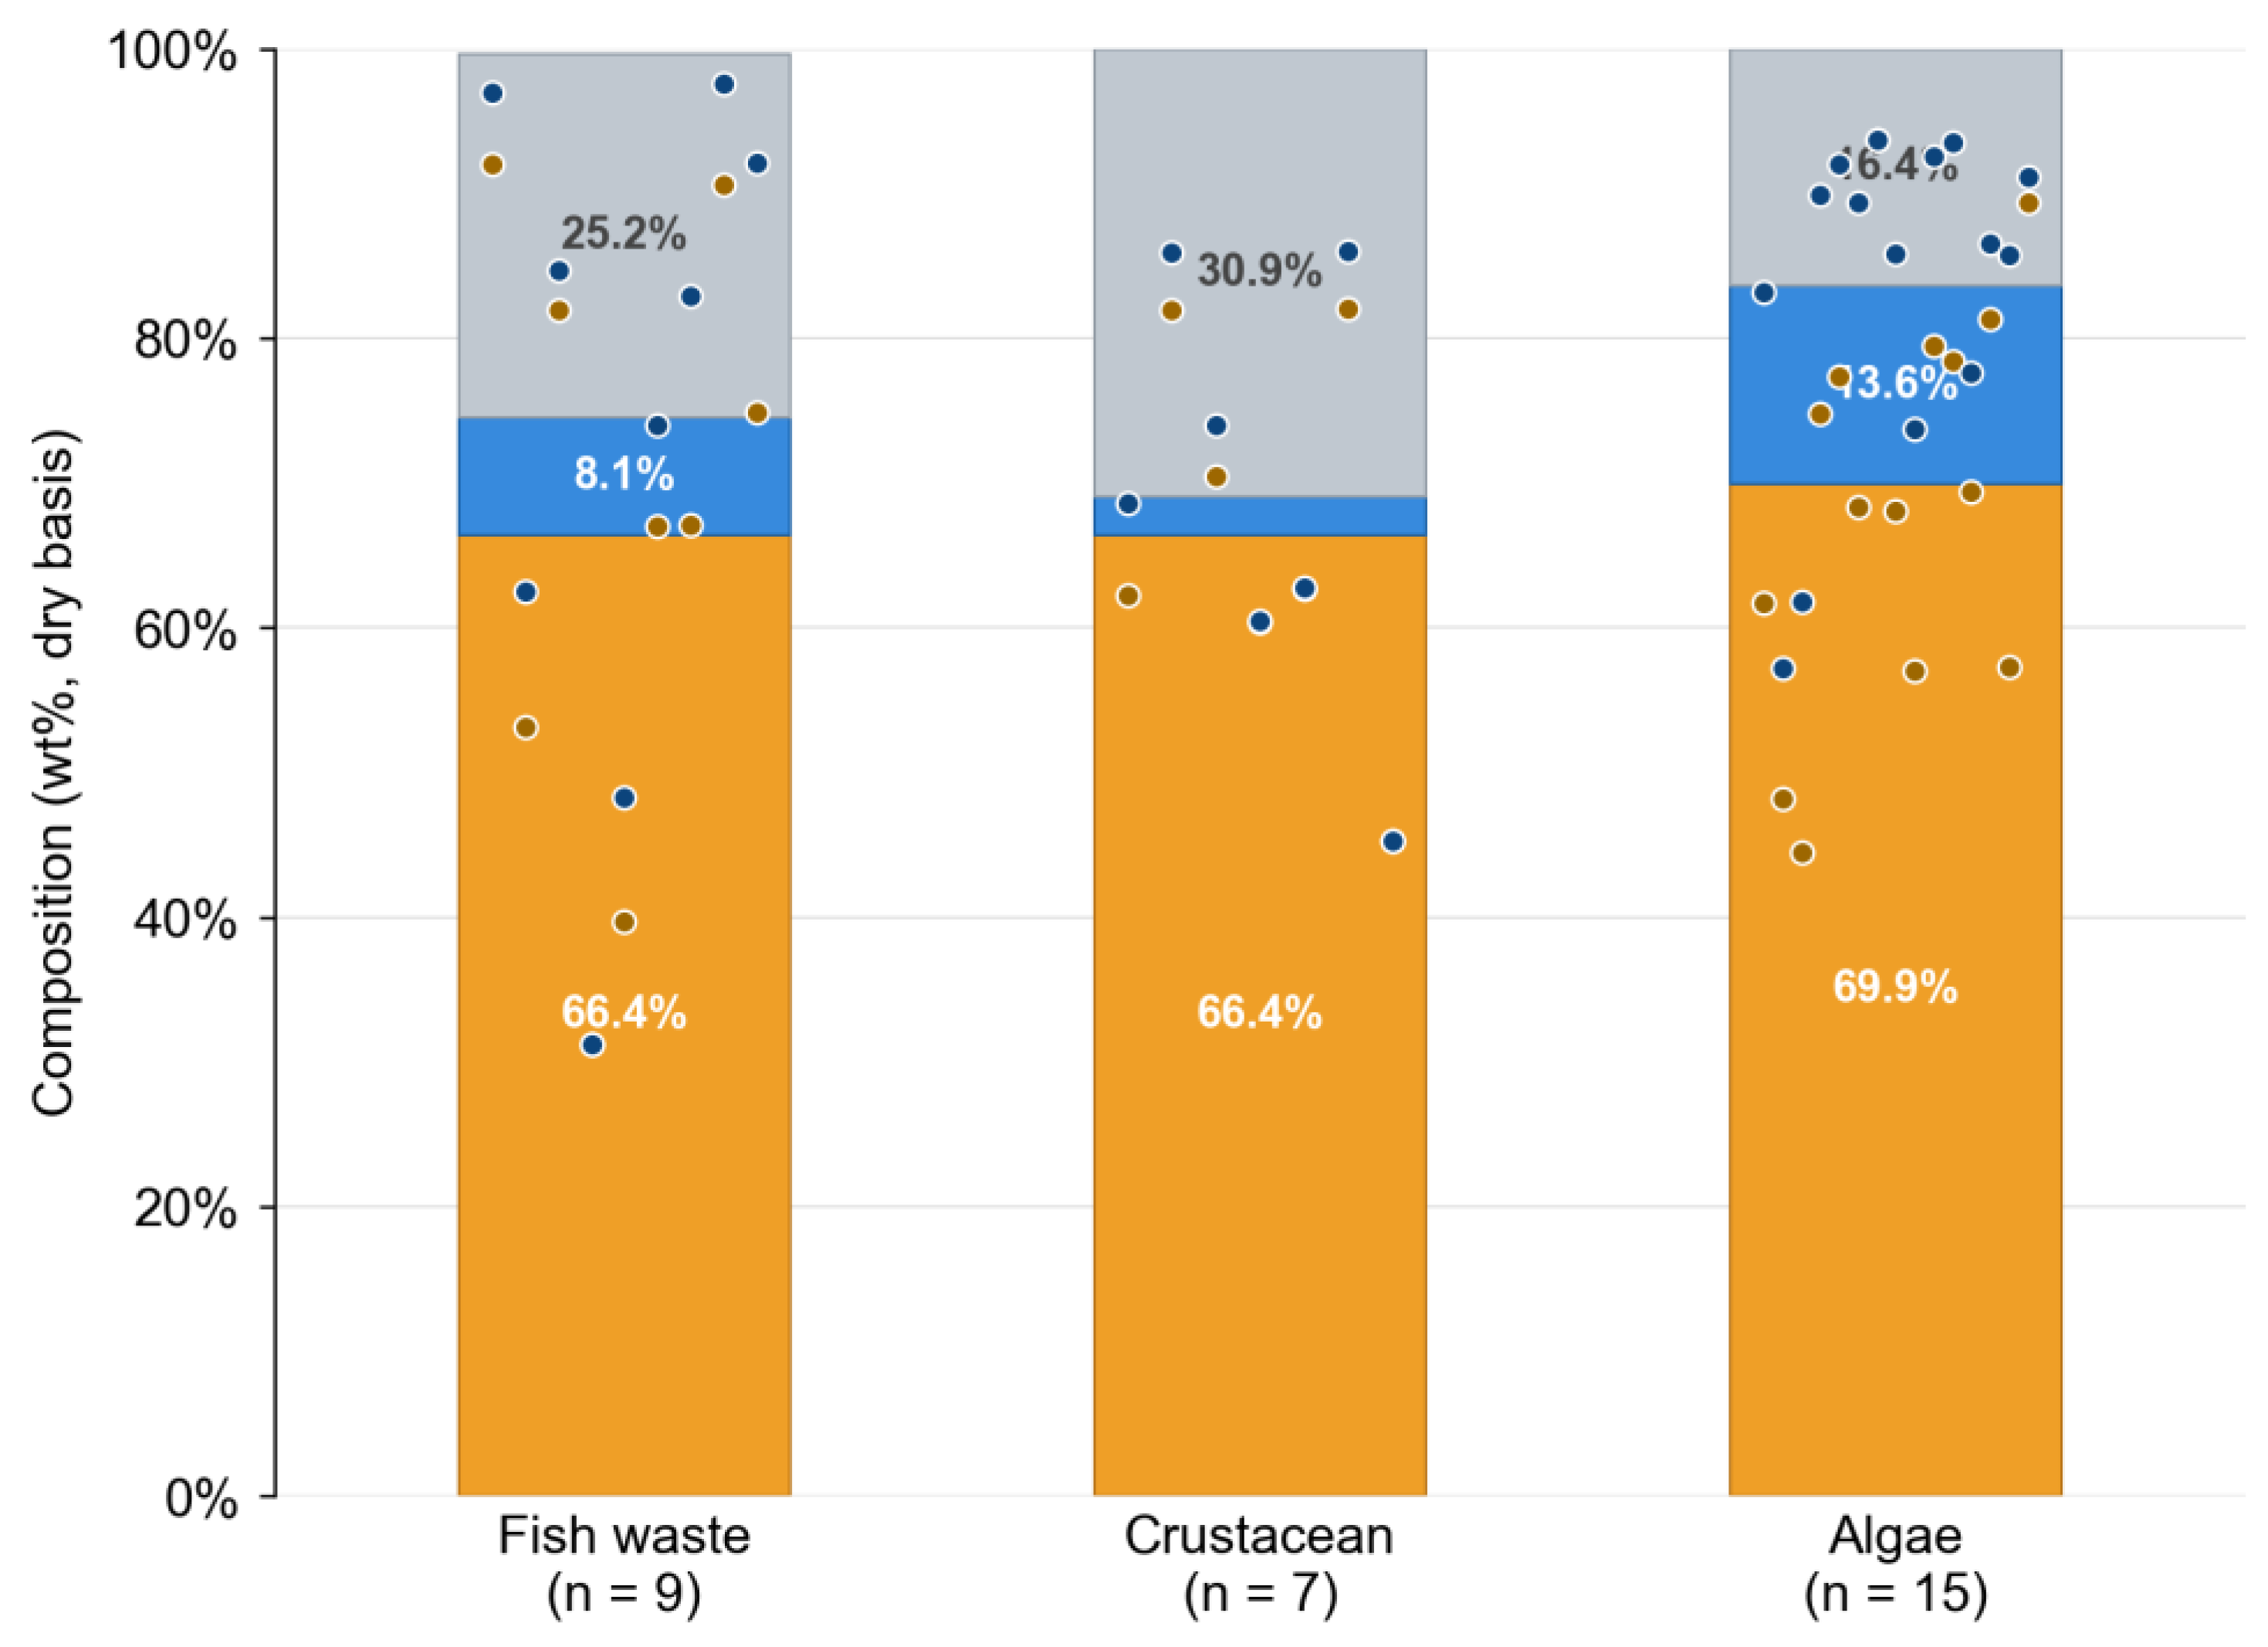
Meanwhile, algal biomass such as Chlorella, Spirulina, and Nannochloropsis, and structurally polysaccharide-rich macroalgae such as Sargassum, Laminaria, and Ulva, have been the subject of extensive dedicated reviews on hydrothermal carbonization [27,50,51,52] and Sargassum-specific carbonization pathways [53]. A comprehensive thermochemical characterization of the principal categories of marine bioresources by Bittencourt et al. provides a useful comparative baseline. Proximate analysis comparison in Figure 2 shows that volatile matter is broadly similar across all three feedstock classes, ranging from 66.4% in fish waste and crustacean to 69.9% in algae, reflecting the shared dominance of thermally labile organic fractions (proteins, lipids, and polysaccharides) regardless of feedstock origin. The more meaningful contrast lies in fixed carbon and ash. Algae records the highest fixed carbon (13.6%), attributable to its carbohydrate-rich cell wall composition of alginate, fucoidan, and cellulose, which undergo solid-state condensation more readily than protein- or chitin-dominated matrices. Fish waste occupies an intermediate position (8.1%), while crustacean waste shows the lowest fixed carbon (2.6%), consistent with a biochemistry where the inorganic calcium carbonate fraction of the exoskeleton displaces carbonizable organic material in the solid residue. Ash content follows the inverse trend: crustacean waste carries the highest ash (30.9%) as a direct consequence of calcium carbonate mineral retention, fish waste is intermediate (25.2%), reflecting its proteinaceous but mineral-bearing bone and scale fractions, and algae is lowest (16.4%), consistent with its predominantly organic, mineral-lean cell wall composition.

2.3. Production Parameters and Impact on Yield

Table 1 reveals considerable diversity in the process conditions applied across HTC of marine biowaste, with pretreatment strategy, reaction temperature, W:B ratio, and residence time all varying substantially between assessed studies.
The majority of studies processed their feedstocks without any preliminary conditioning, applying HTC directly to raw fish or crustacean waste [7,41,54,55]. This gives HTC a significant advantage as a rather low-energy and low-cost treatment. A notable exception is the series of studies that employed enzymatic hydrolysis using a Viscozyme–Lipase–Protease cocktail (1:1:1, 40 °C) prior to carbonization [8,9,33,34,56], a strategy aimed at breaking down proteins and lipids to enhance the accessibility of the biomass during HTC. One study applied mechanical drying and milling (oven-dried at 105 °C, ground to <1 mm) as a standardization step before thermochemical treatment [57], while another used a dilute HCl wash (0.5 M) to remove carbonate minerals from shrimp exoskeleton before carbonization [41].
A critical gap in the literature is the absence of techno-economic analyses comparing these strategies. HCl demineralization deashing at an industrial scale requires acid procurement, corrosion-resistant equipment, and waste acid treatment; enzymatic hydrolysis requires temperature-controlled bioreactors and commercial enzyme supplies. Neither has been subjected to formal cost or life-cycle analysis in the context of marine biowaste hydrothermal carbonization.
Reaction temperatures across the dataset span a broad range of 150–300 °C. The lowest temperatures (150 °C) were exclusively applied to enzymatically pretreated feedstocks [8,9], suggesting that prior hydrolysis may compensate for reduced thermal severity. Most other studies operated in the 200–240 °C window [7,41,54,55,57], which is the typical hydrothermal carbonization regime for wet biomass [30]. Studies on chitin and chitosan as isolated biopolymers explored a wider range of 150–250 °C to map the effect of temperature systematically [40].
The W:B ratio shows the most striking variability in the dataset. Studies using enzymatically pretreated slurries applied near-unity ratios (W:B = 1), reflecting the high moisture content already present in the hydrolysate [7,41,54,55]. In contrast, most other studies used ratios of 7 [7,54,55] or as high as 20 [57], the latter being common when processing dry or solid feedstocks that require substantial water as the reaction medium.
Residence times similarly span a wide range, from 60 min for low-temperature enzymatic pretreatment runs [8,9] to 6 h in the majority of standard HTC studies [7,54,55], and extending to 12 h for crustacean exoskeleton carbonization [41] and even 24 h in an acid-assisted HTC experiment [58]. This last condition, despite its prolonged duration, yielded exceptionally low hydrochar recoveries of only 3.1–8.6% [59], pointing to substantial solubilization of organic matter under acidic hydrothermal conditions.
No study on marine biowaste HTC has independently controlled reactor pressure; it remains an autogenous, temperature-driven parameter across all reviewed works. Comparison with the broader HTC literature suggests that this is an unexplored opportunity. Güleç et al. (2021) showed elevated pressure enhanced carbonization in cellulose-rich biomass, while Yu et al. (2023) demonstrated that decoupling pressure from temperature can achieve equivalent carbonization at lower temperatures [60,61]. Whether similar effects hold for protein- and chitin-rich marine feedstocks, where pressure could influence nitrogen retention, surface area development, or carbonization efficiency, remains entirely untested and warrants future investigation.
In addition, Kannan et al. systematically compared conventional hydrothermal carbonization, using a custom autoclave with resistive heating, and microwave-assisted hydrothermal carbonization, using a high-pressure microwave digestion module. The two methods produced hydrochars of comparable quality at equivalent temperatures and times for both fish waste [9,34] and shrimp waste [33,34]. Microwave heating offers faster and more uniform energy deposition but is currently limited to laboratory scale. For example, another work on seaweed HTC confirms that similar results of 4 h conventional HTC can be obtained within one hour [27]. Conventional heating is more scalable and is the dominant approach in the broader hydrothermal carbonization literature [40,41].
The combination of the different process parameters produce comparable data: crustacean-derived feedstocks consistently outperform fish waste under comparable conditions—for instance, 37.8% versus 17.2% from shrimp and fish waste respectively at 240 °C, 7:1 W:B, and 360 min [54], and 37.8–68.3% versus 15.1–21.5% across a mixed crustacean and fish waste comparison at 200–240 °C [7]. This difference likely reflects the higher chitin content of crustacean shells, which is more thermochemically stable than the protein- and lipid-rich matrix of fish waste. Chitin and chitosan processed as isolated biopolymers further confirm this, yielding 50–90% hydrochar across the 150–250 °C range [26]. Enzymatic pretreatment at 150 °C produced modest but meaningful yields (28.7% for fish, 38.1% for shrimp [8]), with higher yields observed when the temperature was extended to 150–210 °C alongside longer residence times [34], reinforcing the combined role of thermal severity and pretreatment in driving hydrochar formation.
While hydrochar yield is the most frequently reported metric in Table 2, yield alone does not capture process performance. Hydrochar quality metrics, such as higher heating value (HHV), elemental carbon content, H/C and O/C atomic ratios, BET surface area, nitrogen retention, and functional group distribution, are equally critical determinants of end-use suitability and must be considered alongside yield when evaluating any feedstock-parameter combination. Section 3 addresses these quality dimensions systematically. This section focuses on yield trends, acknowledging that the yield-quality trade-off is the central optimization challenge for marine biowaste HTC.

3. Physicochemical Characterization of Marine Biowaste Hydrochars

3.1. Proximate Analysis

Proximate analysis reveals several consistent trends across the currently reported studies. Volatile matter decreases with increasing hydrothermal carbonization severity, while fixed carbon increases, consistent with progressive carbonization. For fish waste hydrochar produced by enzymatic conventional hydrothermal carbonization at 180 °C, a fuel ratio of approximately 1.04 and an energy efficiency factor of approximately 0.96 were reported [8]. For crustacean-derived hydrochars, ash content dominates the proximate analysis, with ash fractions of 30 to 70% on a dry basis common in non-deashed materials. After HCl deashing, the acid-treated shrimp waste intermediate showed markedly reduced ash at 6.08% and substantially higher volatile matter, facilitating KOH activation [41].
The high calcium carbonate content of crustacean waste creates a methodological challenge for cross-paper comparison. When elemental and proximate data are reported on a dry basis, high ash dilutes all other components, giving the misleading impression that crustacean hydrochars are carbon-poor relative to fish waste or algal hydrochars. From the current literature, non-deashed crustacean hydrochars consistently report dry-basis carbon contents of 24 to 40%, including the Siddhartha et al. species comparison (24 to 32%) and the Kannan et al. shrimp series (29 to 40%) [7,33,62]. Kaewtrakulchai et al., who applied HCl deashing prior to hydrothermal carbonization, produced hydrochars with 47.8% carbon on a dry basis—a value approaching the lower end of the fish waste range [7,41].
Acid demineralization and enzymatic hydrolysis both significantly improve downstream hydrochar quality through different mechanisms and at different costs. HCl deashing achieves an approximately 80% ash reduction [41], but introduces an acid consumption burden and generates calcium chloride waste streams. Enzymatic hydrolysis enables hydrothermal carbonization at 150 °C rather than above 180 °C, but requires enzyme supplies and 16 h of reaction time. Neither approach has been subjected to formal techno-economic analysis in the marine biowaste hydrothermal carbonization context. Integration of hydrothermal carbonization downstream of existing chitin extraction operations, where acid demineralization and deproteinization steps are already employed, represents a compelling but unexplored opportunity that could substantially reduce operational costs.

3.2. Elemental Composition and Degree of Carbonization

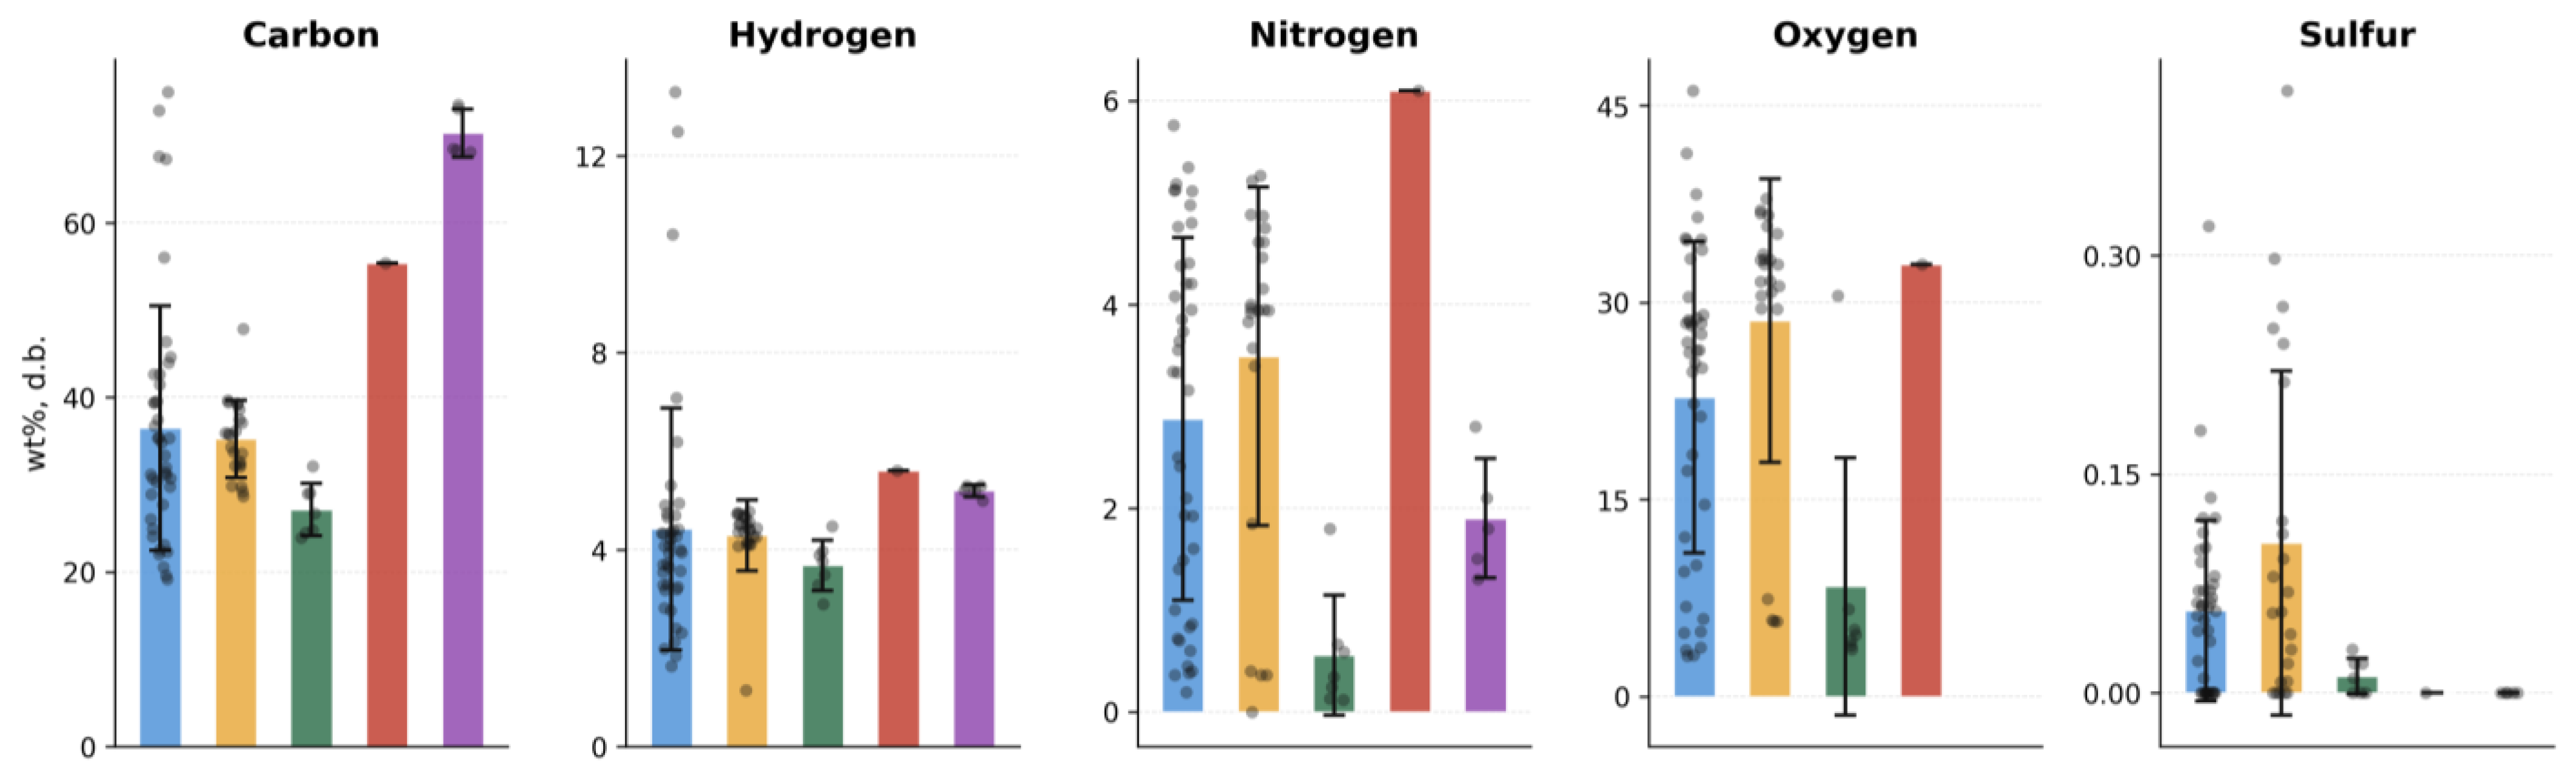
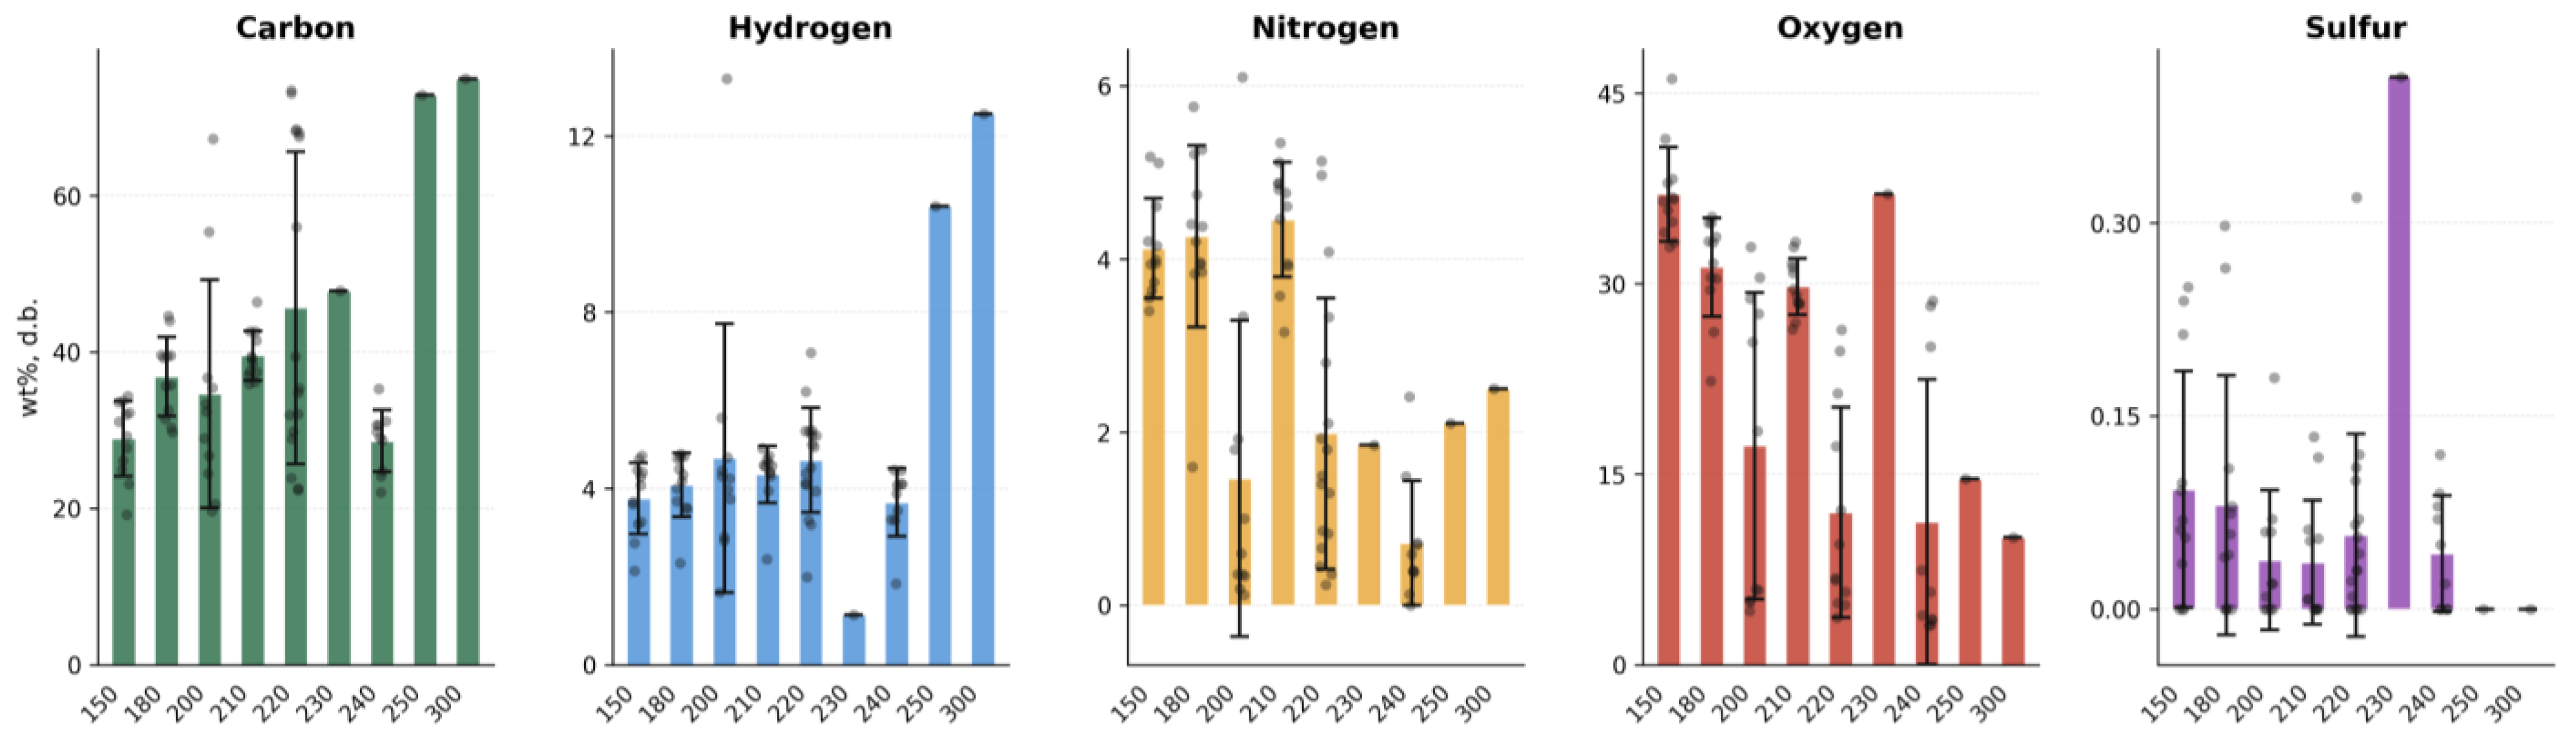
Figure 3 and Figure 4 compile CHNOS profiles of recently published studies, organized by individual reference and by feedstock category respectively. Together, they reveal three consistent patterns: progressive carbon enrichment with increasing HTC severity, suppression of oxygen and hydrogen relative to the raw feedstock, and a persistently elevated nitrogen signature that is unique to marine-derived hydrochars and has no counterpart in lignocellulosic or agricultural waste systems.
A methodological note is needed before comparing results across different feedstocks in this section. Fish waste, crustacean shells, chitin/chitosan isolates, and algae have very different biochemical compositions and mineral contents. Fish waste is rich in protein and lipids with relatively little mineral matter; crustacean shells contain large amounts of calcium carbonate that dilute any organic material therein; isolated chitin and chitosan are purified polymers that lack the complexity of raw waste; and algae contain sulfated polysaccharides not found in animal-derived feedstocks. Differences exist even within marine animal feedstocks: Siddhartha et al. (2024) showed that fish waste and shrimp waste produce different hydrochar yield trends under the same HTC conditions, and this yield difference likely signals further differences in product characteristics such as elemental composition and surface chemistry [7]. For these reasons, trends found in one feedstock class should not be assumed to apply to others, and combining data across classes can hide rather than reveal meaningful patterns. Where possible, feedstock-specific trends are discussed separately, and cross-class comparisons are made only when a shared driver such as temperature or demineralization can be clearly identified.
Carbon content across the reported studies approximately spans 20 to 75 wt% on a dry basis (Figure 3), with fish waste hydrochars occupying the upper portion of this range and crustacean-derived materials the lower portion [7,8,41,57,58,59]. The relatively low carbon values for crustacean hydrochars are not a reflection of poor carbonization but rather of high residual ash diluting the organic fraction [41,59]. It is also worth highlighting that in crustacean waste and derived carbon, there is a significant portion of inorganic carbon in the form of carbonate-C [63]. When grouped by feedstock category (Figure 4), the distinction between fish waste, shrimp and crustacean waste, chitin and chitosan, and crab shell is stark: fish waste hydrochars are systematically carbon-enriched, while chitosan-derived carbons show the widest within-group spread, reflecting the sensitivity of this biopolymer to both temperature and residence time [59]. Hydrogen content decreases predictably across all feedstock classes as aromatic condensation proceeds, while sulfur remains below approximately 1 wt% throughout [8,41,57].
Nitrogen content is the most diagnostically significant elemental feature of marine biowaste hydrochars, and its behavior during HTC is central to understanding both the value and the limitations of these materials. Fish waste hydrochars carry 1 to 6 wt% nitrogen on a dry basis, inherited from the protein-rich muscle tissue of the raw feedstock [8,57,58]. Crustacean hydrochars show a wider range, from below 1 wt% in heavily demineralized or chitin-dominated samples to above 5 wt% in shrimp waste processed without pretreatment (Figure 4). This nitrogen is predominantly retained in heterocyclic aromatic structures formed by Maillard-type condensation of amino acids and reducing sugars during hydrothermal treatment, making it resistant to leaching under ambient conditions but potentially available as a slow-release nitrogen source in soil applications. The oxygen content, by contrast, decreases monotonically with temperature across all feedstock classes, reflecting progressive dehydration and decarboxylation reactions that remove hydroxyl and carboxyl groups from the hydrochar surface [64].
The high nitrogen content of marine biowaste hydrochars has both benefits and drawbacks; however, this trade-off has rarely been discussed critically in the literature. On the positive side, the thermally stable nitrogen forms found in hydrochar (pyrrolic-N and pyridinic-N) create surface sites that improve adsorption of certain pollutants and can be compared to their performance with nitrogen-free commercial activated carbons for targeted applications [54]. For soil use, the nitrogen in hydrochar is tightly bound in ring structures, which may reduce leaching compared to mineral fertilizers and allow slower, more sustained nutrient release [64]. On the negative side, burning nitrogen-rich hydrochar produces substantially more NOX: fish waste hydrochar typically contains 3 to 6 wt% nitrogen, well above the level where fuel-bound nitrogen conversion to NOX becomes a serious problem under normal combustion conditions. Direct use as a solid fuel is therefore questionable without flue gas treatment [65,66]. For material applications such as electrode carbons or catalyst supports, high nitrogen can be either beneficial, improving electronic conductivity through n-type doping, or problematic, depending on which nitrogen forms are present [67]. Any practical assessment of marine biowaste hydrochar must weigh these advantages and limitations together rather than treating high nitrogen content as straightforwardly good or bad.
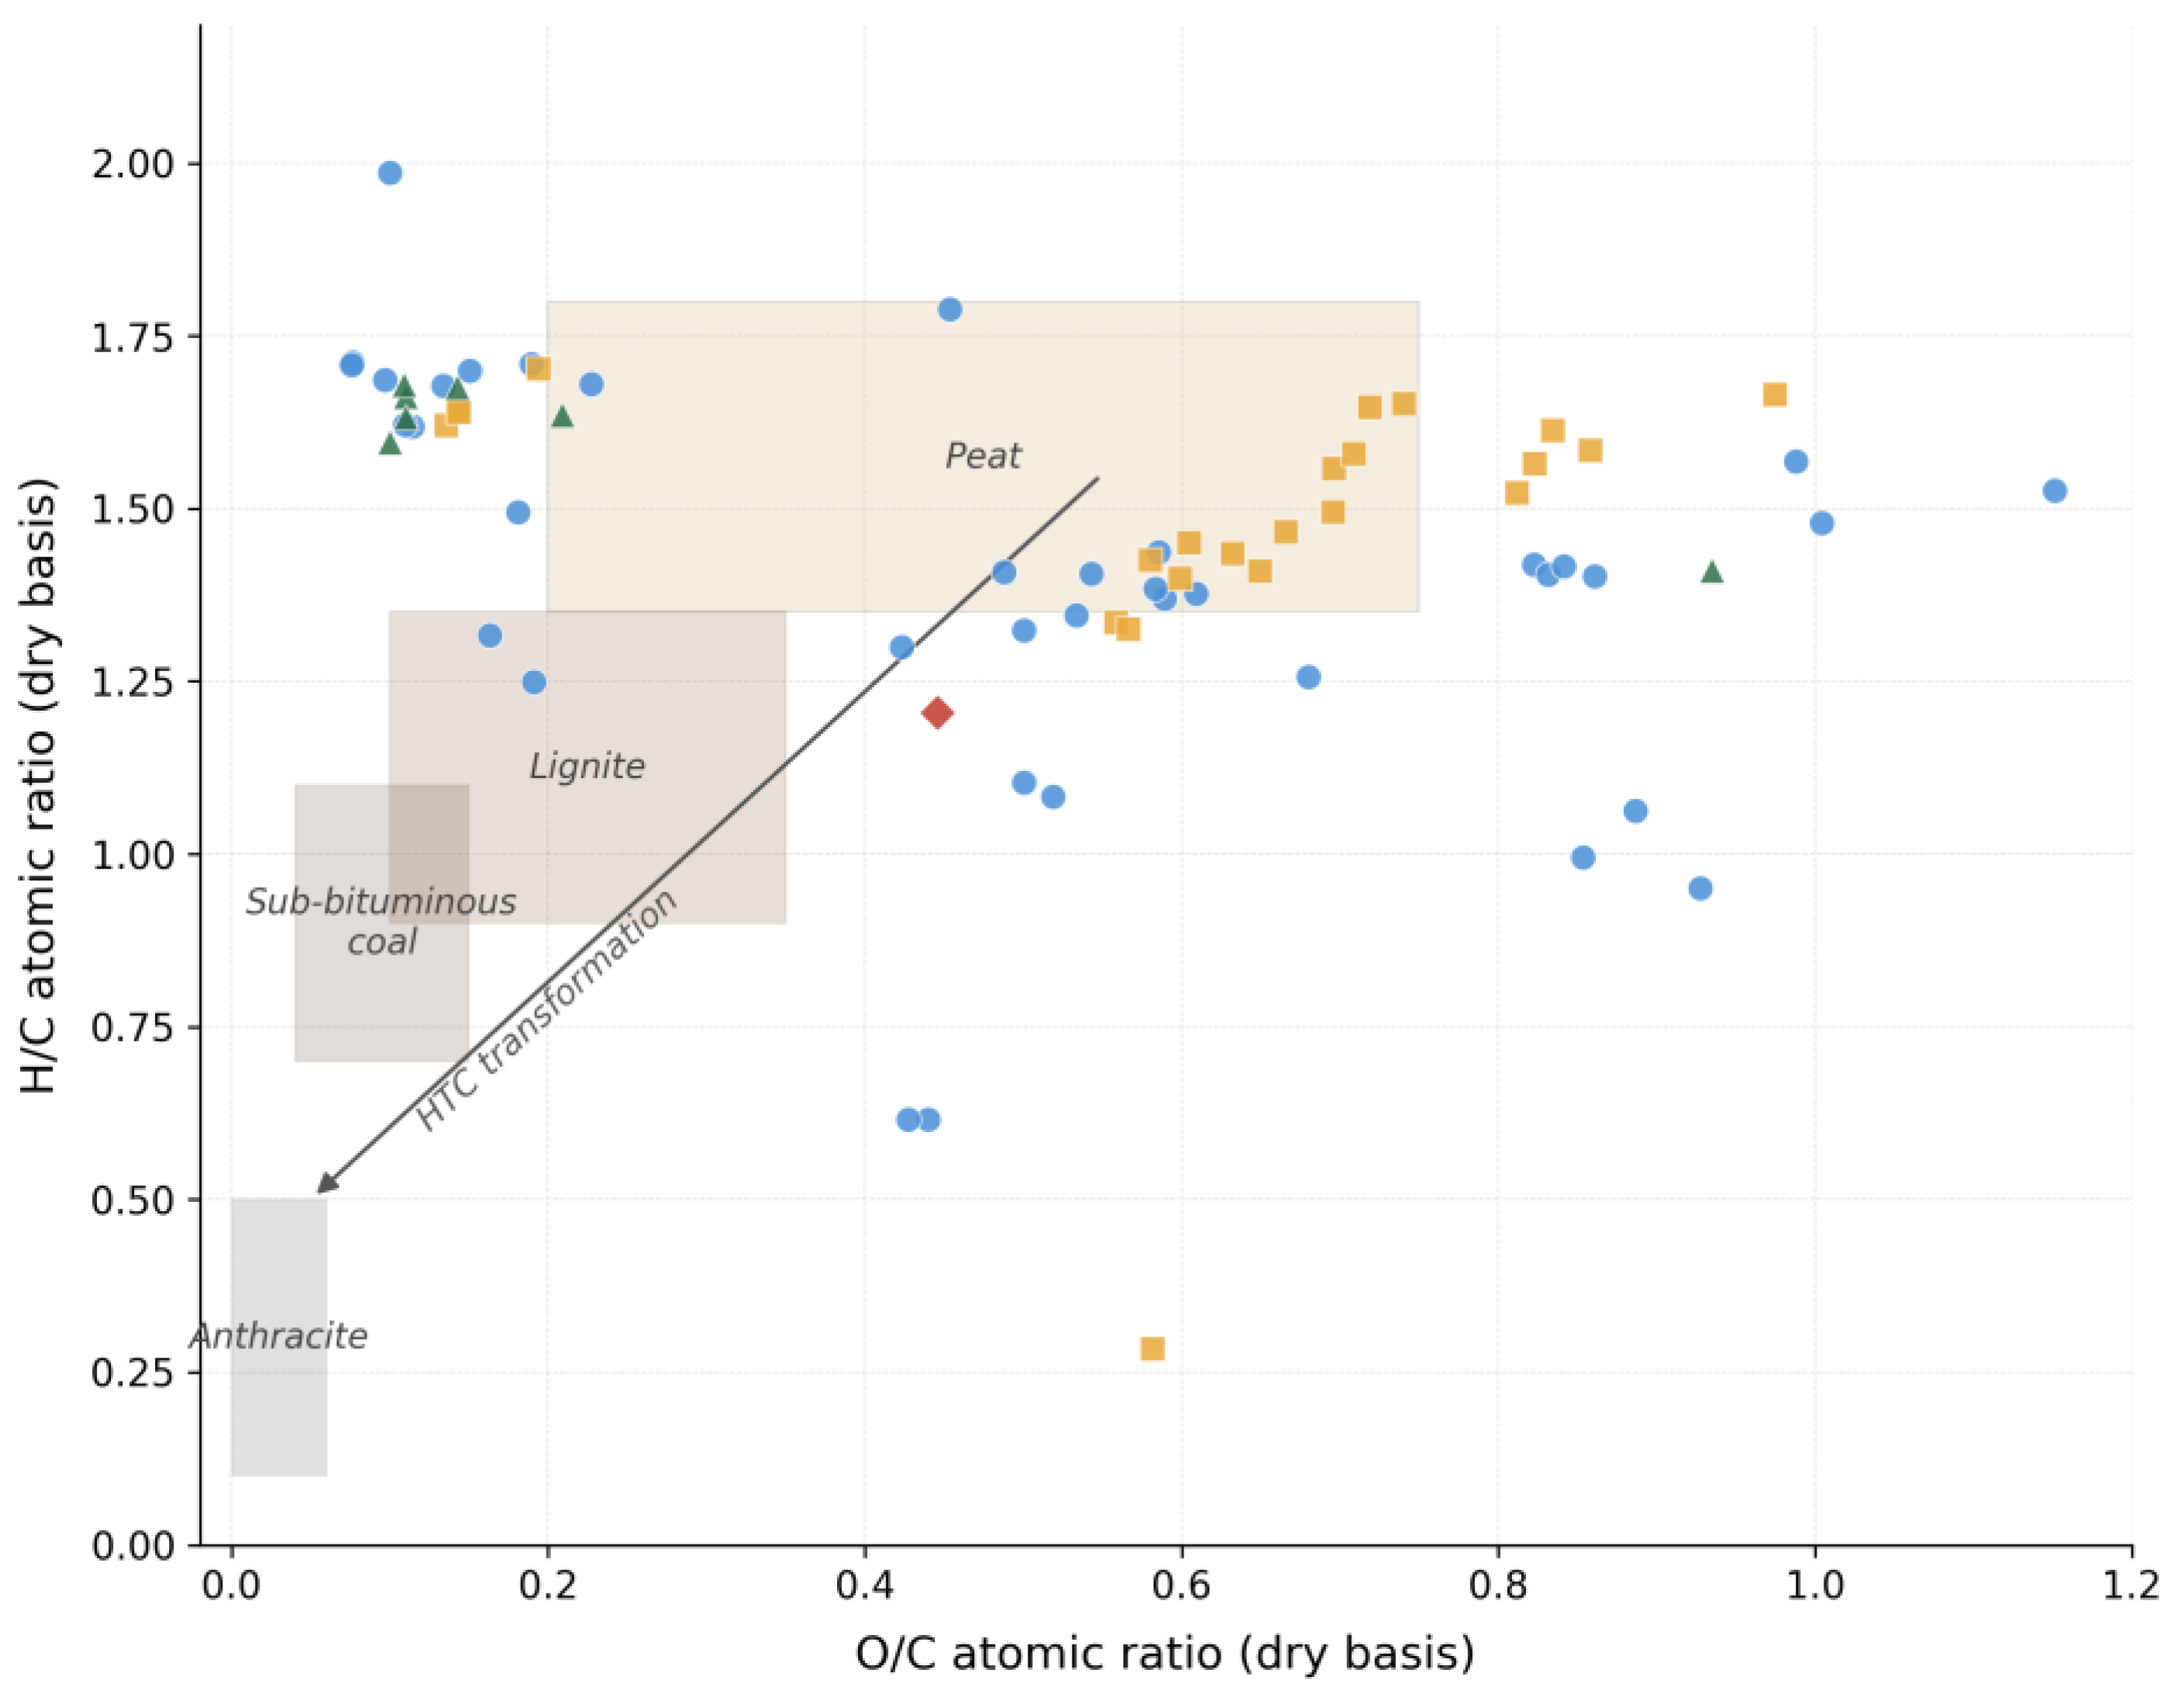
The Van Krevelen diagram (Figure 5) translates these elemental shifts into a visual map of the degree of carbonization. Raw marine biowaste feedstocks cluster in a region of high atomic H/C (1.8 to 2.1) and moderate to high O/C (0.3 to 1.0), consistent with protein- and polysaccharide-rich biomass [8,20,41,54,57,59]. Hydrothermal carbonization moves samples along a trajectory of decreasing H/C and O/C, converging toward the lignite and sub-bituminous coal region of the diagram [20,30]. Fish waste hydrochars tend to migrate further along this trajectory than crustacean materials processed under identical conditions, reflecting the greater lability of protein and lipid relative to chitin during hydrothermal treatment [40,68]. Raw feedstock squares are consistently displaced toward the upper-right of the diagram relative to their hydrochar counterparts, and the spread of individual data points confirms that temperature is the primary driver of position along the HTC vector, with residence time and water-to-biomass ratio producing secondary shifts.

3.3. Surface Area and Chemistry

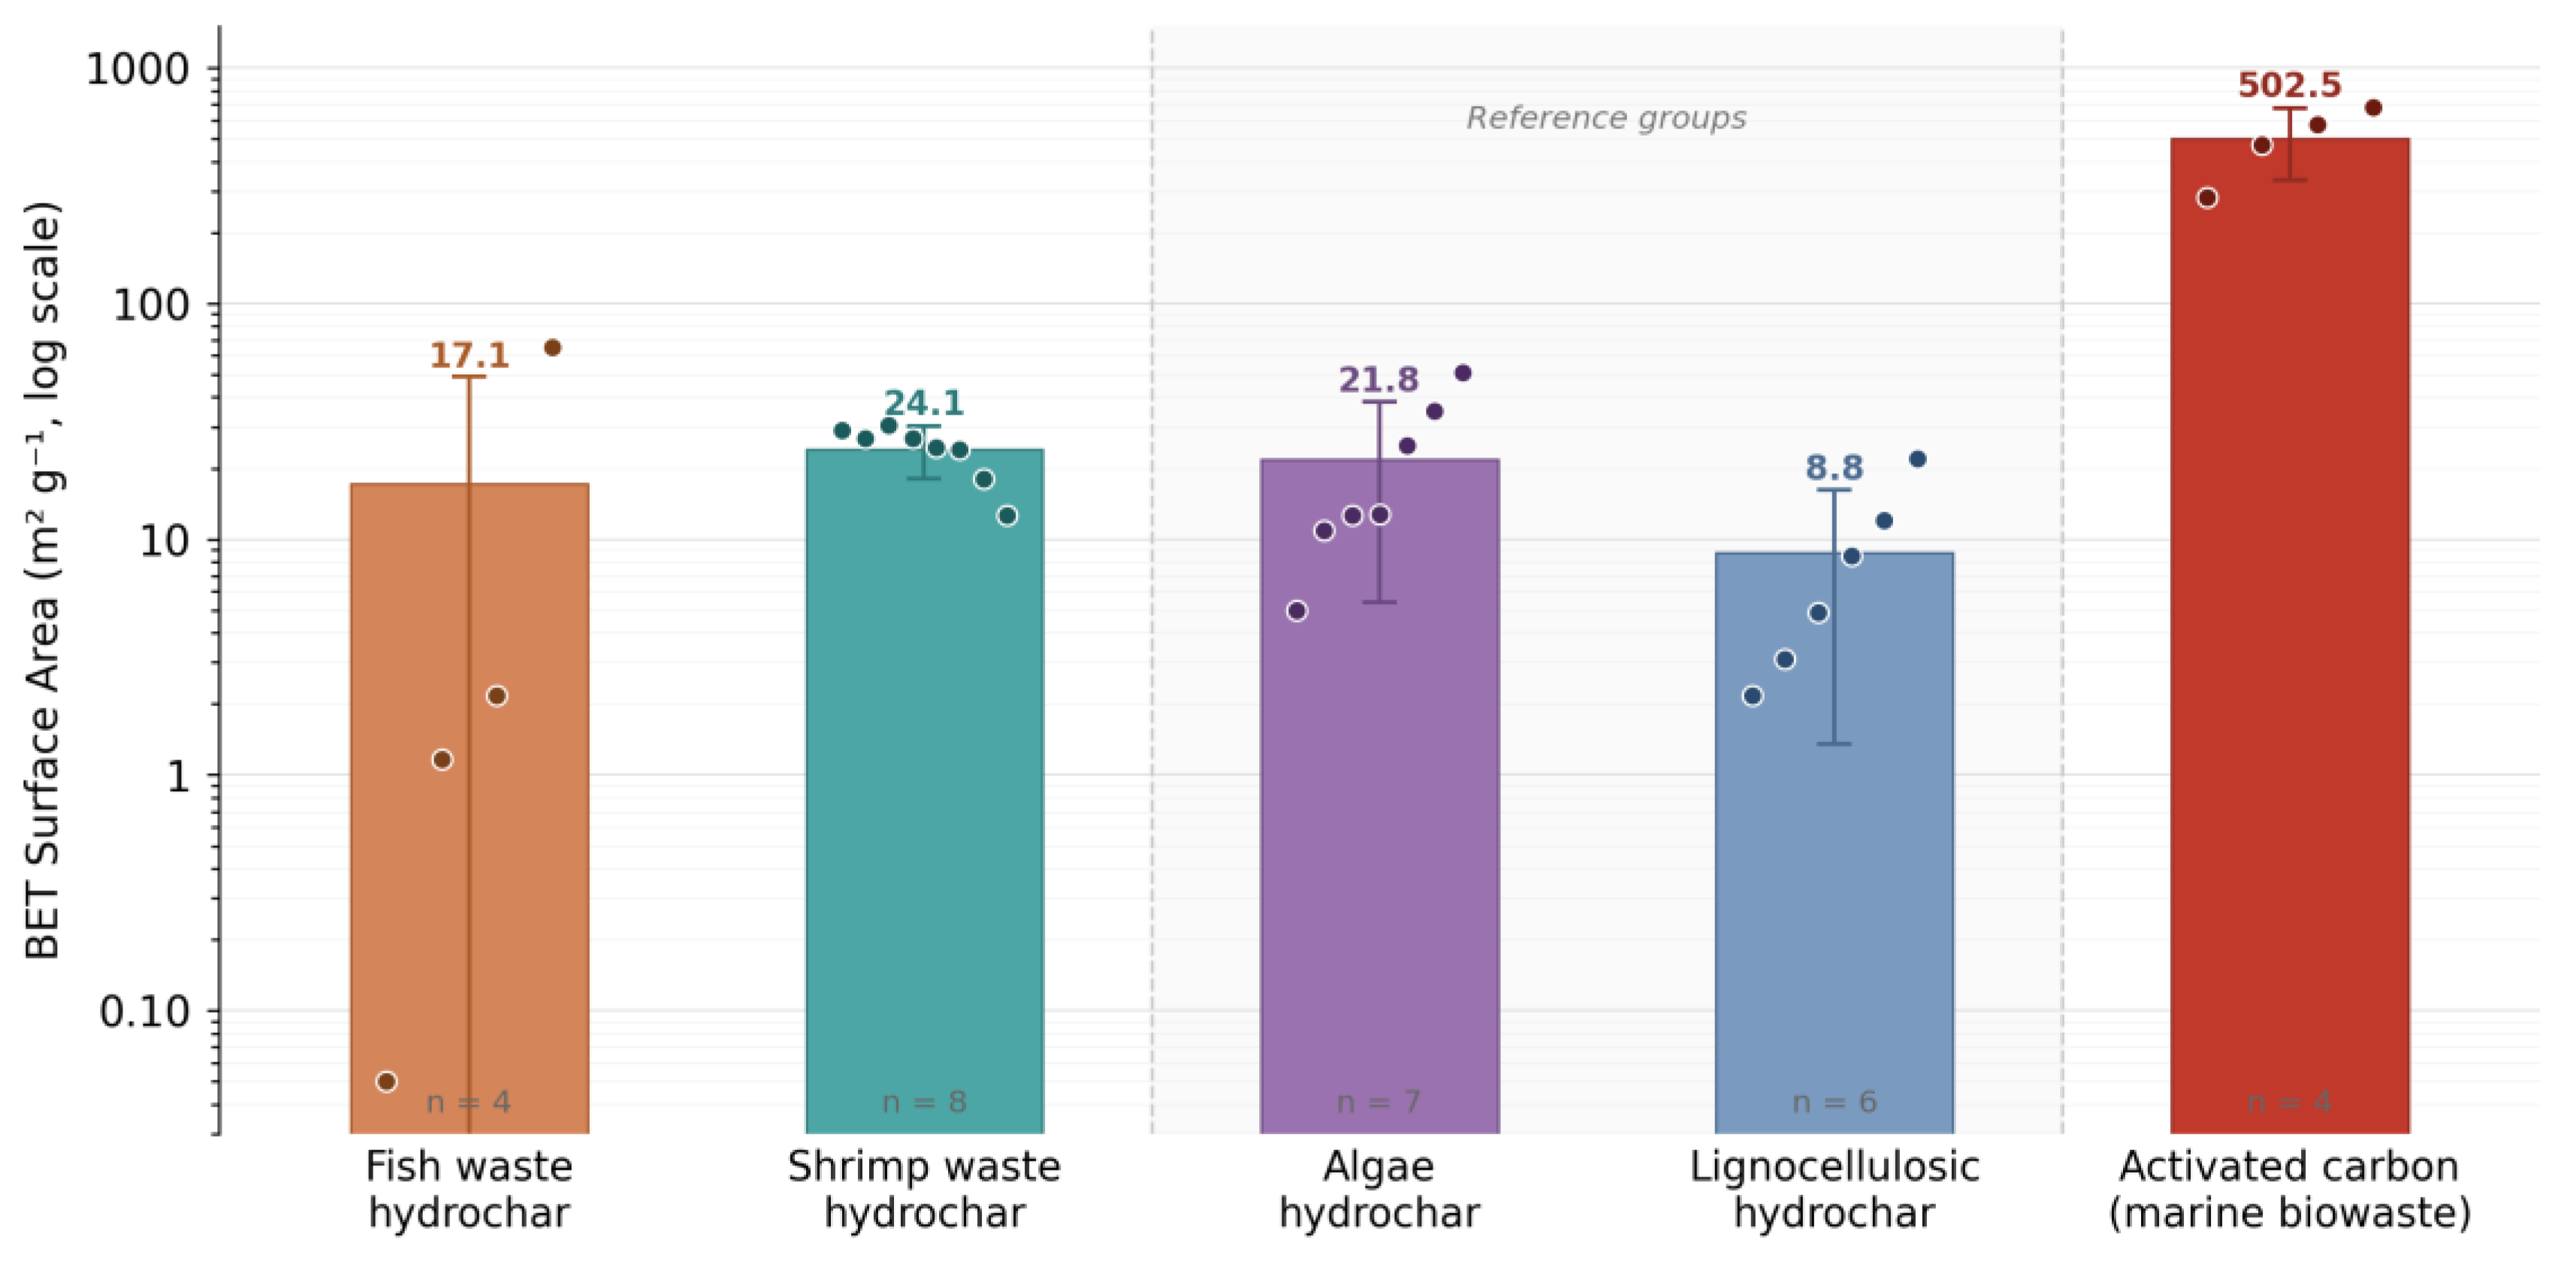
Surface area data compiled in Figure 6 show that inactivated marine biowaste hydrochars occupy a low to moderate BET range, significantly lower compared to KOH activation, which produces a step change that brings these carbons into commercially relevant territory. These values are also definitely lower compared to carbon materials produced from severely higher temperatures, such as biochar from pyrolysis or activated carbon.
Fish waste hydrochars are the most variable group, ranging from below 1 m2 g−1 to 65 m2 g−1 [7,57]. At lower carbonization temperatures, protein- and lipid-rich fish residues yield dense, poorly porous chars [57]; more developed surface textures emerge only under optimized conditions [7,54]. Shrimp and crustacean hydrochars are more consistent, clustering between 13 and 30 m2 g−1 with a mean near 22 m2 g−1 [41,55,59]. The tighter spread likely reflects the structural role of the chitin scaffold, which supports a reproducible porous architecture during hydrothermal treatment regardless of minor process variations.
Against the reference groups, marine animal waste hydrochars compare favorably. Algal hydrochars span a similar window—approximately 5 to 52 m2 g−1 across micro- and macroalgal feedstocks [27,69]—and the lignocellulosic benchmark (2 to 22 m2 g−1 for coconut shell and oak) [23,24] is not systematically higher. High ash content, often cited as a drawback of crustacean-derived carbons, does not appear to suppress surface development relative to conventional biomass.
The clearest result in Figure 6 is the effect of KOH activation. Applied at concentrations between 1 and 7 wt% to shrimp waste hydrochar, KOH raises the BET surface area from 29 m2 g−1 to a peak of 679 m2 g−1 at 5 wt%, before pore collapse reverses the trend at higher loading [41]. The 23-fold gain positions the activated carbon within the range of many commercial adsorbents. The non-monotonic concentration–surface area relationship is practically important: over-activation causes structural degradation rather than further pore development, and the optimal KOH dosage must be identified empirically for each precursor. However, several important caveats limit how broadly these findings can be applied. First, all KOH activation results come from a single study on shrimp waste hydrochar [41]. No equivalent data exist for fish waste, crab shell, or chitin-derived precursors, so it is unknown whether the 23-fold surface area increase is achievable for other marine biowaste materials with different compositions. Second, KOH activation is costly and resource-intensive, and these aspects have not been assessed in the marine biowaste context. KOH use at 5 wt% loading represents significant reagent cost at scale; activation requires temperatures near 700 °C, far above HTC conditions; spent KOH must be neutralized, generating potassium salt waste; and wastewater from impregnation and washing steps requires treatment [70,71]. Whether the resulting activated carbon justifies this added process complexity, compared to commercial activated carbon from established routes, remains an open question that the current literature cannot answer. However, what Figure 6 ultimately shows is that the surface area ceiling for marine biowaste carbons is set not by the feedstock but by whether activation is applied and, when it is, the performance gap with engineered materials is quite promising.
The FTIR spectra of marine biowaste hydrochars carry a distinctive multi-layered chemistry that sets them apart from terrestrial feedstocks as summarized in Table 3. The broad 3200–3600 cm−1 envelope reflects overlapping O–H and N–H stretching from hydroxyl and protein-derived amine groups, while paired aliphatic C–H bands at ~2920 and ~2850 cm−1 confirm lipid and protein residues from the raw feedstock [8]. The carbonyl and nitrogen region (1500–1740 cm−1) is the most diagnostic: amide I (~1651–1695 cm−1) and amide II (~1507–1572 cm−1) bands persist across all HTC temperatures, signaling that protein nitrogen is not simply preserved but reorganized into thermally stable heterocyclic aromatic structures during hydrothermal treatment [58,59]. The 1020–1160 cm−1 region carries superimposed C–O polysaccharide, C–O–C chitin ether, and C–N pyridinic contributions, while crustacean-derived hydrochars additionally display carbonate bands at ~1415, ~875, and below 600 cm−1—a diagnostic CaCO3 signature from the shell mineral fraction absent in fish waste hydrochars [41].
Algal hydrochars share the broad O–H envelope and aliphatic C–H region with marine animal waste materials, but diverge in two key areas. First, macroalgae such as Sargassum and Ulva produce hydrochars with prominent sulfonate S=O bands near 1200–1250 cm−1 arising from sulfated polysaccharides (fucoidan, ulvan)—a band essentially absent in fish and crustacean systems [27]. Second, the polysaccharide fingerprint region (1000–1200 cm−1) is broader and more intense in algal hydrochars, reflecting alginate and fucoidan backbones rather than chitin, while the amide I/II signature is weaker or absent in macroalgal materials (which are protein-poor) but recovers in protein-rich microalgal feedstocks. The CaCO3 bands that mark crustacean hydrochars do not appear in algal spectra unless the feedstock was calcified (e.g., coralline algae). Overall, the nitrogen-band intensity of fish and crustacean hydrochars versus the sulfonate and polyuronate character of macroalgal hydrochars provides a reliable spectroscopic basis for distinguishing feedstock origin without elemental analysis.

4. Post-Treatment and Application

4.1. Post-Treatment

As shown previously, hydrochars produced directly from HTC typically have a low surface area and complex surface chemistry. Post-synthesis activation is therefore applied by some authors to develop porosity in the hydrochar precursor, extending its functional range without departing from the marine biowaste feedstock system. Among the primary studies, chemical activation with KOH is the only approach reported. Kaewtrakulchai et al. impregnated shrimp waste hydrochar with KOH at concentrations of 1, 3, 5, and 7 wt% prior to high-temperature thermal treatment, achieving BET surface areas between approximately 150 and 679 m2 g−1 depending on KOH loading, with a peak at 5 wt% KOH [41]. No physical activation (steam or CO2) study targeting marine biowaste hydrochar was identified in the studies.
The characteristically high ash content of marine biowaste hydrochars—particularly crustacean-derived materials where mineral fractions can exceed 40 wt%—would substantially dilute the carbon phase available for gasification-driven pore development, likely yielding modest surface areas unless prior demineralization is applied [78]. Physical activation is therefore probably not well-suited to marine biowaste hydrochar without pretreatment, and a systematic evaluation remains an open research question.
Like pretreatment, literature is also currently lacking in further analysis of life cycle and techno-economic assessment to assess the viability of each post-treatment. For example, activating hydrochars might be a promising way to ensure better product quality. However, its additional cost should be higher, even by only considering the temperature used between HTC and post-activation.

4.2. Adsorption as Main Application

Several authors employed adsorption performance as a practical applicability test for their hydrochars, using pollutant removal as a proxy for surface functionality and site availability rather than as a primary research objective.
Across all feedstock–pollutant combinations reported in Table 4, the Langmuir isotherm provides the best description of equilibrium data, with R2 values of 0.929–0.993 for the chitosan and shrimp waste systems, indicating monolayer adsorption on a surface with energetically homogeneous sites. Maximum monolayer adsorption capacities (qm) span 21.7 to 73.0 mg g−1, with shrimp waste hydrochar showing the highest capacity for tetracycline (73.0 mg g−1) and chitosan-derived hydrochar performing comparably for clorfibric acid (66.8 mg g−1) and ibuprofen (61.1 mg g−1) [40,41,54]. Fish waste hydrochar recorded a substantially lower qm for tetracycline (21.7 mg g−1), likely reflecting its lower BET surface area relative to the shrimp waste counterpart processed under identical HTC conditions [54]. Lin et al. reported negative values for qm, which is physically not possible and is likely an artifact of kinetic model fitting [40]. The Freundlich 1/n values are consistently below 1 across all systems, confirming favorable and heterogeneous adsorption; notably, fish and shrimp waste hydrochars yield lower 1/n values (0.28–0.33) than chitosan-derived materials (0.79–0.80), suggesting a more energetically heterogeneous pore structure, consistent with the more complex mineral-organic matrix of the whole-waste feedstocks. The Temkin model fits the chitosan systems well (R2 = 0.977–0.982), but was not reported for fish and shrimp waste, limiting cross-system comparison of adsorption energy parameters.
The kinetic data in Table 5 show that pseudo-second-order (PSO) kinetics consistently outperforms pseudo-first-order (PFO) in describing adsorption across virtually all feedstock–pollutant pairs, with PSO R2 values of 0.995–0.9996 for the majority of systems [40,41,54,62]. This suggests that chemisorption is the rate-controlling mechanism rather than simple physical diffusion. The calculated PSO equilibrium capacities (qe) are in reasonable agreement with experimental values across most systems, reinforcing model validity. However, several notable exceptions warrant caution: the PSO fit for methylene blue on both fish and shrimp waste hydrochar yielded anomalous negative qe values and R2 as low as 0.127–0.414, indicating that the PSO model does not describe this system adequately and that a different mechanism—possibly pore diffusion or multilayer adsorption—may govern methylene blue uptake [54]. Similarly, doxycycline hyclate on shrimp waste returned a poor PSO fit (R2 = 0.603), suggesting system-specific adsorption behavior that warrants further investigation. Across the antibiotics and pharmaceutical micropollutants, where models fit well, shrimp waste hydrochar consistently shows higher PSO qe values than fish waste under identical conditions, again pointing to feedstock-dependent differences in surface area and available adsorption sites rather than differences in mechanism.
Another perspective on adsorption performance is offered by a study integrating FTIR, XPS, BET, and DFT analysis on fish and shrimp hydrochars [54]. Despite low BET surface areas, surface-area-normalized molar uptake reveals that shrimp hydrochar achieves up to 547 nmol m−2 for tetracycline against 20 nmol m−2 for commercial activated carbon—a 27-fold efficiency advantage obscured by conventional mg g−1 reporting. XPS confirms that hydroxyl, carbonyl, and carboxyl surface groups are the active binding sites, and their total concentration increases with temperature following an Arrhenius-type expression, producing endothermic adsorption thermodynamics that classical isotherm models do not capture without explicitly accounting for thermally activated site availability [54]. DFT descriptors further reveal that tetracycline and doxycycline interact primarily through hydrogen bonding with oxygenated surface sites, while dyes such as methylene blue rely on π–π stacking—consistent with the anomalous PSO behavior noted above. These findings collectively suggest that the adsorption performance of marine biowaste hydrochars is governed by the chemical nature and thermal accessibility of surface active sites rather than total porosity, and that mass-based capacity metrics systematically underestimate their functional value.
Collectively, the adsorption evidence across primary studies positions marine biowaste hydrochars as credible low-cost adsorbents for a broad spectrum of aquatic pollutants. Their competitive performance derives not from high surface area but from the chemical richness of their surfaces. Although absolute capacities do not match chemically activated carbons, production from abundant waste streams under mild hydrothermal conditions without additional reagents or high-temperature activation makes these materials practically and economically attractive as sustainable alternatives in wastewater treatment applications.

4.3. Emerging Applications

Beyond adsorption, the literature documents a growing range of applications for marine biowaste-derived carbonaceous materials. Several studies in the Kannan series position marine biowaste hydrochar as a solid fuel, reporting higher heating values and fuel quality metrics comparable to low-rank coals [8,9,33,34]. Chen et al. synthesized nitrogen-doped hydrochars from shrimp waste and glucose via one-pot hydrothermal carbonization, leveraging the inherent nitrogen content of chitin to confer visible-light photocatalytic activity; materials with BET surface areas up to 30.5 m2/g achieved 88.9% methylene blue degradation in one hour under visible light, a 2.3-fold improvement over glucose-only hydrochar [59], nitrogen-doped shrimp waste hydrochars, and photocatalysis. Gopika et al. demonstrated the synthesis of nanocarbon dots from tuna fish skin waste via hydrothermal synthesis and achieved corrosion inhibition activity [79]. Sagar and Lynam evaluated hydrothermal carbonization-enriched shrimp and crab shell waste as sprayable fertilizer and carbon-fixing pellets [80], while Kingkhambang et al. extended the scope of marine biowaste processing to mixed biomass and plastic waste co-hydrothermal carbonization [58].

5. Conclusions

The following conclusions can be drawn from this review. Firstly, the biochemical identity of the feedstock is the primary determinant of hydrochar character: the protein and chitin matrix of marine animal waste drives Maillard-type nitrogen incorporation into thermally stable heterocyclic structures, producing inherently nitrogen-rich hydrochars with surface chemistry that has no equivalent in lignocellulosic systems, while the calcium carbonate burden of crustacean feedstocks simultaneously dilutes carbon content and constrains surface area development on a dry basis. Secondly, temperature is the dominant process variable across all marine biowaste feedstocks, with the 180 to 220 °C range governing the critical transition from hydrolysis to condensation and aromatization; residence time and water-to-biomass ratio exert secondary and largely feedstock-dependent effects that do not justify complex optimization in isolation. Thirdly, pretreatment is not optional for crustacean feedstocks: acid demineralization is a prerequisite for meaningful surface area development, as undeashed crustacean hydrochars consistently yield BET surface areas below 30 m2/g regardless of HTC conditions, while enzymatic hydrolysis offers complementary benefits for protein-rich fish waste by improving feedstock uniformity and HTC conversion efficiency. Fourthly, KOH chemical activation is currently the only post-treatment strategy with demonstrated effectiveness for marine biowaste hydrochar, producing order-of-magnitude improvements in BET surface area and confirmed adsorption capacity across pharmaceuticals, dyes, and heavy metals; molar-normalized analysis further reveals that the nitrogen-rich surface chemistry of marine hydrochars provides functional advantages over conventional activated carbon that mass-based metrics systematically conceal.
Regarding HTC of marine waste, there are still quite a few open questions to be answered. For example, no attempt has been made to conduct a techno-economic or life-cycle assessment of any marine biowaste HTC pathway, which is a significant omission given how complex the optimal preparation route is turning out to be. A proper cost analysis on pre- and post-treatment is also needed to ensure that HTC can still be utilized as a cost-efficient waste valorization method. Secondly, physical activation by steam or CO2 has not been tried on any of these hydrochars, and the high ash content suggests that demineralization would need to come first—but that experiment has not been done. Thirdly, every study in the currently reported literature was carried out at bench scale, so nothing is known about how marine biowaste behaves in a continuous or pilot-scale HTC system. Fourthly, the process water, which carries majorly nitrogen compounds, fatty acids, and dissolved organics from the feedstock, has been largely ignored as a resource stream despite representing a potentially valuable co-product. These are not minor gaps at the edges of the field—several of them sit directly in the path of any realistic scale-up effort.
Several gaps identified in this review point to clear priorities for future work. The most urgent need is a formal techno-economic and life-cycle analysis of the HTC from its pretreatment and main reaction until the activation pathway. Without cost and environmental impact data, comparison with competing valorization routes is not possible, and scale-up decisions remain poorly grounded. Secondly, activation chemistry also needs to move beyond the single shrimp waste–KOH system currently reported, with physical activation by steam or CO2, alternative chemical agents such as ZnCl2 or H3PO4, and other precursors including fish waste and crab shell yet to be explored. Since all primary studies in this review were conducted at the bench scale using batch autoclaves, a third point of attention is the need to perform and investigate scale-up to continuous or semi-continuous reactor configurations, including process water recirculation and heat integration, which has not been explored for any marine biowaste feedstock. Fourthly, the process water, which carries dissolved organic nitrogen, ammonia, and volatile fatty acids, has been largely overlooked despite representing a nutrient and organic load that must be managed regardless of how the solid hydrochar is used.

Author Contributions

Conceptualization, T.R.S. and P.M.H.; methodology, T.R.S.; formal analysis, T.R.S.; data curation, T.R.S.; writing—original draft preparation, T.R.S.; writing—review and editing, P.M.H. and F.R.; review and editing, P.M.H. and F.R.; project administration, P.M.H.; funding acquisition, P.M.H. All authors have read and agreed to the published version of the manuscript.

Funding

This research was funded by the Ghent University BOF Grant (BOF22/DOC/191) and the National Research Foundation (NRF) of Korea (Grant No: 2022K1A3A1A78091315).

Data Availability Statement

No new data were created or analyzed in this study.

Acknowledgments

The authors would like to thank the reviewers and the Editor for their constructive remarks. During the preparation of this review, the authors used Claude (version 1.15962.0, Sonnet 4.6) and NotebookLM (https://notebooklm.google.com/, accessed in April—May 2026) for the purposes of data analysis. The authors have reviewed and edited the output and take full responsibility for the content of this publication.

Conflicts of Interest

The authors declare no conflicts of interest.

Abbreviations and Acronyms

The following abbreviations and acronyms are used in this manuscript:
ACActivated carbon
BETBrunauer–Emmett–Teller (surface area analysis)
CHNSOCarbon, hydrogen, nitrogen, sulfur, oxygen (elemental analysis)
CRCrab shell
CSChitosan
CTChitin
d.a.f.Dry-ash-free basis
d.b.Dry basis
DFTDensity functional theory
FCFixed carbon
FTIRFourier-transform infrared spectroscopy
HClHydrochloric acid
HHVHigher heating value
HMFHydroxymethylfurfural
HTCHydrothermal carbonization
KOHPotassium hydroxide
MARPOLInternational Convention for the Prevention of Pollution from Ships
NDHCNitrogen-doped hydrochar
NRNot reported
OTCOxytetracycline
PETPolyethylene terephthalate
PFOPseudo-first-order (kinetic model)
pHpzcpH at the point of zero charge
PSOPseudo-second-order (kinetic model)
SSASpecific surface area
TOCTotal organic carbon
VMVolatile matter
XPSX-ray photoelectron spectroscopy
WoSWeb of Science

References

  1. Olsen, R.L.; Toppe, J.; Karunasagar, I. Challenges and realistic opportunities in the use of by-products from processing of fish and shellfish. Trends Food Sci. Technol. 2014, 36, 144–151. [Google Scholar] [CrossRef]
  2. Rustad, T.; Storrø, I.; Slizyte, R. Possibilities for the utilisation of marine by-products. Int. J. Food Sci. Technol. 2011, 46, 2001–2014. [Google Scholar] [CrossRef]
  3. The State of World Fisheries and Aquaculture 2024; FAO: Rome, Italy, 2024.
  4. Yan, N.; Chen, X. Sustainability: Don’t waste seafood waste. Nature 2015, 524, 155–157. [Google Scholar] [CrossRef] [PubMed]
  5. The Production of Fish Meal and Oil—3. The Process. Available online: https://www.fao.org/4/x6899e/x6899e04.htm (accessed on 12 May 2026).
  6. Update on Global Fishmeal and Fish Oil Production Trends|IFFO—The Marine Ingredients Organisation. Available online: https://www.iffo.com/update-global-fishmeal-and-fish-oil-production-trends (accessed on 12 May 2026).
  7. Siddhartha, T.R.; Kooy, E.; Kashif, M.; Che, C.A.; Ghysels, S.; Wu, D.; Ronsse, F.; Heynderickx, P.M. Evaluation of South Korean marine waste resources for hydrochar production: Effect of process variables. Bioresour. Technol. 2024, 410, 131286. [Google Scholar] [CrossRef] [PubMed]
  8. Kannan, S.; Gariepy, Y.; Raghavan, V. Optimization of Enzyme Hydrolysis of Seafood Waste for Microwave Hydrothermal Carbonization. Energy Fuels 2015, 29, 8006–8016. [Google Scholar] [CrossRef]
  9. Kannan, S.; Gariepy, Y.; Raghavan, G.S.V. Optimization and characterization of hydrochar produced from microwave hydrothermal carbonization of fish waste. Waste Manag. 2017, 65, 159–168. [Google Scholar] [CrossRef] [PubMed]
  10. Hilmarsdóttir, G.S.; Ögmundarson, Ó.; Arason, S.; Gudjónsdóttir, M. Identification of environmental hotspots in fishmeal and fish oil production towards the optimization of energy-related processes. J. Clean. Prod. 2022, 343, 130880. [Google Scholar] [CrossRef]
  11. Makkar, H.P.S.; Tran, G.; Heuzé, V.; Ankers, P. State-of-the-art on use of insects as animal feed. Anim. Feed Sci. Technol. 2014, 197, 1–33. [Google Scholar] [CrossRef]
  12. Jacobs, M.; Santillo, D.; Johnston, P.; Wyatt, C.; French, M. Organochlorine residues in fish oil dietary supplements: Comparison with industrial grade oils. Chemosphere 1998, 37, 1709–1721. [Google Scholar] [CrossRef] [PubMed]
  13. Murugan, G.; Ahilan, K.; Prakasam, V.P.A.; Malreddy, J.; Benjakul, S.; Nagarajan, M. Fish Waste Composition and Classification. In Fish Waste to Valuable Products; Maqsood, S., Naseer, M.N., Benjakul, S., Zaidi, A.A., Eds.; Springer Nature: Singapore, 2024; pp. 1–26. [Google Scholar]
  14. Bujak, J.; Sitarz, P.; Jasiewicz, P. Fuel consumption in the thermal treatment of low-calorific industrial food processing waste. Appl. Energy 2018, 221, 139–147. [Google Scholar] [CrossRef]
  15. Council Directive 1999/31/EC of 26 April 1999 on the Landfill of Waste. Available online: https://eur-lex.europa.eu/legal-content/EN/TXT/?uri=oj:JOL_1999_182_R_TOC (accessed on 12 May 2026).
  16. Convention on the Prevention of Marine Pollution by Dumping of Wastes and Other Matter. Available online: https://www.imo.org/en/about/conventions/pages/convention-on-the-prevention-of-marine-pollution-by-dumping-of-wastes-and-other-matter.aspx (accessed on 12 May 2026).
  17. International Convention for the Prevention of Pollution from Ships (MARPOL). Available online: https://www.imo.org/en/about/conventions/pages/international-convention-for-the-prevention-of-pollution-from-ships-(marpol).aspx (accessed on 12 May 2026).
  18. Román, S.; Libra, J.; Berge, N.; Sabio, E.; Ro, K.; Li, L.; Ledesma, B.; Álvarez, A.; Bae, S. Hydrothermal Carbonization: Modeling, Final Properties Design and Applications: A Review. Energies 2018, 11, 216. [Google Scholar] [CrossRef]
  19. Czerwińska, K.; Śliz, M.; Wilk, M. Hydrothermal carbonization process: Fundamentals, main parameter characteristics and possible applications including an effective method of SARS-CoV-2 mitigation in sewage sludge. A review. Renew. Sustain. Energy Rev. 2022, 154, 111873. [Google Scholar] [CrossRef]
  20. Funke, A.; Ziegler, F. Hydrothermal carbonization of biomass: A summary and discussion of chemical mechanisms for process engineering. Biofuels Bioprod. Biorefining 2010, 4, 160–177. [Google Scholar] [CrossRef]
  21. Choe, U.; Mustafa, A.M.; Lin, H.; Choe, U.; Sheng, K. Anaerobic co-digestion of fish processing waste with a liquid fraction of hydrothermal carbonization of bamboo residue. Bioresour. Technol. 2020, 297, 122542. [Google Scholar] [CrossRef] [PubMed]
  22. Fakudze, S.; Chen, J. A critical review on co-hydrothermal carbonization of biomass and fossil-based feedstocks for cleaner solid fuel production: Synergistic effects and environmental benefits. Chem. Eng. J. 2023, 457, 141004. [Google Scholar] [CrossRef]
  23. González-Arias, J.; Sánchez, M.E.; Cara-Jiménez, J.; Baena-Moreno, F.M.; Zhang, Z. Hydrothermal carbonization of biomass and waste: A review. Env. Chem. Lett. 2022, 20, 211–221. [Google Scholar] [CrossRef]
  24. Petrović, J.; Ercegović, M.; Simić, M.; Koprivica, M.; Dimitrijević, J.; Jovanović, A.; Pantić, J.J. Hydrothermal Carbonization of Waste Biomass: A Review of Hydrochar Preparation and Environmental Application. Processes 2024, 12, 207. [Google Scholar] [CrossRef]
  25. Liu, Z.; Zhao, L.; Yao, Z.; Jia, J.; Wang, Z.; Liu, Z. Behaviors and interactions during hydrothermal carbonization of protein, cellulose and lignin. Chem. Eng. J. 2023, 476, 146373. [Google Scholar] [CrossRef]
  26. Sevilla, M.; Fuertes, A.B. Chemical and Structural Properties of Carbonaceous Products Obtained by Hydrothermal Carbonization of Saccharides. Chem.–Eur. J. 2009, 15, 4195–4203. [Google Scholar] [CrossRef] [PubMed]
  27. Soroush, S.; Ronsse, F.; Verberckmoes, A.; Verpoort, F.; Park, J.; Wu, D.; Heynderickx, P.M. Production of solid hydrochar from waste seaweed by hydrothermal carbonization: Effect of process variables. Biomass Convers. Biorefinery 2024, 14, 183–197. [Google Scholar] [CrossRef]
  28. Bardhan, M.; Novera, T.M.; Tabassum, M.; Islam, A.; Islam, A.; Hameed, B. Co-hydrothermal carbonization of different feedstocks to hydrochar as potential energy for the future world: A review. J. Clean. Prod. 2021, 298, 126734. [Google Scholar] [CrossRef]
  29. Tekin, K.; Karagöz, S.; Bektaş, S. A review of hydrothermal biomass processing. Renew. Sustain. Energy Rev. 2014, 40, 673–687. [Google Scholar] [CrossRef]
  30. Libra, J.A.; Ro, K.S.; Kammann, C.; Funke, A.; Berge, N.D.; Neubauer, Y.; Titirici, M.-M.; Fühner, C.; Bens, O.; Kern, J.; et al. Hydrothermal carbonization of biomass residuals: A comparative review of the chemistry, processes and applications of wet and dry pyrolysis. Biofuels 2011, 2, 71–106. [Google Scholar] [CrossRef]
  31. Kruse, A.; Dinjus, E. Hot compressed water as reaction medium and reactant: Properties and synthesis reactions. J. Supercrit. Fluids 2007, 39, 362–380. [Google Scholar] [CrossRef]
  32. Rogalinski, T.; Liu, K.; Albrecht, T.; Brunner, G. Hydrolysis kinetics of biopolymers in subcritical water. J. Supercrit. Fluids 2008, 46, 335–341. [Google Scholar] [CrossRef]
  33. Kannan, S.; Gariepy, Y.; Raghavan, G.S.V. Optimization and Characterization of Hydrochar Derived from Shrimp Waste. Energy Fuels 2017, 31, 4068–4077. [Google Scholar] [CrossRef]
  34. Kannan, S.; Gariepy, Y.; Vijaya Raghavan, G.S. Optimization of the conventional hydrothermal carbonization to produce hydrochar from fish waste. Biomass Convers. Biorefinery 2018, 8, 563–576. [Google Scholar] [CrossRef]
  35. Atina, G.; Kowenje, C.; Lalah, J.; Ojwach, S. Preparation, characterization of fish scales biochar and their applications in the removal of anionic indigo carmine dye from aqueous solutions. Water Sci. Technol. 2019, 80, 2218–2231. [Google Scholar] [CrossRef] [PubMed]
  36. Suprayitno, E.; Aulanni’am, A.; Sulistiyati, T.D.; Riyadi, P.H. Chemical Characteristics and Amino Acids Profile of Protein Hydrolysates of Nile Tilapia (Oreochromis niloticus) Viscera. J. Worlds Poult. Res. 2019, 9, 324–328. [Google Scholar] [CrossRef]
  37. Korkmaz, K.; Tokur, B. Proximate Composition of Three Different Fish (Trout, Anchovy and Whiting) Waste During Catching Season. Turk. J. Marit. Mar. Sci. 2019, 5, 133–140. [Google Scholar]
  38. Younes, I.; Rinaudo, M. Chitin and Chitosan Preparation from Marine Sources. Structure, Properties and Applications. Mar. Drugs 2015, 13, 1133–1174. [Google Scholar] [CrossRef] [PubMed]
  39. Amelia, R.; Saptarini, N.M.; Halimah, E.; Andriani, Y.; Nurhasanah, A.; Levita, J.; Sumiwi, S.A. Pharmacology activities and extraction of α-chitin prepared from crustaceans: A review. J. Appl. Pharm. Sci. 2020, 10, 140–149. [Google Scholar] [CrossRef]
  40. Lin, X.; Chan, K.; Kingkhambang, K.; Hayashi, H.; Zinchenko, A. Hydrothermal preparation of pharmaceuticals adsorbents from chitin and chitosan: Optimization and mechanism. Bioresour. Technol. 2024, 414, 131583. [Google Scholar] [CrossRef] [PubMed]
  41. Kaewtrakulchai, N.; Samattakarn, N.; Chanpee, S.; Assawasaengrat, P.; Manatura, K.; Wongrerkdee, S.; Eiad-Ua, A. Solid shrimp waste derived nanoporous carbon as an alternative bio-sorbent for oxytetracycline removal from aquaculture wastewater. Heliyon 2024, 10, e32427. [Google Scholar] [CrossRef] [PubMed]
  42. Zhuang, X.; Zhan, H.; Song, Y.; He, C.; Huang, Y.; Yin, X.; Wu, C. Insights into the evolution of chemical structures in lignocellulose and non-lignocellulose biowastes during hydrothermal carbonization (HTC). Fuel 2019, 236, 960–974. [Google Scholar] [CrossRef]
  43. Körner, P. Hydrothermal Degradation of Amino Acids. ChemSusChem 2021, 14, 4947–4957. [Google Scholar] [CrossRef] [PubMed]
  44. Changi, S.M.; Faeth, J.L.; Mo, N.; Savage, P.E. Hydrothermal Reactions of Biomolecules Relevant for Microalgae Liquefaction. Ind. Eng. Chem. Res. 2015, 54, 11733–11758. [Google Scholar] [CrossRef]
  45. Zhuang, X.; Zhan, H.; Huang, Y.; Song, Y.; Yin, X.; Wu, C. Denitrification and desulphurization of industrial biowastes via hydrothermal modification. Bioresour. Technol. 2018, 254, 121–129. [Google Scholar] [CrossRef] [PubMed]
  46. Zhan, H.; Zhuang, X.; Song, Y.; Yin, X.; Wu, C. Insights into the evolution of fuel-N to NO precursors during pyrolysis of N-rich nonlignocellulosic biomass. Appl. Energy 2018, 219, 20–33. [Google Scholar] [CrossRef]
  47. Déniel, M.; Haarlemmer, G.; Roubaud, A.; Weiss-Hortala, E.; Fages, J. Energy valorisation of food processing residues and model compounds by hydrothermal liquefaction. Renew. Sustain. Energy Rev. 2016, 54, 1632–1652. [Google Scholar] [CrossRef]
  48. Islam, M.J.; Peñarubia, O.R. Seafood Waste Management Status in Bangladesh and Potential for Silage Production. Sustainability 2021, 13, 2372. [Google Scholar] [CrossRef]
  49. Coppola, D.; Lauritano, C.; Esposito, F.P.; Riccio, G.; Rizzo, C.; de Pascale, D. Fish Waste: From Problem to Valuable Resource. Mar. Drugs 2021, 19, 116. [Google Scholar] [CrossRef] [PubMed]
  50. Supraja, K.V.; Doddapaneni, T.R.K.C.; Ramasamy, P.K.; Kaushal, P.; Ahammad, S.Z.; Pollmann, K.; Jain, R. Critical review on production, characterization and applications of microalgal hydrochar: Insights on circular bioeconomy through hydrothermal carbonization. Chem. Eng. J. 2023, 473, 145059. [Google Scholar] [CrossRef]
  51. Wang, C.; Lin, X.; Zhang, X.; Show, P.L. Research advances on production and application of algal biochar in environmental remediation. Env. Pollut. 2024, 348, 123860. [Google Scholar] [CrossRef] [PubMed]
  52. Mathimani, T.; Mallick, N. A review on the hydrothermal processing of microalgal biomass to bio-oil—Knowledge gaps and recent advances. J. Clean. Prod. 2019, 217, 69–84. [Google Scholar] [CrossRef]
  53. Transforming Sargassum into Valuable Solid Carbon Materials: A Review of Synthesis Methods. Available online: https://www.jstage.jst.go.jp/article/kona/43/0/43_2026018/_article/-char/ja/ (accessed on 12 May 2026).
  54. Siddhartha, T.R.; Kashif, M.; Ranjbari, A.; Adhikary, K.K.; Kooy, E.; Anbari, A.P.; Che, C.A.; Ronsse, F.; Heynderickx, P.M. Structure, surface chemistry, and DFT-based mechanistic insights of seafood-waste hydrochars for pollutant adsorption. Biomass Bioenergy 2026, 208, 108829. [Google Scholar] [CrossRef]
  55. Siddhartha, T.R.; Anbari, A.P.; Ranjbari, A.; Che, C.A.; Adhikary, K.K.; Ronsse, F.; Heynderickx, P.M. Synergistic effects of co-hydrothermal carbonization of fish and corn waste on hydrochar structure, functionality, and adsorption performance. Biomass Bioenergy 2026, 208, 108897. [Google Scholar] [CrossRef]
  56. Kannan, S.; Burelle, I.; Orsat, V.; Vijaya Raghavan, G.S. Characterization of Bio-crude Liquor and Bio-oil Produced by Hydrothermal Carbonization of Seafood Waste. Waste Biomass Valorization 2020, 11, 3553–3565. [Google Scholar] [CrossRef]
  57. Fu, M.-M.; Mo, C.-H.; Li, H.; Zhang, Y.-N.; Huang, W.-X.; Wong, M.H. Comparison of physicochemical properties of biochars and hydrochars produced from food wastes. J. Clean. Prod. 2019, 236, 117637. [Google Scholar] [CrossRef]
  58. Kingkhambang, K.; Chan, K.; Zinchenko, A. Hydrochars of mixed marine biomass and plastic wastes: Carbonization scenarios and the performance as ketoprofen adsorbents. Waste Manag. 2025, 198, 66–76. [Google Scholar] [CrossRef] [PubMed]
  59. Chen, Z.; Jia, H.; Guo, Y.; Li, Y.; Liu, Z. Nitrogen-doped hydrochars from shrimp waste as visible-light photocatalysts: Roles of nitrogen species. Env. Res. 2022, 208, 112695. [Google Scholar] [CrossRef] [PubMed]
  60. Güleç, F.; Riesco, L.M.G.; Williams, O.; Kostas, E.T.; Samson, A.; Lester, E. Hydrothermal conversion of different lignocellulosic biomass feedstocks—Effect of the process conditions on hydrochar structures. Fuel 2021, 302, 121166. [Google Scholar] [CrossRef]
  61. Yu, S.; Yang, X.; Li, Q.; Zhang, Y.; Zhou, H. Breaking the temperature limit of hydrothermal carbonization of lignocellulosic biomass by decoupling temperature and pressure. Green Energy Env. 2023, 8, 1216–1227. [Google Scholar] [CrossRef]
  62. Kannan, S.; Gariepy, Y.; Raghavan, G.S.V. Conventional Hydrothermal Carbonization of Shrimp Waste. Energy Fuels 2018, 32, 3532–3542. [Google Scholar] [CrossRef]
  63. Rødde, R.H.; Einbu, A.; Vårum, K.M. A seasonal study of the chemical composition and chitin quality of shrimp shells obtained from northern shrimp (Pandalus borealis). Carbohydr. Polym. 2008, 71, 388–393. [Google Scholar] [CrossRef]
  64. Bargmann, I.; Rillig, M.C.; Kruse, A.; Greef, J.; Kücke, M. Effects of hydrochar application on the dynamics of soluble nitrogen in soils and on plant availability. J. Plant Nutr. Soil Sci. 2014, 177, 48–58. [Google Scholar] [CrossRef]
  65. Houshfar, E.; Skreiberg, Ø.; Todorović, D.; Skreiberg, A.; Løvås, T.; Jovović, A.; Sørum, L. NOx emission reduction by staged combustion in grate combustion of biomass fuels and fuel mixtures. Fuel 2012, 98, 29–40. [Google Scholar] [CrossRef]
  66. Giuntoli, J.; de Jong, W.; Verkooijen, A.H.M.; Piotrowska, P.; Zevenhoven, M.; Hupa, M. Combustion Characteristics of Biomass Residues and Biowastes: Fate of Fuel Nitrogen. Energy Fuels 2010, 24, 5309–5319. [Google Scholar] [CrossRef]
  67. Mabena, L.F.; Sinha Ray, S.; Mhlanga, S.D.; Coville, N.J. Nitrogen-doped carbon nanotubes as a metal catalyst support. Appl. Nanosci. 2011, 1, 67–77. [Google Scholar] [CrossRef]
  68. Simsir, H.; Eltugral, N.; Karagoz, S. Hydrothermal carbonization for the preparation of hydrochars from glucose, cellulose, chitin, chitosan and wood chips via low-temperature and their characterization. Bioresour. Technol. 2017, 246, 82–87. [Google Scholar] [CrossRef] [PubMed]
  69. Kozyatnyk, I.; Benavente, V.; Weidemann, E.; Gentili, F.G.; Jansson, S. Influence of hydrothermal carbonization conditions on the porosity, functionality, and sorption properties of microalgae hydrochars. Sci. Rep. 2023, 13, 8562. [Google Scholar] [CrossRef] [PubMed]
  70. Kim, S.; Lee, S.-E. Recovery of reactive potassium compounds as chemical agents in wastewaters from KOH-activated carbon production. Carbon Lett. 2025, 35, 2147–2156. [Google Scholar] [CrossRef]
  71. Amin, M.; Chung, E.; Shah, H.H. Effect of different activation agents for activated carbon preparation through characterization and life cycle assessment. Int. J. Env. Sci. Technol. 2023, 20, 7645–7656. [Google Scholar] [CrossRef]
  72. Farmer, V.C. The Layer Silicates. In The Infrared Spectra of Minerals; Farmer, V.C., Ed.; Mineralogical Society of Great Britain and Ireland: London, UK, 1974. [Google Scholar]
  73. Filley, T.R.; McCormick, M.K.; Crow, S.E.; Szlavecz, K.; Whigham, D.F.; Johnston, C.T.; Heuvel, R.N.v.D. Comparison of the chemical alteration trajectory of Liriodendron tulipifera L. leaf litter among forests with different earthworm abundance. J. Geophys. Res. Biogeosci. 2008, 113, G01027. [Google Scholar] [CrossRef]
  74. Soil Chemical Insights Provided through Vibrational Spectroscopy. In Advances in Agronomy; Academic Press: Cambridge, MA, USA, 2014; pp. 1–148.
  75. Deacon, G.B.; Phillips, R.J. Relationships between the carbon-oxygen stretching frequencies of carboxylato complexes and the type of carboxylate coordination. Coord. Chem. Rev. 1980, 33, 227–250. [Google Scholar] [CrossRef]
  76. Tammer, M. Sokrates: Infrared and Raman characteristic group frequencies: Tables and charts. Colloid Polym. Sci. 2004, 283, 235. [Google Scholar] [CrossRef]
  77. Kloss, S.; Zehetner, F.; Dellantonio, A.; Hamid, R.; Ottner, F.; Liedtke, V.; Schwanninger, M.; Gerzabek, M.H.; Soja, G. Characterization of Slow Pyrolysis Biochars: Effects of Feedstocks and Pyrolysis Temperature on Biochar Properties. J. Env. Qual. 2012, 41, 990–1000. [Google Scholar] [CrossRef] [PubMed]
  78. Madhusudhan, A.; Zelenka, T.; Satrapinskyy, L.; Roch, T.; Gregor, M.; Cheng, P.; Monfort, O. A comparative study of different activation methods for hydrochar: Surface properties and removal of pharmaceutical pollutant in water. Env. Sci. Pollut. Res. Int. 2025, 32, 18107–18120. [Google Scholar] [CrossRef] [PubMed]
  79. Gopika, R.; Ashraf, P.M.; Binsi, P.K. Utilization of Tuna Fish Skin Waste: Synthesis and Application of Nanocarbon Dots for Corrosion Resistance in Epoxy Polymers. Arab J. Sci. Eng. 2024, 49, 9249–9267. [Google Scholar] [CrossRef]
  80. Sagar, V.; Lynam, J.G. Environment Friendly Biodegradable Sprayable Shrimp Waste Fertilizer and Low-Cost Crab Waste Carbon Fixer. Environments 2025, 12, 181. [Google Scholar] [CrossRef]
Figure 1. The reaction chemistry and evolutionary pathways of marine animal biowaste during hydrothermal carbonization.
Energies 19 03124 g001
Figure 2. Proximate composition of hydrochars derived from marine biowaste feedstocks. Bars represent mean volatile matter, fixed carbon, and ash content on a dry weight basis. Dark dots indicate individual study values at the VM − FC boundary and VC + FC boundary, reflecting the cumulative stack height at each interface (Fish waste, n = 9; Crustacean, n = 7; Algae, n = 15, with n the number of samples).
Energies 19 03124 g002
Figure 3. Elemental composition of marine biowaste hydrochars grouped by feedstock category (dry basis, recalculated). Each panel shows mean ± one standard deviation for one element (Carbon, Hydrogen, Nitrogen, Oxygen, Sulfur), with individual data points overlaid as gray dots. Bar colors denote feedstock category: Fish waste; Shrimp waste; Crab/Prawn; Chitin/Chitosan; Shrimp+Glucose (co-HTC). All values are in wt% on a dry basis, recalculated from reported proximate and elemental data.
Energies 19 03124 g003
Figure 4. Elemental composition of marine biowaste hydrochars grouped by production temperature (dry basis, recalculated). Each panel shows mean ± one standard deviation for one element (Carbon, Hydrogen, Nitrogen, Oxygen, Sulfur), with individual data points overlaid as gray dots. All values are in wt% on a dry basis, recalculated from reported proximate and elemental data.
Energies 19 03124 g004
Figure 5. Van Krevelen diagram of assessed hydrochar data points (marine fish and crustacean species across HTC temperatures 180 to 240 °C) [7,33,55,57,58,62]. Symbol color and shape denote feedstock category: = fish waste; = shrimp waste; = crab/prawn waste; = chitin/chitosan.
Energies 19 03124 g005
Figure 6. Surface area comparison among marine biowaste hydrochar and reference material. Data dots represent the actual reported values from literature.
Energies 19 03124 g006
Table 1. Record table from Tier 1 and Tier 2 WoS searches, deduplication, screening by title and abstract, full-text eligibility assessment, and final included papers per tier.
Publication Category#*Used Query
All HTC work17,640TS = ((“hydrothermal carbonization” OR “hydrothermal carbonisation” OR “wet pyrolysis” OR “wet torrefaction” OR HTC OR hydrochar))
HTC on non-lignocellulosic material1870TS = ((“hydrothermal carbonization” OR “hydrothermal carbonisation” OR “wet pyrolysis” OR “wet torrefaction” OR HTC OR hydrochar)AND(“food waste” OR “kitchen waste” OR OFMSW OR “organic fraction of municipal solid waste” OR “organic waste”OR algae OR microalgae OR macroalgae OR “algal biomass” OR seaweedOR “sewagesludge “ OR “wastewater sludge” OR biosolids OR “municipal sludge”OR manure OR “animal manure” OR “poultry manure” OR “swine manure” OR “cattle manure”OR digestate OR “fish waste” OR “fish residue” OR “aquatic waste” OR “aquatic biomass”))
HTC on marine animal waste32TS = ((“hydrothermal carbonization” OR “hydrothermal carbonisation” OR “wet pyrolysis” OR “wet torrefaction” OR HTC OR hydrochar)AND(“fish waste” OR “fish residue” OR “fish by-product” OR “fish processing waste” OR “seafood waste” OR “shrimp waste” OR “aquatic animal waste” OR “marine biomass” OR “marine waste” OR “aquatic biomass”)NOT(seaweed OR macroalgae OR microalgae OR “marine algae” OR “algal biomass”))
HTC on micro- and macro- algae452TS = ((“hydrothermal carbonization” OR “hydrothermal carbonisation” OR “wet pyrolysis” OR “wet torrefaction” OR HTC OR hydrochar) AND (“microalgae” OR “macroalgae” OR “seaweed” OR “kelp” OR “spirulina” OR “chlorella” OR “scenedesmus” OR “nannochloropsis” OR “sargassum” OR “laminaria” OR “ulva” OR “marine algae” OR “algal biomass” OR “microalgal” OR “macroalgal”))
*#: number of publications.
Table 2. Summary of HTC production parameters and hydrochar yield for marine biowaste feedstocks.
FeedstockPretreatmentTemp. (°C)W:B RatioTime (min)Yield (%)Ref.
Fish residueOven-dried 105 °C; ground <1 mm200–30020120NR[57]
Fish waste (anchovy, salmon, cod—heads/tails/viscera/fins, scales)Enzymatic hydrolysis (Viscozyme + Lipase + Protease 1:1:1, 40 °C, 16 h)15016028.7[8]
Shrimp waste (pink, tiger, brown—shell/head/tail)Enzymatic hydrolysis (Viscozyme + Lipase + Protease 1:1:1, 40 °C, 16 h)15016038.1[8]
Fish waste (anchovy, salmon, cod—heads/tails/viscera/fins/scales)Enzymatic hydrolysis (Viscozyme + Lipase + Protease 1:1:1, 40 °C, 6 h)150–210160–120NR[33]
Shrimp waste (pink, tiger, brown—shell/head/tail)Enzymatic hydrolysis (Viscozyme + Lipase + Protease 1:1:1, 40 °C, 6 h)150–210160–120NR[9]
Fish waste (anchovy, salmon, cod—heads/tails/viscera/fins/scales)Enzymatic hydrolysis (Viscozyme + Lipase + Protease 1:1:1, 40 °C, 6 h)150–210160–12030.5–41.5[34]
Shrimp waste (pink, tiger, brown—shell/head/tail)Enzymatic hydrolysis (Viscozyme + Lipase + Protease 1:1:1, 40 °C, 6 h)150–210160–12025.3–41.5[62]
Shrimp waste + Glucose (0–4 g glucose per 4 g shrimp waste)Acid-assisted HTC220NR14403.1–8.6[59]
Chitin (CT)—fishery-waste-derived150–2502060–24072.0–90.0[40]
Chitosan (CS)—fishery-waste-derived150–250206050.0–90.0[40]
Chitin (CT)—fishery-waste-derived2002060–24070.0–85.0[40]
Shrimp waste (exoskeleton/shell)HCl wash (0.5 M) to remove CaCO3; rinsed to neutral230272037.5[41]
Chitosan (CS); Crab shell (CR); Chitin (CT)— (pure biopolymers)200NR24045.0–86.0[41]
Chitosan (CS); Crab shell (CR); Chitin (CT)Co-HTC with PET plastic200NR24042.0–71.0[41]
Chitosan (CS); Chitin (CT); Crab shell (CR)Co-HTC with HDPE plastic200NR2404.0–76.0[41]
Fish waste (Mackerel, Hairtail, Yellow corvina, Horse mackerel, Olive flounder)200–240736015.1–21.5[7]
Crustacean waste (Whiteleg shrimp, Tiger prawn, Asian paddle crab)200–240736037.8–68.3[7]
Fish waste240736017.2[54]
Shrimp waste240736037.8[54]
Fish waste (pure)220736028.1[55]
Fish waste + corn waste (25%, 50%, 75%)Co-HTC with corn waste220736030.0–32.5[55]
Table 3. Typically appearing functional groups in surface chemistry of hydrochar from marine biowaste.
Range (cm−1)Type of Functional GroupsRef.
820–940O-H bending bands from clay minerals associated with hydrochar[72]
1020–1160C-O from polysaccharide, carbohydrate region[73]
1200–1280Carboxylic acid C-OH stretch, O-H deformation[74]
1520–1590COO- carboxylate anions[75]
1650–1740N–H bending amide II, C=O from carboxylic acids, aides, esters, and ketones[76]
2840–2870Symmetric aliphatic CH from terminal CH3 groups[76]
2920–2950Asymmetric aliphatic CH from terminal CH2 groups[76]
3200–3600OH from sorbed water and hydrogen-bonded hydrochar O-H groups[77]
Table 4. Adsorption isotherm parameters for hydrochar-based adsorbents derived from marine biowaste.
Isotherm modelParameterShrimp wasteChitosanChitosanChitosanChitosan + PETFish wasteShrimp waste
Temp. (°C)230200200200200230230
Time (h)12444466
PollutantOxytetracyclineKetoprofenClorfibric acidIbuprofenKetoprofenTetracyclineTetracycline
Reference[41][40][40][40][58][54][54]
Langmuirqm (mg/g)61.26−341.3066.8061.1057.8721.7073.00
kL (L/mg)0.012−0.0060.0420.0360.0400.0680.017
R20.9930.3570.9530.9290.819
FreundlichKF6.831.843.172.522.502.872.55
1/n0.331.060.790.800.800.290.28
R20.8980.9980.9930.9890.994
TemkinB13.1316.6010.709.60
KT0.120.370.640.56
R20.9820.9680.9770.981
Table 5. Adsorption kinetics parameters for various water pollutants.
Hydrochar FeedstockPollutantPseudo-First-Order (PFO)Pseudo-Second-Order (PSO)Ref.
k1 (min−1)qe (mg/g)R2k2 (g/mg·min)qe (mg/g)R2
Shrimp wasteOxytetracycline0.05756.220.9930.00169.340.995[41]
ChitosanKetoprofen0.137420.97714854.10.996[40]
ChitosanChlorofibric acid0.16231.50.93772.248.40.998[40]
ChitosanIbuprofen0.15726.10.94464.539.20.995[40]
Chitosan + PETKetoprofen0.091.20.9100.254.440.999[58]
Fish wasteTetracycline4.805.380.9300.875.030.998[54]
Shrimp wasteTetracycline0.020.760.8900.143.880.999[54]
Fish waste4-Nitrophenol1.160.40.9937.200.330.999[54]
Shrimp waste4-Nitrophenol1.370.280.9966.950.410.998[54]
Fish wasteAcetaminophen0.140.060.7226.290.770.999[54]
Shrimp wasteAcetaminophen0.012.350.9970.011.880.851[54]
Fish wasteDoxycycline hyclate0.021.100.9840.011.420.832[54]
Shrimp wasteDoxycycline hyclate0.021.670.935<0.012.650.603[54]
Fish wasteMethyl orange1.910.140.8927.5520.210.871[54]
Shrimp wasteMethyl orange0.020.430.9260.12520.470.960[54]
Fish wasteMethylene blue2.500.040.75034.380.020.414[54]
Shrimp wasteMethylene blue2.190.070.9500.080.010.013[54]
Fish wasteK2Cr2O70.080.180.9021.120.340.999[54]
Shrimp wasteK2Cr2O70.011.860.9900.031.340.823[54]
Disclaimer/Publisher’s Note: The statements, opinions and data contained in all publications are solely those of the individual author(s) and contributor(s) and not of MDPI and/or the editor(s). MDPI and/or the editor(s) disclaim responsibility for any injury to people or property resulting from any ideas, methods, instructions or products referred to in the content.