Article

Advanced Cooling of Photovoltaic Panels Using Al2O3 Nanofluid: A Numerical Study on the Influence of Flow Rate


by
Ciprian-Cătălin Butnaru
*,
Alexandru-Flavian Crișu
,
Răzvan-Silviu Luciu
and
Andrei Burlacu
Faculty of Civil Engineering and Building Services, Gheorghe Asachi Technical University of Iași, 67 Prof. Dimitrie Mangeron Blvd., 700050 Iași, Romania
*
Author to whom correspondence should be addressed.
Energies 2026, 19(13), 2987; https://doi.org/10.3390/en19132987
Submission received: 30 May 2026 / Revised: 18 June 2026 / Accepted: 22 June 2026 / Published: 25 June 2026

Abstract

This paper presents a parametric numerical study on the cooling performance of photovoltaic panels using water and an Al2O3-based nanofluid. The increase in operating temperature leads to a decrease in electrical efficiency, making thermal management a key factor in optimizing these systems. The analysis was carried out through numerical simulations in ANSYS, aiming to evaluate the influence of volumetric flow rate and inlet temperature of the cooling fluid on the panel cooling time under transient conditions. The results show that the performance of the Al2O3 nanofluid depends on the flow rate of the cooling fluid. At a low flow rate of 0.05 m3/h and a concentration of 4%, the cooling time is reduced by approximately 18–22% compared to water, while this advantage diminishes as the flow rate increases. A favorable operating region was also observed within the investigated laminar and near-transitional range, beyond which increasing the flow rate produced only limited additional reductions in cooling time under the assumptions of the numerical model. The findings highlight the importance of correlating the thermophysical properties of the fluid with flow parameters in order to optimize the thermal management of photovoltaic panels.

1. Introduction

Electricity generation using photovoltaic panels is one of the most promising solutions for reducing dependence on fossil fuels and for advancing sustainable energy systems [1,2]. Due to their structural simplicity, low maintenance costs, and high scalability, photovoltaic systems have experienced rapid development over recent decades. However, the efficiency of converting solar energy into electricity remains limited, as a significant portion of the incoming solar radiation is converted into thermal energy, leading to an increase in the operating temperature of the panels.
The increase in photovoltaic panel temperature has a direct negative impact on their performance. Experimental studies have shown that electrical efficiency decreases by approximately 0.3–0.5% for each degree Celsius increase in temperature [3]. Under these conditions, thermal management becomes a key factor in optimizing the performance of photovoltaic systems, requiring the development of efficient cooling solutions.
An important direction in this context is represented by hybrid photovoltaic/thermal (PV/T) systems, initially introduced in [4], which enable both electricity generation and thermal energy recovery. These systems contribute to reducing panel temperature and increasing the overall efficiency of solar energy utilization. Existing studies present a wide range of cooling methods for photovoltaic panels, including both passive and active approaches, such as air cooling, water cooling, phase change materials, and nanofluids [5]. Air-based cooling systems have been investigated through combined experimental and numerical approaches, showing that the interaction between airflow configuration and panel temperature can directly influence the generated power and the cooling efficiency [6]. Broader comparative studies also indicate that the selection of a suitable PV cooling technique should consider not only the temperature reduction, but also environmental and economic aspects [7]. In addition, direct water cooling and cleaning strategies have shown that the operating scenario of the cooling system can affect both panel temperature and power generation, highlighting the importance of correlating cooling performance with operating conditions [8].
Water cooling is one of the most widely used active methods due to its high heat transfer performance and relatively low cost. The performance of these systems is strongly influenced by the geometry of the flow channels and the operating parameters. For example, tube-and-plate and box-type collectors have been extensively studied, showing that variations in geometric parameters, such as the spacing between tubes or the thermal conductivity of the absorber material, significantly affect both thermal and electrical efficiency [9].
Other studies have investigated innovative flow channel configurations, such as serpentine channels or V-shaped structures, showing that increased fluid turbulence enhances heat transfer and reduces panel temperature [10]. In addition, the use of heat exchangers with converging channels or spiral configurations has demonstrated significant improvements in energy efficiency and notable reductions in operating temperature [11,12].
The performance of PV/T systems is influenced not only by geometry but also by operating parameters, particularly the cooling fluid flow rate. Studies indicate that as the flow rate increases, cooling efficiency improves up to a certain threshold, beyond which further increases become negligible or may even reduce overall performance due to additional energy consumption [13].
In recent years, research has also focused on the use of nanofluids as cooling agents due to their superior thermophysical properties. Nanofluids based on metal oxides, such as Al2O3, have demonstrated the ability to enhance the heat transfer coefficient and improve the efficiency of photovoltaic/thermal systems [2]. Their integration into cooling systems represents a promising direction for optimizing thermal management.
In this context, the present study provides a parametric numerical analysis of the cooling of a photovoltaic panel using water and an Al2O3-based nanofluid. The analysis focuses on the influence of volumetric flow rate on the transient thermal behavior, with the cooling time required to reach relevant temperature thresholds being evaluated. The main objective is to identify a suitable operating regime and to assess the effect of using the Al2O3 nanofluid on the cooling process as a function of flow rate.
To highlight the results reported in recent studies on photovoltaic panel cooling, Table 1 summarizes the main cooling configurations employed and their effects on thermal and electrical performance.
The results summarized in Table 1 highlight the current interest in the use of water and nanofluids for cooling photovoltaic panels, as well as the influence of operating parameters on thermal performance. In this context, the present study numerically investigates the influence of flow rate on the cooling process of a photovoltaic panel using water and an Al2O3-based nanofluid, with the aim of identifying the flow-rate range in which the cooling performance is most favorable. The main contribution consists of a comparative evaluation of thermal performance under transient conditions and in demonstrating that the advantage of using the nanofluid depends on the coolant flow rate.

2. Methodology and Numerical Model

2.1. Description of the Geometric Model

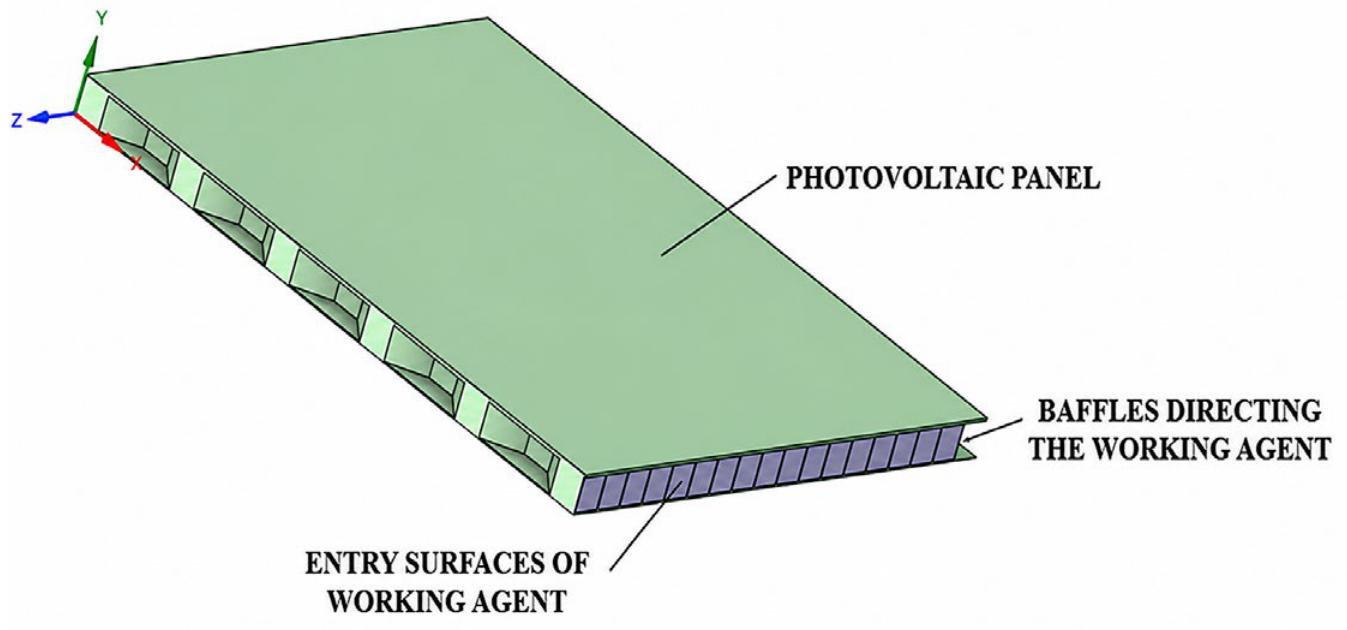
The analyzed model consists of a photovoltaic (PV) panel equipped with an active cooling system mounted on the rear side, in the form of a heat exchanger with a flow channel for the cooling fluid. The photovoltaic panel has dimensions of 860 × 760 mm, corresponding to a total surface area of 0.6536 m2.
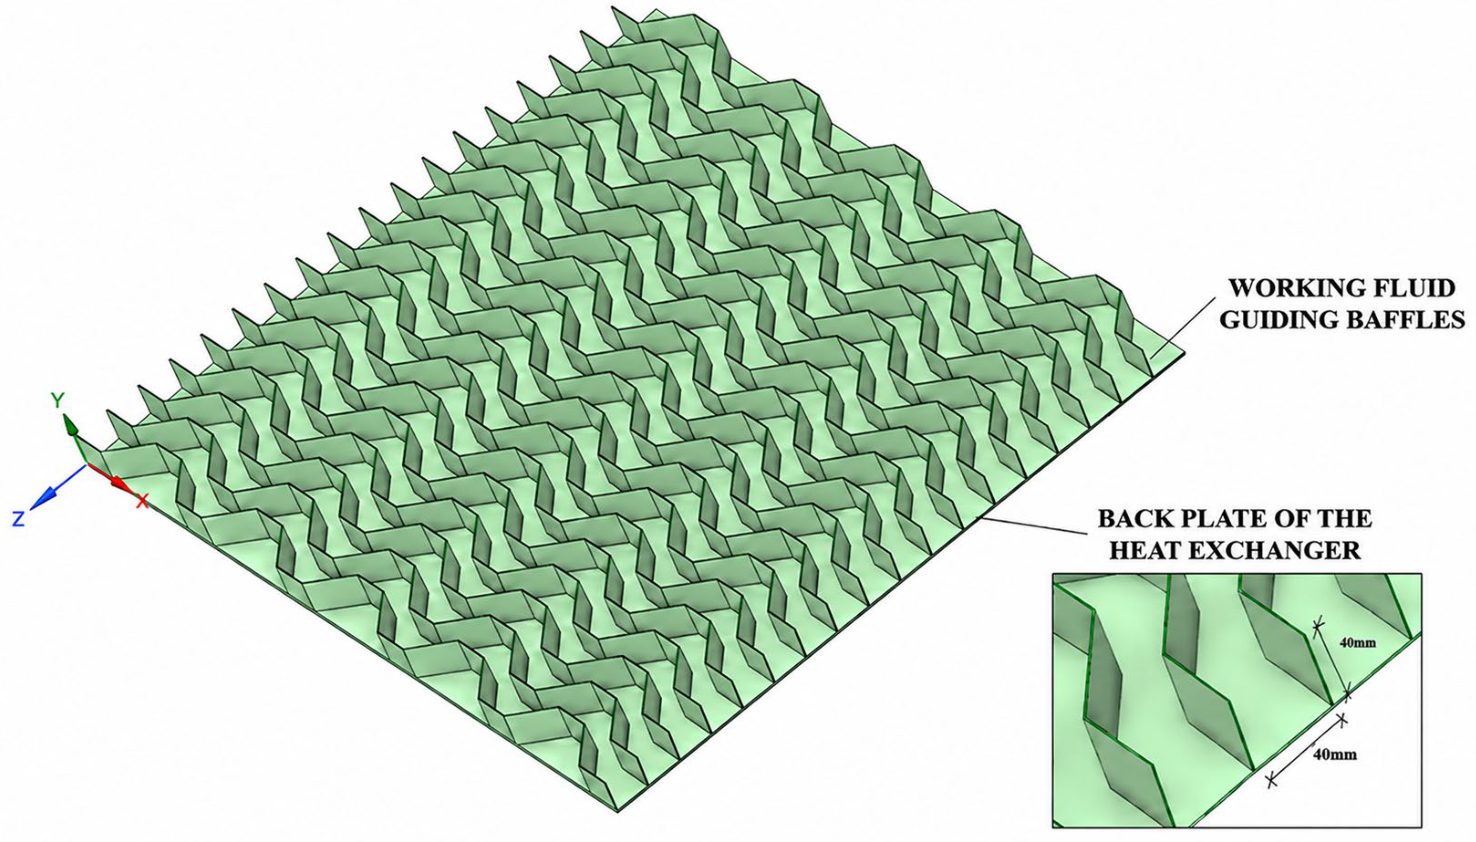
The heat exchanger is designed as a flat plate with the same dimensions as the photovoltaic panel and is equipped with uniformly distributed baffles to guide the cooling fluid. The baffles are spaced at equal intervals of 40 mm and have a height of 40 mm, being used to enhance fluid mixing and increase the heat transfer coefficient.
The heat exchanger assembly is made of copper, due to its high thermal conductivity, and is mounted on the rear surface of the photovoltaic panel, ensuring efficient thermal contact. The interface between the photovoltaic panel and the heat exchanger was assumed to be perfectly bonded, with no thermal contact resistance. This assumption was adopted in order to simplify the numerical model and to focus the analysis on the relative influence of coolant type and volumetric flow rate on the transient cooling behavior. However, in real PV/T systems, thermal contact resistance may occur at the interface due to imperfect bonding, surface roughness, air gaps, or non-uniform contact pressure. The presence of such resistance would reduce the heat transfer rate from the PV panel to the heat exchanger and may therefore increase the predicted cooling time. Consequently, the present results should be interpreted as comparative numerical indicators under idealized contact conditions, while the inclusion of interface thermal resistance is recommended for future experimental or more detailed numerical studies.
The geometric model of the photovoltaic panel with heat exchanger is shown in Figure 1, while the flow channel equipped with baffles is presented in Figure 2.
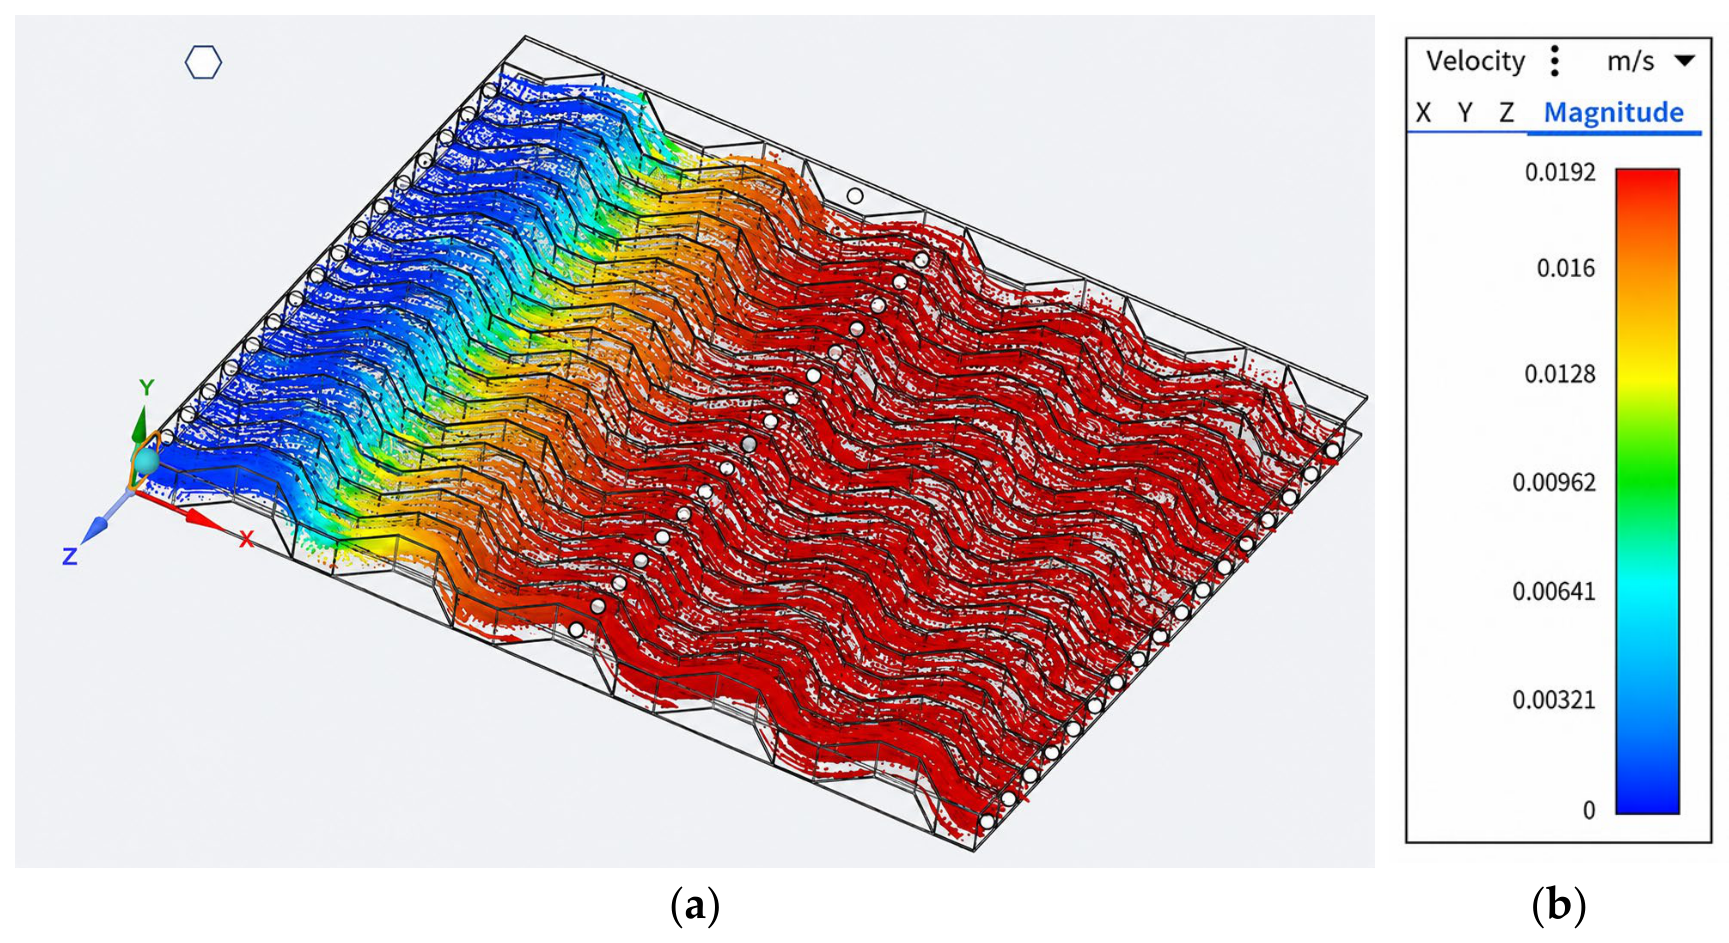
To illustrate the fluid behavior within the flow channel, Figure 3 presents the velocity field distribution. Successive deviations of the fluid trajectory caused by the presence of baffles can be observed, along with local variations in velocity. These effects enhance fluid mixing and influence the heat transfer process.
The system geometry was modeled using the SpaceClaim module within the ANSYS Discovery 2022 R1 and subsequently used for the numerical analysis of heat transfer.
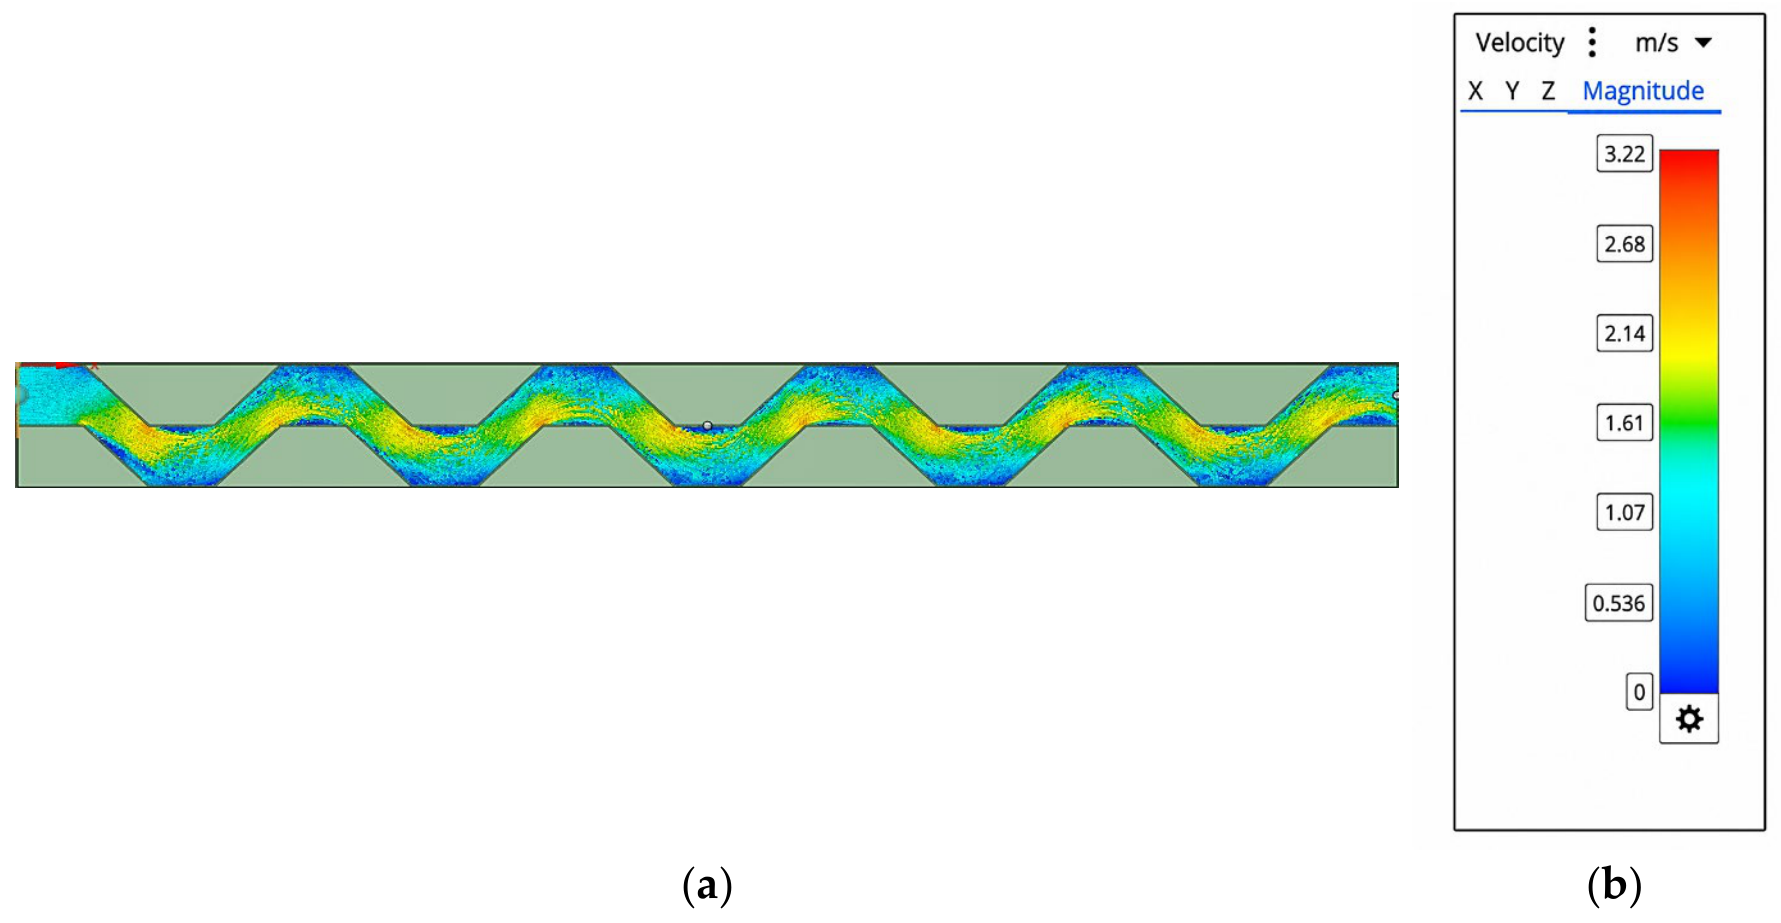
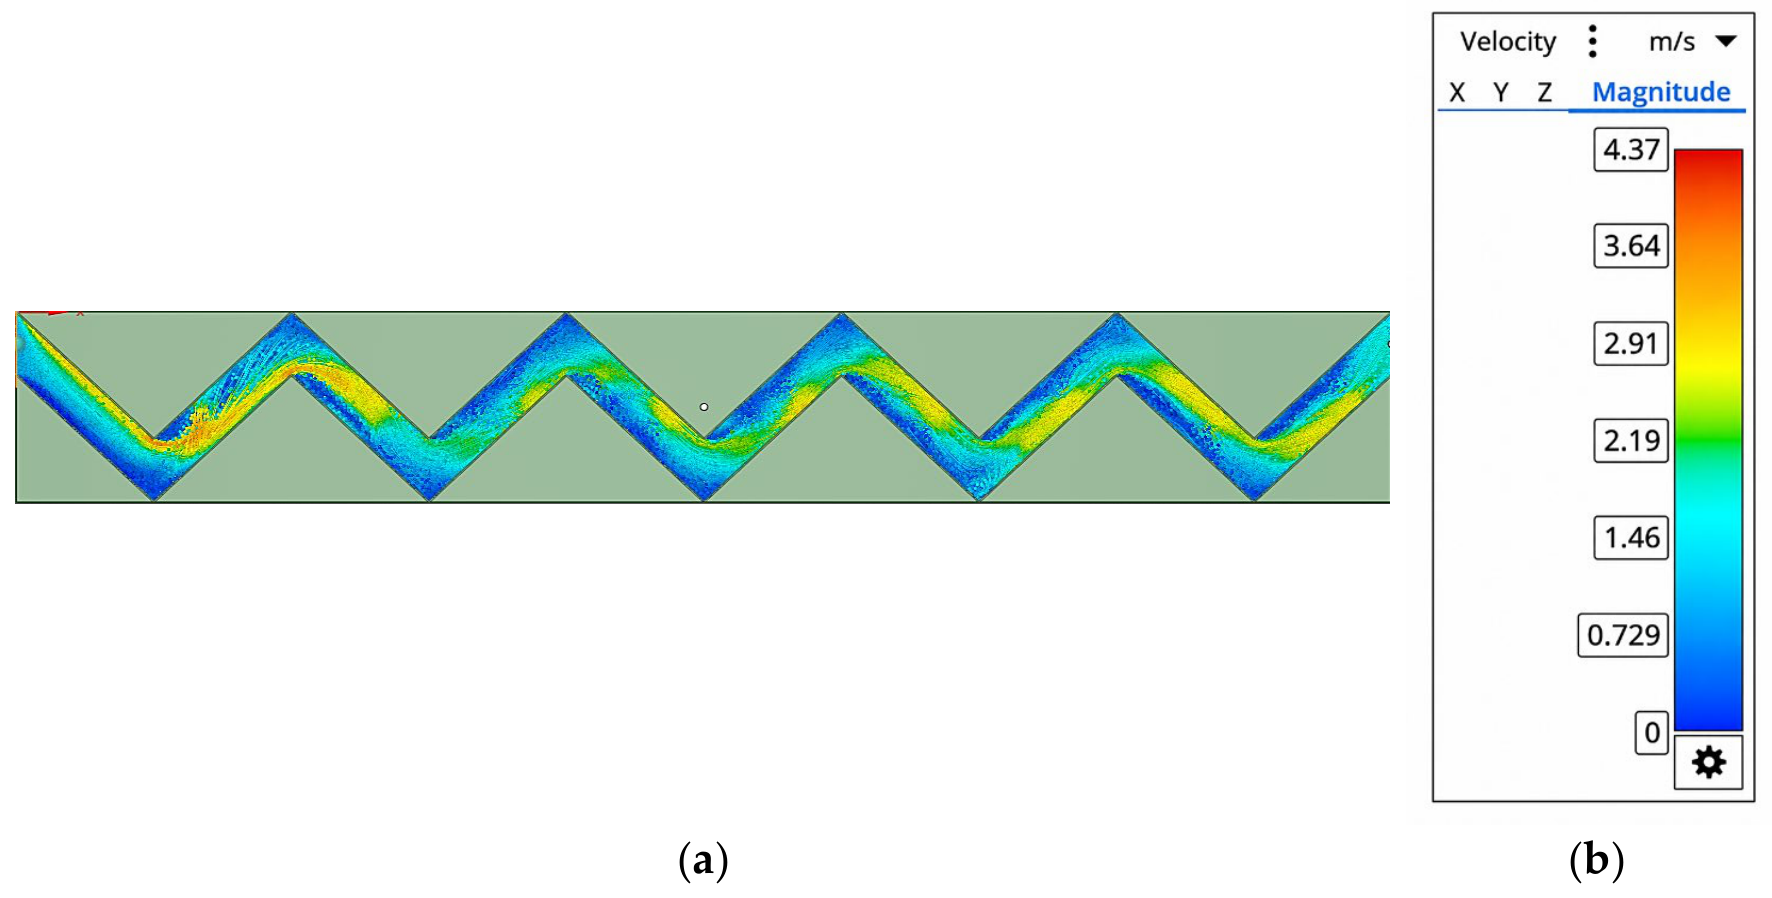
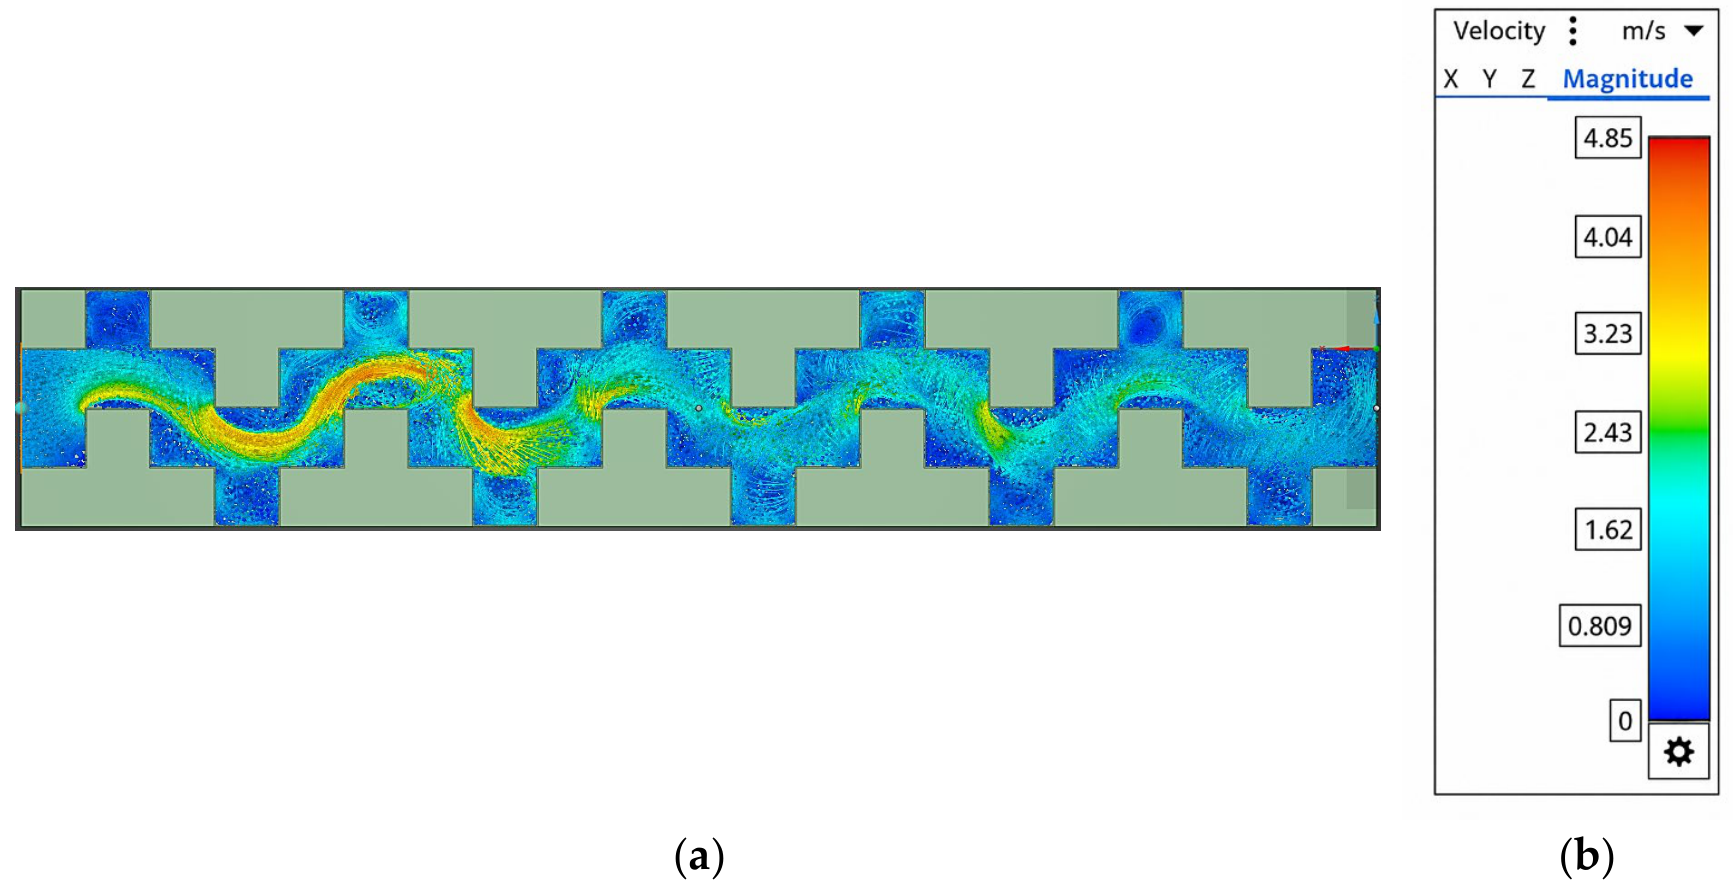
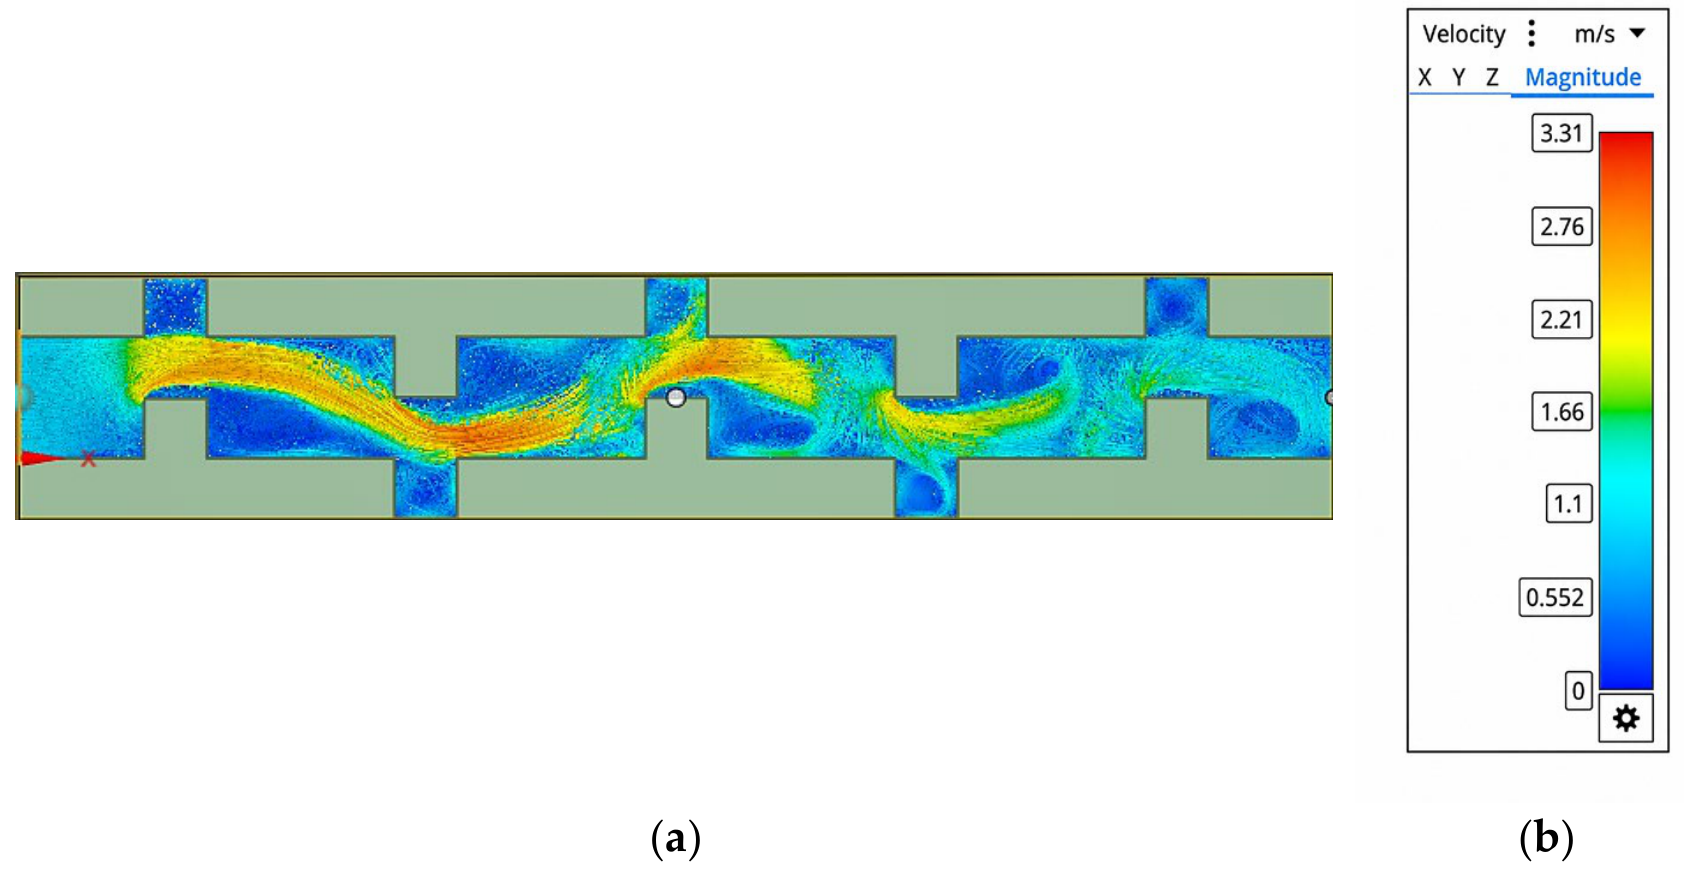
During the design stage of the flow channel configuration, a preliminary comparative analysis of several geometric variants was carried out to evaluate their influence on the flow regime and the thermal performance of the system. For this purpose, five distinct computational models were developed, each representing a characteristic section of the heat exchanger.
The flow regime of the cooling fluid was evaluated using the Reynolds number, a dimensionless parameter commonly used to characterize flow behavior in channels.
The Reynolds number is defined by the following relation:
R e = ρ v D h μ
where ρ is the fluid density [kg/m3], v is the mean flow velocity [m/s], Dh is the hydraulic diameter of the channel [m], and μ is the dynamic viscosity [Pa·s].
For the analyzed case, the flow occurs in a rectangular channel, with the hydraulic diameter determined using the following relation:
D h = 2 a b a + b
where a and b represent the characteristic dimensions of the channel cross-section. For the analyzed rectangular flow channel, the cross-sectional dimensions used for the hydraulic diameter calculation were a = 40 mm and b = 40 mm.
The mean fluid velocity was determined based on the imposed volumetric flow rate, using the following relation:
v = Q A
where Q is the volumetric flow rate [m3/s], and A is the cross-sectional flow area [m2].
To further clarify the flow-regime classification, the Reynolds number values were summarized for the revised investigated flow-rate range. Since the thermophysical properties of the cooling fluid vary with temperature, the Reynolds number was calculated for each analyzed inlet-fluid temperature. The resulting values are reported separately for water and for the Al2O3 nanofluid (4%) in Table 2 and Table 3.
As shown in Table 2 and Table 3, the Reynolds number increases with the volumetric flow rate and varies with the inlet-fluid temperature due to changes in thermophysical properties. The lower flow rates remain within the laminar range, while the highest retained flow rates approach or enter transitional conditions. Therefore, the revised main analysis was restricted to 0.05–0.5 m3/h, while flow rates of 0.6 m3/h and above were excluded because they correspond to higher Reynolds number values and would require an appropriate turbulence model.
For the preliminary comparative analysis of the geometric configurations, the inlet conditions were kept constant, with an initial fluid velocity of 1 m/s and a density of 1000 kg/m3, corresponding to water used as the cooling fluid. This fixed-velocity condition was used only as a common reference case for preliminary geometry screening, in order to compare the relative influence of channel geometry and baffle arrangement on the flow distribution under identical inlet conditions. Therefore, the results of this stage were used only to compare the relative influence of channel geometry on the flow distribution, while the main revised analysis was restricted to the investigated laminar and near-transitional flow-rate range.
After the selection of Model 2, the subsequent parametric study was performed using prescribed volumetric flow rates in the range of 0.05–0.5 m3/h, corresponding to the investigated laminar and near-transitional operating conditions considered in the revised main analysis. Therefore, the fixed inlet velocity of 1 m/s and the imposed volumetric flow rates refer to two different stages of the numerical study: the preliminary geometry-comparison stage and the detailed parametric analysis, respectively. Within each stage, the boundary conditions were applied consistently to all compared cases.
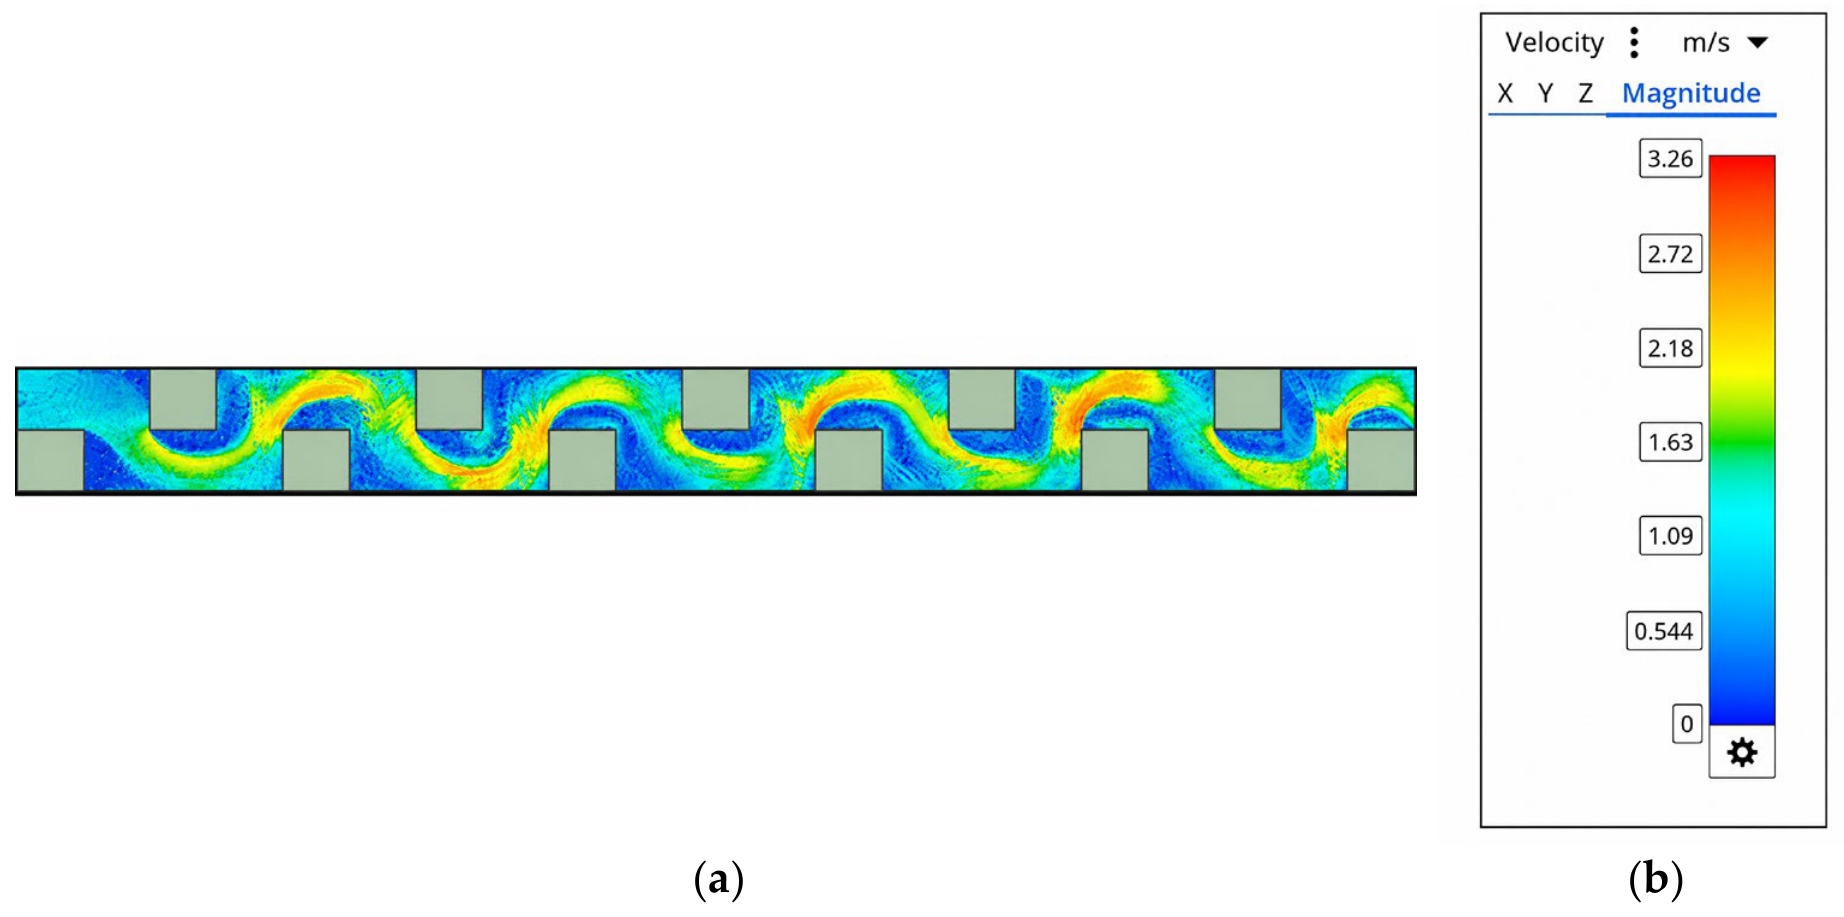
Model 1—(Figure 4) In this case, the channel geometry leads to a local reduction in the flow cross-section, resulting in fluid acceleration along the flow path. As a result, the outlet velocity reaches approximately 3.26 m/s, significantly higher than the imposed inlet velocity.
This increase in velocity indicates the presence of acceleration effects and possible flow separation zones near the baffles, which contribute to enhanced fluid mixing.
Model 2—(Figure 5) This configuration promotes a more uniform flow distribution across the entire channel cross-section. Although local velocity variations occur due to interaction with the baffles, these are less pronounced compared to the other models.
The more homogeneous velocity distribution leads to a more uniform dissipation of the heat flux, which is essential for the efficient cooling of the photovoltaic panel.
Model 3—(Figure 6) In this case, the modification of the fluid flow path leads to more pronounced deviations, resulting in local velocity variations and the formation of recirculation regions.
These effects enhance convective heat transfer but may introduce non-uniformities in the temperature distribution.
Model 4—(Figure 7) This configuration exhibits the most pronounced fluid acceleration among the analyzed cases, with the outlet velocity reaching approximately 4.85 m/s. This significant increase is caused by the geometric constraints imposed by the baffles and the repeated deviations in the flow path.
However, the intensified flow is accompanied by a non-uniform velocity distribution, leading to uneven cooling of the panel surface.
Model 5—(Figure 8) This configuration represents an intermediate case, in which flow acceleration and deviation effects are present but less pronounced compared to Model 4.
The velocity distribution indicates a trade-off between the enhancement of heat transfer and flow uniformity.
The comparative analysis of the five configurations shows that the channel geometry directly influences the flow regime by altering the velocity distribution and promoting the formation of recirculation zones.
Although configurations with more pronounced acceleration, such as Model 4, may enhance local heat transfer, they also lead to a less uniform flow distribution, which may be unfavorable for uniform cooling of the photovoltaic panel. By contrast, Model 2 showed a more balanced velocity distribution within the channel based on the available velocity and temperature contours. Therefore, Model 2 was selected as the reference configuration for the subsequent detailed numerical analysis. It should be noted that this selection represents a preliminary geometry choice among the investigated configurations under the considered operating conditions, rather than a complete quantitative optimization. Although the geometric configuration induces local recirculation effects and velocity variations, the flow regime varies with the flow rate, encompassing laminar conditions and transitional regions within the revised scope of the study.

2.2. Numerical Model and Assumptions

The numerical analysis of the photovoltaic panel cooling process was carried out using ANSYS Discovery under transient conditions, in order to capture the time evolution of the panel temperature and the influence of operating parameters on cooling performance.
The transient simulations were carried out by monitoring the cooling process until the photovoltaic panel reached the prescribed temperature threshold corresponding to the inlet temperature of the cooling fluid, namely 10 °C, 15 °C, 20 °C, or 25 °C, depending on the analyzed case. The time required to reach this threshold was recorded as the cooling time and is reported in Section 3 and Appendix A. Therefore, the total simulation duration was not imposed as a fixed value for all cases, but varied according to the cooling response of each configuration. In ANSYS Discovery, the simulations were performed using an intermediate accuracy level, corresponding to a balance between numerical precision and computational cost. The same accuracy setting, transient procedure, and stopping criterion were applied consistently to all analyzed cases. It is acknowledged that detailed residual convergence criteria and a time-step sensitivity analysis were not available in the present setup and should be included in future work using a full CFD solver.
All material properties, geometric parameters, inlet conditions, and operating data were defined in ANSYS according to the values reported in the manuscript tables. The numerical mesh was generated within ANSYS Discovery using the meshing procedure available for the adopted simulation setup. The same meshing approach and numerical settings were applied consistently to all analyzed cases in order to provide a comparable numerical basis for evaluating the influence of coolant type and volumetric flow rate. A formal mesh sensitivity analysis using multiple mesh densities was not performed in the present study. Therefore, the reported values should be interpreted as comparative numerical indicators obtained under a consistent numerical setup, rather than as fully mesh-independent predictive results. Future work should include a complete mesh independence analysis, including the number of elements, element types, and mesh quality metrics, using a full CFD solver.
The present study should be regarded as a parametric numerical investigation aimed at identifying relative trends under controlled boundary conditions. Since no experimental validation is included, the reported values should not be interpreted as fully validated predictive results for a real PV/T system, but rather as comparative indicators of the influence of coolant type and volumetric flow rate on the transient cooling behavior of the photovoltaic panel.
Heat transfer is assumed to occur through conduction in the solid domain and forced convection in the fluid domain, accounting for the interaction between the velocity and temperature fields. The cooling fluid is considered an incompressible Newtonian fluid.
The thermophysical properties of pure water were determined based on reference data provided by the IAPWS-95 standard [24], widely used for characterizing water properties in engineering and scientific applications. The values corresponding to the analyzed temperature range (10–25 °C), at atmospheric pressure, were extracted from standard tables and, where necessary, interpolated. The results are presented in Table 4.
The water properties reported in Table 4 correspond to the thermophysical-property dataset used as input in the numerical simulations. These values were retained in the manuscript in order to maintain consistency between the property table, the numerical model, and the reported simulation results. It is acknowledged that slight differences may exist compared with other standard tabulated water-property data, depending on the source, interpolation method, and numerical database used. Therefore, the selected property dataset may influence the absolute cooling-time values. However, since the same dataset was applied consistently throughout all analyzed cases, the comparative trends remain valid.
Based on these values and the specific properties of aluminum oxide (Al2O3) na-noparticles, the effective thermophysical properties of the nanofluid used in the study were determined. The thermophysical properties of the Al2O3 nanoparticles used in the calculation of the effective nanofluid properties were adopted from standard literature values for aluminum oxide nanoparticles and were kept constant throughout all analyzed cases [25]. These nanoparticle properties were used as input data in the mixture relations applied for the determination of the effective density, specific heat capacity, viscosity, and thermal conductivity of the Al2O3/water nanofluid.
The density of the nanofluid was determined using a mixture relation based on the volumetric fraction of the nanoparticles, taking into account the thermophysical properties of both the base fluid and the solid particles.
The specific heat capacity was evaluated using the relation proposed in [26], based on the conservation of the mixture’s volumetric energy.
( ρ C p ) n f = ( 1 ϕ ) ( ρ C p ) f + ϕ ( ρ C p ) p
where Cp denotes the specific heat capacity [J/(kg·K)], and the subscripts nf, f, and p refer to the volumetric heat capacity of the nanofluid, base fluid, and nanoparticles, respectively [J/(m3·K)], while ϕ represents the volumetric fraction [–].
The dynamic viscosity of the nanofluid is determined using the following relation:
μ n f   = ( 1 + 7.3 ϕ + 123 ϕ 2 )   μ w
where μ n f   is the dynamic viscosity of the nanofluid [Pa·s], μ w is the dynamic viscosity of the base fluid [Pa·s], and ϕ is the volumetric fraction [–].
The thermal conductivity of the nanofluid was evaluated using the model proposed by Yu and Choi [27]. Although more recent correlations for Al2O3/water nanofluids are available, the age of a model does not necessarily invalidate its applicability when it remains physically consistent and is used as an established baseline approach. In the present study, this model was adopted because it provides a simple and consistent formulation for estimating the effective thermal conductivity of the nanofluid. Since the objective of the work is mainly comparative, focusing on the influence of coolant type and volumetric flow rate on transient cooling behavior, the same thermophysical-property model was applied consistently to all nanofluid cases. Nevertheless, it is acknowledged that the selected thermal conductivity correlation may influence the absolute cooling-time values. Therefore, future work should include a sensitivity analysis using more recent correlations specifically developed for Al2O3/water nanofluids.
k n f = k f k p + 2 k f 2 ϕ ( k f k p )   k p + 2 k f + ϕ ( k f k p )
where knf, kf, and kp denote the thermal conductivities of the nanofluid, base fluid, and nanoparticles, respectively [W/(m·K)].
The calculated values of the nanofluid thermophysical properties for a concentration of 4% are presented in Table 5, highlighting the increase in thermal conductivity and viscosity compared to pure water, which directly influence the performance of the cooling process.
The adopted numerical model is based on simplifying assumptions. The thermophysical properties are considered constant, while radiation effects and heat losses to the external environment are neglected. This assumption was adopted in order to isolate the influence of coolant type and volumetric flow rate on the transient cooling behavior under controlled numerical conditions. However, radiative heat losses may be significant under real outdoor operating conditions. For liquid-based hybrid photovoltaic/thermal collectors, Barbu et al. [28] considered the radiative heat loss coefficient using the Stefan–Boltzmann constant and surface emissivity, highlighting the relevance of radiative exchange in PV/T thermal modeling. Therefore, the omission of radiative exchange represents a limitation of the present model, and the results should be interpreted as comparative numerical indicators rather than fully predictive outdoor performance values. The analysis is carried out exclusively numerically, without experimental validation. These assumptions allow the influence of the main parameters to be highlighted, but may lead to deviations from the actual system behavior.

3. Results

The analysis of the numerical results was carried out to highlight the thermal behavior of the photovoltaic panel under transient conditions, depending on the type of cooling fluid used and the operating parameters. In this context, the time evolution of the temperature was examined, along with the duration required to reach relevant thermal thresholds, defined by the approach of the system temperature to the inlet temperature of the heat exchanger.
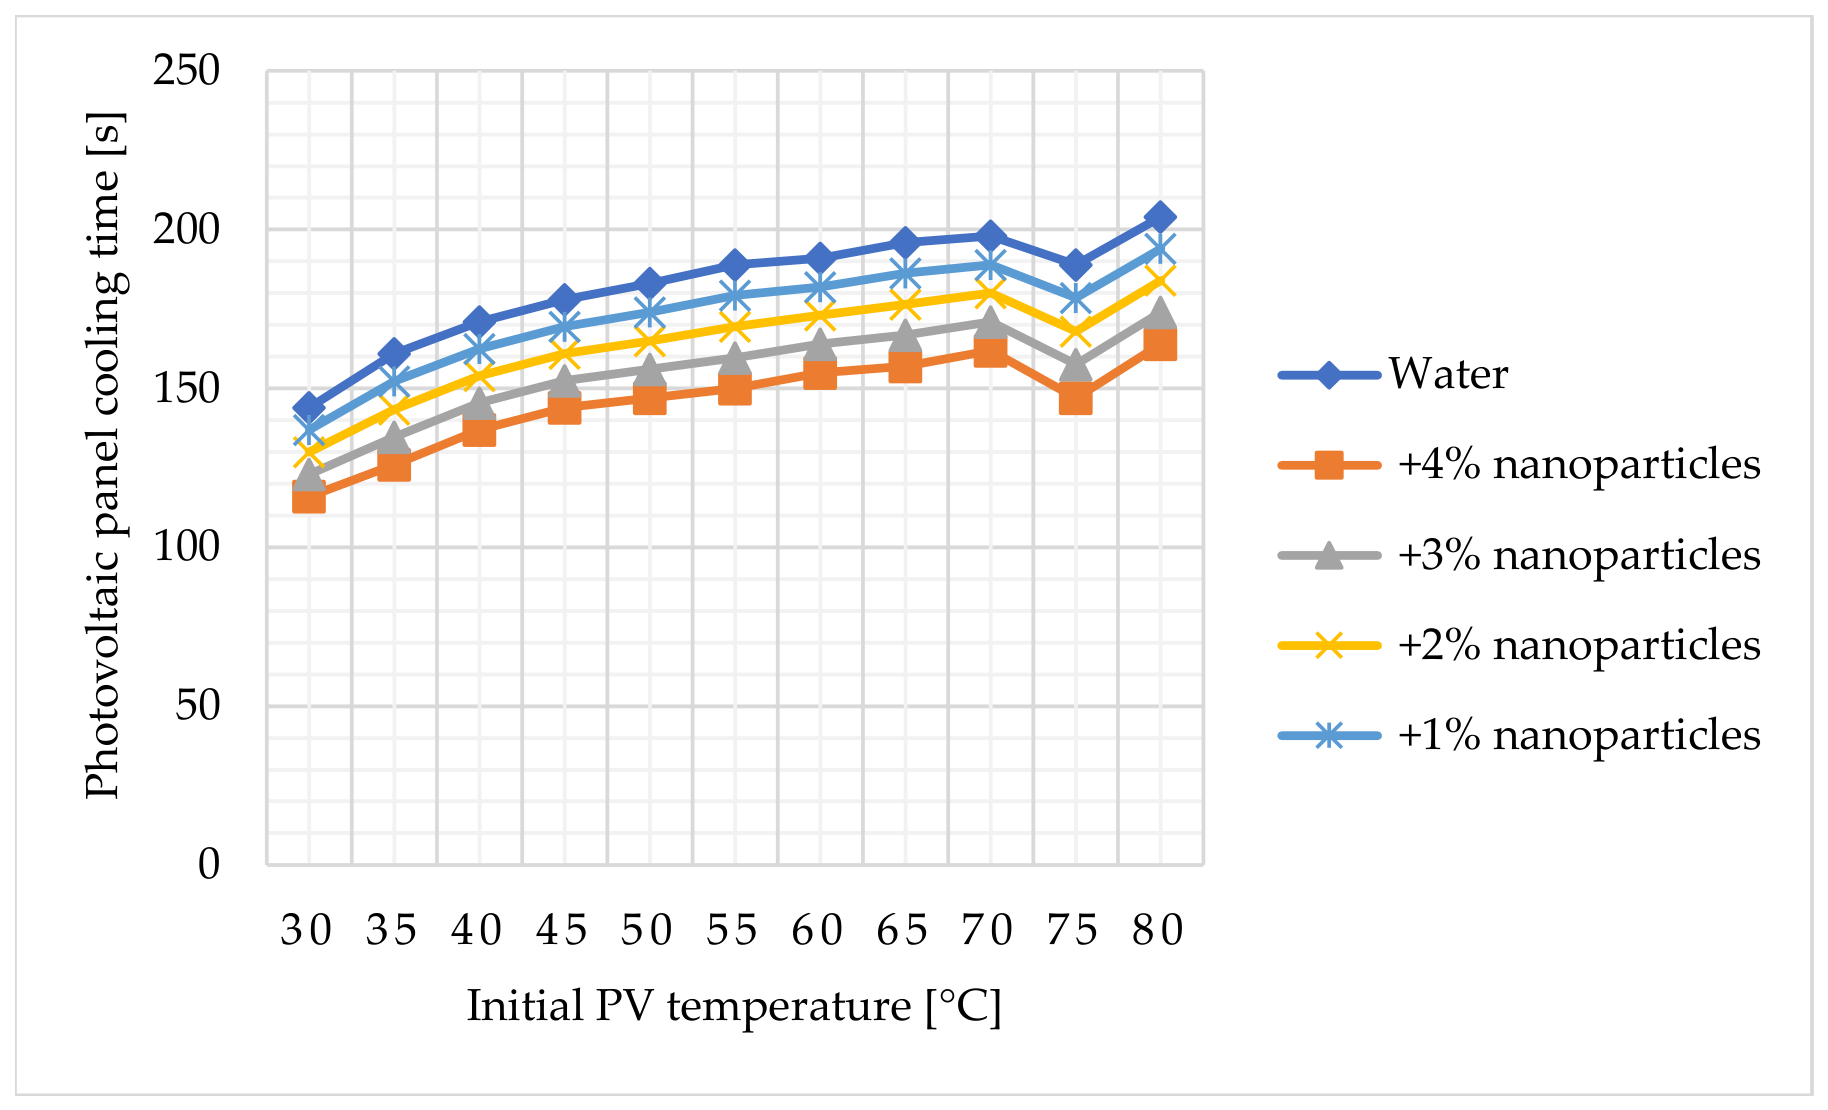
A comparative analysis of the cooling time as a function of nanofluid concentration is presented in Figure 9.
The results indicate a systematic reduction in cooling time with increasing nanoparticle concentration under the low-flow condition considered in Figure 9. At the lowest analyzed flow rate of 0.05 m3/h, the use of the Al2O3 nanofluid leads to improved performance compared to water, with the differences becoming more pronounced at higher initial temperatures. However, this concentration-dependent behavior should not be generalized to all flow rates without additional comparison.
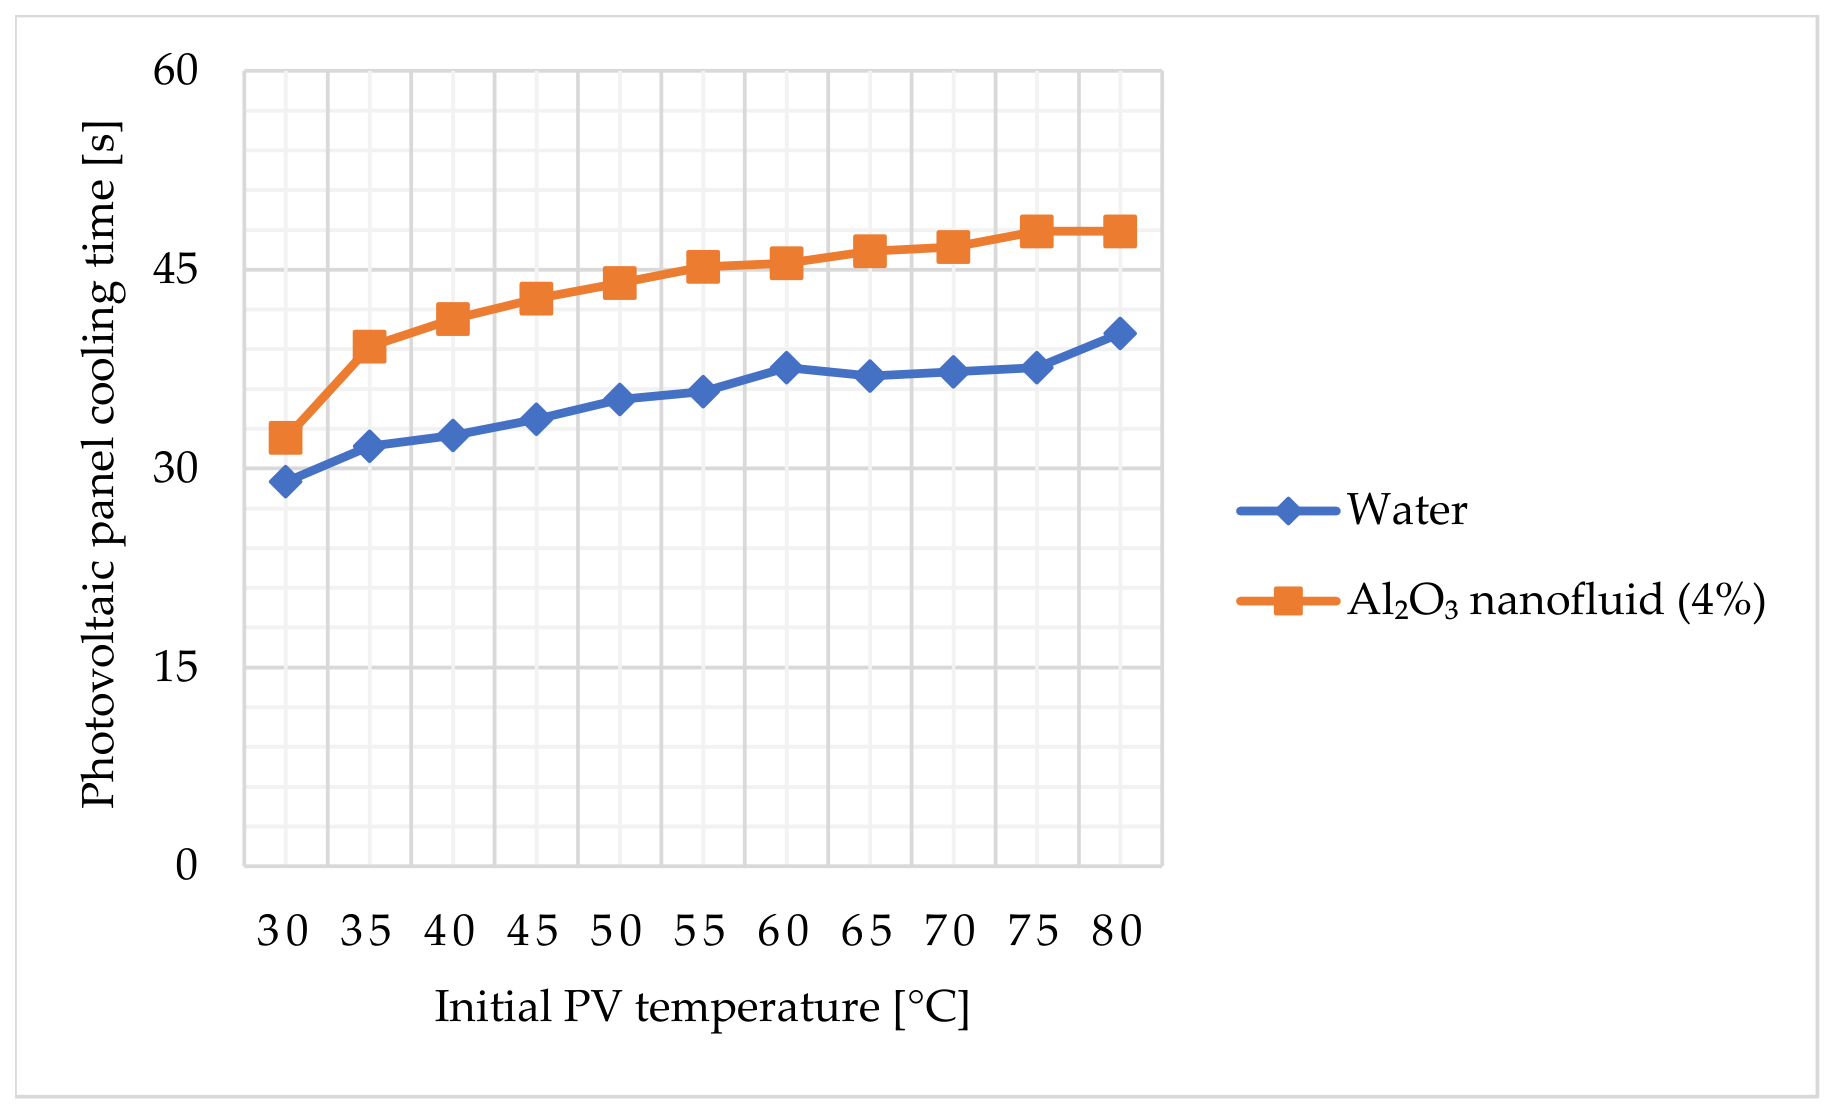
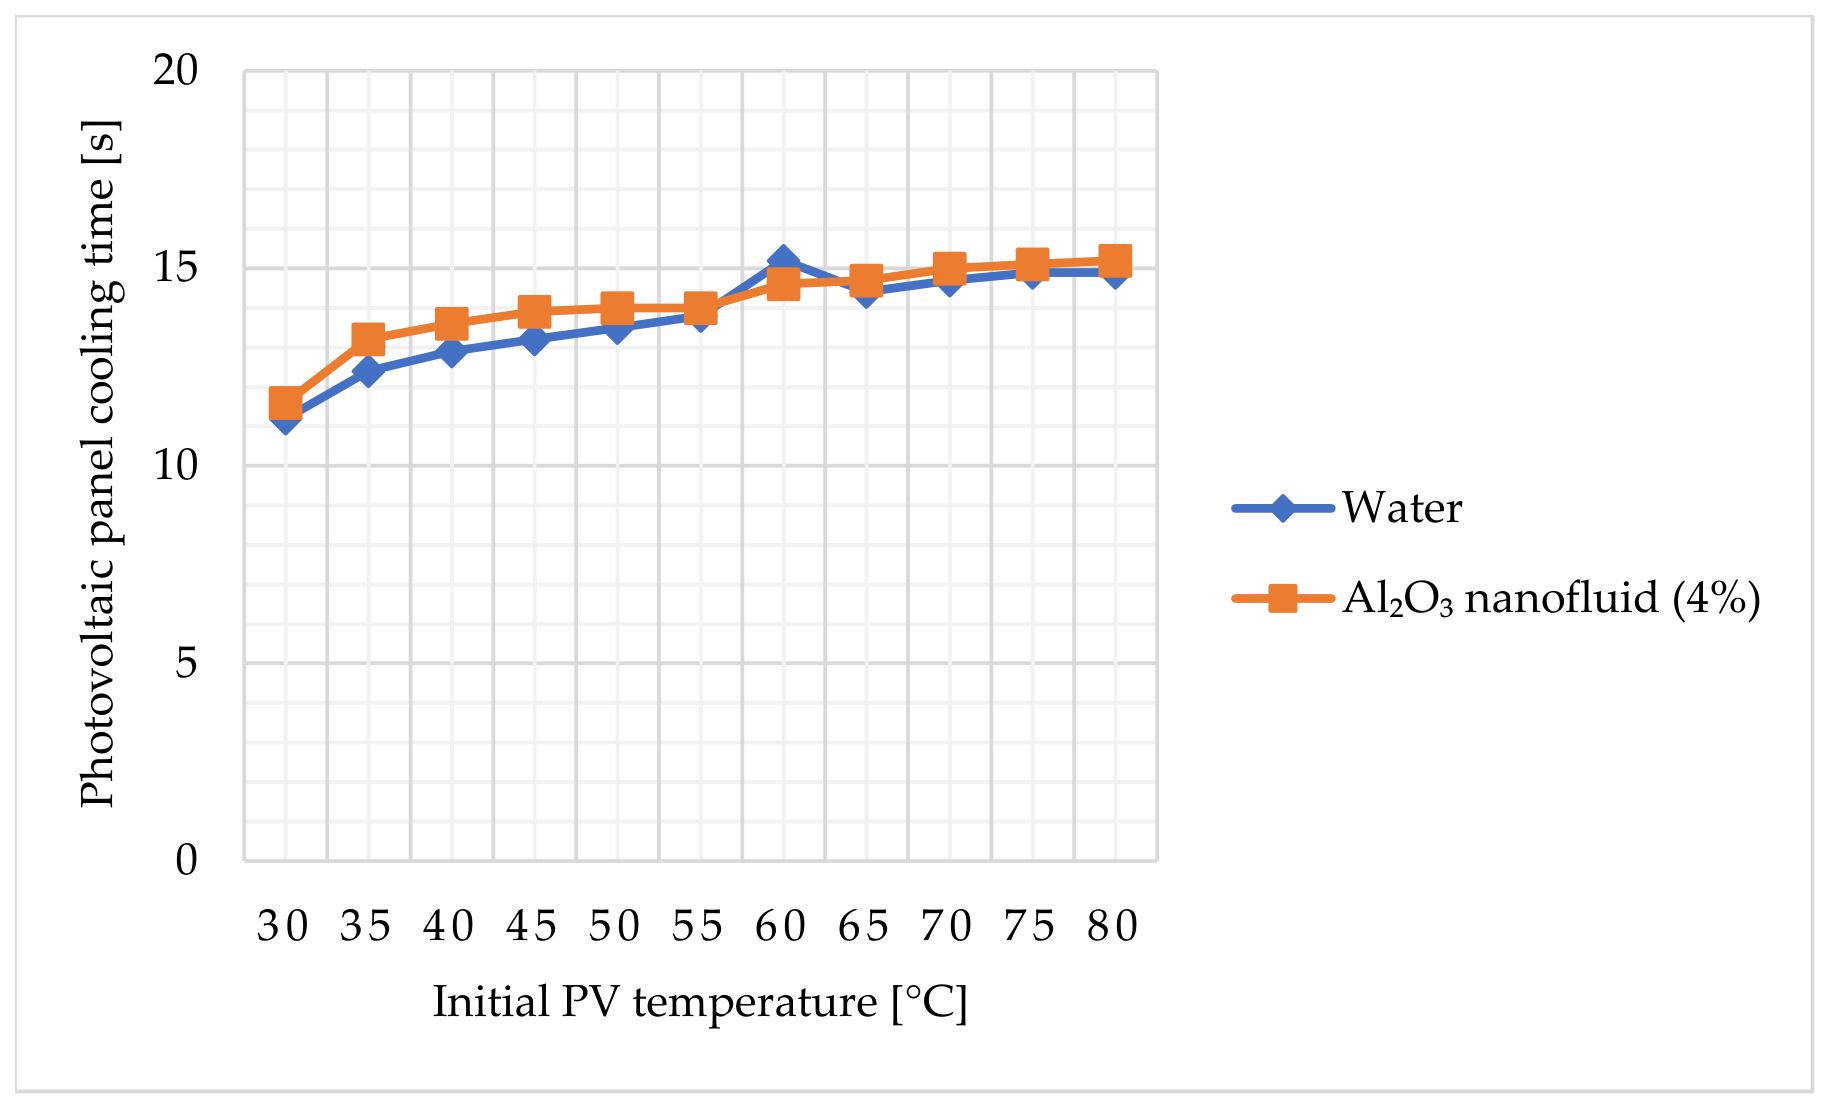
To further address the influence of flow rate, additional comparisons were performed between water and the selected Al2O3 nanofluid concentration of 4% at Q = 0.20 m3/h and Q = 0.50 m3/h, while keeping the inlet fluid temperature at 10 °C for consistency with the concentration-screening analysis. These comparisons are shown in Figure 10 and Figure 11.
The additional comparisons show that the cooling-time advantage of the Al2O3 nanofluid is most pronounced at the lowest analyzed flow rate. At Q = 0.20 m3/h, water provides shorter cooling times than the Al2O3 nanofluid (4%) over the analyzed range of initial PV temperatures. At Q = 0.50 m3/h, the differences between water and the nanofluid become very small, with some cases showing similar or slightly better performance for water. Therefore, the beneficial effect observed at Q = 0.05 m3/h should not be generalized to all flow-rate conditions.
It should be emphasized that the improvement obtained with the Al2O3 nanofluid is not observed over the entire investigated laminar and transitional flow-rate range. The reduction in cooling time is mainly associated with the lowest analyzed flow rate, Q = 0.05 m3/h. For other flow rates within the investigated range, including Q = 0.1 m3/h, the numerical results reported in Appendix A show cases in which water leads to shorter cooling times than the nanofluid. This indicates that the use of the nanofluid is beneficial only under specific operating conditions and should not be generalized to all analyzed cases.
The temperature of the heat transfer fluid was assumed to be 10 °C, corresponding to a favorable cooling regime, used to highlight the differences between the analyzed cases. This approach allows a comparative evaluation of the influence of nanofluid concentration and flow rate on thermal performance.
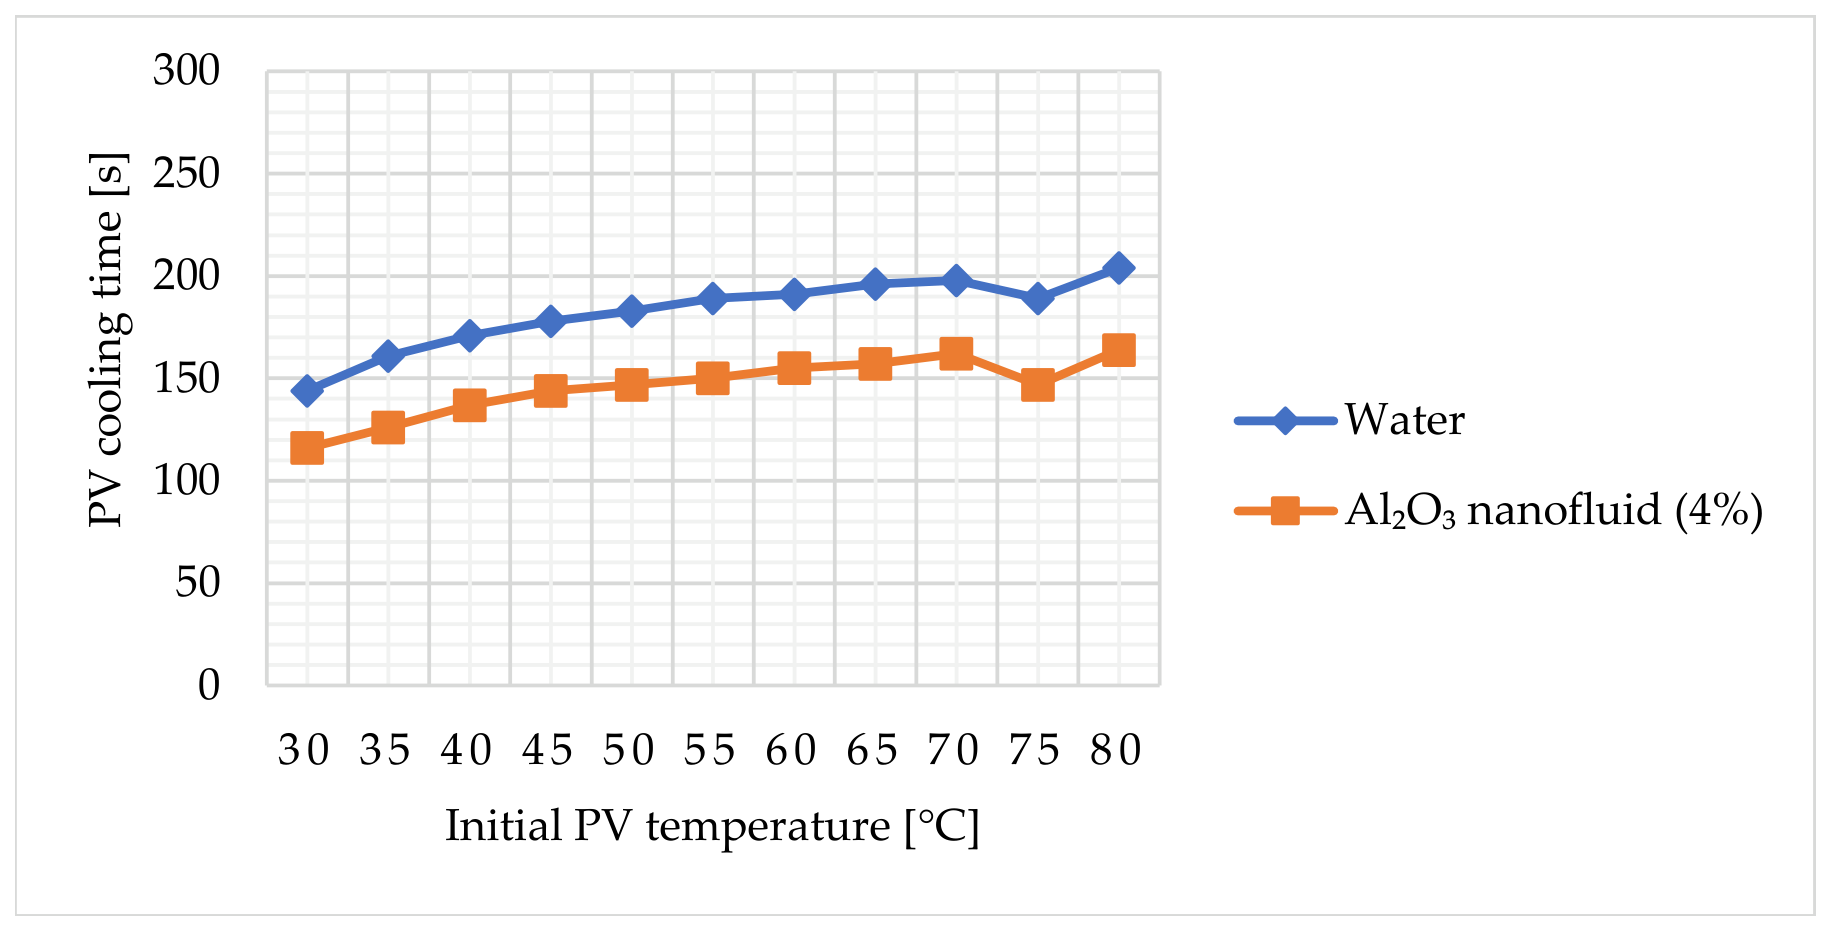
It can be observed that, for an Al2O3 concentration of 4%, the lowest cooling times are obtained, ranging between 116 s and 164 s, depending on the initial panel temperature. By comparison, when water is used, the cooling time ranges between 144 s and 204 s.
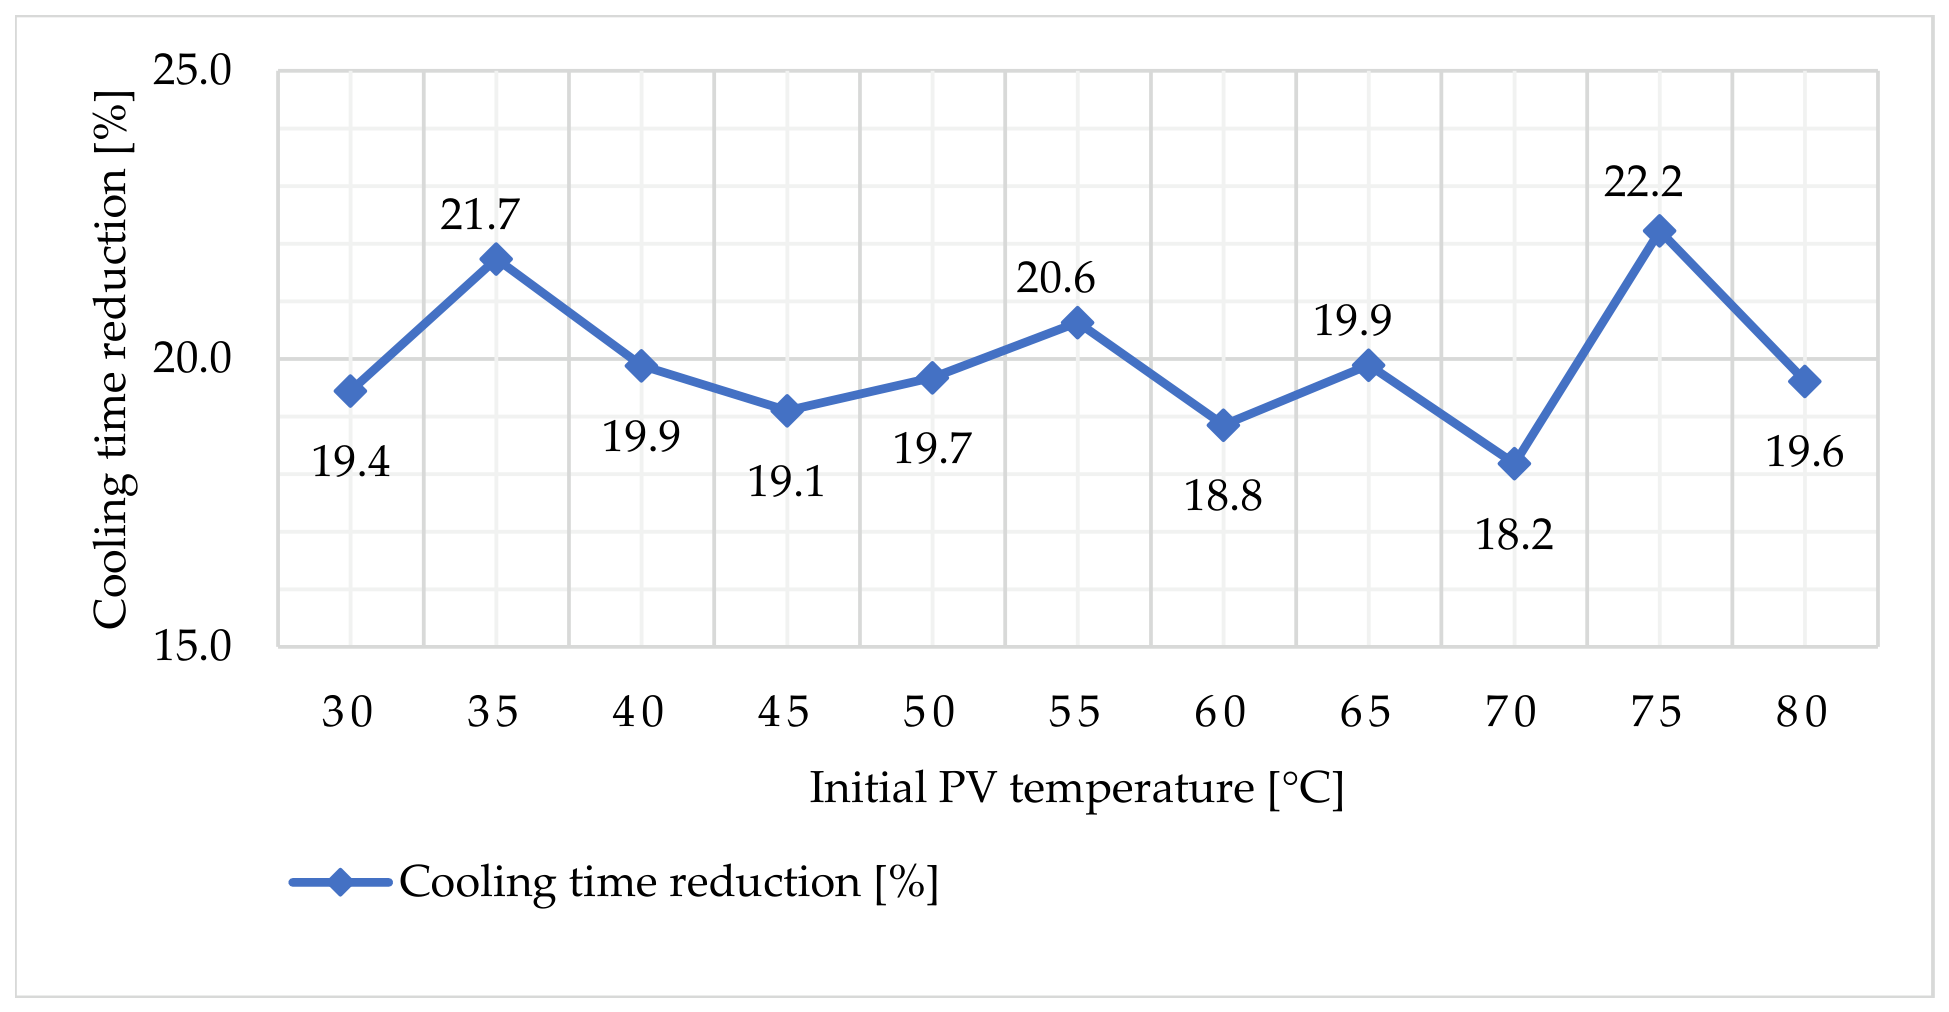
To more clearly highlight the advantage of using the nanofluid under low flow rate conditions, Figure 12 presents the percentage reduction in cooling time for the Al2O3 nanofluid at a concentration of 4%, relative to the case of water, for a flow rate of 0.05 m3/h.
The results indicate an almost constant reduction in cooling time, in the range of 18–22%, for all analyzed initial temperatures.
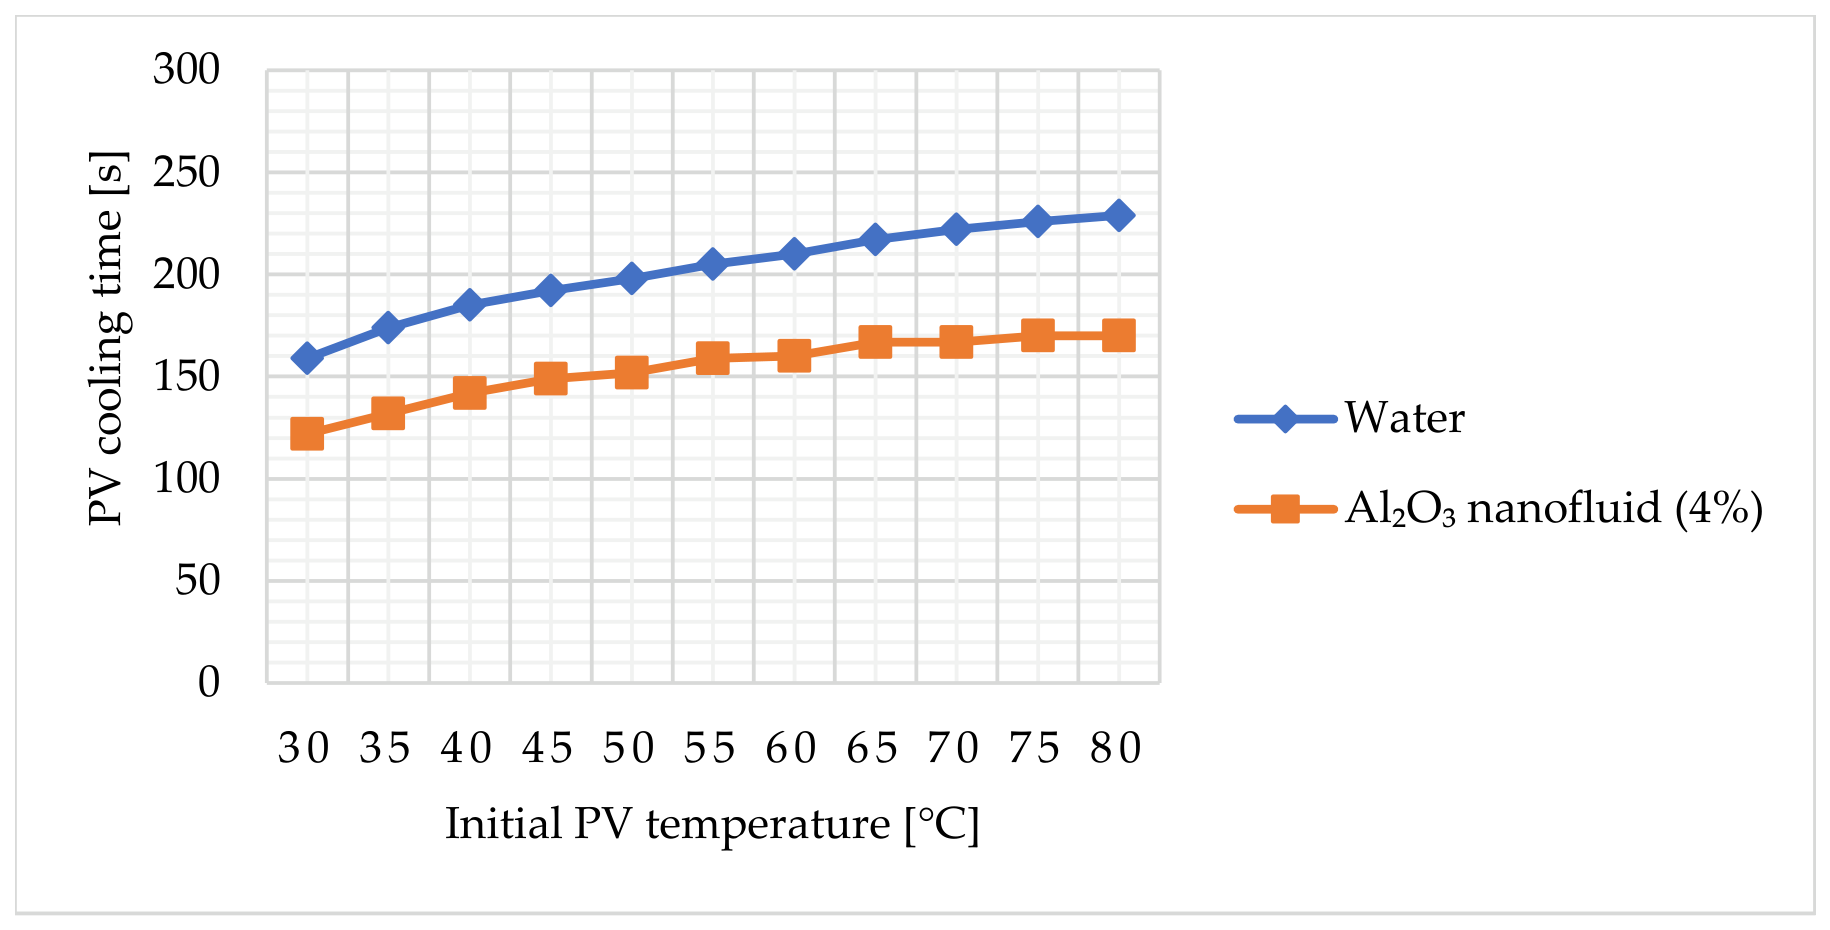
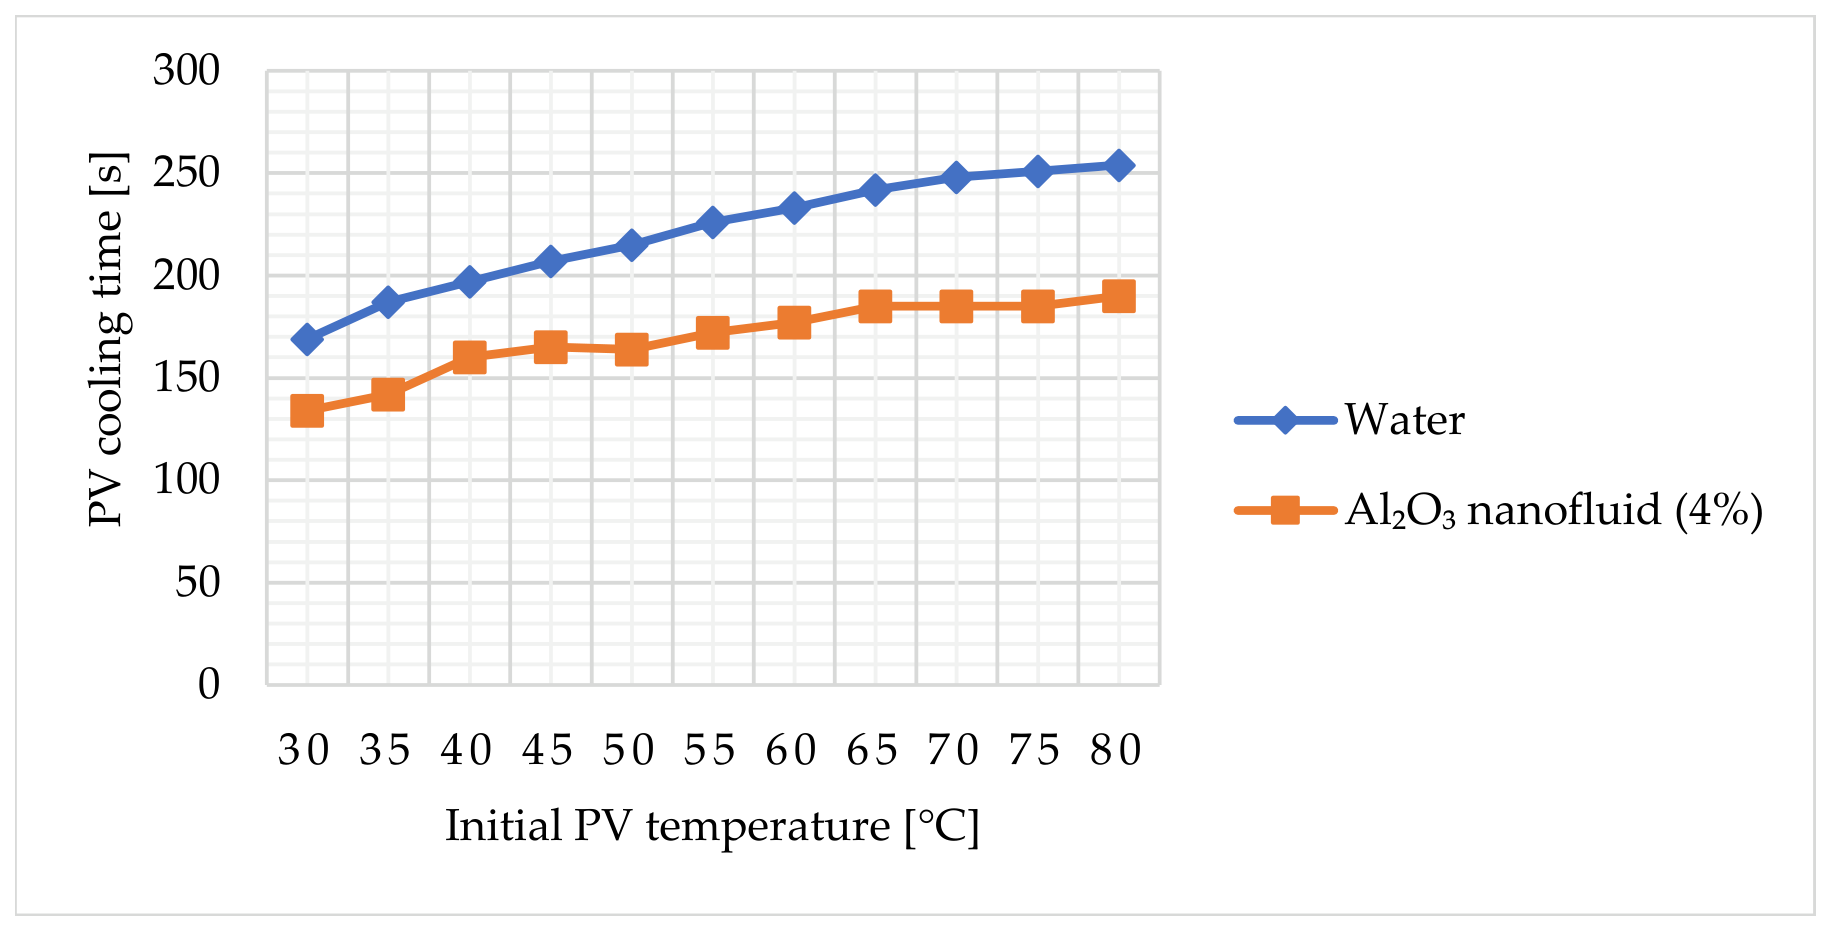
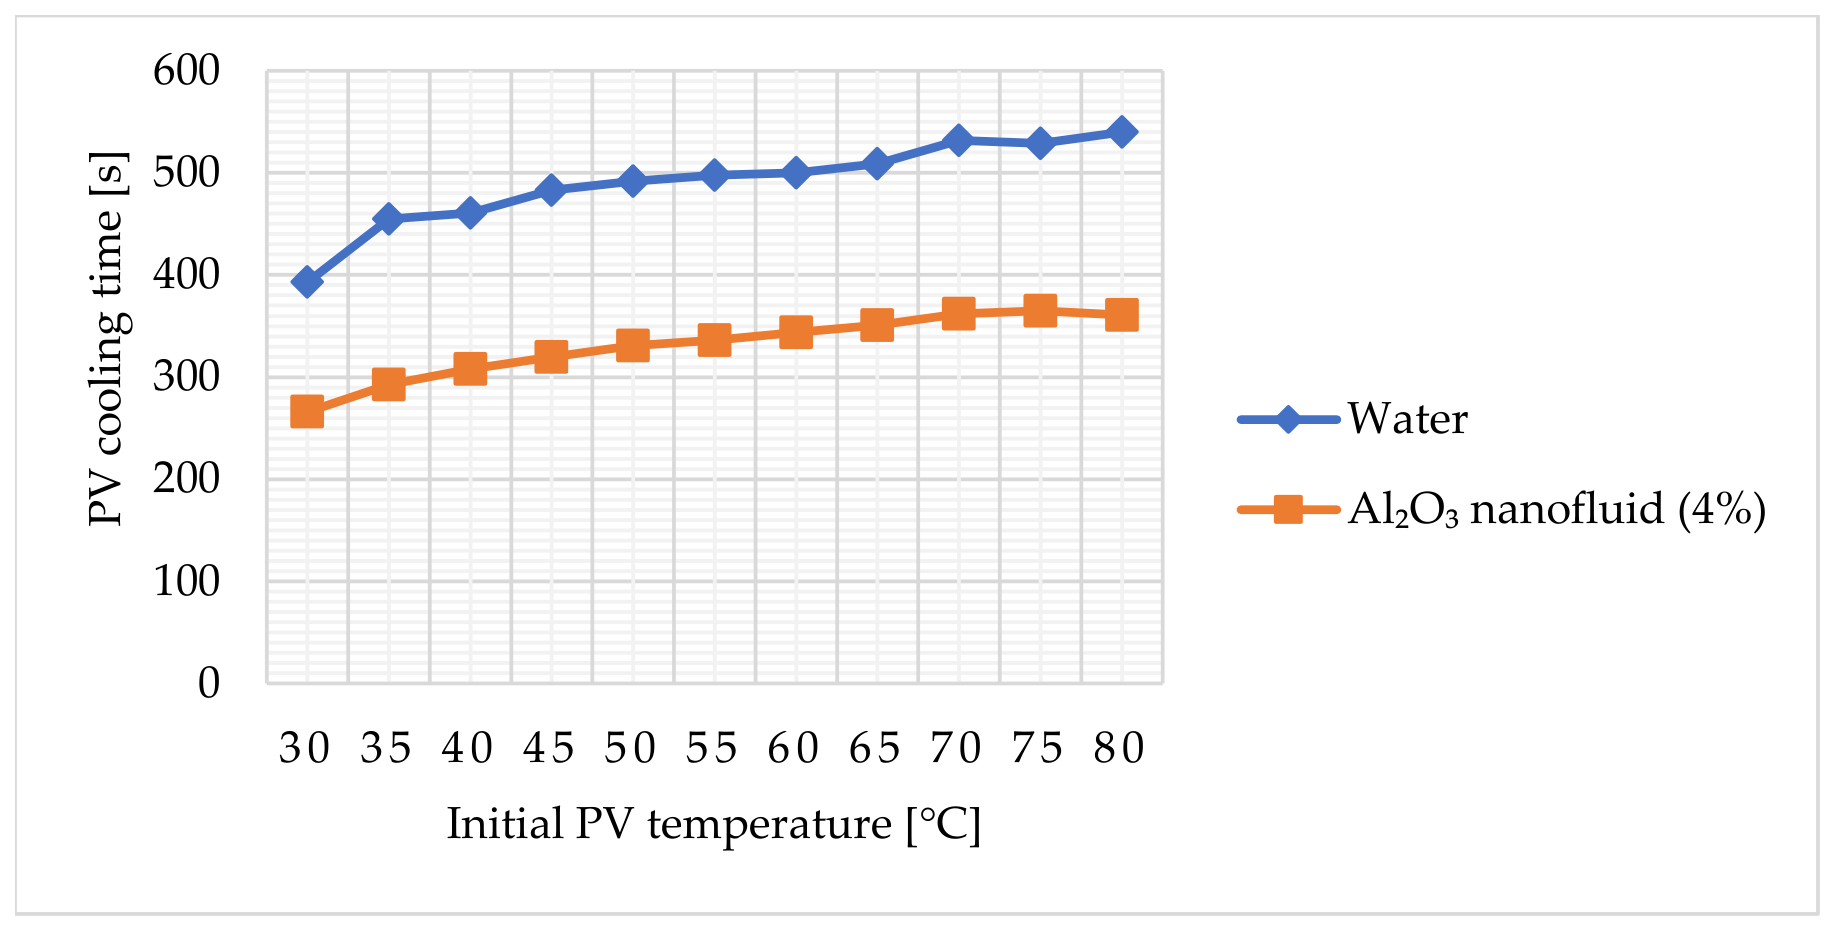
To further evaluate the influence of the inlet fluid temperature under low-flow conditions, Figure 13, Figure 14, Figure 15 and Figure 16 compare the cooling time obtained with water and the Al2O3 nanofluid (4%) at a volumetric flow rate of 0.05 m3/h for inlet fluid temperatures of 10 °C, 15 °C, 20 °C, and 25 °C.
The results show that the Al2O3 nanofluid maintains a lower cooling time than water for all analyzed inlet fluid temperatures at the low flow rate of 0.05 m3/h. However, the absolute cooling time increases as the inlet fluid temperature increases, with the most pronounced increase observed at 25 °C. This confirms that the 10 °C case represents a favorable cooling condition, while the additional 15–25 °C cases provide a more realistic assessment of the cooling performance under warmer inlet-fluid conditions.
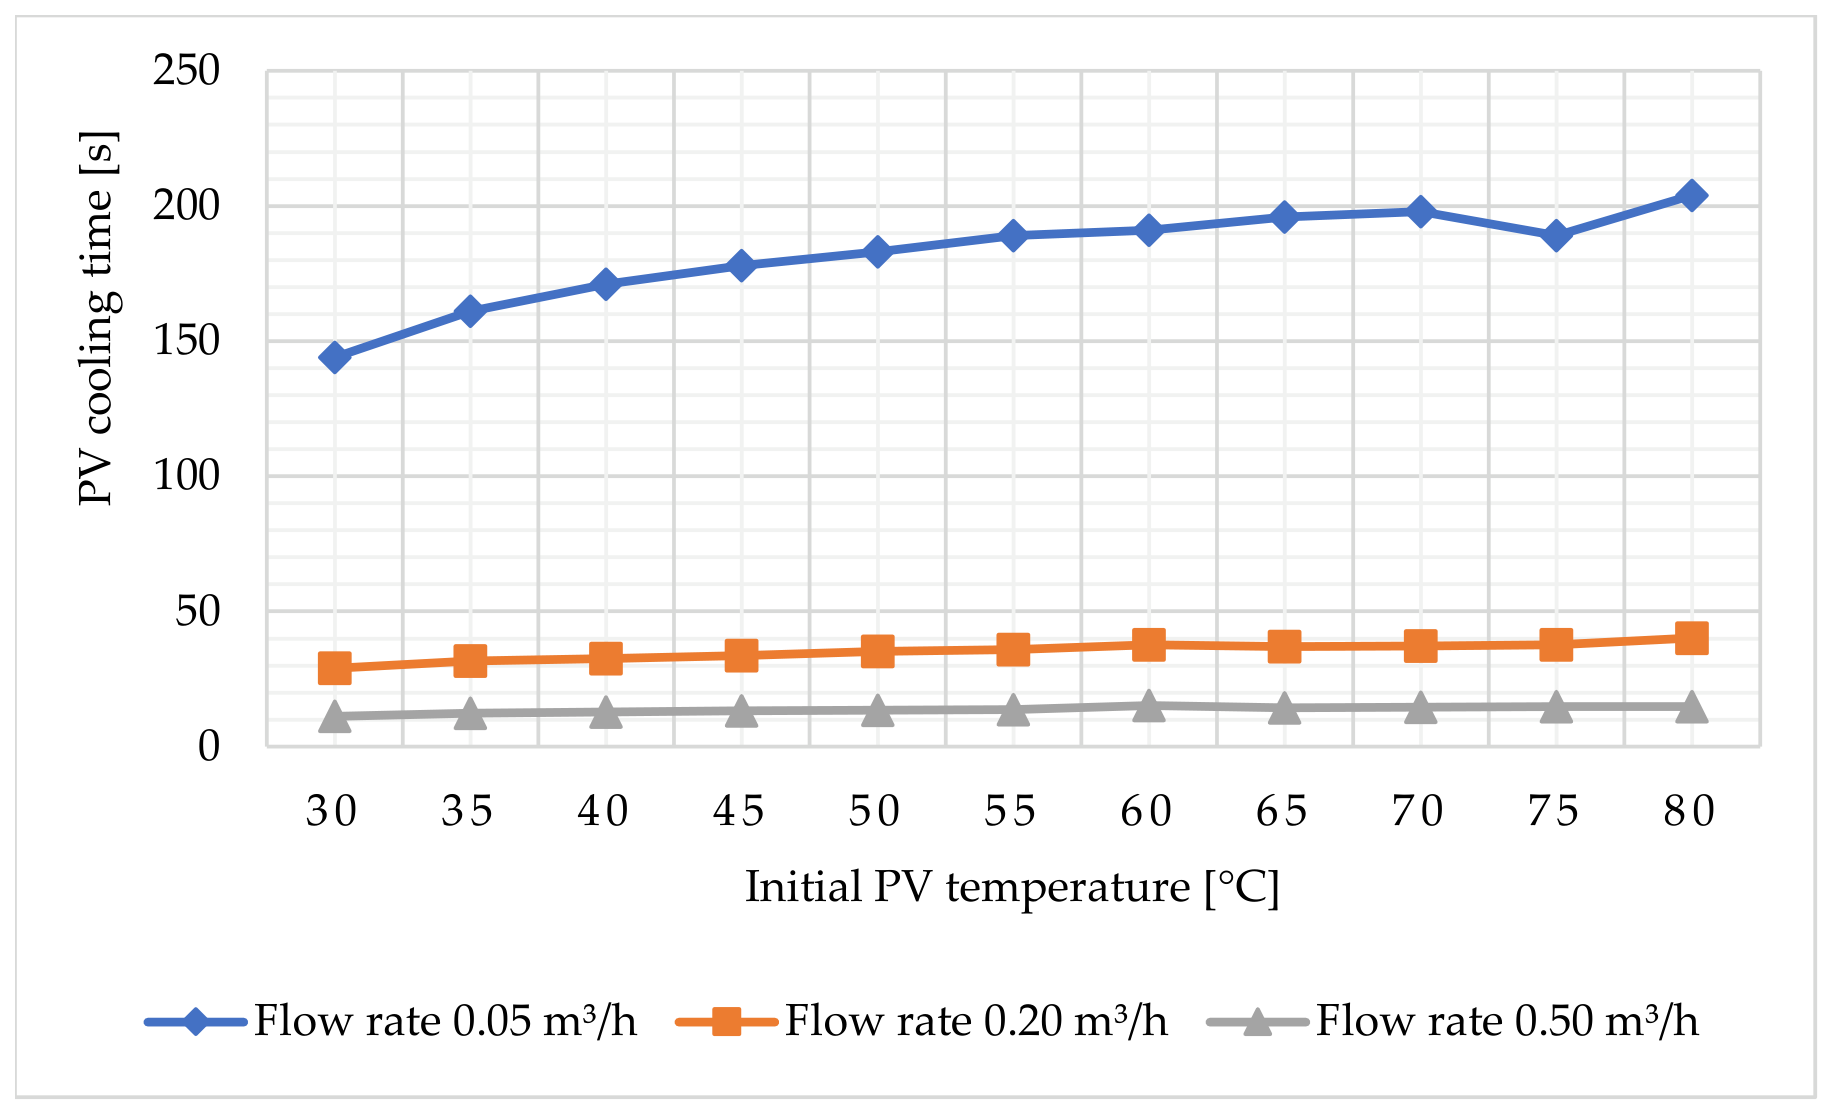
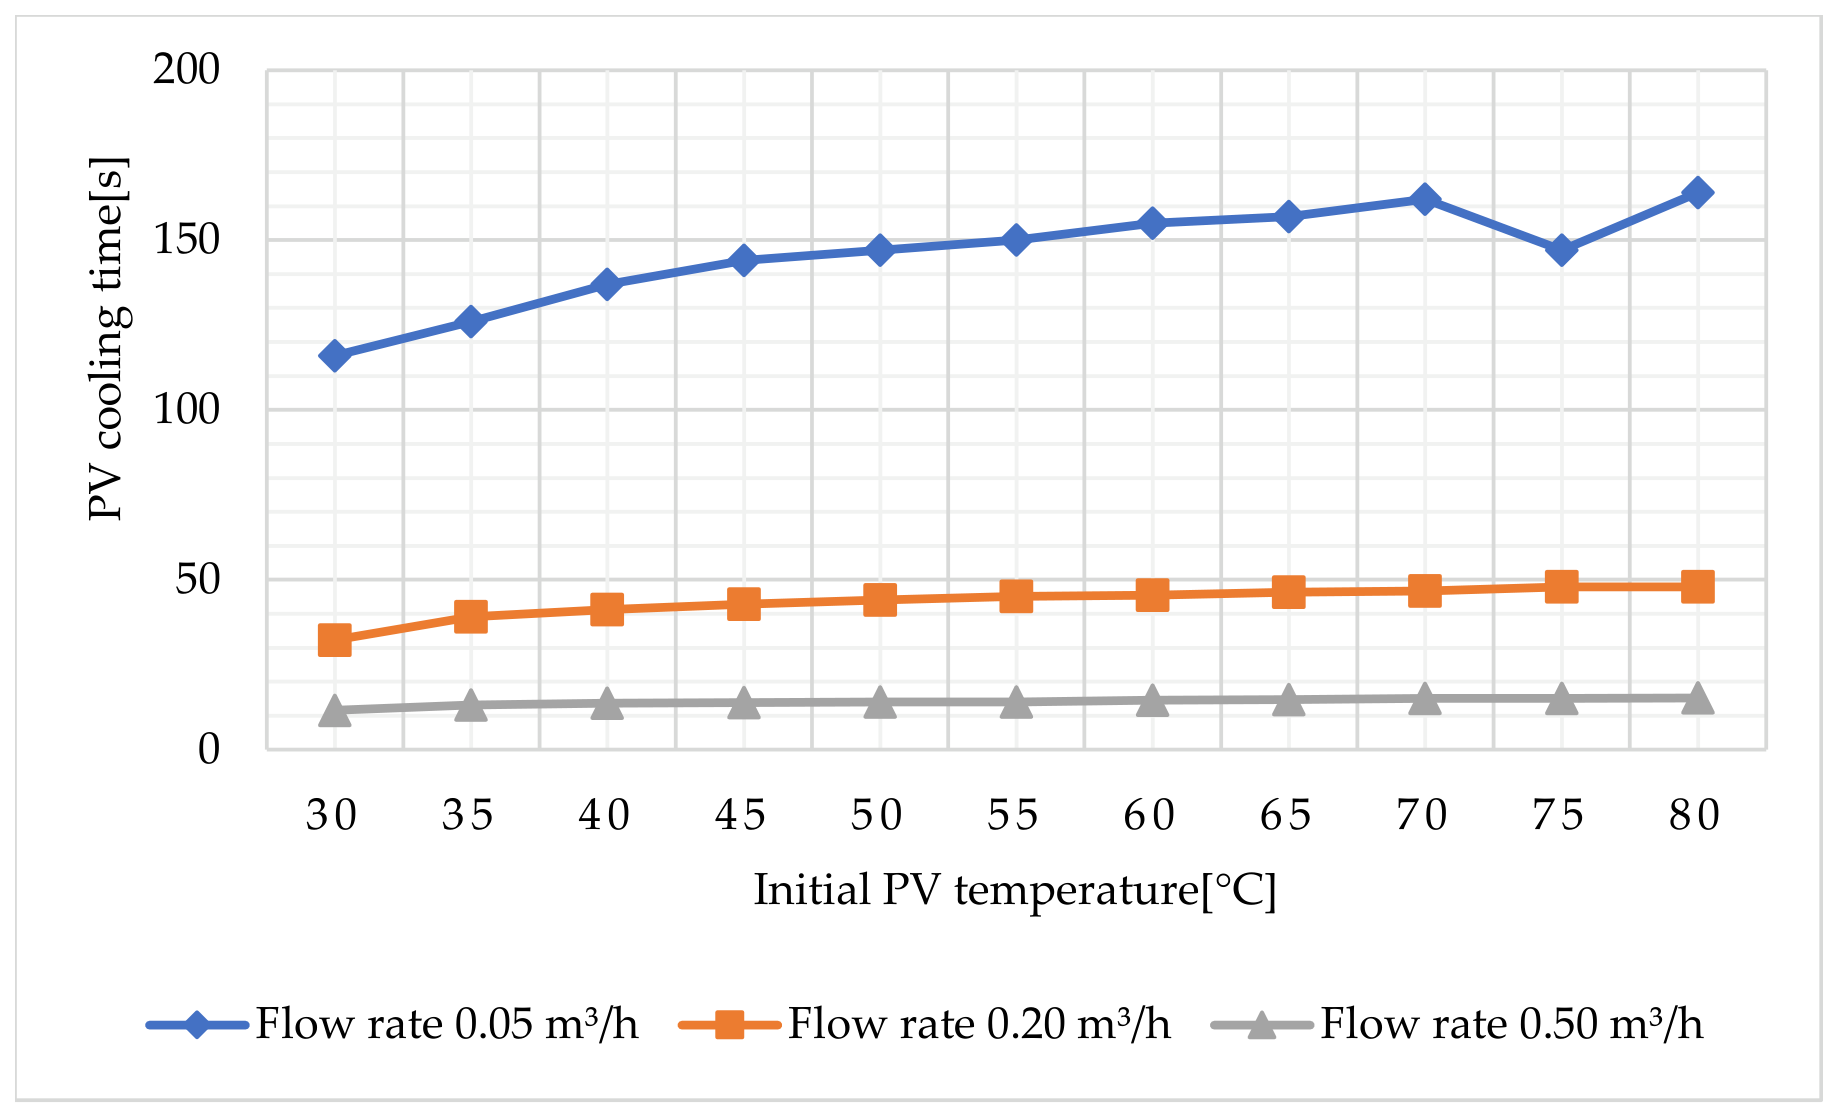
The analysis of the influence of the cooling fluid flow rate on the cooling time of the photovoltaic panel is presented in Figure 17 and Figure 18, for the cases of water and the Al2O3-based nanofluid, respectively, at a constant heat transfer fluid temperature of 10 °C.
Figure 17 highlights the variation in cooling time as a function of the initial panel temperature, for different flow rate values (0.05 m3/h, 0.20 m3/h, and 0.50 m3/h), in the case of water used as the cooling fluid. It can be observed that, for all analyzed temperatures, increasing the flow rate leads to a reduction in cooling time. The differences between flow rates are significant within the analyzed range, particularly between 0.05 m3/h and 0.20 m3/h, where the decrease in cooling time is more pronounced.
Figure 18 presents the same analysis for the Al2O3 nanofluid at a concentration of 4%. The comparative analysis of the results shows that the advantage of using the Al2O3 nanofluid depends on the cooling fluid flow rate. At a low flow rate of 0.05 m3/h, the nanofluid leads to a significant reduction in cooling time compared to water. In contrast, for moderate flow rates within the investigated range (0.2 m3/h and 0.5 m3/h), the differences between the two fluids decrease, and in some cases, water exhibits lower cooling times (according to Appendix A). This behavior indicates that the enhancement of heat transfer through the use of the nanofluid is more pronounced in flow regimes characterized by lower convective intensity.
The reduction in cooling time indirectly contributes to the improvement of the electrical performance of the photovoltaic panel, given its direct dependence on operating temperature [3].
The comparison of the two figures shows that the influence of flow rate is more pronounced in the low flow-rate range, while at moderate flow rates within the investigated range, the differences become less significant. This trend is consistent with experimental results reported for water, where increasing the flow rate from 128.4 L/h (0.1284 m3/h) to 219.6 L/h (0.2196 m3/h) leads to a significant improvement in thermal performance, whereas a further increase up to 813.6 L/h (0.8136 m3/h) does not result in substantial changes in the cooling effect but involves higher pump energy consumption [9].
Although a detailed pumping power analysis was not included in the present numerical model, the energy required to circulate the cooling fluid must be considered when interpreting the effect of flow rate. Increasing the volumetric flow rate improves the cooling process by enhancing convective heat transfer; however, this improvement is accompanied by higher pumping energy demand. Therefore, the reduction in cooling time at moderate flow rates does not necessarily imply a proportional improvement in net energy performance. From this perspective, the most favorable operating range should be regarded as a compromise between thermal improvement and the additional energy required for fluid circulation. A complete evaluation of pumping power, including pressure drop, pump efficiency, and net electrical gain, is recommended for future work.
In the case of the nanofluid, the obtained results indicate a similar overall trend, but they do not confirm the same favorable flow-rate value reported in the cited study. Thus, although increasing the flow rate enhances the cooling process within the laminar and near-transitional range, the advantage of using the nanofluid diminishes or even disappears at moderate flow-rate values, suggesting the existence of an operating threshold beyond which further increases in flow rate are no longer justified from a thermal efficiency standpoint.
To ensure traceability of the results and enable detailed analysis, the complete values obtained from the numerical simulations are presented in Appendix A. These include the time evolution of temperature for each analyzed case, corresponding to different initial temperatures, flow rates, and types of cooling fluid (water and Al2O3 nanofluid at 4%).
The observed behavior can be explained by the dominant heat transfer mechanisms. At low flow rates, the conductive contribution is more significant, and the increased thermal conductivity of the nanofluid leads to an improvement in the cooling process.
As the flow rate increases within the laminar and near-transitional range, heat transfer becomes dominated by convection, and fluid velocity becomes the main factor. Under these conditions, the differences between the thermophysical properties of water and the nanofluid have a reduced influence, which explains the diminishing advantage of the nanofluid at moderate flow rates.
The results indicate the existence of an operating range in which increasing the flow rate leads to a significant reduction in cooling time, followed by a region where further variations become limited. This behavior is governed by the balance between the enhancement of convective heat transfer and the diminishing marginal effect of flow rate on the cooling process.

4. Discussion on the Positioning of the Study

To highlight the context of the obtained results, a comparative analysis of relevant studies investigating the use of nanofluids in cooling photovoltaic systems was conducted. These studies include both experimental and numerical approaches and examine the influence of flow parameters on thermal and electrical performance.
It should be noted that the comparison presented in Table 6 is intended only to place the present numerical results in the context of previously published photovoltaic cooling studies. The studies included in the table differ in terms of cooling configuration, working fluid, operating conditions, evaluation criteria, and whether the results were obtained experimentally or numerically. Therefore, this comparison should not be interpreted as a direct validation of the present numerical model. Instead, it provides a qualitative literature-based context for assessing whether the magnitude and trends of the obtained cooling performance are consistent with the range of improvements reported in previous PV/T cooling studies. Experimental validation of the proposed configuration remains necessary in future work.
The analyzed studies consistently indicate that the use of nanofluids leads to a reduction in photovoltaic panel temperature and an improvement in energy performance; however, the influence of flow parameters is not addressed uniformly.
In this context, the present study explicitly highlights the influence of volumetric flow rate on cooling efficiency under transient conditions, an aspect that is less thoroughly addressed in existing studies.
At the same time, it is observed that the performance of cooling systems does not depend exclusively on the type of fluid used, but also on the operating conditions. In particular, flow parameters such as volumetric or mass flow rate play a key role in determining heat transfer efficiency. In both numerical and experimental studies, these parameters are identified as determining factors in the evolution of temperature and system performance.
The obtained results indicate that the advantage of using the Al2O3 nanofluid is dependent on the cooling fluid flow rate and is maximized under flow regimes characterized by low flow rates. This behavior highlights the need to correlate fluid properties with operating parameters in order to optimize the thermal performance of photovoltaic systems.
The results can also be used in the design of cooling systems for photovoltaic panels, particularly in PV/T configurations. The selection of the cooling fluid flow rate directly influences thermal performance, and its correlation with fluid properties enables the identification of energy-efficient operating regimes.
The obtained results should be interpreted within the revised scope of the numerical model. The main analysis was restricted to the laminar and transitional flow-rate range, while flow rates corresponding to turbulent conditions were excluded. Therefore, the conclusions of the present study apply only to the investigated laminar and transitional operating range. A complete assessment of flow rates corresponding to turbulent conditions would require the use of an appropriate turbulence model and is recommended for future work.

5. Conclusions

The present study analyzed, under transient conditions, the influence of Al2O3 nanofluid usage and cooling fluid flow rate on the cooling process of photovoltaic panels, highlighting the significant role of these parameters in the thermal performance of the system.
The analysis of nanofluid concentration variation showed that its use leads to a reduction in cooling time compared to water under flow regimes characterized by low flow rates. For an Al2O3 concentration of 4% and a flow rate of 0.05 m3/h, a cooling time reduction of approximately 18–22% was obtained, confirming the enhancement of heat transfer relative to the base fluid under these specific conditions. However, this advantage was not maintained for all flow rates. At moderate flow rates within the laminar and near-transitional range, the difference between water and the Al2O3 nanofluid decreased, and in some cases, water provided shorter cooling times. Therefore, the use of Al2O3 nanofluid should be considered advantageous only within a limited operating range, particularly at low flow rates.
Regarding the influence of flow rate, the results show that increasing the coolant flow rate leads to an intensification of the cooling process through enhanced convective heat transfer. However, the comparative analysis indicates that, at moderate flow rates within the laminar and near-transitional range, the advantage of using the nanofluid diminishes, may become negligible, or may even be reversed, highlighting the dependence of nanofluid performance on flow conditions. Moreover, moderate flow rates within the investigated laminar and near-transitional range would require additional pumping energy, which may reduce the net benefit of the cooling system. Therefore, the selection of the operating flow rate should consider not only the cooling time reduction but also the pumping energy required for fluid circulation.
Future developments of the study may consider extending the analysis by evaluating the influence of cooling fluid temperature, given that in the numerical model, this parameter was assumed constant, whereas in real operating conditions, particularly in a closed-loop system, the fluid temperature varies over time. Furthermore, future work should include an assessment of the overall energy performance of the system, including the pumping power required for fluid circulation, as well as experimental validation of the proposed cooling configuration. Such validation is necessary in order to assess the accuracy of the numerical predictions and to evaluate the system behavior under real operating conditions. It would also allow the influence of environmental heat losses, variable coolant temperature, contact resistance, and operational uncertainties to be quantified.

Author Contributions

Conceptualization, C.-C.B. and R.-S.L.; methodology, C.-C.B. and A.-F.C.; software, C.-C.B.; validation, C.-C.B., A.-F.C., R.-S.L. and A.B.; formal analysis, C.-C.B. and A.-F.C.; investigation, C.-C.B.; writing, original draft preparation, C.-C.B.; writing, review and editing, A.-F.C., R.-S.L. and A.B.; supervision, A.B. All authors have read and agreed to the published version of the manuscript.

Funding

This research received no external funding.

Institutional Review Board Statement

Not applicable.

Informed Consent Statement

Not applicable.

Data Availability Statement

The data presented in this study are available within the article.

Conflicts of Interest

The authors declare no conflicts of interest.

Nomenclature

The following nomenclature is used in this manuscript:
Al2O3Aluminum oxide
CFDComputational Fluid Dynamics
CPVConcentrated photovoltaic system
CPVTConcentrated photovoltaic/thermal system
PVPhotovoltaic panel
PV/TPhotovoltaic/thermal system
ACross-sectional flow area [m2]
aChannel cross-section dimension [m]
bChannel cross-section dimension [m]
CpSpecific heat capacity [J/(kg·K)]
DhHydraulic diameter [m]
kThermal conductivity [W/(m·K)]
Mass flow rate [kg/s]
QVolumetric flow rate [m3/h, m3/s]
ReReynolds number [-]
TTemperature [°C, K]
tTime or cooling time [s]
vMean fluid velocity [m/s]
ρDensity [kg/m3]
μDynamic viscosity [Pa·s]
φVolumetric fraction of nanoparticles [-]
fBase fluid
inInlet
nfNanofluid
pNanoparticles

Appendix A

Table A1. Cooling time comparison between water and Al2O3 nanofluid (4%) for an initial PV temperature of 30 °C.
PV
Temperature
[°C]
Fluid
Temperature
[°C]
Volumetric
Flow Rate
[m3/h]
Cooling
Time Water
[s]
Cooling
Time Nanofluid Al2O3 4%
[s]
Nanofluid Performance
[%]
30100.05144.0116.0↑ 19.4
30150.05159.0122.0↑ 23.3
30200.05169.0134.0↑ 20.7
30250.05393.0266.0↑ 32.3
30100.142.973.6↓ 71.6
30150.144.561.0↓ 37.1
30200.181.789.2↓ 9.2
30250.1143.0146.0↓ 2.1
30100.229.032.3↓ 11.4
30150.231.433.8↓ 7.6
30200.222.836.8↓ 61.4
30250.261.568.8↓ 11.9
30100.319.819.3↑ 2.5
30150.320.020.1↓ 0.5
30200.321.822.5↓ 3.2
30250.340.964.2↓ 57.0
30100.413.914.6↓ 5.0
30150.414.215.1↓ 6.3
30200.415.716.8↓ 7.0
30250.429.630.7↓ 3.7
30100.511.211.6↓ 3.6
30150.511.412.4↓ 8.8
30200.512.813.0↓ 1.6
30250.525.024.8↑ 0.8
↑ better cooling performance of the nanofluid; ↓ lower cooling performance.
Table A2. Cooling time comparison between water and Al2O3 nanofluid (4%) for an initial PV temperature of 35 °C.
PV
Temperature
[°C]
Fluid
Temperature
[°C]
Volumetric
Flow Rate
[m3/h]
Cooling
Time Water
[s]
Cooling
Time Nanofluid Al2O3 4%
[s]
Nanofluid Performance
[%]
35100.05161.0126.00↑ 21.7
35150.05174.0132.00↑ 24.1
35200.05187.0142.00↑ 24.1
35250.05455.0293.00↑ 35.6
35100.146.174.20↓ 61.0
35150.147.269.30↓ 46.8
35200.188.898.20↓ 10.6
35250.1159.0161.00↓ 1.3
35100.231.739.20↓ 23.7
35150.233.141.00↓ 23.9
35200.224.441.60↓ 70.5
35250.269.577.80↓ 11.9
35100.323.421.10↑ 9.8
35150.322.422.30↑ 0.4
35200.323.623.80↓ 0.8
35250.344.972.20↓ 60.8
35100.414.615.70↓ 7.5
35150.415.816.60↓ 5.1
35200.417.317.50↓ 1.2
35250.433.634.50↓ 2.7
35100.512.413.20↓ 6.5
35150.512.913.60↓ 5.4
35200.513.614.00↓ 2.9
35250.528.027.40↑ 2.1
↑ better cooling performance of the nanofluid; ↓ lower cooling performance.
Table A3. Cooling time comparison between water and Al2O3 nanofluid (4%) for an initial PV temperature of 40 °C.
PV
Temperature
[°C]
Fluid
Temperature
[°C]
Volumetric
Flow Rate
[m3/h]
Cooling
Time Water
[s]
Cooling
Time Nanofluid Al2O3 4%
[s]
Nanofluid Performance
[%]
40100.05171.0137.0↑ 19.9
40150.05185.0142.0↑ 23.2
40200.05197.0160.0↑ 18.8
40250.05461.0308.0↑ 33.2
40100.168.578.7↓ 14.9
40150.150.475.1↓ 49.0
40200.193.5104.0↓ 11.2
40250.1164.0159.0↑ 3.0
40100.232.541.3↓ 27.1
40150.234.343.7↓ 27.4
40200.224.743.3↓ 75.3
40250.274.083.1↓ 12.3
40100.324.822.7↑ 8.5
40150.322.823.3↓ 2.2
40200.324.625.1↓ 2.0
40250.348.769.2↓ 42.1
40100.416.016.4↓ 2.5
40150.417.017.4↓ 2.4
40200.418.218.4↓ 1.1
40250.435.536.9↓ 3.9
40100.512.913.6↓ 5.4
40150.513.214.1↓ 6.8
40200.514.414.6↓ 1.4
40250.530.828.9↑ 6.2
↑ better cooling performance of the nanofluid; ↓ lower cooling performance.
Table A4. Cooling time comparison between water and Al2O3 nanofluid (4%) for an initial PV temperature of 45 °C.
PV
Temperature
[°C]
Fluid
Temperature
[°C]
Volumetric
Flow Rate
[m3/h]
Cooling
Time Water
[s]
Cooling
Time Nanofluid Al2O3 4%
[s]
Nanofluid Performance
[%]
45100.05178.00144.00↑ 19.1
45150.05192.00149.00↑ 22.4
45200.05207.00165.00↑ 20.3
45250.05483.00320.00↑ 33.7
45100.186.4074.40↑ 13.9
45150.151.5080.00↓ 55.3
45200.197.10108.00↓ 11.2
45250.1172.00169.00↑ 1.7
45100.233.7042.80↓ 27.0
45150.237.2044.60↓ 19.9
45200.226.8044.80↓ 67.2
45250.276.9086.70↓ 12.7
45100.326.2023.90↑ 8.8
45150.323.8024.70↓ 3.8
45200.325.4025.90↓ 2.
45250.353.1073.00↓ 37.5
45100.416.7017.50↓ 4.8
45150.417.5018.10↓ 3.4
45200.419.4019.00↑ 2.1
45250.437.0038.10↓ 3.0
45100.513.2013.90↓ 5.3
45150.513.8014.50↓ 5.1
45200.515.1015.20↓ 0.7
45250.530.6030.00↑ 2.0
↑ better cooling performance of the nanofluid; ↓ lower cooling performance.
Table A5. Cooling time comparison between water and Al2O3 nanofluid (4%) for an initial PV temperature of 50 °C.
PV
Temperature
[°C]
Fluid
Temperature
[°C]
Volumetric
Flow Rate
[m3/h]
Cooling
Time Water
[s]
Cooling
Time Nanofluid Al2O3 4%
[s]
Nanofluid Performance
[%]
50100.05183.00147.00↑ 19.7
50150.05198.00152.00↑ 23.2
50200.05215.00164.00↑ 23.7
50250.05492.00331.00↑ 32.7
50100.176.5077.90↓ 1.8
50150.153.1086.60↓ 63.1
50200.198.20112.00↓ 14.1
50250.1175.00174.00↑ 0.6
50100.235.2044.00↓ 25.0
50150.238.4046.10↓ 20.1
50200.227.6046.60↓ 68.8
50250.280.5079.60↑ 1.1
50100.326.4024.90↑ 5.7
50150.324.6025.10↓ 2.0
50200.325.8026.70↓ 3.5
50250.355.1094.80↓ 72.1
50100.417.2017.50↓ 1.7
50150.417.8023.40↓ 31.5
50200.420.6019.40↑ 5.8
50250.438.8039.30↓ 1.3
50100.513.5014.00↓ 3.7
50150.514.3014.70↓ 2.8
50200.515.6015.50↑ 0.6
50250.531.5030.80↑ 2.2
↑ better cooling performance of the nanofluid; ↓ lower cooling performance.
Table A6. Cooling time comparison between water and Al2O3 nanofluid (4%) for an initial PV temperature of 55 °C.
PV
Temperature
[°C]
Fluid
Temperature
[°C]
Volumetric
Flow Rate
[m3/h]
Cooling
Time Water
[s]
Cooling
Time Nanofluid Al2O3 4%
[s]
Nanofluid Performance
[%]
55100.05189.00150.00↑ 20.6
55150.05205.00159.00↑ 22.4
55200.05226.00172.00↑ 23.9
55250.05498.00336.00↑ 32.5
55100.171.7052.00↑ 27.5
55150.154.7090.70↓ 65.8
55200.198.80114.00↓ 15.4
55250.1212.00174.00↑ 17.9
55100.235.8045.20↓ 26.3
55150.239.3047.00↓ 19.6
55200.229.2046.90↓ 60.6
55250.280.2093.60↓ 16.7
55100.326.7025.90↑ 3.0
55150.324.6025.70↓ 4.5
55200.326.6027.10↓ 1.9
55250.353.5083.50↓ 56.1
55100.417.5017.80↓ 1.7
55150.418.2019.00↓ 4.4
55200.421.0020.00↑ 4.8
55250.439.0040.80↓ 4.6
55100.513.8014.00↓ 1.4
55150.514.7014.80↓ 0.7
55200.516.0016.00=
55250.532.2031.40↑ 2.5
↑ better cooling performance of the nanofluid; ↓ lower cooling performance; = similar performance.
Table A7. Cooling time comparison between water and Al2O3 nanofluid (4%) for an initial PV temperature of 60 °C.
PV
Temperature
[°C]
Fluid
Temperature
[°C]
Volumetric
Flow Rate
[m3/h]
Cooling
Time Water
[s]
Cooling
Time Nanofluid Al2O3 4%
[s]
Nanofluid Performance
[%]
60100.05191.0155.0↑ 18.8
60150.05210.0160.0↑ 23.8
60200.05233.0177.0↑ 24.0
60250.05500.0344.0↑ 31.2
60100.152.594.0↓ 79.0
60150.154.197.3↓ 79.9
60200.1101.0117.0↓ 15.8
60250.1215.0178.0↑ 17.2
60100.237.645.5↓ 21.0
60150.240.547.9↓ 18.3
60200.246.347.5↓ 2.6
60250.283.494.5↓ 13.3
60100.327.327.5↓ 0.7
60150.325.226.1↓ 3.6
60200.327.028.5↓ 5.6
60250.354.187.3↓ 61.4
60100.417.618.4↓ 4.5
60150.418.519.1↓ 3.2
60200.421.320.3↑ 4.7
60250.431.941.4↓ 29.8
60100.515.214.6↑ 3.9
60150.515.015.1↓ 0.7
60200.516.716.5↑ 1.2
60250.533.033.4↓ 1.2
↑ better cooling performance of the nanofluid; ↓ lower cooling performance.
Table A8. Cooling time comparison between water and Al2O3 nanofluid (4%) for an initial PV temperature of 65 °C.
PV
Temperature
[°C]
Fluid
Temperature
[°C]
Volumetric
Flow Rate
[m3/h]
Cooling
Time Water
[s]
Cooling
Time Nanofluid Al2O3 4%
[s]
Nanofluid Performance
[%]
65100.05196.0157.0↑ 19.9
65150.05217.0167.0↑ 23.0
65200.05242.0185.0↑ 23.6
65250.05509.0351.0↑ 31.0
65100.153.6109.0↓ 103.4
65150.155.8104.0↓ 86.4
65200.1103.0117.0↓ 13.6
65250.1218.0181.0↑ 17.0
65100.237.046.4↓ 25.4
65150.238.848.2↓ 24.2
65200.247.147.5↓ 0.8
65250.285.596.0↓ 12.3
65100.327.328.1↓ 2.9
65150.325.426.3↓ 3.5
65200.327.629.1↓ 5.4
65250.355.392.6↓ 67.5
65100.417.918.7↓ 4.5
65150.419.119.4↓ 1.6
65200.421.520.6↑ 4.2
65250.440.342.1↓ 4.5
65100.514.414.7↓ 2.1
65150.515.315.2↑ 0.7
65200.516.916.7↑ 1.2
65250.533.533.2↑ 0.9
↑ better cooling performance of the nanofluid; ↓ lower cooling performance.
Table A9. Cooling time comparison between water and Al2O3 nanofluid (4%) for an initial PV temperature of 70 °C.
PV
Temperature
[°C]
Fluid
Temperature
[°C]
Volumetric
Flow Rate
[m3/h]
Cooling
Time Water
[s]
Cooling
Time Nanofluid Al2O3 4%
[s]
Nanofluid Performance
[%]
70100.05198.0162.0↑ 18.2
70150.05222.0167.0↑ 24.8
70200.05248.0185.0↑ 25.4
70250.05532.0362.0↑ 32.0
70100.154.198.0↓ 81.1
70150.155.8106.0↓ 90.0
70200.1103.0119.0↓ 15.5
70250.1224.0184.0↑ 17.9
70100.237.346.7↓ 25.2
70150.241.448.5↓ 17.1
70200.245.348.1↓ 6.2
70250.286.184.3↑ 2.1
70100.327.628.7↓ 4.0
70150.325.627.7↓ 8.2
70200.328.729.3↓ 2.1
70250.356.382.1↓ 45.8
70100.418.218.8↓ 3.3
70150.420.319.6↑ 3.4
70200.421.521.4↑ 0.5
70250.441.142.9↓ 4.4
70100.514.715.0↓ 2.0
70150.515.515.4↑ 0.6
70200.517.016.8↑ 1.2
70250.534.034.0=
↑ better cooling performance of the nanofluid; ↓ lower cooling performance; = similar performance.
Table A10. Cooling time comparison between water and Al2O3 nanofluid (4%) for an initial PV temperature of 75 °C.
PV
Temperature
[°C]
Fluid
Temperature
[°C]
Volumetric
Flow Rate
[m3/h]
Cooling
Time Water
[s]
Cooling
Time Nanofluid Al2O3 4%
[s]
Nanofluid Performance
[%]
75100.05200.0147.0↑ 26.5
75150.05226.0170.0↑ 24.8
75200.05251.0185.0↑ 26.3
75250.05529.0365.0↑ 31.0
75100.184.1100.0↓ 18.9
75150.197.9107.0↓ 9.3
75200.1105.0121.0↓ 15.2
75250.1227.0187.0↑ 17.6
75100.237.647.9↓ 27.4
75150.241.749.4↓ 18.5
75200.245.649.0↓ 7.5
75250.287.398.7↓ 13.1
75100.325.028.9↓ 15.6
75150.325.828.7↓ 11.2
75200.328.929.5↓ 2.1
75250.357.181.8↓ 43.3
75100.418.719.1↓ 2.1
75150.420.819.9↑ 4.3
75200.421.821.7↑ 0.5
75250.441.543.8↓ 5.5
75100.514.915.1↓ 1.3
75150.515.715.8↓ 0.6
75200.517.317.1↑ 1.2
75250.534.834.3↑ 1.4
↑ better cooling performance of the nanofluid; ↓ lower cooling performance.
Table A11. Cooling time comparison between water and Al2O3 nanofluid (4%) for an initial PV temperature of 80 °C.
PV
Temperature
[°C]
Fluid
Temperature
[°C]
Volumetric
Flow Rate
[m3/h]
Cooling
Time Water
[s]
Cooling
Time Nanofluid Al2O3 4%
[s]
Al2O3 Nanofluid Performance
[%]
80100.05204.0164.0↑ 19.6
80150.05229.0170.0↑ 25.8
80200.05254.0190.0↑ 25.2
80250.05540.0361.0↑ 33.1
80100.194.355.3↑ 41.4
80150.199.4111.0↓ 11.7
80200.1105.0122.0↓ 16.2
80250.1230.0182.0↑ 20.9
80100.240.247.9↓ 19.2
80150.242.649.4↓ 16.0
80200.246.548.7↓ 4.7
80250.288.899.6↓ 12.2
80100.325.428.9↓ 13.8
80150.326.028.9↓ 11.2
80200.329.129.9↓ 2.7
80250.357.756.6↑ 1.9
80100.419.019.1↓ 0.5
80150.420.919.9↑ 4.8
80200.421.821.8=
80250.442.143.9↓ 4.3
80100.514.915.2↓ 2.0
80150.516.115.9↑ 1.2
80200.517.417.2↑ 1.1
80250.534.833.7↑ 3.2
↑ better cooling performance of the nanofluid; ↓ lower cooling performance; = similar performance.

References

  1. Chen, X.; Zhou, W. Economic and ecological assessment of photovoltaic systems for wastewater treatment plants in China. Renew. Energy 2022, 191, 852–867. [Google Scholar] [CrossRef]
  2. Dalmış, M.; Gürel, A.E.; Yıldız, G.; Ergün, A.; Ağbulut, Ü. Effect of the use of metal–oxide and boron-based nanoparticles on the performance in a photovoltaic thermal module (PV/T): Experimental study. Int. J. Thermofluids 2024, 24, 100910. [Google Scholar] [CrossRef]
  3. Emery, K.; Burdick, J.; Caiyem, Y.; Dunlavy, D.; Field, H.; Kroposki, B.; Moriarty, T.; Ottoson, L.; Rummel, S.; Strand, T.; et al. Temperature dependence of photovoltaic cells, modules and systems. In Proceedings of the Conference Record of the Twenty Fifth IEEE Photovoltaic Specialists Conference—1996, Washington, DC, USA, 13–17 May 1996. [Google Scholar] [CrossRef]
  4. Kern, E.C., Jr.; Russell, M.C. Combined Photovoltaic and Thermal Hybrid Collector Systems; COO-4577-3; CONF-780619-24; Massachusetts Inst. of Tech., Lincoln Lab.: Lexington, MA, USA, 1978. [Google Scholar]
  5. Abdel-Aziz, M.M.; ElBahloul, A.A. Innovations in improving photovoltaic efficiency: A review of performance enhancement techniques. Energy Convers. Manag. 2025, 327, 119589. [Google Scholar] [CrossRef]
  6. Homa, M.; Sornek, K.; Goryl, W. Experimental and Numerical Study on Air Cooling System Dedicated to Photovoltaic Panels. Energies 2024, 17, 3949. [Google Scholar] [CrossRef]
  7. Ibrahim, T.; Abou Akrouch, M.; Hachem, F.; Ramadan, M.; Ramadan, H.S.; Khaled, M. Cooling Techniques for Enhanced Efficiency of Photovoltaic Panels—Comparative Analysis with Environmental and Economic Insights. Energies 2024, 17, 713. [Google Scholar] [CrossRef]
  8. Sornek, K. Assessment of the Impact of Direct Water Cooling and Cleaning System Operating Scenarios on PV Panel Performance. Energies 2024, 17, 4392. [Google Scholar] [CrossRef]
  9. Meng, E.; Xia, T.; Zhang, D. Experimental study of the thermal and power generation performance of a new type of water-cooling photovoltaic/thermal system. Appl. Therm. Eng. 2026, 286, 129352. [Google Scholar] [CrossRef]
  10. Bhatnagar, A.; Hegde, A.K.; Arunkumar, H.S.; Karanth, K.V.; Madhwesh, N. Innovative cooling for PV panels: Energy and exergy assessments of water-induced V-shaped channels. Results Eng. 2024, 24, 103100. [Google Scholar] [CrossRef]
  11. Maseer, M.M.; Ismail, F.B.; Kazem, H.A.; Wai, L.C.; Al-Gburi, K.A.H. Optimal evaluation of photovoltaic-thermal solar collectors cooling using a half-tube of different diameters and lengths. Sol. Energy 2024, 267, 112193. [Google Scholar] [CrossRef]
  12. Baloch, A.A.; Bahaidarah, H.M.; Gandhidasan, P.; Al-Sulaiman, F.A. Experimental and numerical performance analysis of a converging channel heat exchanger for PV cooling. Energy Convers. Manag. 2015, 103, 14–27. [Google Scholar] [CrossRef]
  13. Fudholi, A.; Sopian, K.; Yazdi, M.H.; Ruslan, M.H.; Ibrahim, A.; Kazem, H.A. Performance analysis of photovoltaic thermal (PVT) water collectors. Energy Convers. Manag. 2014, 78, 641–651. [Google Scholar] [CrossRef]
  14. Lebbi, M.; Touafek, K.; Benchatti, A.; Boutina, L.; Khelifa, A.; Baissi, M.T.; Hassani, S. Energy performance improvement of a new hybrid PV/T Bi-fluid system using active cooling and self-cleaning: Experimental study. Appl. Therm. Eng. 2021, 182, 116033. [Google Scholar] [CrossRef]
  15. Kabeel, A.; Abdelgaied, M.; Sathyamurthy, R. A comprehensive investigation of the optimization cooling technique for improving the performance of PV module with reflectors under Egyptian conditions. Sol. Energy 2019, 186, 257–263. [Google Scholar] [CrossRef]
  16. Swar, A.Z.; Omar, M.A. Performance analysis and electrical production of photovoltaic modules using active cooling system and reflectors. Ain Shams Eng. J. 2021, 12, 2009–2016. [Google Scholar] [CrossRef]
  17. Abdolzadeh, M.; Ameri, M. Improving the effectiveness of a photovoltaic water pumping system by spraying water over the front of photovoltaic cells. Renew. Energy 2009, 34, 91–96. [Google Scholar] [CrossRef]
  18. Hussein, T.; Ali, B.; Abdul, A.H.K.; Azher, M.A.; Nirmalendu, B.; Farhan, L.R.; Radhi, A.L.; Hafiz, M.A.; Hayder, I.M.; Dipak, K.M. Advancing photovoltaic thermal (PV/T) systems: Innovative cooling technique, thermal management, and future prospects. Sol. Energy 2025, 291, 113402. [Google Scholar] [CrossRef]
  19. Sadegh, A.; Shahin, G.; Bahman, S. Energy and exergy analysis of a photovoltaic thermal (PV/T) system using nanofluids: An experimental study. Sol. Energy 2018, 165, 167–177. [Google Scholar] [CrossRef]
  20. Govind, S.M.; Murali, S.; Jacob, E.; Aniesrani, D.D.S.; Alfiya, P.V.; Manoj, P.S. Experimental investigations on unglazed photovoltaic-thermal (PVT) system using water and nanofluid cooling medium. Renew. Energy 2022, 188, 986–996. [Google Scholar] [CrossRef]
  21. Meysam, M.; Seyed, M.N.; Ali, F. Experimental study of using Al2O3/methanol nanofluid in a two phase closed thermosyphon (TPCT) array as a novel photovoltaic/thermal system. Sol. Energy 2018, 164, 243–250. [Google Scholar] [CrossRef]
  22. Talib, K.M.; Ali, A.H. Optimization the performance of photovoltaic panels using aluminum-oxide nanofluid as cooling fluid at different concentrations and one-pass flow system. Results Eng. 2022, 15, 100541. [Google Scholar] [CrossRef]
  23. Mohsen, S.; Mohammad, H.A.; Jaroon, R.; Fatimah, M.M. Thermal Management of Solar Photovoltaic Cell by Using Single Walled Carbon Nanotube (SWCNT)/Water: Numerical Simulation and Sensitivity Analysis. Renew. Energy Technol. Syst. Dev. Chall. Oppor. 2022, 14, 11523. [Google Scholar] [CrossRef]
  24. Wagner, W.; Pruß, A. The IAPWS Formulation 1995 for the Thermodynamic Properties of Ordinary Water Substance for General and Scientific Use. J. Phys. Chem. Ref. Data 2002, 31, 2. [Google Scholar] [CrossRef]
  25. Vajjha, R.S.; Das, D.K. Experimental determination of thermal conductivity of three nanofluids and development of new correlations. Int. J. Heat Mass Transf. 2009, 52, 4675–4682. [Google Scholar] [CrossRef]
  26. Xuan, Y.; Roetzel, W. Conceptions for heat transfer correlation of nanofluids. Int. J. Heat Mass Transf. 2000, 43, 3701–3707. [Google Scholar] [CrossRef]
  27. Yu, W.; Choi, S. The Role of Interfacial Layers in the Enhanced Thermal Conductivity of Nanofluids: A Renovated Maxwell Model. J. Nanopart. Res. 2003, 5, 167–171. [Google Scholar] [CrossRef]
  28. Barbu, M.; Siroux, M.; Darie, G. Numerical model and parametric analysis of a liquid based hybrid photovoltaic thermal (PVT) collector. Energy Rep. 2021, 7, 7977–7988. [Google Scholar] [CrossRef]
  29. Satpute, J.; Campli, S.; Alnamasi, K.; Alsharif, A.M.A.; Bashir, N.M. Experimental investigation of photovoltaic thermal (PVT) system incorporating water-copper oxide nanofluid. Case Stud. Therm. Eng. 2025, 73, 106519. [Google Scholar] [CrossRef]
  30. Arifin, Z.; Prasojo, Y.J.; Juwana, W.E.; Rachmanto, R.A.; Widhiyanuriyawan, D.; Yohana, E.; Prasetyo, S.D. Investigating the influence of nanofluid on photovoltaic-thermal systems concerning photovoltaic panel performance. e-Prime Adv. Electr. Eng. Electron. Energy 2024, 9, 100730. [Google Scholar] [CrossRef]
  31. Shaalan, Z.; Hussein, A.; Abdullah, M. Numerical-experimental study to improve photovoltaic panel cooling by using hybrid ZnO/Al2O3 nanofluids. Case Stud. Therm. Eng. 2025, 70, 106053. [Google Scholar] [CrossRef]
  32. Rejeb, O.; Ghenai, C.; Jomaa, M.H.; Bettayeb, M. Statistical study of a solar nanofluid photovoltaic thermal collector performance using response surface methodology. Case Stud. Therm. Eng. 2020, 21, 100721. [Google Scholar] [CrossRef]
  33. Utomo, B.; Darkwa, J.; Du, D.; Worall, M. Solar photovoltaic cooling and power enhancement systems: A review. Renew. Sustain. Energy Rev. 2025, 216, 115644. [Google Scholar] [CrossRef]
Figure 1. Geometric model of the photovoltaic panel with heat exchanger.
Energies 19 02987 g001
Figure 2. Flow channel equipped with baffles for guiding the fluid.
Energies 19 02987 g002
Figure 3. Flow behavior in the baffled channel at a volumetric flow rate of 0.05 m3/h: (a) velocity field and flow trajectories; (b) corresponding velocity magnitude scale.
Energies 19 02987 g003
Figure 4. Velocity field distribution in the flow channel for Model 1: (a) flow domain; (b) velocity scale.
Energies 19 02987 g004
Figure 5. Velocity field distribution in the flow channel for Model 2: (a) flow domain; (b) velocity scale.
Energies 19 02987 g005
Figure 6. Velocity field distribution in the flow channel for Model 3: (a) flow domain; (b) velocity scale.
Energies 19 02987 g006
Figure 7. Velocity field distribution in the flow channel for Model 4: (a) flow domain; (b) velocity scale.
Energies 19 02987 g007
Figure 8. Velocity field distribution in the flow channel for Model 5: (a) flow domain; (b) velocity scale.
Energies 19 02987 g008
Figure 9. Cooling time of the photovoltaic panel as a function of initial PV temperature and Al2O3 nanofluid concentration, at a volumetric flow rate of 0.05 m3/h and an inlet fluid temperature of 10 °C.
Energies 19 02987 g009
Figure 10. Cooling time comparison between water and Al2O3 nanofluid (4%) as a function of initial PV temperature, at a volumetric flow rate of 0.20 m3/h and an inlet fluid temperature of 10 °C.
Energies 19 02987 g010
Figure 11. Cooling time comparison between water and Al2O3 nanofluid (4%) as a function of initial PV temperature, at a volumetric flow rate of 0.50 m3/h and an inlet fluid temperature of 10 °C.
Energies 19 02987 g011
Figure 12. Percentage reduction in the cooling time of the photovoltaic panel for the Al2O3 nanofluid (4%) compared to water, at a flow rate of 0.05 m3/h.
Energies 19 02987 g012
Figure 13. Cooling time comparison between water and Al2O3 nanofluid (4%) as a function of initial PV temperature, at a volumetric flow rate of 0.05 m3/h and an inlet fluid temperature of 10 °C.
Energies 19 02987 g013
Figure 14. Cooling time comparison between water and Al2O3 nanofluid (4%) as a function of initial PV temperature, at a volumetric flow rate of 0.05 m3/h and an inlet fluid temperature of 15 °C.
Energies 19 02987 g014
Figure 15. Cooling time comparison between water and Al2O3 nanofluid (4%) as a function of initial PV temperature, at a volumetric flow rate of 0.05 m3/h and an inlet fluid temperature of 20 °C.
Energies 19 02987 g015
Figure 16. Cooling time comparison between water and Al2O3 nanofluid (4%) as a function of initial PV temperature, at a volumetric flow rate of 0.05 m3/h and an inlet fluid temperature of 25 °C.
Energies 19 02987 g016
Figure 17. Influence of the cooling fluid flow rate on the cooling time of the photovoltaic panel in the case of water within the investigated laminar and transitional flow range (T_fluid = 10 °C).
Energies 19 02987 g017
Figure 18. Influence of the cooling fluid flow rate on the cooling time of the photovoltaic panel in the case of the Al2O3 nanofluid (4%) within the investigated laminar and transitional flow range (T_fluid = 10 °C).
Energies 19 02987 g018
Table 1. Summary of studies on photovoltaic panel cooling using water and nanofluids.
StudyCooling ConfigurationApproachEvaluated ParametersRelevant Findings
[9]Rear-side coolingExperimentalNet energy,
flow rate
Net electrical energy increased by 10% compared to a standalone PV system; optimal flow rate identified at 219 L/h
[14]Front-side water cooling ExperimentalTemperature;
electrical efficiency
Temperature reduction of 15 °C, accompanied by a 6% increase in efficiency
[15]Water cooling of CPV systemExperimentalMaximum temperatureReduction in maximum temperature by 38 °C
[16]Water-cooled CPVT systemExperimentalTemperature;
electrical efficiency
Temperature reduction of 33 °C, associated with a 1.6% increase in efficiency
[17]Continuous front-side sprayingExperimentalTemperature;
electrical efficiency
Temperature decreases from 59 °C to 38 °C, with a 3.26% increase in efficiency
[18,19,20]Nanofluids (Ag/H2O, CuO/H2O)ExperimentalTemperature;
electrical efficiency
Relative temperature reduction of 23.7% and an efficiency increase of 17.61%
[21]Thermosyphon using nanofluidExperimentalTemperature;
electrical power
Temperature reduction of 14.52 °C and an increase in electrical power of 1.42 W
[22]Nanofluid-based structures ExperimentalTemperature;
electrical efficiency
Temperature reduction of 23.14%, with an efficiency increase of 20.2%
[23]Nanofluid microchannels ExperimentalModule temperatureA temperature reduction of 26.4 °C
Table 2. Reynolds number values for water at different volumetric flow rates and inlet-fluid temperatures.
Volumetric Flow Rate [m3/h]Re at 10 °C [-]Re at 15 °C [-]Re at 20 °C [-]Re at 25 °C [-]Flow-Regime
Interpretation
0.05266.99304.96344.94387.78Laminar
0.10533.97609.91689.88775.57Laminar
0.201067.951219.831379.761551.13Laminar
0.301601.921829.742069.642326.70Laminar/
near transitional
0.402135.902439.662759.523102.27Transitional
0.502669.873049.573449.403877.83Transitional
Table 3. Reynolds number values for the Al2O3 nanofluid (4%) at different volumetric flow rates and inlet-fluid temperatures.
Volumetric Flow Rate [m3/h]Re at 10 °C [-]Re at 15 °C [-]Re at 20 °C [-]Re at 25 °C [-]Flow-Regime
Interpretation
0.05213.85245.25277.89310.99Laminar
0.10427.69490.51555.79621.97Laminar
0.20855.38981.021111.581243.94Laminar
0.301283.081471.521667.371865.91Laminar
0.401710.771962.032223.152487.89Laminar/
near transitional
0.502138.462452.542778.943109.86Near transitional/
transitional tendency
Table 4. Thermophysical properties of pure water (H2O) at different temperatures.
Temperature [°C]Temperature [K]ρ
[kg/m3]
Cp
[J/(kg·K)]
μ
[kg/(m·s)]
k
[W/(m·K)]
10283999.64137.20.0013000.586
15288998.64142.60.0011370.594
20293997.44147.60.0010040.602
25298996.24152.80.0008920.610
Table 5. Thermophysical properties of the Al2O3 water nanofluid at a concentration of 4%.
Temperature [°C]Temperature [K]ρ
[kg/m3]
Cp
[J/(kg·K)]
μ
[kg/(m·s)]
k
[W/(m·K)]
102831194.84003.20.001940.65589
152881193.74007.80.001690.66503
202931192.54012.60.001490.67369
252981191.24017.60.001330.68211
Table 6. Comparison of the performance of photovoltaic systems cooled with nanofluids.
StudyType of StudyAnalyzed
Parameter
Main
Results
Relevant
Observation
[29]ExperimentalNanofluid concentration; fluids used: water and CuO/water nanofluidThe photovoltaic panel temperature was 61.4 °C in the absence of cooling, 50.8 °C when water cooling was applied, and 45.3 °C when the nanofluid was used. The electrical efficiency was 5.74%, 7.1%, and 9.05%, respectively, while the thermal efficiency reached 67.40%Direct comparison highlights the advantage of the nanofluid
[30]ExperimentalFlow rate; fluids used: CuO/water, TiO2/water, Al2O3/waterAt a flow rate of 3 L/min, the temperature reduction was 18.84 °C for CuO, 18.12 °C for TiO2, and 17.62 °C for Al2O3Performance depends on the type of nanoparticles
[31]Numerical and experimentalFlow regime; fluids used: water, air, and Al2O3/ZnO hybrid nanofluidThe use of the hybrid nanofluid results in lower temperatures and higher values of electrical efficiency and generated power compared to water and air coolingConfirms the superiority of hybrid nanofluids
[32]Numerical and statisticalMass flow rate; fluid used: ZnO/water nanofluidThe analyzed studies report electrical efficiency values of up to 4.93% and thermal efficiency values of up to 46.29%, highlighting the influence of mass flow rate on performanceMass flow rate with a decisive influence
[33]ReviewCooling method; fluids used: various nanofluidsThe reduction in photovoltaic panel temperature can reach up to 40.4 °C, depending on the system configurationEfficiency depends on the system configuration
Present studyNumerical (transient regime)Volumetric flow rate; fluids used: water and Al2O3/water nanofluid (4%)Flow rate ranging from 0.05 to 0.5 m3/h. The reduction in cooling time is approximately 18–22% at low flow rates, while the difference between water and nanofluid decreases at moderate flow ratesThe efficiency of the nanofluid is dependent on the flow regime, with the advantage being more pronounced at low flow rates
Disclaimer/Publisher’s Note: The statements, opinions and data contained in all publications are solely those of the individual author(s) and contributor(s) and not of MDPI and/or the editor(s). MDPI and/or the editor(s) disclaim responsibility for any injury to people or property resulting from any ideas, methods, instructions or products referred to in the content.