1. Introduction
Modern energy systems operate under conditions of continuously increasing demand for electricity, resulting from both rapid technological development and the growing number of end users. This phenomenon is directly correlated with an increase in carbon dioxide emissions, generated mainly by conventional energy sources based on fossil fuels [
1]. This challenge is particularly evident in the maritime sector, where empirical measurements of vessel-related emissions have confirmed a significant and growing contribution to regional atmospheric burdens, reinforcing the need for emission-free marine energy alternatives [
2]. Consequently, the energy sector is facing the necessity of implementing solutions that enable the reduction of greenhouse gas emissions and, in the longer term, the complete elimination of CO
2 emissions in newly designed power generation installations [
3]. Public investment frameworks, including feed-in tariffs and power purchase agreements, have demonstrated measurable effectiveness in accelerating the deployment of renewable capacity in EU member states [
4,
5,
6,
7]. Moreover, evidence from the Baltic and Nordic countries indicates that renewable energy penetration is strongly correlated with long-term institutional quality and regulatory stability [
8]. The transition to renewable energy systems also requires robust financial frameworks and mechanisms for sustainable investment [
9]. At the same time, minimizing the long-term environmental impacts resulting from the continued operation of existing energy infrastructure remains an important challenge [
10].
In this context, the development of renewable energy sources characterized by a low-emission profile and long-term operational potential is particularly important. One of the most promising research directions in this field is the use of wave energy. This form of energy, generated by the propagation of waves on the water surface, can be converted into mechanical energy and subsequently into electrical energy [
11]. This process does not involve the emission of harmful substances, including carbon dioxide, which makes wave energy a particularly attractive solution from an environmental perspective. Despite its significant global potential, this technology remains an area of intensive research, and its full commercialization faces considerable technical and operational barriers [
12].
Floating wave energy power plants are particularly interesting due to their high energy potential and favorable performance forecasts under marine conditions. An important development trend in such systems is the integration of wave energy conversion units with energy storage systems. This approach enables surplus energy to be stored during periods of intensive operation and used during periods of increased electricity demand. One of the considered energy storage methods is compressed air energy storage, generated as a result of the vertical oscillations of buoys moving along the vertical axis under wave excitation [
13]. The accelerated deployment of renewable energy technologies has been further reinforced by geopolitical factors; empirical studies confirm that crises related to energy dependence, such as the war in Ukraine, have significantly stimulated investment in renewable energy sources and policy reforms in European economies [
14,
15,
16].
Wave energy absorbers play a key role in the wave energy conversion process, serving as the direct interface between the wave field and the energy conversion system. These specially designed devices are capable of absorbing the kinetic and potential energy of ocean waves and converting it into mechanical and subsequently electrical energy. Such systems must meet stringent structural and operational requirements arising from hydrodynamic loads, corrosion processes, and the variability of wave parameters. The literature distinguishes several basic classes of wave energy absorbers, including point absorbers, linear absorbers, and pressure-differential systems [
17].
The subject of this study is a conceptual prototype of a three-armed buoy intended to operate as a small-scale wave energy absorber under the moderate hydrodynamic conditions of the Baltic Sea. The analyzed structure has an axisymmetric arrangement of three cylindrical arms ending in hemispherical buoyancy elements and a central column with an axial opening. This solution was adopted to achieve a uniform distribution of buoyancy, reduce heeling moments, and increase the system’s resistance to variable wave propagation directions. From a functional perspective, the buoy is a floating element intended to operate in a moored state, and its primary task is to convert the energy of oscillatory vertical motion into useful energy through cooperation with a power take-off system and auxiliary pneumatic storage.
The concept of the device assumes the use of the vertical component of wave-induced motion, i.e., heave motion, as the primary mechanism for energy harvesting. This motion constitutes the input for two conversion pathways: an electric generator and a pneumatic energy storage system based on cyclic air compression. Introducing the description of the research object at the introductory stage makes it possible to separate the characteristics of the structural solution from the actual methodological procedure presented later in the paper.
Therefore, the aim of this study is to provide a preliminary quantitative assessment of whether the three-armed float configuration can support stable dynamic response, provide useful vertical motion, and improve the possibility of energy recovery under wave conditions characteristic of the southern Baltic Sea. The novelty of the study lies in linking the geometry of a multi-armed buoy with a dual-path energy conversion system, comprising an electric generator and a pneumatic energy storage system, as well as in identifying the limitations of the model that require further coupled analysis: an irregular wave field, multi-degree-of-freedom dynamics, and the interaction of the mooring system. To strengthen the preliminary feasibility assessment, the study also introduces a first-order heave-response model and a parametric interpretation of the main design assumptions. In addition to the baseline energy estimate, the analysis includes the influence of effective operational density, added mass, PTO damping, conversion-path efficiency, heave response amplitude operator (RAO), and simplified hydrostatic stability. This modelling hierarchy makes it possible to distinguish between a screening-level estimate of energy potential and a more detailed assessment of the sensitivity of the buoy response to mass, damping, ballast and buoyancy distribution. The study does not aim to replace full BEM/CFD hydrodynamic modelling or experimental validation; instead, it identifies the key parameters and limitations that should guide further development of the concept.
2. Literature Review and Operating Principles of Wave Energy Absorbers
In order to improve the structural coherence of the article, the literature review was combined with a description of the operating principles and examples of wave energy absorber technologies. This approach makes it possible to present the state of the art in a causal and logical sequence: from the physical foundations of wave motion and methods of hydrodynamic modelling, through the classification of wave energy converters, to structural solutions and energy conversion mechanisms relevant to the analyzed three-armed buoy. The extended literature section not only organizes previously dispersed content but also strengthens the justification for selecting a multi-armed geometry, using heave motion as the main degree of freedom, and integrating the generator with a pneumatic energy storage system.
Wave energy is one of the forms of renewable energy classified within the broad category of ocean energy, alongside tidal energy, marine currents, and thermal and salinity gradients. From the perspective of marine physics, surface waves are a manifestation of the mechanical propagation of energy in a liquid medium, where energy transport occurs without significant mass transport, which is one of the fundamental assumptions of classical gravity wave theory [
18,
19].
According to linear wave theory, also known as Airy wave theory, ocean waves can be modelled as harmonic disturbances of the water surface, whose dynamics are described by the Euler equations linearized with respect to small amplitudes. Despite its limited accuracy under strongly nonlinear wave conditions, this theory remains a fundamental analytical tool used in the early design stages of wave energy converters [
20].
The mechanism of wave generation is associated with the transfer of momentum from the atmosphere to the ocean surface, in which Kelvin–Helmholtz instability mechanisms and resonance mechanisms described in the classical theories of Miles and Phillips play a key role [
21]. The intensity of this process depends on wind speed, wind duration, and the fetch length. At later stages, waves undergo bathymetric transformation, including refraction, diffraction, shoaling, and breaking, which leads to spatial variability in the wave energy flux [
22].
From the perspective of marine energy engineering, the key parameter characterizing the wave resource is wave power flux density, defined as the amount of energy transported by a wave per unit time and per unit length of wave crest. In long-term analyses, wave energy is described spectrally using spectral functions such as the Pierson–Moskowitz and JONSWAP spectra, which enable probabilistic assessment of wave conditions over multi-year periods [
23,
24].
Studies indicate that, on a global scale, the energy potential of ocean waves may reach values comparable to current global energy demand, with an important advantage arising from their relatively high statistical predictability resulting from the inertia of ocean systems [
25]. Climate models and wave reanalyses now make it possible to estimate energy production with sufficient accuracy for long-term energy system planning [
26].
The Baltic Sea, characterized by limited depth and a relatively short fetch, is dominated by low- and medium-energy waves. Nevertheless, numerous analyses indicate that the average wave power density along the southern Baltic coast reaches approximately 3–5 kW/m, classifying this region as an area with moderate but potentially exploitable wave energy conditions [
27].
The central issue in wave energy technology is the conversion of hydrodynamic energy into electrical energy, carried out by devices known as wave energy converters (WECs). The design of such systems is based on the theory of wave–structure interaction, including diffraction and radiation phenomena, whose mathematical description is formulated within the framework of potential flow theory [
28].
In engineering practice, this problem is solved using numerical methods, particularly the Boundary Element Method (BEM), which enables the determination of wave forces, dynamic response functions, and energy absorption coefficients [
29]. In the context of point absorbers, such methods are particularly important for determining frequency-dependent added mass, radiation damping and excitation-force coefficients.
Drew, Plummer, and Sahinkaya [
30] demonstrated that the efficiency of WEC devices largely depends on dynamic resonance between the natural frequency of the system and the dominant frequency in the wave spectrum. In this context, impedance matching between the hydrodynamic system and the power take-off mechanism (PTO) is crucial, as it enables the maximization of the capture width ratio.
For point absorbers, the key design parameter is the relationship between the device dimensions and the wavelength, whereas in oscillating water columns, aerohydrodynamic coupling and the nonlinear characteristics of bidirectional turbines dominate [
31]. Horizontal segmented devices are analyzed using elastic beam theory and multibody mechanical system dynamics, taking into account material fatigue and stochastic wave loading [
32].
One of the main limitations of the practical use of wave energy remains the non-stationary nature of wave availability. Temporal variability in the energy flux leads to fluctuations in output power, which poses a serious challenge to the stability of energy systems.
In response to these limitations, the literature emphasizes the need to integrate wave energy converters with energy storage systems. Particular attention is given to compressed air energy storage (CAES) technologies, which can be effectively integrated with hydraulic PTO systems, enabling the reduction in power fluctuations and increasing the capacity factor of installations [
33]. In addition to compressed air systems, the broader challenge of integrating energy storage into renewable installations has been addressed using various electrochemical and redox-based technologies. Recent studies indicate that innovative storage systems, including photo-redox batteries, offer significant potential for improving grid stability and reducing dependence on fossil-fuel backup in national energy mixes, thereby contributing to the broader transition toward sustainable energy systems [
34].
At the same time, theoretical and experimental studies indicate that the implementation of CAES systems in the marine environment involves significant challenges related to materials engineering, corrosion resistance, and fatigue durability of structural components, which remain among the key directions for further research [
35].
The current state of research indicates that, in the years 2023–2025, the development of wave energy conversion technologies has increasingly focused on multi-element systems, small-scale point-absorber units, and the integration of PTO systems with energy storage. Contemporary studies on compact wave energy converters show that small floating devices can serve as autonomous power sources for marine infrastructure; however, their effectiveness depends on the coupling between float geometry, the characteristics of the power take-off system, control strategy, mooring, and the actual wave spectrum [
36]. Research on multipoint and multimodal systems further indicates that arranging several buoyancy elements around the structural axis can broaden the effective energy absorption range and improve the response to waves propagating from different directions [
37,
38]. This is directly related to the three-armed geometry analyzed in this study, in which the distribution of buoyancy and hydrodynamic interactions affects both stability and the available working motion in the vertical direction. At the same time, recent studies on pneumatic and compressor-based energy storage confirm that the direct use of mechanical wave energy to compress air can stabilize non-stationary output power, but requires analysis of variable damping, compression efficiency, tank capacity, and thermodynamic losses [
39,
40,
41]. Therefore, the literature review provides the basis for the adopted concept of dual-path energy conversion, while also justifying the need for further validation of the model under irregular wave conditions and with the coupling of the mooring system taken into account. In addition to the classification of WEC technologies and energy-storage pathways, the literature also indicates the need for a hierarchical modelling approach in the early development of point-absorber devices. Simplified analytical or semi-analytical models are commonly used at the conceptual stage to estimate the order of magnitude of the energy potential and to compare design variants. However, a more complete description of point-absorber dynamics requires the introduction of added mass, radiation damping, hydrostatic restoring stiffness, wave excitation force and PTO damping. These quantities determine the heave response and the corresponding response amplitude operator (RAO), while their frequency-dependent forms are typically obtained using potential-flow methods, BEM/WAMIT tools, CFD simulations or experimental identification. Therefore, the present study adopts a two-level modelling structure: a screening-level energy estimate and a first-order heave-response model. This approach is consistent with the conceptual nature of the work while explicitly identifying the hydrodynamic quantities that require higher-fidelity modelling and experimental validation in future research [
42,
43,
44].
Operating Principles and Examples of Wave Energy Absorbers
After presenting the theoretical foundations and current research directions, it is reasonable to proceed to a discussion of the operating principles of selected wave energy absorbers, since the structural solutions described in the literature constitute a direct reference point for the proposed three-arm buoy. Integrating these contents into one section makes it possible to simultaneously compare energy conversion mechanisms, stabilization methods for floating structures, and operational limitations occurring under real marine conditions.
The studies by Morek et al. (2010) indicate that the effectiveness of wave energy absorbers largely depends on the precise adaptation of their structural and dynamic parameters to local hydrodynamic conditions. Such systems use the energy of ocean wave motion, particularly its vertical component, to drive the moving elements of the device, which form the basis of the energy conversion process [
45].
Wave action causes cyclic vertical displacement of the prototype, initiating relative motion between the magnet and the coil. As a result, changes occur in the magnetic flux passing through the winding, which—in accordance with Faraday’s law of electromagnetic induction—lead to the generation of electromotive force (EMF) in the conductor and the flow of electric current [
46].
A key aspect of wave energy absorber operation is the dynamic exchange of energy between wave motion and the electromagnetic system, enabling the effective transformation of mechanical wave energy into electrical energy. Propagating waves induce vertical—and in some cases also horizontal—motion of the buoy or other floating elements immersed in water, and the nature of these motions depends directly on the wave height, period, and intensity [
47].
In the structure of the device, the permanent magnet and the conductor wound in the form of a coil play a fundamental role. The magnet is usually connected to a moving element, such as a buoy, while the coil remains stationary; alternative configurations with reversed arrangements are also possible. The relative motion of the magnet with respect to the coil causes periodic changes in magnetic flux, resulting in the induction of electromotive force and electric current. This phenomenon, known as electromagnetic induction, enables the direct conversion of mechanical energy into electrical energy through a time-varying magnetic field [
48].
The magnitude of the generated electromotive force depends on several factors, including the magnetic field strength, the number of coil turns, the relative velocity between the magnet and the coil, and the parameters of wave motion, particularly amplitude and frequency. According to Lenz’s law, the direction of the induced current opposes the change in magnetic flux that caused it [
49].
Depending on the adopted design assumptions, wave energy conversion systems may use different energy conversion mechanisms, including hydraulic, pneumatic, and direct-drive electrical systems. These solutions differ in structural complexity, energy efficiency, and range of applications [
50]. In the context of marine energy systems, the efficiency of dual-path energy conversion combining electricity generation with pneumatic or thermal energy recovery has shown a significant improvement in the overall utilization of primary energy sources. Studies of cogeneration systems on ships have shown that integrated energy conversion architectures reduce losses associated with single-direction generation and improve the performance coefficient of marine installations [
51].
An example of a point absorber wave energy system is AquaBuOY, in which the motion of the buoy caused by wave action drives hydraulic pumps that convert mechanical energy into electrical energy. This design is based on relatively simple yet effective hydraulic mechanisms [
52].
Another solution is WaveBob, an Irish point absorber concept consisting of a floating buoy coupled with a hydraulic or pneumatic system. Wave energy is converted into hydraulic energy, which then drives turbines generating electrical energy [
53].
The PowerBuoy system, developed by Ocean Power Technologies (OPT), is a commercially used point absorber. This device converts the vertical motion of waves into electrical energy using a hydraulic power take-off system. The generated electricity can be transmitted to shore or used directly to power offshore installations [
54].
Another concept is the CETO system developed by Carnegie Wave Energy, which operates entirely below the water surface. Submerged buoys generate hydraulic energy, which is transmitted through pipelines to onshore turbines producing electricity. The CETO system was designed to minimize environmental impact and increase resistance to extreme marine conditions [
55].
It is also worth noting the WaveStar project, based on a network of multiple buoys mounted on movable arms connected to a stable platform. The independent operation of individual buoys enables effective harvesting of waves of different heights and frequencies [
56].
The final example discussed is the OE Buoy developed by Ocean Energy. This device is a large, deeply submerged buoy in which wave motion energy is converted into compressed air that drives turbines. The system operates similarly to air turbines and is being tested for resistance to extreme ocean conditions [
57].
Wave energy technologies are mainly based on the concept of point absorbers, whose primary task is to convert the kinetic and potential energy of ocean waves into electrical energy. Systems such as AquaBuOY, WaveBob, and PowerBuoy use the vertical motion of buoys through hydraulic, pneumatic, or mechanical power take-off (PTO) systems. The performance of these devices largely depends on the technological advancement of the systems used and on local hydrodynamic conditions, particularly the characteristics of the wave spectrum [
58].
Another group of technologies is represented by CETO-type systems, which operate entirely below the water surface. The use of submerged working elements increases resistance to extreme environmental conditions, such as severe storms, and reduces the visual and acoustic impact on the marine environment. However, such technologies are characterized by relatively high installation costs due to the need for underwater hydraulic and transmission infrastructure [
59].
Among multi-point solutions, particular attention should be paid to systems such as WaveStar and Wave Star Energy, which use arrays of independently operating buoys. This configuration enables more effective energy extraction from waves of varying heights and frequencies, resulting in more stable energy production. At the same time, structural complexity and the need for extensive supporting infrastructure increase both capital and operational costs [
60].
Technologies such as Seabased and the OE Buoy developed by Ocean Energy are characterized by relatively simple structures and lower operating costs. In these systems, wave energy is converted directly into electrical energy or into compressed air that drives turbines. However, their efficiency may be limited under strong and irregular conditions [
61].
The selection of an appropriate wave energy conversion technology should always be preceded by an analysis of local environmental conditions, including wave characteristics, water depth, and the geotechnical properties of the seabed. Economic factors, such as the available investment budget and requirements related to energy efficiency and environmental protection, are also of key importance. Each of the analyzed technologies involves specific benefits and trade-offs that must be considered when planning and designing marine energy systems [
62].
Despite the dynamic development of wave energy conversion technologies, the sector still faces serious implementation barriers. Key challenges include high installation, operation, and maintenance costs resulting from structural complexity and operation in an aggressive marine environment. Additional issues include vulnerability to extreme weather events, such as storms, and corrosion processes affecting system durability and reliability [
63].
The energy efficiency of wave energy converters is strongly dependent on local hydrodynamic conditions, which limits their broad application in regions with low wave potential. Another important challenge remains the scalability of these technologies and their integration with existing energy systems, which requires the expansion of transmission infrastructure and the implementation of energy storage systems.
In summary, advanced wave energy technologies, despite their high level of innovation, require further research and development aimed at improving reliability, durability, and energy efficiency, while simultaneously reducing investment and operating costs and minimizing environmental impact. The integration of intelligent forecasting tools and AI-based control systems represents a complementary pathway for improving power supply continuity in distributed energy generation systems. Recent studies have demonstrated the application of edge-oriented machine learning models for predicting operational loads [
64], monitoring microgrids [
62], and planning AI-supported renewable energy capacity [
65].
3. Research Methodology
This section presents only the modelling assumptions, scope of calculations, and procedure for evaluating the dynamic and energy response of the buoy. The structural description and the intended application of the analysed system were introduced earlier; therefore, the methodology is focused on the idealisation of wave motion, the determination of geometric parameters, the modelling of vertical motion, the energy balance, and the interpretation of limitations resulting from the adopted level of simplification.
The analysis was carried out in an ordered computational sequence. In the first stage, the geometric and buoyancy parameters of the structure were determined. In the second stage, a deterministic description of regular wave excitation was adopted. In the third stage, the dynamic response of the buoy in vertical motion and the associated energy potential of the generator and pneumatic system were determined. The procedure defined in this way makes it possible to treat the obtained results as a conceptual assessment intended to identify fundamental design relationships, rather than as a complete operational forecast for a real marine basin.
Since the analysed buoy was assumed to be a floating element intended to operate under moored offshore conditions, the influence of the mooring system should be treated as an integral part of the dynamic model, rather than solely as a positioning condition for the device. At the present stage of the research, the stiffness, damping, and geometric constraints of the mooring lines have not yet been explicitly introduced into the equations of motion. This constitutes a deliberate simplification adopted for the preliminary assessment of the energy potential of the structure.
From an engineering practice perspective, however, such a simplification limits the possibility of fully assessing displacement amplitudes, phase shifts between wave excitation and buoy response, restoring force values, and the actual energy available to the power take-off system. In subsequent stages, the model should be extended to include a nonlinear description of the mooring system, covering at least the force–elongation characteristics of the lines, the restoring stiffness matrix, material and hydrodynamic damping, line pretension, allowable displacement constraints, and coupling with the buoy motion in multiple degrees of freedom.
A model defined in this way would make it possible to determine the influence of the mooring configuration on the dynamic response, extreme loads, stability of the operating position, and energy conversion efficiency. Therefore, the inclusion of the mooring system is necessary in order to move from an idealised conceptual analysis to a model closer to the actual operating conditions of an offshore wave energy converter, as well as to reduce the risk of overestimating the generated energy due to the omission of mechanical motion constraints.
The deterministic regular-wave model applied in this study should be treated as an initial stage of computational idealisation, intended for a controlled assessment of the buoy’s dynamic response and for comparing operating variants of the system under clearly defined wave amplitude and period. However, it should be emphasised that such a description does not fully reproduce the actual wave conditions of the Baltic Sea, where the free surface has an irregular, multi-frequency, and random structure, while wave heights, periods, phases, and propagation directions are subject to stochastic variability.
For this reason, in subsequent stages of the research, the hydrodynamic model should be extended to include irregular-wave simulations generated on the basis of the JONSWAP spectrum, which is particularly useful for describing developed and partially developed sea states in limited-fetch basins such as the Baltic Sea. The implementation of the JONSWAP spectrum would enable the actual distribution of wave energy in the frequency domain to be represented, the buoy response to multi-harmonic excitation to be determined, and a more reliable assessment of the instantaneous and averaged energy recovered by the generator and pneumatic system to be performed.
In particular, future analyses should include the generation of time-domain realisations of the sea surface for specified values of , , and the spectral peak enhancement factor , followed by the evaluation of the dynamic response, hydrodynamic loads, and energy stability of the system under non-stationary, random wave excitation. Such an extension would make it possible to verify whether the results obtained for regular waves remain valid in a realistic wave field and would reduce the risk of overestimating the energy potential of the analysed buoy.
In the first stage, a detailed geometric model of the structure was developed, enabling determination of fundamental physical parameters such as total volume, frontal area, and mass resulting from buoyancy conditions. These parameters constituted the input data for subsequent dynamic and energy analyses.
In the next stage, the buoy motion was modeled as a single-degree-of-freedom system in the vertical direction, assuming dominance of the heave component as the primary mechanism of interaction between the structure and the wave field. The buoy motion was described as a forced harmonic oscillation induced by regular sea waves. The vertical displacement of the buoy was assumed to be proportional to wave amplitude, with energy losses taken into account through hydrodynamic damping and the characteristics of the power take-off system.
The wave parameters were selected based on data representative of average hydrodynamic conditions prevailing in the Baltic Sea. The analysis considered waves with an amplitude of 1.0 m and a period of 6 s, corresponding to an angular frequency of 1.047 rad/s.
Additionally, extreme conditions were examined, corresponding to the highest 10% of waves occurring in the Baltic Sea. In this case, waves with an amplitude of 1.5 m were assumed. According to the Rayleigh distribution, it is assumed that the height of the highest 10% of waves falls within the range of approximately 1.8 to 2.0 times the significant wave height .
The maximum wave height
was estimated by adopting the upper bound of this range, leading to the relationship:
These adopted parameters allow for the analysis of both average and extreme conditions characteristic of the studied water area.
The energy analysis was performed based on calculations of the buoy’s kinetic energy as a time-dependent function during a single motion cycle. The vertical velocity was determined as the time derivative of harmonic displacement, which allowed calculation of instantaneous and total kinetic energy over one wave period. The total energy per cycle was obtained by integrating the kinetic energy over the duration of a single oscillation cycle.
The energy conversion process included two independent conversion paths. In the baseline screening-level estimate, electrical and pneumatic conversion efficiencies of 10% and 5%, respectively, were used as conservative reference assumptions. The pneumatic pathway was associated with air compression occurring during the downward motion phase of the buoy. These values were subsequently extended through a parametric sensitivity analysis of the electrical and pneumatic conversion pathways.
Based on the energy obtained in one operating cycle, the daily energy output of the system was estimated under the assumption of continuous operation in constant wave conditions over a period of 24 h. The number of cycles per day was determined on the basis of the wave period, and the obtained energy values were converted into kilowatt-hours (kWh) to enable the assessment of the system’s energy efficiency.
The energy analysis was supplemented with a qualitative assessment of the forces acting on the buoy during the motion cycle, including the wave excitation force and the hydrodynamic drag force. This assessment made it possible to evaluate preliminary loading tendencies of the structure and to indicate potentially favourable motion characteristics of the adopted geometric configuration within the assumptions of the simplified model.
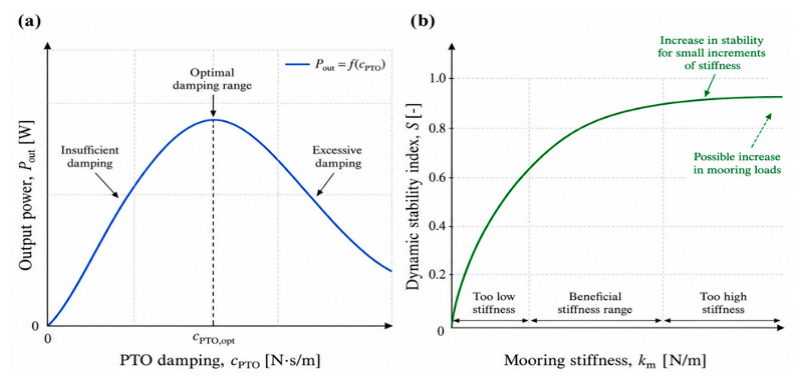
In order to synthetically illustrate the influence of key model parameters on the energy response and stability of the system, schematic relationships between the damping of the power take-off system (PTO) and output power, as well as between mooring stiffness and the dynamic stability index, were presented, as shown in
Figure 1. This approach organizes the interpretation of the results and indicates the existence of parameter ranges that are favourable from the perspective of energy efficiency and safe system operation.
The research methodology applied made it possible to comprehensively assess the dynamic response of the three-arm buoy and to estimate its energy potential under moderate wave conditions. The obtained results provide a basis for formulating final conclusions and defining directions for further research and development focused on the optimisation of the structure and the power take-off system.
3.1. Geometrical Definition and Buoyancy-Volume Calculation
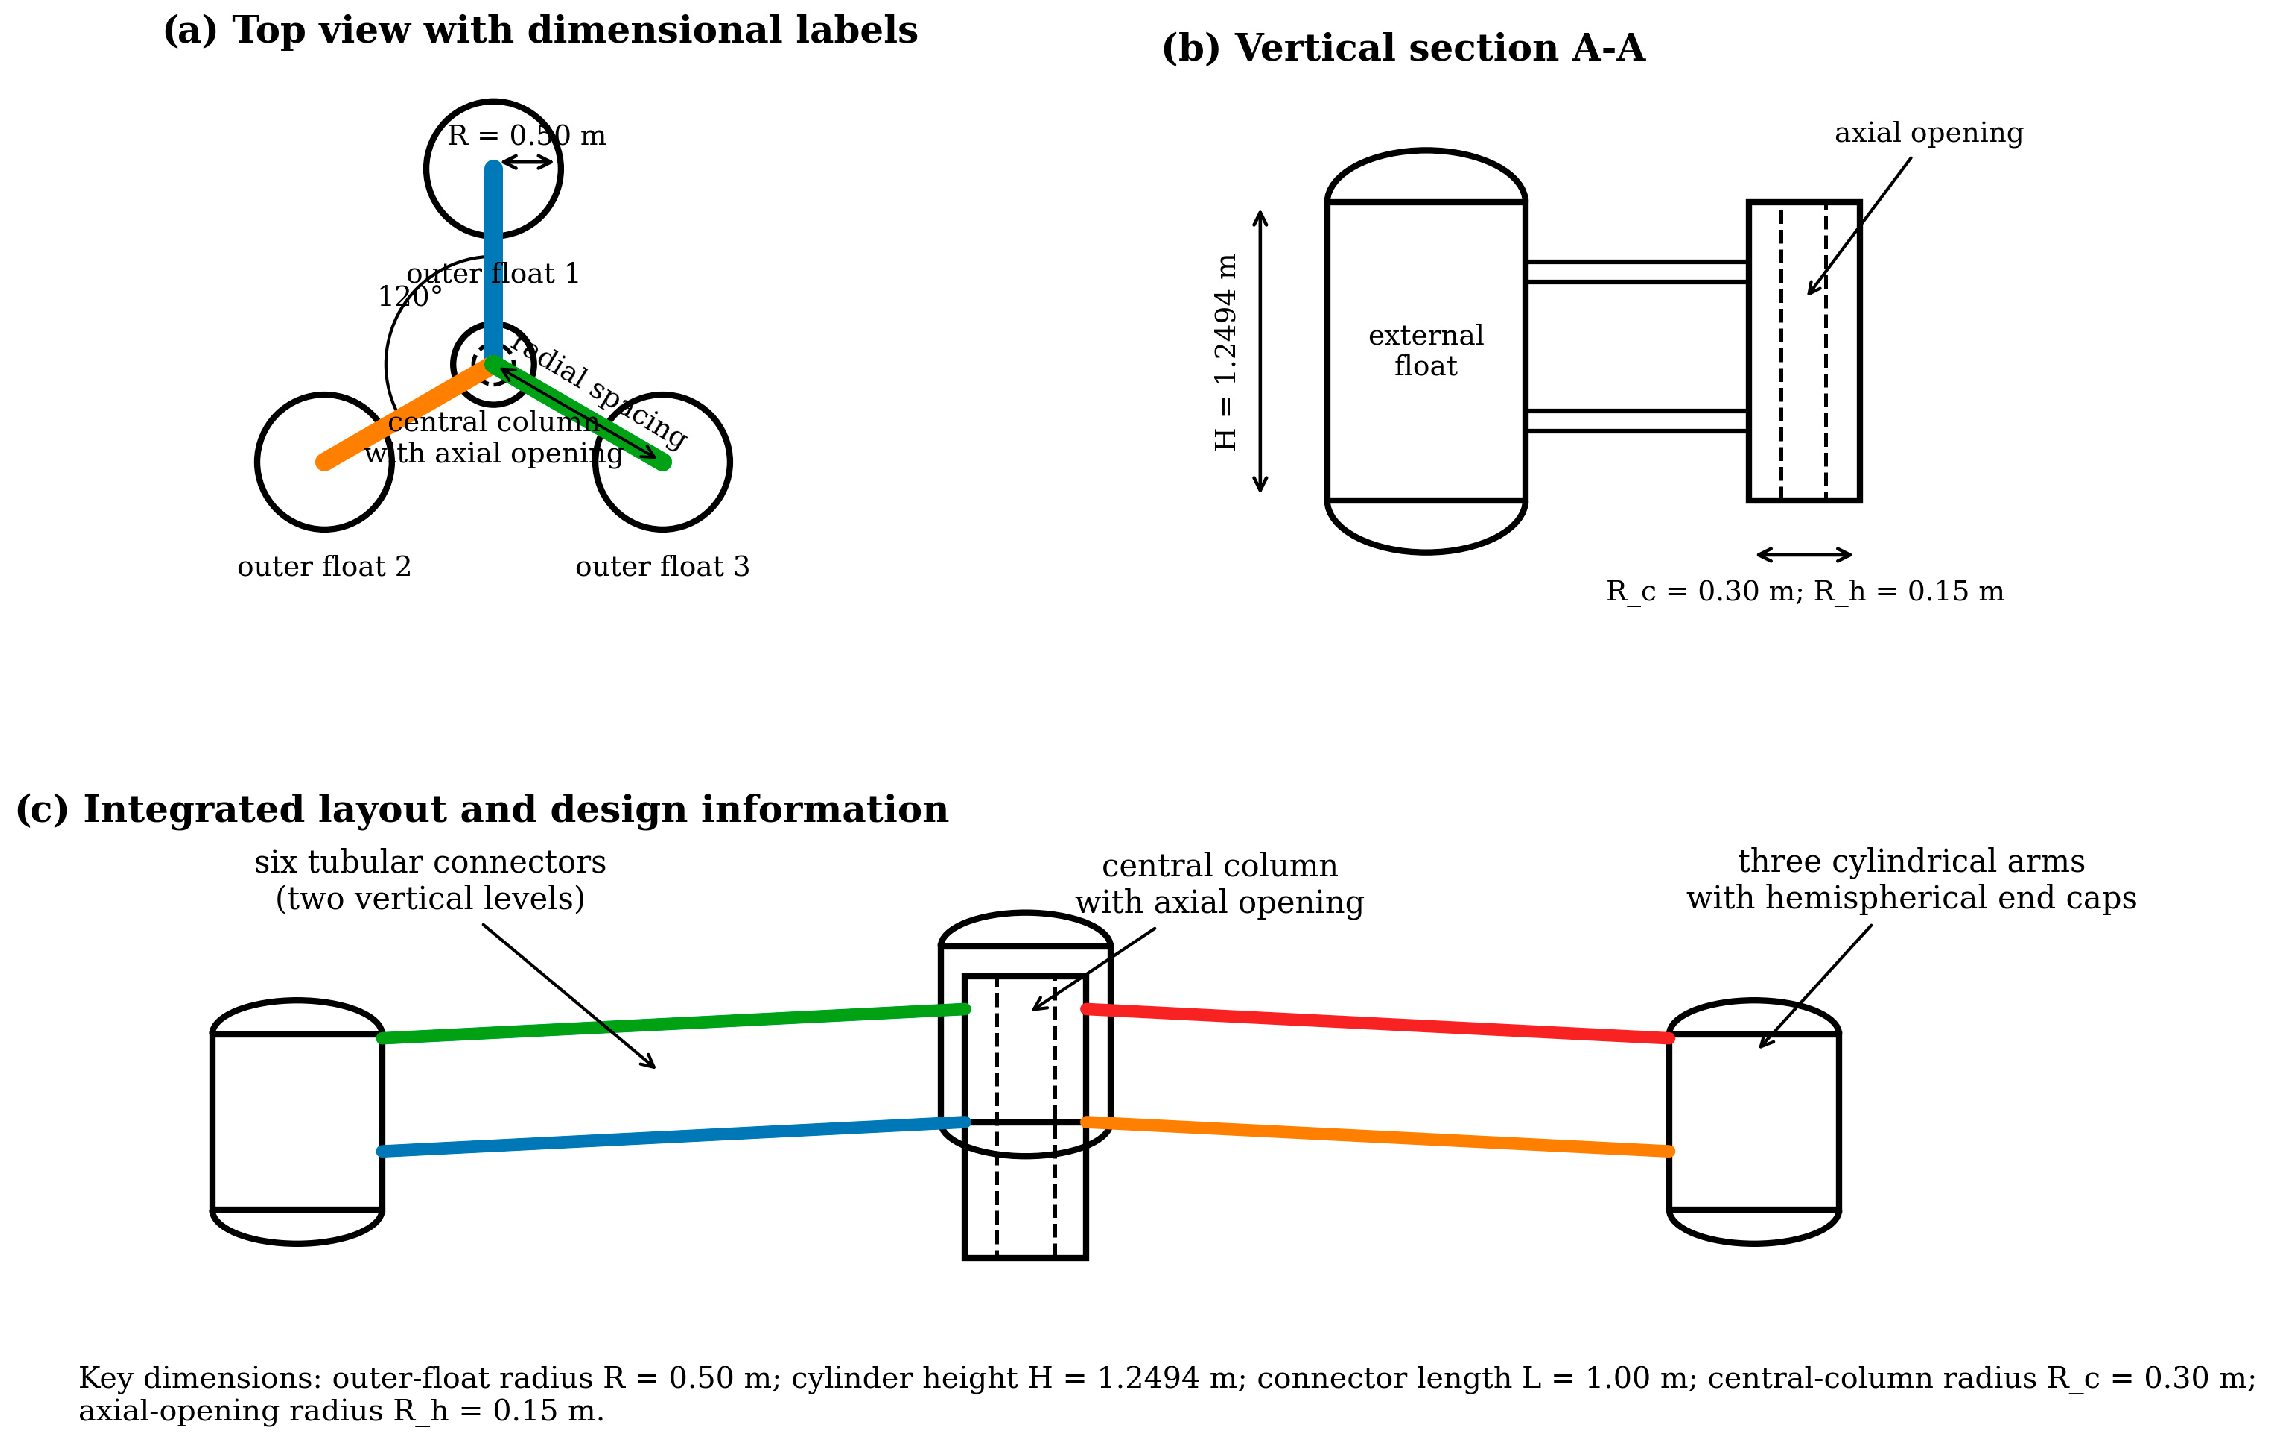
The geometry of the three-arm buoy was defined as a system of three identical external floaters arranged symmetrically around a central column. Each external floater consists of a cylindrical section and two hemispherical end caps, located at the upper and lower ends of the floater. Therefore, the volume of the two hemispherical caps of a single floater is equivalent to the volume of one sphere with the same radius as the cylindrical section. This distinction is important for an unambiguous definition of the total buoyancy volume of the structure, as shown in
Figure 2.
The condition adopted to limit the overall size of the structure during the design optimization process was to increase the diameter of the three-armed buoy arms to 1.0 m.
Buoy Dimensions After Structural Optimization with Respect to Its Functional Requirements
The volume of one external floater was calculated as the sum of the cylindrical volume and the volume of the two hemispherical caps:
where
is the radius of the external floater and
is the length of its cylindrical section. For the adopted dimensions
and
, the cylindrical volume is:
whereas the volume of the two hemispherical caps is:
Thus, the volume of one external floater is:
and the total volume of the three external floaters is:
The central column was represented as a hollow cylindrical element with an outer radius
, an inner radius
, and a height
. Its volume was calculated as:
which gives:
The six tubular connectors, each with a radius
and a length
, have a total volume of:
The total geometrical volume, treated as the maximum buoyancy volume of the floater, is therefore:
In the subsequent analysis,
was used as the reference volume for defining the operational mass under different effective-density assumptions, as shown in
Table 1. It should be emphasized that
does not directly represent the submerged volume at equilibrium. The actual submerged volume depends on the operational mass, internal equipment, ballast, and the configuration of the power take-off system.
The value 0.5236 m3 corresponds to the combined volume of the two hemispherical caps of one external floater, i.e., to the volume of one complete sphere with radius R = 0.5 m. The corrected geometrical volume balance provides the basis for the subsequent hydrodynamic and energy analyses. In particular, the total geometrical volume is treated as the maximum buoyancy volume of the structure, whereas the actual submerged volume depends on the operational mass, ballast and internal equipment.
3.2. Modelling Framework and First-Order Heave-Response Model
Two complementary levels of modelling were used in the analysis. The first level was a simplified energy estimate intended as a screening-level assessment of the buoy concept under representative Baltic Sea wave conditions. This approach provides an initial order-of-magnitude estimate of the energy that can be recovered from the vertical motion of the structure. The use of simplified analytical or semi-analytical models is common at the early design stage of point-absorber wave energy converters, where the main purpose is to evaluate the feasibility of a concept before applying higher-fidelity hydrodynamic tools [
66,
67,
68].
The second level was a first-order heave-response model based on a linear single-degree-of-freedom equation of motion. Such a formulation is commonly used for point-absorber wave energy converters, particularly when the primary energy-extraction mechanism is the vertical motion of the buoy relative to the power take-off system [
42,
67,
68] Point absorbers are generally modelled as floating bodies whose horizontal dimensions are small in relation to the incident wavelength, and whose oscillatory motion is damped by the PTO system to extract useful power [
66,
68].
The heave motion was described as:
where
m is the operational mass of the buoy,
is the added mass in heave,
is the hydrodynamic radiation damping, C
PTO is the power take-off damping coefficient, K
Z is the hydrostatic restoring stiffness, and F
exc(t) is the vertical wave excitation force. This form follows the standard representation of heaving point absorbers, in which the equation of motion includes mass and added mass, hydrostatic restoring stiffness, radiation damping, external or PTO damping, and wave excitation force [
43,
67,
68].
The hydrostatic restoring stiffness was calculated from:
where ρ
w is the seawater density,
is the gravitational acceleration, and
Awp is the waterplane area. For the cases in which the equilibrium waterline intersects the cylindrical sections of the external floaters and the central column, the waterplane area was calculated as:
For the lightweight configuration, in which the equilibrium waterline is located within the lower hemispherical sections, a reduced waterplane area consistent with the hemispherical cross-section geometry was used.
For a regular wave described by:
the excitation-force amplitude was approximated in a first-order hydrostatic form as:
where
is the wave amplitude and
is the angular wave frequency. In a complete hydrodynamic formulation, the excitation force includes contributions from incident-wave and diffraction effects, while the body motion generates radiation forces; these quantities are commonly obtained from potential-flow BEM tools such as WAMIT, CFD calculations, or experimental identification [
43,
67,
68]. To account for uncertainty in the actual excitation-force amplitude at the present conceptual stage, the parametric analysis may also be expressed as:
where
is an excitation-force correction factor.
For harmonic excitation, the heave-response amplitude is:
and the heave response amplitude operator is defined as:
The RAO is a standard frequency-domain measure used to describe the motion response of floating bodies and point-absorber WECs to incident waves [
67,
68]. Assuming
, the heave RAO becomes:
The mechanical power absorbed by the PTO was represented as the power dissipated by a linear damper:
This representation is consistent with simplified PTO modelling approaches used in early-stage WEC analysis, where the PTO is often represented through an equivalent damping term in order to evaluate power absorption and dynamic response [
43,
44]. The mean mechanical PTO power over one period of harmonic motion was then calculated as:
The simplified energy estimate and the first-order heave-response model were not treated as competing predictions, but as two levels of the same modelling hierarchy. The simplified estimate provides a screening-level assessment of the energy potential of the concept, whereas the heave-response model quantifies the sensitivity of the results to operational mass, added mass, hydrodynamic damping, PTO damping and assumed conversion-path efficiencies. Such a hierarchical modelling approach is consistent with the staged development of point-absorber WEC models, where analytical models are used for conceptual assessment and parametric studies, while BEM, CFD and experimental testing are required for detailed hydrodynamic validation [
43,
66,
67].
It should be emphasized that the present model is a first-order analytical representation and does not replace full hydrodynamic calculations based on BEM, CFD, or experimental validation. In particular, the frequency-dependent curves A
z (ω), B
z (ω), and F
exc (ω), require separate numerical or experimental identification. In the present analysis, these quantities were treated parametrically to evaluate the influence of hydrodynamic uncertainty on the buoy response. This limitation is consistent with the distinction between conceptual analytical models and higher-fidelity hydrodynamic models reported in the literature [
43,
67,
68].
3.3. Sensitivity to Effective Operational Density
The operational mass of the buoy is one of the key parameters affecting its dynamic response in heave. In a practical marine device, this mass depends not only on the geometrical volume of the structure, but also on the shell material, wall thickness, internal components, PTO equipment, pneumatic hardware, ballast and mooring-related elements. Therefore, instead of assigning a single fixed mass to the buoy, a parametric analysis based on the effective operational density was introduced.
The effective density was defined as a fraction of seawater density:
where
f is the dimensionless effective-density ratio and
is the seawater density. Four cases were considered:
The case f = 0.10 represents a lightweight buoy configuration suitable for screening- level conceptual assessment. The cases, f = 0.25, f = 0.50, and f = 0.75 represent increasingly ballasted operational configurations, accounting for the possible contribution of structural material, internal equipment, PTO components and pneumatic subsystems. This approach makes it possible to quantify the influence of operational mass and ballast on the natural period, heave RAO and PTO-based power estimate. Parametric analysis of inertia, damping and PTO-related assumptions is consistent with early-stage modelling practice for point-absorber WECs, for which the dynamic response strongly depends on the system mass, added mass, hydrodynamic damping and PTO characteristics [
43,
44,
67,
68].
For each case, the operational mass was calculated as:
where
The comparative dynamic analysis was carried out using:
where
is the added mass in heave,
is the damping ratio, and
is the fraction of the total damping attributed to the PTO. These values were used as parametric comparison assumptions and should not be interpreted as experimentally validated properties of the device.
For the lightweight case
, the equilibrium waterline is located within the lower hemispherical sections of the external floaters; therefore, a reduced waterplane area was used. For the
,
, and
cases, the equilibrium waterline was assumed to intersect the cylindrical sections of the external floaters and the central column, resulting in an approximately constant waterplane area:
The results of the effective-density sensitivity analysis are summarized in
Table 2.
The effective density was calculated as , where is the effective-density ratio and is the assumed seawater density. The operational mass was calculated as , with . The added mass in heave was assumed as , the damping ratio was set to , and the share of PTO damping in the total damping was assumed as . The reference regular-wave condition used in the comparison was defined by the wave period and wave amplitude .
For the lightweight case, a reduced waterplane area was used because the equilibrium waterline is located within the lower hemispherical sections of the external floaters. For the , , and cases, the equilibrium waterline was assumed to intersect the cylindrical sections of the external floaters and the central column, resulting in an approximately constant waterplane area.
In the table, denotes the waterplane area, is the hydrostatic restoring stiffness, is the natural angular frequency in heave, is the corresponding natural period, is the heave response amplitude operator evaluated for the reference wave condition, is the mean mechanical power absorbed by the PTO, and is the daily electrical energy estimate calculated for . The values of and should be interpreted as parametric outputs of the first-order heave-response model, not as experimentally validated wave-to-wire performance.
Increasing the effective operational density increases the system inertia and shifts the natural period of the buoy towards longer periods. The natural period increases from approximately 1.17 s for the lightweight configuration to approximately 2.96 s for the case. However, even for the heaviest analysed configuration, the natural period remains shorter than the reference wave period of . Therefore, the analysed geometry should not be interpreted as a resonance-tuned point absorber for the reference wave condition. Instead, it behaves as a buoyancy-dominated system whose heave response depends on operational mass, damping and wave excitation assumptions.
The results also show that the PTO-based power estimate and the corresponding daily energy estimate are sensitive to the assumed operational mass. These values should not be interpreted as experimentally validated wave-to-wire energy production. They represent parametric outputs of the first-order heave-response model, intended to quantify the influence of mass and ballast assumptions on the dynamic behaviour of the buoy. A complete validation of the response would require frequency-dependent hydrodynamic coefficients and higher-fidelity numerical or experimental analysis [
43,
67,
68].
3.4. Sensitivity to Conversion-Path Efficiency
The efficiency of the power take-off system and subsequent energy-conversion path is one of the key factors determining the final amount of useful energy obtained from a wave energy absorber. In WEC systems, the PTO is not merely a final conversion component; it also affects the dynamic response of the device, because its damping influences the motion amplitude, buoy velocity and mechanical power that can be extracted from wave-induced oscillations [
43,
44].
In the analysed concept, two pathways for using the mechanical energy absorbed by the PTO were considered. The first pathway is electrical conversion, in which mechanical energy is converted into electrical energy. The second pathway is pneumatic energy storage, in which part of the buoy motion can be used to compress air and store energy in the form of pressurised gas. Since the actual efficiency of both pathways depends on component selection, mechanical losses, flow losses, generator characteristics, valve operation, compression losses, leakage and storage-system configuration, a sensitivity analysis was introduced instead of relying on a single fixed efficiency value.
The useful daily electrical energy was calculated as:
where
is the electrical conversion efficiency and
is the daily mechanical energy absorbed by the PTO.
Similarly, the daily pneumatic energy-storage estimate was calculated as:
where
is the pneumatic conversion efficiency.
For the electrical conversion path, the following efficiency values were analysed:
In the baseline screening-level estimate, electrical and pneumatic conversion efficiencies of 10% and 5%, respectively, were used as conservative reference assumptions. These values were subsequently extended through a parametric sensitivity analysis of the electrical and pneumatic conversion pathways.
For the pneumatic path, the following values were analysed:
The value of was treated as a conservative baseline assumption, accounting for possible losses associated with compression, valve operation, flow resistance, leakage and air-storage configuration.
The analysis was performed for two representative operational-mass cases: the lightweight configuration
and the ballasted configuration
. For these cases, the daily mechanical energy absorbed by the PTO was:
for
, and:
for
.
The results of the electrical-efficiency sensitivity analysis are presented in
Table 3.
The results of the pneumatic-efficiency sensitivity analysis are shown in
Table 4.
The results show a linear dependence of the final useful energy estimate on the assumed conversion-path efficiency. Therefore, the electrical and pneumatic energy values should not be interpreted as experimentally validated production forecasts, but as scenario-dependent estimates based on assumed PTO and conversion-path efficiencies. This treatment is appropriate for the conceptual modelling stage, because actual conversion efficiencies can only be determined after component selection, PTO-characteristic identification and experimental validation [
43,
44,
66].
3.5. Hydrostatic Stability Assessment and Baseline-Configuration Comparison
A simplified hydrostatic stability assessment for small heel angles was carried out to quantify the effect of the three-arm geometry on buoy stability. This analysis does not replace a complete naval-architecture stability assessment or a full 6DOF hydrodynamic model; however, it provides a first-order measure of the influence of buoyancy distribution on the metacentric radius and restoring moment. In point-absorber WECs, buoy geometry, inertia, buoyancy distribution and PTO coupling are known to affect both the dynamic response and the energy-absorption capability of the system [
66,
67,
68].
For small heel angles, the metacentric height can be expressed as:
where
is the vertical position of the centre of buoyancy,
is the metacentric radius, and
is the vertical position of the centre of gravity. The metacentric radius was calculated as:
where
is the second moment of area of the waterplane about the heel axis and
is the submerged volume.
Because the actual position of the centre of gravity depends on the mass distribution of the structure, PTO components, pneumatic subsystem, ballast and auxiliary equipment, a single arbitrary value of
was not assigned. Instead, the metacentric height was evaluated conditionally as:
where
represents the relative position of the centre of gravity with respect to the centre of buoyancy. Three representative values were considered:
This approach allows the stability margin to be assessed without assuming an experimentally unverified centre-of-gravity location.
The waterplane second moment of area of the three-arm configuration was calculated as the sum of the individual second moments of the three circular external-floater waterplanes, the central hollow-column waterplane, and the parallel-axis contribution resulting from the offset of the external floaters from the central axis. For three floaters arranged symmetrically at 120°, this can be written as:
where
is the radius of the external floater,
and
are the outer and inner radii of the central column, respectively,
, and
is the distance between the axis of an external floater and the central axis of the system.
Because the exact value of
depends on the final CAD geometry and connector layout, three representative spacing variants were analysed:
The resulting waterplane second moments of area are presented in
Table 5.
The results show that the waterplane second moment of area increases strongly with floater spacing, because the main contribution arises from the parallel-axis term . Therefore, the hydrostatic advantage of the three-arm configuration results not only from the buoyancy volume itself, but also from the spatial distribution of buoyancy around the central axis.
The metacentric radius
was calculated for the four effective-density cases, for which the submerged volume is:
The results are summarized in
Table 6.
For the intermediate spacing case
, the conditional metacentric height was calculated for three values of
, and the results are presented in
Table 7.
The results indicate that the , , and configurations retain positive metacentric height over the analysed range of . The case is more sensitive to the centre-of-gravity location and would require careful ballast distribution and lowering of the centre of gravity. This represents an important design constraint for further development of the device.
For small heel angles, the restoring moment can be approximated as:
For the representative case
,
,
, and
, the conditional metacentric height is:
which gives:
To assess the hydrostatic advantage of the three-arm geometry, a normalized comparison with baseline configurations was also performed. A single circular buoy, a two-floater arrangement, and the proposed three-arm buoy were compared for the same total waterplane area. For
, the obtained values are presented in
Table 8.
For the
case, the corresponding metacentric radii are presented in
Table 9.
The comparison shows that the three-arm configuration provides approximately 91% higher waterplane second moment of area than a single circular buoy with the same total waterplane area. A two-floater arrangement can provide higher stability about one axis, but it also introduces a weak stability axis. Therefore, the main advantage of the three-arm geometry is a more directionally balanced hydrostatic response, which is favourable for a point absorber exposed to waves approaching from different directions.
4. Result
4.1. Analysis of the Characteristics of a Three-Arm Float Under Average Wave Conditions in the Baltic Sea
Analysis of the Height of the Float’s Motion in Relation to the Average Wave Conditions in the Baltic Sea
- I.
Average amplitude of the wave (
):
- II.
Wave period ():
This results in the angular frequency of the waves:
Generator Operating Conditions:
The generator converts 10% of the float’s kinetic energy into electrical energy.
The system operates continuously, with the assumption that the wave conditions remain constant throughout the year.
Average wave conditions in the Baltic Sea
Input:
The float’s pitch () is the result of the movement of the wave that lifts the float to the amplitude and lowers it in the opposite direction. Theoretically, the swimmer’s stroke is:
where
is the difference between the highest point (wave crest) and the lowest point (wave valley).
The theoretical jump is:
,
Consideration of drag and dynamic behavior of the float
In fact, the swimmer does not achieve a full jump because:
Taking into account the damping and characteristics of the model (e.g., 10% generator damping, hydrodynamic resistance), the effective stroke can be estimated at 80–90% of the theoretical stroke, which gives approximately:
- III.
Energy in one cycle
- (a)
Generator:
The generator converts 10% of the float’s kinetic energy into electrical energy.
Kinetic energy () is a function of time, calculated at each moment of the cycle:
where
—float weight,
—speed of sinusoidal motion:
coordinate:
—swimmer’s jump,
—angular frequency.
Kinetic energy calculated as integral over time in one cycle
The energy generated by the generator is:
Thanks to the analysis, the following results were obtained:
- (b)
Pistons (downward movement):
The calculations gave the result:
- IV.
Daily energy generated:
- (a)
Generator:
- (b)
Pistons:
4.2. Results of the Operating Characteristics Analysis of the Three-Arm Float
Energy per single cycle:
Generator: 81.72 J
Pistons: 20.43 J
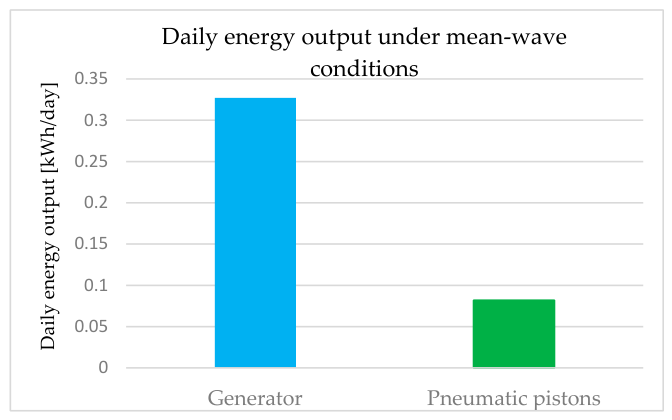
Daily energy output:
Pistons: 0.082 kWh
Generator: 0.327 kWh
Total:
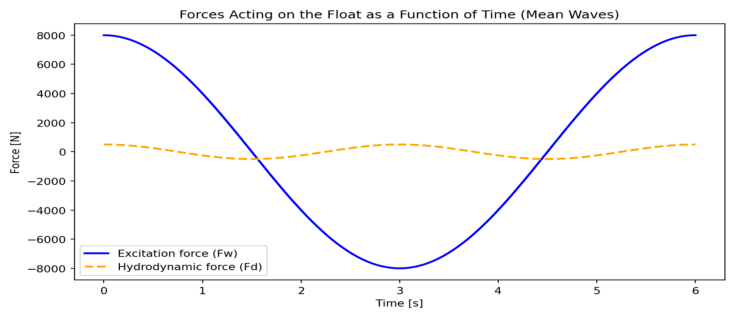
The excitation and hydrodynamic forces acting on the first float over the motion cycle are shown in
Figure 3.
X-axis (Time [s]): Represents the motion period of the float, taking into account variations in forces over time.
Y-axis (Force [N]): Illustrates the magnitude of forces acting on the float, expressed in newtons (N).
The plot illustrates the time-dependent variation in forces acting on the float:
Excitation force (Fw): Reflects the influence of ocean waves on the float. Its values vary from approximately −8000 N (wave trough) to 8000 N (wave crest), exhibiting a sinusoidal pattern.
Hydrodynamic force (Fd): Represents the motion resistance of the float in water. It oscillates within the range of −500 N to 500 N, indicating high hydrodynamic efficiency of the structure.
The system design should account for the variable forces acting on the float, particularly those reaching values of up to 8000 N. Additionally, the implementation of damping mechanisms should be considered, as they could further reduce the hydrodynamic force (Fd), thereby improving the overall efficiency of the system.
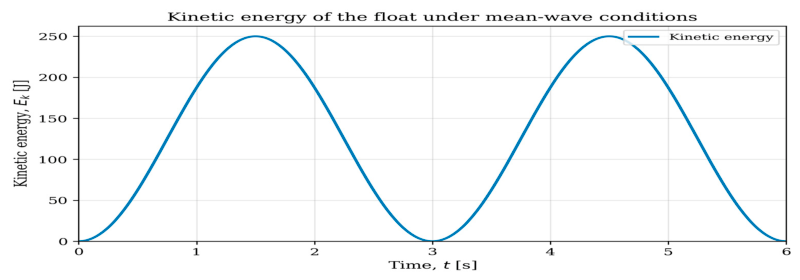
The kinetic energy variation of the first float under mean wave conditions is presented in
Figure 4.
X-axis (Time [s]): Represents the duration of the float operating cycle, illustrating the variation in its kinetic energy over time.
Y-axis (Energy [J]): Represents the magnitude of the float’s kinetic energy expressed in joules (J). It illustrates changes in kinetic energy during the cyclic motion of the float.
The plot presents the time-dependent variation in the float’s kinetic energy. The kinetic energy reaches:
Maximum (~250 J): When the float attains its highest velocity at the midpoint of the motion, resulting in the greatest kinetic energy.
Minimum (0 J): At the turning points of the float motion (crest and trough), where the velocity equals 0 m/s.
The kinetic energy of the float, reaching maximum values of approximately 250 J, constitutes a key driving component of the system. Its sinusoidal variation over time, resulting from the cyclic motion of the float, highlights the strong dependence of system efficiency on wave dynamics. Zero values at the turning points (float velocity = 0 m/s) limit the continuity of energy utilization.
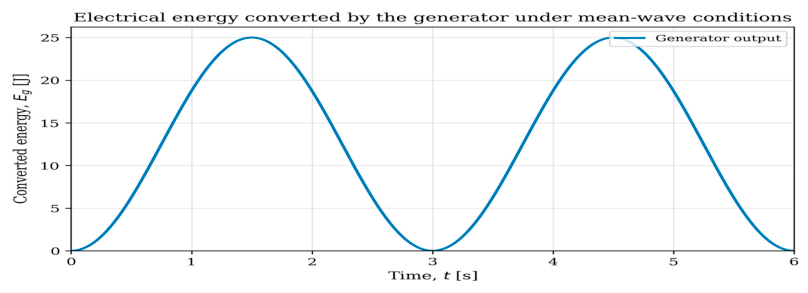
The energy generated by the generator in the first system concept under mean wave conditions is shown in
Figure 5.
X-axis (Time [s]): Represents the duration of the float operating cycle, illustrating the periodic nature of energy generation.
Y-axis (Energy [J]): Shows the amount of electrical energy generated by the system, expressed in joules (J).
The electrical energy generated by the system corresponds to 10% of the total kinetic energy.
The plot presents periodic variations in the energy generated by the generator, reflecting the sinusoidal operating characteristics of the system:
Maximum (~25 J): Occurs at the moment of the highest float velocity, when kinetic energy is efficiently converted into electrical energy.
Minimum (0 J): Appears at the turning points of the float motion, where the absence of motion results in zero energy generation.
The plot demonstrates that the generator efficiency is strongly dependent on the dynamic behavior of the float. A key design challenge remains improving energy utilization during low-generation phases and minimizing system losses. Matching the generator parameters to the characteristics of the motion cycle can significantly enhance the overall system efficiency.
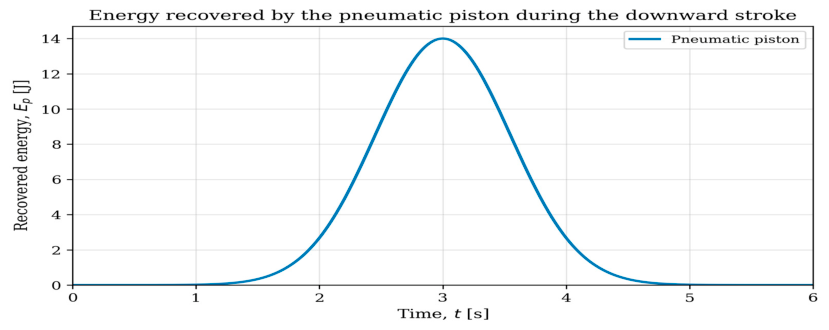
The energy generated by the pistons over the operating cycle of the first float under mean wave conditions is presented in
Figure 6.
X-axis (Time [s]): Represents time within the operating cycle of the float, illustrating the moments when the pistons are active in the energy conversion process.
Y-axis (Energy [J]): Energy generated by the pistons, expressed in joules (J).
The energy generated by the pistons is proportional to the force and downward velocity of the float motion.
The maximum energy value (~14 J) corresponds to approximately 5% of the float’s kinetic energy, in accordance with the system efficiency assumptions.
The energy generated by the pistons is limited to periods of peak activity, which indicates the need for precise synchronization and optimization of their operation. The system could benefit from the implementation of energy storage–supporting technologies. The piston efficiency is consistent with the design assumptions and constitutes an important component of the overall system efficiency. The compressed air energy corresponds to 5% of the kinetic energy.
A comparison of daily energy output generated by the generator and pistons in the first system concept is shown in
Figure 7.
X-axis (Components): Presents the two main elements of the system—the generator and the pistons—illustrating their respective contributions to the daily energy supply.
Y-axis (Daily energy [kWh]): Shows the amount of generated energy expressed in kilowatt-hours (kWh), enabling a comparison of the energy output of individual components.
4.3. Analysis of System Performance Under the Highest 10% of Waves in the Baltic Sea
The system performance analysis was carried out for conditions corresponding to the highest 10% of waves occurring in the Baltic Sea. Input data consisted of wave parameters representative of this range of interactions.
The significant wave height was determined to be 1.5 m, which corresponds to average values observed in the analyzed area. According to assumptions based on the Rayleigh distribution, the height of the highest 10% of waves falls within the range of approximately to . In this analysis, the upper bound of this range was adopted to estimate extreme conditions.
The maximum wave height was therefore determined as:
The wave amplitude, defined as half of its height, is:
The vertical motion range of the float
, corresponding to the difference between the wave crest and trough, is:
Under real conditions, hydrodynamic damping and energy losses due to motion resistance must be considered. It was assumed that the effective stroke of the float constitutes 80% to 90% of the theoretical value, leading to:
Ultimately, for the highest 10% of waves in the Baltic Sea, the theoretical float stroke is 3.0 m, while the effective stroke ranges from 2.4 m to 2.7 m.
In the analysis, it was assumed that the generator converts 10% of the kinetic energy of the float motion into electrical energy. The kinetic energy of the system is a function of the instantaneous velocity of the float and is described by:
where the float mass is
.
The float motion was modeled as harmonic, and its velocity is given by:
where
is the stroke of the float, and
is the angular frequency.
The total kinetic energy in one motion cycle was determined by integrating over the oscillation period
:
On this basis, the electrical energy generated by the system in one cycle was determined as:
It was assumed that the piston system generates energy only during the downward motion phase of the float, i.e., for
. Therefore, the kinetic energy considered takes the form:
The total kinetic energy in this phase was determined by integration over the appropriate time interval:
Assuming a conversion efficiency of 5%, the energy generated by the pistons in one cycle is:
For a wave period of
, the number of cycles per day is:
The daily energy production of the generator is:
which corresponds to:
For the piston system, which operates only during half of the cycle, the effective number of cycles is:
Thus, the daily energy production is:
which converts to:
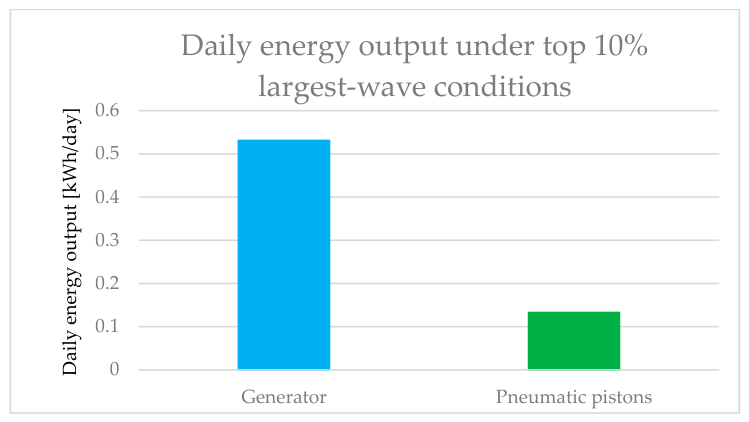
The analysis showed that the energy generated in one cycle is 183.87 J for the generator and 45.97 J for the piston system. On a daily scale, this corresponds to energy production of 0.736 kWh and 0.183 kWh, respectively.
The total daily energy production of the analyzed system is:
The obtained results indicate the potential application of the analyzed solution in marine wave energy harvesting systems, although the actual performance will depend on operating conditions and the efficiency of the applied components.
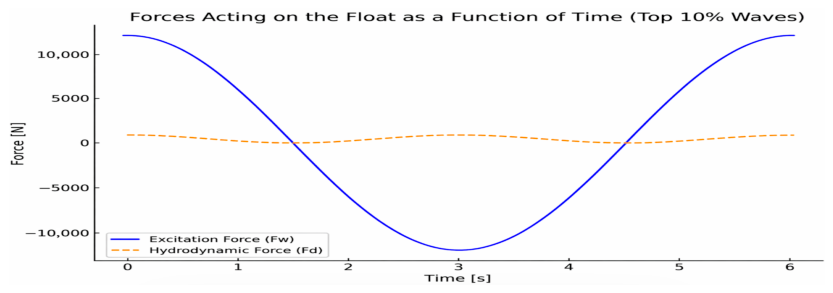
The forces acting on the first float as a function of time under conditions corresponding to the top 10% of waves are shown in
Figure 8.
X-axis (Time [s]): Represents the duration of the float motion cycle, showing periodic variations in the forces acting on the float.
Y-axis (Force [N]): Represents the magnitude of the forces acting on the float, expressed in newtons (N).
Excitation force (): Reaches a maximum of approximately 10,000 N and a minimum of −10,000 N, reflecting the intensity of wave action under these conditions.
Hydrodynamic force (): Reaches maximum values of around 500 N, indicating efficient hydrodynamics and limited motion resistance.
The forces acting on the float result from interactions with waves and water resistance. The excitation force (), generated by wave oscillations, is the primary source of energy but requires a robust float structure due to high loads. The hydrodynamic force (), dependent on the shape and velocity of the float, remains relatively low, indicating good design optimization and minimized energy losses. Effective utilization of both forces is crucial for the overall efficiency of the system.
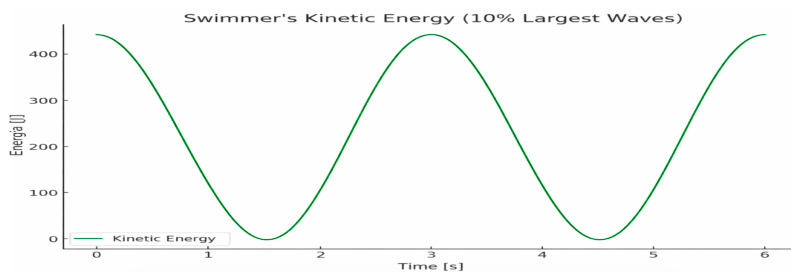
The kinetic energy of the first float under conditions corresponding to the top 10% of waves is presented in
Figure 9.
X-axis (Time [s]): Represents the duration of the float motion cycle, showing the sinusoidal variation in energy over time.
Y-axis (Energy [J]): Represents the kinetic energy of the float, expressed in joules (J).
The kinetic energy of the float varies sinusoidally, reflecting the periodic nature of wave motion:
Maximum value (~600 J): Reached at the midpoint of each cycle, when the float velocity is highest, confirming a significant mechanical energy potential in the system.
Minimum value (0 J): Occurs at the turning points, when the float velocity drops to zero, leading to the disappearance of kinetic energy.
The kinetic energy of the float is the primary energy source in the system. Its maximum values (~600 J) are crucial for ensuring efficient generator operation. Zero values at motion reversal points limit the continuity of system operation; however, this limitation can be mitigated by implementing energy storage systems or further optimizing the float design to better utilize mechanical potential at these moments.
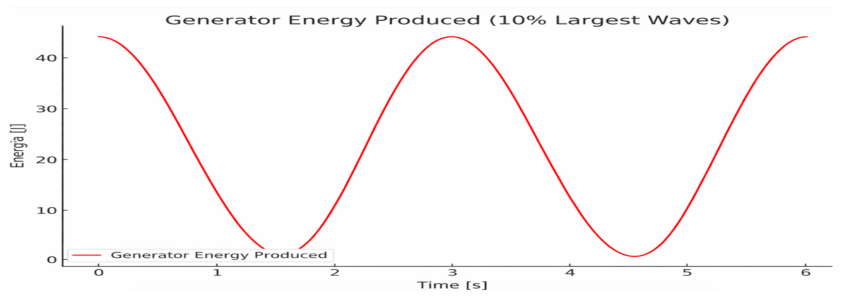
The energy generated by the generator in the second concept under conditions corresponding to the top 10% of waves is shown in
Figure 10.
X-axis (Time [s]): Represents the duration of the float operation cycle, accounting for variations in energy generation as a function of its motion.
Y-axis (Energy [J]): Illustrates the amount of electrical energy generated by the system, expressed in joules (J), indicating the dynamics of converting the float’s kinetic energy.
The energy generated by the generator is approximately 10% of the float’s kinetic energy, highlighting its dependence on motion:
Maximum value (~40 J): Occurs at mid-cycle, when the float’s velocity and kinetic energy reach their highest values. This is the key moment when the system achieves maximum efficiency.
Minimum value (0 J): Appears at the turning points, when the float motion stops, preventing energy generation.
Energy generation by the generator is strongly dependent on the dynamics of the float’s motion, reaching peak efficiency at maximum velocity. The turning points of the cycle, where energy drops to zero, indicate limitations in the continuity of system operation. Implementing energy storage systems could mitigate these interruptions, improving the stability and overall efficiency of the system.
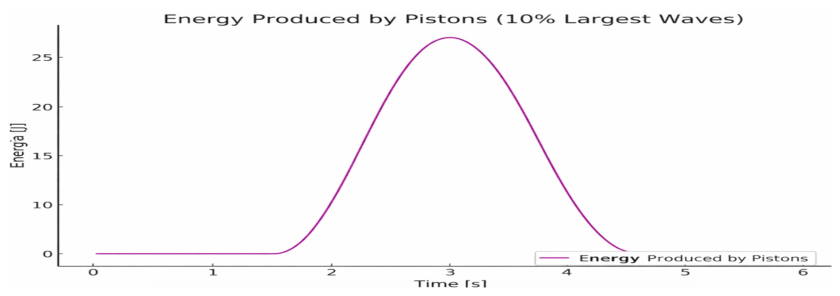
The energy generated by the pistons in the second concept under conditions corresponding to the top 10% of waves is presented in
Figure 11.
X-axis (Time [s]): Represents the duration of the float operation cycle, including periods of piston activity during energy conversion.
Y-axis (Energy [J]): Shows the amount of energy generated by the pistons, expressed in joules (J), illustrating their operational dynamics.
The energy generated by the pistons constitutes approximately 5% of the float’s kinetic energy:
Maximum value (~20 J): Reached at mid-cycle during the downward motion of the float, when the pistons operate with the highest efficiency.
Minimum value (0 J): Occurs during inactive phases of the pistons, such as upward motion or at turning points, where the lack of compression prevents energy generation.
The energy generated by the pistons is limited to short periods of their activity, which results from their operating principle and the float motion cycle. Implementing energy storage mechanisms would allow for better utilization of the generated energy, ensuring greater system stability. Improving piston synchronization with the float’s motion cycle and optimizing their performance under high-load conditions could significantly enhance both the efficiency and durability of the entire system.
A comparison of energy generated by the generator and pistons under conditions corresponding to the top 10% of waves is shown in
Figure 12.
X-axis (Components): Presents the two main elements of the energy generation system—the generator and the pistons—showing their contribution to daily electrical energy production.
Y-axis (Daily energy [kWh]): Shows the daily amount of energy produced by each component, expressed in kilowatt-hours (kWh).
4.4. Extended Parametric Results and Hydrostatic Interpretation
The baseline energy assessment provided an initial estimate of the energy that could be obtained from the vertical oscillatory motion of the buoy under representative Baltic Sea wave conditions. However, the additional parametric analysis presented above makes it possible to interpret these results in a broader dynamic and hydrostatic context. In particular, the extended analysis shows how the assumed operational mass, effective density, PTO damping, conversion-path efficiency and hydrostatic geometry influence the response of the system.
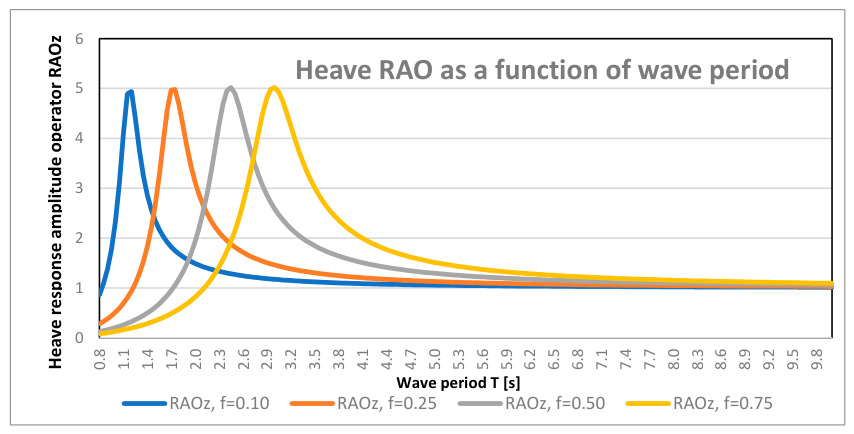
The effective-density analysis indicates that the lightweight configuration, represented by , corresponds to a low-mass conceptual configuration suitable for preliminary feasibility assessment. Increasing the effective-density ratio from to increases the operational mass and shifts the natural period of the buoy towards longer periods. The natural period increases from approximately for the lightweight configuration to approximately for the case. Nevertheless, the natural period remains shorter than the reference wave period of in all analysed cases. Therefore, the proposed geometry should not be interpreted as a resonance-tuned point absorber for the reference wave condition. Instead, the buoy behaves as a buoyancy-dominated oscillator whose heave response is governed by operational mass, hydrostatic restoring stiffness, damping and wave excitation assumptions.
The RAO analysis indicates this interpretation. The heave response amplitude operator changes with effective density because the system inertia affects the natural frequency of the buoy. Higher effective-density cases move the response peak towards longer wave periods, but the reference wave period remains outside the resonance range of the analysed configurations. This result is important from a design perspective: increasing ballast and operational mass may improve the dynamic response in longer-period waves, but it does not automatically provide resonance tuning. Further optimization of buoy geometry, ballast distribution and PTO damping would be required to approach resonance-based energy amplification.
The curves in
Figure 13. were calculated using the first-order heave-response model with
,
, and
. The vertical dashed line indicates the reference wave period
. The figure illustrates the sensitivity of the heave response to operational mass and ballast assumptions; it does not represent BEM-derived hydrodynamic RAO.
The PTO-based energy estimates also show a strong dependence on operational mass and damping assumptions. For the first-order heave-response model and an electrical conversion efficiency of , the daily electrical energy estimate ranges from approximately for the case to approximately for the case. These values should be treated as parametric outputs of the heave-response model, not as experimentally validated wave-to-wire production values. The comparison shows that the energy estimate is sensitive to the assumed displacement and PTO parameters, which supports the need for parametric rather than single-value interpretation of the energy results.
The conversion-efficiency analysis further indicates that the final useful energy output depends linearly on the assumed conversion-path efficiency. The electrical pathway was analysed for
= 5–30%, while the pneumatic pathway was analysed for
= 2–15%. The values of
and
were retained as conservative baseline assumptions for the conceptual assessment. However, the results indicate that these efficiencies should not be interpreted as fixed validated properties of the system. Actual values will depend on the selected generator, PTO architecture, pneumatic components, compression losses, valve operation, leakage and operating conditions [
43,
44,
66].
The hydrostatic stability assessment provides additional support for the use of a three-arm geometry. The waterplane second moment of area increases strongly with the offset radius of the external floaters. For , the three-arm configuration provides , which is approximately 91% higher than the value obtained for a single circular buoy with the same total waterplane area. This confirms that the spatial distribution of buoyancy improves the hydrostatic characteristics of the system. The advantage of the three-arm geometry is not only a higher waterplane second moment of area compared with a single buoy, but also a more directionally balanced hydrostatic response than a two-floater configuration.
The conditional metacentric-height analysis shows that the , , and cases retain positive metacentric height for the analysed range of . The case is more sensitive to the centre-of-gravity location and may require careful ballast distribution and lowering of the centre of gravity. This result indicates that increasing operational mass can improve some aspects of the dynamic response, but it must be balanced against hydrostatic stability requirements.
Overall, the extended results show that the three-arm buoy concept is feasible as a preliminary point-absorber configuration for moderate Baltic Sea conditions, but its performance depends strongly on operational mass, PTO damping, conversion efficiency and ballast distribution. The simplified energy estimate and the first-order heave-response model should therefore be interpreted as complementary levels of analysis. The former provides a conservative screening-level estimate, while the latter identifies the sensitivity of the system to key design and hydrodynamic parameters. Full performance assessment requires frequency-dependent hydrodynamic coefficients and experimental validation.
The key findings from the extended parametric analysis are summarized in
Table 10.
The table summarizes the influence of effective operational density, PTO assumptions and buoyancy distribution on the dynamic and hydrostatic behaviour of the three-arm buoy. Detailed assumptions and numerical values are provided in the preceding sensitivity and hydrostatic-stability tables.
5. Discussion
The obtained results indicate that the proposed three-arm buoy can be considered a feasible conceptual point-absorber configuration for moderate Baltic Sea wave conditions. The adopted geometry promotes vertical oscillatory motion, i.e., heave, which is the primary energy-conversion mechanism in the analysed model. At the same time, the symmetric arrangement of three external floaters provides a more balanced distribution of buoyancy around the central axis, which is beneficial from the perspective of hydrostatic stability and response to variable wave directions [
42,
67,
68].
The baseline screening-level energy estimate indicates that energy harvesting is possible under both average wave conditions and conditions corresponding to the highest 10% of Baltic Sea waves. Under average conditions, the total daily energy output was approximately , while under stronger wave conditions it increased to approximately . These values confirm the strong dependence of the system output on wave amplitude and period. However, they should be interpreted as preliminary order-of-magnitude estimates rather than final operational predictions, because they were obtained under simplified deterministic regular-wave assumptions.
The extended first-order heave-response model provides a broader interpretation of the baseline energy estimates. The effective-density analysis showed that increasing the operational mass shifts the natural period of the buoy towards longer periods. For the analysed effective-density ratios
,
,
, and
, the natural period increased from approximately
to approximately
. Nevertheless, the natural period remained shorter than the reference wave period of
in all analysed cases. This means that the system should not be interpreted as a resonance-tuned point absorber for the reference wave condition. Instead, it behaves as a buoyancy-dominated oscillator whose response depends on operational mass, restoring stiffness, damping and wave excitation assumptions [
30,
42,
68].
The RAO analysis supports this interpretation. The response peak shifts towards longer wave periods as the effective operational density increases, indicating that ballast and internal equipment may influence the dynamic response of the system. However, increasing the operational mass alone does not provide resonance tuning for the analysed reference wave period. From a design perspective, this suggests that further optimization should consider the combined influence of geometry, ballast distribution, PTO damping and hydrodynamic coefficients rather than treating mass increase as a sufficient design improvement [
67,
68].
The PTO-based energy estimates obtained from the first-order heave-response model also demonstrate the sensitivity of the system to operational mass and damping assumptions. For an assumed electrical conversion efficiency of , the daily electrical energy estimate ranged from approximately for the lightweight configuration to approximately for the most heavily ballasted analysed case . These values are higher than the baseline screening-level estimate because they arise from the extended dynamic model and different mass-response assumptions. Therefore, the two sets of results should not be treated as competing predictions, but as two levels of a modelling hierarchy: a conservative screening estimate and a parametric heave-response estimate.
The analysis of conversion-path efficiency indicates that the final useful energy output scales linearly with the assumed efficiency of the electrical and pneumatic pathways. The values
and
were retained as conservative reference assumptions, but the extended sensitivity analysis showed that the useful energy estimate may change substantially depending on component-level performance. This confirms that the generator and pneumatic system efficiencies should not be interpreted as fixed validated properties of the device. Instead, they should be treated as scenario parameters until the generator, PTO mechanism, compressor, valves and storage subsystem are selected and experimentally characterized [
43,
44,
66].
The dual-path energy-conversion concept remains technically attractive, but the role of each pathway should be interpreted with caution. The electrical generator remains the dominant useful-energy pathway in the present configuration, while the pneumatic system should be treated as a supplementary storage pathway. Compressed-air storage may be useful for smoothing and storing part of the recovered mechanical energy, but its practical contribution will depend on compression efficiency, valve timing, leakage, pressure variation and synchronization with buoy motion. These issues require a dedicated pneumatic subsystem model and experimental validation.
The hydrostatic analysis provides additional support for the three-arm geometry. For
, the three-arm buoy gives a waterplane second moment of area
, which is approximately 91% higher than that of a single circular buoy with the same total waterplane area. This indicates that the advantage of the three-arm geometry results primarily from the spatial distribution of buoyancy rather than from total volume alone. Compared with a two-floater configuration, the three-arm arrangement provides a more directionally balanced hydrostatic response, avoiding a pronounced weak stability axis [
33,
39,
40,
41].
The conditional metacentric-height analysis further shows that the , , and configurations retain positive stability margins for the analysed range . The case is more sensitive to the centre-of-gravity location and would require careful ballast distribution and lowering of the centre of gravity. This result is important because increasing operational mass may improve some aspects of the dynamic response but can also reduce the hydrostatic stability margin if the centre of gravity is not properly controlled.
The hydrodynamic force results should be interpreted within the limitations of the simplified model. The comparison between excitation and drag forces indicates that the structure may exhibit favourable motion characteristics under the assumed conditions. However, these force estimates do not replace a complete hydrodynamic load analysis. In particular, the present study does not provide BEM- or CFD-derived frequency-dependent added mass, radiation damping and excitation-force coefficients. Therefore, the force results should be treated as preliminary indicators of loading tendencies rather than as final design loads for structural verification [
43,
67,
68].
The main limitation of the present model is its restriction to first-order heave motion under regular wave excitation. This assumption is useful for conceptual analysis and controlled comparison of variants, but it does not fully represent real Baltic Sea operating conditions. In practice, the buoy response will be affected by irregular and multidirectional waves, six-degree-of-freedom motion, mooring-system coupling, nonlinear PTO behaviour, stroke limitations and transient loading. Therefore, the present results should be interpreted as a basis for further hydrodynamic and experimental development rather than as a complete validation of the device [
69,
70].
Future work should include the determination of frequency-dependent hydrodynamic coefficients , , and using BEM, CFD or experimental identification. The model should also be extended to six-degree-of-freedom motion and coupled with a mooring model. In addition, scaled laboratory tests should be performed to measure the heave RAO, identify PTO damping, verify ballast effects on stability and validate the pneumatic conversion pathway. Only after these steps will it be possible to assess the operational performance and scalability of the three-arm buoy under realistic Baltic Sea conditions.
Model Limitations, Validation Requirements and Future Work
The presented analysis should be interpreted as a conceptual and parametric assessment, representing an intermediate stage between a simplified energy estimate and a complete hydrodynamic model of a point-absorber WEC. The applied model makes it possible to evaluate the influence of geometry, operational mass, ballast, PTO damping and conversion-path efficiency on the heave response of the buoy. However, it does not replace a full hydrodynamic analysis based on BEM, CFD or experimental validation.
The most important limitation of the model is the absence of frequency-dependent hydrodynamic coefficients for the exact three-arm buoy geometry. In particular, the following functions were not determined at this stage:
corresponding to added mass, radiation damping and wave excitation force, respectively. In point-absorber modelling, these quantities are typically obtained using potential-flow methods, BEM/WAMIT tools, CFD simulations or experimental identification [
43,
66,
67,
68]. In the present model, they were therefore treated parametrically in order to evaluate the influence of hydrodynamic uncertainty on the system response.
A second limitation is the restriction of the motion model to a single degree of freedom, namely heave. This assumption is justified at the conceptual-analysis stage of a point absorber because vertical motion is the primary energy-extraction mechanism in the considered configuration. Under real operating conditions, however, the buoy response will involve coupled six-degree-of-freedom motion, including surge, sway, heave, roll, pitch and yaw. These couplings, particularly under irregular waves, oblique wave incidence and mooring interaction, should be included in future stages of the analysis [
66,
67,
68].
Another limitation is the representation of the wave field by regular waves. This approach enables a controlled analysis of the influence of basic wave parameters, such as amplitude and period, but it does not reproduce the full variability of a real sea state. Future modelling should therefore include irregular waves described by spectral formulations, such as JONSWAP or Pierson–Moskowitz spectra, and sea states representative of the southern Baltic Sea.
The PTO and pneumatic subsystems also introduce additional uncertainty. In the present model, the PTO was represented as an equivalent linear damping term, which is acceptable for early-stage modelling and conceptual testing Tom et al., 2022 [
44]; Li and Yu, 2012 [
43]. A real PTO system may, however, exhibit nonlinear behaviour, stroke limitations, force saturation, mechanical losses, electrical losses and efficiency dependence on velocity and loading. Similarly, the pneumatic pathway requires a separate model including air compression, valve losses, leakage, pressure variation and synchronization with buoy motion.
For this reason, the energy values reported in this study should be treated as scenario-dependent estimates rather than experimentally validated operational forecasts. Their main purpose is to identify the order of magnitude of the energy potential and to indicate which structural and dynamic parameters have the strongest influence on the system response.
Future work should include four main stages. First, frequency-dependent hydrodynamic coefficients , and should be determined for the exact buoy geometry using BEM or CFD. Second, the model should be extended to at least six degrees of freedom and coupled with a mooring model. Third, laboratory validation should be carried out using a small-scale wave-testing setup, including measurements of heave response, identification of PTO damping and comparison of the experimental RAO with the computational model. Fourth, the geometry, operational mass, ballast and PTO parameters should be optimized with respect to the trade-off between energy yield, motion limitation and structural safety.
The planned laboratory validation should include tests of scaled buoy models under regular and irregular wave conditions. Particular attention should be given to controlled PTO loading, because model-scale WEC tests often use simplified PTO simulators, such as linear or active damping systems, to evaluate the influence of power-take-off loading on device response Tom et al., 2022 [
44]; Guo et al., 2022 [
68]. Such validation would make it possible to move from conceptual analysis towards an experimentally supported characterization of buoy performance.




 ,
,