Article

Experimental Evaluation of Two- and Four-Bed PSA Cycles for Hydrogen Recovery from Syngas and Water–Gas Shift Syngas

Institute of Energy and Fuel Processing Technology, Zamkowa 1, 41-803 Zabrze, Poland
*
Author to whom correspondence should be addressed.
Energies 2026, 19(12), 2753; https://doi.org/10.3390/en19122753
Submission received: 11 May 2026 / Revised: 28 May 2026 / Accepted: 4 June 2026 / Published: 8 June 2026
(This article belongs to the Special Issue Advances in Hydrogen Energy and Fuel Cell Technologies)

Abstract

This study experimentally evaluates hydrogen recovery from synthetic syngas and water–gas shift (WGS) syngas using a laboratory-scale pressure swing adsorption (PSA) unit equipped with layered activated carbon/zeolite 5A beds. Breakthrough tests were first performed to determine adsorption-time limits and identify the critical impurity controlling product quality. Continuous PSA experiments were then carried out using two cycle configurations: a two-bed Berlin-type cycle and a four-bed Linde-type cycle. CO was the first impurity breakthrough experimentally detected and it therefore defined the practical adsorption-time cut-off, whereas CO2 exhibited the strongest retention, especially in beds with an increased activated-carbon fraction. The results showed a clear trade-off between purity and recovery. The four-bed Linde-type cycle provided a wider operating window than the two-bed Berlin-type cycle, owing to pressure equalization and product-purge steps. The best overall performance was obtained for WGS syngas with the 1.6:1 AC:zeolite bed, reaching 99.5 vol.% H2 at 84% recovery and maintaining 99.2 vol.% H2 at 86% recovery. The tail gas was enriched in CO2 up to approximately 72 vol.%, indicating potential for integration with downstream CO2 management.

1. Introduction

Hydrogen is increasingly recognized as both a key industrial feedstock and an energy carrier for low-carbon energy systems. It is widely used in petroleum refining, ammonia and methanol synthesis, steelmaking, power generation, and emerging fuel-cell applications. In most large-scale production routes, hydrogen is not obtained as a pure stream but as a component of synthesis gas produced by steam methane reforming, partial oxidation, gasification, or related thermochemical processes. Depending on the feedstock and process conditions, syngas typically contains H2, CO, CO2, CH4, N2, and water vapor. For hydrogen-oriented applications, the H2 fraction is commonly increased by the water–gas shift reaction, which converts CO and steam into additional hydrogen and CO2. However, even after WGS, the gas still contains significant amounts of CO2 and residual impurities, which must be removed before downstream use [1,2,3,4,5,6].
Pressure swing adsorption is widely implemented for industrial hydrogen purification because it enables continuous separation of hydrogen-rich streams without the need for cryogenic temperatures or liquid solvents. In PSA, the separation is achieved by cyclic changes in pressure: impurities such as CO2, CO, CH4, and N2 are preferentially retained by the adsorbent at elevated pressure, while hydrogen passes through the bed as the weakly adsorbed product component. During depressurization and purge, the retained species are released and leave the system in the low-pressure tail-gas stream [7,8,9,10,11].
The performance of PSA-based hydrogen purification depends on several strongly coupled design and operating parameters, including feed-gas composition, adsorption pressure, purge-to-feed ratio, adsorption time, adsorbent selection, bed layering, number of adsorption columns, and cycle sequence. Commercial hydrogen PSA systems frequently employ layered beds, typically combining activated carbon for the removal of CO2 and CH4, with molecular sieves such as zeolite 5A or 13X for the removal of CO and N2. These configurations leverage the distinct adsorption affinities and mass-transfer behavior of syngas components, but they also introduce complex dynamic effects that cannot be fully assessed from equilibrium data or single-bed breakthrough tests alone [12,13,14,15,16,17,18,19].
For this reason, hydrogen purity should not be regarded as the sole indicator of PSA performance. While achieving high H2 purity is essential, it is frequently accomplished at the expense of hydrogen recovery, productivity, purge demand, cycle duration, and overall energy efficiency. From a process engineering standpoint, PSA systems should be assessed using a broader set of indicators, including H2 recovery, product purity, tail-gas flow rate and composition, cyclic stability, and the effects of pressure equalization and purge strategy. This comprehensive evaluation is particularly relevant for syngas- and WGS-derived hydrogen production, where the PSA tail gas may contain residual H2 along with CO2, CO, CH4, and N2. The composition of this stream influences not only the hydrogen balance but also the potential integration of PSA with CO2 capture, utilization, or storage concepts [9,20,21,22,23,24].
Although PSA is widely used in industry, there is a relative scarcity of publicly available experimental data on full-cycle dynamic hydrogen PSA performance. Most existing literature focuses on equilibrium adsorption, breakthrough behavior, numerical simulations, or selected cycle-optimization studies [7,25,26]. Experimental studies involving flexible laboratory-scale installations, representative multicomponent feed gases, and direct comparison of different PSA cycle configurations are less common. This limitation is particularly relevant for comparative studies involving syngas and WGS syngas, where changes in CO2 and CO concentration can significantly influence adsorption-front development, bed regeneration requirements, hydrogen losses, and the purity–recovery trade-off [21,22,27,28,29,30].
In a previous study, the authors presented a comprehensive literature analysis of PSA-based hydrogen purification from syngas and WGS syngas, addressing adsorbent selection, breakthrough behavior, and the preliminary design of PSA cycle sequences using layered beds of activated carbon and zeolite 5A [31]. This prior work provided the foundation for selecting adsorbent configuration and defining initial process assumptions. Nevertheless, the actual dynamic performance of the PSA system under cyclic operation, specifically regarding hydrogen purity, recovery, and tail-gas composition, remains to be experimentally validated.
While our previous paper [31] focused on literature-based assessment, adsorbent selection, breakthrough considerations, and preliminary PSA cycle design, the present work provides experimental validation under cyclic PSA operation. Its distinct contribution is the direct comparison of two PSA cycle configurations, i.e., the two-bed Berlin-type cycle and the four-bed Linde-type cycle, two layered-bed configurations with AC:zeolite ratios of 1:1 and 1.6:1, and two representative feed compositions, i.e., syngas and WGS syngas. The study reports experimentally measured breakthrough curves, cyclic steady-state hydrogen purity and recovery, safety margins to CO breakthrough, and tail-gas composition ranges. This allows the influence of bed configuration, feed composition, and cycle sequence to be quantified using a single laboratory PSA platform, which was not addressed in the previous work.
The present study addresses this gap by experimentally evaluating hydrogen separation from synthetic syngas and WGS syngas using a laboratory-scale PSA installation. Two PSA cycle configurations are investigated: a two-bed Berlin-type cycle and a four-bed Linde-type cycle. The study compares the effects of feed-gas composition and cycle configuration on hydrogen purity, hydrogen recovery, and low-pressure tail-gas composition under cyclic steady-state operation. By integrating breakthrough behavior, cycle-resolved PSA operation, and overall process indicators, this study provides experimental insight into the dynamic performance of layered-bed PSA systems for hydrogen purification and supports the development of optimized PSA configurations for integrated syngas-based hydrogen production and CO2 management.

2. Materials and Methods

All pressure values reported in this study are expressed as absolute pressures.

2.1. PSA Laboratory Setup

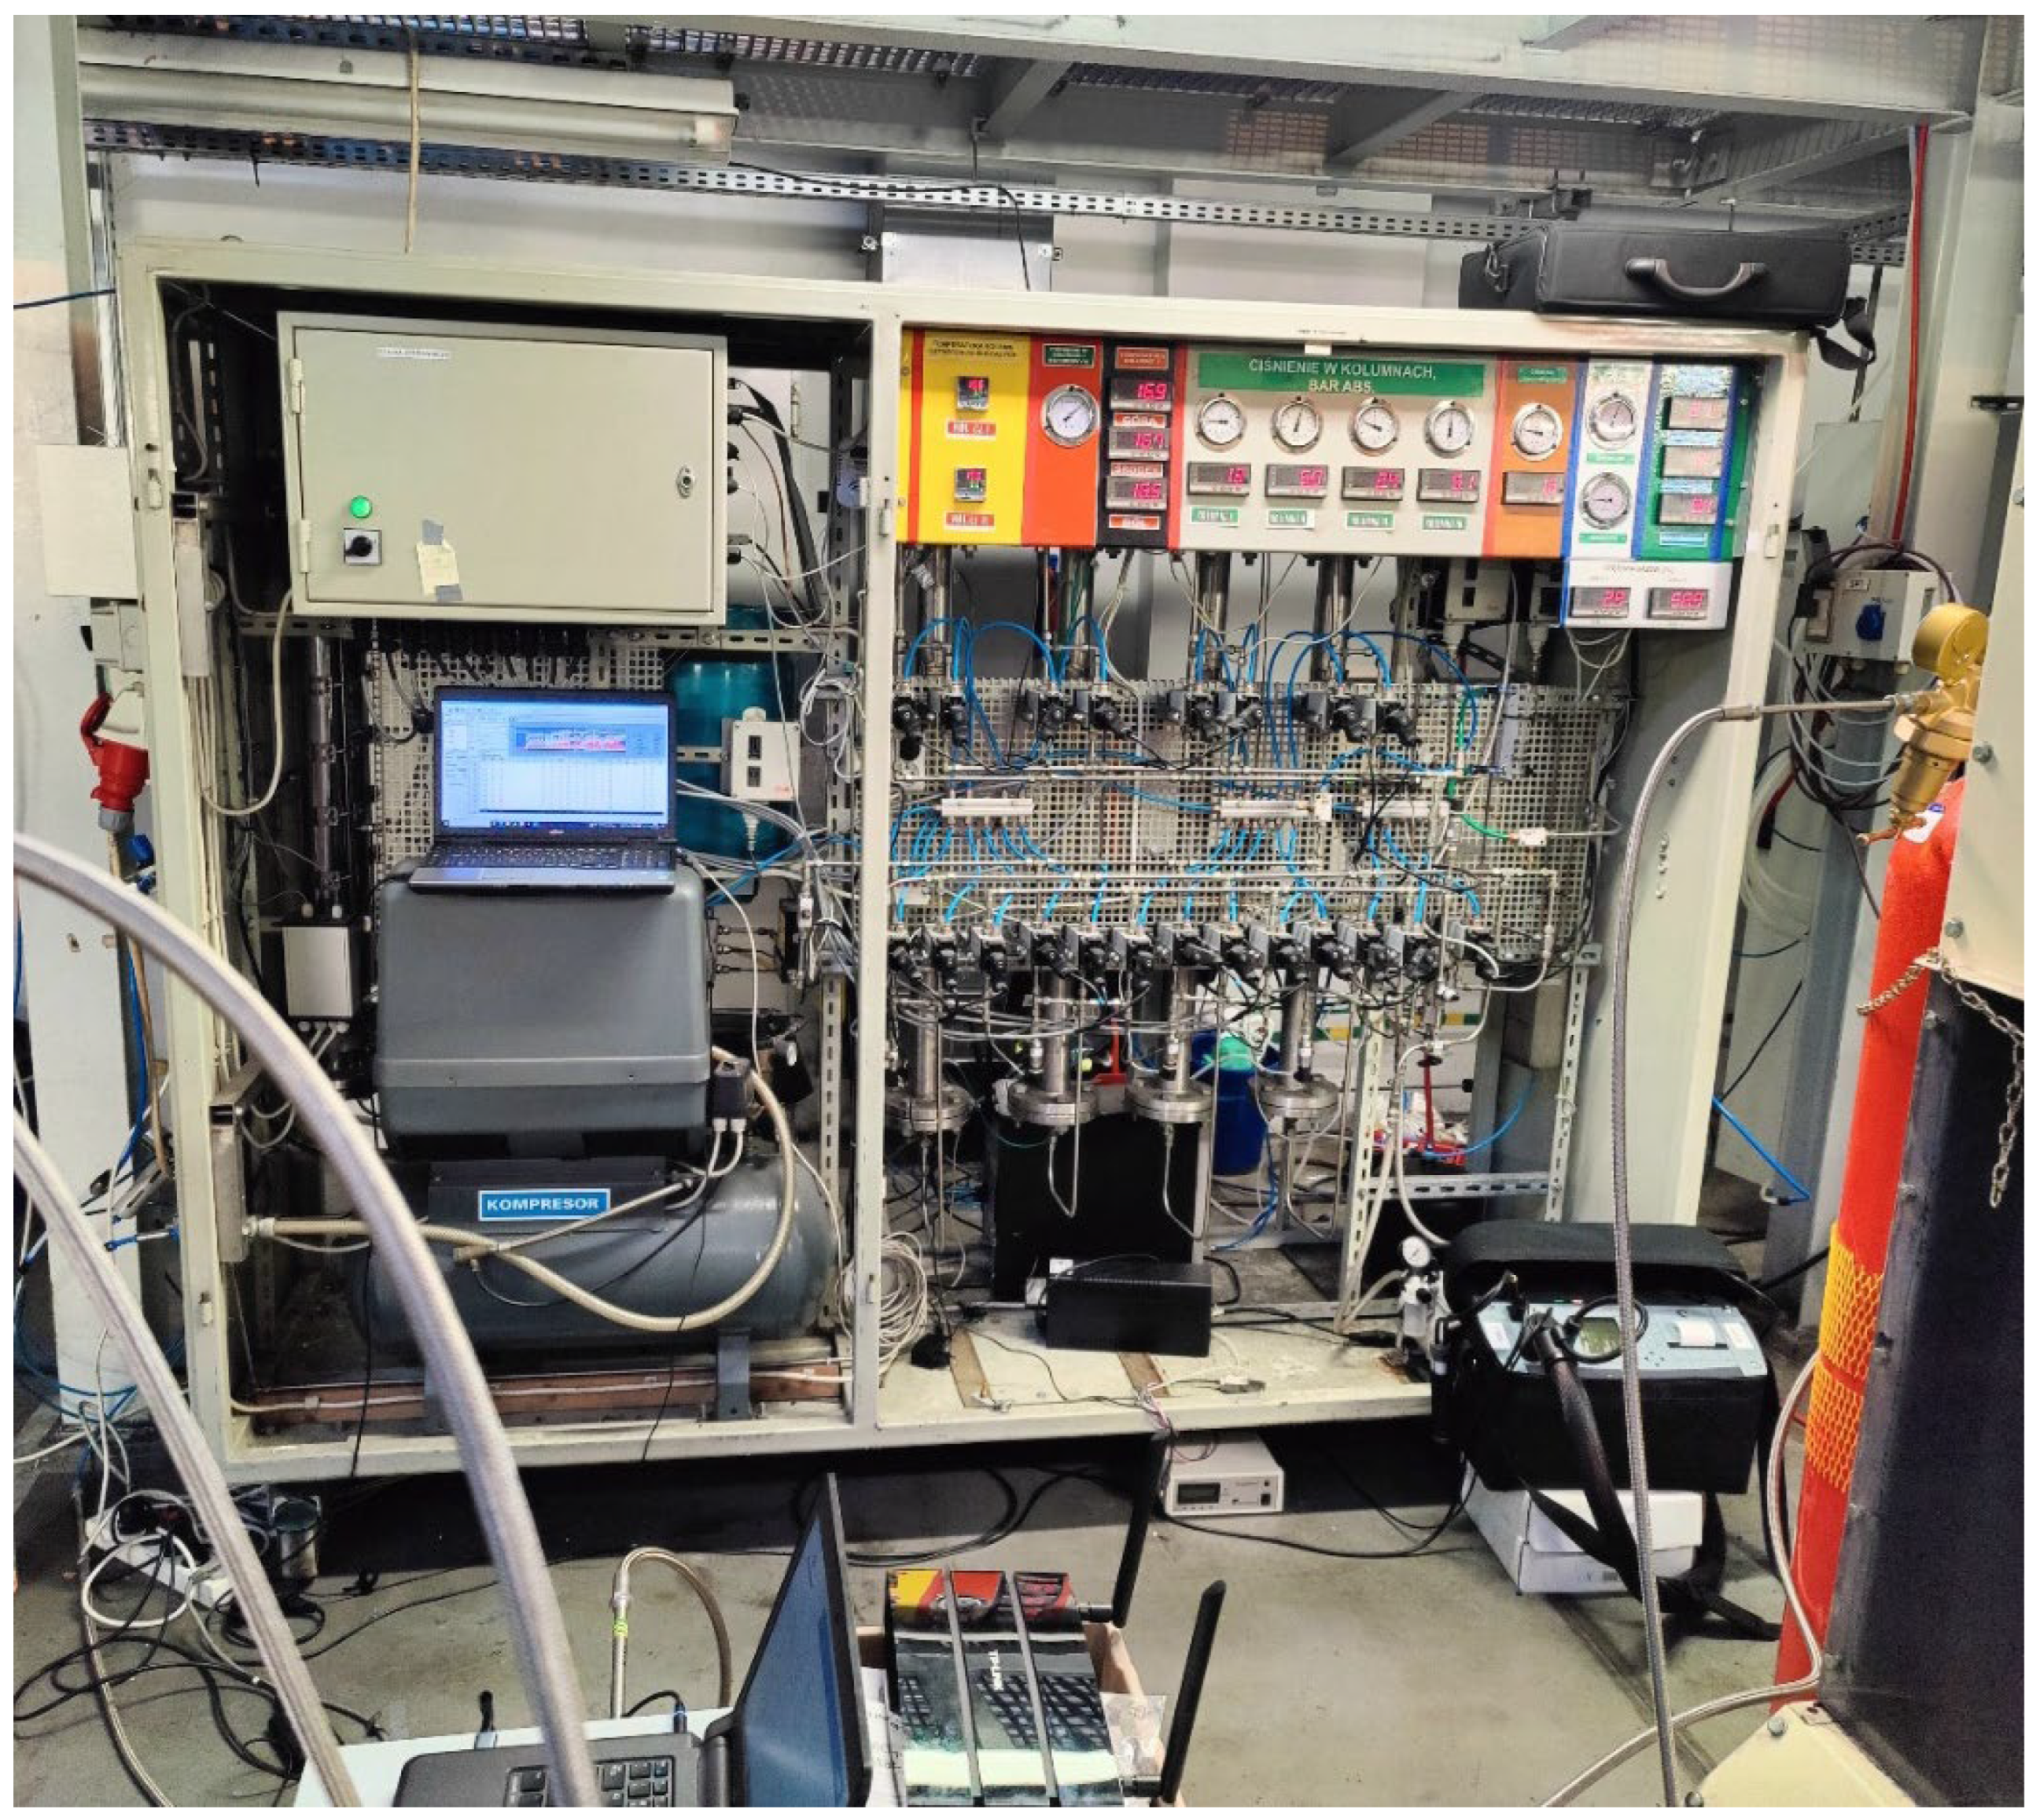
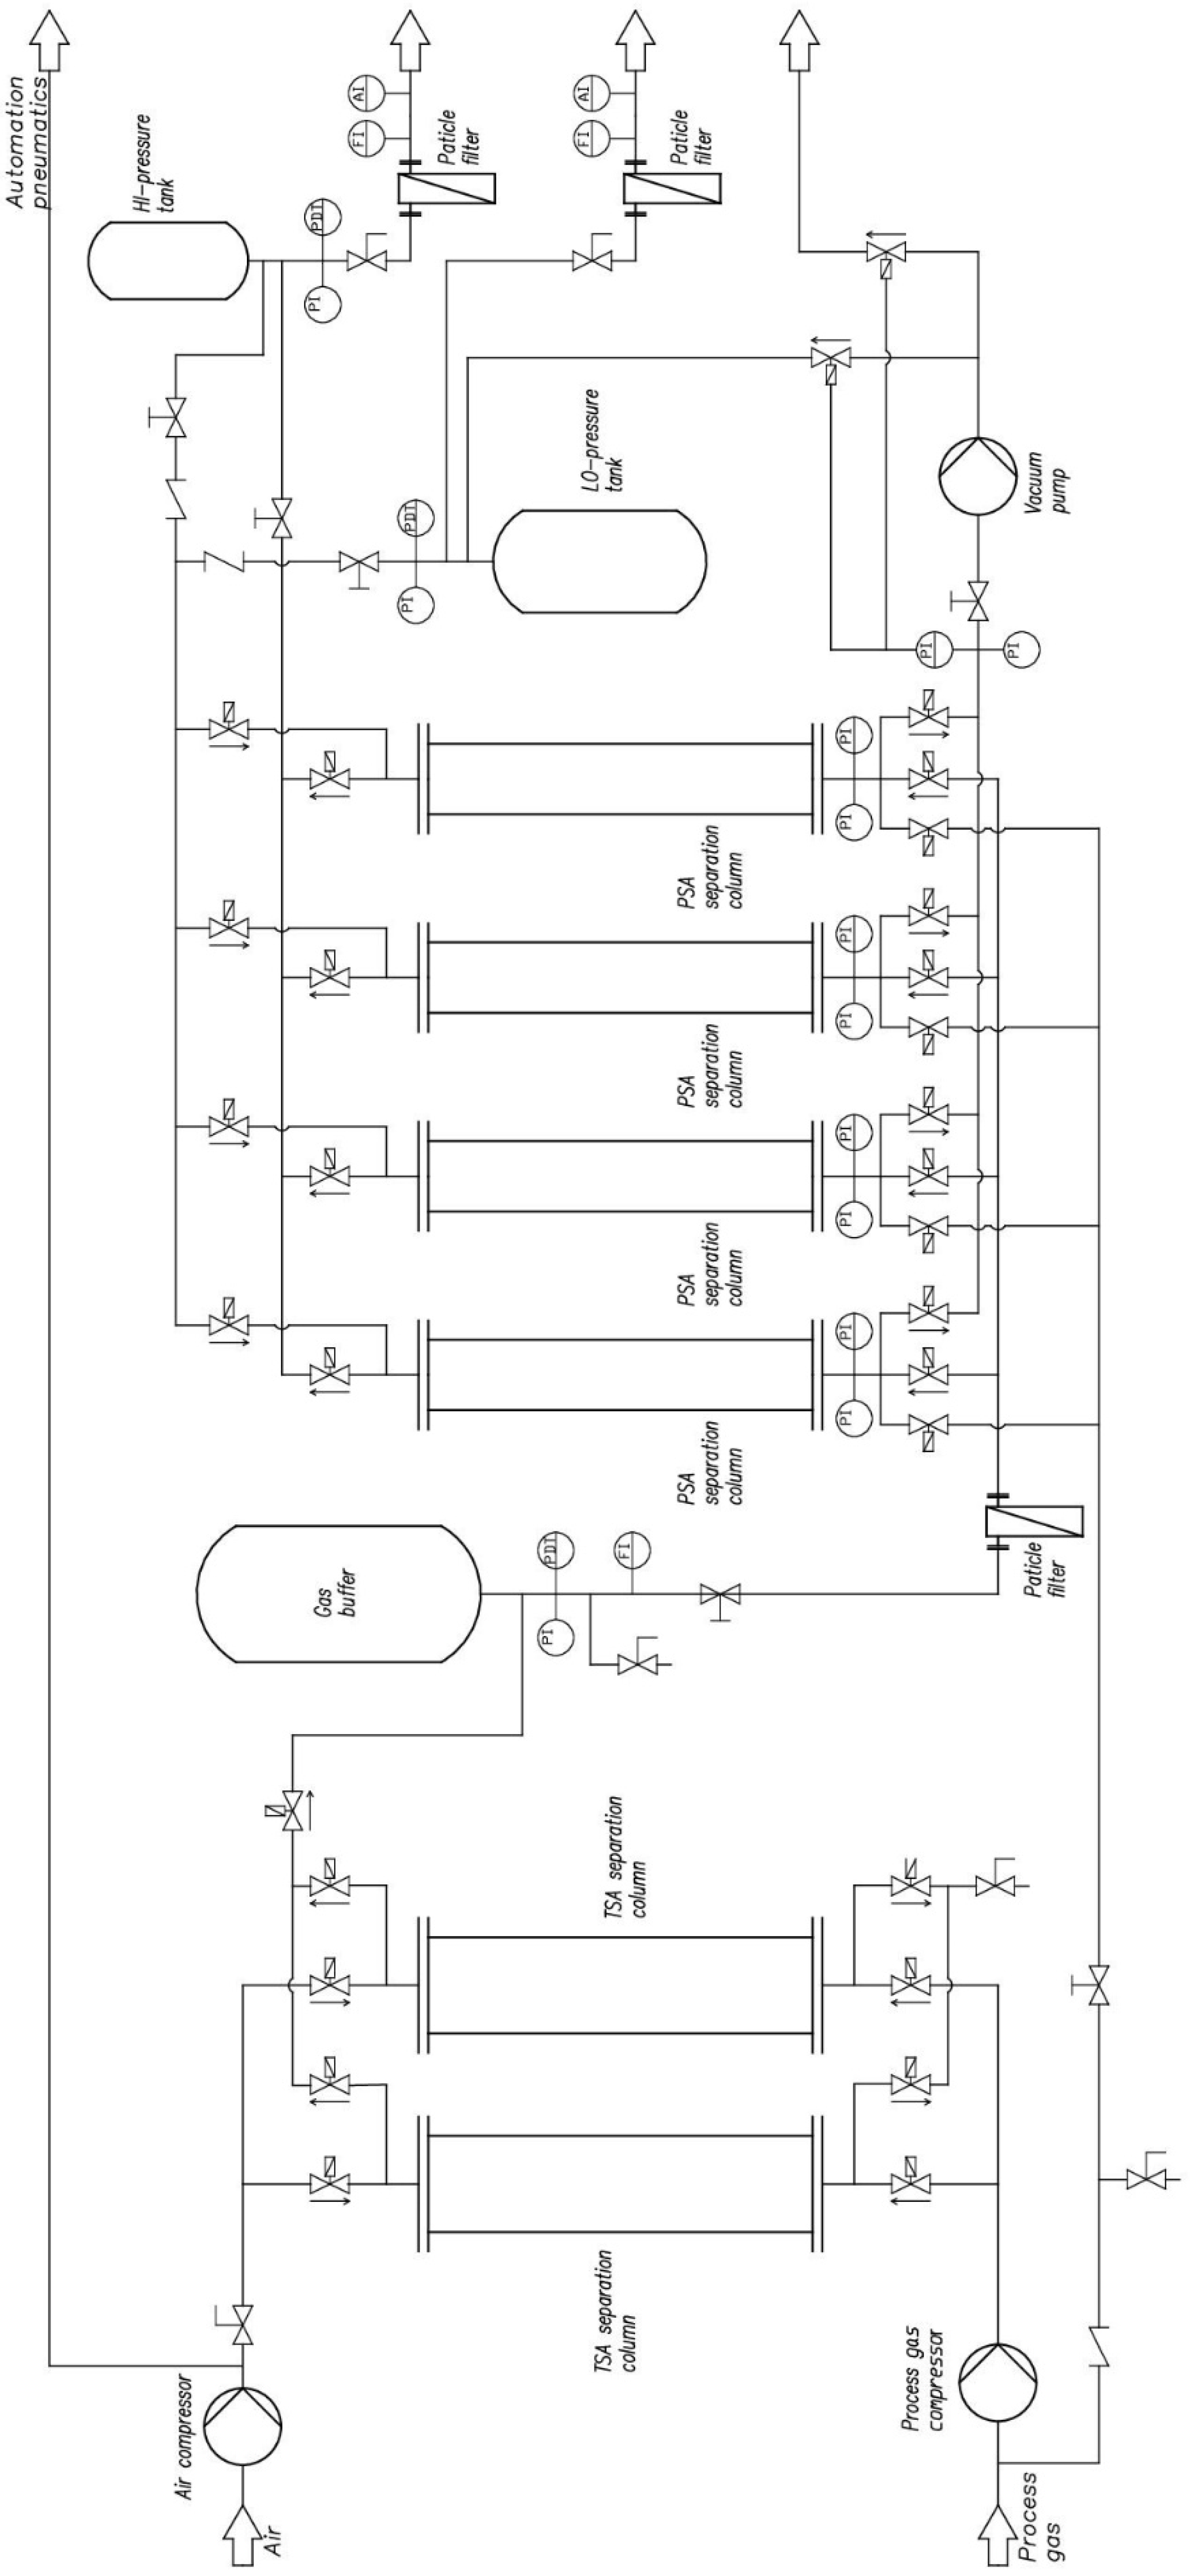
The ITPE PSA laboratory setup is shown in Figure 1, while the simplified flowchart is shown in Figure 2. The installation is divided into two sections: one containing two cleaning columns that can operate in TSA mode and another containing four separation columns operating in PSA mode. The key parameters of the PSA laboratory unit are listed in Table 1.
The feed stream first entered the PSA section through a buffer vessel, which reduced short-term pressure fluctuations before the gas was directed to the adsorption columns. The separation columns operated cyclically by changing the gas-flow path and pressure level. The hydrogen-rich fraction was collected from the column outlet as the high-pressure product stream (raffinate, HP), whereas the more strongly adsorbed components were removed during depressurization and purge as the low-pressure tail-gas stream (tail gas, LP).
Buffer tanks are installed in both the high-pressure (raffinate) line and the low-pressure (tail gas) line to stabilize pressure fluctuations resulting from the cyclic operation of the PSA process. During regeneration, the top valves are closed while the corresponding bottom valves are opened to achieve counter-current depressurization of the bed. The resulting blowdown stream contains desorbed, strongly adsorbed components and interstitial gas remaining within the column void volume. The flow rate of each outlet gas stream is measured using mass flow meters.
The PSA section operates with one to four adsorption columns, depending on the selected cycle configuration. Electrically actuated valves regulate gas flow between columns. These valves may be operated manually or automatically via the control system. All components in contact with the tested gases are made of stainless steel or chromium-plated brass.
A Madur GA-40Tplus gas analyzer (Zgierz, Poland) was used for continuous measurement and data recording of the inlet and high-pressure (raffinate) outlet gas composition, including H2, CH4, CO2, and CO. Methane was measured using the NDIR technique. The low-pressure tail gas stream was monitored with an IRMA optical NDIR single-gas sensor from Madur and a Siemens Ultramat 23 analyzer (Munich, Germany). Gas flow rates were measured using Aalborg mass flow meters (Orangeburg, NY, USA), and the gas mixing unit was equipped with five Bronkhorst mass flow controllers (Ruurlo, The Netherlands). Pressure at the column inlets, outlets, and buffer tanks was measured using P51 pressure sensors (SSI Technologies, Janesville, WI, USA). Temperature at the inlet, middle, and outlet of column I was measured using K-type thermocouples from Introl (Mikołów, Poland). GSPX-10V valves from ATCGOGO (Zhejiang, China) redirected gas streams within the PSA system. Key operating parameters were recorded and controlled using a dedicated SCADA system [31].

2.2. Feed Gas Compositions

Two dry synthetic gas mixtures were prepared to represent non-shifted and shifted syngas compositions. The mixtures were generated from pure H2, CO, CO2, CH4, and N2 (Messer, Chorzów, Poland) using mass flow controllers, which allowed stable and repeatable feed compositions to be supplied to the PSA unit. The selected compositions are reported as volume fractions under normal conditions, i.e., 0 °C and 1 bar, in Table 2. In the following sections, the non-shifted mixture is referred to as syngas, whereas the shifted mixture is referred to as WGS syngas.

2.3. Analytical Methods and Measurement Uncertainty

Feed gas compositions were set using dedicated control software for the mass flow controllers installed in the gas mixing unit (Bronkhorst FlowSuite™, Bronkhorst High-Tech B.V.). The mass flow controllers exhibit a typical uncertainty of ±1% relative to the setpoint. Gas compositions were independently verified using MADUR GA-40Tplus measurements. The detection limits/measurement thresholds of the online analytical system used for breakthrough identification were as follows: H2: 0.1 vol.%, CO: 0.1 vol.%, CO2: 0.1 vol.%, and CH4: 0.1 vol.%. These values were used only to define the first continuous detection of directly measured components in the outlet gas. Nitrogen was not directly measured by the online analyzer and therefore no experimental N2 breakthrough time was determined.

2.4. Adsorbents and Bed Configuration

The adsorption columns were filled with a two-layer bed consisting of activated carbon and zeolite 5A. The activated carbon, Sorbotech® GE 603 supplied by ACES Ltd. (Gdynia, Poland), was used in pellet form, whereas the zeolite 5A molecular sieve supplied by HurtGral (Swarzędz, Poland) was used as spherical granules. Activated carbon was placed in the lower part of the column to preferentially retain CO2 and hydrocarbons, while zeolite 5A was positioned above it to support the removal of CO and N2. A wire mesh separator was installed between the layers to maintain the bed arrangement during filling and operation [31].
Two AC:zeolite bed-length ratios were investigated: 1:1 (50/50 cm) and approximately 1.6:1 (61.5/38.5 cm). Prior to the experiments, the adsorbents were regenerated to ensure reproducible initial conditions: (i) a thermal regeneration (AC at 190 °C and zeolite 5A at 320 °C for about 2 h) and (ii) a vacuum regeneration (up to 0.1 bar and minimum gas flow). Detailed physicochemical properties and adsorption characteristics of the applied adsorbents were reported in our previous work [31]. In the present study, identical materials and preparation procedures were used to ensure consistency and comparability of the results.
All experiments were conducted using dry gas mixtures supplied from compressed gas cylinders (Linde Gas, Messer). Therefore, no additional drying layer, such as silica gel, was required in the adsorption beds. However, in practical applications involving humid feed gases, a dedicated drying stage is typically required to protect moisture-sensitive adsorbents such as zeolite 5A. The use of dry synthetic gas mixtures allowed the PSA behavior of the layered activated carbon/zeolite 5A bed to be evaluated under controlled and reproducible conditions. However, real syngas streams may contain water vapor and trace impurities. Water is strongly adsorbed on zeolitic materials and may compete with CO, CO2, CH4, and N2 for adsorption sites, thereby reducing the effective working capacity of zeolite 5A and increasing the regeneration demand. Moisture may also affect the stability of cyclic operation by delaying desorption and changing the position of the mass-transfer zone. Therefore, in practical operation, an upstream drying step, condensate removal, or a dedicated guard bed would be required before the PSA unit, especially when zeolite 5A is used as the polishing layer.

2.5. Process Operating Parameters

Unless otherwise specified, both breakthrough and cyclic PSA adsorption tests were conducted at ambient temperature with a feed flow rate of approximately 10 NL/min. The adsorption pressure was maintained at 8 to 9 bar, and the desorption pressure was set at 1.2 to 1.4 bar. The purge-to-feed ratio (P/F) was kept at approximately 0.1. Table 3 summarizes the recommended PSA operating parameters.

2.6. Breakthrough Tests

Breakthrough tests were performed to determine how the layered bed responded dynamically to the investigated gas mixtures and to provide a basis for selecting adsorption times in the cyclic PSA experiments. Each test was carried out in a single column packed with a defined activated-carbon-to-zeolite ratio [32,33]. The feed composition, pressure, temperature, and flow rate were kept constant during a given run. The test matrix is summarized in Table 4.
The process parameters were set according to established operating conditions. During the experiments, the feed gas mixture was introduced into the adsorption column until the adsorbents reached their capacity. The concentrations of target components, including H2, CO, CO2, and CH4, in the effluent were continuously monitored using gas analyzers.
Breakthrough experiments were conducted using a standardized procedure. The adsorption bed was initially purged with nitrogen and then evacuated under vacuum. This purge and evacuation sequence was repeated at least three times to ensure complete regeneration. Afterward, the column was pressurized with nitrogen to the specified adsorption pressure, and the test gas mixture was introduced at a controlled flow rate under defined operating conditions. The outlet gas composition was continuously monitored using online gas analyzers located at the high-pressure outlet to ensure accurate tracking of gas composition over time. Breakthrough time was defined as the first time at which the outlet concentration of a directly measured component remained continuously above the corresponding analyzer detection limit/measurement threshold for at least two consecutive SCADA-recorded data points. This criterion was applied only to the components directly measured by the online analyzer, i.e., H2, CO, CO2, and CH4. Nitrogen was not directly measured; therefore, no experimental N2 breakthrough time was assigned.

2.7. PSA Gas Adsorption Tests

Two PSA cycle configurations were investigated in the continuous adsorption tests:
  • the Berlin two-column,
  • the Linde-type four-column.

2.7.1. The Berlin-Type Cycle

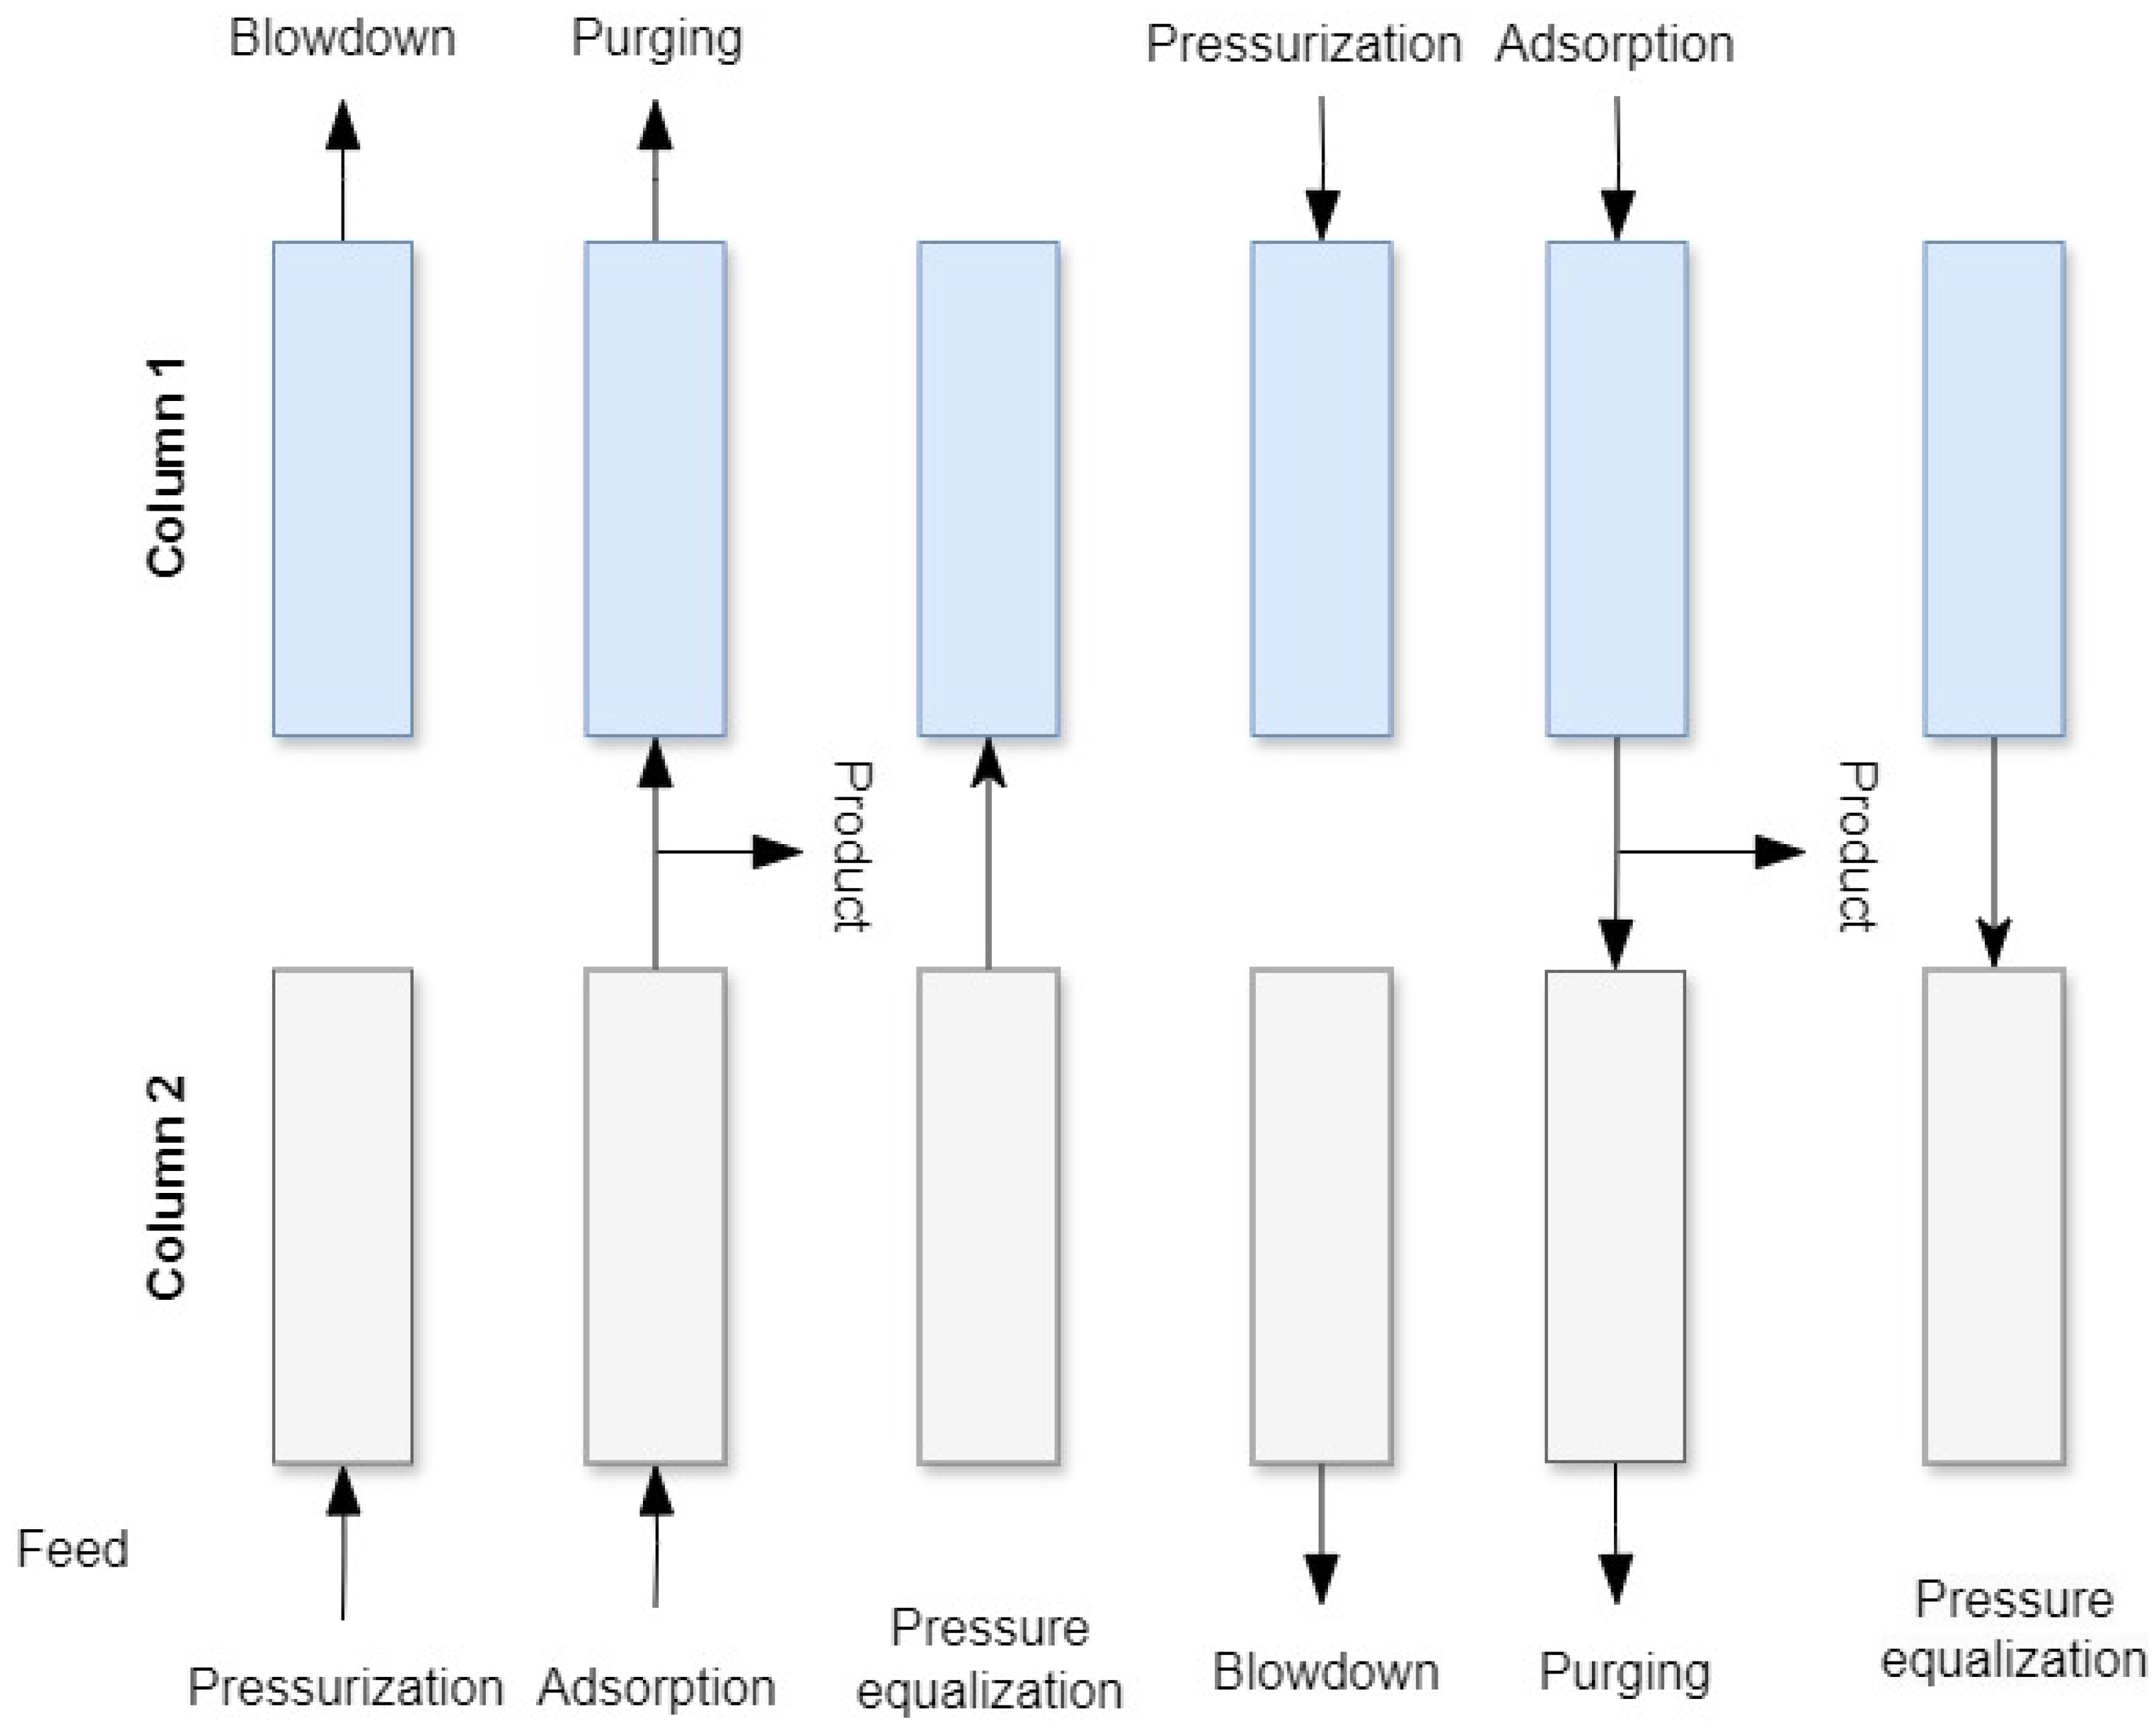
The Berlin-type cycle used in this study was based on a two-column PSA arrangement with pressure equalization between beds. In comparison with the basic Skarstrom sequence, the equalization step allows part of the gas remaining in one column to be transferred to the second column before full repressurization or depressurization. The implemented cycle consisted of six steps per column, including adsorption, blowdown, purge, repressurization, and two pressure-equalization steps with opposite flow directions, as shown in Figure 3 and Table 5 [35,36].

2.7.2. The Linde-Type Cycle

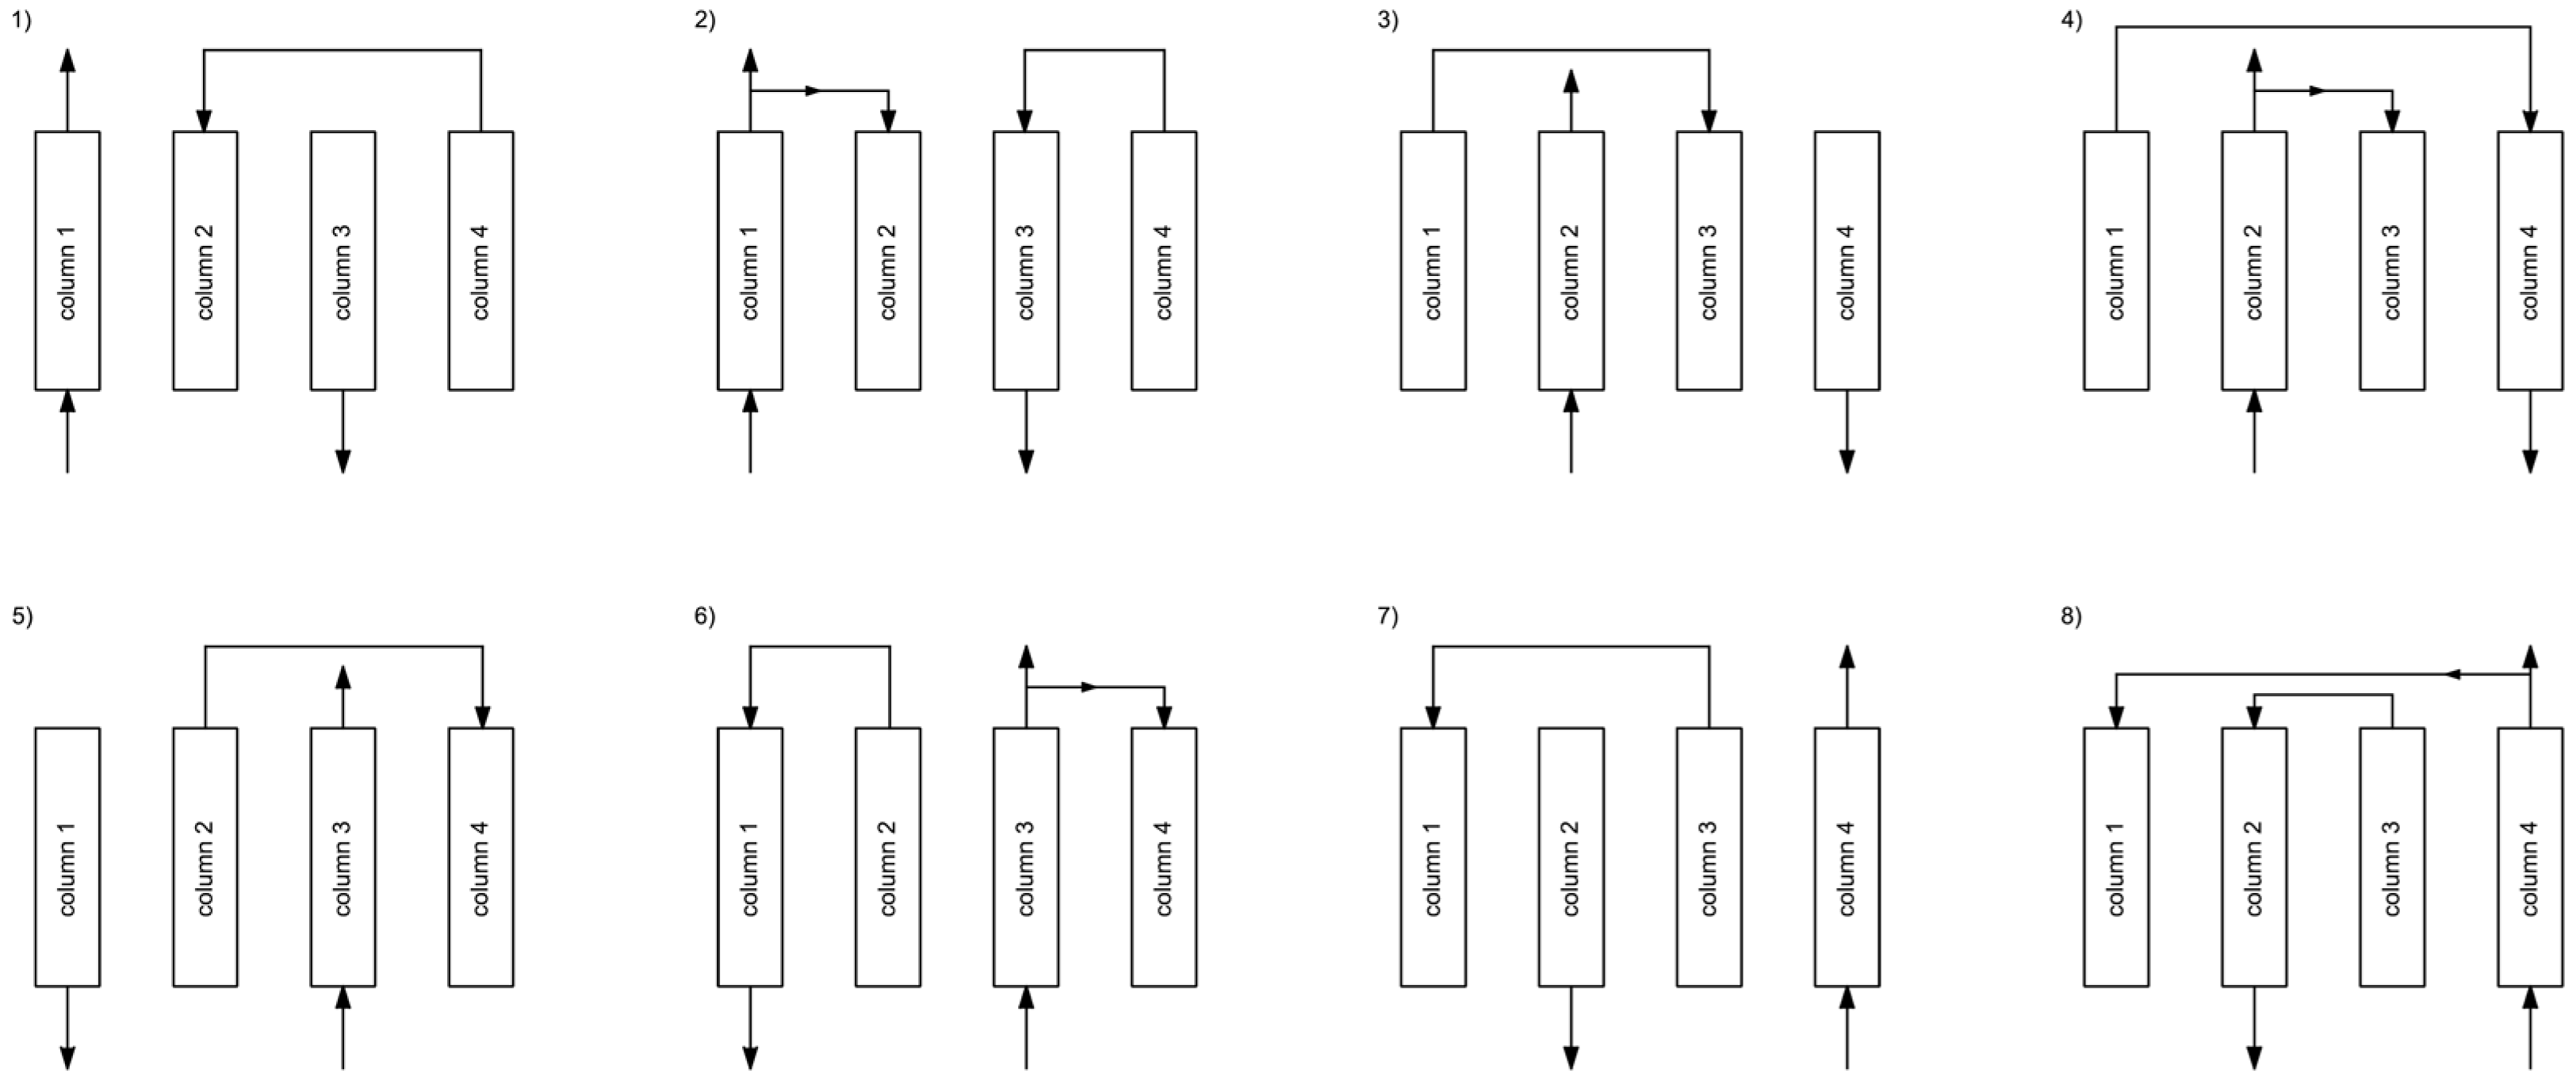
The Linde-type cycle was implemented as a four-column PSA sequence. This configuration provides more flexibility than the two-column cycle because it includes two pressure-equalization levels and a dedicated product-purge step. These additional steps allow hydrogen-rich gas to be internally redistributed between columns, which can improve repressurization and regeneration and reduce direct hydrogen losses. The step sequence used in this work is shown in Figure 4 and Table 6 [31]. No overlap step was applied during the experiments. All Linde-type tests were performed with four active columns; therefore, the comparison with the Berlin-type cycle represents a comparison of the implemented cycle configurations rather than an isolated comparison of the number of beds.

2.8. Performance Indicators and Data Processing

The performance of the PSA system was evaluated based on hydrogen purity and hydrogen recovery, calculated in accordance with the methodology reported by Grande [37].
Hydrogen purity was determined as the average molar fraction of hydrogen in the high-pressure product stream, as measured by the online gas analyzer during steady-state operation. Only data from stabilized cyclic operation were included.
Hydrogen recovery was calculated as the ratio of the total recovered hydrogen molar flow rate in the product stream to the total molar flow rate of hydrogen supplied to the system with the feed gas. Recovery was evaluated under steady-state conditions using time-averaged molar flow rates.
H 2   p u r i t y = y H 2 ,   H P · 100 %
H 2   r e c o v e r y = n ˙ H P · y H 2 , H P n ˙ f e e d · y H 2 , f e e d · 100 %
y N 2 = 1 y H 2 + y C O 2 + y C O + y C H 4
where n ˙ H P and n ˙ f e e d are the time-averaged molar flow rates of the high-pressure product and feed streams, respectively; y H 2 ,   H P and y H 2 ,   f e e d are the hydrogen molar fractions in the high-pressure product and feed streams, respectively; and y i denotes the molar fraction of component i . Nitrogen concentration in the high-pressure product stream was not directly measured due to limitations of the gas analyzer used. Therefore, N 2 was estimated by difference, under the assumption that the sum of the measured and calculated components equals 100 vol.%. Unless otherwise stated, H2, CO, CO2, and CH4 concentrations were directly measured by the online gas analyzers, while N2 was calculated by difference. Therefore, N2 values are reported as calculated estimates and not as directly measured concentrations.
Hydrogen purity was calculated directly from the measured H2 mole fraction in the high-pressure product stream and was not obtained by normalizing the sum of measured components to 100 vol.%. Therefore, the by-difference calculation of N2 does not artificially increase the reported H2 purity. The N2 value affects only the closure of the gas composition and the interpretation of unmeasured weakly adsorbed impurities. The feed compositions generated using mass flow controllers were independently verified using the MADUR GA-40Tplus analyzer. Dedicated cross-sensitivity tests were not performed; this limitation is reflected in the maximum error values reported in Table 7 and is now explicitly acknowledged.
The safety margin to CO breakthrough was calculated as
S M C O = t b , C O t a d s t b , C O · 100 %
where t b , C O is the experimentally determined CO breakthrough time and t a d s is the adsorption step time used in the PSA cycle.
Hydrogen losses during purge and regeneration steps were quantified, as all gas flow rates were continuously monitored with calibrated mass flow meters (Aalborg Instruments).
Steady-state operation was defined as operator-selected PSA cycles during which the composition of the high-pressure product stream remained constant for at least 30–60 min. The system generally required 30 to 60 min to reach cyclic steady state following any change in operating conditions. All results presented in this work are based solely on data collected after cyclic steady state was achieved.
Instead of adding error bars to each performance plot, the maximum absolute errors of the key measured and calculated parameters are summarized in Table 7. This approach was selected because individual PSA operating points were not repeated as fully independent replicate experiments. Therefore, confidence intervals from repeated experiments were not calculated. The maximum errors were estimated from analyzer detection thresholds, instrument specifications, and the observed stability of SCADA-recorded steady-state periods. The repeatability of steady-state operation was within these error ranges.

3. Results and Discussion

3.1. Breakthrough Tests—The Basis for Adsorption Step Time

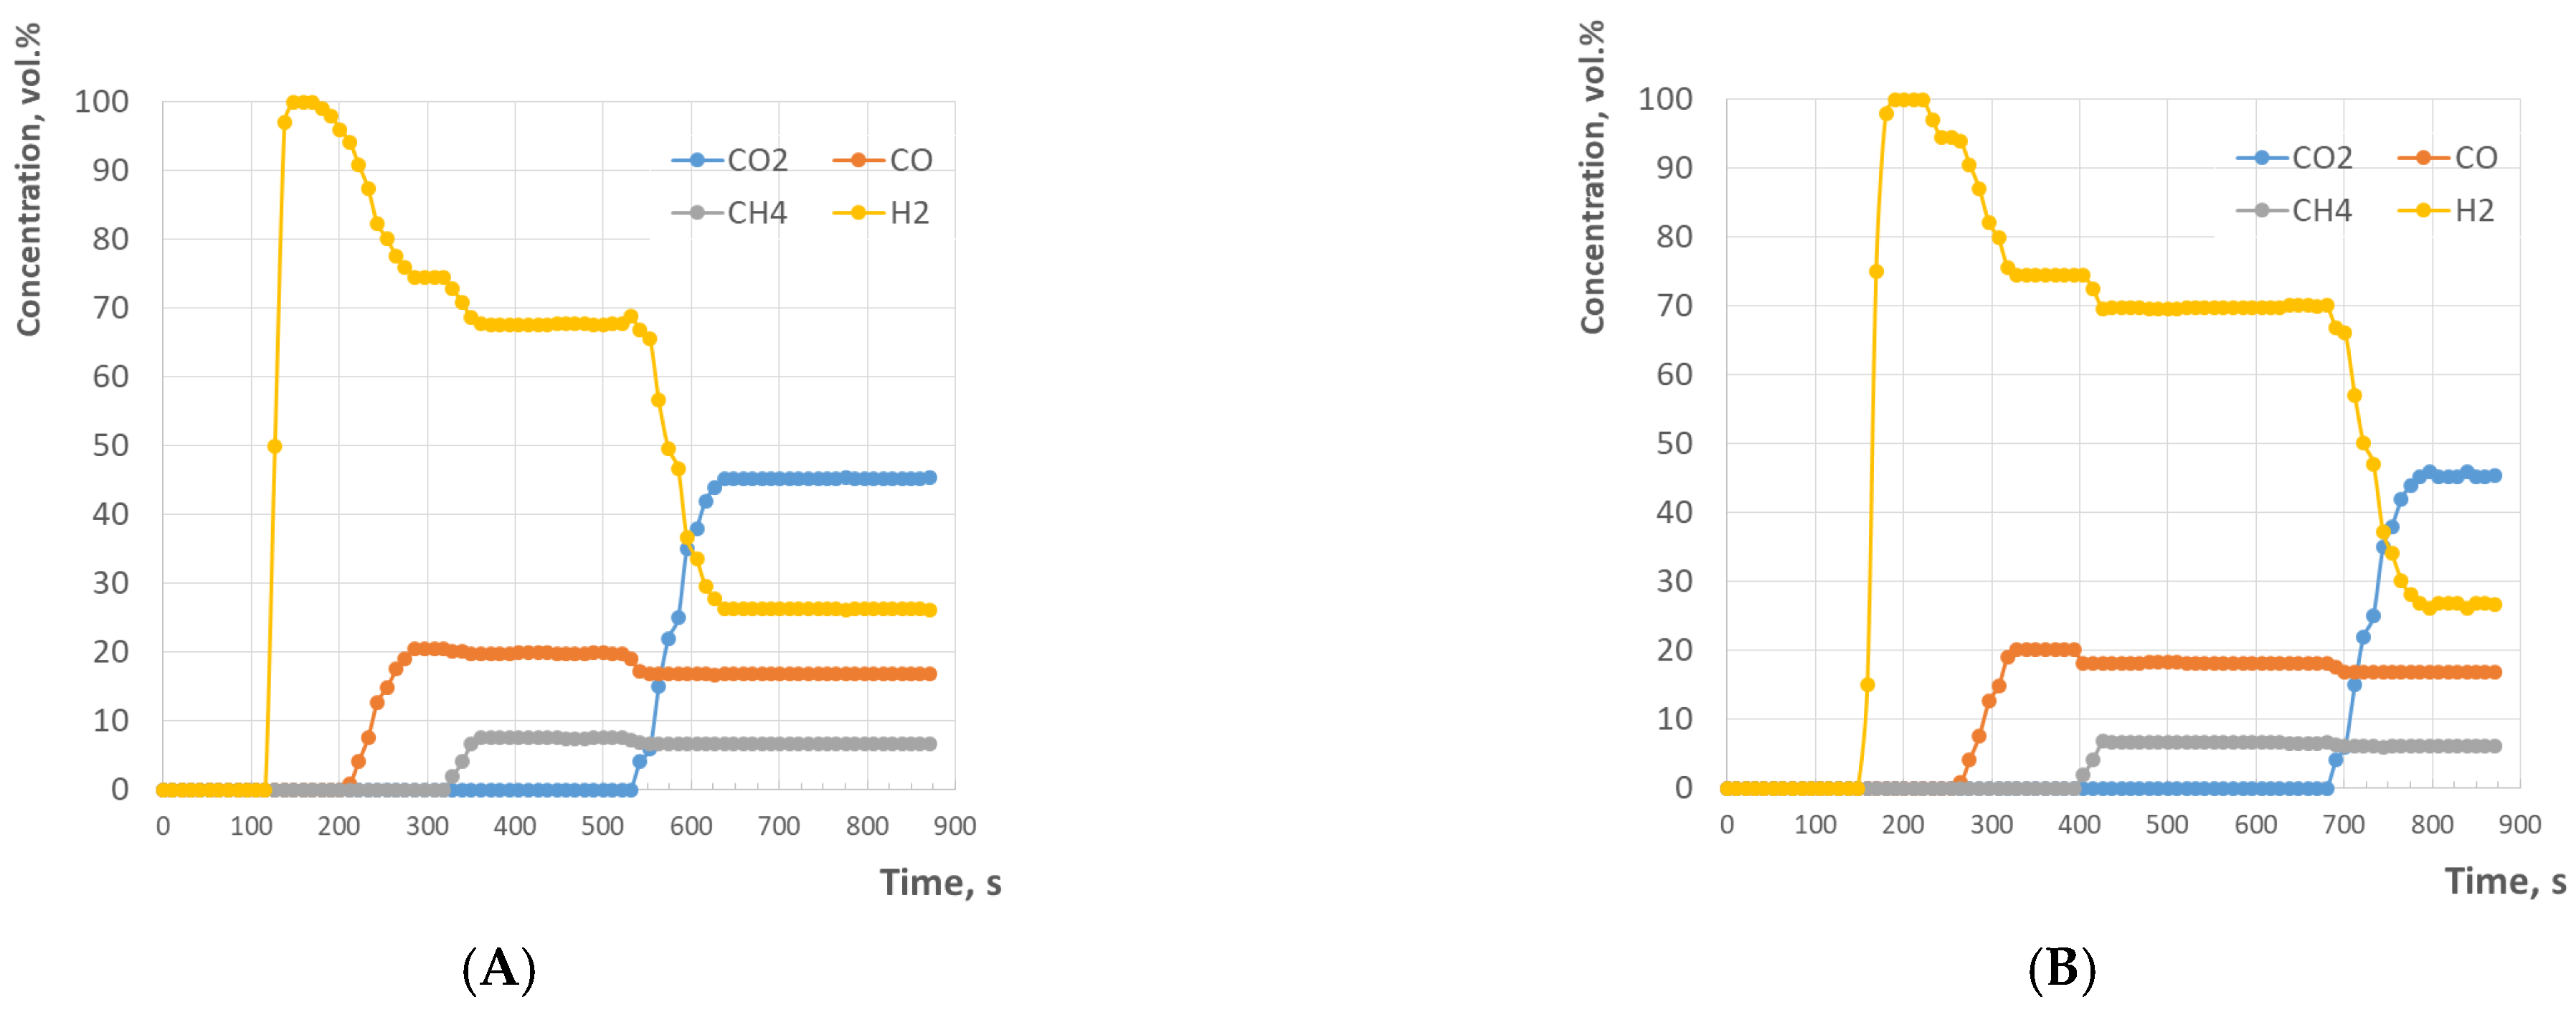
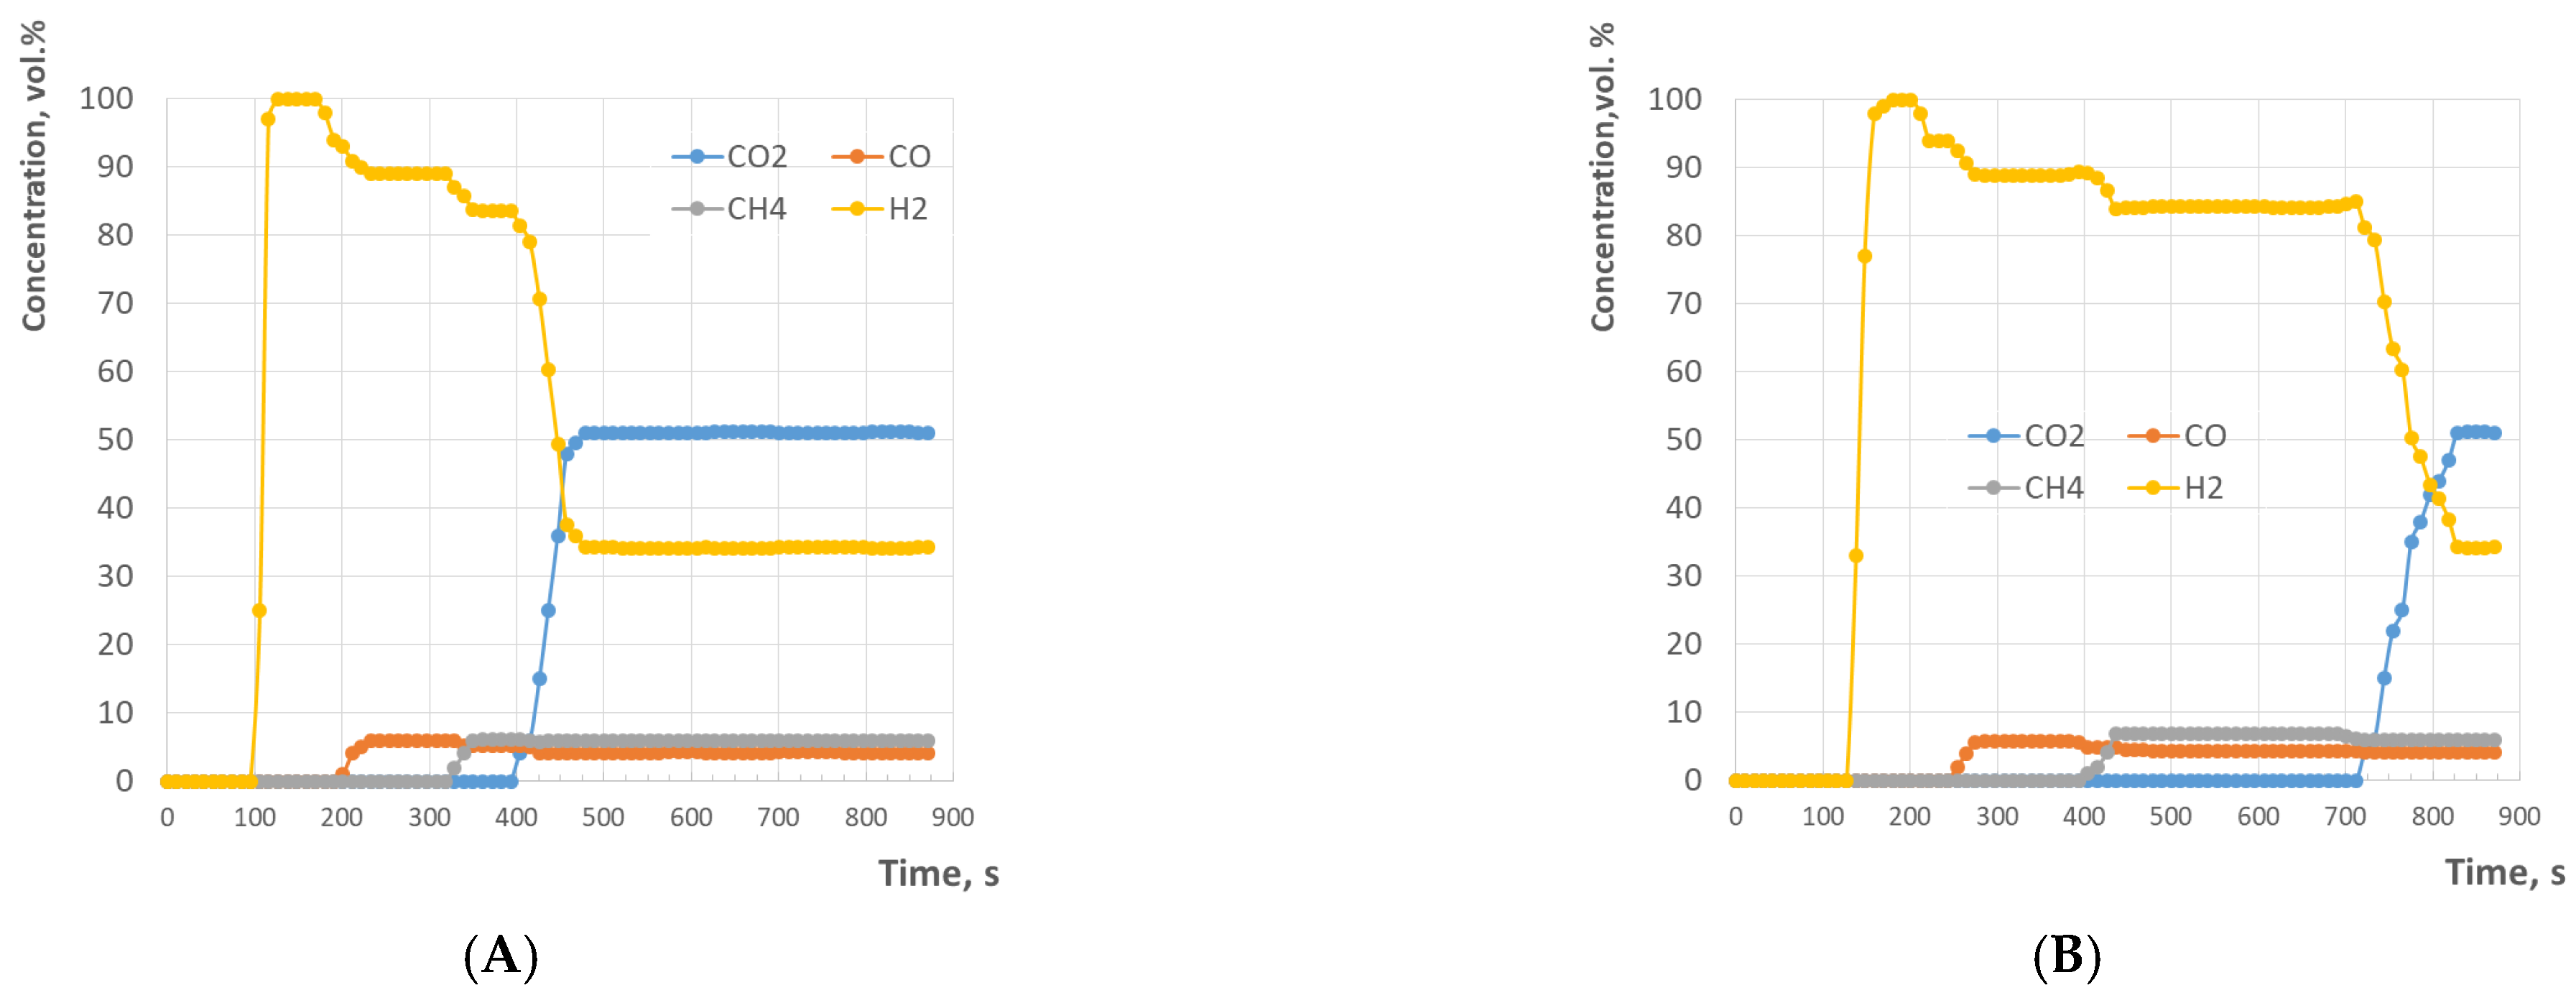
The breakthrough experiments were used to determine the order in which the measured components appeared at the column outlet and to define a conservative operating range for the adsorption step in cyclic PSA tests. Figure 5 and Figure 6 present the results obtained for syngas and WGS syngas using the two investigated bed configurations. In all cases, the measured breakthrough sequence followed the expected adsorption strength of the components. Hydrogen appeared first, while CO2 was retained for the longest time due to its strong interaction with the activated carbon layer. CO and CH4 showed intermediate behavior, with CO being the most relevant impurity from the viewpoint of hydrogen product quality.
For the syngas mixture, shown in Figure 5, increasing the activated carbon fraction from an AC-to-zeolite ratio of 1:1 to 1.6:1 resulted in delayed breakthrough times for all measured components. The initial hydrogen breakthrough increased from 121 to 151 s, while the first measured impurity breakthrough, attributed to CO, increased from 205 to 256 s. Similar delays were observed for CH4, from 322 to 402 s, and for CO2, from 545 to 681 s. These results demonstrate that extending the activated carbon section increases the bed’s overall dynamic adsorption capacity, particularly for strongly adsorbed species. The prolonged CO2 retention confirms the important role of the activated carbon layer in removing the dominant acidic component of the syngas feed, while the zeolite 5A layer contributes to the retention of less strongly adsorbed impurities, particularly CO and N2.
The WGS syngas breakthrough curves in Figure 6 show a similar qualitative trend to those of syngas, but with distinct differences due to the altered feed composition. Compared with syngas, the WGS mixture contained a higher fraction of hydrogen and CO2 and a significantly lower concentration of CO. As a result, hydrogen breakthrough occurred earlier than for the syngas case, at 103 s for the 1:1 bed and 129 s for the 1.6:1 bed. The first measured impurity breakthrough, again represented by CO, occurred at 195 and 244 s, respectively. Despite the lower CO concentration in the WGS feed, CO remained the key measured impurity limiting the permissible adsorption step time because even low CO concentrations in the hydrogen-rich product stream may be critical for downstream applications. The most pronounced effect of increasing the AC fraction was observed for CO2, whose breakthrough time increased from 402 s for the 1:1 bed to 716 s for the 1.6:1 bed. This result confirms that a higher share of activated carbon is particularly beneficial for CO2-rich WGS syngas purification.
Overall, the 1.6:1 AC:zeolite ratio configuration provided longer breakthrough times than the 1:1 configuration for both feed gases. This improvement is especially relevant for CO and CO2, as these components directly determine the permissible adsorption time in PSA operation. However, the selection of adsorption time for cyclic PSA operation should not rely solely on CO2 breakthrough. Although CO2 exhibits the longest retention, CO is the first impurity detected in the outlet stream and thus serves as the practical threshold for maintaining high hydrogen purity. Therefore, the adsorption step in the PSA cycle should be set below the CO breakthrough time, preferably with an additional safety margin to address cycle variations, valve switching, and axial dispersion effects.
It should also be noted that nitrogen was not directly quantified by the online gas analyzer used in the breakthrough tests. Therefore, N2 breakthrough is not shown explicitly in Figure 5 and Figure 6, and no experimental N2 breakthrough time is reported in Table 8. In this study, nitrogen was considered only indirectly through the overall gas balance, while CO was treated as the first experimentally confirmed impurity breakthrough. The decrease in H2 concentration observed before the CO peak should therefore be interpreted only as an indication of changes in the outlet gas composition that were not fully resolved by the online analyzer configuration. It cannot be assigned unambiguously to N2 without direct measurement. Future breakthrough experiments should include complementary GC/TCD analysis to quantify N2 and verify its breakthrough behavior.
The breakthrough experiments provide a practical basis for determining the adsorption step duration in the PSA test matrix. For syngas, experimentally observed CO breakthrough times suggest that adsorption durations should remain below approximately 205 s for the 1:1 bed and 256 s for the 1.6:1 bed. For WGS syngas, the corresponding upper limits are approximately 195 and 244 s, respectively. In practical PSA operation, shorter adsorption times are recommended to maintain product purity, especially when high-purity hydrogen is the target. These results demonstrate that the layered AC/zeolite 5A bed is effective for hydrogen enrichment from both syngas and WGS syngas. Furthermore, the WGS composition resulted in a higher CO2 loading on the bed and therefore benefited more from an increased activated carbon fraction.

3.2. PSA Gas Adsorption Tests—Continuous Process

A common approach in PSA cycle development involves setting the adsorption step duration below the breakthrough time of the first critical impurity, while maintaining an additional safety margin to address non-ideal flow distribution, valve switching dynamics, axial dispersion, and cycle-to-cycle variations. In hydrogen PSA systems, this strategy is particularly important for feeds containing CO, as even low CO concentrations in the product stream may restrict the use of recovered hydrogen in downstream catalytic or fuel-cell applications. Therefore, the adsorption times in the present study’s continuous PSA experiments were based on the CO breakthrough times established in Section 3.1. This approach aligns with the existing literature, where adsorption time is typically set below the breakthrough point of the limiting impurity and further optimized based on the observed purity–recovery trade-off [38,39]. The adsorption times used in the continuous PSA tests were selected iteratively rather than as a uniformly spaced design of experiments. Initial values were chosen below the experimentally determined CO breakthrough times, and subsequent values were adjusted to cover both conservative high-purity operation and longer adsorption times aimed at higher hydrogen recovery. Therefore, the reported safety margins should be interpreted as experimentally tested operating points spanning the purity–recovery trade-off, not as universal design margins. In the Linde-type cycle, smaller safety margins could be tested because pressure equalization and product-purge steps improved internal gas redistribution, bed regeneration, and repressurization. However, the smallest safety margin, observed for LS1, corresponded to 94.0 vol.% H2 and was included to define the lower-purity/high-recovery end of the operating window rather than as an optimized high-purity condition. For high-purity operation close to or above 99 vol.% H2, larger safety margins were required. However, CO2 accumulation and incomplete regeneration may also influence cyclic stability, especially for WGS syngas with higher CO2 content. In the present work, the continuous PSA experiments were evaluated after cyclic steady state had been reached, based on stabilized product composition and flow rates. A dedicated long-term, cycle-resolved CO2 loading analysis was not performed. Therefore, the reported data should be interpreted as steady-state PSA performance under the investigated operating windows rather than as a full long-term stability assessment. Future work should include cycle-by-cycle CO2 mass-balance closure, adsorbent loading estimation, and extended operation tests to quantify possible CO2 accumulation.
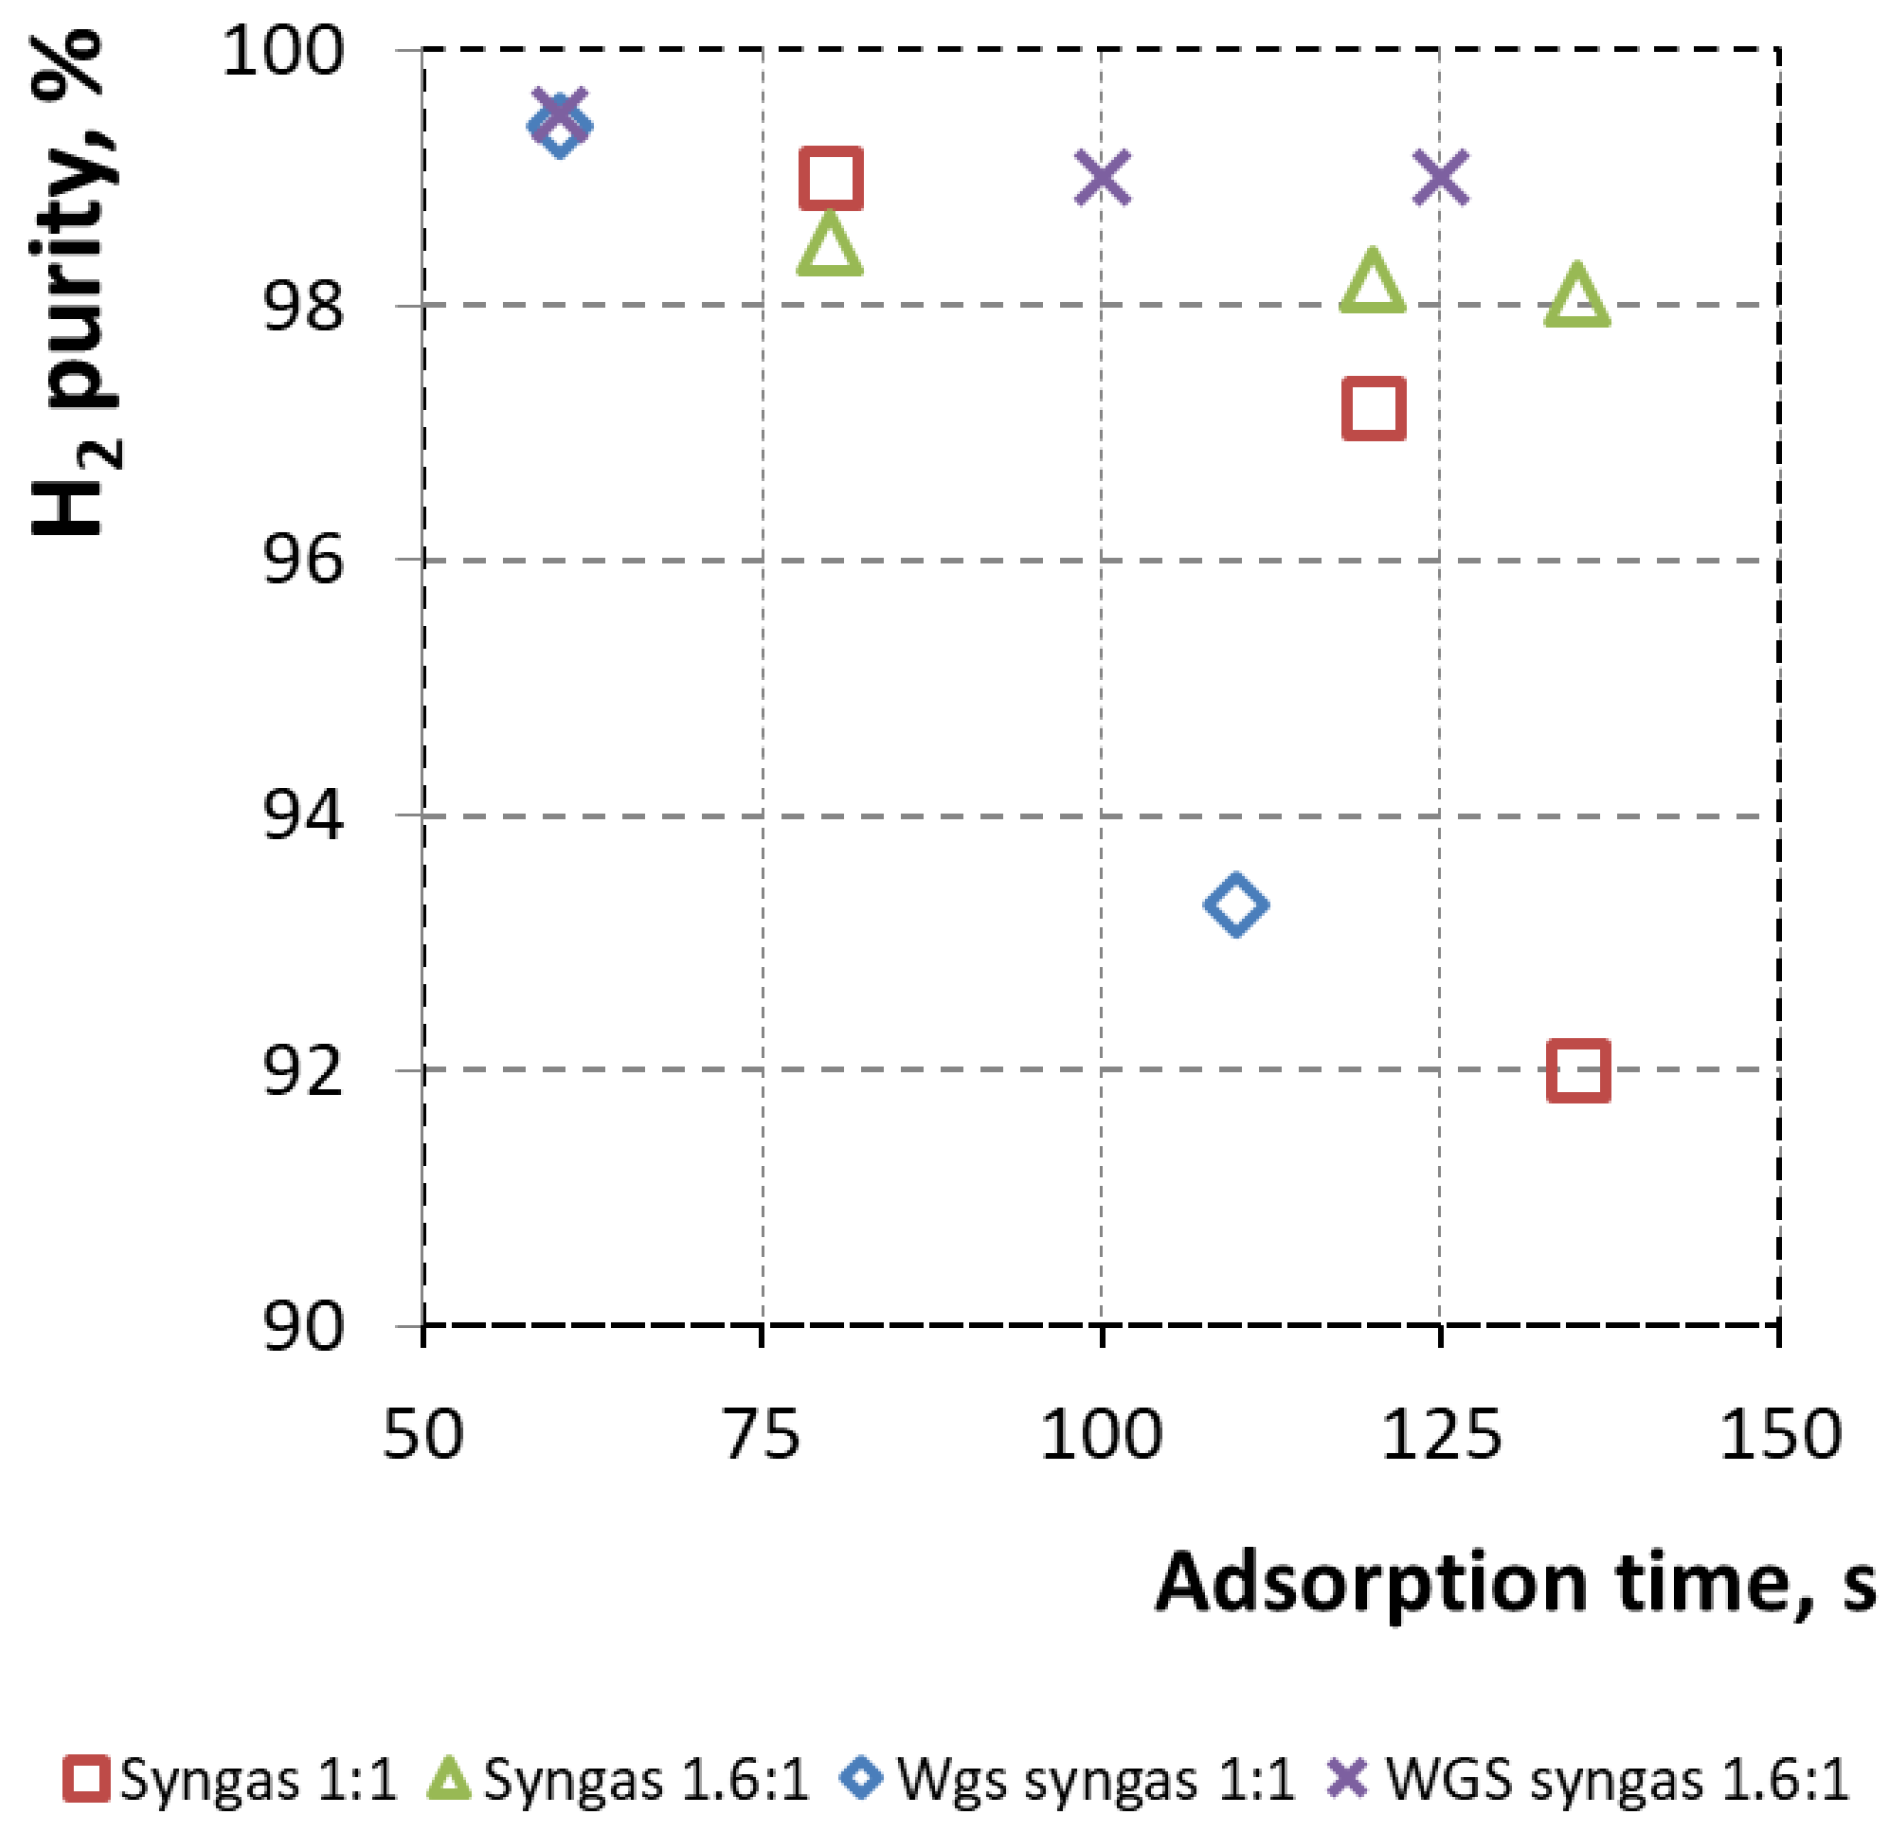
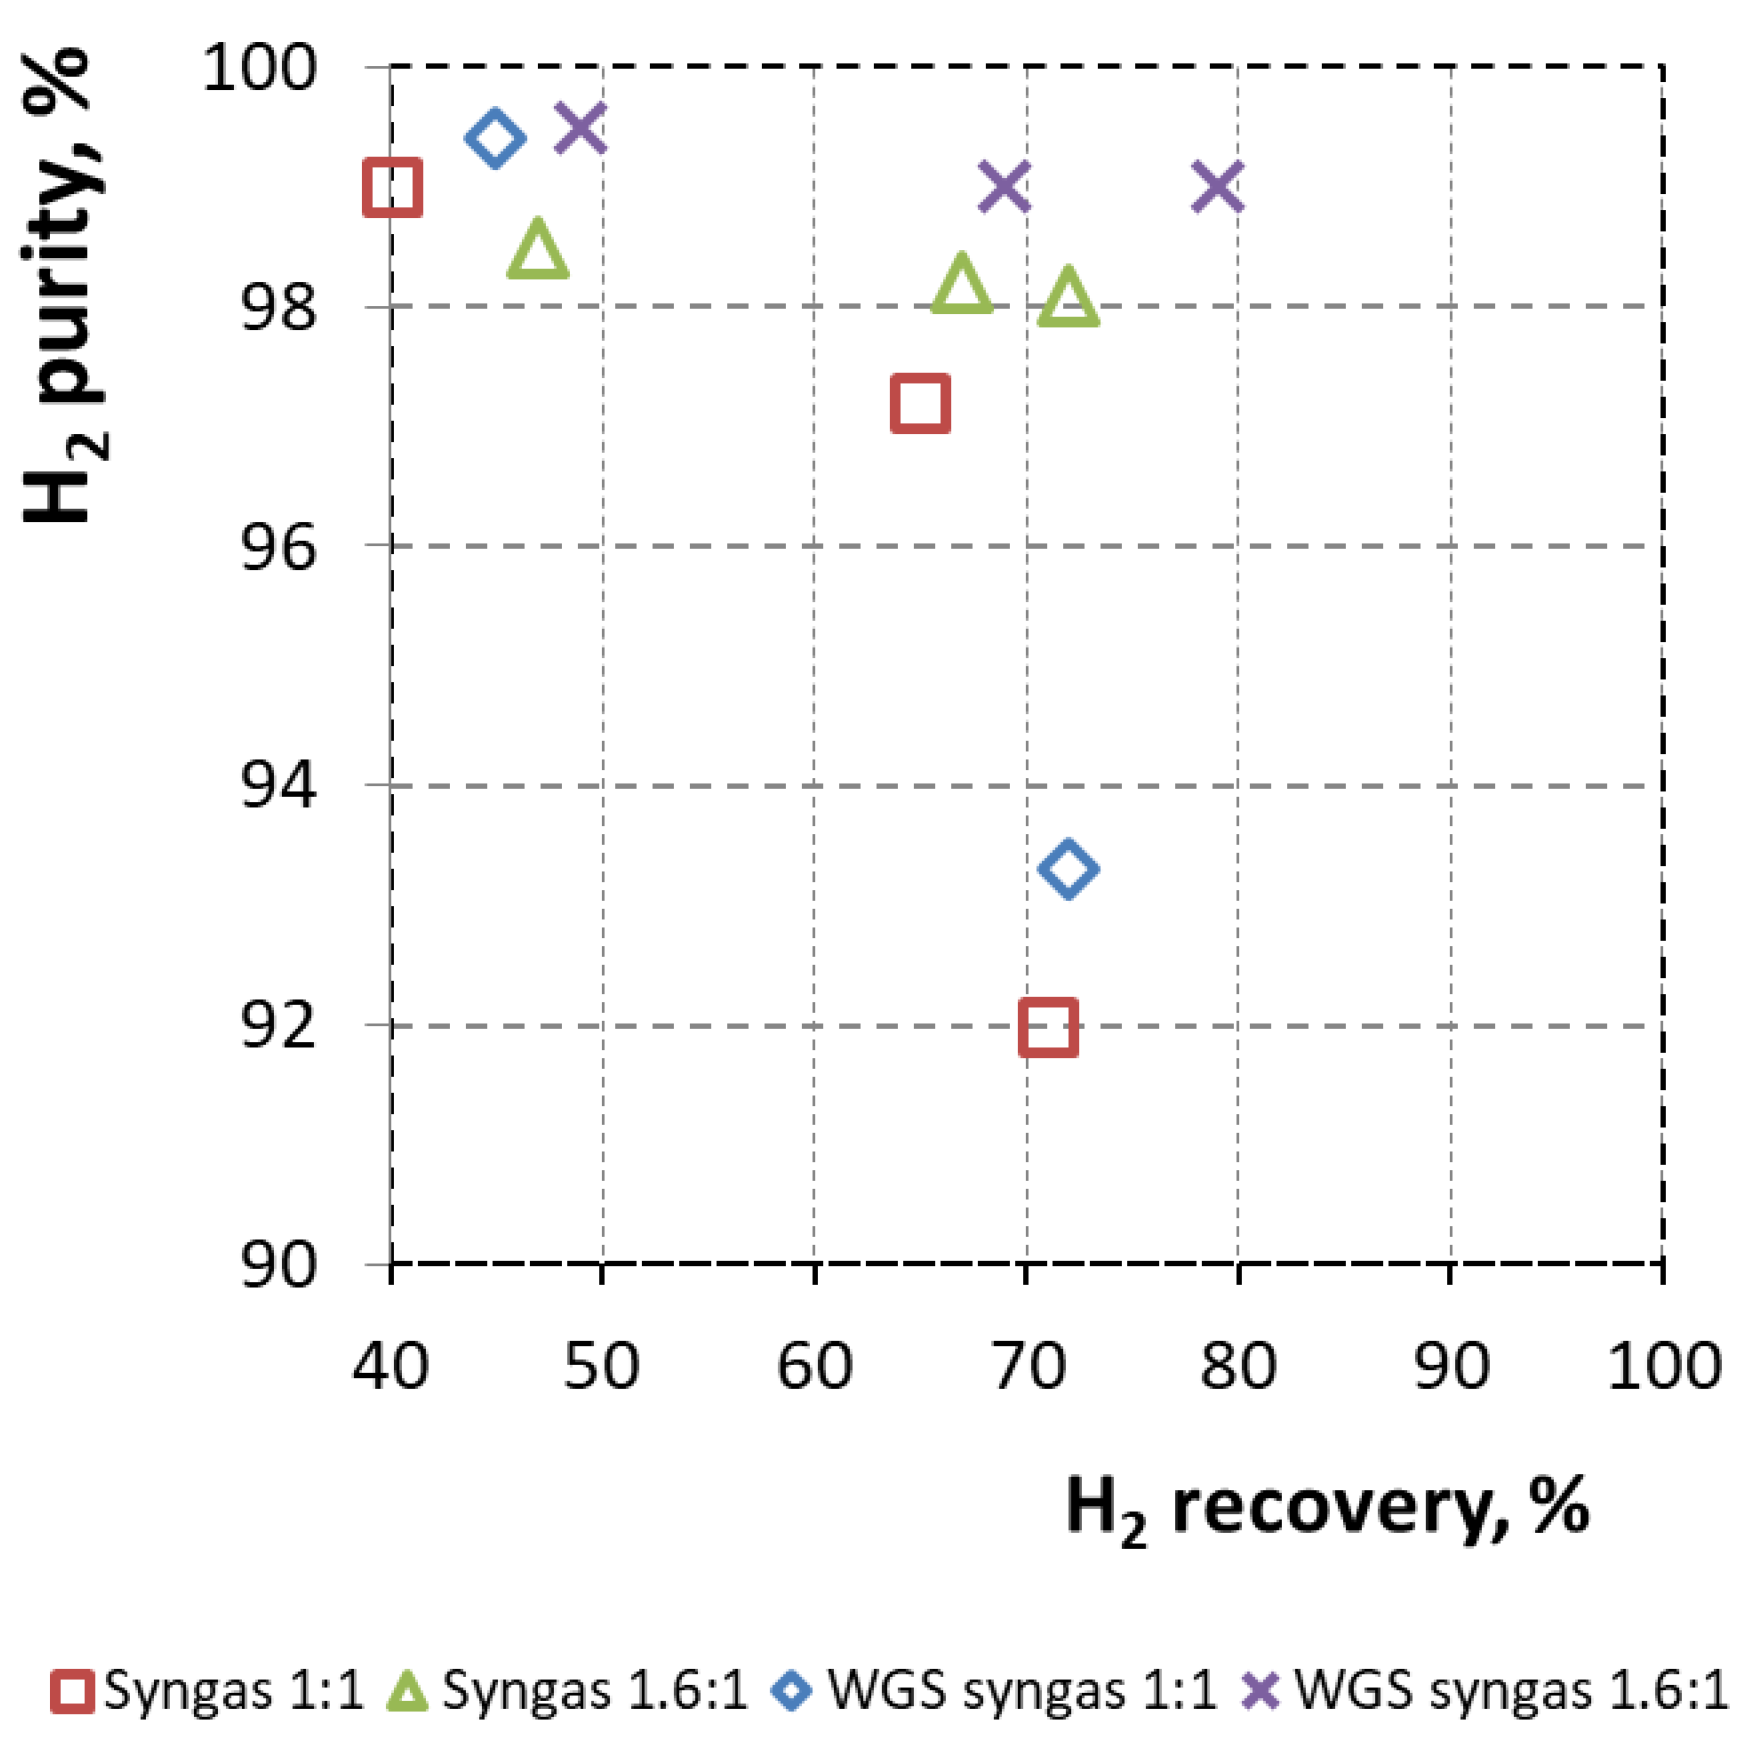
Table 9 and Figure 7 summarize the results obtained for the two-bed Berlin-type cycle. For syngas, the adsorption time was varied between 80 and 135 s, corresponding to a safety margin to CO breakthrough of 34.1–68.8%. The results demonstrate a clear trade-off between hydrogen purity and recovery. For the 1:1 AC:zeolite bed, reducing adsorption time from 135 to 80 s increased the average H2 concentration in the high-pressure product from 92 to 99.0 vol.%, while the H2 recovery decreased from 71 to 40%. A similar trend was observed for the 1.6:1 bed, where an adsorption time of 135 s resulted in 98.1 vol.% H2 and 72% recovery, whereas shortening the adsorption time to 80 s increased the H2 purity to 98.5 vol.% but reduced the recovery to 47%.
The impact of the bed configuration was evident in the results. Increasing the activated carbon fraction from an AC:zeolite ratio of 1:1 to 1.6:1 improved impurity retention and enabled higher hydrogen purity to be achieved at comparable adsorption times. This effect was particularly visible for syngas at an adsorption time of 135 s, where H2 purity increased from 92 to 98.1 vol.% while maintaining a similar recovery level. These findings confirm the beneficial role of an extended activated carbon section in retaining strongly adsorbed components, particularly CO2 and CH4, and in stabilizing the adsorption front before the gas reaches the zeolite 5A layer. The behavior aligns with the established principles of layered PSA bed design, in which activated carbon is primarily applied for the removal of CO2 and hydrocarbons, while zeolitic layers are responsible for the retention of CO and N2 [10,11,12,13,14,15,16,40].
For WGS syngas, the Berlin-type cycle generally provided higher hydrogen purity than for syngas, mainly due to the lower CO concentration in the feed gas. In this case, adsorption times ranging from 60 to 125 s were evaluated, resulting in safety margins to CO breakthrough of 43.6–75.4%. The highest H2 purity observed in the Berlin-type cycle was 99.5 vol.%, for WGS syngas, using the 1.6:1 bed (AC:zeolite ratio) and an adsorption time of 60 s. However, H2 recovery under these conditions was limited to 49%, indicating that conservative adsorption times improve product quality but increase hydrogen losses during regeneration and purge steps. The optimal balance for the Berlin-type cycle was achieved for WGS syngas using the 1.6:1 bed at an adsorption time of 125 s, yielding a product with 99.0 vol.% H2 and a recovery of 79%.
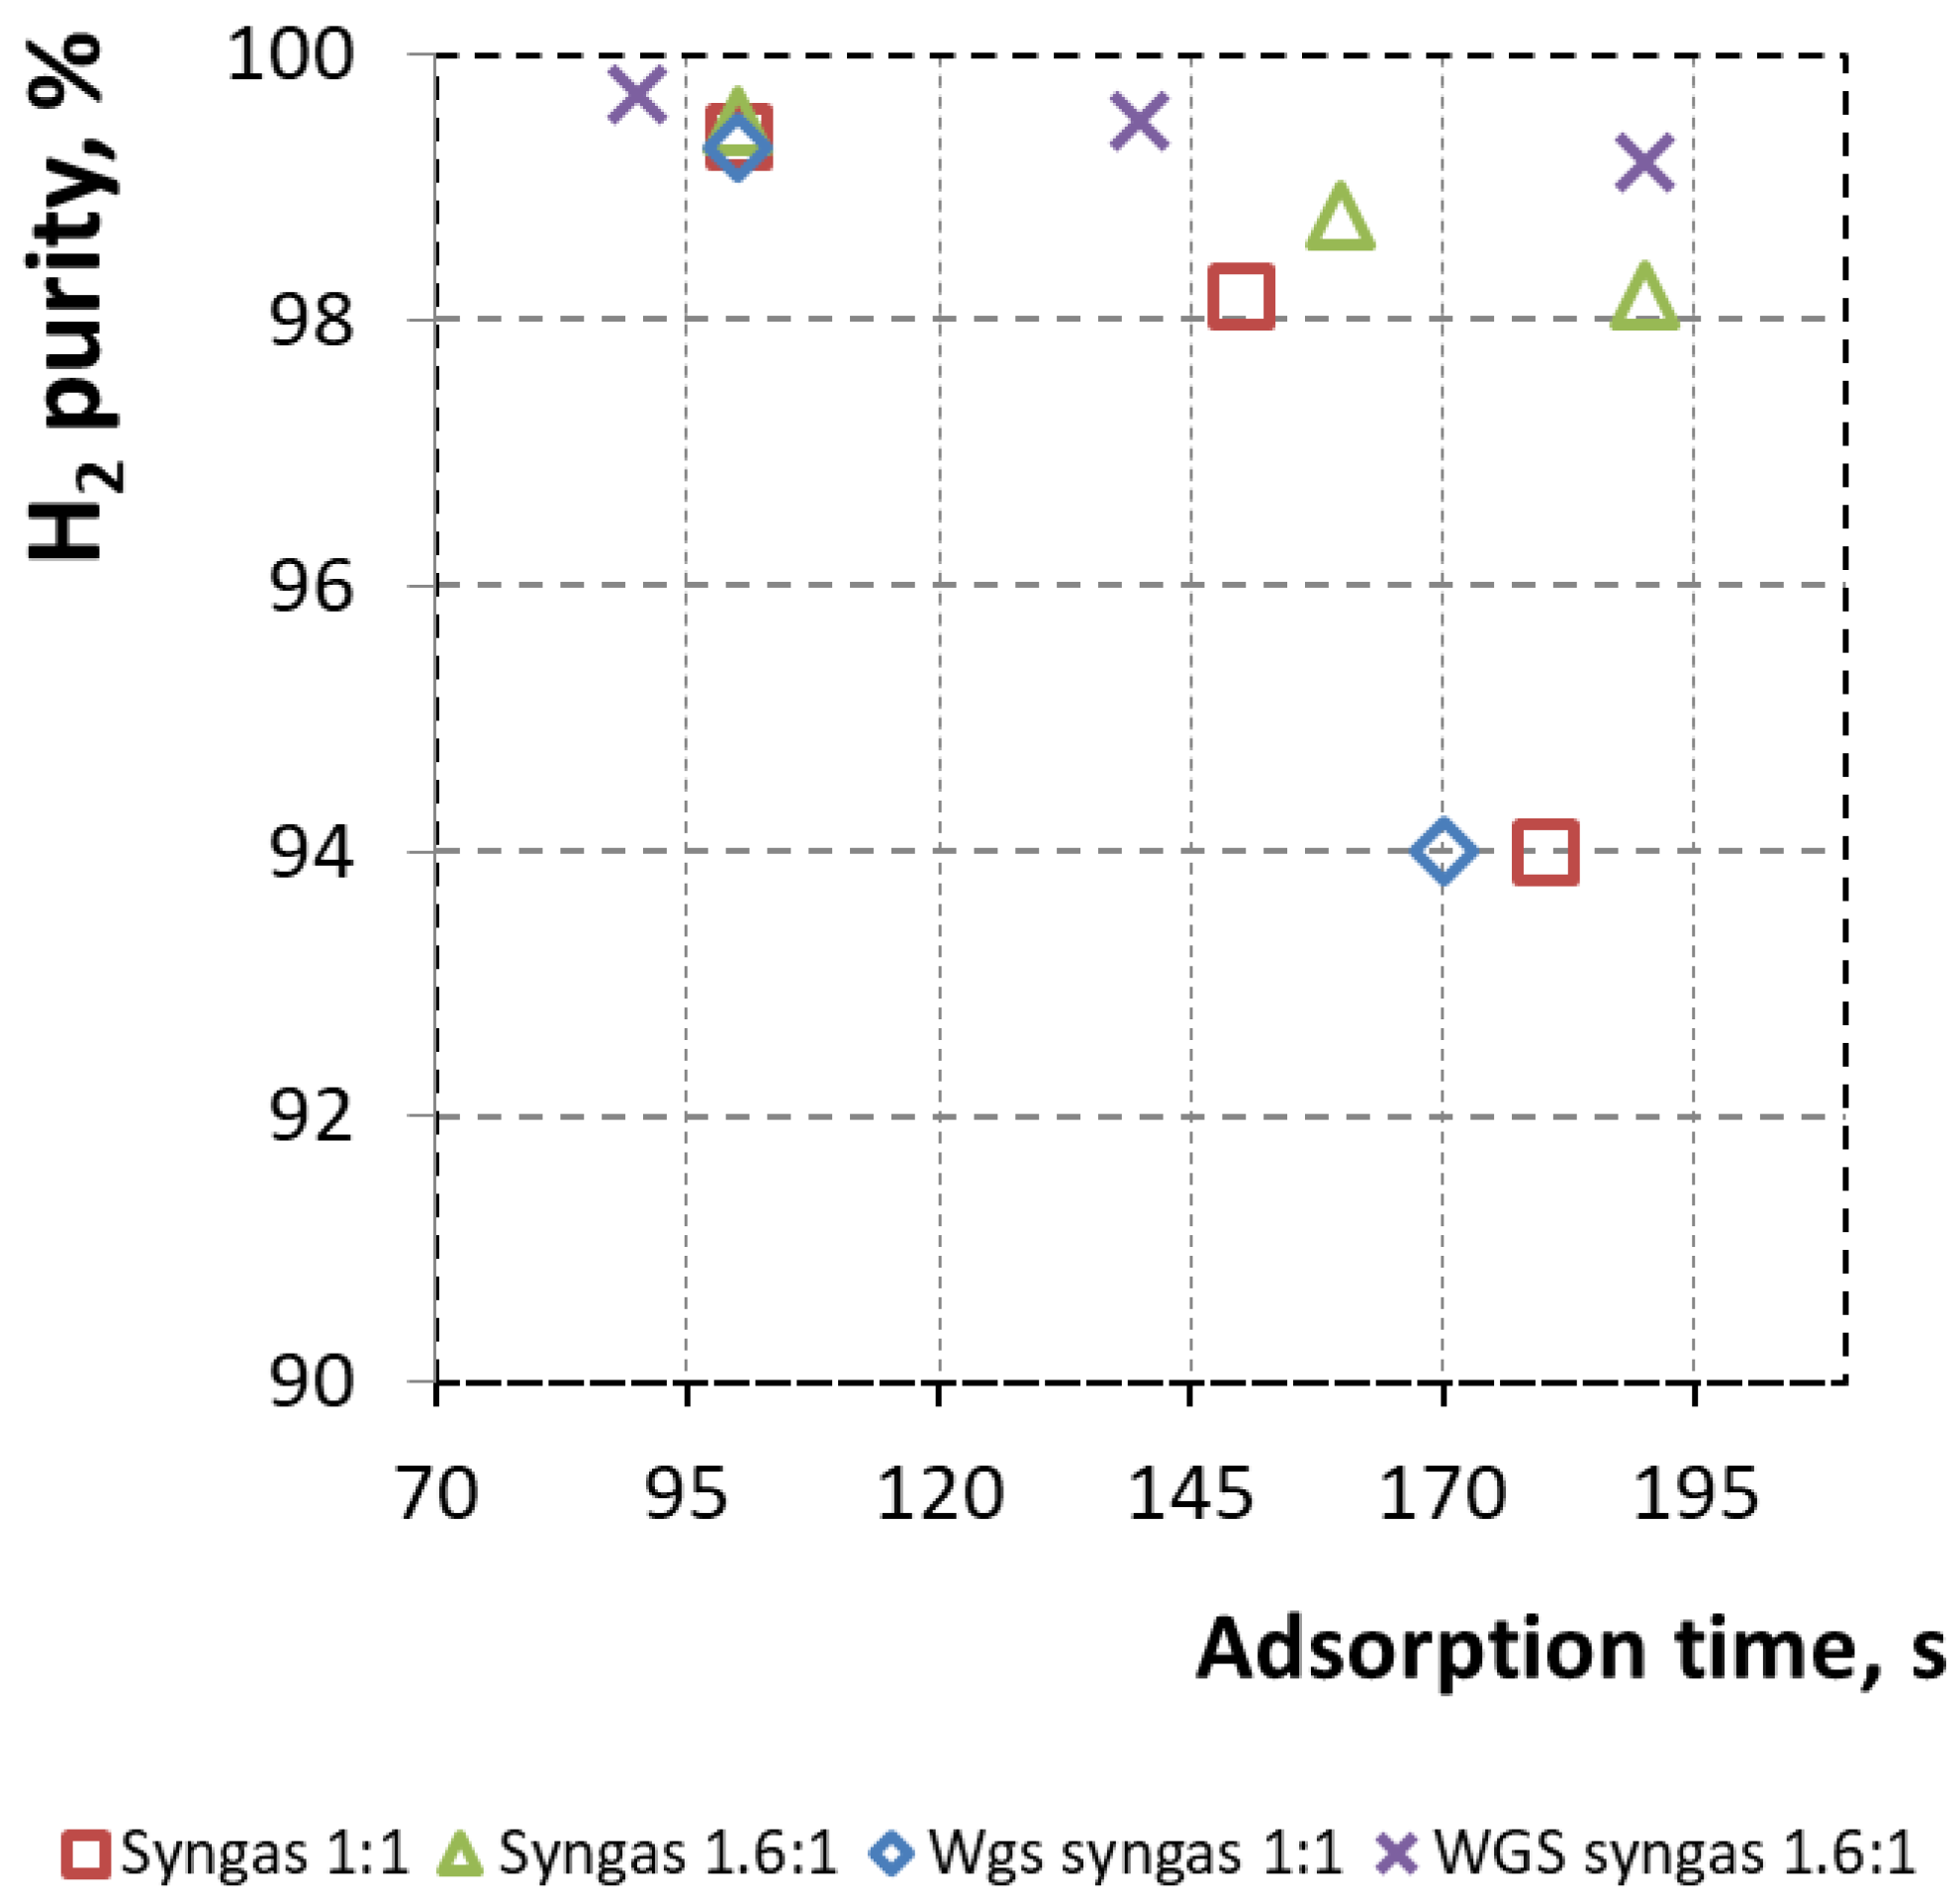
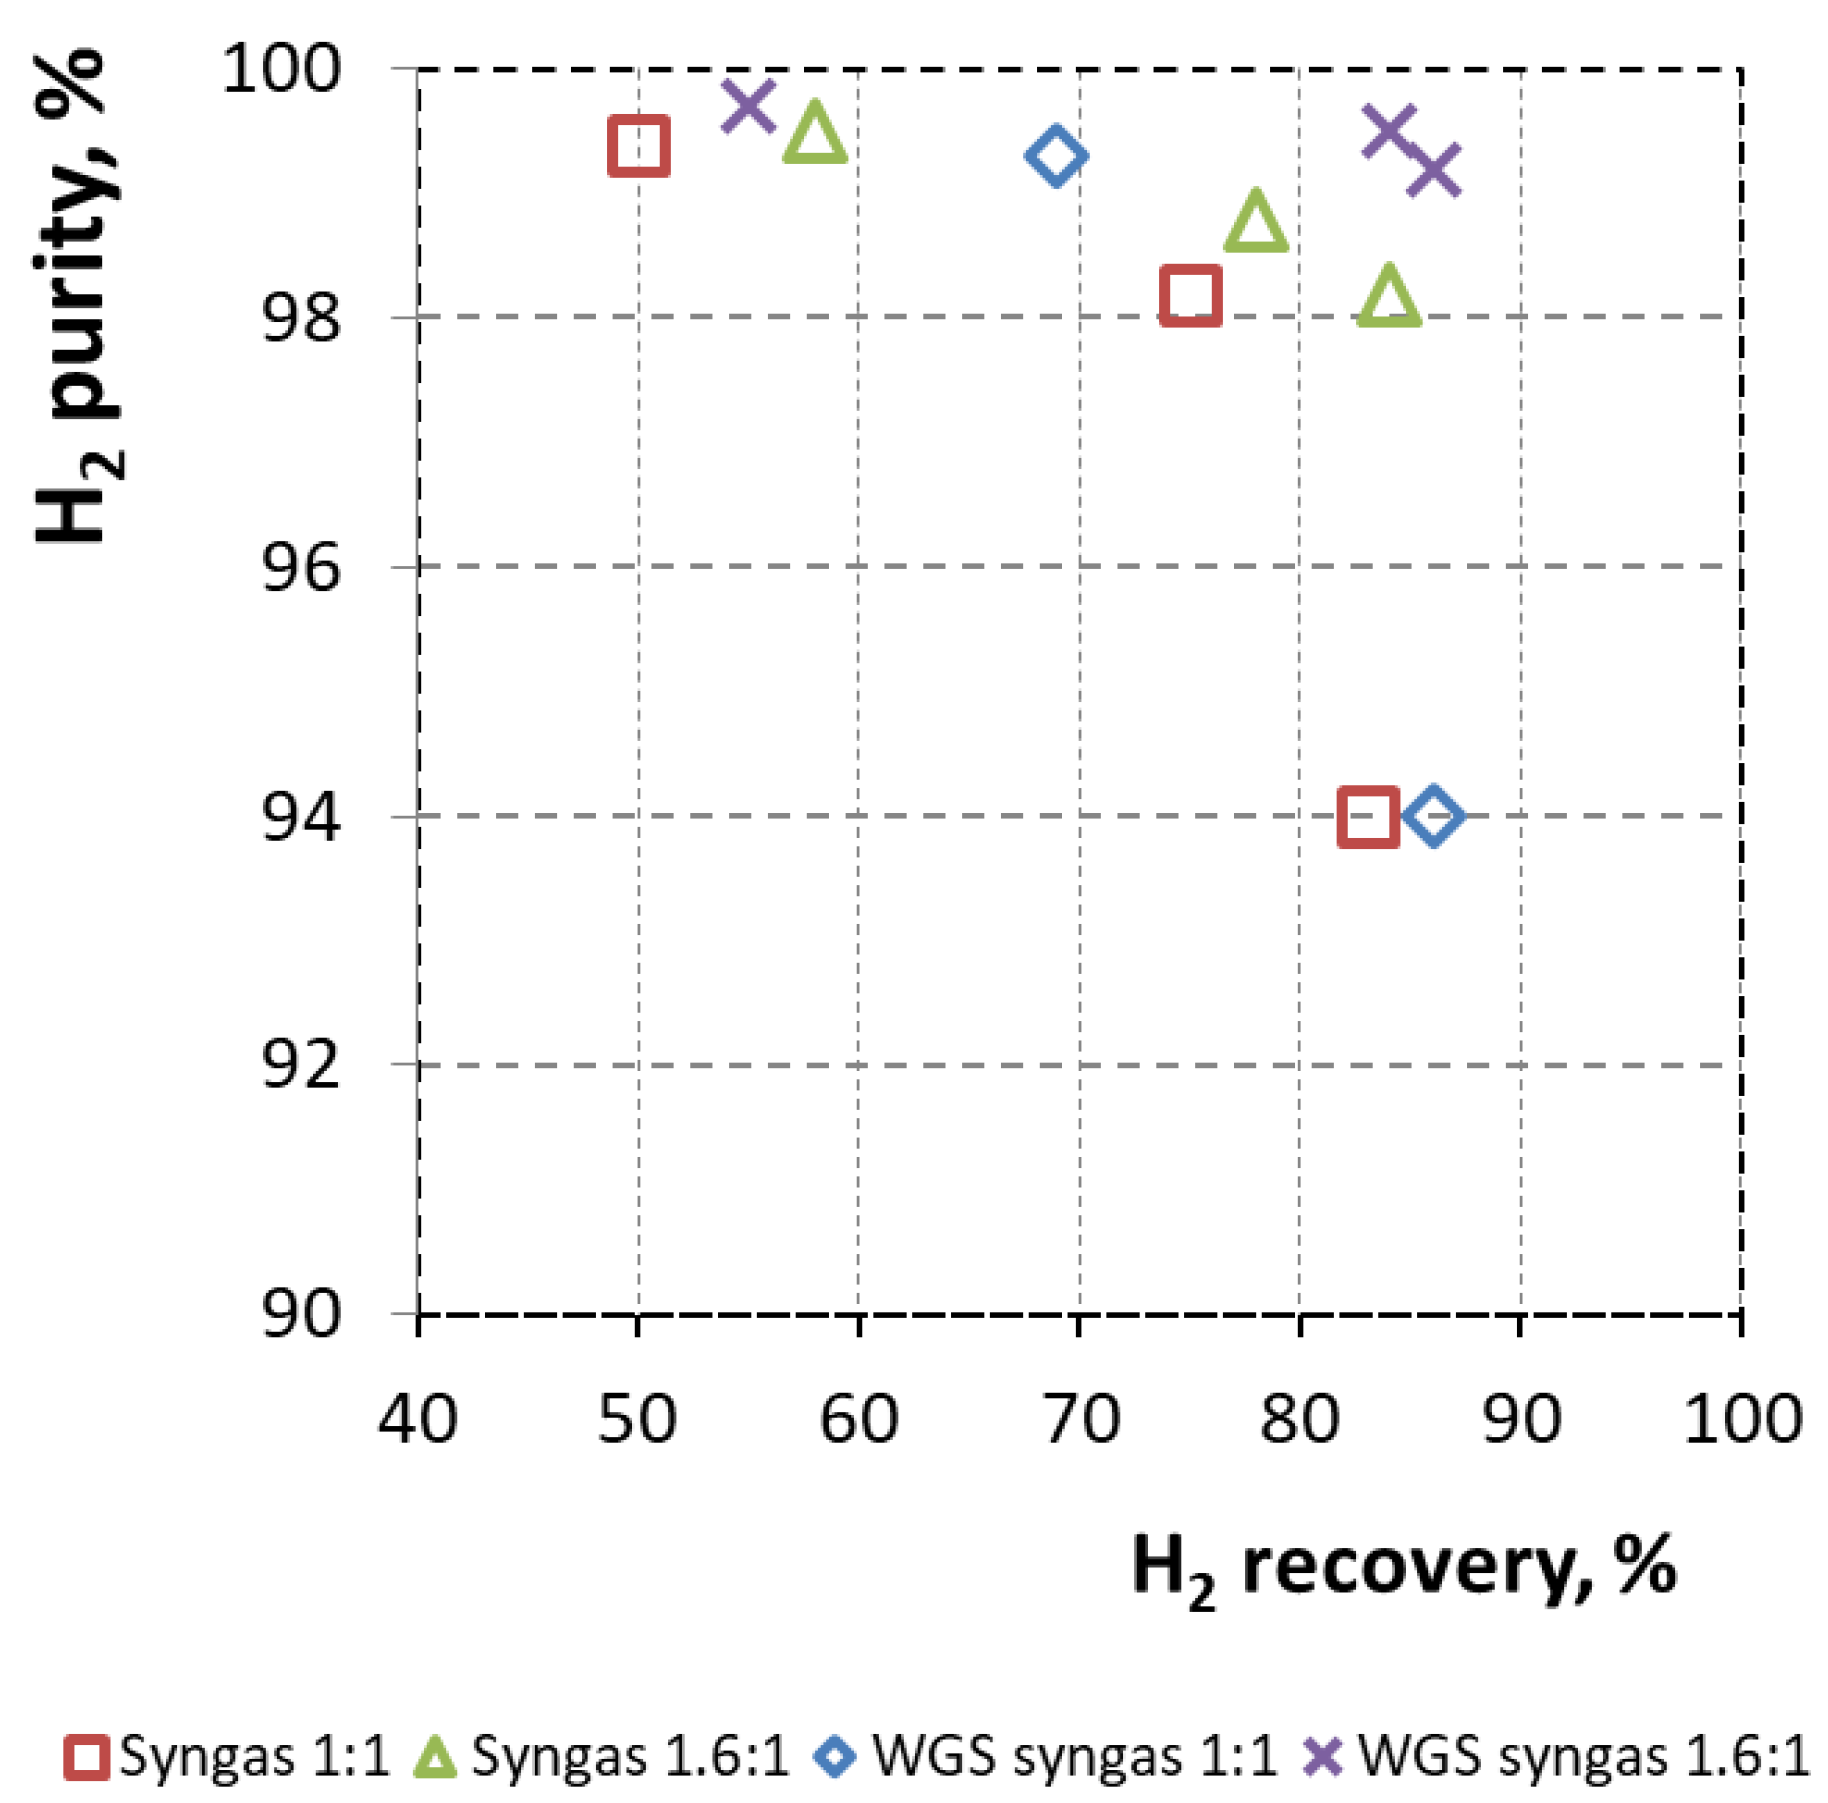
The four-bed Linde-type cycle showed a broader, more favorable operating window, as presented in Table 10 and Figure 8. For syngas, H2 purity ranged from 94 to 99.5 vol.%, with H2 recovery between 50 and 84%. For WGS syngas, the respective ranges were 94.0–99.7 vol.% and 55–86%, respectively. Compared with the Berlin-type cycle, the Linde-type cycle achieved higher hydrogen recovery while maintaining comparable or higher hydrogen purity. This improvement can be attributed to the more advanced cycle configuration, which includes two pressure equalization steps and a dedicated product-purge step. These additional steps improve the utilization of hydrogen-rich gas within the cycle for bed regeneration and repressurization, thereby reducing hydrogen losses during blowdown and purge. Similar advantages of multi-bed PSA cycles with pressure equalization have also been reported for hydrogen recovery and pre-combustion gas separation systems [21,22,29,37].
In the Linde-type cycle using syngas, reducing the adsorption time from 180 s to 100 s for the 1:1 AC:zeolite bed increased H2 purity from 94 to 99.4 vol.%, while the recovery decreased from 83% to 50%. A similar trend was observed for the 1.6:1 bed. An adsorption time of 160 s yielded 98.8 vol.% H2 with 78% recovery, whereas reducing the adsorption time to 100 s increased H2 purity to 99.5 vol.% but reduced the recovery to 58%. These results confirm that achieving higher H2 purity in the PSA unit requires a shorter adsorption step, while maximizing recovery requires longer adsorption times and more complete utilization of the bed capacity before impurity breakthrough.
The best overall performance was observed for WGS syngas in the Linde-type cycle using the 1.6:1 AC:zeolite bed. At an adsorption time of 90 s, the highest H2 purity of 99.7 vol.% was achieved, although the recovery was limited to 55%. Extending the adsorption time to 140 s yielded 99.5 vol.% H2 with 84% recovery, while a further increase to 190 s maintained a high H2 purity of 99.2 vol.% and increased recovery to 86%. These findings indicate that, under the investigated conditions, the Linde-type cycle can achieve both high hydrogen purity and recovery when operated with WGS syngas and a higher activated carbon fraction.
For the highest-purity case, corresponding to 99.7 vol.% H2 in the Linde-type cycle with WGS syngas and the 1.6:1 AC:zeolite bed, the residual CO concentration reported by the online analyzer was approximately 0.02 vol.% in the high-pressure product stream. This value should be interpreted as low CO slip within the measurement capability of the online analyzer, not as verification of sub-ppm CO removal. Under the investigated conditions, CO was consistently the first directly measured impurity breakthrough and was therefore used as the practical limiting component for defining the adsorption-time cut-off. However, the present laboratory PSA configuration should not be interpreted as a final fuel-cell-grade hydrogen purification unit. The residual CO concentrations reported in this study do not verify sub-ppm CO specifications. For ultra-high-purity applications, a downstream polishing step, such as catalytic CO methanation, preferential oxidation, or a dedicated adsorptive polishing bed, would be required.
The experimentally obtained results show that adsorption time was the dominant operating variable controlling the purity–recovery trade-off. In both PSA cycles, shorter adsorption times increased the safety margin to CO breakthrough and improved hydrogen purity, but also increased hydrogen losses during blowdown and purge, thereby decreasing recovery. This effect was especially visible in the Berlin-type cycle, where reducing the adsorption time from 135 to 80 s for syngas increased the H2 concentration from 92.0 to 99.0 vol.% but decreased H2 recovery from 71 to 40%. In the Linde-type cycle, the same trend was observed, although the recovery penalty was lower due to the additional pressure equalization and product-purge steps. These steps enabled better internal use of hydrogen-rich gas for repressurization and regeneration, which reduced direct hydrogen losses to the tail gas. The most favorable operating window was obtained for WGS syngas using the 1.6:1 AC:zeolite bed in the Linde-type cycle, where 99.5 vol.% H2 was achieved at 84% recovery and 99.2 vol.% H2 was maintained at 86% recovery. These results indicate that the four-bed cycle was more effective not only because of its longer cycle sequence, but also because internal gas redistribution improved bed regeneration and pressure recovery while maintaining sufficient protection against impurity breakthrough. In design and research practice, it is common to establish initial PSA cycle stage durations, which are subsequently refined during the start-up and optimization of a new installation. These initial values, based on typical data reported in the technical literature and previous laboratory experience, serve as a starting point for further optimization. Stage durations are then adjusted based on measured product purity, recovery, and process stability.
When optimizing the PSA cycle, it is important to consider several operational factors such as the temperature and humidity effects on adsorbent performance, energy demand for various cycle configurations, and the trade-off among cycle duration, productivity, and compressed gas consumption. Furthermore, advanced simulation tools based on dynamic PSA models, coupled with adaptive control algorithms, can help maximize overall process efficiency [41].
The primary goal of PSA cycle optimization is to achieve the highest possible hydrogen purity while maximizing recovery and minimizing operating costs. Table 11 and Table 12 provide experimentally determined starting values for the durations of individual cycle stages, intended for the initial optimization of the Berlin and Linde-type cycle configurations. These values, based on operating pressure fluctuations (Pads = 8.5 bar, Pdes = ~1.2 bar), serve as a starting point for further installation-specific optimization.
From a process-optimization perspective, the experimentally determined step durations should be regarded as installation-specific starting points rather than universal PSA cycle parameters. During further scale-up or process optimization, adsorption, pressure equalization, purge, and pressurization times require iterative adjustment based on product purity, hydrogen recovery, pressure profiles, and tail gas composition. Particular attention should be paid to valve switching dynamics, dead volumes, purge demand, and effective pressure swing, as these factors significantly influence hydrogen losses and cyclic stability in laboratory-scale PSA systems. Upon scale-up, adsorption time should not be assumed to scale linearly with bed length. The optimal stage durations depend on superficial velocity, bed length-to-diameter ratio, pressure drop, axial dispersion, mass-transfer-zone length, valve switching time, dead-volume fraction, and the efficiency of pressure equalization and purge steps. Larger beds generally reduce the relative influence of dead volumes and may permit higher recovery, but they also require careful control of pressure propagation and mass-transfer resistance. Therefore, industrial PSA design should be supported by dynamic PSA modeling and pilot-scale validation rather than by direct linear scaling of the laboratory stage durations.

3.3. Impact of PSA Cycle Configuration on Hydrogen Purification Performance

The comparison of the tested PSA cycle configurations shows that both the cycle configuration and the feed gas composition significantly affect hydrogen purification performance. Figure 9 and Figure 10 show the typical purity–recovery trade-off in PSA-based hydrogen separation. Shortening adsorption time increases hydrogen purity by raising the safety margin to impurity breakthrough, but it lowers hydrogen recovery as more hydrogen is lost in the blowdown and purge streams. Conversely, longer adsorption times improve recovery and productivity, but increase the risk of product contamination with CO, CH4, CO2 or N2.
Feed gas composition significantly affected PSA performance. WGS syngas provided a wider operating window for hydrogen purification because it contained a higher H2 fraction and a much lower CO concentration than syngas. Since CO was the first experimentally confirmed impurity breakthrough, its reduced concentration in the WGS feed directly decreased the risk of CO slip into the hydrogen-rich product stream. However, WGS syngas also contained a higher CO2 concentration, which increased the adsorption load on the activated carbon section and could intensify competitive adsorption effects between CO2, CO, CH4, and N2 in the layered bed. CO2 has a strong affinity for activated carbon and may form a broad mass-transfer zone; if the activated carbon section is insufficient, the advancing CO2 front may change the composition of the gas reaching the zeolite layer and reduce the effective capacity for CO retention. The 1.6:1 AC:zeolite configuration therefore acted as a larger protective buffer: it retained more CO2 in the upstream bed section, delayed CO2 breakthrough, and stabilized the gas reaching the zeolite 5A layer. This helped prevent premature CO slip and explains why the extended activated carbon section was especially beneficial for WGS syngas, although it may also increase regeneration demand under CO2-rich operation. The most favorable operating window was observed for the Linde-type cycle using WGS syngas and the 1.6:1 AC:zeolite bed. Under these conditions, H2 purity of 99.5 vol.% was obtained at 84% recovery for an adsorption time of 140 s, while H2 purity of 99.2 vol.% was maintained at 86% recovery for an adsorption time of 190 s. These results indicate that the four-bed configuration enables simultaneous high hydrogen purity and recovery operation. By contrast, the Berlin-type cycle exhibited a more pronounced purity–recovery trade-off, particularly for syngas.
Although industrial PSA units generally achieve hydrogen purities above 99.9% and recoveries over 80–90%, the lower recoveries observed in this study result from the challenging feed gas composition and the laboratory-scale character of the PSA unit. The feed contained only 26–34 vol.% H2 and high levels of strongly adsorbed components such as CO2 and CO. These conditions increase hydrogen losses during blowdown, purge, and pressure equalization steps, especially in laboratory-scale systems with relatively high dead volumes. In addition, adsorption kinetics and mass-transfer resistance in the layered activated carbon/zeolite 5A bed may also contribute to lower recovery. Finite adsorption and desorption rates, axial dispersion, and broadening of the mass-transfer zone can reduce effective bed utilization and promote hydrogen co-desorption during regeneration. These effects are particularly relevant for CO2-rich WGS syngas, where the activated carbon layer is strongly loaded and where incomplete regeneration may affect the following adsorption step.
The overall efficiency of the PSA process, defined by the purity–recovery trade-off, is significantly influenced by several operational factors, including (i) the effective pressure swing amplitude, (ii) the intensity and duration of the purge and regeneration steps, (iii) switching valve leakage, (iv) the size of dead volumes within the system, and (v) the number and configuration of pressure equalization steps.
According to literature, industrial PSA systems achieve hydrogen purity exceeding 99.9 vol.% with recovery rates of 80–91% for hydrogen-rich feedstocks, such as reformer or process-off gases characterized by high H2 content [7,9,42].
For hydrogen-lean feed gases with high CO2 concentrations, such as the mixtures analyzed in this study, lower hydrogen recovery can be expected due to the thermodynamic and kinetic limitations of the adsorption process. At the same time, the literature [42] indicates that the use of a deeper reduction in regeneration pressure (Pdes ≈ 1.2 bar), combined with appropriately optimized pressure equalization and purging steps, allows hydrogen purity to be maintained above 99 vol.%, even for challenging CO2-rich streams. This approach is commonly used in pre-combustion CO2 capture systems based on PSA and VPSA technologies.
The Linde-type cycle outperforms the Berlin-type cycle due to additional pressure equalization and dedicated product-purge steps. These features allow more effective utilization of hydrogen-rich gas for bed regeneration and repressurization, thereby reducing hydrogen losses and improving overall recovery. The PSA system performance depends on several interrelated factors, including adsorption equilibria, mass-transfer kinetics in the layered activated carbon–zeolite 5A bed, valve switching dynamics, buffer tank characteristics, and the chosen adsorption cut-off point, defined by adsorption time and final pressure.
In addition to H2 purity and H2 recovery, selected supplementary indicators were evaluated to support process interpretation. Hydrogen loss was calculated as the complement of H2 recovery, while purge consumption was represented by the purge-to-feed ratio, which was maintained at approximately 0.1 under the investigated operating conditions. The CO2 content of the low-pressure tail gas was used as an indicator of the potential for downstream CO2 management. However, specific energy consumption and adsorbent productivity were not calculated in this study because the laboratory installation was not equipped with direct compressor power measurement and the experiments were not designed as a full scale-up or techno-economic assessment. These indicators are therefore identified as important targets for future process optimization.
Adsorbent productivity was not calculated in this study because the experiments were designed primarily to evaluate breakthrough behavior, hydrogen purity, hydrogen recovery, and tail-gas composition under laboratory cyclic steady-state operation. A complete productivity analysis would require cycle-specific product flow integration and normalization to adsorbent mass for all operating points. Therefore, adsorbent productivity is identified as an important target for future process optimization and scale-up studies.

3.4. Composition of Low-Pressure Tail Gas from PSA Laboratory Setup

In typical PSA hydrogen separation, the adsorbent bed (consisting of zeolites, activated carbon, or silica gel in multilayer systems) selectively adsorbs more strongly adsorbed components such as CO2, CO, CH4, N2, H2O, while H2 remains in the gas phase as the product stream. Consequently, during bed regeneration in the blowdown and purge stages, these impurities are desorbed, producing an impurity-rich off-gas stream. This stream still contains a significant amount of H2 due to unavoidable process losses [10,11,43].
Table 13 presents overall tail-gas composition ranges obtained from the low-pressure extract line. These ranges combine steady-state data for both PSA cycle configurations for a given feed gas and should therefore be interpreted as an overall composition envelope rather than as cycle-specific values. This approach was retained because the available tail-gas data were used primarily for global hydrogen-loss and CO2-enrichment assessment, whereas complete cycle-resolved LP gas balances were not available for all operating points. In addition, the low-pressure stream was collected downstream of the LP buffer, where blowdown and purge contributions were mixed and damped. Therefore, robust cycle-specific tail-gas compositions could not be reconstructed from the available dataset. However, the higher H2 recoveries achieved in the Linde-type cycle indicate lower net hydrogen loss to the tail gas than in the Berlin-type cycle at comparable product purities. A cycle-resolved LP analysis, including separate blowdown and purge fractions, will be required to determine whether a given cycle produces a more CO2-rich or H2-rich tail gas at a fixed adsorption time. H2, CO, CO2, and CH4 were measured online, while N2 was calculated by difference. Future work will include cycle-specific tail-gas measurements and complete LP/HP mass-balance closure for individual PSA cycle configurations.
Reported values correspond to steady-state operation and reflect variations in adsorption time, bed configuration, and PSA cycle configuration. H2, CO, CO2, and CH4 were measured online, while N2 was calculated by difference. The values should be interpreted as overall tail-gas composition ranges, not as cycle-specific compositions.

4. Conclusions

This study evaluated hydrogen recovery from synthetic syngas and WGS syngas using a laboratory-scale PSA unit operated with two cycle configurations: a two-bed Berlin-type cycle and a four-bed Linde-type cycle. Breakthrough tests showed that CO was the first impurity detected, thereby limiting the adsorption step duration, whereas CO2 exhibited the strongest retention in the activated carbon layer. Increasing the activated carbon fraction improved impurity retention, particularly for the CO2-rich WGS syngas mixture. Nitrogen was not directly measured in the breakthrough tests; therefore, CO was considered the first experimentally confirmed impurity breakthrough, while N2 was included only indirectly through the gas balance.
The present results should be interpreted as laboratory-scale cyclic steady-state data rather than as a direct industrial design basis. The PSA unit used relatively small columns and laboratory-scale buffer volumes, and therefore the influence of dead volumes, valve switching, and pressure equalization may be stronger than in optimized industrial PSA systems. Moreover, the study did not include long-term stability testing, full scale-up analysis, or techno-economic evaluation. Consequently, the industrial relevance of the results lies mainly in identifying trends in bed configuration, feed-gas composition, cycle configuration, and the purity–recovery trade-off. Future work should include extended cyclic operation, direct N2 validation, humid-feed testing, energy-demand assessment, and scale-up modeling.
Continuous PSA experiments demonstrated a clear trade-off between hydrogen purity and recovery. The highest hydrogen purity of 99.7 vol.% was achieved for WGS syngas in the Linde-type cycle, but with a reduced recovery of 55%. Shorter adsorption times increased hydrogen purity but reduced recovery, whereas longer adsorption times improved recovery at the expense of higher impurity slip. The four-bed Linde-type cycle offered a more favorable operating window than the two-bed Berlin-type cycle due to additional pressure equalization and product-purge steps. The best overall performance was achieved for WGS syngas using the Linde-type cycle with a higher activated carbon fraction, reaching 99.5 vol.% H2 at 84% recovery and maintaining 99.2 vol.% H2 at 86% recovery. The results represent cyclic steady-state performance under the investigated laboratory conditions; extended cycle-resolved tests would be required to quantify possible long-term CO2 accumulation and regeneration efficiency.
The PSA tail gas was highly enriched in CO2, reaching approximately 72 vol.% for WGS syngas. This indicates potential for integration with CO2 capture, utilization, or storage strategies. The main limitations of this study are related to the laboratory scale of the PSA unit, the use of dry synthetic gas mixtures, the indirect estimation of N2 by difference, and the absence of long-term stability, humid-feed, scale-up, and techno-economic analyses. Future work should therefore include direct N2 quantification using GC/TCD, extended cyclic operation to evaluate CO2 accumulation and regeneration efficiency, tests with humid and trace-contaminant-containing syngas, energy-demand measurements, and process modeling for scale-up and optimization. Overall, the results demonstrate the strong potential of layered-bed PSA cycles for hydrogen purification from syngas-derived streams, especially when integrated with downstream CO2 management.

Author Contributions

Conceptualization, A.K. and J.B.; methodology, A.K.; formal analysis, A.K.; investigation, A.K. and T.S.; resources, J.B.; data curation, A.K.; writing—original draft preparation, A.K. and T.S.; writing—review and editing, A.K. and T.S.; supervision, K.I. and A.C.; project administration, J.B. and A.C. All authors have read and agreed to the published version of the manuscript.

Funding

This research was co-funded by the European Commission within the framework of the Research Fund for Coal and Steel (RFCS) program under contract no. 101112386 and by a state subsidy within the framework of the program ‘Co-financed International Projects’ (PMW) established by the Minister of Science and Higher Education of Poland. The APC was also funded by these sources.

Data Availability Statement

In order to receive detailed research data used to develop a manuscript, please contact the corresponding author.

Conflicts of Interest

The authors declare no conflict of interest.

Abbreviations

The following abbreviations are used in this manuscript:
HPHigh-pressure gas product gas
P/FPurge-to-feed ratio
GCGas chromatography
TCDThermal conductivity detector
PadsAdsorption pressure
PdesDesorption pressure
WGSWater Gas Shift process/reaction
SyngasSynthesis gas
PSAPressure Swing Adsorption
VPSAVacuum Pressure Swing Adsorption
NLNormal liter at 0 °C, 1 bar

References

  1. Basile, A.; Iulianelli, A. Advances in Hydrogen Production, Storage and Distribution; Woodhead Publishing: Sawston, UK, 2014; ISBN 978-0-85709-768-2. [Google Scholar]
  2. Nikolaidis, P.; Poullikkas, A. A Comparative Overview of Hydrogen Production Processes. Renew. Sustain. Energy Rev. 2017, 67, 597–611. [Google Scholar] [CrossRef] [Scilit]
  3. Abe, J.O.; Popoola, A.P.I.; Ajenifuja, E.; Popoola, O.M. Hydrogen Energy, Economy and Storage: Review and Recommendation. Int. J. Hydrogen Energy 2019, 44, 15072–15086. [Google Scholar] [CrossRef] [Scilit]
  4. Rostrup-Nielsen, J.; Christiansen, L.J. Concepts in Syngas Manufacture; Catalytic Science Series; Imperial College Press: London, UK, 2011; Volume 10, ISBN 978-1-84816-567-0. [Google Scholar]
  5. Staffell, I.; Scamman, D.; Abad, A.V.; Balcombe, P.; Dodds, P.E.; Ekins, P.; Shah, N.; Ward, K.R. The Role of Hydrogen and Fuel Cells in the Global Energy System. Energy Environ. Sci. 2019, 12, 463–491. [Google Scholar] [CrossRef] [Scilit]
  6. Newsome, D.S. Water-Gas Shift Reaction. Catal. Rev. Sci. Eng. 1979, 21, 275–318. [Google Scholar] [CrossRef] [Scilit]
  7. Sircar, S.; Golden, T.C. Purification of Hydrogen by Pressure Swing Adsorption. Sep. Sci. Technol. 2000, 35, 667–687. [Google Scholar] [CrossRef] [Scilit]
  8. Sircar, S. Pressure Swing Adsorption. Ind. Eng. Chem. Res. 2002, 41, 1389–1392. [Google Scholar] [CrossRef] [Scilit]
  9. Luberti, M.; Ahn, H. Review of Polybed Pressure Swing Adsorption for Hydrogen Purification. Int. J. Hydrogen Energy 2022, 47, 10911–10933. [Google Scholar] [CrossRef] [Scilit]
  10. Yang, R.T. Gas Separation by Adsorption Processes; Butterworth-Heinemann: Oxford, UK, 1987; ISBN 978-0-409-90004-0. [Google Scholar]
  11. Ruthven, D.M.; Farooq, S.; Knaebel, K.S. Pressure Swing Adsorption; VCH: New York, NY, USA, 1994; ISBN 978-1-56081-517-4. [Google Scholar]
  12. Sircar, S.; Golden, T.C.; Rao, M.B. Activated Carbon for Gas Separation and Storage. Carbon 1996, 34, 1–12. [Google Scholar] [CrossRef] [Scilit]
  13. Siriwardane, R.V.; Shen, M.-S.; Fisher, E.P.; Poston, J.A. Adsorption of CO2 on Molecular Sieves and Activated Carbon. Energy Fuels 2001, 15, 279–284. [Google Scholar] [CrossRef] [Scilit]
  14. Mofarahi, M.; Gholipour, F. Gas Adsorption Separation of CO2/CH4 System Using Zeolite 5A. Microporous Mesoporous Mater. 2014, 200, 1–10. [Google Scholar] [CrossRef] [Scilit]
  15. Park, Y.; Moon, D.-K.; Kim, Y.-H.; Ahn, H.; Lee, C.-H. Adsorption Isotherms of CO2, CO, N2, CH4, Ar and H2 on Activated Carbon and Zeolite LiX up to 1.0 MPa. Adsorption 2014, 20, 631–647. [Google Scholar] [CrossRef] [Scilit]
  16. Feng, L.; Shen, Y.; Wu, T.; Liu, B.; Zhang, D.; Tang, Z. Adsorption Equilibrium Isotherms and Thermodynamic Analysis of CH4, CO2, CO, N2 and H2 on NaY Zeolite. Adsorption 2020, 26, 1101–1111. [Google Scholar] [CrossRef] [Scilit]
  17. Shabbani, H.J.K.; Othman, M.R.; Al- Janabi, S.K.; Barron, A.R.; Helwani, Z. H2 Purification Employing Pressure Swing Adsorption Process: Parametric and Bibliometric Review. Int. J. Hydrogen Energy 2024, 50, 674–699. [Google Scholar] [CrossRef] [Scilit]
  18. Wu, W.; Chen, S.; Niu, Z.; Zhang, D.; Tang, Z.; Li, W. A High-Productivity PSA Process Configuration for H2 Purification. Fuel 2024, 356, 129566. [Google Scholar] [CrossRef] [Scilit]
  19. Zhang, N.; Hu, S.; Xin, Q. Optimization of Pressure Swing Adsorption in a Three-Layered Bed for Hydrogen Purification Using Machine Learning Model. Sci. Rep. 2025, 15, 14193. [Google Scholar] [CrossRef] [Scilit] [PubMed]
  20. Chen, Y.; Ahn, H. Feasibility Study of Vacuum Pressure Swing Adsorption for CO2 Capture From an SMR Hydrogen Plant: Comparison Between Synthesis Gas Capture and Tail Gas Capture. Front. Chem. Eng. 2021, 3, 742963. [Google Scholar] [CrossRef] [Scilit]
  21. Ahn, S.; You, Y.-W.; Lee, D.-G.; Kim, K.-H.; Oh, M.; Lee, C.-H. Layered Two- and Four-Bed PSA Processes for H2 Recovery from Coal Gas. Chem. Eng. Sci. 2012, 68, 413–423. [Google Scholar] [CrossRef] [Scilit]
  22. Zhang, N.; Xiao, J.; Bénard, P.; Chahine, R. Single- and Double-Bed Pressure Swing Adsorption Processes for H2/CO Syngas Separation. Int. J. Hydrogen Energy 2019, 44, 26405–26418. [Google Scholar] [CrossRef] [Scilit]
  23. Chen, W.-H.; Chen, W.-H.; Chein, R.-Y.; Tuan Hoang, A.; Manatura, K.; Raza Naqvi, S. Optimization of Hydrogen Purification via Vacuum Pressure Swing Adsorption. Energy Convers. Manag. X 2023, 20, 100459. [Google Scholar] [CrossRef] [Scilit]
  24. Golmakani, A.; Khallaghi, N.; Amiri, A.; Manovic, V.; Nabavi, S.A. Techno-Economic Assessment of Pressure Swing Adsorption Tail Gas Decarbonisation for Blue Hydrogen Production. Gas Sci. Eng. 2025, 142, 205683. [Google Scholar] [CrossRef] [Scilit]
  25. Santos, M.S.; Grande, C.A.; Rodrigues, A.E. New Cycle Configuration to Enhance Performance of Kinetic PSA Processes. Chem. Eng. Sci. 2011, 66, 1590–1599. [Google Scholar] [CrossRef] [Scilit]
  26. Sun, K.; Yang, T.; Ma, S.; Ye, F.; Xiao, J. Hydrogen Purification Performance of Pressure Swing Adsorption Based on Cu-BTC/Zeolite 5A Layered Bed. J. Wuhan Univ. Technol.-Mat. Sci. Ed. 2022, 37, 815–822. [Google Scholar] [CrossRef] [Scilit]
  27. Park, Y.; Kang, J.-H.; Moon, D.-K.; Jo, Y.S.; Lee, C.-H. Parallel and Series Multi-Bed Pressure Swing Adsorption Processes for H2 Recovery from a Lean Hydrogen Mixture. Chem. Eng. J. 2021, 408, 127299. [Google Scholar] [CrossRef] [Scilit]
  28. Zhang, R.; Shen, Y.; Tang, Z.; Li, W.; Zhang, D. A Review of Numerical Research on the Pressure Swing Adsorption Process. Processes 2022, 10, 812. [Google Scholar] [CrossRef] [Scilit]
  29. Subraveti, S.G.; Pai, K.N.; Rajagopalan, A.K.; Wilkins, N.S.; Rajendran, A.; Jayaraman, A.; Alptekin, G. Cycle Design and Optimization of Pressure Swing Adsorption Cycles for Pre-Combustion CO2 Capture. Appl. Energy 2019, 254, 113624. [Google Scholar] [CrossRef] [Scilit]
  30. Yáñez, M.; Relvas, F.; Ortiz, A.; Gorri, D.; Mendes, A.; Ortiz, I. PSA Purification of Waste Hydrogen from Ammonia Plants to Fuel Cell Grade. Sep. Purif. Technol. 2020, 240, 116334. [Google Scholar] [CrossRef] [Scilit]
  31. Krótki, A.; Bigda, J.; Spietz, T.; Ignasiak, K.; Matusiak, P.; Kowol, D. Performance Evaluation of Pressure Swing Adsorption for Hydrogen Separation from Syngas and Water–Gas Shift Syngas. Energies 2025, 18, 1887. [Google Scholar] [CrossRef] [Scilit]
  32. Park, J.-H.; Kim, J.-N.; Cho, S.-H.; Kim, J.-D.; Yang, R.T. Adsorber Dynamics and Optimal Design of Layered Beds for Multicomponent Gas Adsorption. Chem. Eng. Sci. 1998, 53, 3951–3963. [Google Scholar] [CrossRef] [Scilit]
  33. Ahn, H.; Yang, J.; Lee, C.-H. Effects of Feed Composition of Coke Oven Gas on a Layered Bed H2 PSA Process. Adsorption 2001, 7, 339–356. [Google Scholar] [CrossRef] [Scilit]
  34. H2GEO—New Technology for Hydrogen and Geopolymer Composites Production. Available online: https://h2geo.komag.eu/ (accessed on 1 June 2026).
  35. Skarstrom, C.W. Method and Apparatus for Fractionating Gaseous Mixtures by Adsorption. U.S. Patent 2,944,627, 12 July 1960. [Google Scholar]
  36. Berlin, N.H. Method for Providing an Oxygen-Enriched Environment. U.S. Patent 3,280,536, 25 October 1966. [Google Scholar]
  37. Grande, C.A. Advances in Pressure Swing Adsorption for Gas Separation. Int. Sch. Res. Not. 2012, 2012, 982934. [Google Scholar] [CrossRef] [Scilit]
  38. Simo, M.; Rosinski, A.C.; Belanger, P.W.; Baksh, S. Hydrogen PSA Process Product Purity Control Method and Controller. Adsorption 2014, 20, 471–476. [Google Scholar] [CrossRef] [Scilit]
  39. Yang, T.; Yang, Z.; Li, C.; Tong, L.; Chen, B.; Li, X.; Yuan, Y.; Yuan, C.; Xiao, J. Hydrogen Purification Performance of Pressure Swing Adsorption in Coal-Derived Activated Carbon/Zeolite 13X Layered Bed. Appl. Sci. 2025, 15, 5505. [Google Scholar] [CrossRef] [Scilit]
  40. Yang, J.; Lee, C.H.; Chang, J.W. Separation of Hydrogen Mixtures by a Two-Bed Pressure Swing Adsorption Process Using Zeolite 5A. Ind. Eng. Chem. Res. 1997, 36, 2789–2798. [Google Scholar] [CrossRef] [Scilit]
  41. Ward, A.; Pini, R. Design and Performance Evaluation of Multisorbent Vacuum-Swing Adsorption Processes for Postcombustion Carbon Capture. Ind. Eng. Chem. Res. 2024, 63, 13787–13800. [Google Scholar] [CrossRef] [Scilit]
  42. Park, J.; Kang, R.H.; Lee, J.W. Efficient Pressure Swing Adsorption for Improving H2 Recovery in Precombustion CO2 Capture. Korean J. Chem. Eng. 2017, 34, 1763–1773. [Google Scholar] [CrossRef] [Scilit]
  43. Sircar, S. Separation of Multicomponent Gas Mixtures. U.S. Patent 4,171,206, 16 October 1979. [Google Scholar]
Figure 1. PSA laboratory setup view at work, ITPE, Zabrze, Poland.
Energies 19 02753 g001
Figure 2. Simplified flowchart of PSA laboratory setup. Adapted from the authors’ previous work [31].
Energies 19 02753 g002
Figure 3. Two-column adsorption PSA cycle sequence by Berlin. Adapted from [31].
Energies 19 02753 g003
Figure 4. Cycle sequence of an eight-step four-column PSA proposed by Linde Gas. The subfigures labels indicate the next step in the cycle sequence. Adapted from [31].
Energies 19 02753 g004
Figure 5. Breakthrough curves for syngas mixtures in a fixed-bed adsorber packed with AC:zeolite ratio of (A) 1:1 and (B) 1.6:1.
Energies 19 02753 g005
Figure 6. Breakthrough curves for WGS syngas mixtures in a fixed-bed adsorber packed with AC: Zeolite ratio of (A) 1:1 and (B) 1.6:1.
Energies 19 02753 g006
Figure 7. The effect of adsorption time on H2 purity for the PSA Berlin-type cycle. Data points correspond to the test runs and adsorption times listed in Table 9.
Energies 19 02753 g007
Figure 8. The effect of adsorption time on H2 purity for the PSA Linde-type cycle. Data points correspond to the test runs and adsorption times listed in Table 10.
Energies 19 02753 g008
Figure 9. The effect of hydrogen recovery on hydrogen purity for the PSA Berlin-type cycle. Data points correspond to the operating points listed in Table 9.
Energies 19 02753 g009
Figure 10. The effect of hydrogen recovery on hydrogen purity for the PSA Linde-type cycle. Data points correspond to the operating points listed in Table 10.
Energies 19 02753 g010
Table 1. The PSA laboratory setup key unit parameters.
ParameterValueUnit
Feed gas capacity5–20NL/min
Number of PSA columns4pieces
PSA pressureup to 15bar
PSA adsorbers diameter50mm
PSA column height1.0m
Inlet gas buffer tank volume27.2L
High (HI) pressure gas buffer tank volume4.8L
Low (LO) pressure gas buffer tank volume7.2L
Number of gas mass flowmeters4pieces
Table 2. Average feed-gas compositions used in PSA tests.
GasH2 [vol.%]CO [vol.%]CO2 [vol.%]CH4 [vol.%]N2 [vol.%]
Syngas26.3116.8045.256.605.04
WGS Syngas34.304.2051.105.904.50
Table 3. The breakthrough and PSA gas adsorption operating parameters used in this study.
ParameterValueUnitNotes
Adsorption temperatureambientTypically 20–25 °C.
Adsorption pressure (Pads)8.0–9.0barTarget high pressure level.
Desorption/regeneration pressure (Pdes)1.2–1.4barTarget low pressure level (blowdown phase).
Purge-to-feed ratio (P/F)0.1Upper recommended range for balancing H2 purity and recovery.
Bed configurationSorbotech GE603 activated carbon + zeolite 5A (layered bed)AC at the column bottom and zeolite 5A at the top; dry feed gases.
AC:zeolite ratio (by bed length)1:1, 1.6:1Baseline; 1.6:1 as alternative in screening.
Table 4. Adsorption breakthrough test matrix. Data obtained within the H2GEO project [34].
Gas CompositionAC: Zeolite Ratio
Syngas 1:11.6:1
WGS syngas 1:11.6:1
Table 5. Cycle sequence of a six-step two-column PSA proposed by Berlin [31]. Arrows indicate co-current (↑) and counter-current (↓) flow directions; equalization is denoted by two-way arrows (↓↑/↑↓).
Step123456
Column 1Blowdown ↓Blowdown ↓
Purging ↓
Pressure equalization ↓↑Compression
(Pressurization) ↑
Adsorption ↑Pressure equalization ↑↓
Column 2Compression
(Pressurization) ↑
Adsorption ↑Pressure equalization ↓↑Blowdown ↓Blowdown ↓
Purging ↓
Pressure equalization ↑↓
Table 6. Cycle sequence of an eight-step four-column PSA proposed by Linde Gas [31]. Arrows indicate co-current (↑) and counter-current (↓) flow directions; equalization is denoted by two-way arrows (↓↑/↑↓).
Step12345678
Column 1Adsorption ↑Pressure equalization 2 ↑Provide purge ↑Blowdown ↓Purge ↓Pressure equalization 1 ↓Compression with the product ↑
Column 2Pressure equalization 1 ↓Compression with the product ↑Adsorption ↑Pressure equalization 2 ↑Provide purge ↑Blowdown ↓Purge ↓
Column 3Blowdown ↓Purge ↓Pressure equalization 1 ↓Compression with the product ↑Adsorption ↑Pressure equalization 2 ↑Provide purge ↑
Column 4Pressure equalization 2 ↑Provide purge ↑Blowdown ↓Purge ↓Pressure equalization 1 ↓Compression with the product ↑Adsorption ↑
Direction of gas flow between columns
Flow4 → 24 → 31 → 31 → 42 → 42 → 13 → 13 → 1
Table 7. Maximum absolute errors of key measured and calculated PSA process parameters.
ParameterUnitMax. ErrorSource/Method
H2 gas concentrationvol.%0.1Online gas analyzer/measurement threshold
CO gas concentrationvol.%0.1Online gas analyzer/measurement threshold
CO2 gas concentrationvol.%0.1Online gas analyzer/measurement threshold
CH4 gas concentrationvol.%0.1Online gas analyzer/measurement threshold
N2 gas concentrationvol.%0.4Calculated by difference from H2, CO, CO2, and CH4
Feed gas flow rateNL/min1%Mass flow controller specification
Product/tail-gas flow rateNL/min1%Mass flow meter specification
Adsorption/desorption pressurebar0.1Pressure sensor/SCADA stability
Temperature°C1.0K-type thermocouple/SCADA stability
H2 purityvol.%0.1Direct H2 analyzer reading
H2 recoverypercentage points1.5Calculated from Equation (2)
H2 losspercentage points1.5Calculated as 100%−H2 recovery
Safety margin to CO breakthroughpercentage points1.0Calculated from Equation (4)
Table 8. Experimental breakthrough data. Data obtained within the H2GEO project [34].
Component/Feed GasSyngas
AC:Zeolite 1:1
Syngas
AC:Zeolite 1.6:1
WGS Syngas
AC:Zeolite 1:1
WGS Syngas AC:Zeolite 1.6:1Comment
Time, s
H2121151103129weakly adsorbed; appears first
CO205256195244first measured impurity breakthrough; limits H2 purity
CH4322402322402later impurity breakthrough
CO2545681402716strongly adsorbed; last to appear
N2----not directly measured; no experimental breakthrough time assigned
Table 9. PSA Berlin-type cycle sequence selected results.
Feed GasAC:Zeolite RatioTest RunAdsorption Time, sSafety Margin to CO Breakthrough, %Cycle Time, sAverage Product Composition, vol. % H2 Recovery, %
H2COCH4CO2
Syngas1:1BS113534.124092.02.050.650.5571
BS212041.522597.21.100.350.3565
BS3806118599.00.200.100.1040
BCS412053.122598.20.650.20.2067
1.6:1BCS513547.324098.10.750.250.2572
BCS68068.818598.50.150.080.0747
WGS syngas1:1BWS711043.621593.30.300.200.8572
BWS86069.216599.40.050.050.445
1.6:1BWS96075.416599.50.030.030.3049
BWCS1012548.823099.00.180.120.4579
BWCS1110059.020599.00.100.080.7069
Bold values indicate the best balanced operating points within each feed/cycle group, selected as the highest H2 recovery while maintaining H2 purity at or above 99.0 vol.%. Test-run labels identify the cycle, feed, and bed configuration: B = Berlin-type cycle; L = Linde-type cycle; S = syngas; W = WGS syngas; C = increased AC:zeolite ratio of 1.6:1. All experiments were conducted at a purge-to-feed ratio of approximately 0.1.
Table 10. PSA Linde-type cycle sequence selected results.
Feed GasAC:Zeolite RatioTest RunAdsorption Time, sSafety Margin to CO Breakthrough, %Cycle Time, sAverage Product Composition, vol. %H2 Recovery, %
H2COCH4CO2
Syngas1:1LS118012.230594.01.450.350.3583
LS215026.827598.20.550.160.1875
LS310051.122599.40.080.040.0550
LCS419025.831598.20.650.180.1884
1.6:1LCS516037.528598.80.280.100.1278
LCS610060.922599.50.050.030.458
WGS syngas1:1LWS717012.829594.00.450.150.7086
LWS810048.722599.30.050.040.1869
1.6:1LWS99063.121599.70.020.020.0555
LWCS1014042.626599.50.040.030.1084
LWCS1119022.131599.20.100.050.2086
Bold values indicate the best balanced operating points within each feed/cycle group, selected as the highest H2 recovery while maintaining H2 purity at or above 99.0 vol.%. Test-run labels are explained in the note below Table 9. All experiments were conducted at a purge-to-feed ratio of approximately 0.1.
Table 11. PSA Berlin-type cycle sequence initial step times proposed for start-up and optimization under the designed pressure swing. Direction arrows indicate the direction of gas flow relative to the gas feed. Data obtained within the H2GEO project [34].
Step no.StepDirectionTime, s (Initial)Notes/Control Targets
1Blowdown↓ (counter-current)15Depressurize to Pdes = 1.2 bar.
2 = 6Pressure equalization ↓↑8–12Between high and low beds; target intermediate Peq. This step is the same as step 6, which involves a direction change.
3Compression
(Pressurization)
15–25To Pads using product and/or feed.
4Adsorption ↑ (co-current)80–135 (syngas);
60–125 (WGS syngas)
Stop before CO/N2 breakthrough; optimize vs. purity/recovery.
5Purging↓ (counter-current)45–60Use H2 product; P/F ≈ 0.05–0.15; optimize vs. purity/recovery.
6 = 2Pressure equalization ↑↓8–12Gas transfer to next bed before full pressurization. This step is the same as step 2, which involves a direction change.
Table 12. PSA Linde-type cycle sequence initial step times proposed for start-up and optimization under the designed pressure swing. Direction arrows indicate the direction of gas flow relative to the gas feed. Data obtained within the H2GEO project [34].
Step
no.
StepDirectionTime, s (Initial)Notes/Control Targets
1Adsorption (product)100–190 (syngas); 90–190 (WGS)High-pressure H2 product; stop before impurity breakthrough
2Pressure equalization 28–12Co-current depressurizing equalization to intermediate pressure
3Provide purge10–20Withdraw H2-rich gas to purge another bed
4Blowdown15Depressurize to Pdes = 1.2 bar
5Purge45–60Counter-current purge with H2 product; set by P/F
6Pressure equalization 1 8–12Counter-current pressurizing equalization
7Product pressurization10–20Raise pressure using H2 product
8Compression with the product5–15Bring bed to Pads before AD starts
Table 13. PSA off-gas (tail gas) composition ranges.
ComponentSyngas Off-Gas
(Derived from Syngas)
WGS Syngas Off-Gas
(Derived from Shifted Syngas)
CO2 (Carbon Dioxide)50–58% vol.60–72% vol.
CO (Carbon Monoxide)18–22% vol.4–6% vol.
H2 (Hydrogen)8–18% vol.9–23% vol.
CH4 (Methane)8–9% vol.8–10% vol.
N2 (Nitrogen)6–7% vol.6–8% vol.
Disclaimer/Publisher’s Note: The statements, opinions and data contained in all publications are solely those of the individual author(s) and contributor(s) and not of MDPI and/or the editor(s). MDPI and/or the editor(s) disclaim responsibility for any injury to people or property resulting from any ideas, methods, instructions or products referred to in the content.