Article

Precise Definition and Quantitative Assessment of Ineffective Boreholes in Coalbed Methane Drainage


1
School of Energy Science and Engineering, Henan Polytechnic University, Jiaozuo 454003, China
2
Collaborative Innovation Center of Coalbed Methane and Shale Gas for Central Plains Economic Region, Jiaozuo 454003, China
3
Science and Technology R&D Platform of Emergency Management Ministry for Deep Well Ground Control and Gas Extraction Technology, Jiaozuo 454003, China
4
College of Safety Science and Engineering, Henan Polytechnic University, Jiaozuo 454003, China
5
Collaborative Innovation Center of Coal Work Safety and Clean High Efficiency Utilization, Jiaozuo 454003, China
6
Shaanxi Water Development Group Co., Ltd., Xi’an 710018, China
*
Author to whom correspondence should be addressed.
Energies 2026, 19(11), 2681; https://doi.org/10.3390/en19112681
Submission received: 8 April 2026 / Revised: 22 May 2026 / Accepted: 25 May 2026 / Published: 2 June 2026
(This article belongs to the Special Issue Subsurface Energy and Environmental Protection—2nd Edition)

Abstract

The efficiency of gas extraction in coalbed methane extraction is governed by coal seam permeability and borehole structural integrity. Over prolonged extraction, some boreholes become ineffective owing to degraded performance, necessitating precise identification criteria. In this study, a mathematical model for cumulative gas production under borehole failure was developed based on a gas flow decay function. Numerical analysis and data visualization were conducted via MATLAB, with mean values for collapsed/blocked boreholes adopted to eliminate the interference of unstable intervals. The analysis produced an equation that correlates the critical borehole flow rate with the time of loss of stability, providing a quantitative criterion for identifying ineffective boreholes in coal mining operations.

1. Introduction

Efficient coalbed methane (CBM) extraction serves as a core technology for coal mine hazard mitigation and clean energy exploitation. In challenging geological conditions (high-gas, soft, composite, and outburst-prone seams), extraction efficiency depends not only on coal permeability but also on borehole quality and longevity, which are severely compromised by instability events such as collapse, blockage, and blowout. Although extensive studies have investigated borehole formation quality and instability mechanisms [1,2,3,4,5,6], recent progress has been achieved: Xiao et al. developed a quantitative model for borehole collapse [7] and Liu et al. analyzed failure mechanisms in soft coal seams [8]. Despite advances in drilling technologies [9,10,11,12], a systematic definition of ineffective boreholes remains absent in CBM engineering practice. This limitation is significant because boreholes failing before the pre-drainage period results in ineffective extraction and failure to meet drainage standards. Thus, precise definition and quantitative assessment of ineffective boreholes remain an urgent research need.

2. Theory and Formula

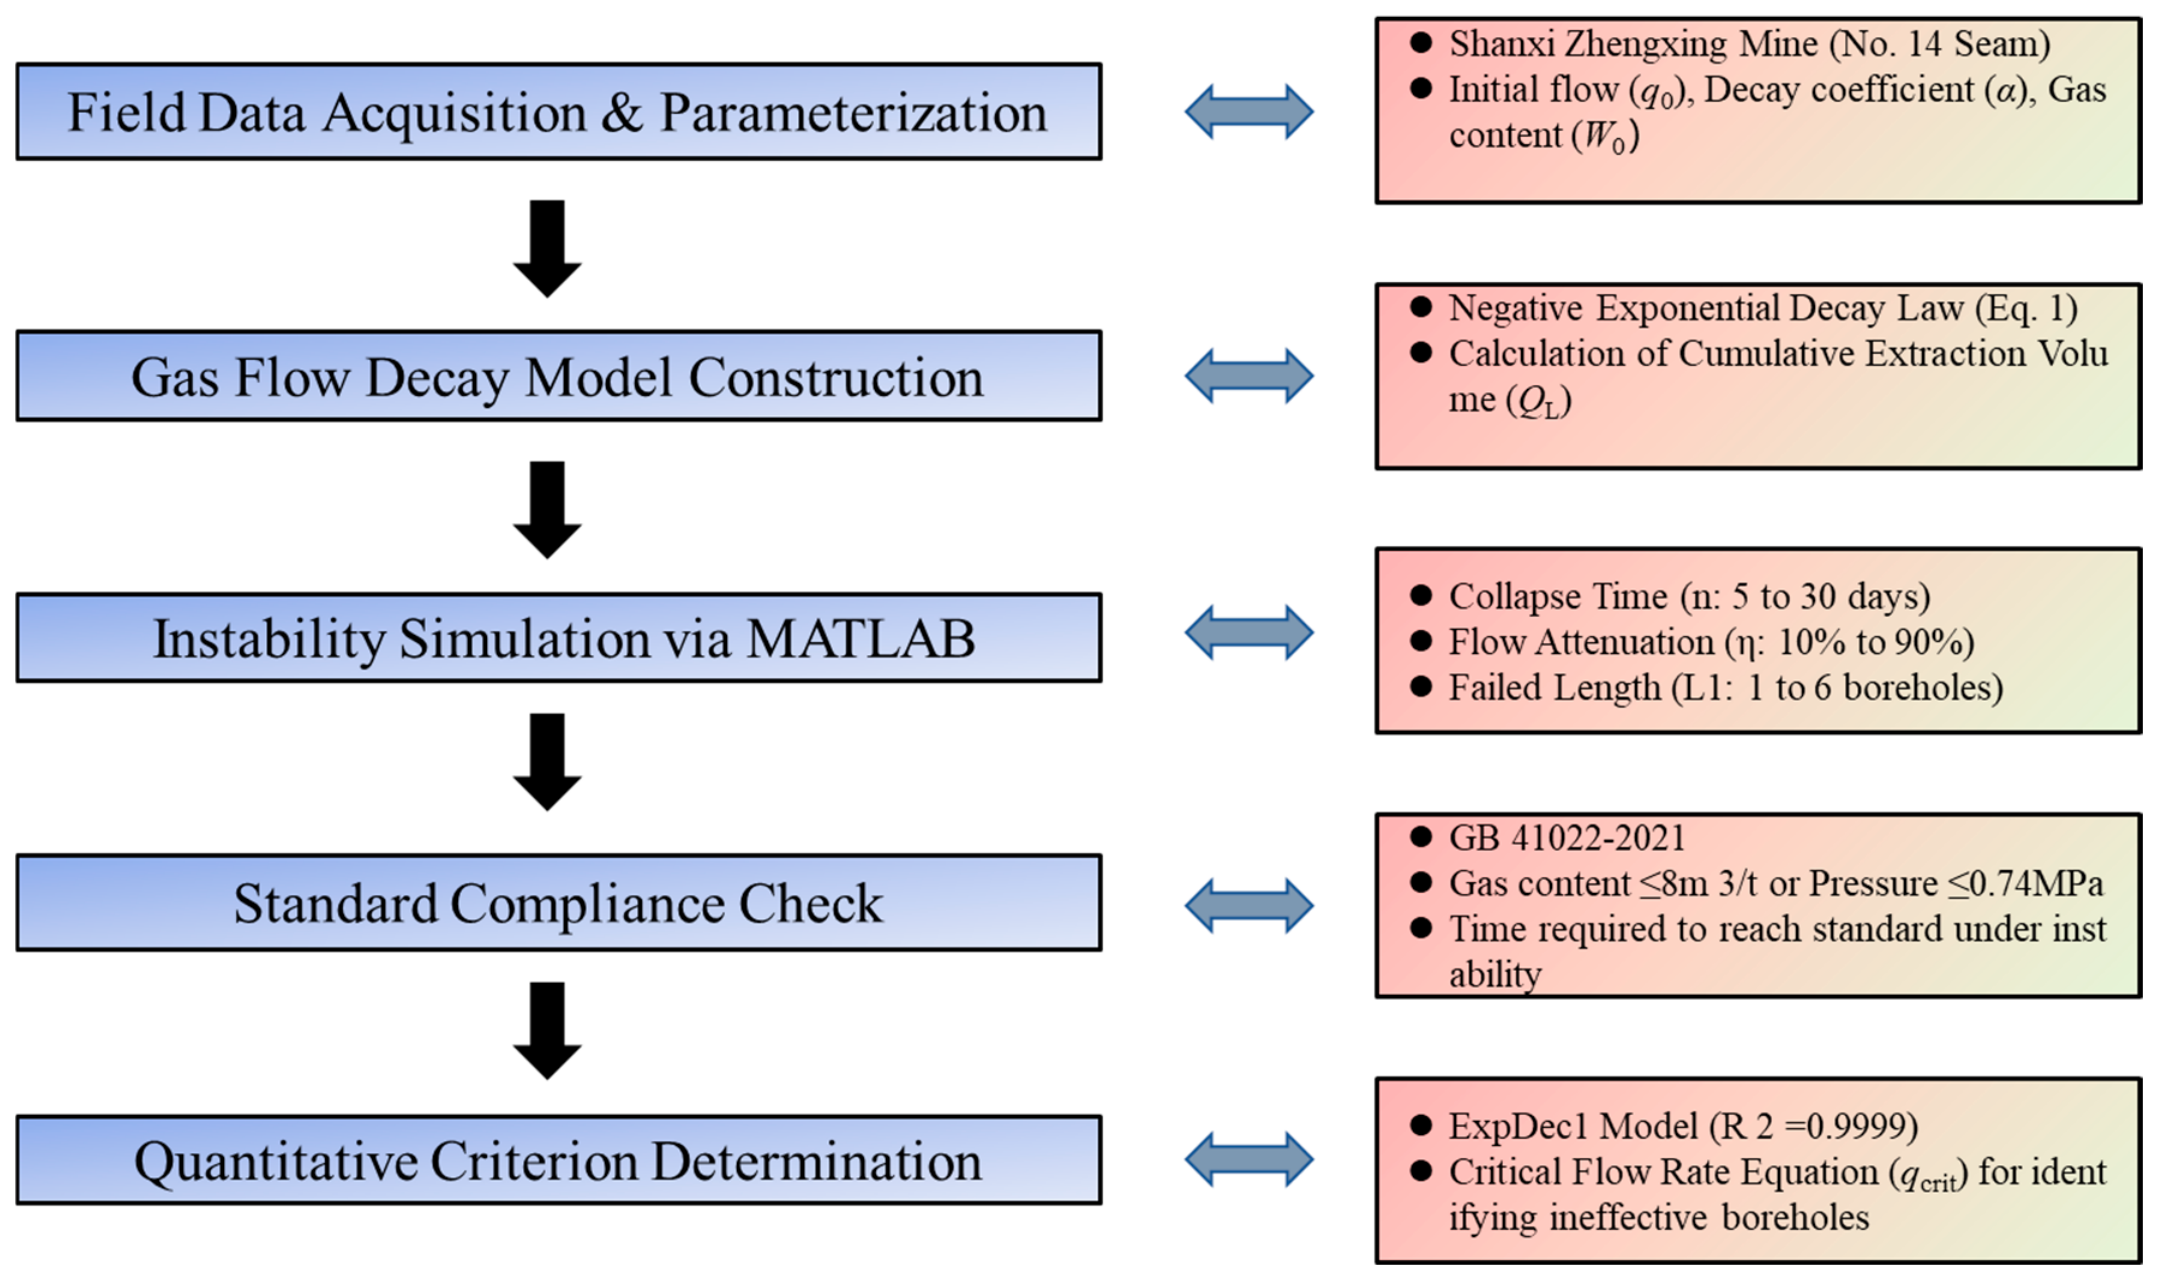
The overall research flowchart and technical framework are shown in Figure 1.
Field observations and prior studies [13] confirm that borehole gas flow follows a negative exponential decay law under undisturbed mining conditions. This relationship can be expressed as
q t = q 0 exp α t
qt is the gas flow rate per 100 m of borehole after t days of extraction (m3/(hm·min) hm = hectometer (100 m), unit means cubic meters per 100 m of borehole per minute), q0 is the initial gas flow rate at the time of borehole completion (m3/(hm·min)), t is the time elapsed since extraction began (days), and α is the decay coefficient (d−1). The negative exponential decay model was selected based on historical field data from the Shanxi Zhengxing Mine, which indicates that gas flow in stable boreholes follows this pattern in the absence of mining disturbances [14].
By integrating the time that the gas in the borehole experiences, as described in Equation (1), we can calculate the cumulative gas extraction volume Q1 for a 100 m borehole over this time period:
Q 1 = 0 t 1440 q 0 exp ( α t ) d t
The total gas extraction volume QL over time t can be expressed as a function of the total borehole length (in meters), which is determined by the number of boreholes and their average length.
Q L = Q 1 L 100 = 14.4 L 0 t q 0 exp ( α t ) dt = 14.4 L q 0 1 exp ( α t ) α
If, after n days, a subset of boreholes becomes collapsed or blocked, sustaining a reduced flow intensity of η times the normal level while the decay coefficient remains unchanged, the total gas extraction volume QL1 over time t can be expressed as
Q L 1 = 14.4 L q 0 1 exp ( α n ) α + 14.4 L 2 q 2 1 exp ( α ( t n ) ) α + 14.4 L 1 q 1 1 exp ( α ( t n ) α
L1: Total length of failed boreholes (m). L2: Length of boreholes remaining in normal condition, with L2 = LL1 (m). q1: Gas flow rate per hundred meters at the time of instability on day n, given by q1 = ηq0exp(−αn) (m3/(hm·min)). q2: The normal gas flow rate in the borehole in the absence of instability such as collapse or blockage. η: The flow retention coefficient following borehole collapse or blockage, with a range of 0 to 100, reflecting the extent of flow decline caused by instability. Field evidence confirms that instability only reduces flow magnitude, not decay behavior; thus, α remains unchanged [15].

3. Experimental Setup

Field tests were conducted at Zhengxing High-Gas Coal Mine, Shanxi Province. The No. 14 coal seam is characterized by a thickness of 1.07 m and a permeability coefficient of 0.05 m2/(MPa2⋅d) (representing low permeability conditions), presenting significant challenges for stable gas extraction. Face drainage efficiency is the core indicator for evaluating pre-drainage performance. Per GB 41022-2021 [16], drainage compliance requires seam gas content ≤ 8 m3/t or gas pressure ≤ 0.74 MPa. Working face gas emission mainly comes from adjacent seams and the surrounding rock. Thus, the required drainage rate must satisfy Table 1. The desorbable gas within 20 m ahead of the face must also meet the criteria in Table 2. The ultimate goal is to ensure that the gas extraction at the working face complies with the overall standard, which is determined through a comprehensive evaluation of both the emission sources and the required extraction indicators.
Analysis of Equation (4) for the total gas extraction volume QL1 after borehole collapse identifies three key variables that directly affect the outcome, assuming a constant decay coefficient α and a known initial flow rate q0: the collapse time n (days), the post-collapse flow rate q1 (m3/(hm·min)), and the length of the failed borehole section L1 (m). By systematically varying these factors—the collapse time, the degree of flow attenuation, and the length of the collapsed section—and comparing the resulting QL1 with the compliance threshold, we can determine the required pre-drainage period following a collapse and quantify the relationship between impaired and normal gas extraction volumes.

4. Result Discussions

Zhengxing Mine covers an area of 10.4804 km2, with mining elevations from +599.99 m to +1359.99 m. The mining field spans 2.2–4.2 km in the north–south direction and 1.6–4.2 km in the east–west direction. The main mineable seams are No. 14 and No. 15, with relatively stable geological conditions. This study selects a working face in the No. 14 seam, which is stable and structurally simple. It is classified as a stable, mineable thin coal seam within the field. The model was solved using MATLAB R2022b software. Input parameters included the initial gas flow rate in the borehole q0 (measured value, range 0.5–2.5 m3/(hm·min)), the gas flow decay coefficient α (fitted value, 0.02–0.05 d−1), and extraction duration t (measured value, 5–30 d). The simulation was configured for single-hole extraction conditions, with boundary conditions based on actual geological parameters from the Zhenxing Mine site; the calibration process involved comparing the model-calculated flow rate with the measured flow rate, and adjusting the value of α to keep the relative error within 5%. The parameters necessary for calculation are provided in Table 3.
The original gas reserves of the coal seam are calculated as W0 = abhγ (m3), and the pre-drainage volume is given by W1 = η0·W0 (m3). Based on the calculation, W0 = 3,213,516.8 m3 and W1 = 1,285,406.72 m3. Under normal conditions, compliance time is 36 days. To analyze the relationships among instability time, flow attenuation, and failed length, the following scenarios are considered:
  • Time of Instability (n): Six values were considered, 5, 10, 15, 20, 25, and 30 days.
  • Post-Instability Flow Attenuation (η): Nine levels were assessed, ranging from 90% to 10% of the original flow rate.
  • Length of Unstable Segments (L1): Boreholes were grouped into sets of seven. Scenarios where 1 to 6 boreholes per group collapsed were simulated to determine L1.
The resulting gas flow rates after instability, corresponding to the attenuation levels from 90% to 10%, are summarized in Table 4.
Failed lengths for 1–6 collapsed boreholes are 6545–39,270 m.
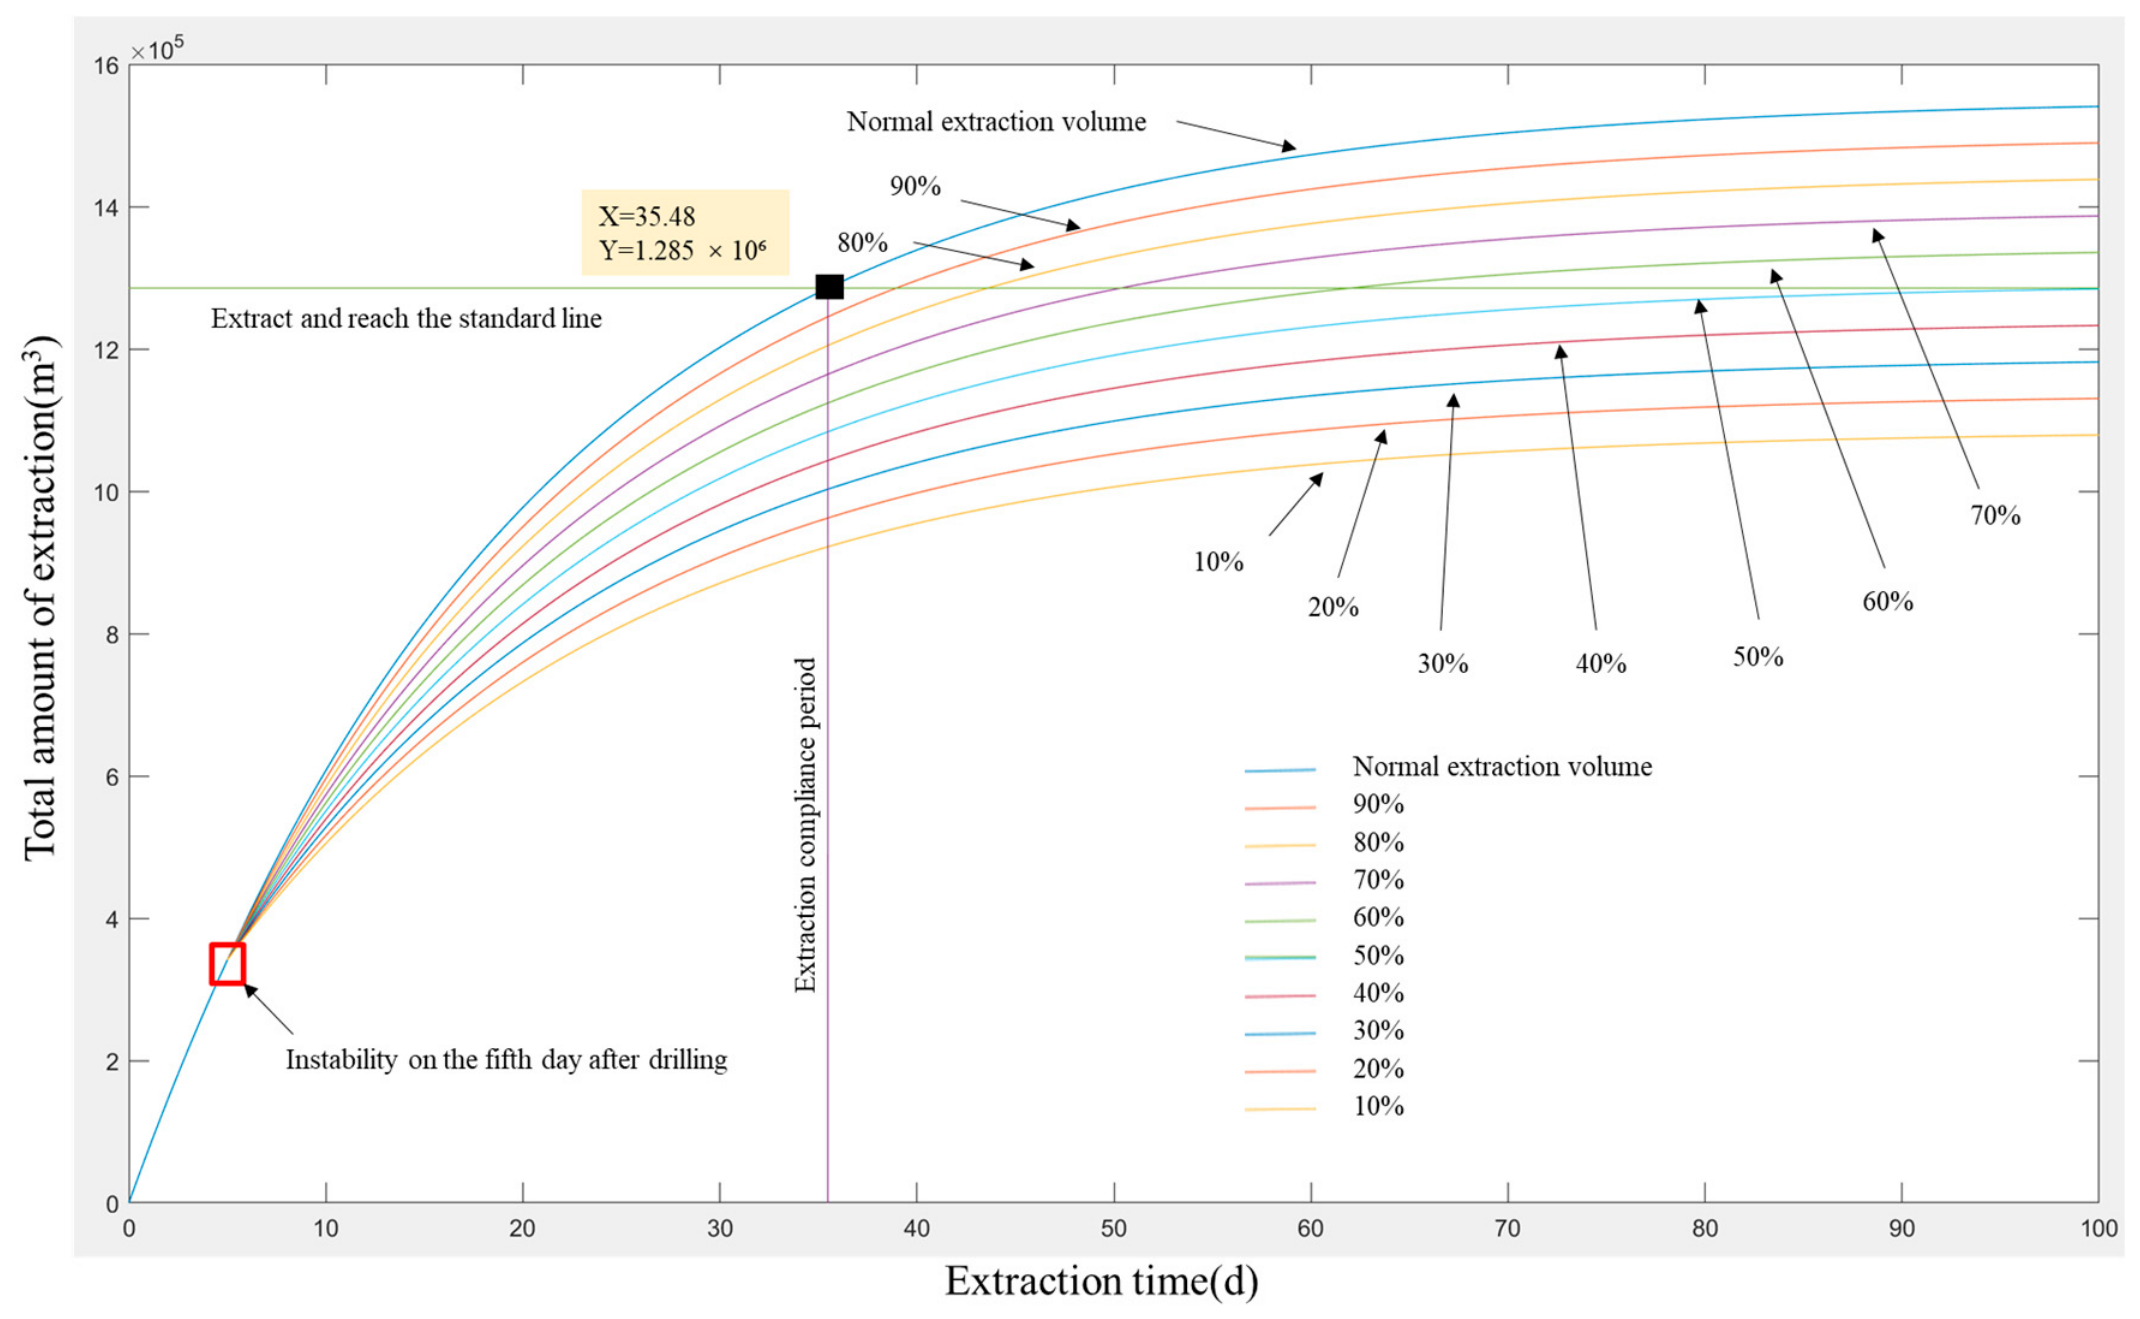
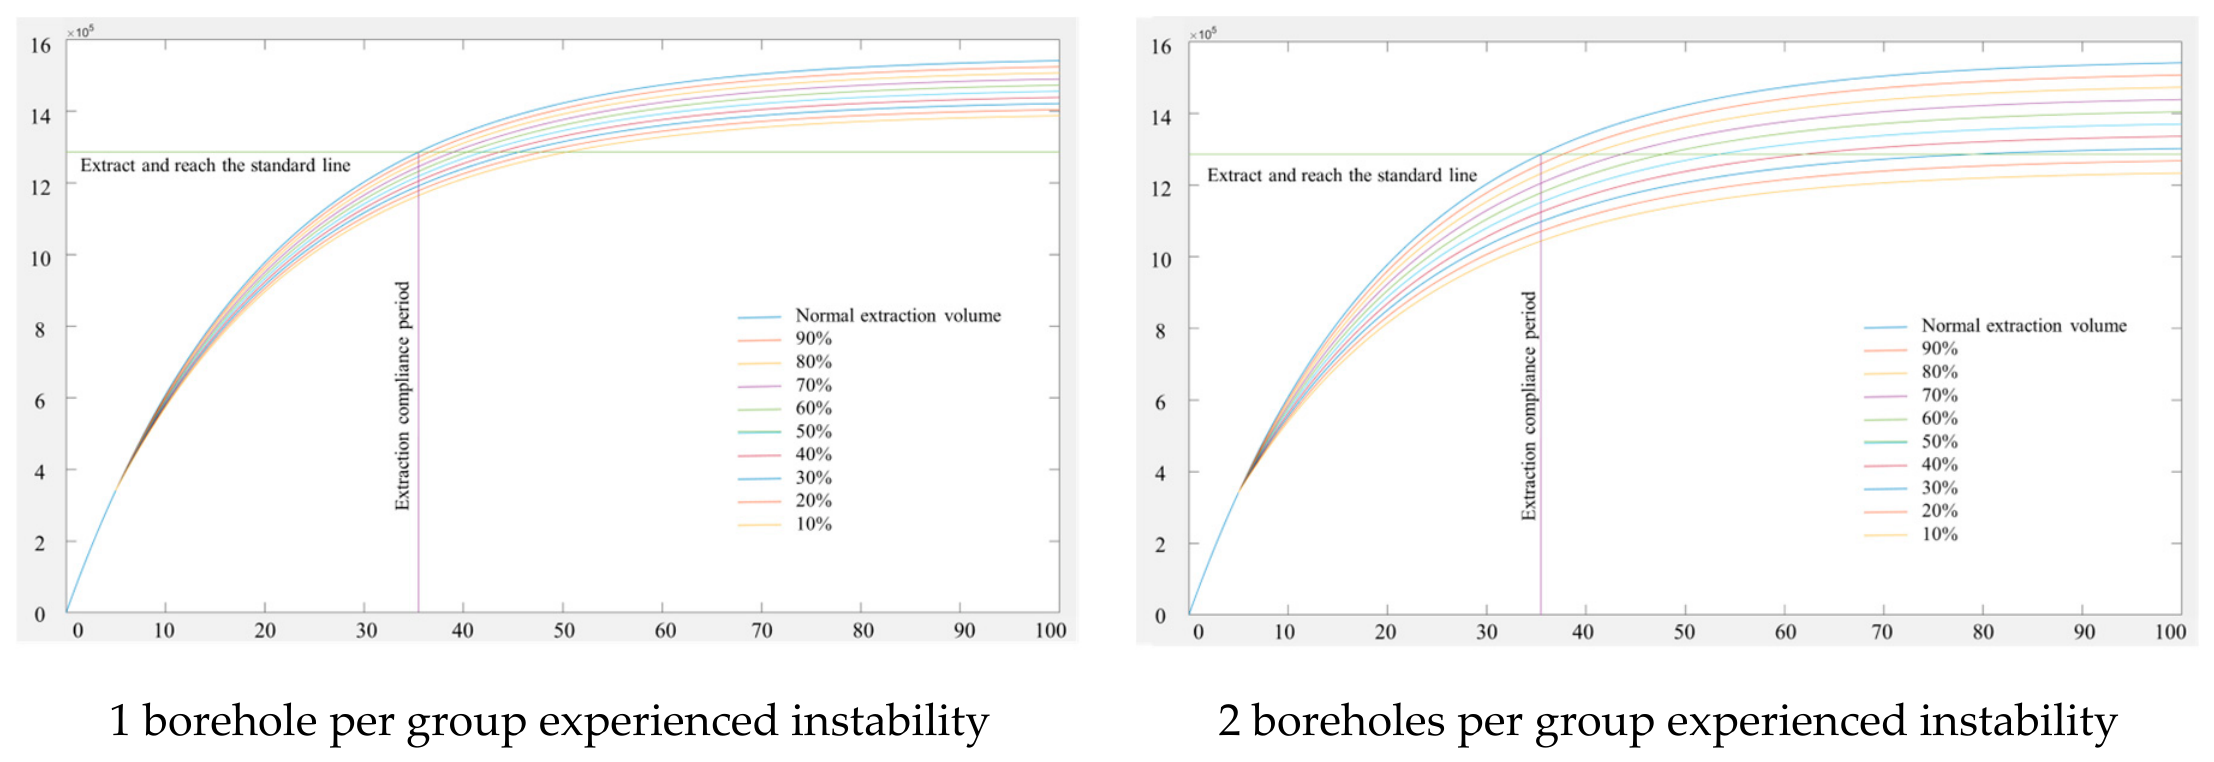
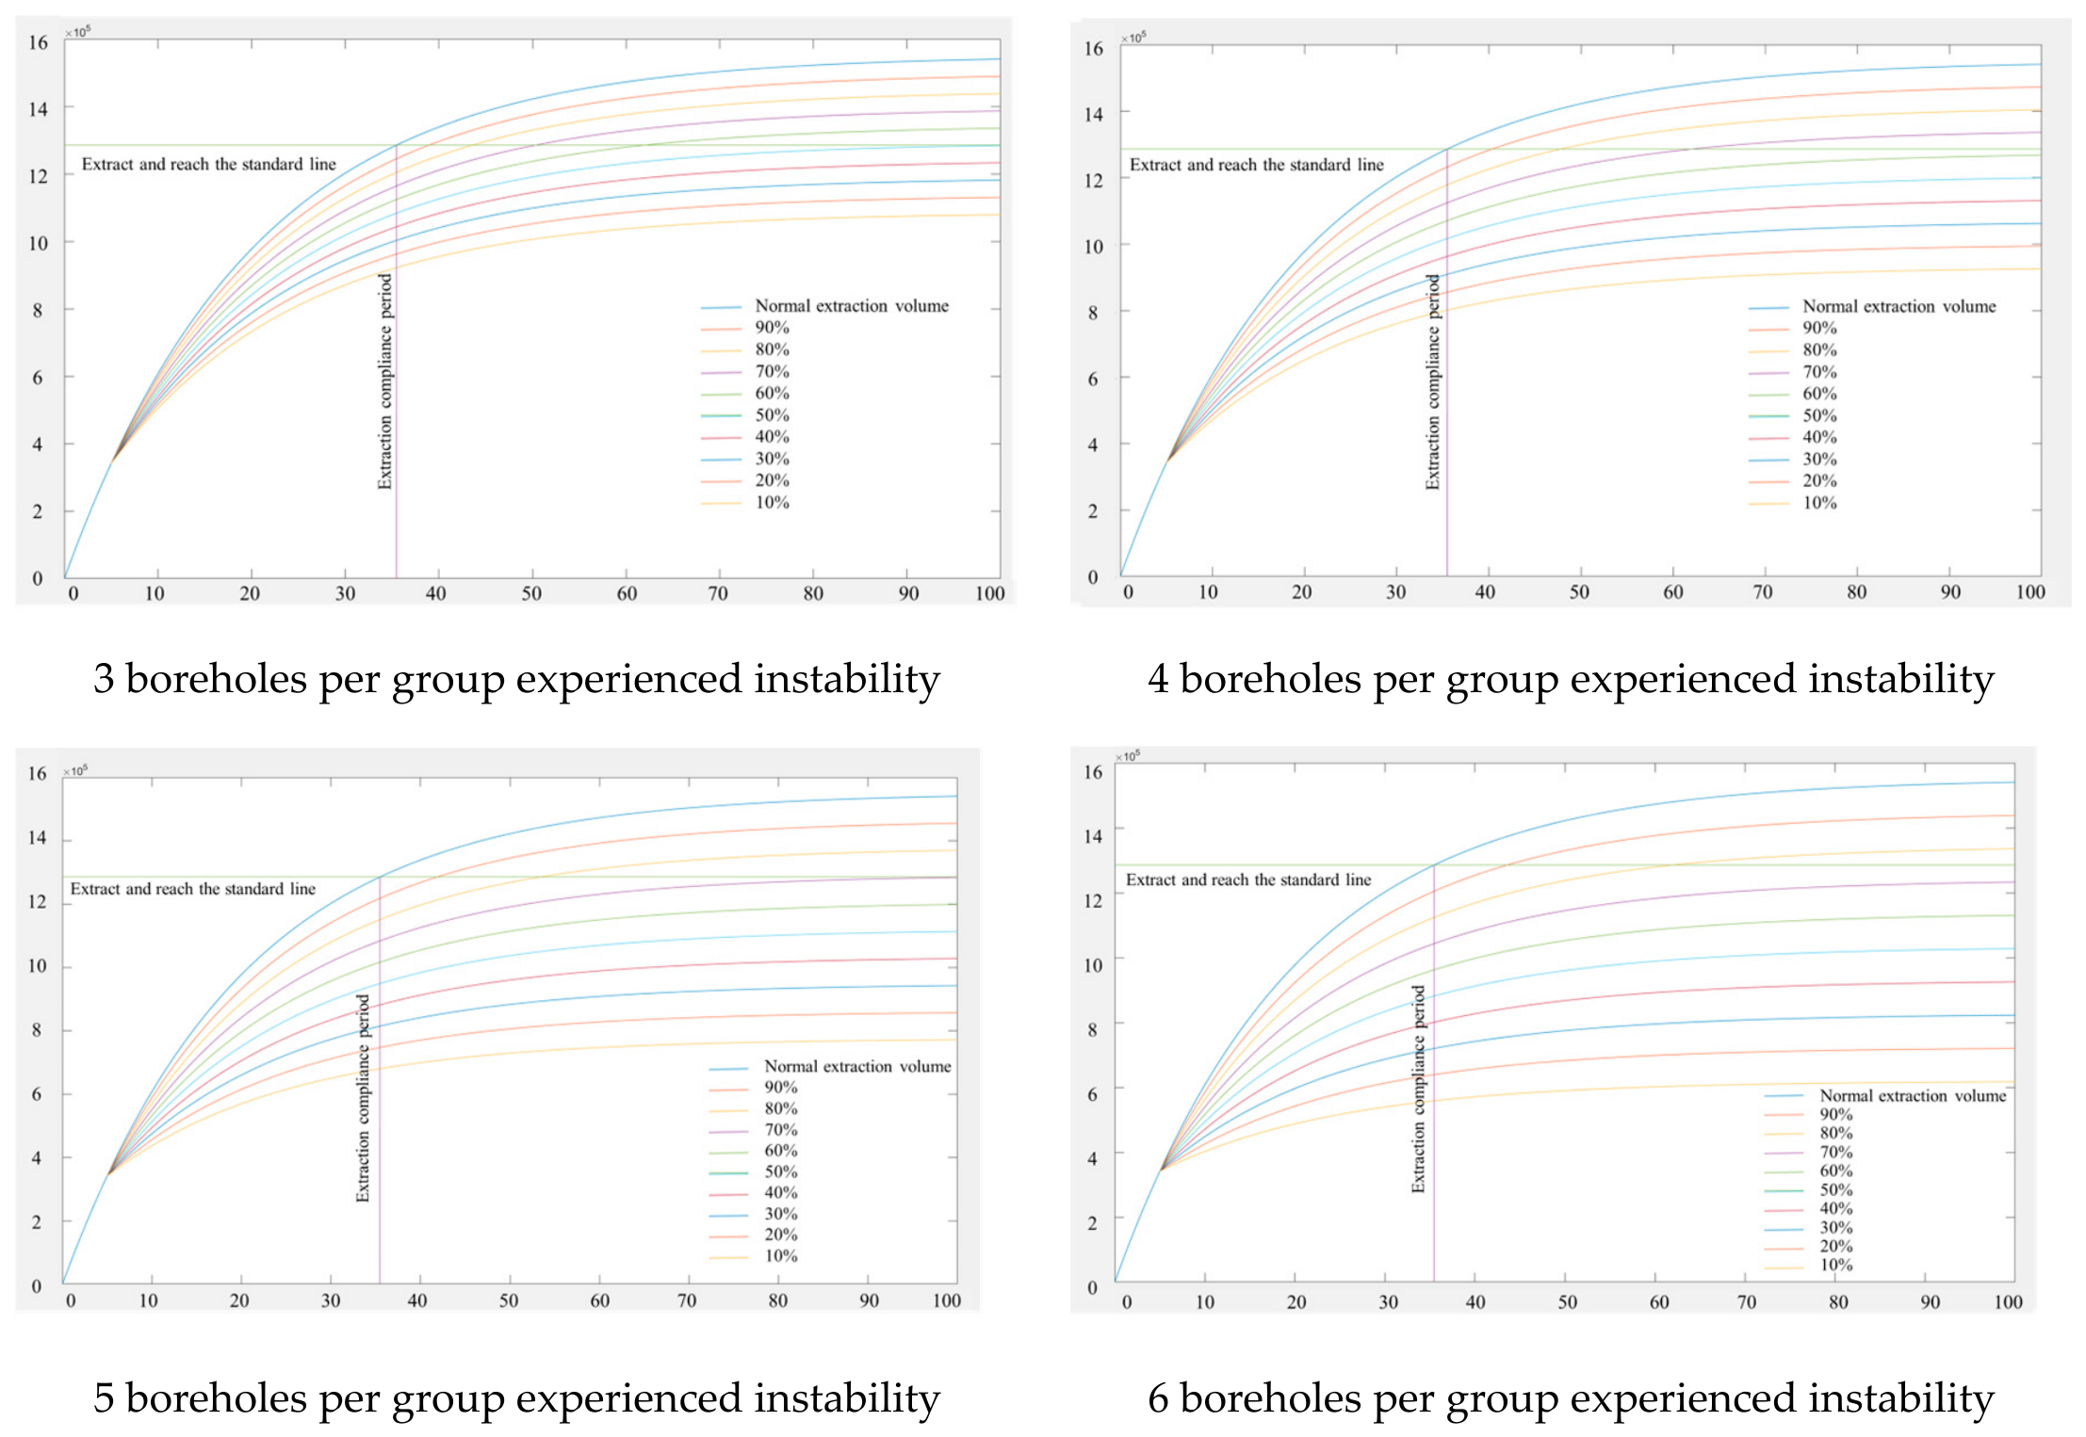
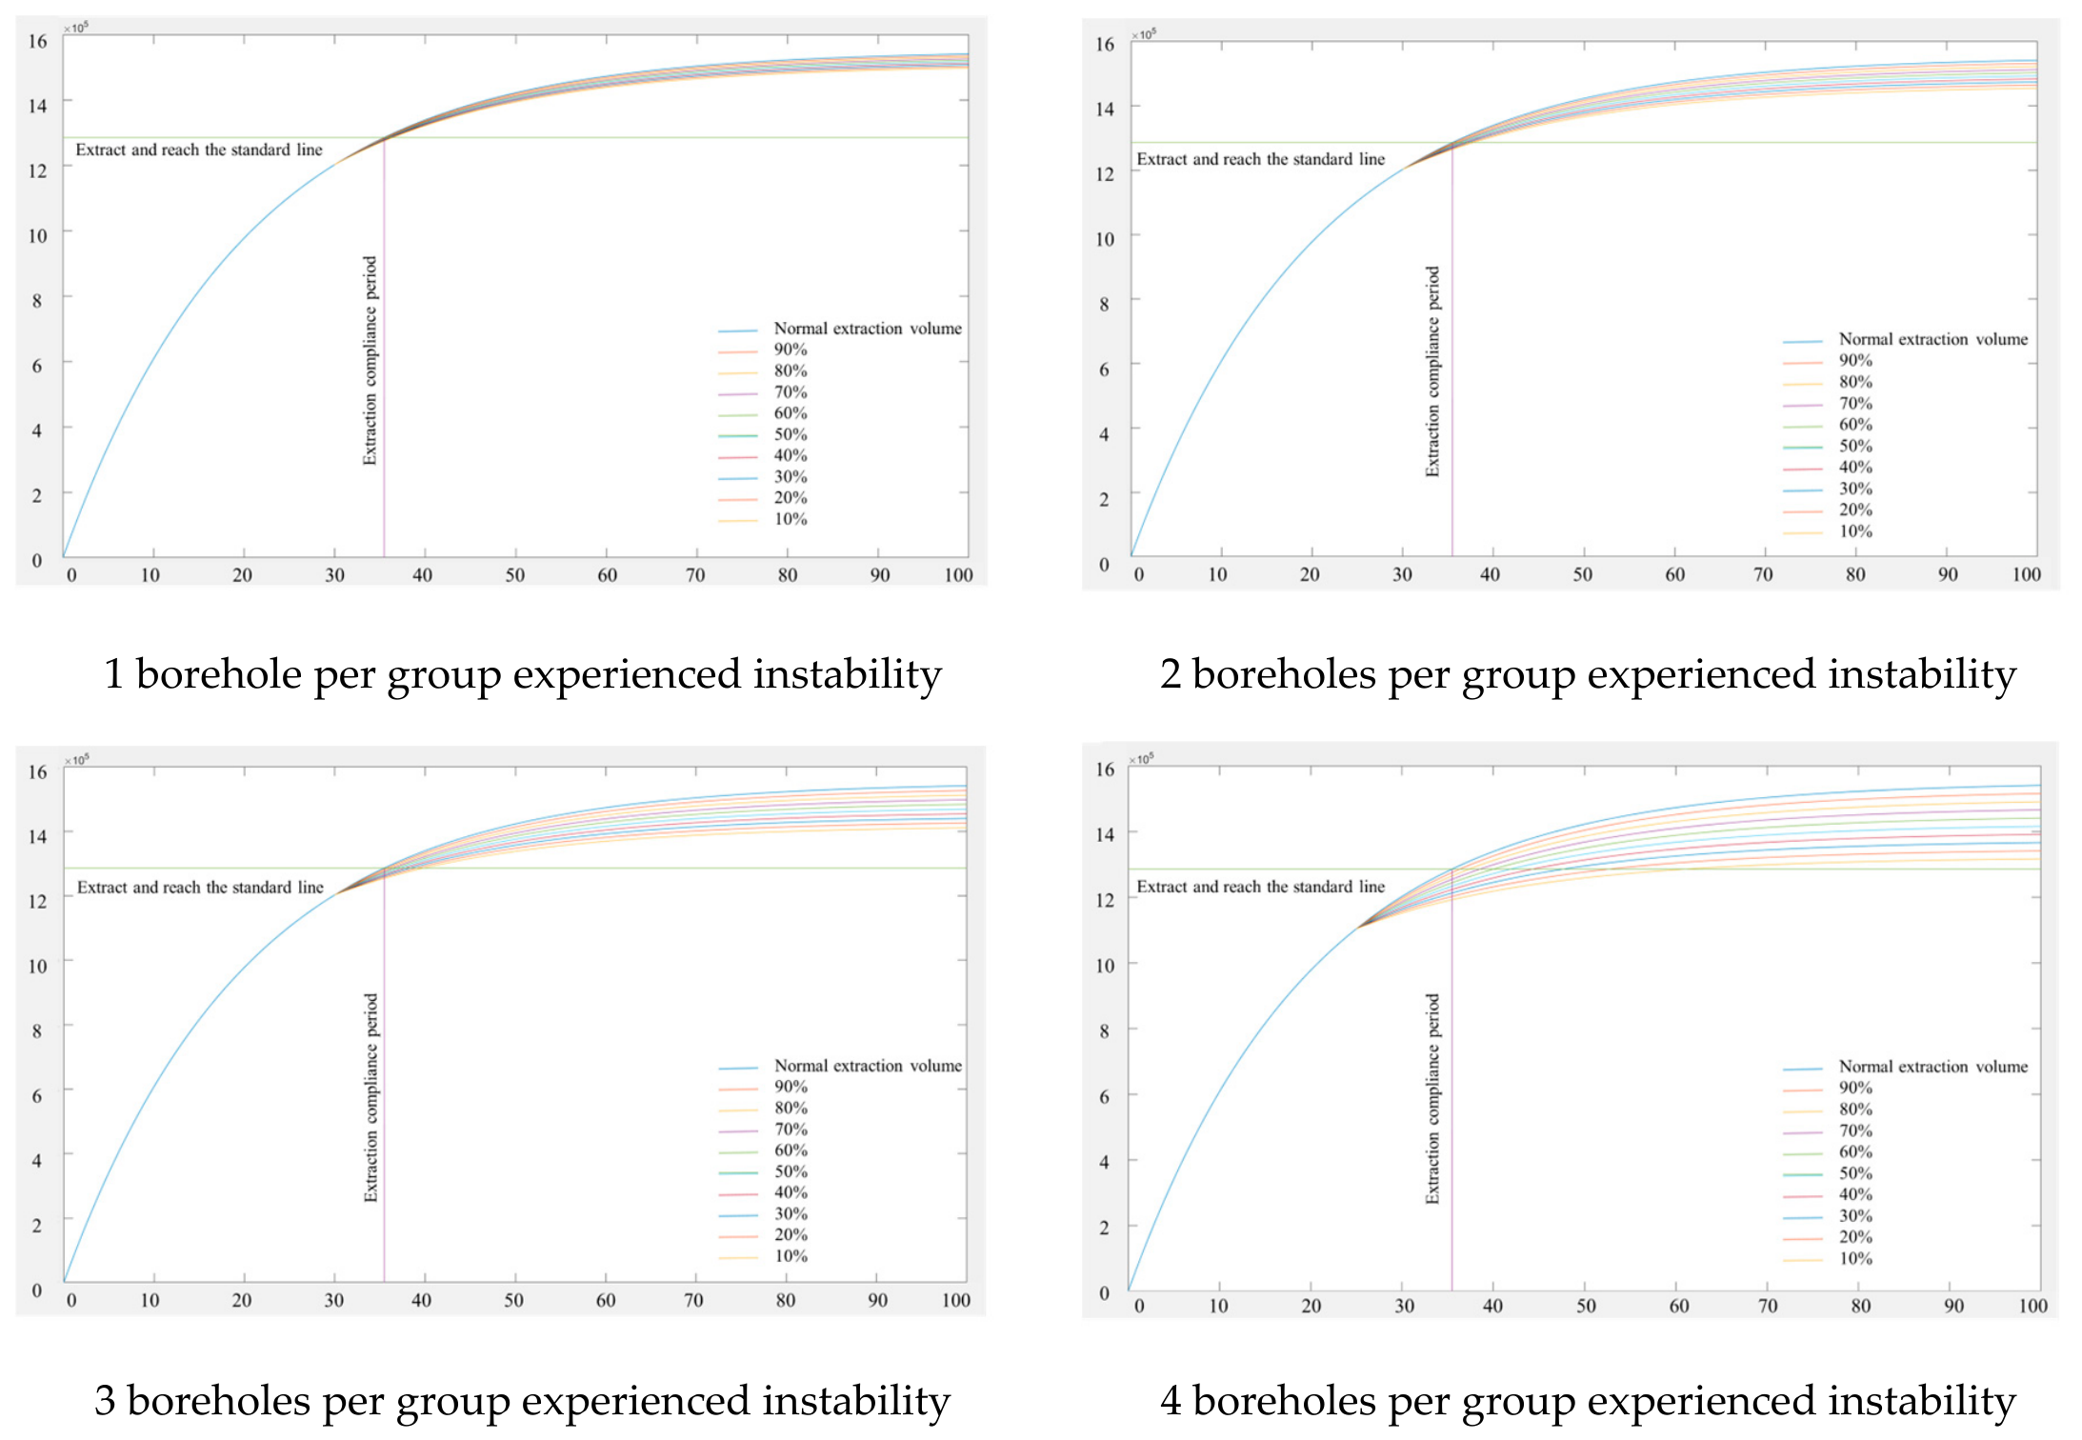
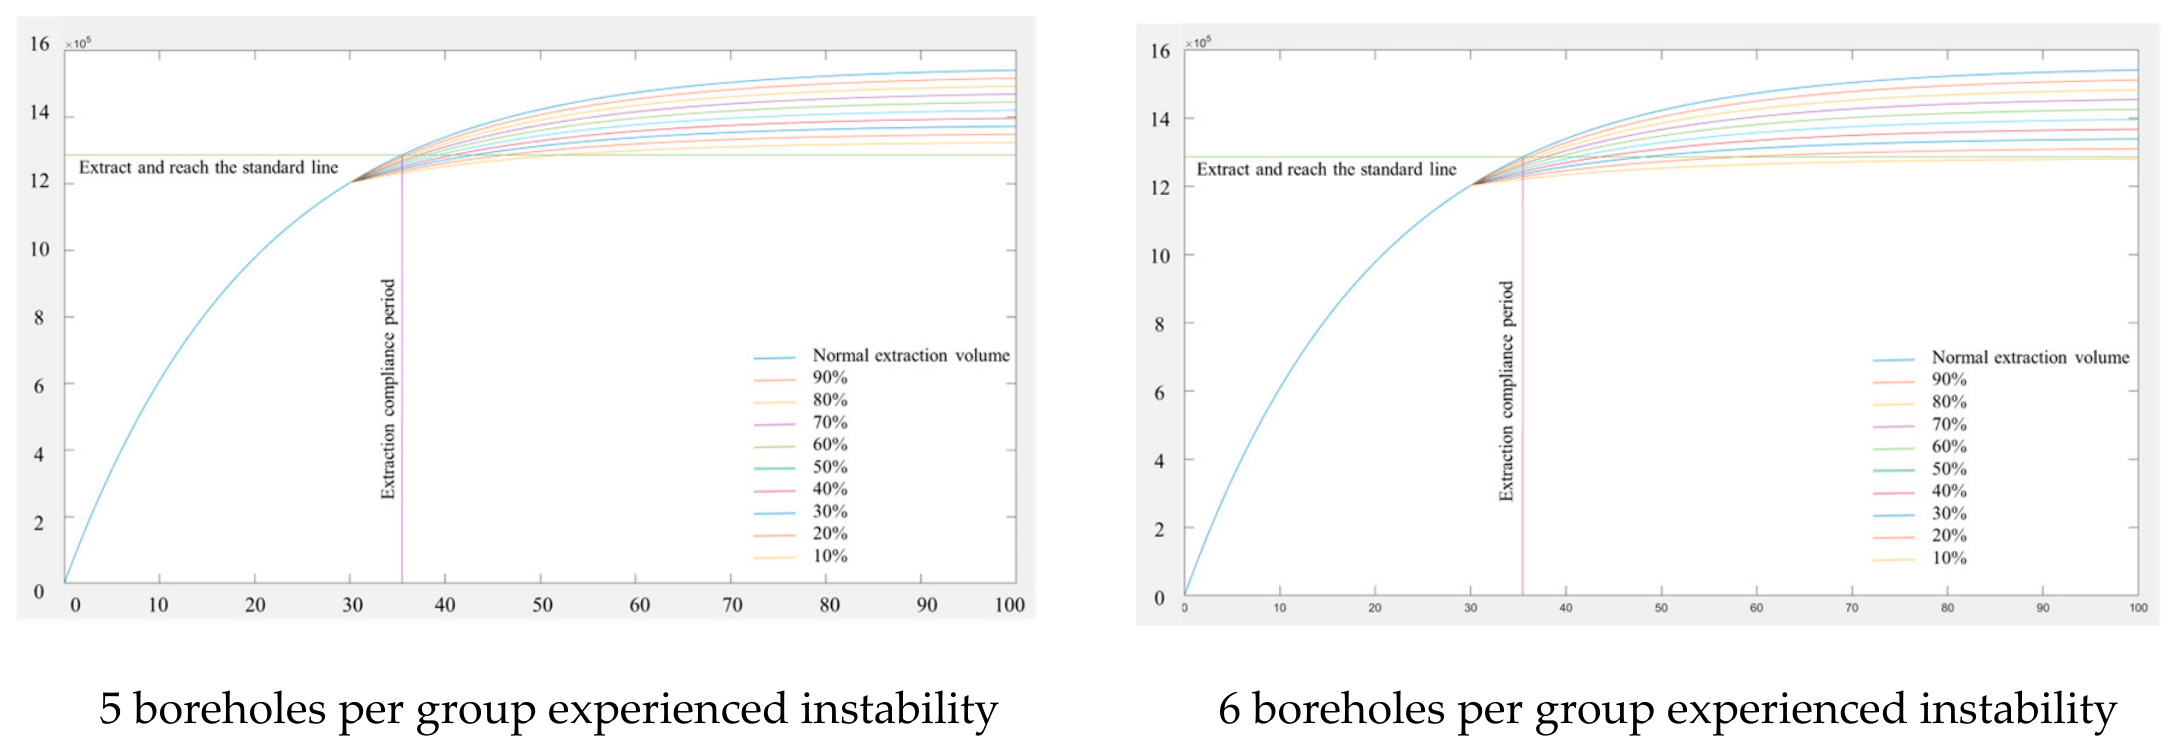
Intermediate instability times show similar trends to Day 5 and Day 30. Higher flow attenuation always causes a nonlinear increase in compliance time. Therefore, to maintain conciseness and avoid redundancy, the detailed figures and data tables for these intermediate dates are provided in the Supplementary Materials. The example is shown in Figure 2, by substituting the relevant parameters into Equation (3) to model the scenario where three boreholes become unstable on the fifth day after completion, the results obtained via MATLAB are shown in Figure 3 and Figure 4.
Normal compliance time is 35.48 days. Subsequent tables present the compliance time required under various scenarios of borehole collapse and flow attenuation (from 90% to 10%). The values in parentheses indicate the ratio of the post-collapse compliance time to the standard time (35.48 days). An entry marked with “/” denotes that the total extraction volume fails to meet the standard under the corresponding conditions. The results are shown in Table 5 and Table 6.
Using MATLAB simulations, the critical borehole gas flow rate and corresponding drainage time required to achieve compliance immediately after instability were determined by identifying the point at which cumulative gas production meets the standard requirement. As summarized in Table 7, the time required to reach the drainage standard varies with both the timing of borehole instability and the number of failed boreholes. The results clearly show that if the drainage period after instability exceeds four to five times the normal compliance duration, the total gas production of the borehole group will fail to meet the standard. To be consistent with common underground practice, where gas flow is measured on a group basis, the reduced flow rates of individual collapsed boreholes were aggregated into group-averaged values [17]. A comparison between these group-averaged reduced flow rates and the corresponding normal values at the same drainage time is presented in Table 8.
As summarized in Table 8, averaging gas flow rates of individual collapsed boreholes mitigates the influence of failed borehole length on total extraction. This group-averaging method aligns with field monitoring practices:
q ¯ = 1 m i = 1 m q i
where m is the number of boreholes and qi is the flow rate of each borehole.
These group-averaged flow rate changes (η) are further compiled in Table 9.
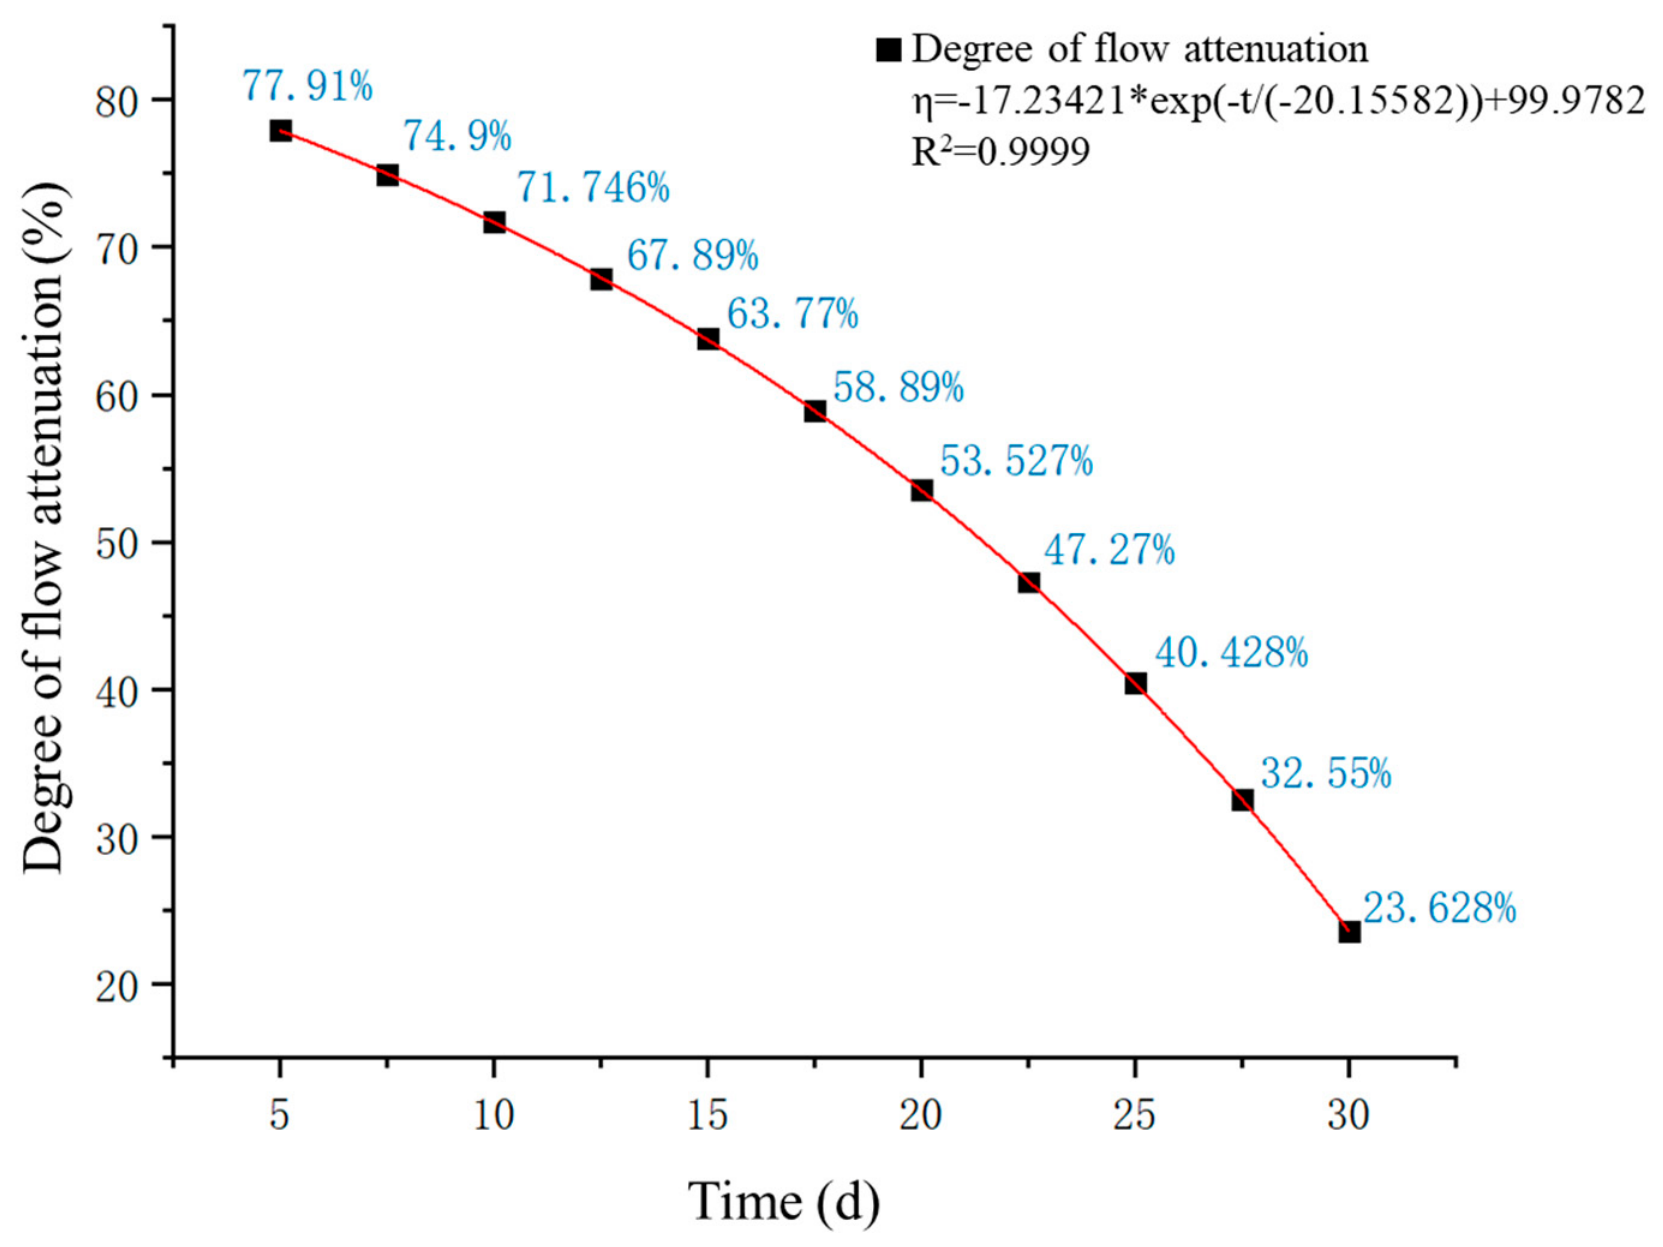
The variation in gas flow rate (η) was modeled as a function of the borehole collapse time (t) using the ExpDec1 function in Origin, as shown in Figure 5.
The fitting results yield a coefficient of determination (R2) of 0.9999, demonstrating an excellent fit of the ExpDec1 model to the relationship between the gas flow rate variation (η) and the collapse time (t). The resulting fitting equation is as follows:
η = 17.23421 × e x p t / 20.15582 + 99.9782
Combining the equation η = q q 1 .
By combining the basic decay model for gas flow in boreholes (Equation (1)) with the empirical formula for the rate of flow decay following borehole instability (Equation (6)), the formula for calculating the critical gas flow rate in boreholes (Equation (7)) can be derived, as follows:
q = q 0 e x p ( α t ) × [ 17.23421 × e x p t / 20.15582 + 99.9782 ]
It should be noted that the model assumes homogeneous coal seam permeability and a uniform decay coefficient (α) for the borehole group. Under highly heterogeneous geological conditions, prediction accuracy may decrease. Future work will introduce variable decay coefficients to improve model robustness.
Specifically, coal seam heterogeneity, including local variations in fracture networks and in situ stress, can lead to spatial deviations between the actual decay coefficient (α) and the idealized uniform value. In practical applications, dynamic calibration of α using zonal monitoring data is therefore required to ensure prediction accuracy.
Based on the derived fitting equation, we introduce the concept of critical flow rate qcrit:
q c r i t = q 0 e x p ( α t ) × η 100
At extraction time t = 15 d, the measured gas flow rate is 0.0268 m3/(hm·min), and the model-predicted critical flow rate q_crit is 0.0277 m3/(hm·min). The two values are highly consistent with a relative error less than 3.3%, which fully verifies the reliability and accuracy of the model.
This parameter defines the minimum gas flow intensity required at any given time t to ensure that the cumulative drainage volume ultimately meets the compliance criteria specified in GB 41022-2021.
Measure the borehole extraction time t(d) and the measured gas flow rate qmeasured at time t on site.
Substitute t into Equation (6) to calculate η; substitute q0, α, t, and η into Equation (7) to obtain the critical flow rate qcrit.
Effective Zone: If the measured flow rate qmeasuredqcrit, the borehole retains sufficient permeability to discharge the required volume of gas within an acceptable pre-drainage period.
Ineffective Zone: If qmeasured < qcrit, the flow attenuation caused by collapse or blockage is too severe. The borehole has entered a failure state where the remaining gas content cannot be reduced to the standard level (8 m3/t or 0.74MPa) even if extraction continues indefinitely.
This model is developed based on field data from the low-permeability thin coal seams at Zhengxing Coal Mine. Comparative analysis with the requirements for gas drainage efficiency specified in GB 41022-2021, the Design Standard for Coal Mine Gas Extraction Projects, confirms its compliance. Additionally, the model’s numerical results align well with the on-site drainage performance and flow rate variation patterns observed at Zhengxing Coal Mine, verifying its engineering reliability.
Engineering Application Example
Taking a group of boreholes in Coal Seam No. 14 at the Shanxi Zhenxing Mine as an example, the known parameters are initial flow rate q0 = 0.116658 m3/(hm·min), decay coefficient α = 0.0497 d−1, and drainage time t = 15 d.
Calculate the flow retention coefficient using Equation (6):
η = 17.23421 exp 20.15582 t + 99.9782
Substituting t = 15, we obtain η ≈ 63.77%.
Calculate the critical flow rate qcrit:
q crit = q 0 exp α t × η 100
Substituting the data gives qcrit ≈ 0.0277 m3/(hm·min).
On-site assessment:
If the measured flow rate measured qmeasured < qcrit = 0.0277 m3/(hm·min), then the borehole group shall be classified as a failed borehole, and measures such as drilling additional boreholes or grouting repairs shall be taken.

5. Conclusions

  • Impact of Borehole Instability on Drainage Compliance: Borehole instability significantly impairs drainage performance. This study reveals that if gas flow decreases abruptly due to collapse or blockage, and the subsequent drainage period exceeds four to five times the standard compliance duration, the total gas production of the borehole group will fail to meet the requirements specified in GB 41022-2021.
  • Key Governing Factors: To account for underground geological heterogeneity, a group-averaging method is adopted to reduce the numerical influence of individual collapsed boreholes. Sensitivity analysis indicates that the timing of instability and the degree of flow attenuation are the dominant factors controlling total gas production.
  • Quantitative Evaluation Model: The relationship between gas flow rate variation (η) and collapse time (t) is accurately modeled by the ExpDec1 model, with a high-quality fit (R2 = 0.9999). The fitted equation for borehole flow rate as a function of collapse time is q = q0exp(−αt)·[−17.23421*exp(−t/(−20.15582)) + 99.9782].
  • The derived equation provides a practical criterion for identifying ineffective drainage boreholes in underground coal mines. A three-step evaluation protocol is proposed for field application:
Step 1: Measure the real-time gas flow rate q and cumulative drainage time t of the target borehole group.
Step 2: Calculate the critical flow rate qcrit at time t using Equation (6).
Step 3: Compare the measured flow rate with q < qcrit (i.e., the flow attenuation falls below the fitted curve in Figure 2), the borehole group is classified as ineffective, indicating severe collapse or blockage. Remedial measures such as re-drilling or grouting should be promptly implemented to ensure compliance.
This model was developed using field data from the Zhenxing Mine, which features low permeability (0.05 m2/(MPa2·d)), a thin coal seam (1.07 m), and a soft coal seam with high gas content. It is suitable for coal mine gas drainage projects with similar geological conditions. For mines where there are significant variations in seam thickness and permeability, the model parameters can be optimized by incorporating additional field data, thereby extending the model’s scope of application.

Supplementary Materials

The following supporting information can be downloaded at: https://www.mdpi.com/article/10.3390/en19112681/s1, Figure S1. Total Gas Extraction Volume versus Time (5 Days Post-Drilling); Figure S2. Total Extraction Volume versus Time (10 Days Post-Drilling); Figure S3. Total Extraction Volume versus Time (15 Days Post-Drilling); Figure S4. Total Extraction Volume versus Time (20 Days Post-Drilling); Figure S5. Total Extraction Volume versus Time (25 Days Post-Drilling); Figure S6. Total Extraction Volume versus Time (30 Days Post-Drilling); Table S1 Time to Achieve Extraction Standard under Different Post-Instability Conditions (Day 5); Table S2. Time to Achieve Extraction Standard under Different Post-Instability Conditions (Day 10); Table S3. Time to Achieve Extraction Standard under Different Post-Instability Conditions (Day 15); Table S4. Time to Achieve Extraction Standard under Different Post-Instability Conditions (Day 20); Table S5. Time to Achieve Extraction Standard under Different Post-Instability Conditions (Day 25); Table S6. Time to Achieve Extraction Standard under Different Post-Instability Conditions (Day 30).

Author Contributions

Formal analysis, investigation, writing—original draft preparation, F.Z. and Y.H.; resources, data curation, super vision, project administration, funding acquisition, F.Z., F.S., C.N. and Q.L.; writing—review and editing, F.Z. and Y.H. All authors have read and agreed to the published version of the manuscript.

Funding

This research was supported by the National Natural Science Foundation of China (Nos. 51974108, and 51404093), the Scientific and Technological Project of Henan Province (No. 242102320213), the Natural Science Foundation of Henan Province (No. 232300420077), the Fundamental Research Funds for the Universities of Henan Province (No. NSFRF240638), and the Post-doctoral Research Project of Henan Province (No. 001701014).

Data Availability Statement

The data that support the findings of this study are available from the corresponding author upon reasonable request.

Conflicts of Interest

Author Chen Niu was employed by the company Shaanxi Water Development Group Co., Ltd. The remaining authors declare that the research was conducted in the absence of any commercial or financial relationships that could be construed as a potential conflict of interest.

References

  1. Han, Y.; Zhang, F.Y. Progress in research on instability mechanism of coalbed borehole. J. Saf. Sci. Technol. 2014, 4, 114–119. [Google Scholar] [CrossRef]
  2. Cao, L.; Lv, M.; Li, C.; Sun, Q.; Wu, M.; Xu, C.; Dou, J. Effects of Crosslinking Agents and Reservoir Conditions on the Propagation of Fractures in Coal Reservoirs During Hydraulic Fracturing. Reserv. Sci. 2025, 1, 36–51. [Google Scholar] [CrossRef] [Scilit]
  3. Han, Y.; Zhang, F.Y.; Liu, X.; Li, X. Numerical simulation of instability and failure types of coalbed borehole based on Hoek-Brown criterion. J. China Coal Soc. 2020, 45, 308–318. [Google Scholar] [CrossRef]
  4. Li, M.; Liu, J.; Xia, Y. Risk Prediction of Gas Hydrate Formation in the Wellbore and Subsea Gathering System of Deep-Water Turbidite Reservoirs: Case Analysis from the South China Sea. Reserv. Sci. 2025, 1, 52–72. [Google Scholar] [CrossRef] [Scilit]
  5. Wang, D.; Qu, Z.; Ren, Z.; Shan, Q.; Yu, B.; Zhang, Y.; Zhang, W. Numerical Simulation on Borehole Instability Based on Disturbance State Concept. Energies 2022, 17, 6295. [Google Scholar] [CrossRef] [Scilit]
  6. Wang, Y.L.; Yu, Z.J.; Guo, J.K.; Du, K.; Ma, D.; Zhao, A. Mechanism and application of drill pipe bending induced borehole collapse in soft coal seam drilling. Energy Sci. Eng. 2024, 12, 4763–4772. [Google Scholar] [CrossRef] [Scilit]
  7. Xiao, P.; Huang, X.; Zhang, C.; Liu, X.; Li, B.; Chen, L.; Chen, Z.; Cheng, R.; Zhao, Y. Research on the construction and verification of evaluation model for borehole collapse in gas extraction. Fuel 2024, 362, 130800. [Google Scholar] [CrossRef] [Scilit]
  8. Liu, C.; Man, Z.; Tian, J. Failure Mechanisms of Boreholes in Soft Coal Seams: Comparative Analysis of Protective Sieve Pipes. Int. J. Geomech. 2025, 25, 04024256. [Google Scholar] [CrossRef] [Scilit]
  9. Duan, K.; Wu, W.; Kwok, C.Y. Discrete element modelling of stress-induced instability of directional drilling boreholes in anisotropic rock. Tunn. Undergr. Space Technol. 2018, 81, 55–67. [Google Scholar] [CrossRef] [Scilit]
  10. Zhao, L.; Yuan, C.; Shan, K.; Gao, M.; Long, X.; Xu, M.; Ao, T.; Yang, Y. Expandable profile liner technology for mitigating lost circulation and wellbore instability in geothermal drilling. Renew. Sustain. Energy Rev. 2025, 209, 115109. [Google Scholar] [CrossRef] [Scilit]
  11. Zhao, H.B.; Zhang, M.; Zhang, H.; Wang, H.; Li, F. Development and application of stability dynamic monitoring and measuring device to gas drainage borehole. Coal Sci. Technol. 2018, 1, 127–132+198. [Google Scholar] [CrossRef]
  12. Wang, Y.L.; Zhai, X.X.; Sun, Y.N. Research on the reasonable parameters of protruding coal seam drilling. J. China Coal Soc. 2011, 2, 304–307. [Google Scholar] [CrossRef]
  13. Qi, Q.; Jia, X.; Zhou, X.; Zhao, Y. Instability-negative pressure loss model of gas drainage borehole and prevention technique: A case study. PLoS ONE 2020, 15, e0242719. [Google Scholar] [CrossRef] [Scilit]
  14. Zhou, X.; Yang, F.; Chen, Z.; Su, Y. Mechanistic Insights and Engineering Strategies for Wellbore Integrity Control in Polar Permafrost Reservoirs. Reserv. Sci. 2026, 2, 126–150. [Google Scholar] [CrossRef] [Scilit]
  15. Li, Q.; Li, Q.; Wang, F.; Wu, J.; Wang, Y.; Jin, J. Effects of Geological and Fluid Characteristics on the Injection Filtration of Hydraulic Fracturing Fluid in the Wellbores of Shale Reservoirs: Numerical Analysis and Mechanism Determination. Processes 2025, 13, 1747. [Google Scholar] [CrossRef] [Scilit]
  16. GB41022-2021; Basic Index of Coal Mine Gas Drainage and Exploition. State Administration for Market Regulation: Beijing, China, 2021.
  17. Tang, L.; Wang, T.; Liu, Y.; Zhou, H. Methane Interface Desorption Mechanism in Geological Reservoirs After Natural Gas Hydrate Decomposition. Reserv. Sci. 2026, 2, 172–188. [Google Scholar] [CrossRef] [Scilit]
Figure 1. Methodological flowchart of the study.
Energies 19 02681 g001
Figure 2. Example: Three boreholes’ instability on their 5th day following their completion.
Energies 19 02681 g002
Figure 3. Total gas extraction volume versus time (5 days post-drilling).
Energies 19 02681 g003aEnergies 19 02681 g003b
Figure 4. Total extraction volume versus time (30 days post-drilling).
Energies 19 02681 g004aEnergies 19 02681 g004b
Figure 5. Time and flow attenuation degree fitting curve.
Energies 19 02681 g005
Table 1. Gas drainage efficiency of the working face.
Total Gas Emission Rate of the Working Face (Q) (m3/min)Gas Drainage Rate of the Working Face (%)
5 ≤ Q < 10≥20
10 ≤ Q < 20≥30
20 ≤ Q < 40≥40
40 ≤ Q < 70≥50
70 ≤ Q < 100≥60
100 ≤ Q≥70
Table 2. The index of the recovery of coal before the coal mining face.
Daily Coal Production of Working Face A (t)Desorbable Gas Content Wj (m3/t)
A ≤ 1000≤8
1000 < A ≤ 2500≤7
2500 < A ≤ 4000≤6
4000 < A ≤ 6000≤5.5
6000 < A ≤ 8000≤5
8000 < A ≤ 10,000≤4.5
A > 10,000≤4
Table 3. Coal seam and drilling-related parameters.
ParametersValues
Coal seam thickness h (m)1.07
Slope length a (m)160
Strike length b (m)1088
Apparent density of coal γ (kg·m−3)1420
Maximum gas content of coal seam W (m3/t)13.0
Residual gas content W’ (m3/t)2.45
Extraction rate of working face η0 (%)40
Borehole spacing d (m)4
Total number of boreholes i540
Average borehole length l (m)70~100
Initial gas extraction volume per hundred meters of borehole q0 [m3/(hm·min)]0.116658
Decay coefficient of borehole gas flow rate α (d−1)
(Represents the rate of decline in gas emission capability over time)
0.0497
Table 4. Gas extraction volume of boreholes after instability (m3/(hm·min)).
Borehole Collapse TimeDay 5Day 10Day 15Day 20Day 25Day 30
Gas Flow Rate Variation
90%0.08190.06390.04980.03890.03030.0236
80%0.07280.05680.04430.03450.02690.021
70%0.06370.04970.03870.03020.02360.0184
60%0.05460.04260.03320.02590.02020.0158
50%0.04550.03550.02770.02160.01680.0131
40%0.03640.02840.02210.01730.01350.0105
30%0.02730.02130.01660.0130.01010.0079
20%0.01820.01420.01110.00860.00670.0053
10%0.00910.00710.00550.00430.00340.0026
Table 5. Time to achieve extraction standard under different post-instability conditions (Day 5).
Number of Instabilities123456
Degree of Attenuation
90%36.538 d
(102.98%)
37.691 d
(106.23%)
38.949 d
(109.78%)
40.335 d
(113.68%)
41.871 d
(118.01%)
43.587 d
(122.85%)
80%37.692 d
(106.23%)
40.339 d
(113.70%)
43.593 d
(122.87%)
47.755 d
(134.60%)
53.412 d
(150.54%)
61.986 d
(174.71%)
70%38.953 d
(109.79%)
43.595 d
(122.87%)
50.345 d
(141.90%)
61.998 d
(174.74%)
103.058 d
(290.47%)
/
60%40.340 d
(113.70%)
47.761 d
(134.61%)
62.005 d
(174.76%)
///
50%41.878 d
(118.03%)
53.424 d
(150.57%)
103.165 d
(290.77%)
///
40%43.597 d
(122.88%)
62.011 d
(174.78%)
////
30%45.540 d
(128.35%)
79.008 d
(222.68%)
////
20%47.763 d
(134.62%)
/////
Note: The symbol ‘/’ indicates that the total extraction volume cannot meet the standard regardless of the extended time, signifying a complete failure.
Table 6. Time to achieve extraction standard under different post-instability conditions (Day 30).
Number of Instabilities 1 2 3 4 5 6
Degree of Attenuation
90%35.572 d
(100.26%)
35.668 d
(100.53%)
35.767 d
(100.81%)
35.87 d
(101.10%)
35.977 d
(101.40%)
36.087 d
(101.71%)
80%35.665 d
(100.52%)
35.865 d
(101.09%)
36.079 d
(101.69%)
36.31 d
(102.34%)
36.558 d
(103.04%)
36.828 d
(103.80%)
70%35.763 d
(100.80%)
36.076 d
(101.68%)
36.427 d
(102.67%)
36.821 d
(103.78%)
37.266 d
(105.03%)
37.775 d
(106.47%)
60%35.863 d
(101.08%)
36.304 d
(102.32%)
36.817 d
(103.77%)
37.423 d
(105.48%)
38.148 d
(107.52%)
39.033 d
(110.01%)
50%35.971 d
(101.38%)
36.558 d
(103.04%)
37.277 d
(105.06%)
38.174 d
(107.59%)
39.328 d
(110.85%)
40.870 d
(115.19%)
40%36.077 d
(101.68%)
36.825 d
(103.79%)
37.782 d
(106.49%)
39.059 d
(110.09%)
40.848 d
(115.13%)
43.551 d
(122.75%)
30%36.189 d
(102.00%)
37.114 d
(104.61%)
38.365 d
(108.13%)
40.163 d
(113.20%)
42.980 d
(121.14%)
48.106 d
(135.59%)
20%36.305 d
(102.33%)
37.427 d
(105.49%)
39.043 d
(110.04%)
41.582 d
(117.20%)
46.213 d
(130.25%)
58.043 d
(163.59%)
10%36.431 d
(102.68%)
37.785 d
(106.50%)
39.877 d
(112.39%)
43.566 d
(122.79%)
52.104 d
(146.85%)
/
Table 7. Time to achieve extraction standard under different instability times and number of unstable boreholes.
Instability TimeDay 5Day 7.5Day 10Day 12.5Day 15Day 17.5Day 20Day 22.5Day 25Day 27.5Day 30
Number of Instabilities
1///////////
2214.5 d
(604.57%)
168 d
(473.51%)
/////////
3143.1 d
(403.33%)
159.6 d
(449.835%)
161.6 d
(455.47%)
214 d
(603.16%)
167 d
(470.69%)
175 d
(493.24%)
/////
4167 d
(470.69%)
168.7 d
(475.48%)
188.7 d
(531.85%)
167 d
(470.69%)
147 d
(414.32%)
175.4 d
(494.36%)
152.3 d
(429.26%)
162.7 d
(458.57%)
///
5166.7 d
(469.84%)
186 d
(524.24%)
170.8 d
(481.40%)
159.5 d
(449.55%)
154.7 d
(436.02%)
154.3 d
(434.89%)
156.5 d
(441.09%)
157.1 d
(442.78%)
150 d
(422.77%)
144.1 d
(406.14%)
/
6142.9 d
(402.76%)
144.7 d
(407.84%)
161.5 d
(455.19%)
214 d
(603.16%)
166.5 d
(469.28%)
175.4 d
(494.36%)
161.8 d
(456.03%)
183.1 d
(516.07%)
172.3 d
(485.63%)
182.7 d
(514.94%)
177.8 d
(501.13%)
Table 8. The corresponding gas flow variations in each borehole group under different conditions when the total extraction volume just reaches the compliance threshold.
Collapse TimeDay 5Day 7.5Day 10Day 12.5Day 15Day 17.5Day 20Day 22.5Day 25Day 27.5Day 30
Number of Collapsed Holes Single BoreholeEach GroupSingle BoreholeEach GroupSingle BoreholeEach GroupSingle BoreholeEach GroupSingle BoreholeEach GroupSingle BoreholeEach GroupSingle BoreholeEach GroupSingle BoreholeEach GroupSingle BoreholeEach GroupSingle BoreholeEach GroupSingle BoreholeEach Group
1//////////////////////
222.9%77.97%12.2%74.91%//////////////////
348.6%77.97%41.1%74.75%34.1%71.76%25.1%67.9%15.5%63.785%3.8%58.77%//////////
461.4%77.94%55.9%74.8%50.5%71.714%43.9%67.94%36.6%63.77%28.1%58.91%18.7%53.54%7.7%47.26%//////
568.9%77.78%65.1%75.07%60.4%71.714%55.1%67.93%49.3%63.785%42.5%58.93%34.9%53.5%26.4%47.43%16.6%40.428%5.7%32.64%//
674.2%77.89%70.8%74.97%67.0%71.714%62.4%67.77%57.7%63.74%52.1%58.94%45.8%53.54%38.3%47.11%30.5%40.428%21.2%32.46%10.9%23.628%
Table 9. The gas flow attenuation in each borehole group precisely meets the compliance threshold.
Collapse Time (d)Average (%)Collapse Time (d)Average (%)
577.917.574.90
1071.74612.567.89
1563.7717.558.89
2053.52722.547.27
2540.42827.532.55
3023.628
Disclaimer/Publisher’s Note: The statements, opinions and data contained in all publications are solely those of the individual author(s) and contributor(s) and not of MDPI and/or the editor(s). MDPI and/or the editor(s) disclaim responsibility for any injury to people or property resulting from any ideas, methods, instructions or products referred to in the content.