Article

Visualization Study on Flow Pattern Evolution and Heat Transfer Characteristics of a Two-Phase Loop Thermosyphon Under High Heat Flux with Various Filling Ratios

Key Laboratory of Ocean Energy Utilization and Energy Conservation of Ministry of Education, Dalian University of Technology, Dalian 116023, China
*
Author to whom correspondence should be addressed.
Energies 2026, 19(11), 2674; https://doi.org/10.3390/en19112674
Submission received: 23 April 2026 / Revised: 26 May 2026 / Accepted: 29 May 2026 / Published: 2 June 2026
(This article belongs to the Collection Advances in Heat Transfer Enhancement)

Abstract

To investigate the flow pattern evolution and phase-change characteristics of a two-phase loop thermosyphon under high heat flux conditions with different filling ratios, a visual experimental study was conducted. The filling ratio ranged from 36.8% to 92.3%, with a maximum heat flux of 240 W/cm2. The results indicate that at a filling ratio of 81.6%, bubbly flow is observed under low heat flux (30–60 W/cm2), with a bubble detachment size of approximately 2 mm. When the heat flux increases to 90–180 W/cm2, intermittent boiling occurs, and the flow pattern cycle shifts from bubbly flow to single-phase flow and back to bubbly flow, with the period shortening from 5.92 s to 4.92 s. At heat fluxes ≥ 200 W/cm2, intermittent boiling disappears, transitioning to stable high-velocity subcooled flow boiling, and the detachment size decreases from 1951 μm to 762 μm. At a filling ratio of 65.3%, bubbly and slug flow are observed under low heat flux (30–120 W/cm2). Intermittent boiling appears at heat fluxes ≥ 150 W/cm2, characterized by a cycle of “churn flow–bubbly flow–single-phase flow–bubbly flow–churn flow”. This intermittent boiling persists under high heat flux (200–220 W/cm2) without transitioning to stable flow boiling. At a filling ratio of 36.8%, large-scale slug bubbles (maximum 37 cm) form under 30–60 W/cm2, transitioning to churn flow at 90–120 W/cm2. Instantaneous dryout occurs at 150 W/cm2, followed by complete dryout at 180 W/cm2. The visualization results reveal the critical heat flux for flow pattern transitions and the periodic characteristics of intermittent boiling under different filling ratios.

1. Introduction

With the increasing global demand for energy, heat and mass transfer technologies continue to evolve and advance. The emergence of new technologies in advanced manufacturing, renewable energy, and high-end electronics has imposed stricter requirements on thermal management and heat transport technologies, particularly under extreme operating conditions such as high temperatures and high heat fluxes [1,2,3,4]. Generally, heat transfer technologies involving heat fluxes exceeding 100 W/cm2 are classified as high heat flux heat transfer technologies. In fields such as electronic devices [5,6], aerospace [7,8], and comprehensive solar energy utilization [9,10,11], high heat flux, heat transfer technology has become a critical means of improving production efficiency and ensuring equipment safety. The two-phase loop thermosyphon (TPLT), also known as a separate-type gravity heat pipe, is a passive heat transfer device characterized by high thermal efficiency. Due to the absence of a capillary wick structure, its operation is not limited by capillary limits. Furthermore, the evaporator and condenser sections are arranged separately in different pipelines, enabling long-distance heat exchange. It also offers advantages such as structural simplicity, flexibility, ease of processing, low cost, and long service life [2]. Under high heat flux conditions, TPLTs with high filling ratios exhibit enhanced heat transfer performance while meeting requirements for low thermal resistance and passive operation. Therefore, high-filling-ratio TPLTs hold significant potential for applications in high heat flux heat transfer.
Complex flow patterns such as bubbly flow, slug flow, and churn flow exist within TPLTs, and their transitions significantly affect heat transfer performance. Visualization experiments can directly reveal flow pattern transitions and underlying heat transfer mechanisms. Consequently, researchers worldwide have conducted relevant studies. Shi et al. [12] performed a visualization study on a TPLT used for motor spindle cooling, employing an all-transparent glass loop to investigate startup characteristics under varying heat loads (30–110 W) and liquid filling ratios (10–50%). Fang et al. [13] visually investigated intermittent boiling in a loop thermosyphon, observing that it primarily occurs under low heat loads and low filling ratios, with periodic flow pattern variations in the downcomer. He et al. [14] conducted visualization experiments on a small-diameter loop thermosyphon (3 mm) across a wide filling ratio range (44–97%), with the visualization area located in the riser. Liu et al. [15,16] investigated flow instability in a loop thermosyphon over a wide range of filling ratios (38–87%) through visualization experiments, with the observation window located in the evaporator outlet riser, identifying intermittent boiling phenomena. Thongdaeng et al. [17] performed visualization experiments under heat flux conditions (0.38–1.79 W/cm2) and a filling ratio of 50%, concluding that the operating mechanism was nucleate pool boiling. Zhang et al. [18] visualized the flow pattern variations in a multi-evaporator loop thermosyphon under heat loads of 20–60 W, observing periodic changes in flow state. Zhang et al. [19] established a visualization test rig to observe and measure flow pattern characteristics in the downcomer. Tong et al. [20] visualized a multi-evaporator TPLT for data center applications across filling ratios of 45–151%, noting two-phase flow in both the riser and downcomer. Zhang et al. [21] investigated the heat transfer performance and two-phase flow characteristics of a loop thermosyphon via visualization. Cao et al. [22] conducted a visual experimental study on the heat transfer and flow characteristics of a TPLT under different filling ratios (20–140%, based on evaporator volume). Zhang et al. [23] visualized the two-phase flow characteristics of a water-charged TPLT at a 25% filling ratio. Wang et al. [24] studied the two-phase flow characteristics of a TPLT at a heat flux of 0.76 W/cm2 over a filling ratio range of 15.2–96.1% (based on evaporator volume). Elkholy [25] visualized the heat transfer process in a TPLT with filling ratios from 11% to 38% and heating power from 0.6 W/cm2 to 4.83 W/cm2, using a flexible transparent nylon tube for the riser visualization section.
In recent years, driven by the ever-increasing demand for high-heat-flux dissipation, visualization research on two-phase thermosyphon loops has achieved new progress in terms of filling ratio effects, working fluid effects, and structural optimization., Lu et al. [26] reported that the minimum loop thermal resistance (0.0808 °C/W) is obtained at a filling ratio of 40%. Zamanifard and Wang [27] confirmed that a filling ratio of 40% minimizes both thermal resistance and entropy generation. Cai et al. [28] compared the heat transfer characteristics of H2O and R134a over a filling ratio range of 30–90% and pointed out that R134a exhibits smaller temperature fluctuations under high filling ratios. He et al. [29] reported for the first time the self-regulating phenomenon of two-phase flow in the downcomer under high filling ratios. Zhang et al. [30] found that the highest effective thermal conductivity occurs at a filling ratio of 40%. Li et al. [31] conducted transient experimental and numerical studies on a loop thermosyphon with a microchannel evaporator using R134a as the working fluid, over a filling ratio range of 30–100% and a heat flux range of 380–2300 W/m2. They confirmed that a low filling ratio leads to severe superheating in the upper part of the evaporator section, whereas the minimum thermal resistance is achieved at a filling ratio of 50%. Zhu et al. [32] investigated the instability of a dual-evaporator loop thermosyphon with a separator under uneven heating power conditions. They found that instability occurs when the filling ratio is in the range of 50–70%, with the oscillation period increasing from 115 s to 911 s and the amplitude increasing from 2.5 °C to 11.1 °C. Nevertheless, the system can still operate stably even when the heating power difference between the two evaporators reaches as high as 350 W. Visualization observations revealed the flow pattern changes in the liquid line and two-phase line, as well as the mass competition mechanism between the two evaporators. Baek et al. [33] suppressed temperature fluctuations caused by intermittent boiling in a two-phase closed thermosyphon by adding 0.5 wt% carbon nanotube (CNT) nanofluid. Their study showed that the CNT nanofluid significantly reduces the maximum and average temperature differences between the bottom and top of the evaporator section, decreases thermal resistance by up to 9.48%, and increases the heat transfer coefficient by 19.66%. Evaporator structure optimization and flow instability, Zhu et al. [32] found that when the filling ratio is in the range of 50–70%, the system oscillates with periods of 115–911 s. Balihar et al. [34] achieved a thermal efficiency of 91% at a filling ratio of 0.88 and a heating power of 400 W. Ma et al. [35] found that the dominant frequency of the periodic flow pattern transition increases with heat flux and decreases with filling ratio. He et al. [36] optimized the heat transfer performance of a two-phase thermosyphon loop by regulating the wettability of the riser wall. They found that the influence of wall wettability on flow behavior and heat transfer performance varies significantly with the filling ratio, and the loop thermal resistance can be reduced by 6.9% to 53.5% under different filling ratios. Qu et al. [37] comparatively studied two-phase thermosyphon loops with and without pump assistance. Through high-speed visualization, they found that the introduction of a pump ensures smooth startup and suppresses local intermittent dryout and intermittent boiling phenomena. In the heating power range of 150–550 W and pump power range of 1.6–2.4 W, the thermal resistance was reduced by 2.9–30.1%, and the flow boiling heat transfer coefficient in the evaporator was increased by 12.3% compared to the pump-free condition. Srivastava et al. [38] used methanol as the working fluid and realized visual observation of the phase-change process in a two-phase closed loop thermosyphon using a transparent horizontal evaporator. They revealed the key physical mechanism that the vapor phase must displace the liquid to initiate flow in the horizontal evaporator, providing important insights for evaporator design to prevent backflow. A comparison of representative visualization studies on two-phase thermosyphon loops in the past three years is shown in Table 1.
The aforementioned studies indicate that flow patterns within TPLTs vary with filling ratio and operating conditions. Although numerous investigations have been conducted, limitations persist. Firstly, although some studies have extended the filling ratio range to as high as 90%, detailed research on two-phase flow and phase-change characteristics for filling ratios exceeding 80% remains limited. In particular, comparative studies that finely classify the filling ratio into high (80–100%), medium-high (50–80%), and low (<50%) ranges are scarce. Secondly, due to limitations in loop pressure capacity and visualization section materials, most existing visualization studies are confined to relatively low heat flux ranges, typically below 100 W/cm2. Flow pattern transitions and phase-change behaviors under high heat flux conditions (>200 W/cm2) remain undefined, leaving a considerable gap compared to the practical demands of advanced electronic devices. Furthermore, visualization windows in existing studies are predominantly located on the riser or downcomer pipes, whereas boiling phenomena actually occur within the evaporator. The phase-change process inside the evaporator can reveal bubble nucleation, growth, and departure, yet direct visualization of this process remains insufficient. Consequently, the quantitative understanding of the relationship between the evolution of flow patterns and heat transfer performance under high filling ratios and high heat fluxes remains ambiguous. In this context, gradient heatmetry has emerged as a complementary methodology that enables direct measurement of local heat flux with high temporal resolution, offering new insights into boiling and phase-change heat transfer processes beyond what visualization alone can provide. As comprehensively documented by Sapozhnikov et al. [39] gradient heat flux sensors allow direct fixation of heat flux per unit area and have proven to be a reliable method for studying phase transitions and non-stationary processes. Such direct heat flux measurement capabilities are highly relevant to the quantitative characterization needed in the present work, though the focus here remains on flow pattern visualization under high heat flux conditions.
Therefore, this study conducts a visual experimental investigation into the phase-change heat transfer and two-phase flow characteristics of a high-filling-ratio TPLT. The objective is to elucidate the heat transfer mechanism of high-filling-ratio TPLTs, improve loop structures for enhanced thermal performance, and provide a theoretical foundation for the application of high-filling-ratio TPLTs.

2. Experimental Study

2.1. Experimental System

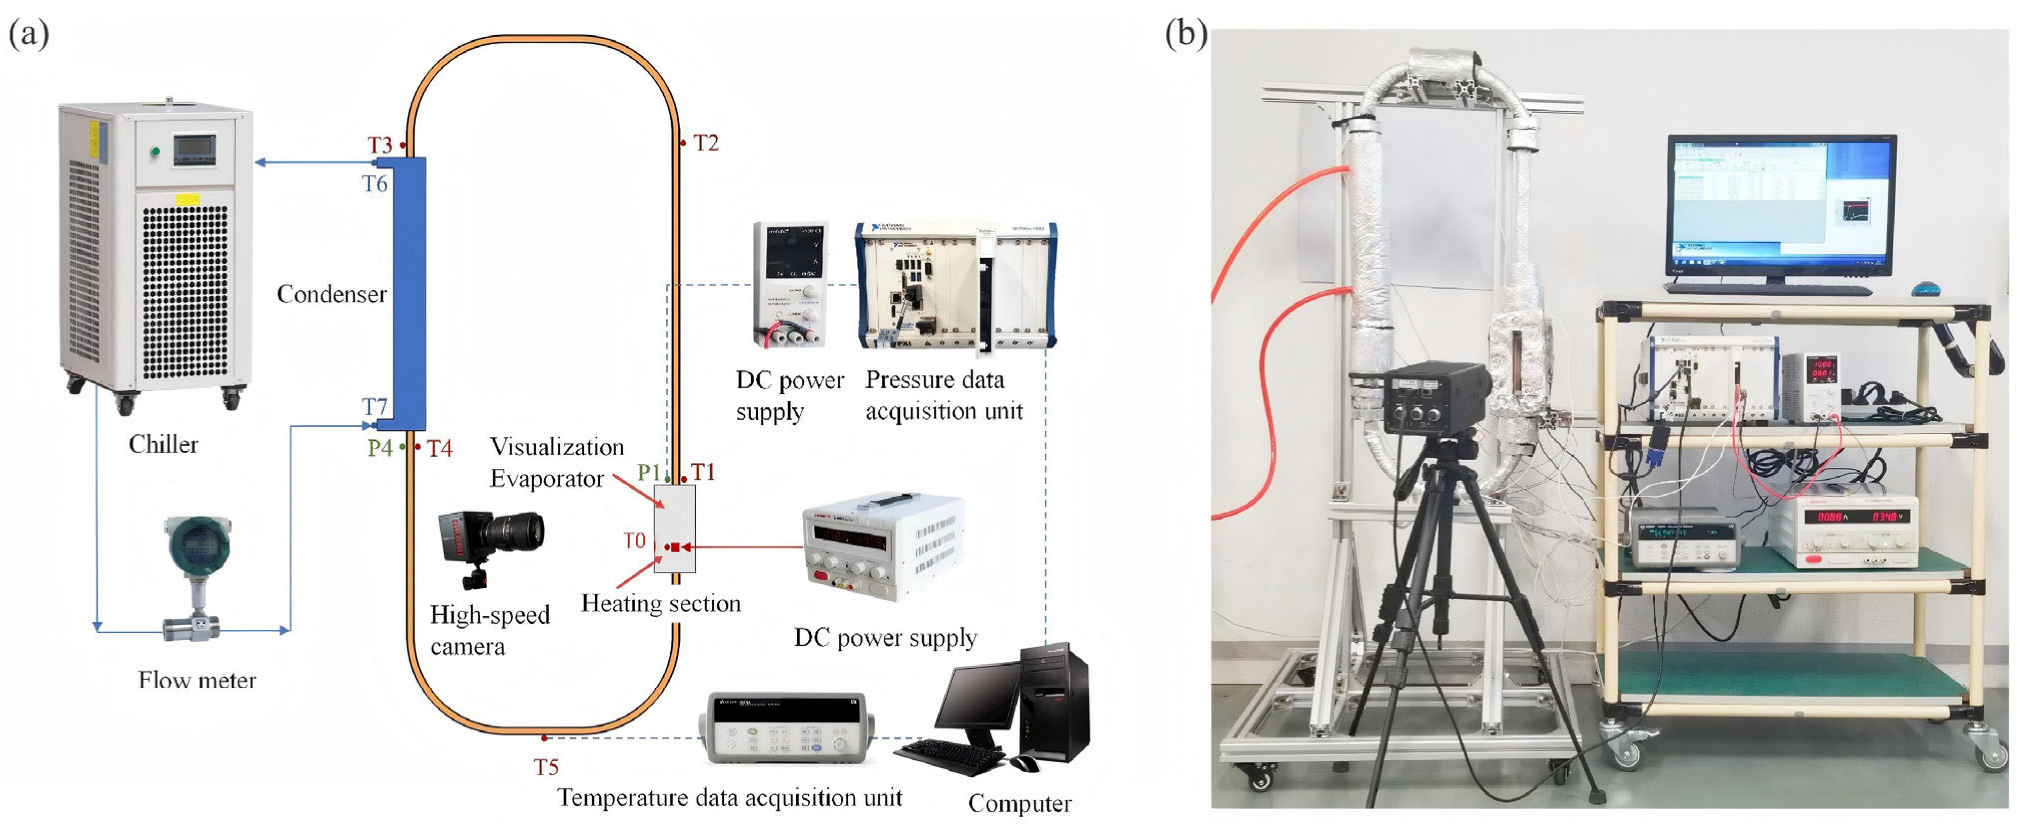
A schematic diagram of the experimental system is shown in Figure 1a, and a photograph of the physical setup is presented in Figure 1b. The experimental system primarily consists of the TPLT, a heating system, a cooling system, a visualization and image acquisition system, and temperature and pressure measurement systems. The heating system comprises a heating block, electric cartridge heaters, and a DC power supply. The heater material is copper, welded to the base plate, and externally insulated with adiabatic asbestos to minimize heat loss to the environment. The cooling system consists of a constant temperature chiller, a circulating water pump, and a flow meter. To investigate the influence of cooling conditions on the heat transfer performance of the two-phase thermosyphon loop, cooling water at different temperatures (8 °C, 13 °C, and 18 °C) was used at a flow rate of 1.5 L/min. The temperature acquisition system includes thermocouples and an Agilent 34972A data acquisition unit. A PXIe-1082 data acquisition instrument equipped with a TB-4309 acquisition board is used for pressure measurements, with a Kulite XTEL-190LM-35BarA pressure sensor. The pressure acquisition frequency is 1000 Hz. Both pressure sensors and thermocouples are sealed using M5 threads. The visualization system comprises a FASTCAM Mini AX200 high-speed camera and a Jinbei EF-150LED photographic lamp. The FASTCAM Mini AX200 high-speed camera can capture grayscale images, supporting up to 6400 fps at 1024 × 1024 pixels and up to 20,000 fps at 640 × 480 pixels. In this study, the shooting resolution was set to 1024 × 1024 pixels with a frame rate of 3000 fps. The camera was positioned in front of the evaporation section, shooting vertically toward the evaporation section. All images are original and have not been processed.

2.2. Visualizable Evaporator Loop Test Section

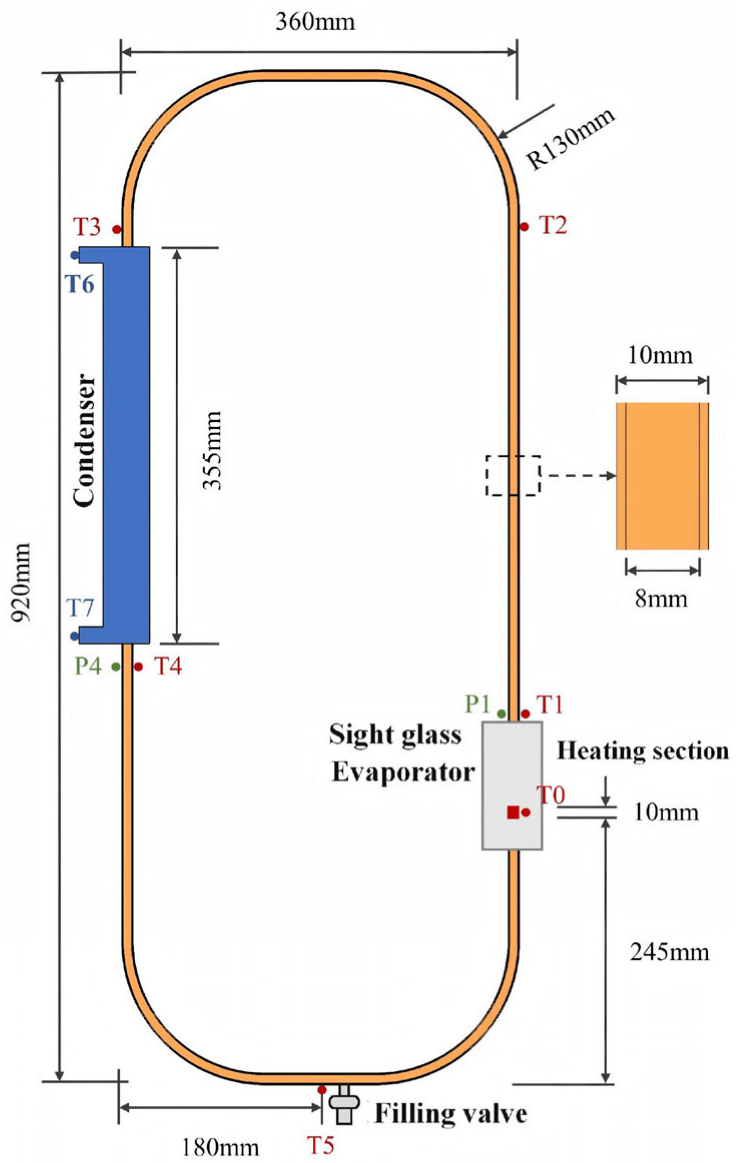
The two-phase loop thermosyphon in the present experiment is mainly composed of a visualized evaporator, a riser, a condenser, a cooling water jacket, and a downcomer, forming a closed natural circulation loop. The working fluid used inside the loop is R134a. Detailed dimensions are provided in Figure 2. Eight thermocouples are arranged along the loop: at the heating surface (T0), evaporator outlet (T1), riser (T2), condenser inlet (T3), condenser outlet (T4), downcomer (T5), and cooling water jacket inlet/outlet (T6, T7). Pressure sensors (P1, P4) are installed at the evaporator outlet and condenser outlet, respectively. To investigate the phase-change heat transfer characteristics of a two-phase loop thermosyphon with a high filling ratio in greater detail, the conventional high filling ratio range (>50%) was further refined. Based on the phase-change heat transfer and flow characteristics, the filling ratio is classified into three types:
Low filling ratio (≤50%): The loop is prone to dryout, with low heat flux.
Medium-high filling ratio (50–80%): As the heat flux increases, the loop experiences two stages: flow boiling and intermittent boiling.
High filling ratio (80–100%): As the heat flux increases, the loop undergoes three stages: flow boiling, intermittent boiling, and then flow boiling again, accompanied by a relatively high heat flux.
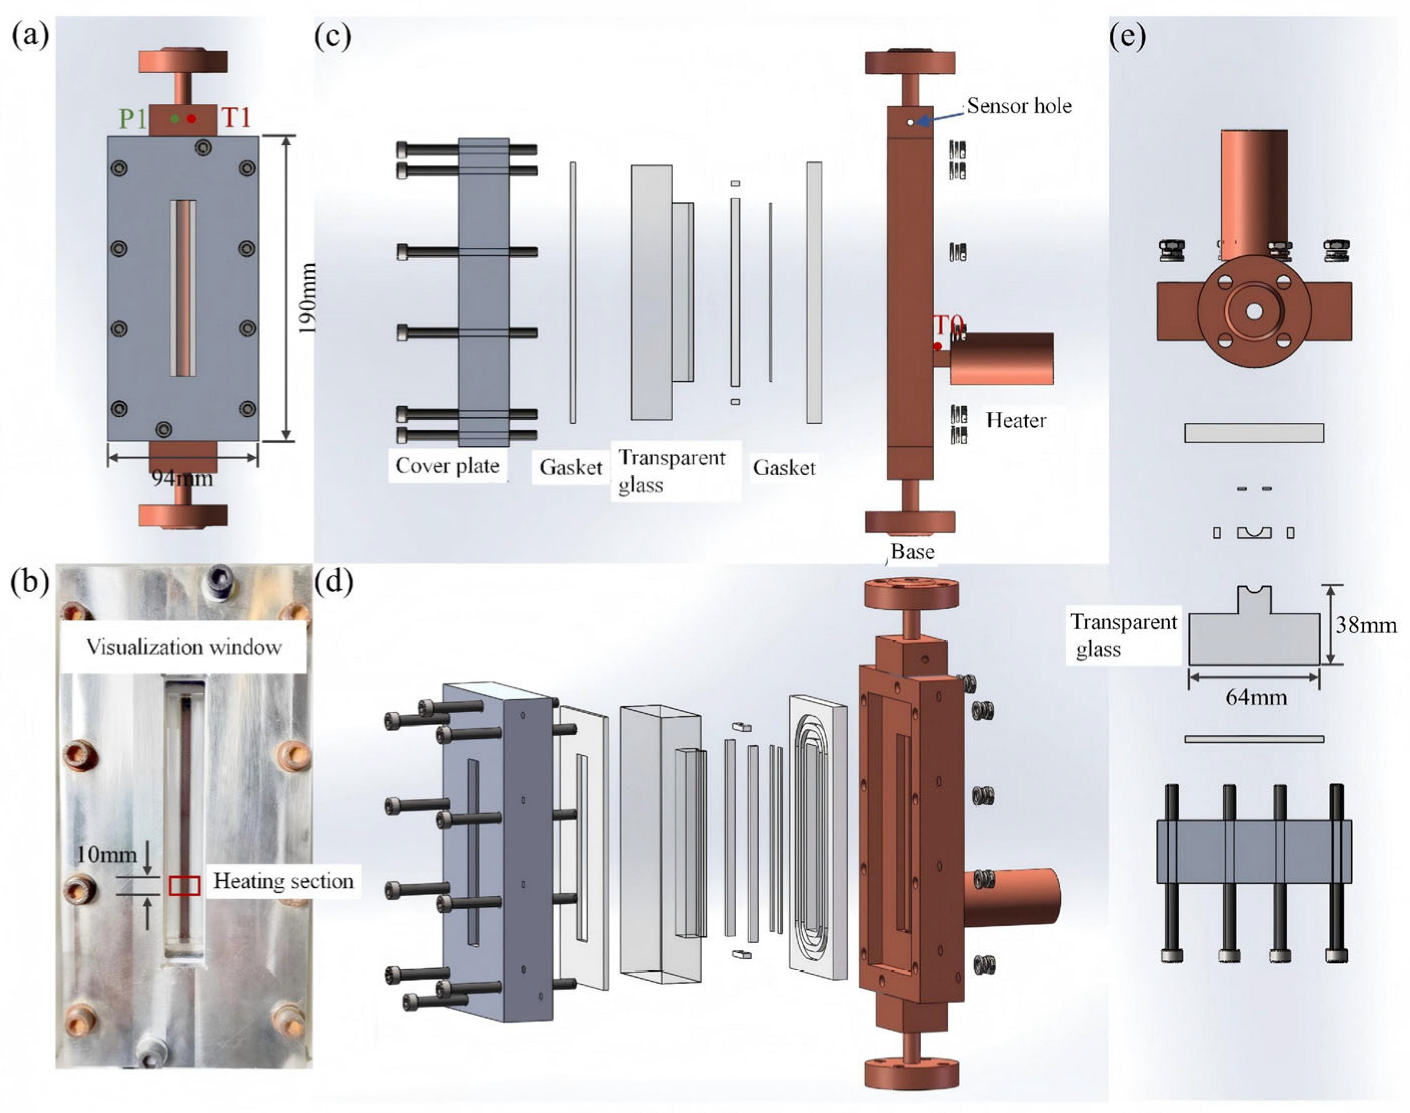
The structure of the visualizable evaporator is illustrated in Figure 3. It consists of a stainless steel cover plate, gaskets, transparent quartz glass, and a base, sealed using gaskets, bolts, and nuts. The overall evaporator length is 190 mm, with a width of 94 mm and a viewing window length of 110 mm. To ensure a consistent internal diameter with the loop flow channel, semi-circular grooves with an 8 mm diameter are machined into both the base and the quartz glass, forming a circular channel of 8 mm diameter for the working fluid when assembled. PTFE gaskets are placed at all contact interfaces between the quartz glass and the base to provide sealing and protection against glass fracture due to pressure-induced deformation. The visualizable evaporator can withstand pressures up to 5 MPa. The heater is welded to the base of the evaporator, allowing observation of bubble behavior and flow pattern changes within the heating section through the visualization window. The cross-section of the heater is 10 × 10 mm. The upper and lower ends of the visualizable evaporator are connected to the loop piping via flanges.

2.3. Experimental Operation

The experiment was set up as follows:
(1)
Evacuation of the two-phase loop thermosyphon. A high vacuum inside the TPLT system is essential for its normal operation, as it minimizes non-condensable gases and ensures proper phase-change heat transfer of the working fluid. In this study, a self-built high-vacuum automatic charging device was used to achieve an absolute vacuum of 0.05 Pa inside the TPLT.
(2)
Charging of the working fluid. The working fluid was charged using the same device at a pressure of 1.8 MPa. The filling amount was controlled by an electromagnetic valve and a flowmeter integrated into the system.
(3)
Experimental setup. An experimental platform was established, consisting of the TPLT system, a heating system, a cooling system, and a data acquisition system.
The experimental procedure was conducted as follows:
(1)
The cooling water parameters were adjusted to maintain continuous circulation of cooling water through the condenser. This condition was held for approximately 40 min to achieve a uniform initial temperature of the test specimen.
(2)
The data acquisition unit was turned on to start recording experimental data.
(3)
The heat input power was adjusted and maintained for a sufficient duration to allow the TPLT to operate under a stable heating power.
(4)
Temperatures at all measuring points were monitored via the data acquisition system. The TPLT system was considered to have reached steady state when the temperature fluctuations at all points did not exceed ±0.5 °C within a 5 min period. Then, the experimental parameters were adjusted for the next condition.
Steps (2) through (4) were repeated to obtain temperature data at different heating powers. After that, the experimental conditions were changed, and steps (1) through (4) were repeated to complete the acquisition of TPLT experimental data.

2.4. Error Analysis

Qin and Qout represent the input and output heat transfer rates of the system, respectively, calculated using the following equations:
Q in = k A d T d x
Q out = C p , l i q u i d m ˙ Δ T
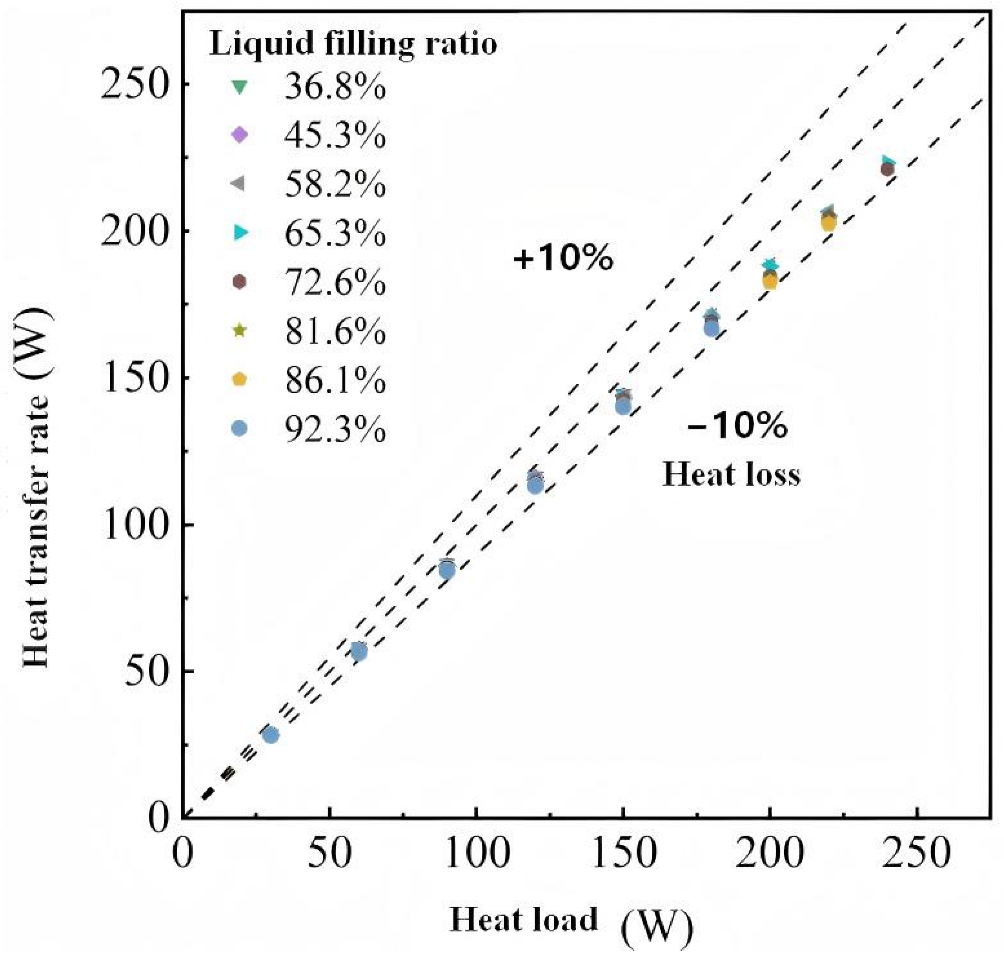
where k is the thermal conductivity of the heating block, A is the cross-sectional area of the heating block, dT/dx is the temperature gradient within the heating block, Cp,liquid is the isobaric specific heat capacity of water, m ˙ is the mass flow rate of water, and ΔT is the temperature difference of the cooling water. The relationship between heat output and heat input for different filling ratios in the TPLT is shown in Figure 4. The centerline represents the ideal state with no heat loss; greater deviation from this line indicates larger heat losses. The thermal loss of the TPLT is within 10% of the total heat load, indicating minimal heat loss from the loop system and an acceptable margin of error.
Good temperature uniformity ensures the stability and reliability of heat transfer and is a crucial metric for evaluating the heat transfer capability of a TPLT. In this study, a non-uniformity coefficient η is used to characterize temperature uniformity. A smaller η value indicates better uniformity. The expression is
η = ( Δ T ) m a x T ¯
where ( Δ T ) m a x is the maximum temperature difference across the loop and T ¯ = 1 N i = 1 N T i is the average value of the temperature measurement points on the loop.
Thermal resistance is a key parameter for evaluating the heat transfer capability of a TPLT and is calculated as follows:
R e v a = T s u r f a c e T e v a , o u t Q
R c o n = T c o n , i n T c o n , o u t Q
R l o o p = T s u r f a c e T c o n , o u t Q
where Reva is the evaporator thermal resistance, Rcon is the condenser thermal resistance, and Rloop is the overall loop thermal resistance. Tsurface is the heating surface temperature, Teva,out is the evaporator outlet temperature, Tcon,in is the condenser inlet temperature, Tcon,out is the condenser outlet temperature, and Q is the heating power.
A standard error analysis method was employed to evaluate the uncertainty of the experimental parameters.
The corresponding calculation equation is given below:
S T = i = 1 n ( T i T ¯ ) 2 n
where T i and T ¯ are the temperature and average temperature, respectively, within 5 min after the system reaches steady state under a certain working condition, °C.
The uncertainties of the main experimental parameters are shown in Table 2.

3. Results and Discussion

3.1. Loop Temperature Characteristics Under Different Filling Ratios

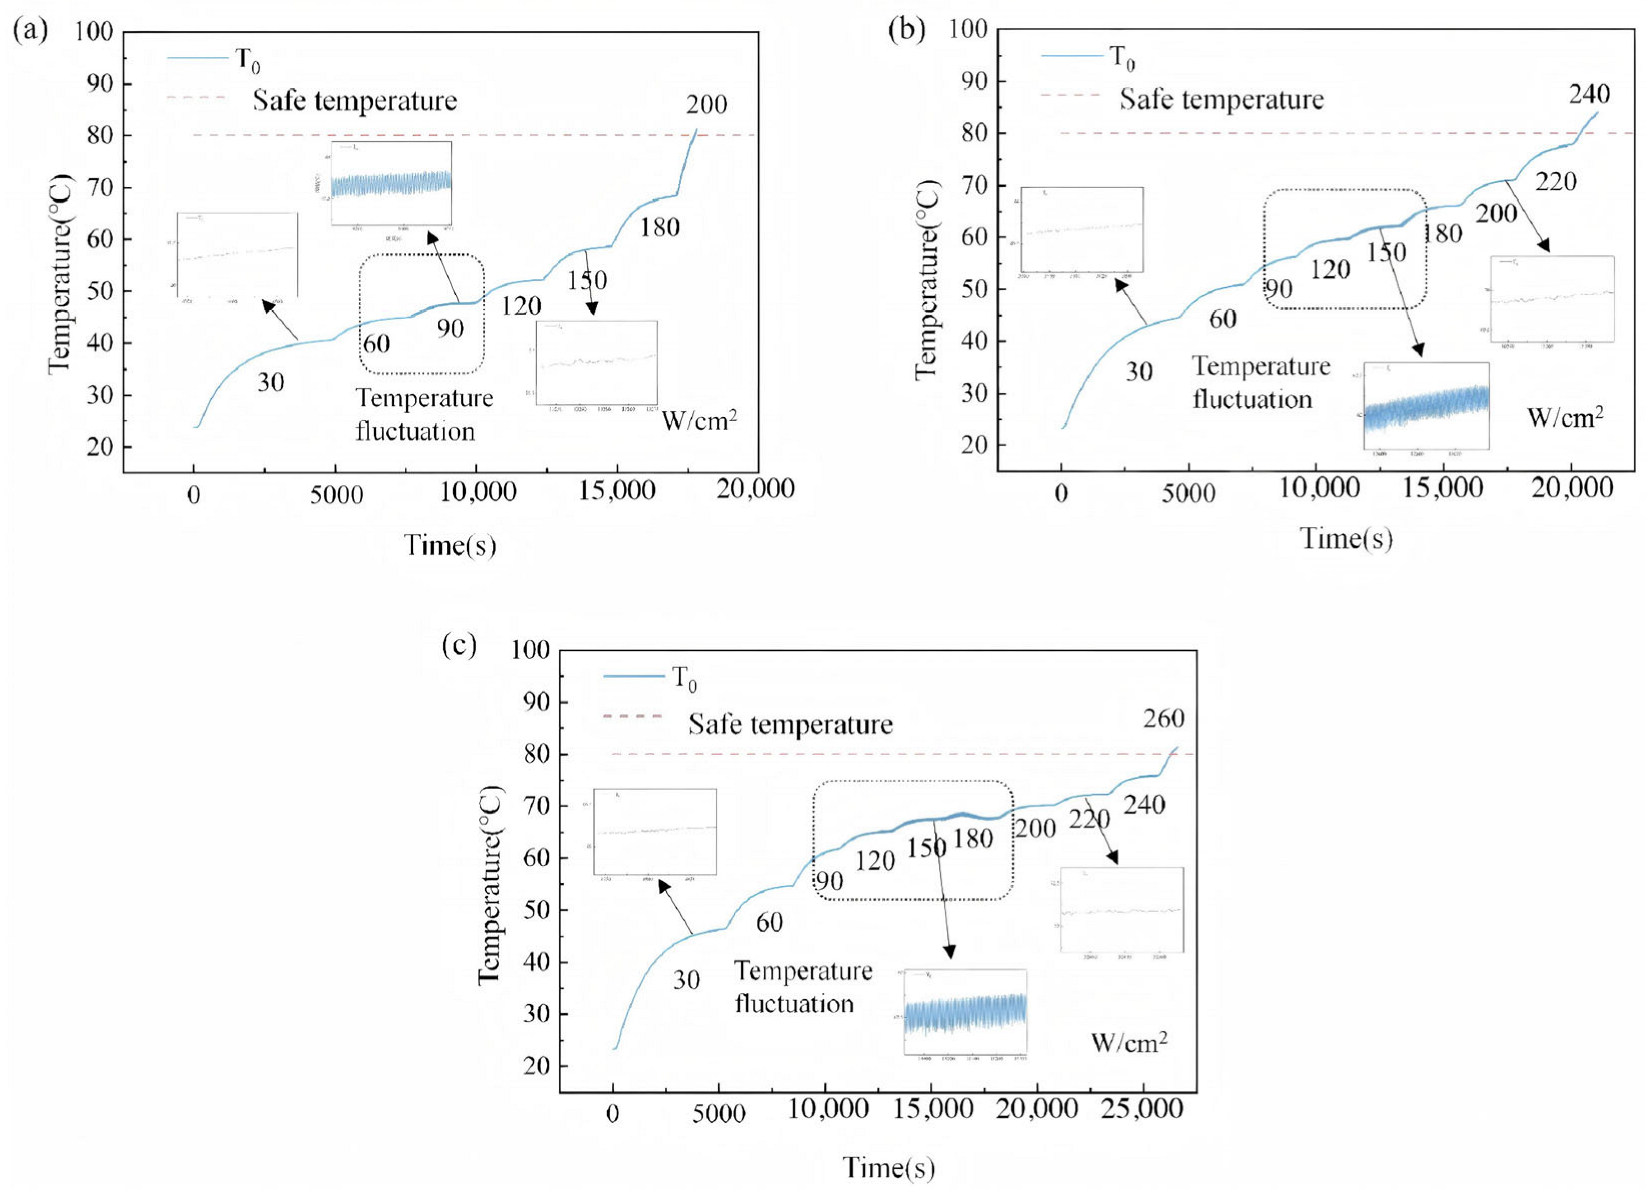
The variation of heating surface temperature with heat flux under high filling ratio conditions is shown in Figure 5. For all three filling ratios, the heating surface temperature exhibited a consistent trend, increasing gradually with rising heat flux. At a filling ratio of 92.3%, the temperature increased slowly under low heat flux. Temperature fluctuations were observed in the range of 60–90 W/cm2, indicating the occurrence of heat transfer instability. The fluctuations ceased when the heat flux exceeded 120 W/cm2, signifying another change in heat transfer state. Above 150 W/cm2, the temperature increase rate accelerated markedly, exceeding the safe operating temperature for electronic devices (80 °C) at 200 W/cm2. The maximum heat flux within the safe temperature range was 180 W/cm2.
At a filling ratio of 86.1%, the temperature rose more rapidly at low heat fluxes. The onset of temperature fluctuations was delayed to 90 W/cm2, and the fluctuation range extended to 90–150 W/cm2. Fluctuations disappeared at heat fluxes above 180 W/cm2, and the maximum heat flux within the safe temperature range increased to 220 W/cm2. At a filling ratio of 81.6%, the fluctuation range further shifted to 90–180 W/cm2, disappearing above 200 W/cm2. The maximum safe heat flux reached 240 W/cm2.
Overall, under high filling ratios, the heating surface temperature exhibited three distinct phases: “no fluctuation–fluctuation–no fluctuation”, indicating three transitions in the internal heat transfer and flow state.
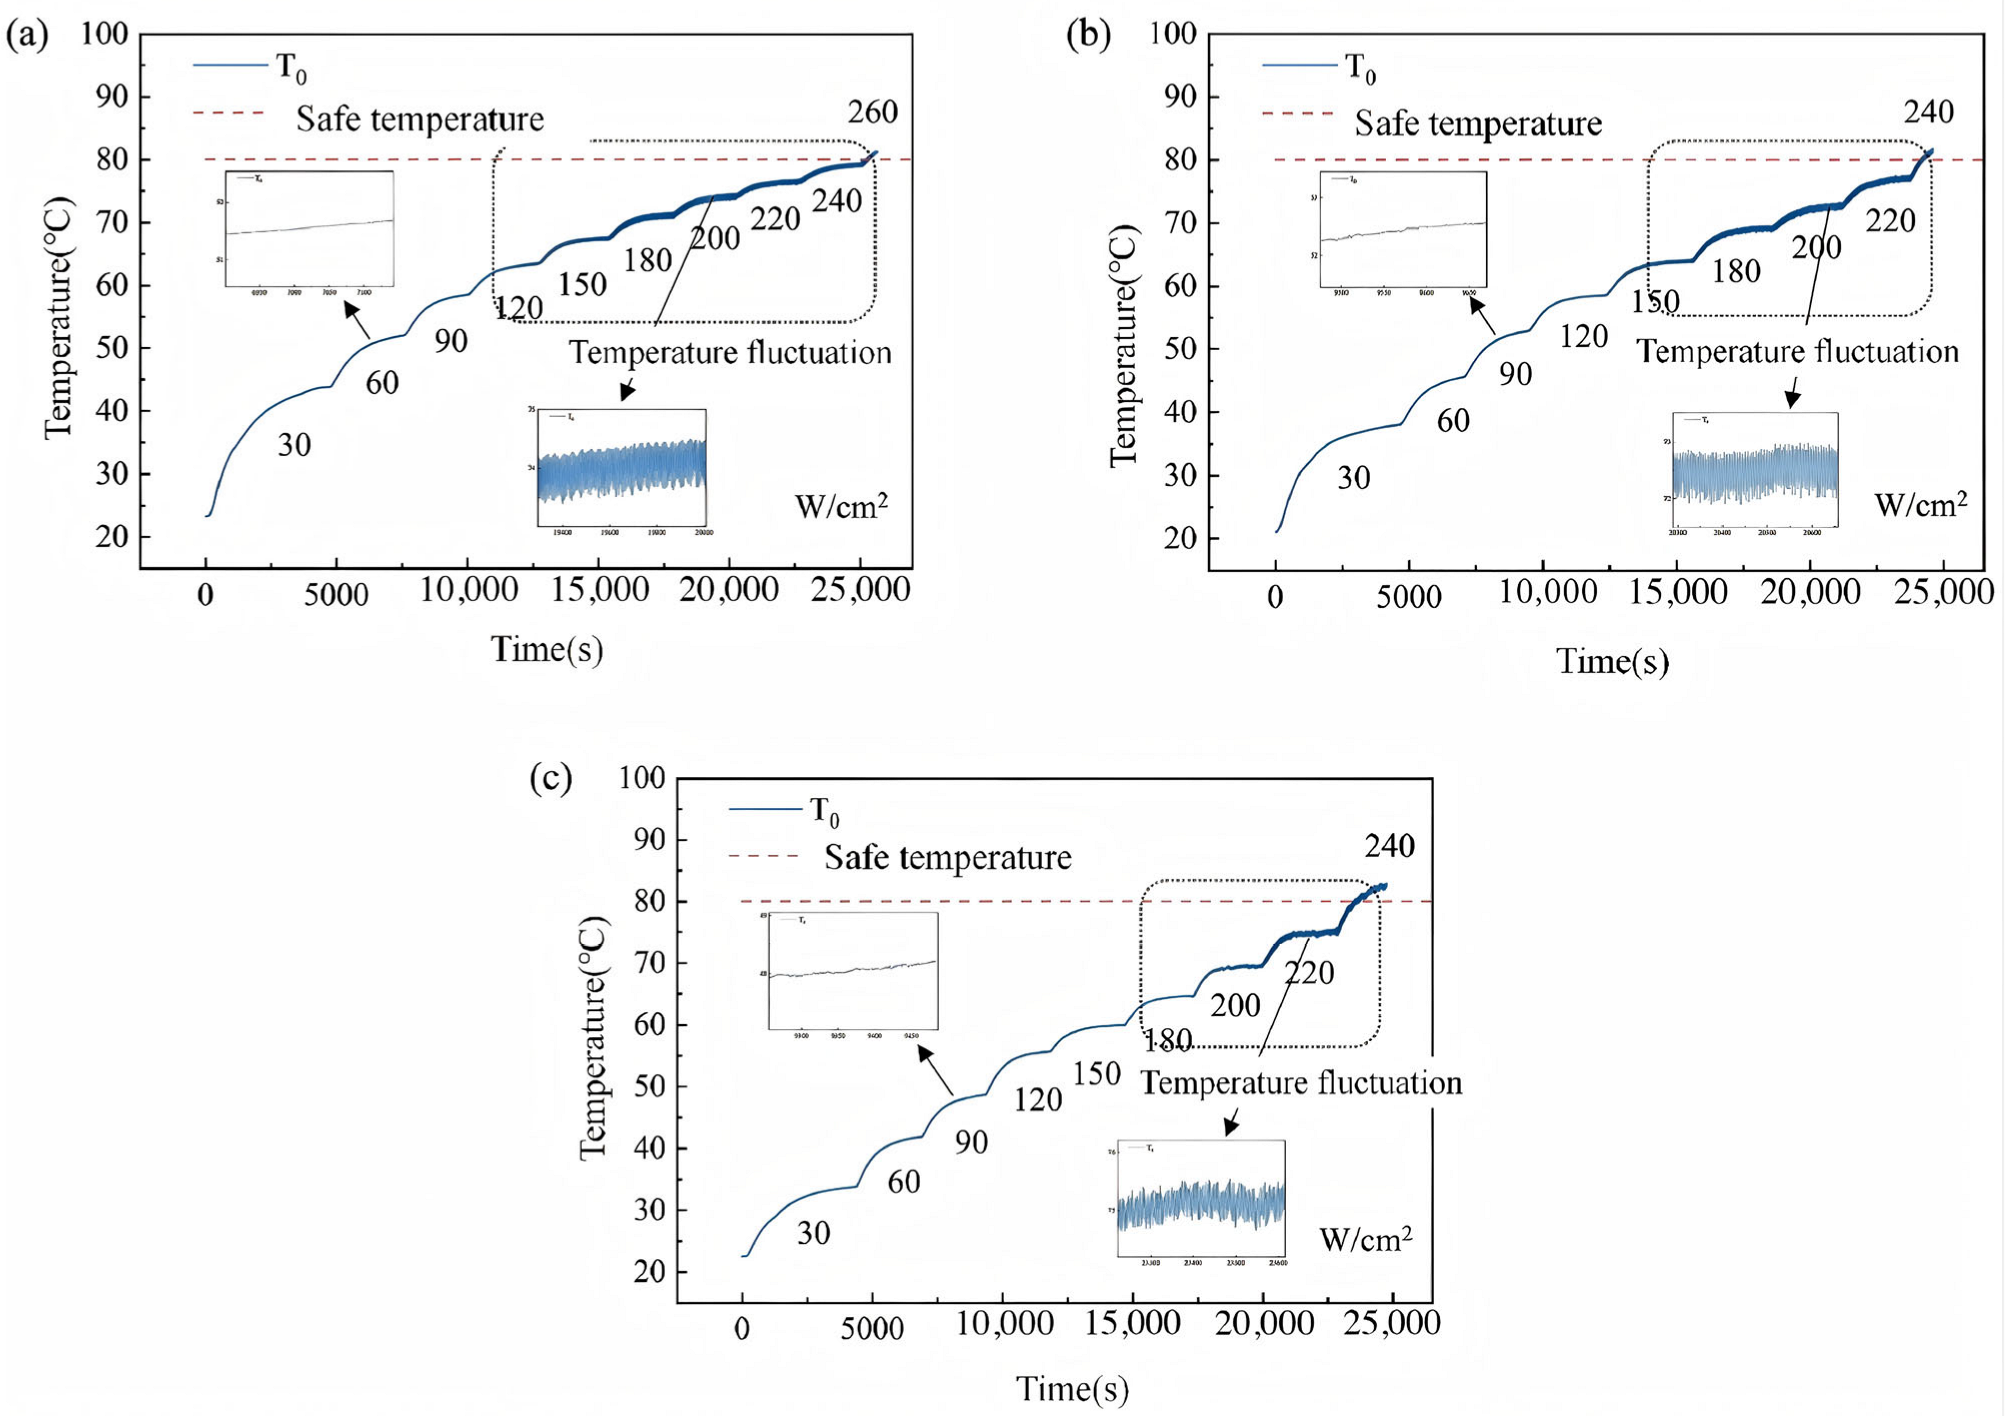
Temperature variations under medium-high filling ratio conditions are depicted in Figure 6. At a filling ratio of 72.6%, the temperature increased rapidly at low heat fluxes (30–90 W/cm2) without fluctuations. Fluctuations commenced at 120 W/cm2 and persisted, intensifying with increasing heat flux. Unlike the high filling ratio case, the fluctuations did not cease at high heat fluxes. At a filling ratio of 65.3%, the onset of fluctuation was delayed to 150 W/cm2, but fluctuations similarly persisted. The maximum safe heat flux was 220 W/cm2. At a filling ratio of 58.2%, no fluctuations occurred in the 30–150 W/cm2 range, with the onset delayed to 180 W/cm2, and the maximum safe heat flux remained 220 W/cm2.
Under medium-high filling ratios, only two phases were observed: “no fluctuation–fluctuation”. Heat transfer instability persisted at high heat fluxes, differing significantly from the high filling ratio behavior.
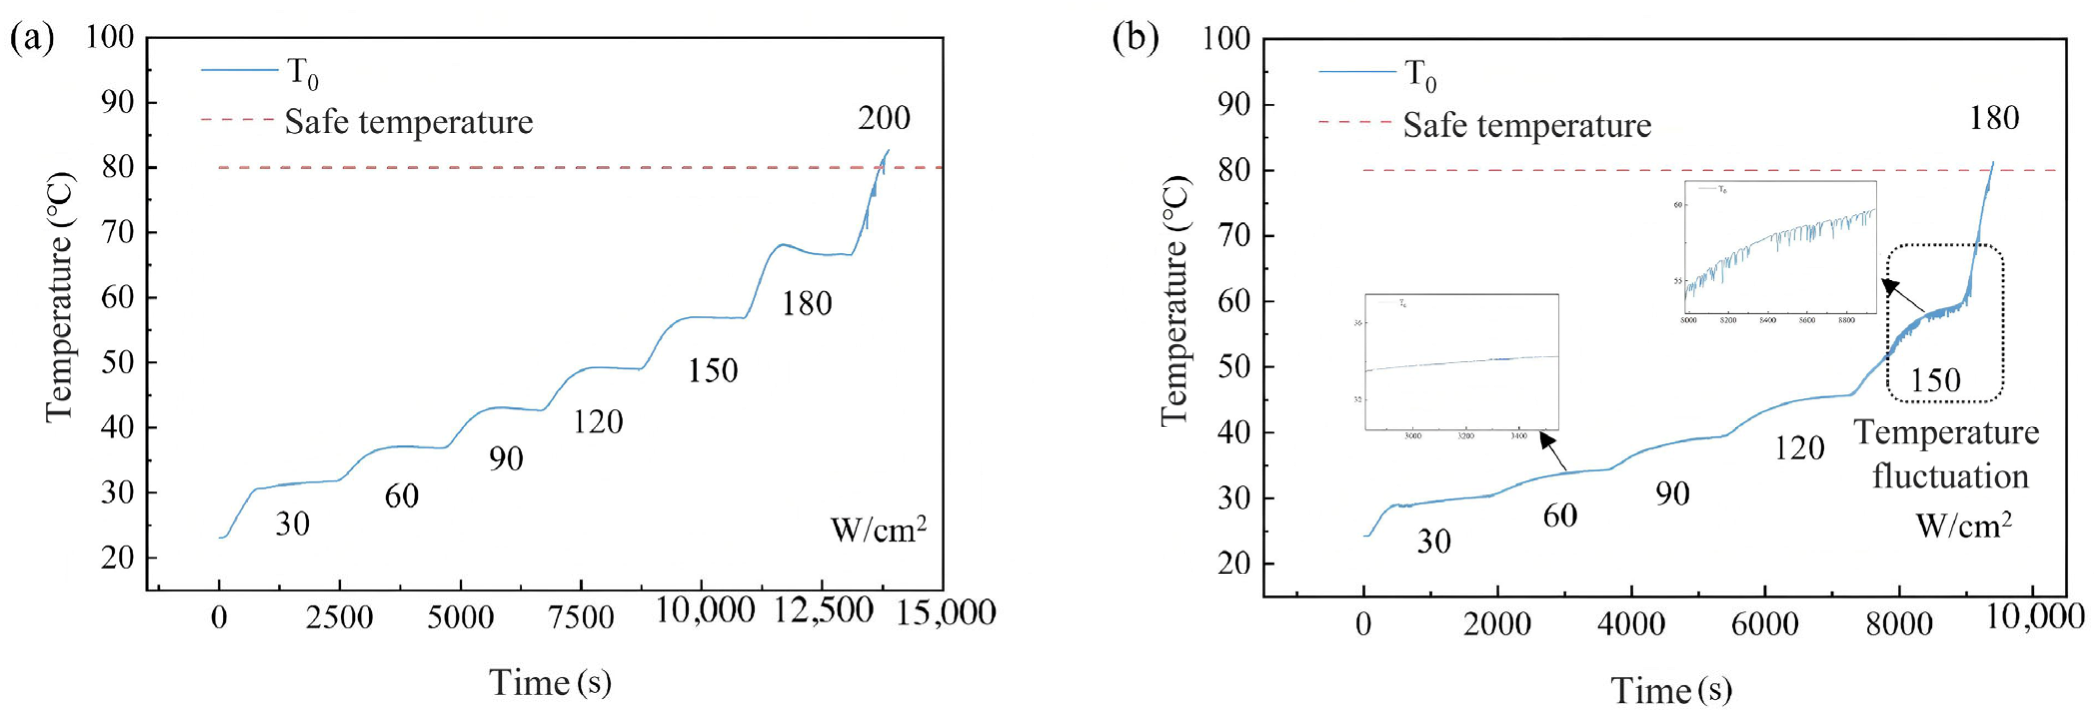
Temperature variations under low filling ratio conditions are presented in Figure 7. At a filling ratio of 45.3%, the heating surface temperature at low heat fluxes was notably lower than that under medium-high filling ratios. No fluctuations occurred between 30 and 180 W/cm2, with a maximum safe heat flux of 180 W/cm2. At a filling ratio of 36.8%, the temperature rose sharply and exhibited slight fluctuations above 150 W/cm2, though the peak-to-valley differences were indistinct. The maximum safe heat flux decreased to 150 W/cm2.
The temperature variation patterns on the heating surface indicate that the phase-change heat transfer and flow characteristics of the TPLT under low filling ratios differ from those under high filling ratios, particularly at elevated heat fluxes. Furthermore, the maximum heat flux achievable within the safe temperature range for electronic devices is lower under low filling ratios compared to high filling ratios.

3.2. Visualized Flow Pattern Analysis in the Heating Section Under Different Filling Ratio

In a two-phase loop thermosyphon, the flow pattern inside the evaporator directly affects the wall wetting state, local heat transfer coefficient, and critical heat flux. Compared with indirect measurement methods such as pressure drop fluctuation or conductivity probes, high-speed visualization provides the most intuitive and realistic spatiotemporal evolution information, especially suitable for identifying transient flow pattern transitions and capturing the onset of dryout. By observing the flow morphology, the current flow pattern can be determined. Some common flow patterns include the following:
  • Bubbly flow: Numerous small bubbles are dispersed in a continuous liquid phase. The bubble sizes are much smaller than the inner diameter of the pipe, and the bubbles vary in size and shape.
  • Slug flow: As the void fraction increases, bubbles approach each other, collide, and coalesce into larger bubbles, eventually forming bubbles that are nearly the size of the pipe diameter. These large bubbles have a shape similar to a bullet with a hemispherical head and a flat tail. The large bubbles are separated by liquid slugs that contain small bubbles.
  • Churn flow: As the gas phase velocity increases, adjacent Taylor bubbles begin to merge, and the surrounding liquid exhibits a stirred or chaotic motion. The flow takes on an irregular shape and oscillates up and down, but the net flow is still upward.
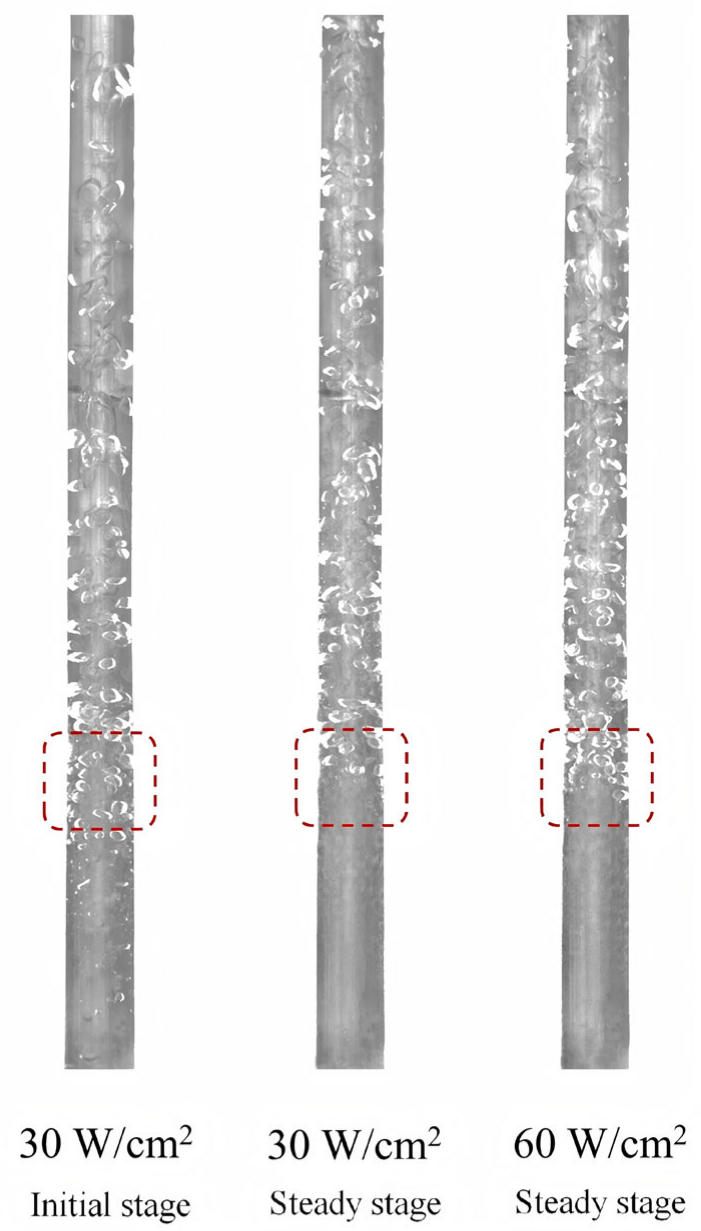
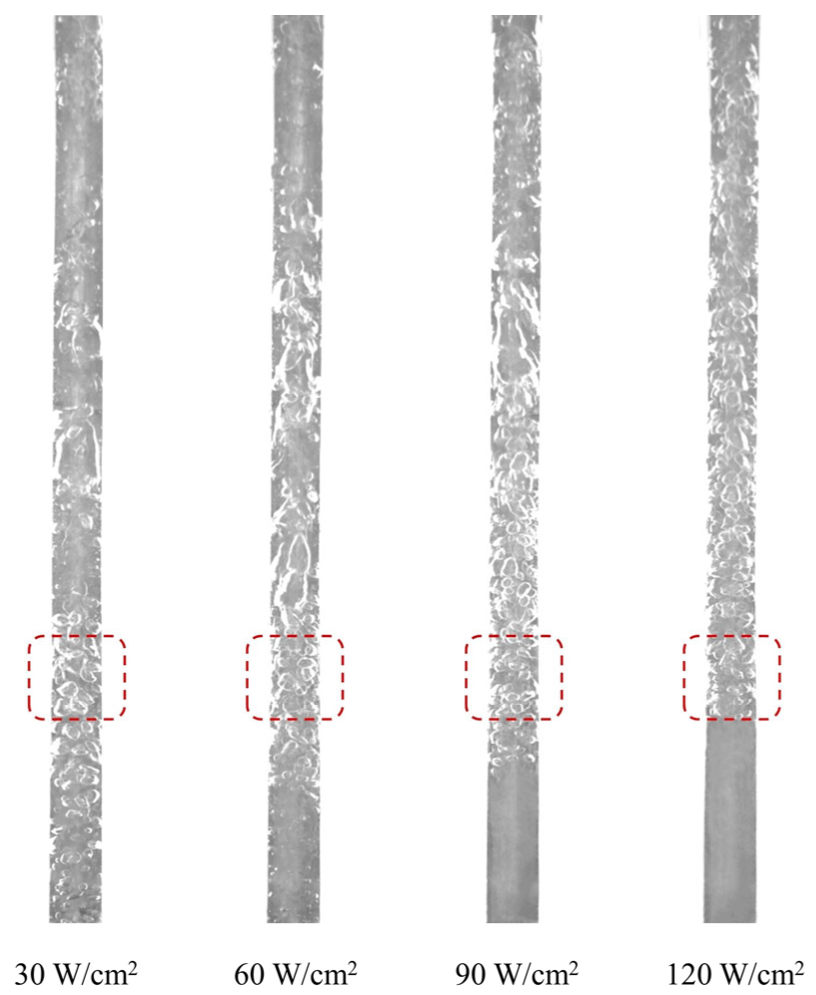
At a filling ratio of 81.6%, the variation of the two-phase flow pattern inside the evaporator with increasing heat flux is illustrated in Figure 8 (the red region denotes the heating section). At a heat flux of 30 W/cm2, bubbles began to form once the evaporator section reached saturation.
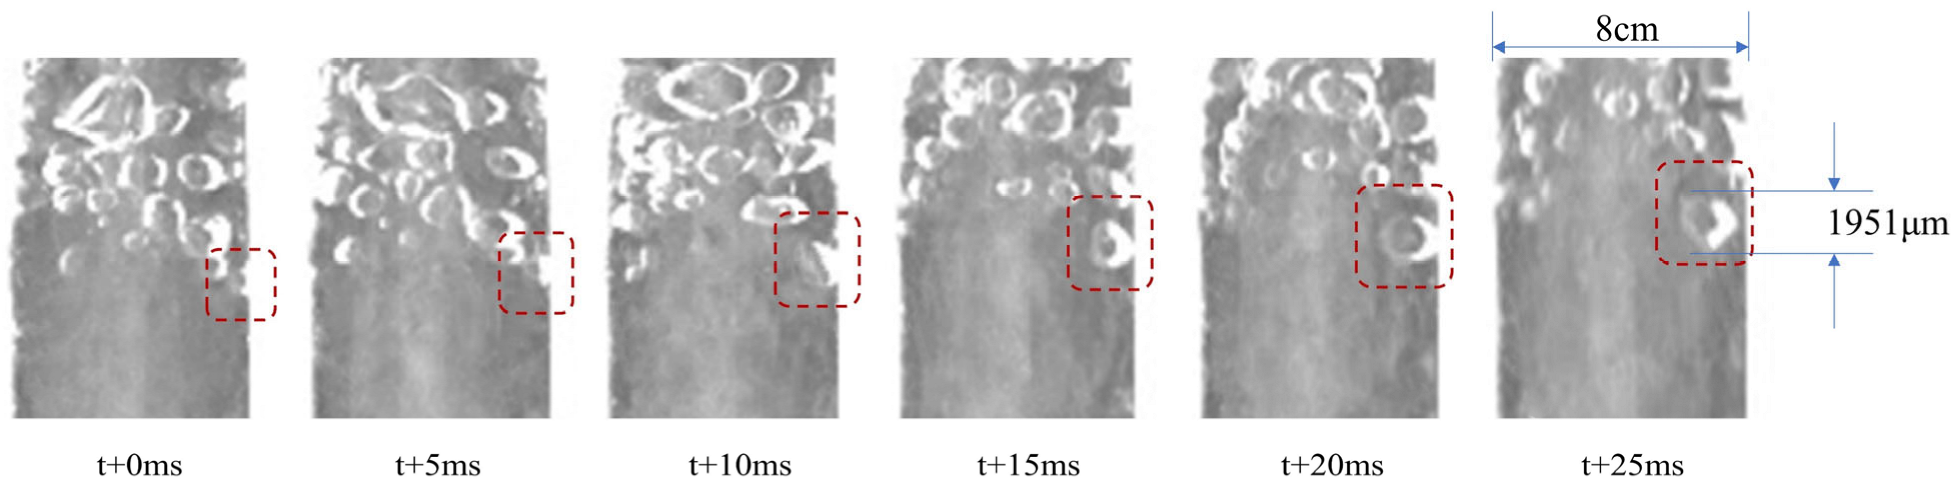
Figure 9 depicts the bubble growth and detachment process on the heating section wall at 60 W/cm2. Bubbles nucleated and grew on the wall, initially unable to detach due to dominant surface tension and expansion resistance. As buoyancy and internal pressure increased, the bubble completed growth and detachment within approximately 25 ms, with a detachment size of around 2 mm.
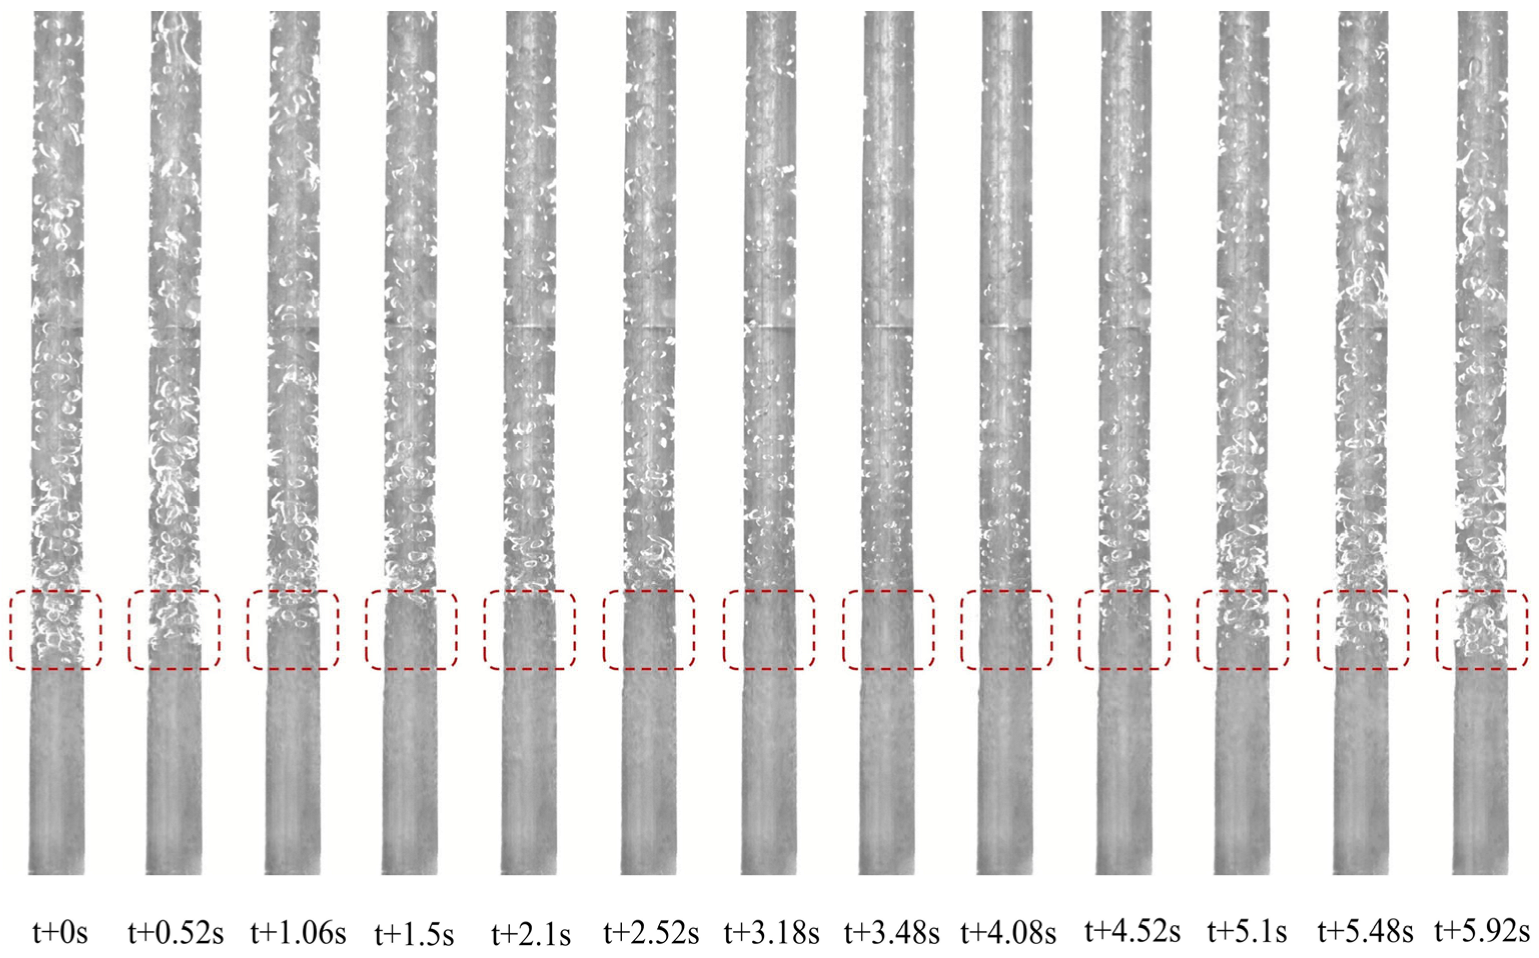
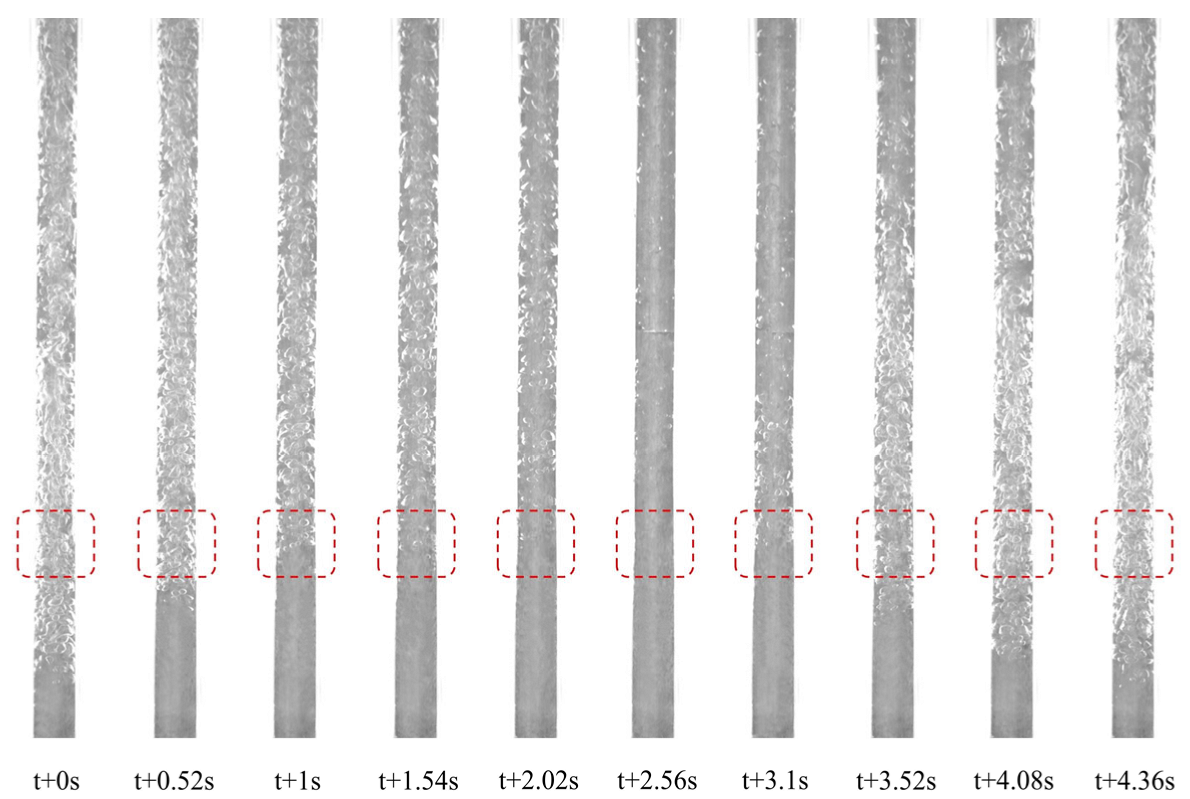
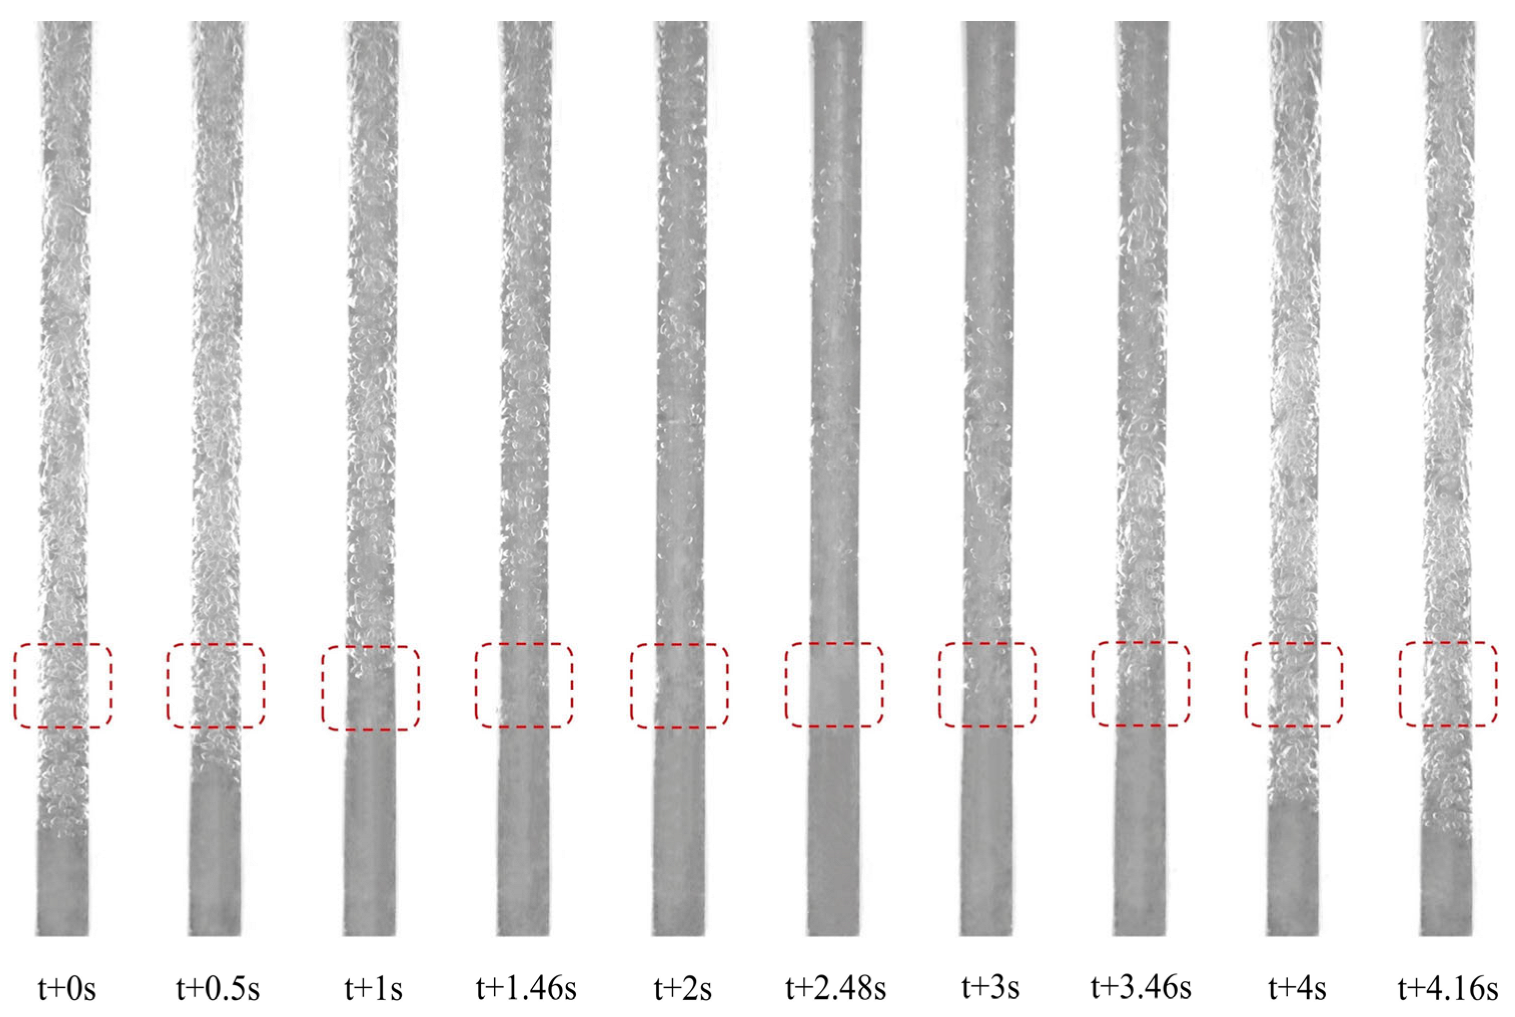
When the heat flux reached 90 W/cm2 (Figure 10), two-phase flow instability emerged within the heating section. Initially, bubble population increased, with bubbles appearing in the inlet and mainstream regions, indicating a transition of the working fluid from subcooled to saturated conditions. Subsequently, subcooled liquid entered the lower section, reducing bubble content and weakening boiling, even resulting in single-phase flow (t + 3.48 s). Thereafter, bubbles reappeared, and the flow pattern reverted to bubbly flow (t + 5.92 s). The entire process exhibited a periodic variation of bubbly flow–single-phase flow–bubbly flow, characteristic of intermittent boiling. The transition from saturated boiling to single-phase flow took approximately 3.48 s, while the reverse transition took about 2.44 s.
At a heat flux of 120 W/cm2 (Figure 11), the flow pattern evolution was similar, but the single-cycle duration shortened to 5.54 s (a decrease of 0.38 s compared to 90 W/cm2). The duration from bubbly flow to single-phase flow remained relatively stable at 3.42 s, whereas the time from single-phase flow back to bubbly flow notably decreased to 2.12 s, attributable to the accelerated phase change driven by the higher heat flux. Additionally, bubble size decreased due to the shortened boiling period limiting bubble growth.
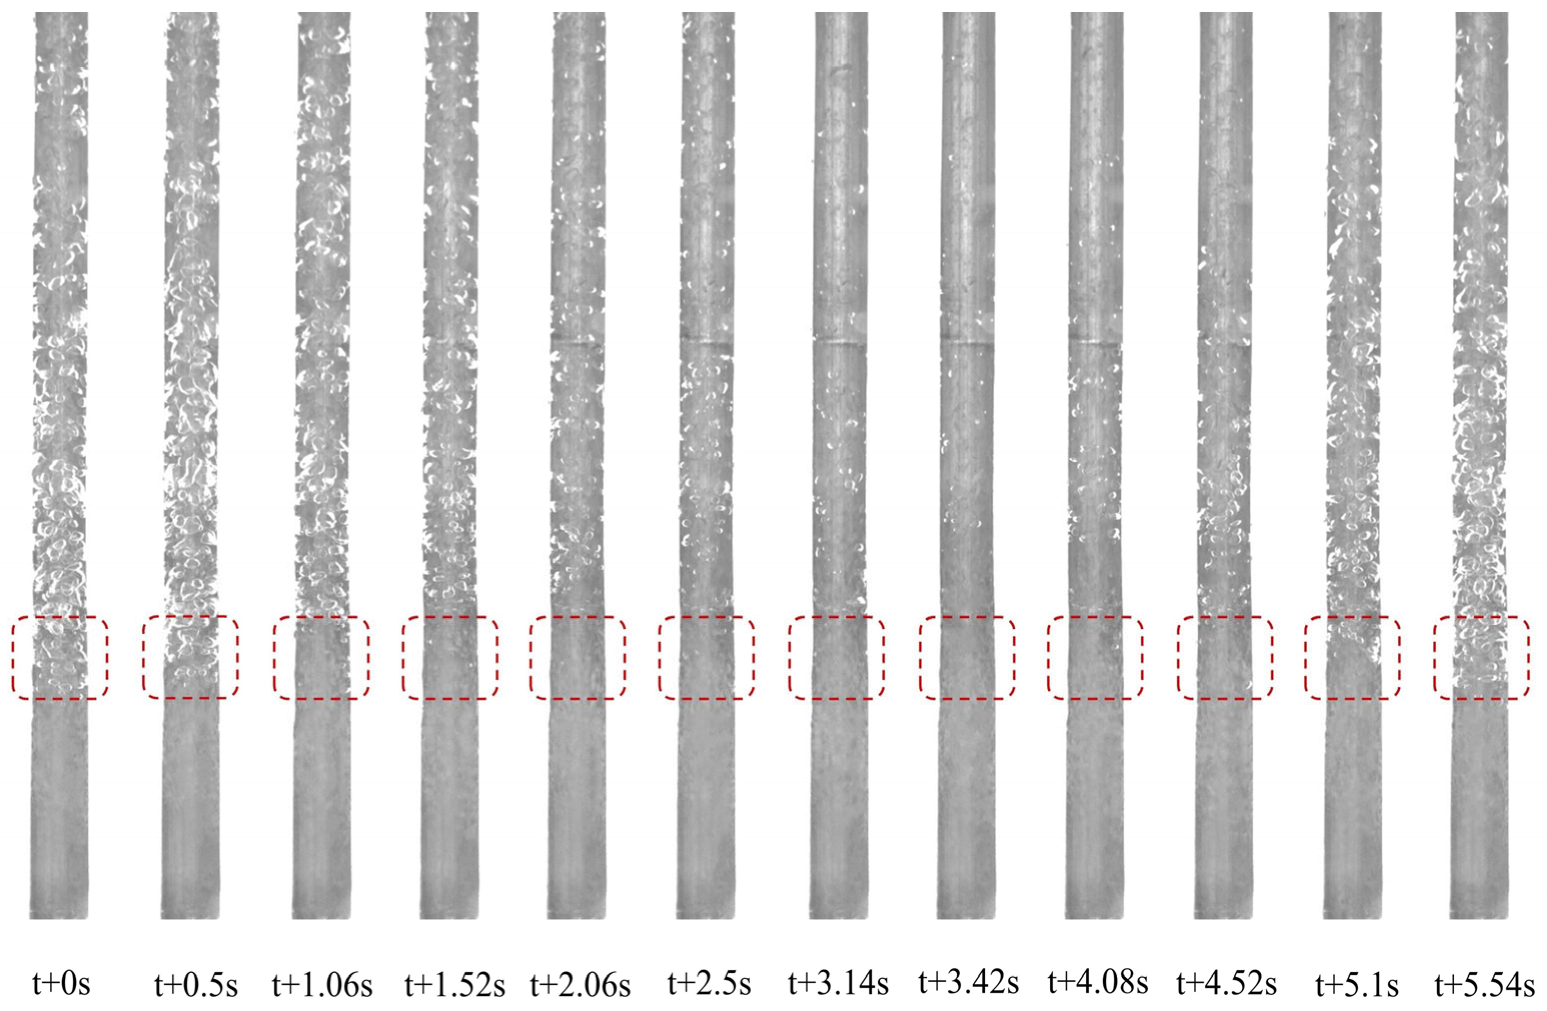
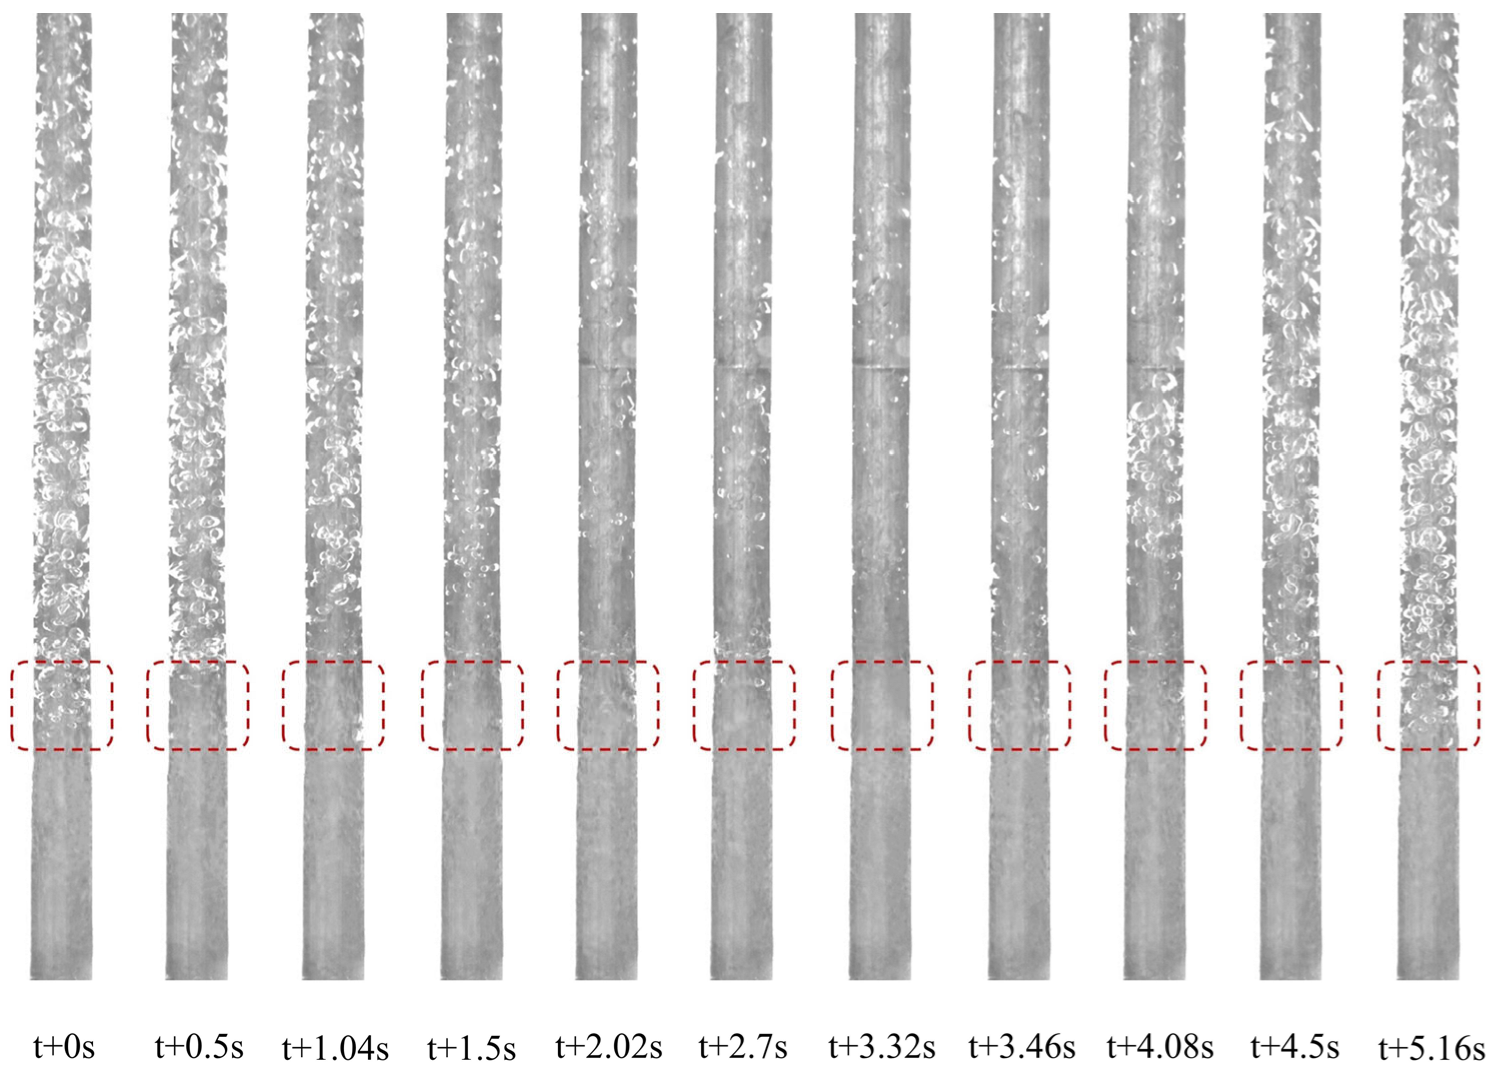
At a heat flux of 150 W/cm2 (Figure 12), the intermittent boiling period further decreased to 5.16 s. The time from bubbly flow to single-phase flow reduced to 3.32 s, and the time from single-phase to bubbly flow shortened to 1.84 s, accompanied by a continued reduction in bubble size.
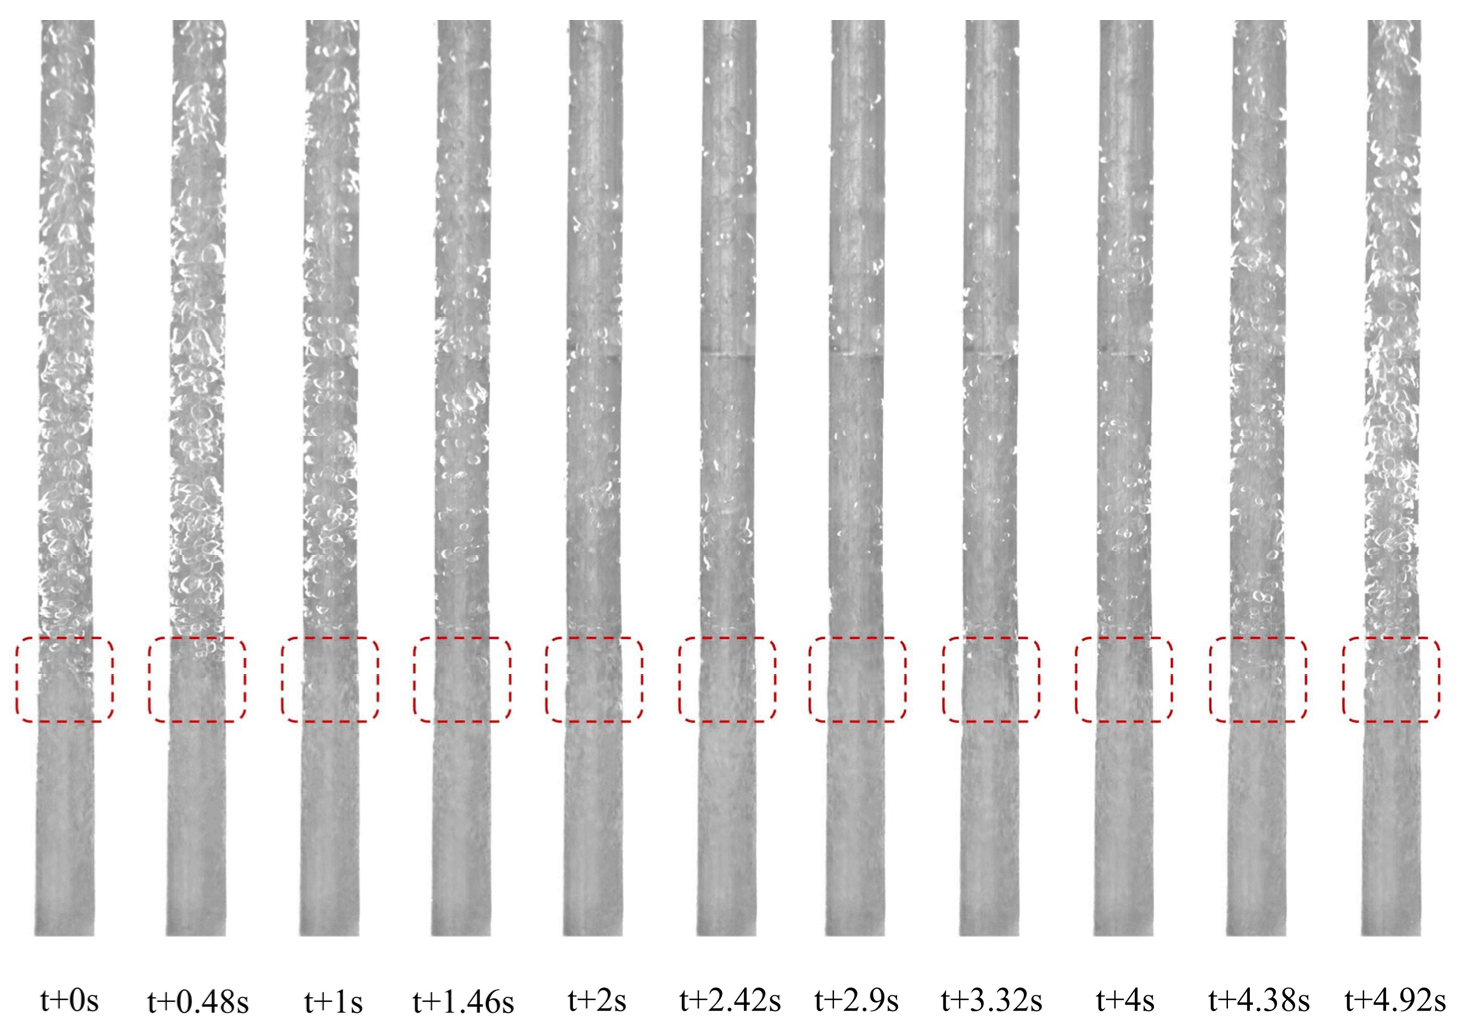
At a heat flux of 180 W/cm2 (Figure 13), intermittent boiling persisted, but bubbles vanished at the evaporator inlet, and the bubble population in the mainstream region decreased. The working fluid transitioned from saturated to subcooled state, shifting the boiling mode to subcooled intermittent boiling. The cycle period further reduced to 4.92 s, with smaller bubble sizes.
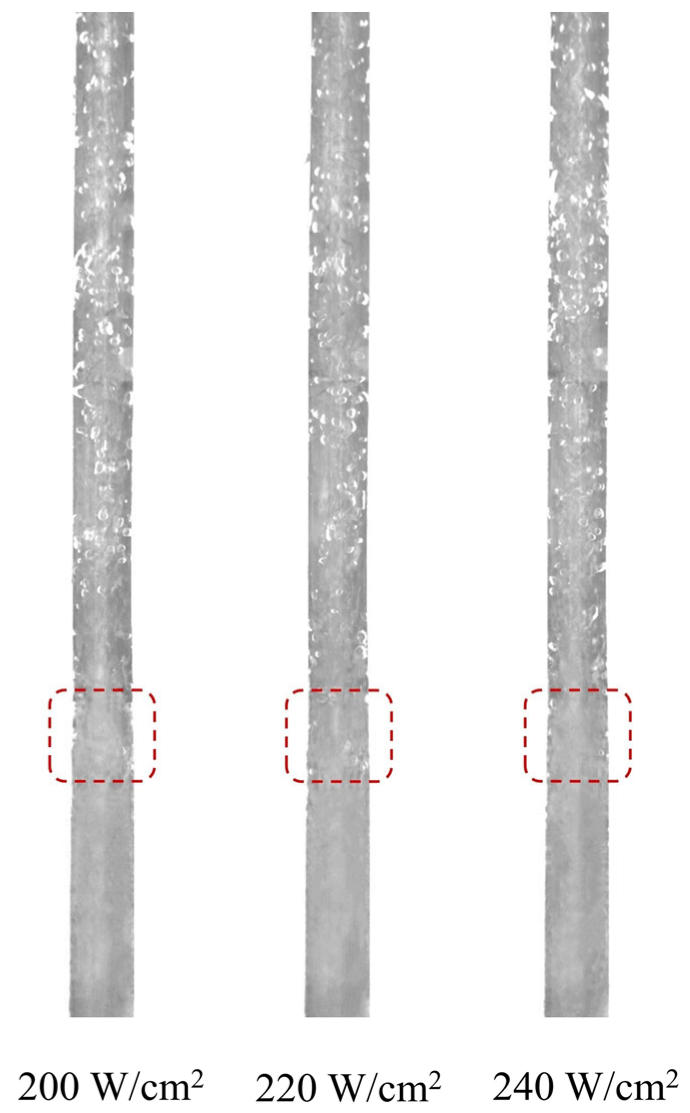
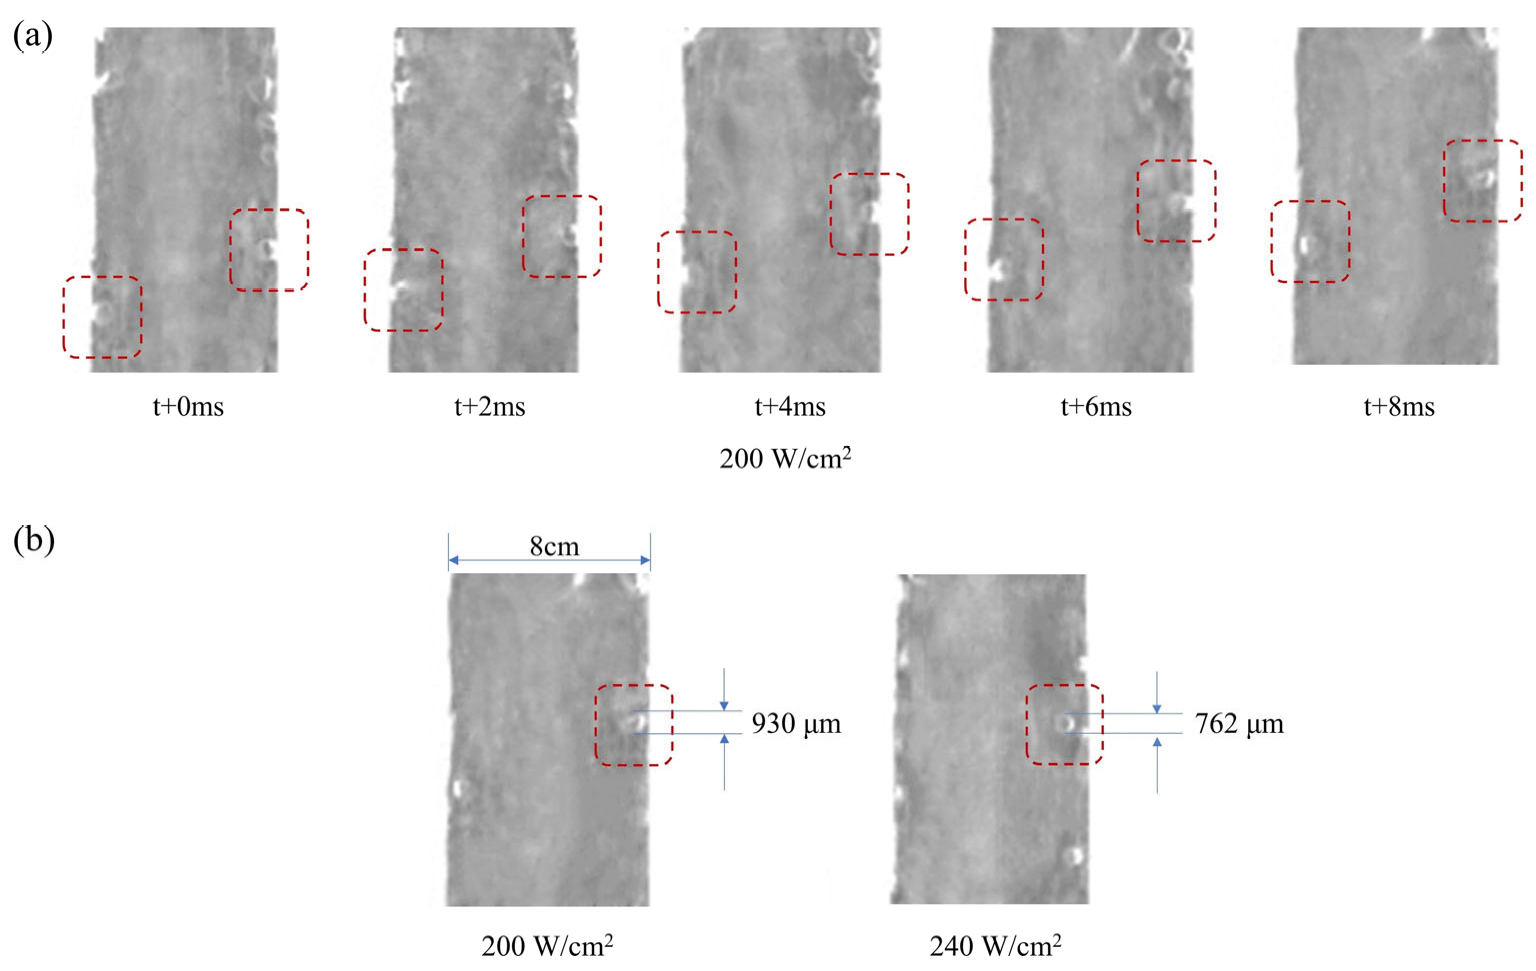
When the heat flux was increased to 200 W/cm2 and above (Figure 14), intermittent boiling ceased, establishing stable subcooled flow boiling. Compared to the low heat flux condition (30–60 W/cm2), the bubble size within and above the heating section was significantly reduced. Figure 15a shows that at 200 W/cm2, bubbles detached from the wall within 8 ms at a much smaller size. The detachment frequency increased from 40 Hz at 60 W/cm2 to 125 Hz. Figure 15b indicates that the bubble detachment size decreased from 1951 μm (at 60 W/cm2) to 930 μm at 200 W/cm2, and further to 762 μm at 240 W/cm2. The increased detachment frequency and reduced bubble size substantially enhanced heat transfer efficiency.
At a filling ratio of 65.3%, the two-phase flow pattern in the evaporator is depicted in Figure 16. At a heat flux of 30 W/cm2, bubbly flow was observed within the heating section, with heat extending towards the lower section, resulting in a significantly greater number of bubbles in the lower region compared to the high filling ratio condition. In the upper heating section, bubbles coalesced under buoyancy, forming slug bubbles with diameters comparable to the tube diameter, resulting in slug flow in the upper region. Figure 17 shows a bubble detachment size of approximately 3.1 mm under this condition.
In the heat flux range of 30 W/cm2 to 120 W/cm2 (Figure 18), as heat flux increased, the number of bubbles in the lower heating section decreased. This indicates enhanced heat transfer due to increased mass velocity, which impeded the downward expansion of heat. Bubble size diminished, although slug bubbles were still discernible in the upper heating section. At 120 W/cm2, bubbles were no longer present in the lower heating section; the working fluid was saturated, bubble size had further reduced, and the void fraction in the upper section increased.
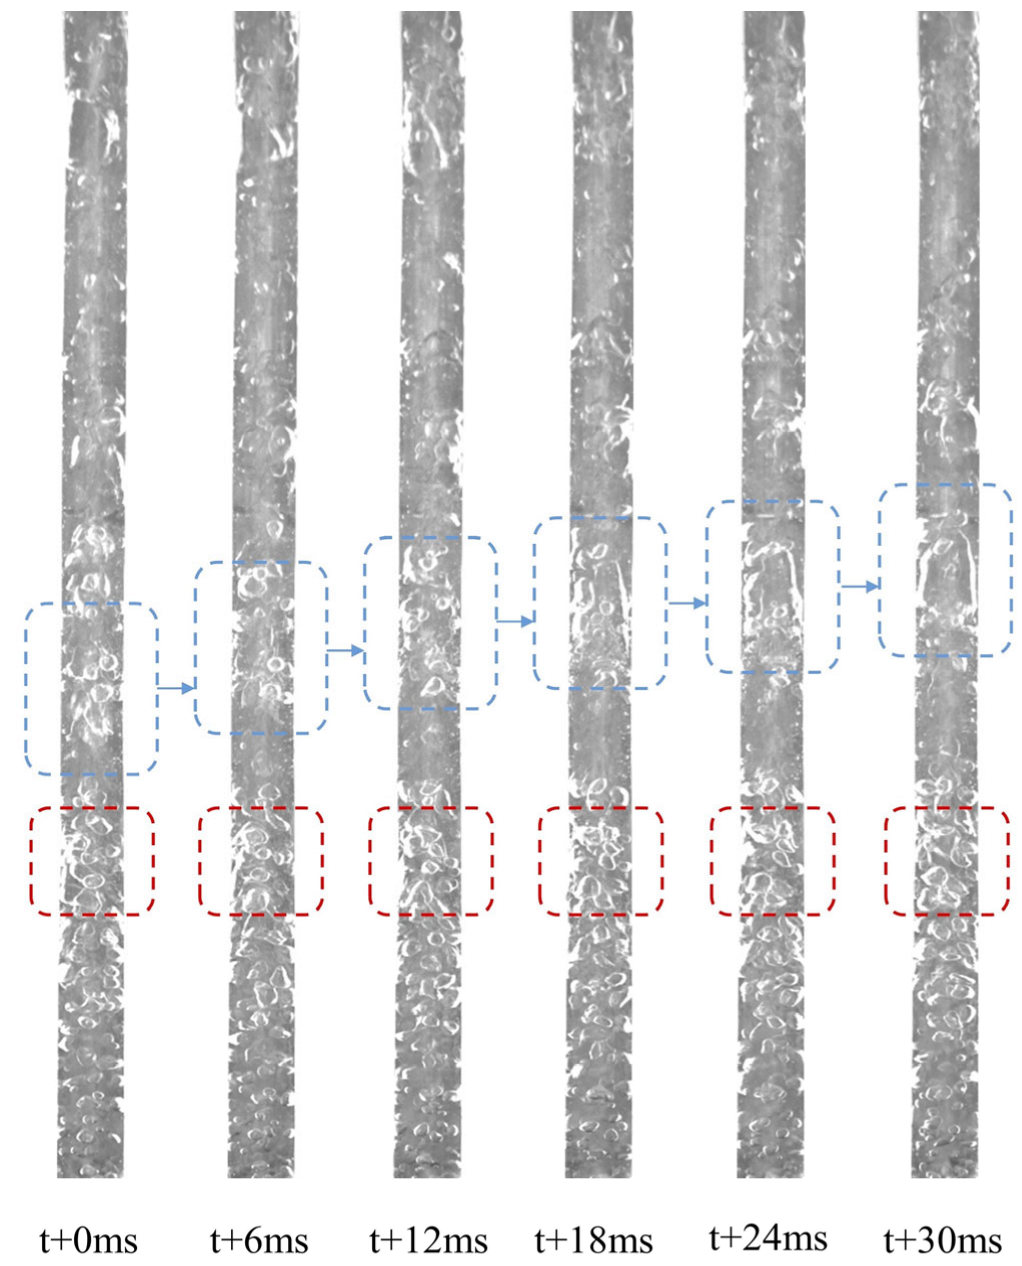
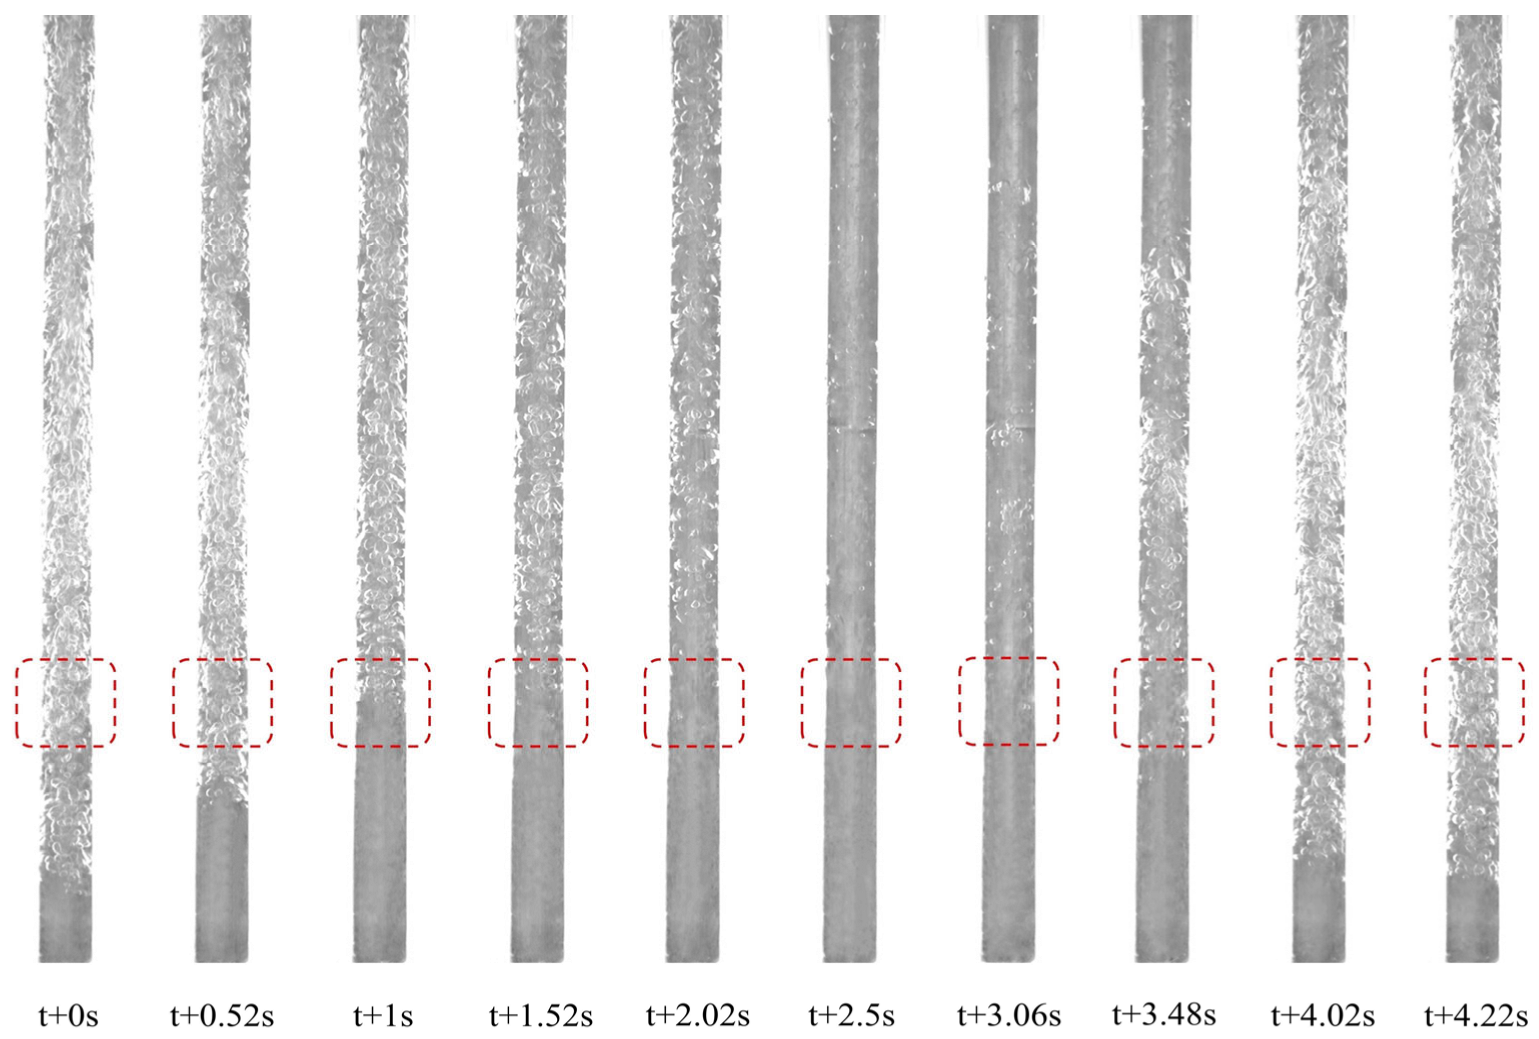
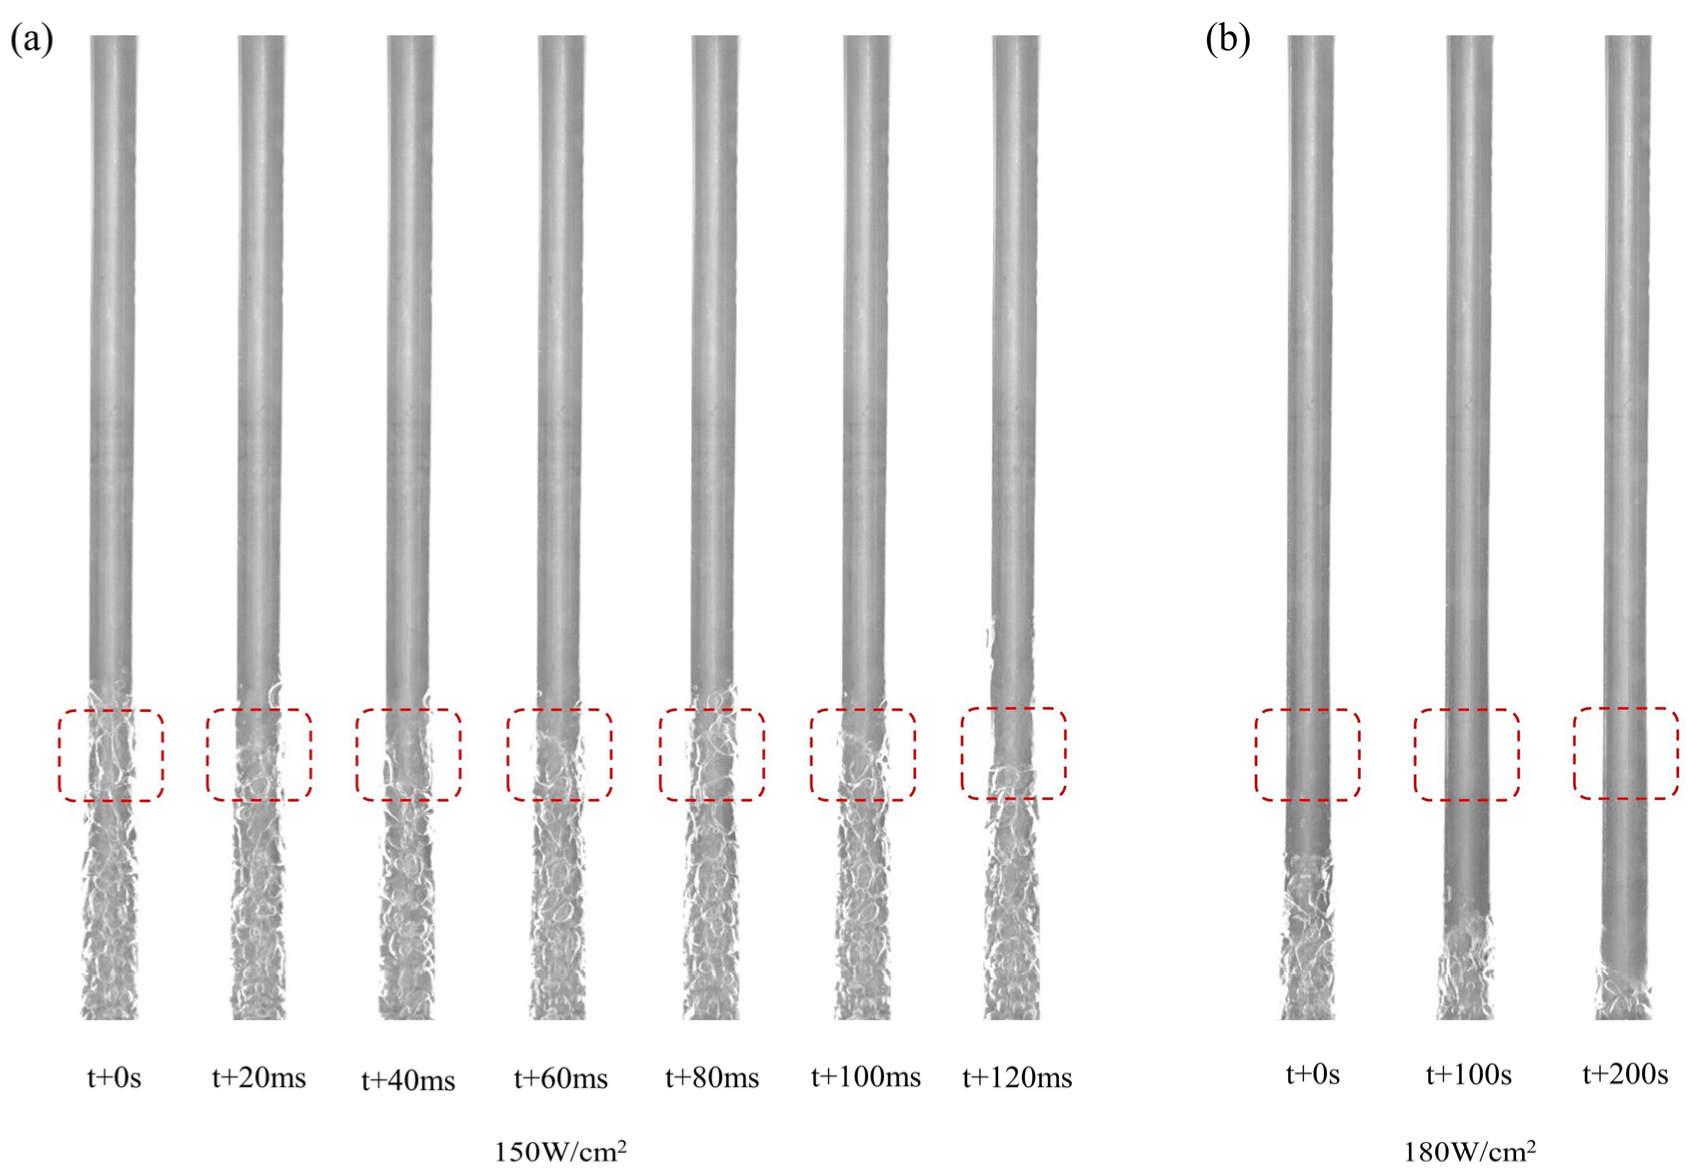
When the heat flux reached 150 W/cm2 (Figure 19), intermittent boiling commenced in the loop, but the flow pattern evolution differed from that observed under high filling ratios. Initially, churn flow (supersaturated state) was present in the heating section. Subsequently, subcooled liquid entered from below, progressively reducing the vapor content and altering the thermodynamic state from supersaturated to saturated, then to subcooled. At t + 1 s, subcooled boiling (bubbly flow) was observed. At t + 2.56 s, bubbles disappeared, transitioning to single-phase flow. Later, bubbles reappeared and increased in number, returning to the initial churn flow state at t + 4.36 s. The complete cycle was characterized by churn flow–bubbly flow–single-phase flow–bubbly flow–churn flow. Compared to the high filling ratio case, the onset heat flux for instability was higher (150 W/cm2 vs. 90 W/cm2), and the cycle included a churn flow stage. This is attributed to the higher circulating mass flux at lower filling ratios, where rapid accumulation of heat and bubbles promotes the transition to churn flow.
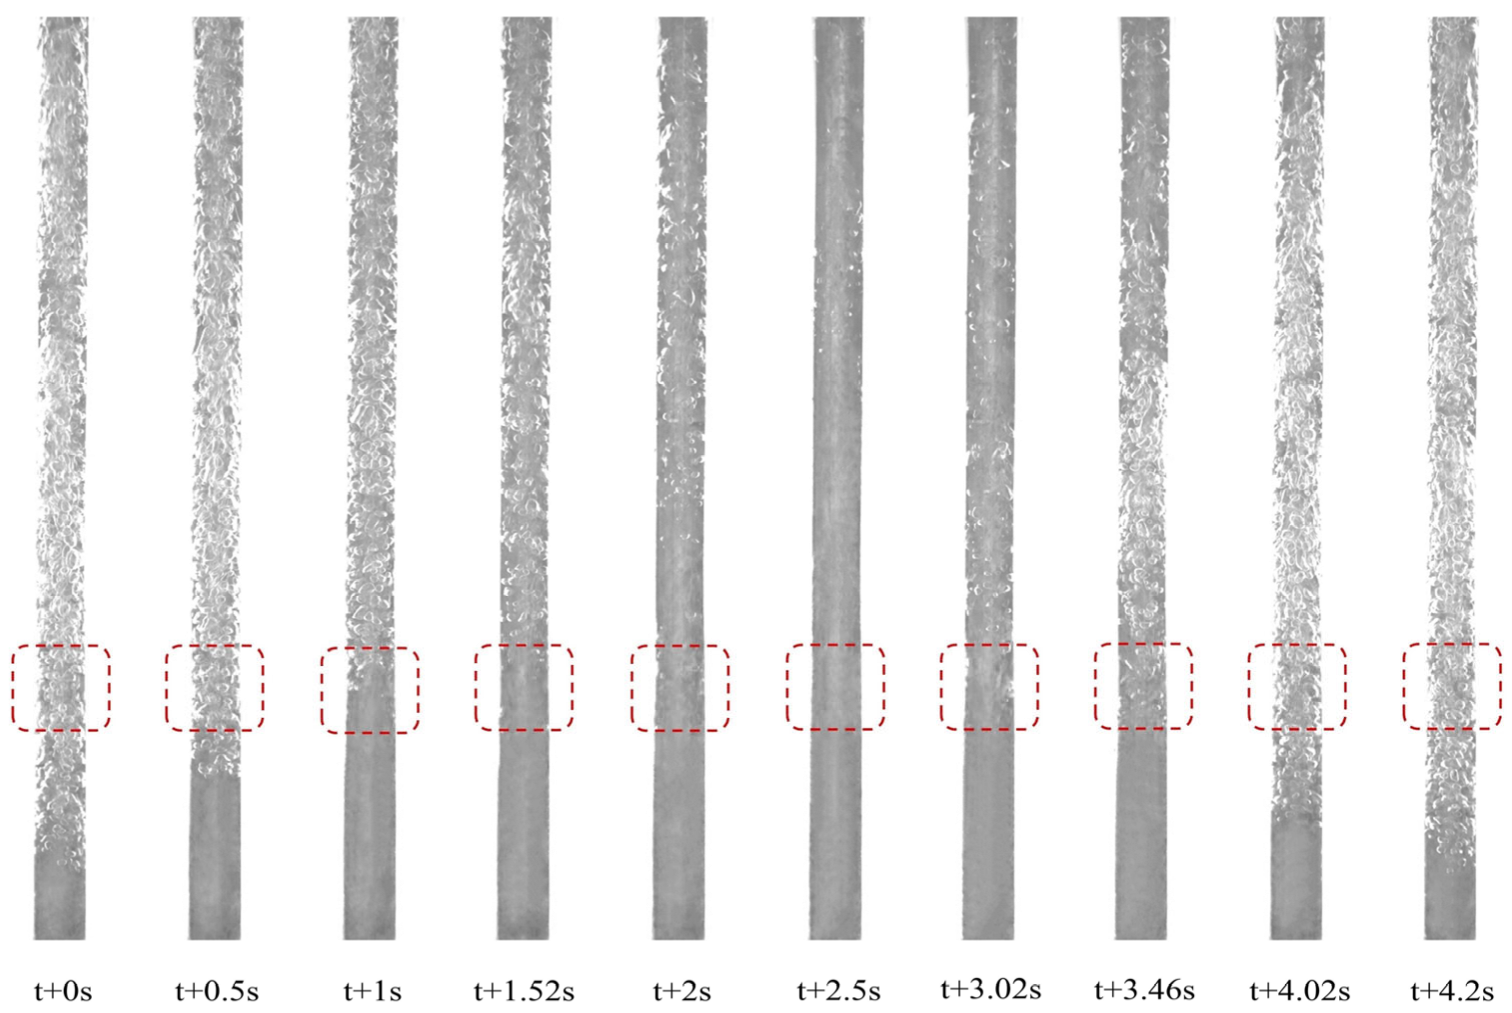
At heat fluxes of 180 W/cm2 (Figure 20), 200 W/cm2 (Figure 21), and 220 W/cm2 (Figure 22), the flow pattern evolution remained consistent with that at 150 W/cm2, albeit with progressively shorter cycle periods. In contrast to high filling ratio conditions, stable flow boiling was not established at high heat fluxes under medium-high filling ratios. The lower filling ratio provides a larger vapor space, which is not conducive to forming a stable, high-velocity mass circulation.
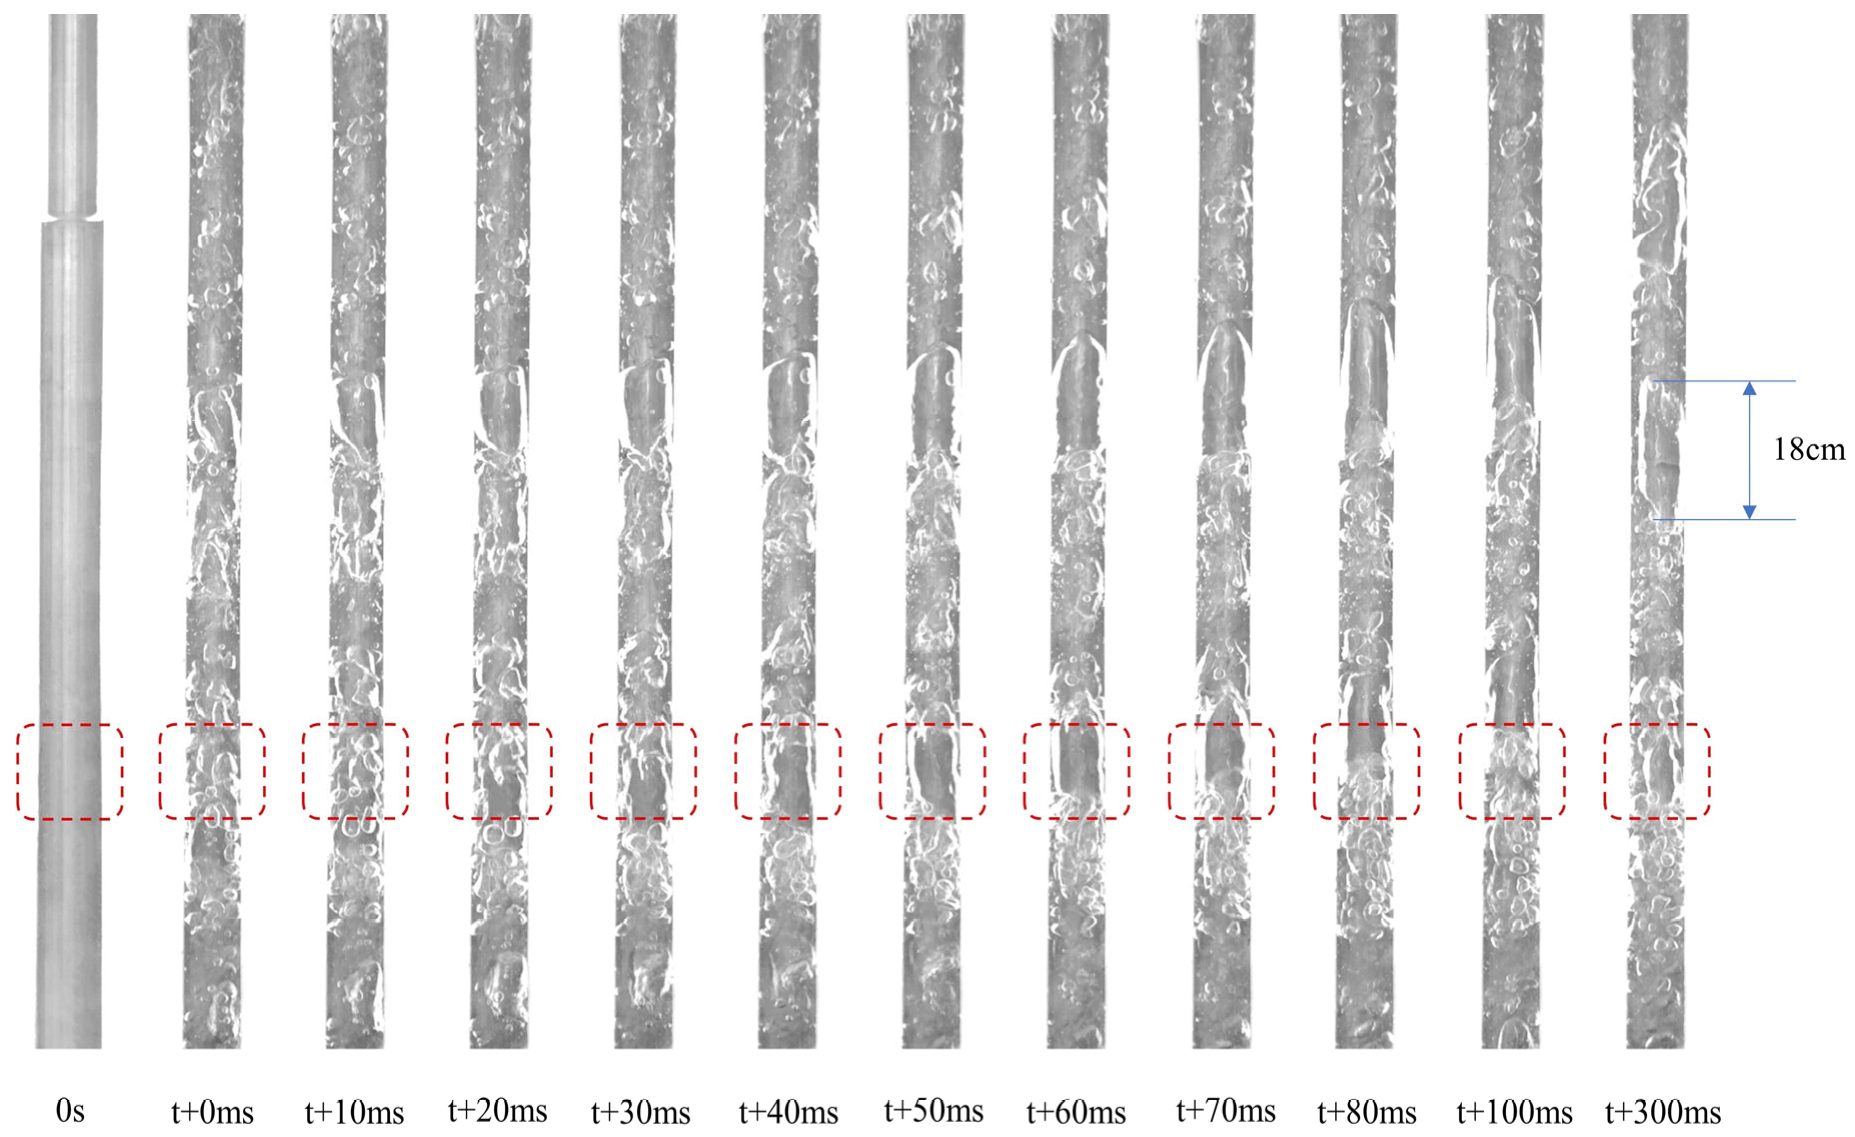
At a filling ratio of 36.8%, the vapor–liquid interface of R134a was clearly visible in the evaporator in the initial state (Figure 23). At a heat flux of 30 W/cm2, the low filling ratio and low mass flux allowed heat to propagate downward, generating bubbles in the lower heating section. Due to prolonged residence time in the heating section, the internal vapor pressure of bubbles increased rapidly, overcoming surface tension and expanding to the tube diameter, forming large slug bubbles (approximately 18 cm in length). Slug flow dominated within the evaporator.
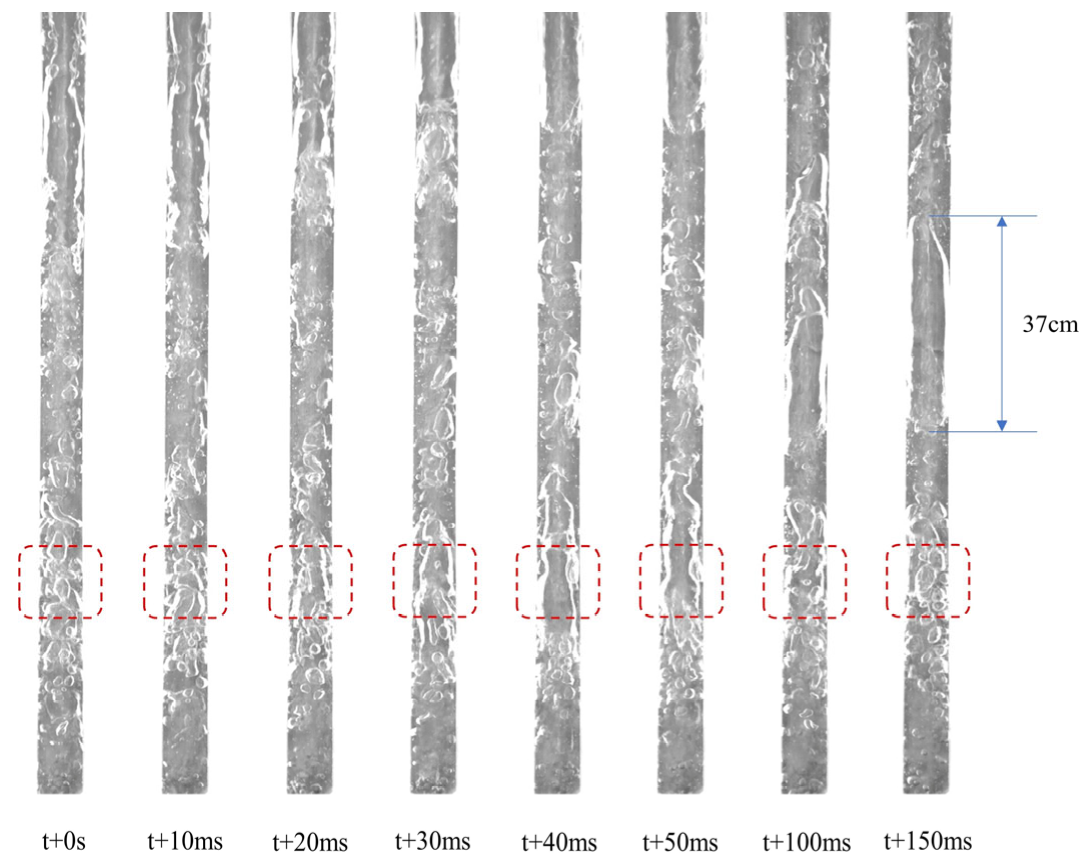
When the heat flux increases to 60 W/cm2 (Figure 24), the slug bubbles grow further in the heating section, reaching a size of 37 cm, approximately twice that at 30 W/cm2, and then rise and depart under the action of buoyancy.
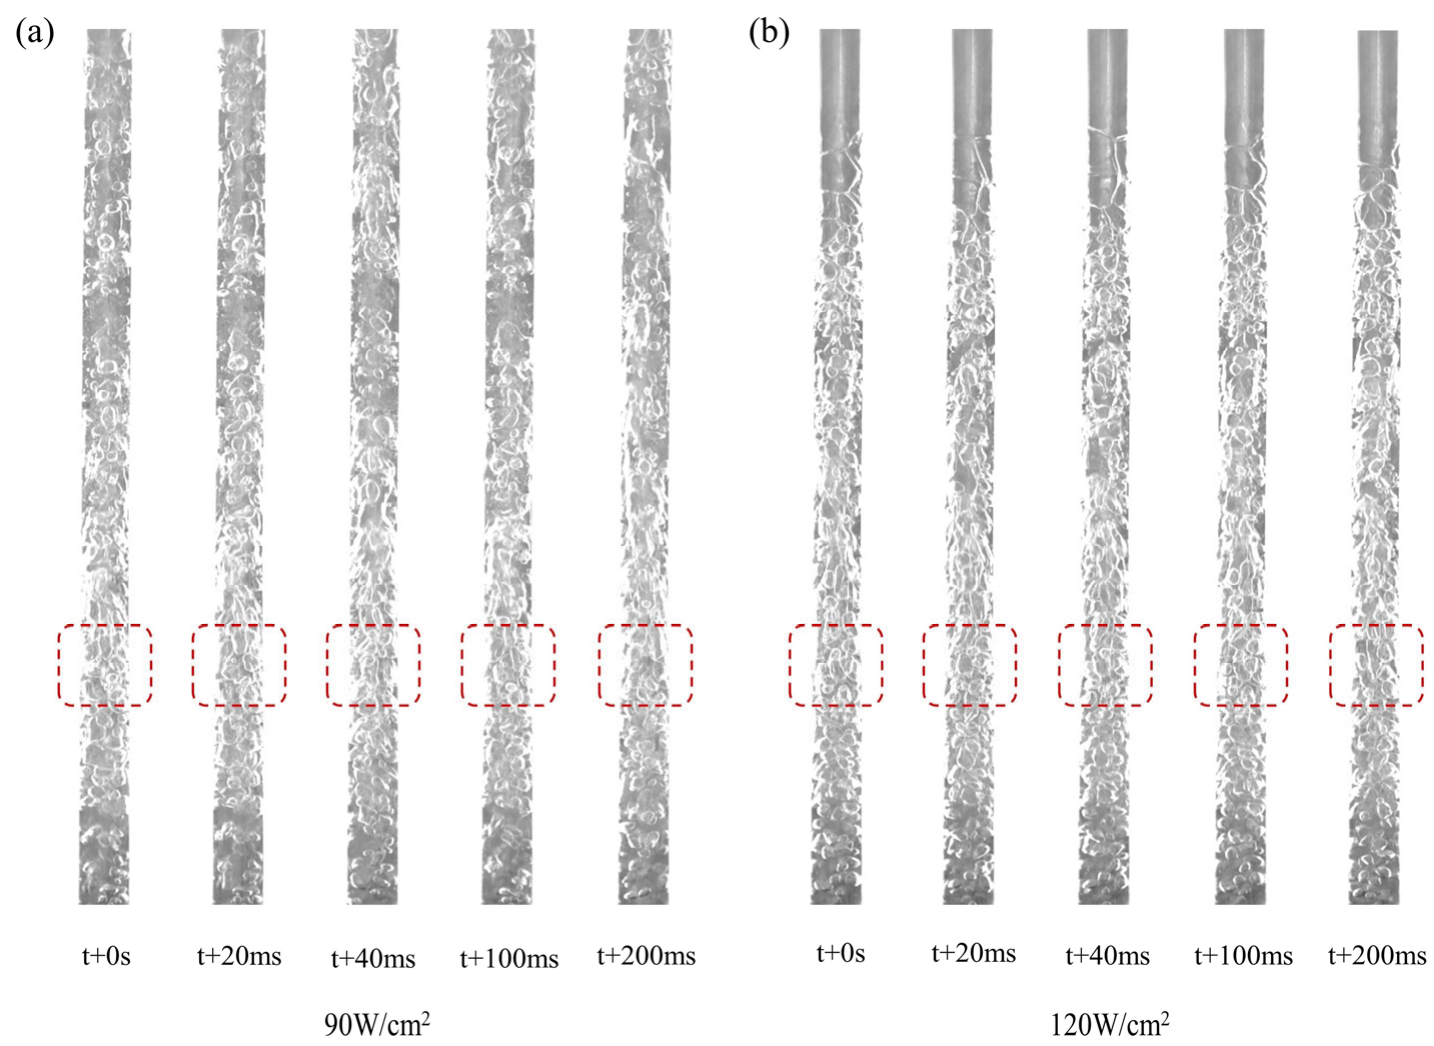
At a heat flux of 90 W/cm2 (Figure 25a), the slug bubbles disintegrated, and the flow pattern transitioned to churn flow. This was attributed to increased internal vapor pressure and velocity within the slug bubbles due to higher heat flux, leading to interfacial instability. Bubble generation in the lower heating section increased, intensifying boiling. At 120 W/cm2 (Figure 25b), churn flow persisted, but a distinct interface between vapor and two-phase fluid emerged at the top of the evaporator, indicating a drop in the free liquid level.
When the heat flux reached 150 W/cm2 (Figure 26a), the liquid level in the evaporator dropped significantly, accompanied by a marked reduction in liquid working fluid content. Instantaneous dryout occurred within the heating section, characterized by periodic surges of liquid in a boiling–dryout–boiling cycle. This was caused by an excessively high boiling rate coupled with a lag in the return of condensed liquid. At a heat flux of 180 W/cm2 (Figure 26b), the evaporation rate further increased, exacerbating the liquid return lag. The liquid level dropped below the heating section inlet, resulting in complete dryout of the heating section due to the absence of liquid working fluid.

3.3. Comparison of TPLT Heat Transfer Performance

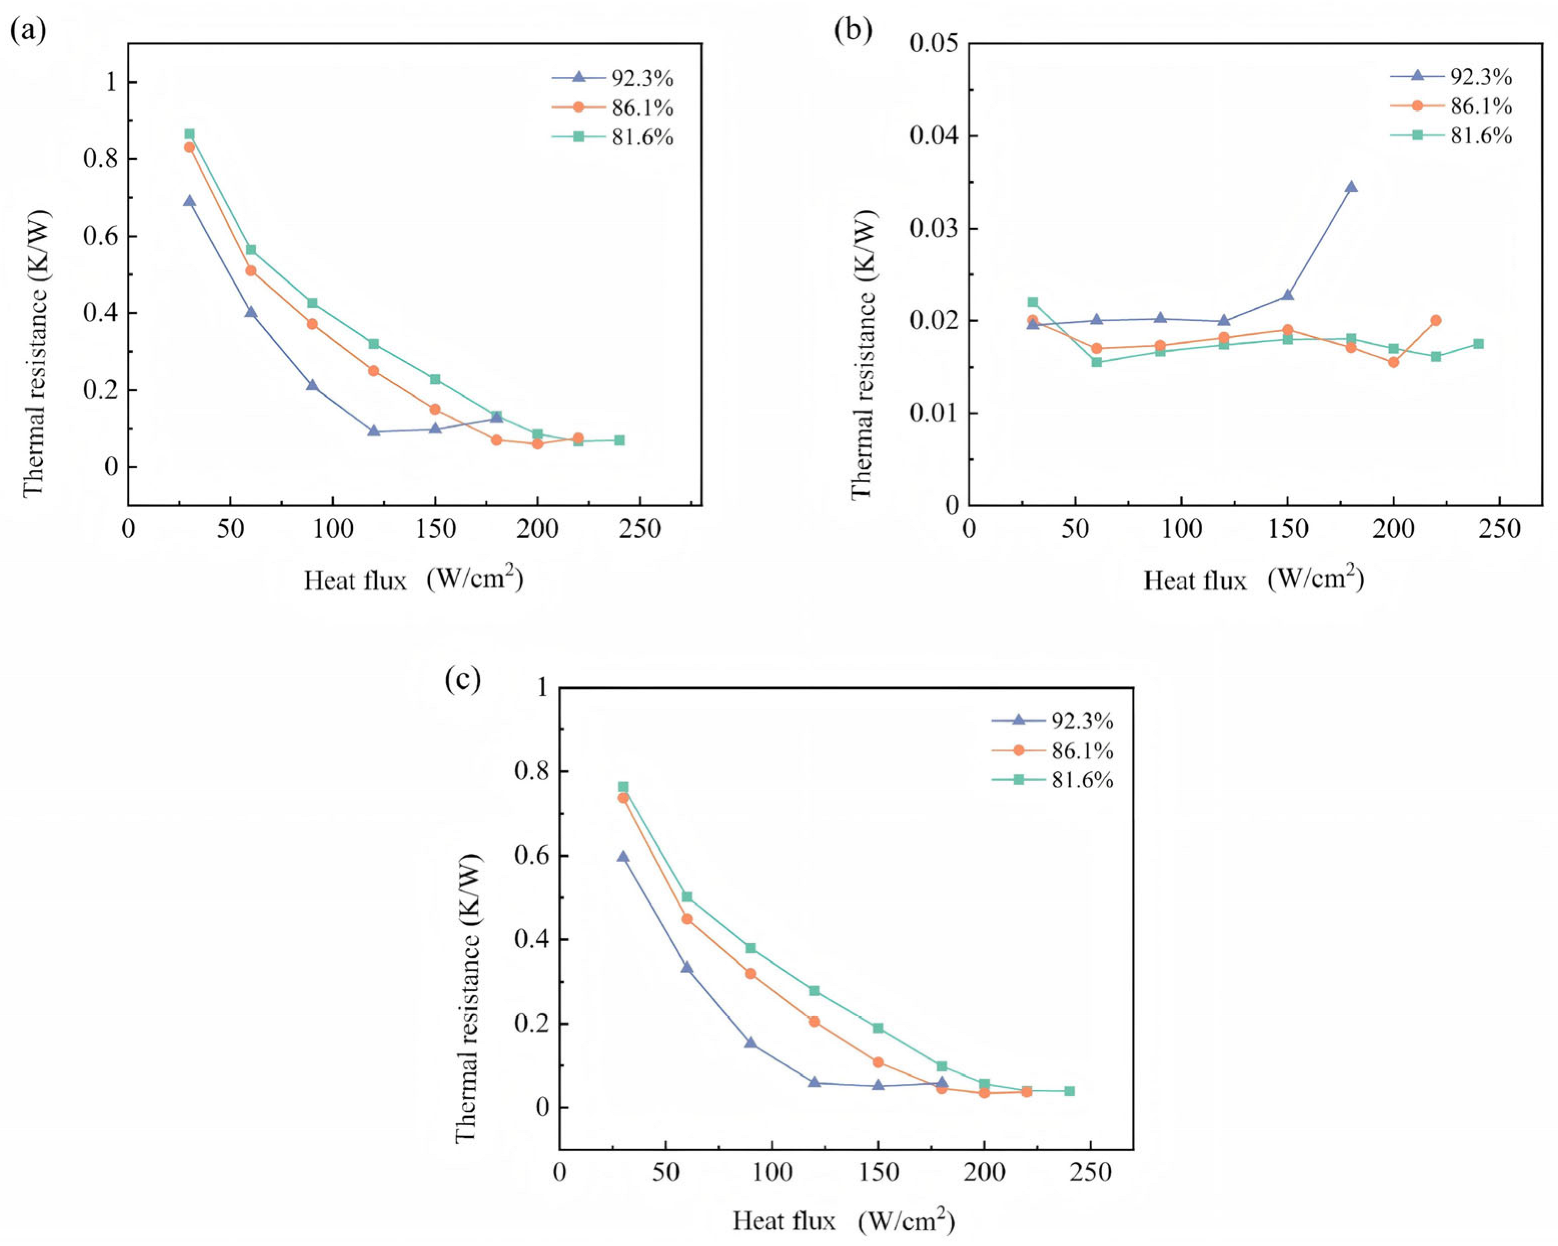
The overall loop thermal resistance, evaporator thermal resistance, and condenser thermal resistance for high filling ratio conditions are shown in Figure 27. At low heat fluxes, both the loop and condenser thermal resistances were relatively high, indicating inferior heat transfer capability. Initially, the condenser was predominantly filled with liquid, leading to heat transfer primarily via single-phase convection (sensible heat). Although subcooled flow boiling in the evaporator offered high heat transfer efficiency, the low mass flow rate hindered the transport of bubbles to the condenser, resulting in elevated overall thermal resistance. As heat flux increased, the mass flow rate rose, boiling intensified in the evaporator, and condenser heat transfer efficiency improved, causing all thermal resistances to decrease. Upon entering the intermittent boiling regime, continuous boiling in the evaporator was replaced by periodic boiling, slightly reducing heat transfer efficiency and increasing evaporator thermal resistance. Simultaneously, bubbles entering the condenser increased the proportion of latent heat transfer, further decreasing both condenser and overall thermal resistances. With further increases in heat flux, thermal expansion of the liquid increased the liquid volume fraction, establishing a liquid connection between the evaporator and condenser. The loop entered a high mass flow rate regime. The evaporator exhibited high-velocity subcooled flow boiling, characterized by significantly reduced bubble detachment size and increased detachment frequency, substantially enhancing heat transfer capability. At heat fluxes above 200 W/cm2, thermal resistances dropped below 0.1 K/W, achieving a maximum heat flux of 240 W/cm2. Further increases in heat flux led to a continued expansion of the liquid volume, reducing the space available for phase change and decreasing the latent heat contribution in the evaporator, thereby increasing evaporator thermal resistance. Notably, at a filling ratio of 92.6% and a heat flux of 180 W/cm2, the vapor phase in the loop was substantially reduced, approaching single-phase heat transfer, which deteriorated heat transfer performance and increased loop thermal resistance. Therefore, while high filling ratios enable higher heat transfer capacity and lower thermal resistance, excessively high filling ratios should be avoided.
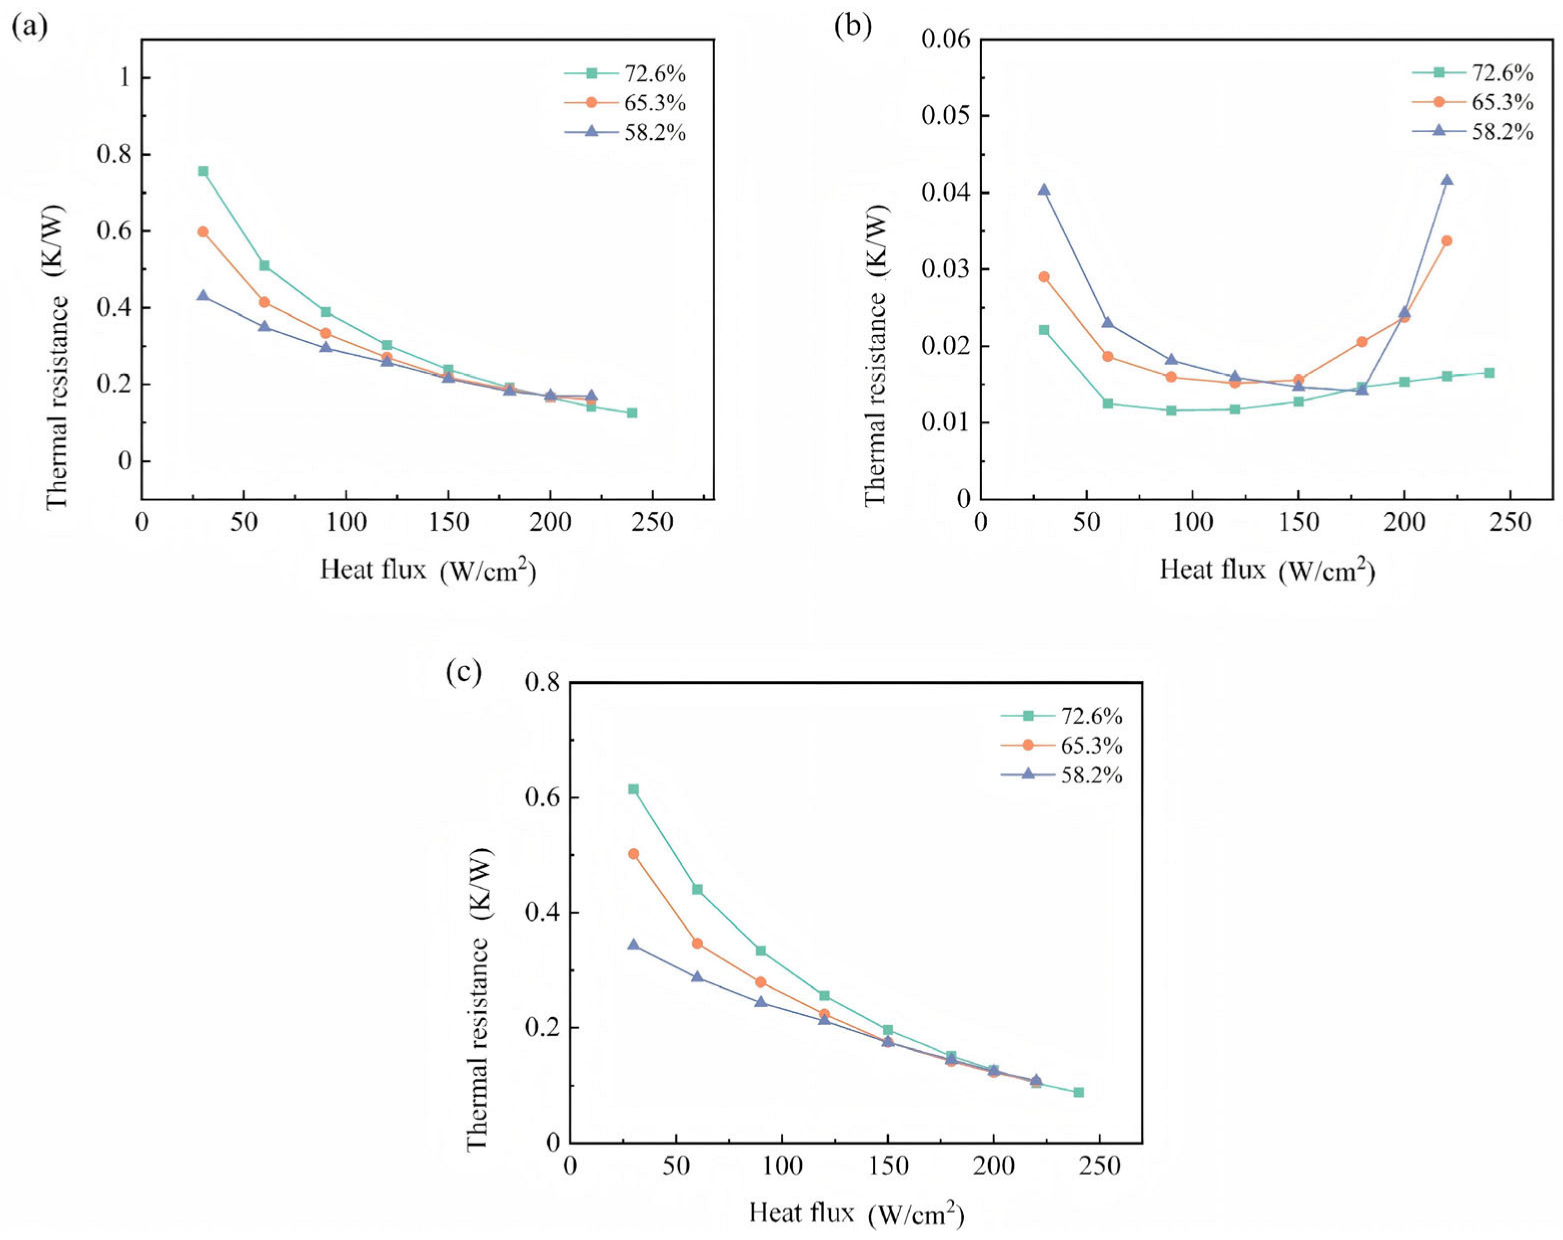
Thermal resistance variations under medium-high filling ratios are shown in Figure 28. Similar to the high filling ratio case, condenser and overall loop thermal resistances were high at low heat fluxes. As the filling ratio decreased, the liquid level in the condenser dropped, increasing the vapor volume and the proportion of latent heat transfer, resulting in lower thermal resistance at equivalent heat fluxes. Conversely, evaporator thermal resistance exhibited an opposite trend: at low heat fluxes, higher filling ratios facilitated working fluid circulation and bubble detachment, leading to lower evaporator thermal resistance. As heat flux increased, evaporator thermal resistance initially decreased and then increased, with the turning point corresponding to the onset of intermittent boiling. Before the onset of intermittent boiling, increased heat flux enhanced mass flow rate and flow boiling heat transfer efficiency, reducing all thermal resistances. Following the onset of intermittent boiling, the transition from stable continuous boiling to intermittent boiling increased evaporator thermal resistance. However, condenser thermal resistance continued to decrease due to intense flow perturbations. Under medium-high filling ratios, even with thermal expansion of the working fluid, a significant vapor space remained within the loop. Consequently, a liquid connection between the evaporator and condenser, as seen in high filling ratio scenarios, could not be established. Therefore, intermittent boiling persisted at high heat fluxes, preventing the formation of a high-velocity mass circulation. This resulted in relatively inferior heat transfer capability, with a minimum thermal resistance of 0.12 K/W, higher than that achieved under high filling ratio conditions.
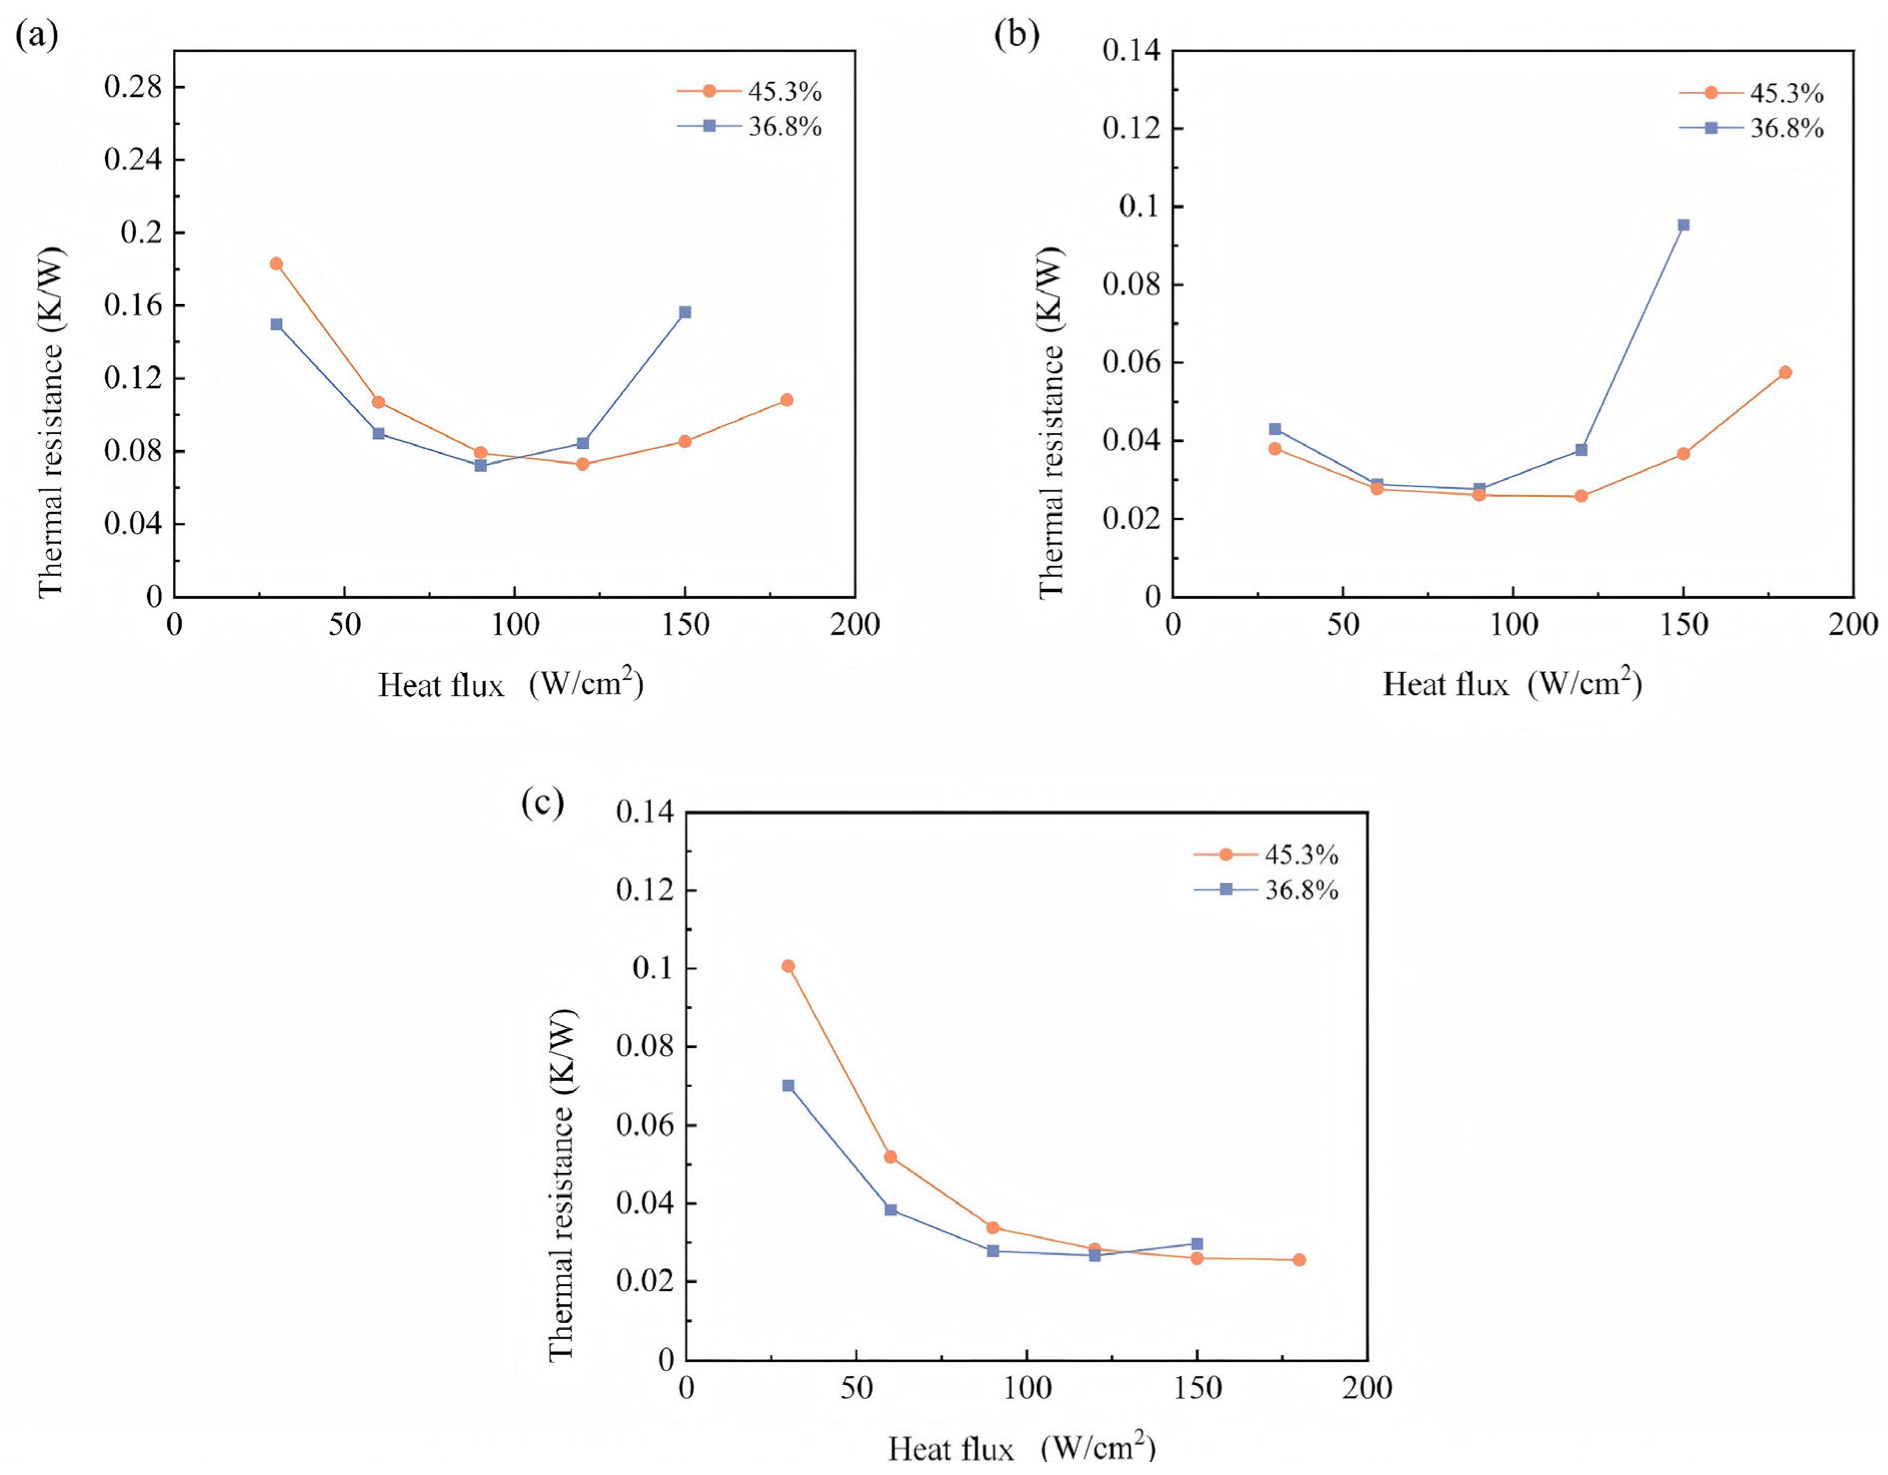
Thermal resistance variations under low filling ratios are presented in Figure 29. At low heat fluxes, loop and condenser thermal resistances were lower than those under medium-high filling ratios because the condenser was entirely occupied by vapor. Condensation of the vapor released latent heat, resulting in high heat transfer efficiency and an overall loop thermal resistance below 0.2 K/W. As heat flux increased, loop thermal resistance first decreased and then increased. At lower heat fluxes, the increase in heat flux intensified boiling and condensation, improving heat transfer efficiency and reducing thermal resistance. With further increases in heat flux, evaporator thermal resistance rose significantly due to the boiling rate substantially outpacing the rate at which condensed liquid could return to the evaporator. This mismatch led to dryout in the evaporator, causing a rapid temperature rise and a decline in heat transfer capability. The increase in evaporator thermal resistance caused a sharp rise in overall loop thermal resistance at higher heat fluxes. This effect was more pronounced at lower filling ratios, resulting in a lower maximum heat transfer capacity compared to medium-high and high filling ratio conditions.
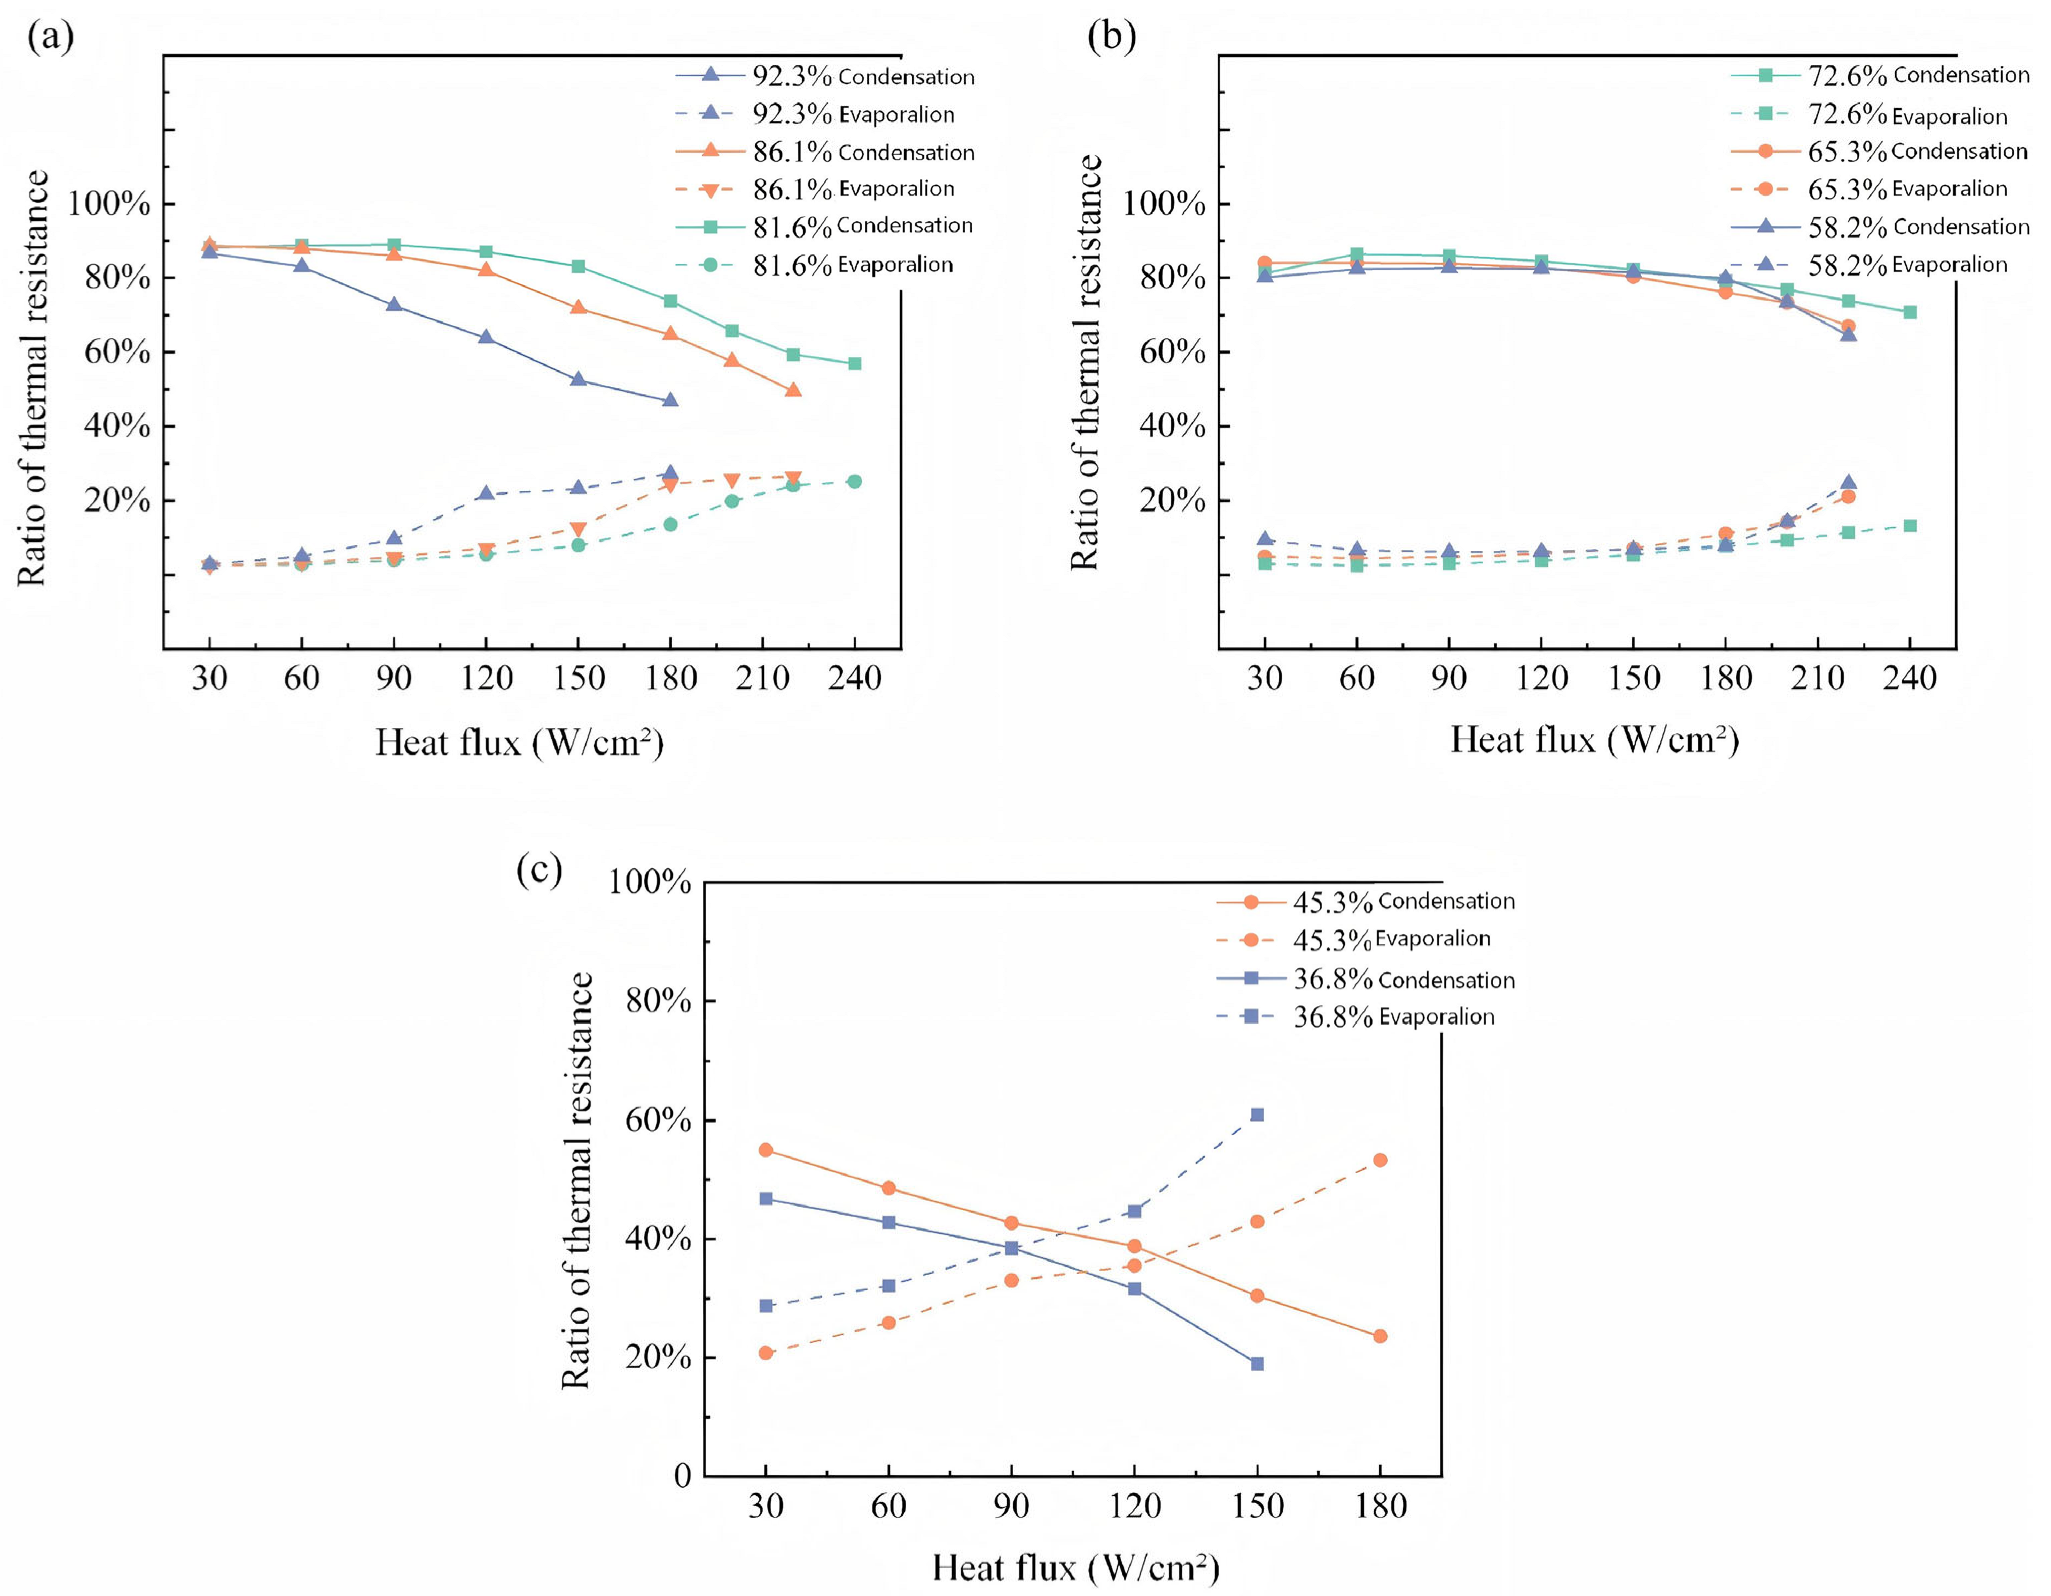
Figure 30 illustrates the proportions of evaporator and condenser thermal resistances relative to the total loop thermal resistance under high, medium-high, and low filling ratio conditions. Under high filling ratios and low heat fluxes, the condenser thermal resistance accounted for nearly 90% of the total, with a minimal contribution from the evaporator. This was due to the condenser being predominantly filled with liquid, relying primarily on convective heat transfer. As heat flux increased and a high-velocity mass circulation developed, bubbles entered the condenser, releasing latent heat and enhancing condenser heat transfer. Consequently, the proportion of condenser thermal resistance gradually decreased, while the evaporator’s contribution increased. At equivalent heat fluxes, higher filling ratios facilitated working fluid circulation, resulting in a lower proportion of condenser thermal resistance. Nonetheless, even under these conditions, the condenser thermal resistance still constituted over 50% of the total, indicating that the condenser was the primary source of thermal resistance under high filling ratios. Under medium-high filling ratio conditions, the proportion of condenser thermal resistance was similar to that under high filling ratios, exceeding 80% at low heat fluxes. As heat flux increased, this proportion decreased slightly, but the reduction was less pronounced than under high filling ratios. This was attributed to the larger vapor space and dominance of intermittent boiling under medium-high filling ratios, which limited the increase in mass flow rate. Consequently, condenser thermal resistance remained relatively high, with a minimum proportion still above 60%. Under low filling ratio conditions, the contributions of evaporator and condenser thermal resistances were more balanced. Although condenser thermal resistance was initially higher at low heat fluxes, it was significantly lower than that observed under medium-high filling ratios due to the low liquid level in the condenser and the predominance of latent heat transfer, resulting in higher heat transfer efficiency. As heat flux increased, the proportion of evaporator thermal resistance rose substantially, eventually surpassing that of the condenser. This was because the limited liquid inventory in the heating section and low mass flow rate at high heat fluxes prevented timely liquid replenishment, causing localized dryout and a significant increase in evaporator thermal resistance.
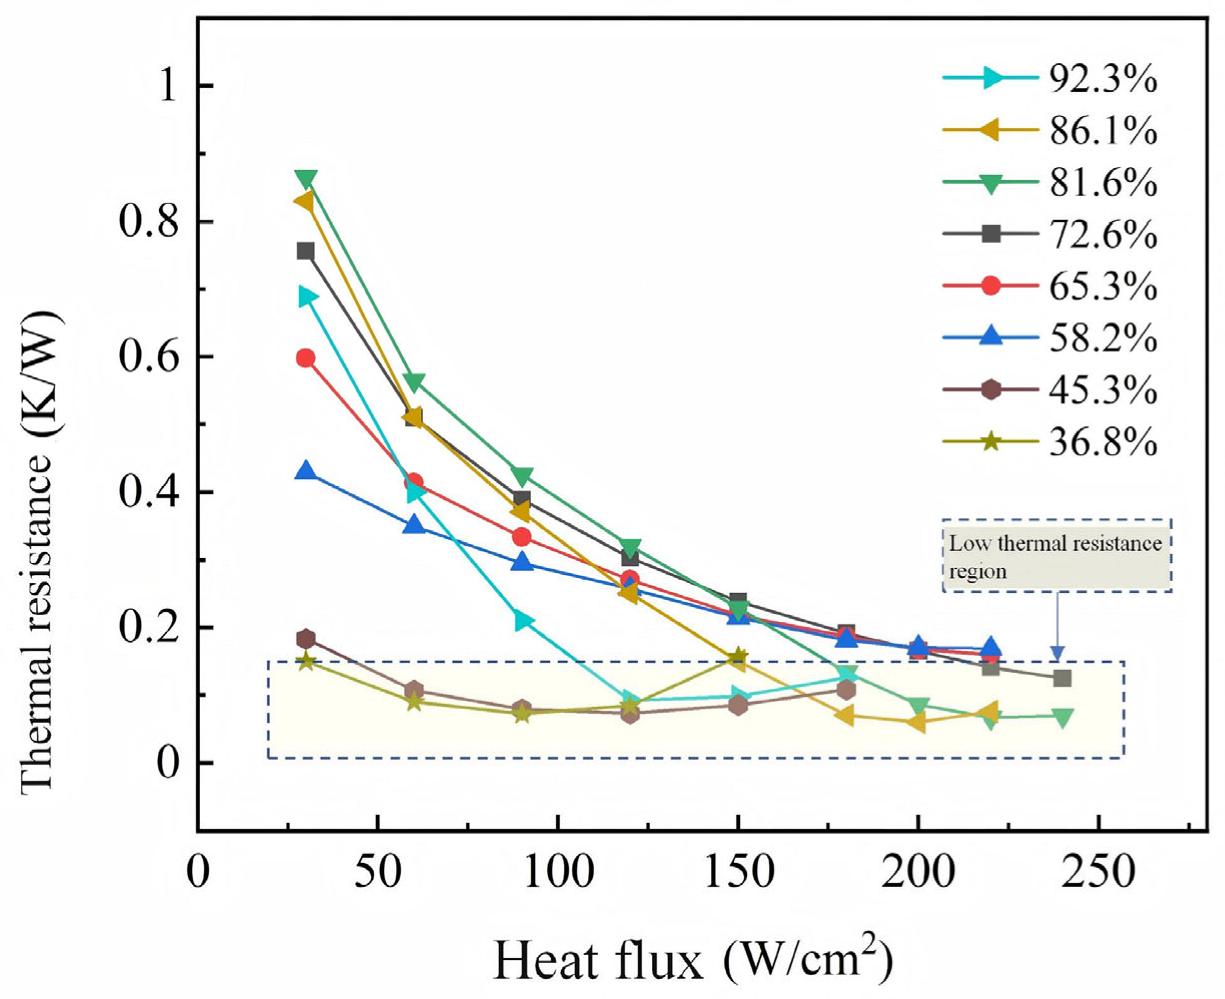
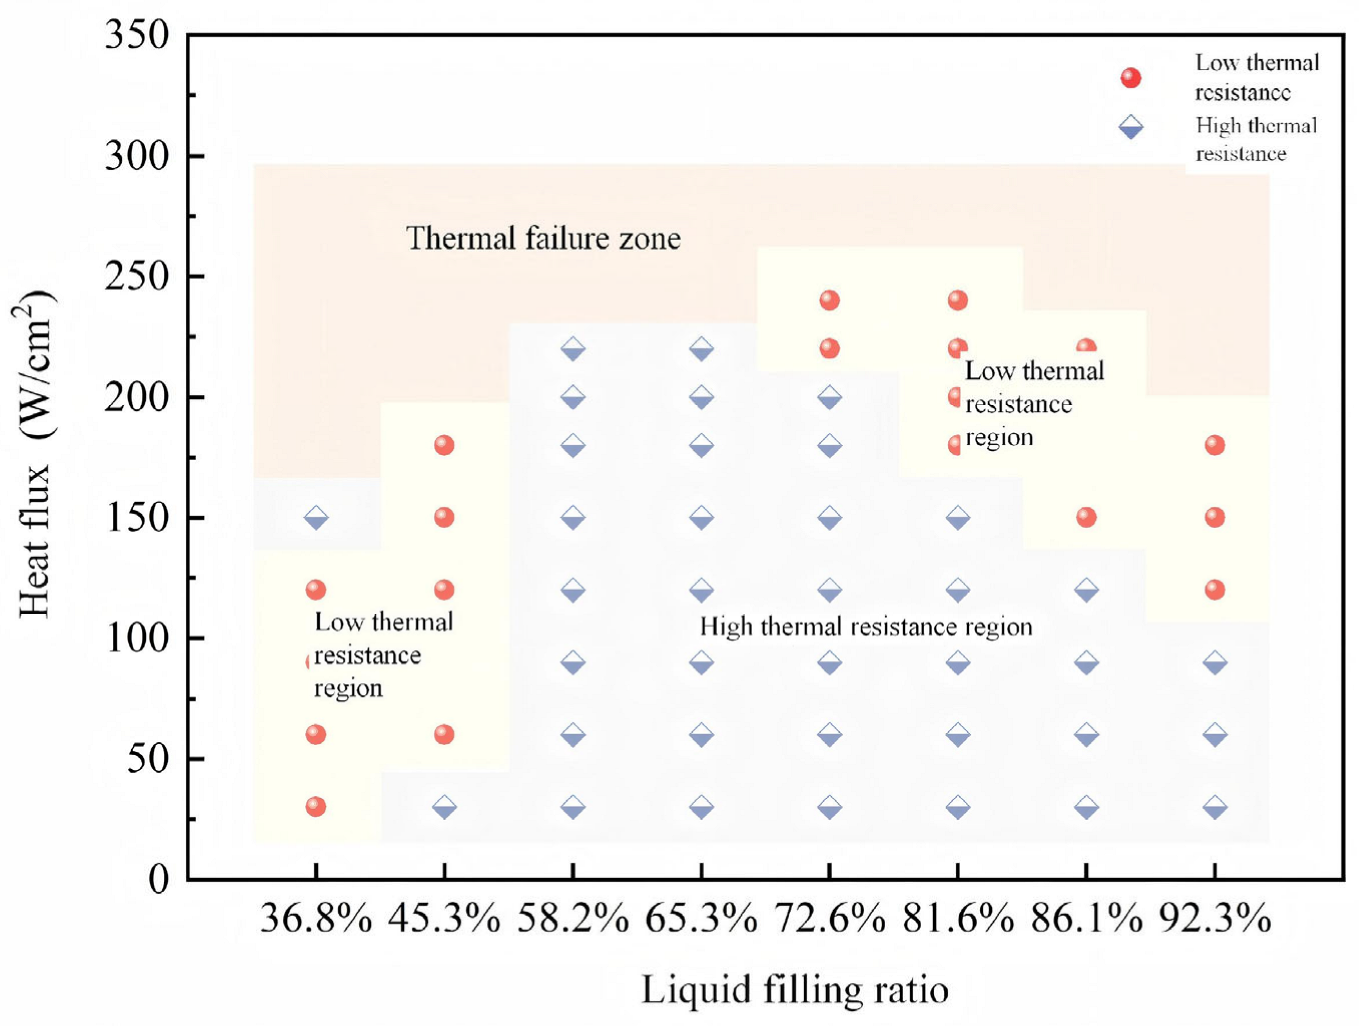
Figure 31 summarizes the variation of thermal resistance with heat flux for different filling ratios. Thermal resistance decreased with increasing heat flux under both high and medium-high filling ratios, but the rate of decrease was significantly greater under high filling ratios, rapidly dropping below 0.15 K/W. Within the high filling ratio range (81.6–92.3%), higher filling ratios required lower heat fluxes to achieve a thermal resistance below 0.15 K/W, indicating an easier transition to a high-intensity heat transfer state. Under low filling ratios, thermal resistance increased at high heat fluxes, preventing operation at elevated heat flux levels. According to the criterion proposed by Kravets et al. [40], the thermal resistance value of 0.15 K/W is used as the threshold to distinguish the low-thermal-resistance heat transfer state from the high-thermal-resistance heat transfer state: below 0.15 K/W corresponds to the low-thermal-resistance heat transfer state, and above 0.15 K/W corresponds to the high-thermal-resistance heat transfer state. Based on this, the TPLT heat transfer map is plotted as shown in Figure 32. The low-thermal-resistance region appears under both low and high filling ratio conditions but with distinct distributions: Under low filling ratios, the low-resistance region is confined to low heat flux ranges, transitioning to thermal failure at high heat fluxes. Under high filling ratios, the low-resistance region extends into high heat flux ranges, meeting the demanding cooling requirements of high-power electronics. Medium-high filling ratios predominantly reside in the high-thermal-resistance region. In summary, low-filling-ratio TPLTs are suitable for cooling devices with low heat flux densities, whereas high-filling-ratio TPLTs are better suited for high heat flux dissipation applications.
Based on the above visualization results and thermal resistance analysis, a more detailed physical interpretation of the heat transfer mechanisms under different filling ratios can be provided. Under high filling ratio conditions, the evaporator maintains an adequate liquid supply, and the heating surface remains well-wetted throughout. As heat flux increases, bubble nucleation density rises, departure size decreases, and departure frequency increases, leading to continuous enhancement of nucleate boiling. When the heat flux exceeds 200 W/cm2, a high-velocity mass circulation is established in the loop, and the evaporator transitions to stable subcooled flow boiling. Bubbles are swept away by the high-speed fluid immediately after departure, preventing coalescence into large bubbles. As a result, wall temperature uniformity improves significantly, and thermal resistance drops below 0.1 K/W. At this stage, the heat transfer mechanism shifts from “nucleate boiling dominated” to “convective evaporation dominated”, and the overall heat transfer efficiency is greatly improved. Under medium-high filling ratio conditions, the liquid supply in the evaporator is relatively sufficient, but a large vapor space always exists in the loop, preventing the establishment of a high-velocity liquid-connected circulation. As heat flux increases, intermittent boiling is triggered, and the flow pattern exhibits a periodic evolution of “churn flow–bubbly flow–single-phase flow–bubbly flow–churn flow”, causing sustained wall temperature fluctuations and preventing further reduction in thermal resistance. Under low filling ratio conditions, the liquid inventory in the evaporator is severely insufficient. As heat flux increases, the evaporation rate far exceeds the condensate return rate, causing the liquid level to drop continuously. When the liquid level falls below the heating surface, local instantaneous dryout occurs. With further increase in heat flux, the dryout region expands and eventually covers the entire heating surface. The heat transfer mechanism then degrades from boiling heat transfer to single-phase vapor convection, resulting in a sharp deterioration of heat transfer capability, a sudden rise in wall temperature, and an exponential increase in thermal resistance. In summary, a high filling ratio maintains a continuous liquid phase in the evaporator and induces high-velocity mass circulation, enabling the transition from “nucleate boiling” to “convective evaporation” as the dominant heat transfer mechanism. This transition is the key to achieving low thermal resistance and high heat flux dissipation. In contrast, under low filling ratios, the fundamental lack of liquid inventory makes it impossible to sustain stable boiling heat transfer under high heat flux conditions, inevitably leading to dryout failure.
Temperature uniformity, which reflects the even distribution of temperature across the loop, is a crucial indicator of heat transfer performance. In this study, the non-uniformity coefficient is employed to characterize temperature uniformity.
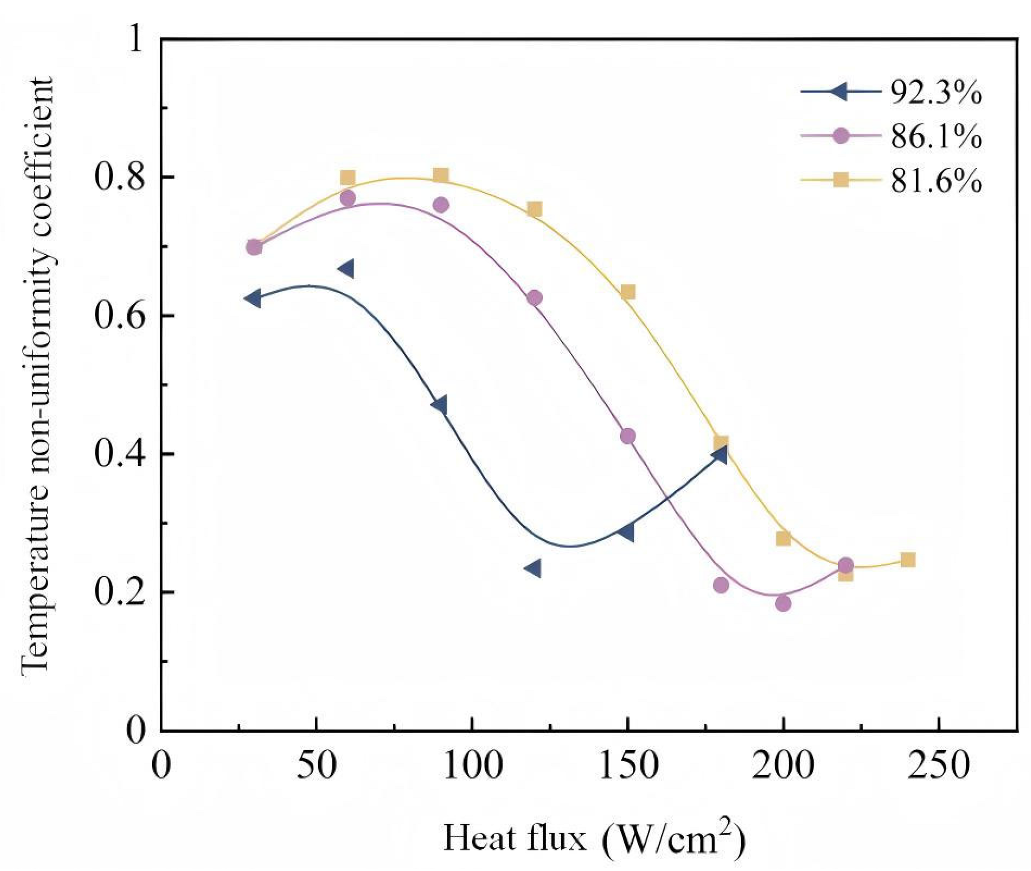
The variation of the non-uniformity coefficient with heat flux under high filling ratios is shown in Figure 33. As heat flux increased, the non-uniformity coefficient initially rose at low heat fluxes, then sharply declined, and exhibited a slight increase at high heat fluxes. At low heat fluxes, the low mass flow rate and high condenser thermal resistance resulted in a large temperature difference between the evaporator and condenser, leading to poor temperature uniformity. As heat flux increased and the loop entered the intermittent boiling regime, the mass flow rate rose, condenser thermal resistance decreased, and temperature uniformity improved. At high heat fluxes, thermal expansion of the liquid reduced the volume available for phase change and decreased the latent heat contribution, slightly degrading temperature uniformity, particularly at a filling ratio of 92.6%. Furthermore, high filling ratios readily facilitated the formation of high-velocity mass circulation, dramatically improving heat transfer efficiency and causing a substantial drop in the non-uniformity coefficient, signifying a marked enhancement in temperature uniformity. At low heat fluxes, higher filling ratios resulted in lower non-uniformity coefficients and better temperature uniformity.
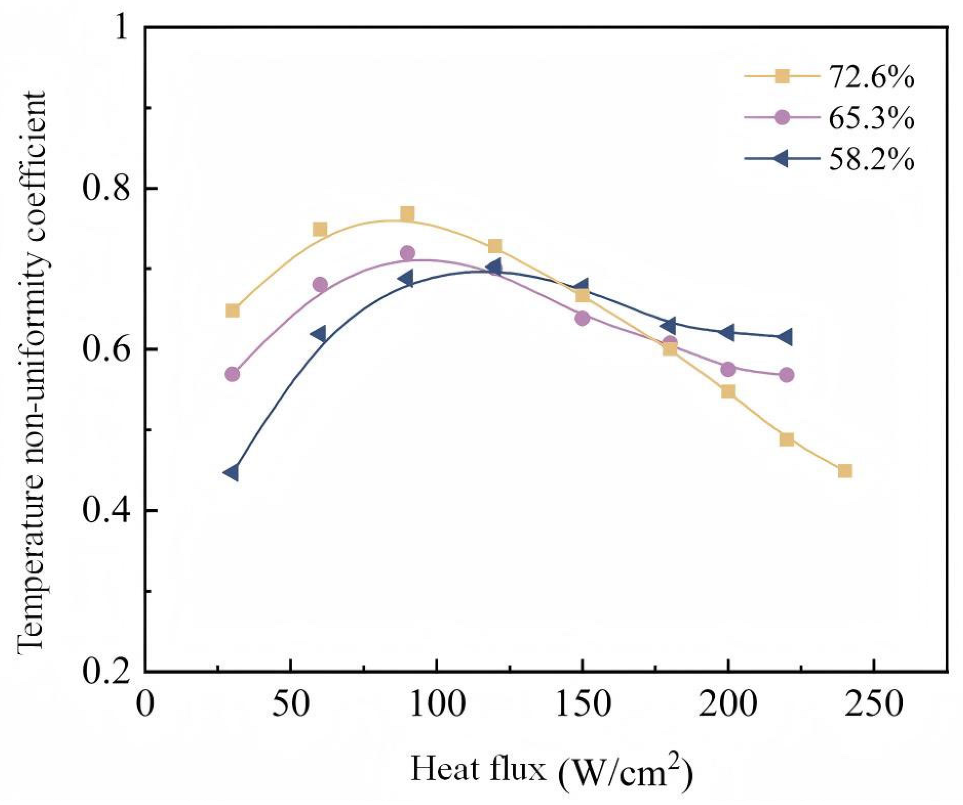
The variation of the non-uniformity coefficient under medium-high filling ratios is presented in Figure 34. As heat flux increased, the non-uniformity coefficient first increased and then decreased, indicating an initial decline followed by an improvement in temperature uniformity. The initial deterioration in uniformity at low heat fluxes was attributable to the same reasons as for high filling ratios (low mass flow rate, large temperature differences). With further increases in heat flux, the loop entered a regime of vigorous intermittent boiling. The associated perturbations enhanced two-phase flow, increased the mass flow rate, intensified heat transfer, and improved temperature uniformity. However, due to the relatively lower filling ratios, a high-velocity mass circulation could not be established, resulting in a smaller reduction in the non-uniformity coefficient compared to high filling ratio conditions. At low heat fluxes, lower filling ratios provided better temperature uniformity because the reduced liquid level in the condenser increased the vapor space, enhancing the proportion of latent heat condensation and improving overall condensation efficiency. At high heat fluxes, higher filling ratios yielded better uniformity, as they supported higher mass flow rates, enhancing both sensible and latent heat transfer.
Figure 35 depicts the variation of the non-uniformity coefficient under low filling ratios. At low heat fluxes, the coefficient was small, indicating good temperature uniformity. This was due to the dominance of vapor condensation (latent heat transfer) in the condenser, which provided high heat transfer efficiency. As heat flux increased, boiling in the evaporator became vigorous, but the low mass flow rate eventually led to dryout. The consequent temperature rise in the evaporator substantially increased the temperature difference between the evaporator and condenser, degrading temperature uniformity and causing a sharp increase in the non-uniformity coefficient. This effect was more pronounced at lower filling ratios.

4. Conclusions

A visualized experiment was conducted to study the heat transfer and phase-change mechanisms in the heating section of a two-phase loop thermosyphon under high heat flux, with low, medium-high, and high filling ratios. Key findings are the following:
(1)
Temperature fluctuation evolution with heat flux depends on filling ratio, with the high ratio containing three stages (no fluctuation–fluctuation–no fluctuation) and a max heat flux of 240 W/cm2, the medium-high ratio containing two stages and persistent thermal instability, and the low ratio containing a sharp temperature rise at high flux and a max of 150 W/cm2.
(2)
The flow pattern evolution in the heating section depends on the filling ratio. At a high filling ratio, as the heat flux increases, the flow pattern transitions from subcooled flow boiling to intermittent boiling, and then to stable subcooled flow boiling, accompanied by a significant reduction in bubble size. At a low filling ratio, the flow pattern evolves sequentially from bubbly flow to slug flow, then to churn flow, and finally to dryout at high heat fluxes.
(3)
High filling ratio enhances heat transfer capacity significantly; thermal resistance drops below 0.1 K/W above 200 W/cm2, though condenser resistance dominates. Low ratio suits low heat flux dissipation; high ratio suits high heat flux devices. Non-uniformity coefficient first increases then decreases with heat flux under high ratio. Excessively low cooling water temperatures impair temperature uniformity and increase thermal resistance and should be avoided if cooling capacity is sufficient.
In this study, only R134a was used as the working fluid. Long-term operation and variations in geometric parameters were not considered. Therefore, the generalizability of the conclusions is limited. Future work will include comparisons of multiple working fluids, full-loop visualization, long-term reliability experiments, and thermal validation using real electronic devices, in order to promote the practical application of two-phase loop thermosyphon with high filling ratios.

Author Contributions

Conceptualization, C.Y.; methodology, D.T.; software, K.W.; validation, J.Z.; formal analysis, J.Z.; investigation, C.Y.; writing—original draft preparation, C.Y.; writing—review and editing, C.Y.; visualization, J.Z.; funding acquisition, C.Y. All authors have read and agreed to the published version of the manuscript.

Funding

This research received no external funding.

Data Availability Statement

The data presented in this study are available on request from the corresponding author.

Conflicts of Interest

The authors declare no conflicts of interest.

Nomenclature

SymbolMeaningUnit
English letters
AHeating surface areacm2
QHeating powerW
TTemperatureK
RThermal resistanceW/K
m ˙ Mass flow ratekg/s
CpSpecific heat at constant pressureJ/(kg K)
Greek letters
ηTemperature uniformity
k Thermal conductivityW/(m·K)
Subscripts
liquidWater
maxMaximum
loopLoop
evaEvaporator
conCondenser
inInlet
outOutlet

References

  1. Zheng, R.; Wu, Y.; Li, Y.; Wang, G.; Ding, G.; Sun, Y. Development of a hierarchical microchannel heat sink with flow field reconstruction and low thermal resistance for high heat flux dissipation. Int. J. Heat Mass Transf. 2022, 182, 121925. [Google Scholar] [CrossRef]
  2. Cao, J.; Zheng, Z.; Asim, M.; Hu, M.; Wang, Q.; Su, Y.; Pei, G.; Leung, M.K.H. A review on independent and integrated/coupled two-phase loop thermosyphons. Appl. Energy 2020, 280, 115885. [Google Scholar] [CrossRef]
  3. Zhang, Y.; Li, H.; Zhou, Y.; Ma, J.; Lin, K.-T.; Lin, H.; Guo, C.; Jia, B. Beyond conventional cooling: Advanced micro/nanostructures for managing extreme heat flux. Adv. Mater. 2025, 38, e04706. [Google Scholar] [CrossRef]
  4. Guo, S.; Li, X.; Shen, C.; Han, Z. Advances in thermal management of semiconductor devices: Multi-scenario compatible solutions, challenges, and future perspectives. Appl. Therm. Eng. 2025, 279, 128010. [Google Scholar] [CrossRef]
  5. Zha, Y.; Meng, X.; Qin, S.; Hou, N.; He, S.; Huang, C.; Zuo, H.; Zhao, X. Performance evaluation with orthogonal experiment method of drop contact heat dissipation effects on electric vehicle lithium-ion battery. Energy 2023, 271, 127049. [Google Scholar] [CrossRef]
  6. Zhou, Z.F.; Lin, X.W.; Ji, R.J.; Zhu, D.Q.; Chen, B.; Wang, H.; Lu, Y.J. Enhancement of heat transfer on micro- and macro-structural surfaces in close-loop R410A flashing spray cooling system for heat dissipation of high-power electronics. Appl. Therm. Eng. 2023, 223, 119978. [Google Scholar] [CrossRef]
  7. Lv, J.; Du, G.; Jin, P.; Li, R. Heat transfer analysis and structural optimization for spiral channel regenerative cooling thrust chamber. Int. J. Aerosp. Eng. 2023, 2023, 8628107. [Google Scholar] [CrossRef]
  8. Cheng, X.; Li, Z.R.; Wan, H.N.; Bi, Q.C.; Ji, W.T. Experimental investigation on convective heat transfer of hydrocarbon fuel in transverse corrugated tubes. Int. J. Heat Mass Transf. 2023, 201, 123586. [Google Scholar] [CrossRef]
  9. Chaurasia, S.; Goel, V.; Debbarma, A. Impact of hybrid roughness geometry on heat transfer augmentation in solar air heater: A review. Sol. Energy 2023, 255, 435–459. [Google Scholar] [CrossRef]
  10. Babazadeh, M.A.; Babaelahi, M.; Saadatfar, M. Enhancing solar Stirling engine performance through the use of innovative heat transfer fin shapes. Int. J. Therm. Sci. 2023, 190, 108290. [Google Scholar] [CrossRef]
  11. Pan, Q.W.; Liu, L.; Wang, B.; Xu, J.; Ge, T.S. Design and experimental study on a small-scale silica gel/water adsorption chiller with heat and mass recovery scheme for solar energy use. Sol. Energy 2023, 252, 91–100. [Google Scholar] [CrossRef]
  12. Shi, X.; Mu, Y.; Chen, G.; Zhang, X. Experimental investigation on the start-up characteristics of single loop thermosyphon for motorized spindle bearing-shaft system cooling. Int. Commun. Heat. Mass. Transf. 2021, 120, 104989. [Google Scholar] [CrossRef]
  13. Fang, C.; Tong, Z.; Zang, G. Experimental study of instability characteristics of a CO2 two-phase thermosyphon loop. Int. Commun. Heat. Mass. Transf. 2023, 142, 106639. [Google Scholar] [CrossRef]
  14. He, Y.; Hu, C.; Li, H.; Hu, X.; Tang, D. Visualized-experimental investigation on a mini-diameter loop thermosyphon with a wide range of filling ratios. Int. Commun. Heat. Mass. Transf. 2022, 133, 105973. [Google Scholar] [CrossRef]
  15. Liu, Y.; Li, Z.; Li, Y.; Jiang, Y.; Tang, D. Heat transfer and instability characteristics of a loop thermosyphon with wide range of filling ratios. Appl. Therm. Eng. 2019, 151, 262–271. [Google Scholar] [CrossRef]
  16. Liu, Y.; Li, Z.; Li, Y.; Kim, S.; Jiang, Y. Experimental investigation of geyser boiling in a two-phase closed loop thermosyphon with high filling ratios. Int. J. Heat Mass Transf. 2018, 127, 857–869. [Google Scholar] [CrossRef]
  17. Thongdaeng, S.; Pipatpaiboon, N.; Donmuang, A. Visualization and heat transfer in a closed loop thermosyphon with a check valve. Case Stud. Therm. Eng. 2020, 22, 100758. [Google Scholar] [CrossRef]
  18. Zhang, H.; Shao, S.; Xu, H.; Tian, C. The transient response, oscillation and internal flow of a loop thermosyphon with dual evaporators. Int. J. Refrig. 2018, 88, 451–457. [Google Scholar] [CrossRef]
  19. Zhang, P.; Wang, B.; Shi, W.; Li, X. Experimental investigation on two-phase thermosyphon loop with partially liquid-filled downcomer. Appl. Energy 2015, 160, 10–17. [Google Scholar] [CrossRef]
  20. Tong, Z.; Liu, X.-H.; Jiang, Y. Three typical operating states of an R744 two-phase thermosyphon loop. Appl. Energy 2017, 206, 181–192. [Google Scholar] [CrossRef]
  21. Zhang, T.; Qu, J.; Hua, Y. Heat transfer characteristics and operational visualization of two-phase loop thermosyphon. Appl. Therm. Eng. 2023, 228, 120520. [Google Scholar] [CrossRef]
  22. Cao, H.; Li, H.; Ding, T.; He, Z.; Li, Z. Research on the refrigerant distribution and distinctive flow phenomena in a two-phase loop thermosyphon through a holistic visualization method. Int. J. Refrig. 2021, 125, 64–74. [Google Scholar] [CrossRef]
  23. Zhang, L.; Hua, M.; Zhang, X.; Yu, Z.; Mei, R. Visualized investigation of gas–liquid stratified flow boiling of water in a natural circulation thermosyphon loop with horizontal arranged evaporator. Int. J. Heat Mass Transf. 2016, 102, 980–990. [Google Scholar] [CrossRef]
  24. Wang, Y.; Wang, X.; Chen, H.; Taylor, R.A.; Zhu, Y. A combined CFD/visualized investigation of two-phase heat and mass transfer inside a horizontal loop thermosiphon. Int. J. Heat Mass Transf. 2017, 112, 607–619. [Google Scholar] [CrossRef]
  25. Elkholy, A.; Kempers, R. Experimental investigation of geyser boiling in a small diameter two-phase loop thermosyphon. Exp. Therm. Fluid. Sci. 2020, 118, 110170. [Google Scholar] [CrossRef]
  26. Lu, J.; Cai, Y.; Li, Y.; Hu, C.; Tang, D. Visualization investigation of the impact of two-phase flow patterns on heat transfer in the loop thermosyphon with a parallel mini-channels evaporator. Appl. Therm. Eng. 2025, 279, 127636. [Google Scholar] [CrossRef]
  27. Zamanifard, A.; Wang, C.C. An experimental study on a novel two-phase loop thermosyphon applicable for cooling in 2U servers. Appl. Therm. Eng. 2025, 278, 127123. [Google Scholar] [CrossRef]
  28. Cai, Y.; Hu, X.; Lu, J.; Li, Y.; Tang, D.; Hu, C. Impact of working fluid properties on heat transfer and flow characteristics of two-phase loop thermosyphon with high filling ratios. Int. J. Heat Mass Transf. 2025, 238, 126482. [Google Scholar] [CrossRef]
  29. He, Y.; Hu, C.; Li, H.; Hu, X.; Tang, D. Visualized-experimental assessment on a two-phase thermosyphon loop downcomer state with wide range of filling ratios. Appl. Therm. Eng. 2024, 242, 122497. [Google Scholar]
  30. Zhang, H.; Ding, J.; Liu, H.; Ding, T.; Feng, Y. Start-up investigation and heat transfer enhancement analysis of a loop thermosyphon with biomimetic honeycomb-channel evaporator. Int. J. Refrig. 2025, 169, 383–390. [Google Scholar] [CrossRef]
  31. Li, G.; Zhang, Y.C.; Zhang, G.H.; Huang, S.Y.; Ding, S.T. Transient experimental and numerical study of thermosyphon under different heating fluxes and filling ratios. Appl. Therm. Eng. 2024, 243, 122514. [Google Scholar] [CrossRef]
  32. Zhu, L.; Zhu, Z.; Xie, F.; Qin, Y. Instability characteristics and heat transfer of a separator assisted dual-evaporators loop thermosyphon under heating power maldistribution condition. Appl. Therm. Eng. 2024, 255, 124038. [Google Scholar] [CrossRef]
  33. Baek, S.; Park, C.; Lee, S.; Sung, Y. Enhancing thermal performance of two-phase closed thermosyphons by inhibiting geyser boiling: Synergistic effects of carbon nanotube nanofluids. Case Stud. Therm. Eng. 2025, 66, 105764. [Google Scholar] [CrossRef]
  34. Balihar, A.J.; Karmakar, A.; Kumar, A.; Minj, S.; Sangso, P.L.J. Analysis of thermal performance in a two-phase thermosyphon loop based on flow visualization and an image processing technique. Heat Transf. Res. 2024, 55, 71–89. [Google Scholar] [CrossRef]
  35. Ma, H.; Cao, J.; Sheng, Q. Experimental study of flow and temperature oscillation in loop thermosyphon with water and carbon-nanotube nanofluid. Appl. Therm. Eng. 2025, 274, 126597. [Google Scholar] [CrossRef]
  36. He, Y.; Hu, C.; Hu, X.; Wang, H.; Tang, D. Assessing the enhancements in thermal performance of two-phase thermosyphon loops through riser wettability optimization. Int. J. Heat Mass Transf. 2024, 218, 124731. [Google Scholar] [CrossRef]
  37. Qu, J.; Zhao, Y.; Hua, Y.; Yang, W.; Gao, S. Comparative study of operational characteristics for two-phase loop thermosyphons with and without pump assistant: Heat transfer performance and high-speed visualization observation. Appl. Therm. Eng. 2025, 271, 126382. [Google Scholar] [CrossRef]
  38. Srivastava, A.; Kumar, P.; Dash, S.; Ambirajan, A.; Dutta, P. Visualisation within horizontal evaporator of a two-phase loop thermosyphon. In Proceedings of the 28th National and 6th International ISHMT-ASTFE Heat and Mass Transfer Conference, Jodhpur, India, 9–12 December 2025. [Google Scholar]
  39. Sapozhnikov, S.Z.; Mityakov, V.Y.; Mityakov, A.V. Heatmetry: The Science and Practice of Heat Flux Measurement; Springer: Cham, Switzerland, 2020. [Google Scholar]
  40. Kravets, V.; Alekseik, Y.; Alekseik, O.; Khairnasov, S.; Baturkin, V.; Ho, T.; Celotti, L. Heat pipes with variable thermal conductance property for space applications. J. Mech. Sci. Technol. 2017, 31, 2613–2620. [Google Scholar] [CrossRef]
Figure 1. The experimental system: (a) schematic diagram and (b) experimental system diagram.
Energies 19 02674 g001
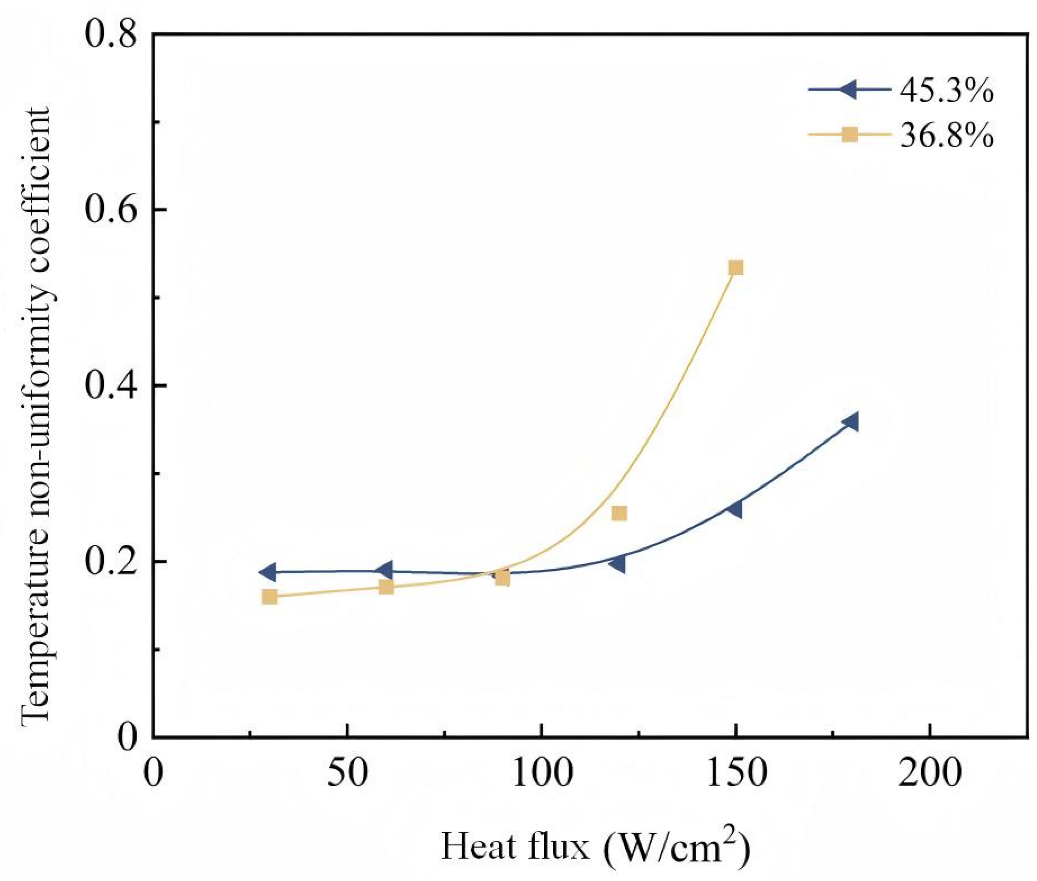
Figure 2. The structure diagram of the loop thermosyphon.
Energies 19 02674 g002
Figure 3. Structure diagram of the loop thermosyphon evaporator: (a) overall three-dimensional exploded view; (b) front view of the assembled evaporator; (c) cross-sectional side view; (d) enlarged view of the heating section. (e) Cross-sectional top view.
Energies 19 02674 g003
Figure 4. Total heat transferred by the loop versus the heat load.
Energies 19 02674 g004
Figure 5. Temperature change of heating surface under high filling ratios: (a) 92.3%; (b) 86.1%; and (c) 81.6%.
Energies 19 02674 g005
Figure 6. Temperature change of heating surface under medium-high filling ratios: (a) 72.6%; (b) 65.3%; and (c) 58.2%.
Energies 19 02674 g006
Figure 7. Temperature change of heating surface under low filling ratios: (a) 45.3% and (b) 36.8%.
Energies 19 02674 g007
Figure 8. The two-phase flow pattern in the evaporator at filling ratio of 81.6% (heat flux 30–60 W/cm2) temperature, indicating the onset of boiling. The absence of bubbles near the heating section inlet suggests subcooled flow boiling in this region. As the heat flux increased to 60 W/cm2, the number of bubbles within the heating section increased significantly, intensifying boiling, but bubbles were still absent at the inlet, maintaining a bubbly flow pattern.
Energies 19 02674 g008
Figure 9. The process of bubble growth and detachment on the heating section wall (heat flux 60 W/cm2).
Energies 19 02674 g009
Figure 10. The two-phase flow pattern in the evaporator at filling ratio of 81.6% (heat flux 90 W/cm2).
Energies 19 02674 g010
Figure 11. The two-phase flow pattern in the evaporator at filling ratio of 81.6% (heat flux 120 W/cm2).
Energies 19 02674 g011
Figure 12. The two-phase flow pattern in the evaporator at filling ratio of 81.6% (heat flux 150 W/cm2).
Energies 19 02674 g012
Figure 13. The two-phase flow pattern in the evaporator at filling ratio of 81.6% (heat flux 180 W/cm2).
Energies 19 02674 g013
Figure 14. The two-phase flow pattern in the evaporator at filling ratio of 81.6% (heat flux 200–240 W/cm2).
Energies 19 02674 g014
Figure 15. (a) The process of bubble growth and detachment on the heating section wall under heat flux of 200 W/cm2 and (b) bubble detachment size (200–240 W/cm2).
Energies 19 02674 g015
Figure 16. The flow pattern in the evaporator at filling ratio of 65.3% (heat flux 30 W/cm2).
Energies 19 02674 g016
Figure 17. The process of bubble growth and detachment on the heating section wall (heat flux 30 W/cm2).
Energies 19 02674 g017
Figure 18. The two-phase flow pattern in the evaporator at filling ratio of 65.3% (heat flux 30–120 W/cm2).
Energies 19 02674 g018
Figure 19. The two-phase flow pattern in the evaporator at filling ratio of 65.3% (heat flux 150 W/cm2).
Energies 19 02674 g019
Figure 20. The two-phase flow pattern in the evaporator at filling ratio of 65.3% (heat flux 180 W/cm2).
Energies 19 02674 g020
Figure 21. The two-phase flow pattern in the evaporator at filling ratio of 65.3% (heat flux 200 W/cm2).
Energies 19 02674 g021
Figure 22. The two-phase flow pattern in the evaporator at filling ratio of 65.3% (heat flux 220 W/cm2).
Energies 19 02674 g022
Figure 23. The flow pattern in the evaporator at filling ratio of 36.8% (heat flux 30 W/cm2).
Energies 19 02674 g023
Figure 24. The flow pattern in the evaporator at filling ratio of 36.8% (heat flux 60 W/cm2).
Energies 19 02674 g024
Figure 25. The two-phase flow pattern in the evaporator at filling ratio of 36.8%: (a) 90 W/cm2 and (b) 120 W/cm2.
Energies 19 02674 g025
Figure 26. The two-phase flow pattern in the evaporator at filling ratio of 36.8%: (a) 150 W/cm2 and (b) 180 W/cm2.
Energies 19 02674 g026
Figure 27. The thermal resistance of the loop under high filling ratio conditions: (a) total thermal resistance of the loop; (b) thermal resistance of evaporation section; and (c) thermal resistance of condensation section.
Energies 19 02674 g027
Figure 28. The thermal resistance of under medium-high filling ratio conditions: (a) total thermal resistance of the loop; (b) thermal resistance of evaporation section; and (c) thermal resistance of condensation section.
Energies 19 02674 g028
Figure 29. The thermal resistance of the loop under low filling ratio conditions: (a) total thermal resistance of the loop; (b) thermal resistance of evaporation section; and (c) thermal resistance of condensation section.
Energies 19 02674 g029
Figure 30. The ratio of evaporation and condensation thermal resistance to total thermal resistance: (a) high filling ratios; (b) medium filling ratios; and (c) low filling ratios.
Energies 19 02674 g030
Figure 31. The variation law of thermal resistance with heat flux density under different filling ratios.
Energies 19 02674 g031
Figure 32. The heat transfer diagram of loop thermosyphon.
Energies 19 02674 g032
Figure 33. The variation of non-uniformity coefficients from the loop thermosyphon with heat flux density under high filling ratios.
Energies 19 02674 g033
Figure 34. The variation of non-uniformity coefficients from the loop thermosyphon with heat flux density under medium-high filling ratios.
Energies 19 02674 g034
Figure 35. The variation of non-uniformity coefficients from the loop thermosyphon with heat flux density under low filling ratios.
Energies 19 02674 g035
Table 1. Comparison of representative visualization studies on two-phase thermosyphon loops in the past three years.
Literature SourceFilling RatioHeat Flux/Power RangeWorking FluidVisualization Region
Lu et al. [26]30–90%700 WNot specifiedEvaporator, riser
Zamanifard [27]35–60%120–850 W, 92 W/cm2Not specifiedWhole loop
Cai et al. [28]30–90%Up to 270/390 W/cm2H2O, R134aHeated section of evaporator
He et al. [29]Wide rangeHigh heat fluxNot specifiedDowncomer
Zhang et al. [30]35–50%≤250 WR141bRiser
Zhu et al. [32]50–70%Max. power difference 350 WNot specifiedLiquid line, two-phase line
Balihar et al. [34]0.88400 WH2OEvaporator
Ma et al. [35]30–70%Variable heat fluxH2OVapor line
Table 2. Uncertainties of the main experimental parameters.
Equipment/MaterialMeasurement RangeUncertainty
Thermocouple−50–400 °C±0.1 °C
Pressure Sensor0–3.5 MPa±40 Pa
DC Power Supply220 V 10 A±0.5%
Flow Meter0–10 L/min±0.1 L/min
Filling Ratio0–100%±0.1%
Chiller5–35 °C±0.2 °C
Disclaimer/Publisher’s Note: The statements, opinions and data contained in all publications are solely those of the individual author(s) and contributor(s) and not of MDPI and/or the editor(s). MDPI and/or the editor(s) disclaim responsibility for any injury to people or property resulting from any ideas, methods, instructions or products referred to in the content.