1. Introduction
In recent years, the frequent and intense occurrence of extreme weather events has significantly increased the risks posed to the stable operation of a power system by the stochastic, fluctuating, and intermittent output of large-scale, high-penetration wind and solar power stations [
1]. This has heightened concerns about the security of new-type power systems. Examples include the large-scale blackout in Brazil on 15 August 2023, caused by a surge in renewable energy output [
2], and the 28 April 2025, blackout in Spain and Portugal, which may have resulted from extreme temperature fluctuations [
3]. Enhancing the resilience of new-type power systems has thus become an urgent necessity [
4].
Given its flexible operation and rapid response capabilities, hydropower is considered one of the most effective energy sources for mitigating impacts on the power grid due to the integration of wind and solar power [
5], thus enhancing power system resilience. Existing studies indicate that extreme fluctuations in wind and solar output reduce the resilience of new-type power systems [
6] and that resilience can be improved through multi-energy complementary strategies, including optimized dispatching rules and capacity allocation [
7]. In terms of dispatching rules, Ref. [
8] proposed a rule for wind power curtailment under hurricane conditions to control ramp rates, which improved system resilience and reduced system costs by 7% in case studies. Ref. [
9] noted that the joint operation of hydropower and solar power under optimized dispatching rules not only harnesses their complementary potential but also enhances system resilience. In terms of capacity allocation, Ref. [
10] conducted simulations on the Texas power grid under hurricane conditions, examining scenarios where wind and solar accounted for 21%, 47%, and 60% of the installed capacity. The results showed that when the share of wind and solar exceeded 47%, the power system’s casualties and recovery costs increased significantly. Ref. [
11] investigated a clean energy generation system composed entirely of water, wind, and solar. They found that the allocation of 80% hydropower, 3% wind, and 17% solar achieved favorable economic performance while meeting resilience and reliability requirements. Ref. [
12] treated wind, solar, energy storage, and temperature-controlled loads as dispatchable resources and focused on enhancing resilience during the recovery phase; their case studies showed a 42% reduction in load shedding and a 28% improvement in resilience metrics.
Table 1 lists the evolution and gaps in the literature.
As extreme weather events often occur suddenly and last for a short duration, existing studies have mostly focused on intraday time scales, paying little attention to multi-day scenarios. However, given the existence of prolonged extreme weather events such as cold waves, the cumulative impact of wind and solar power integrated into the power grid is a research gap that remains underexplored, along with the question of whether hydropower can mitigate such effects. To fill this specific research gap, this study investigates the resilience-optimized dispatch of hydro–wind–solar power systems under continuous multi-day extreme scenarios.
3. Model Construction and Solution Approach
This study establishes a model for a hydro–wind–solar power generation system composed of a single hydropower station, a single wind farm, and a single photovoltaic power station. The model takes the system’s total output and the minimization of the average deviation percentage (hereinafter referred to as the average load deviation percentage) as the resilience objective. The proposed model takes the maximum total power generation of the hydro–wind–solar generation system as the economic objective, while considering constraints such as the water balance. The mathematical formulations are presented below.
- (1)
Objective functions
① Minimization of average load deviation percentage:
where
is the minimum average load deviation percentage, MW;
is the load demand in time period
t, MW; and
is the total output in time period
t, MW.
② Maximization of total power generation:
where
is the total power generation of the hydro-wind-solar system, MW·h;
T is the total number of time periods;
,
, and
are the hydro, wind, and solar power output in time period
t, respectively, MW; and Δ
t is the duration of each time period, s.
- (2)
Constraints
① Water balance constraint:
where
is the reservoir capacity at the beginning of time period
t, m
3; and
and
are the inflow and outflow in time period
t, m
3/s.
② Water level constraint:
where
is the reservoir water level at time
t, m; and
and
are the minimum and maximum allowable water levels, m.
③ Power output constraint:
where
is the hydropower output in time
t, MW;
and
are the minimum and maximum hydropower output, MW;
K is the output coefficient, MW/(m·m
3/s);
is the generation head, equal to the reservoir water level
minus the tailwater level (which was fixed in this study), m; and
is the power-generating flow rate, m
3/s.
④ Flow constraint:
where
is the spillage flow, which depends on the opening degree of spillage gate and the reservoir water level, m
3/s; and
and
are the minimum and maximum reservoir outflows, m
3/s.
⑤ Terminal water level constraint:
where
and
are the initial and final reservoir water levels of the dispatching period, usually set based on the regulation operator, m.
⑥ Water level fluctuation constraint:
where
is the maximum change in reservoir water level between two continuous time periods, m.
- (3)
Model solution
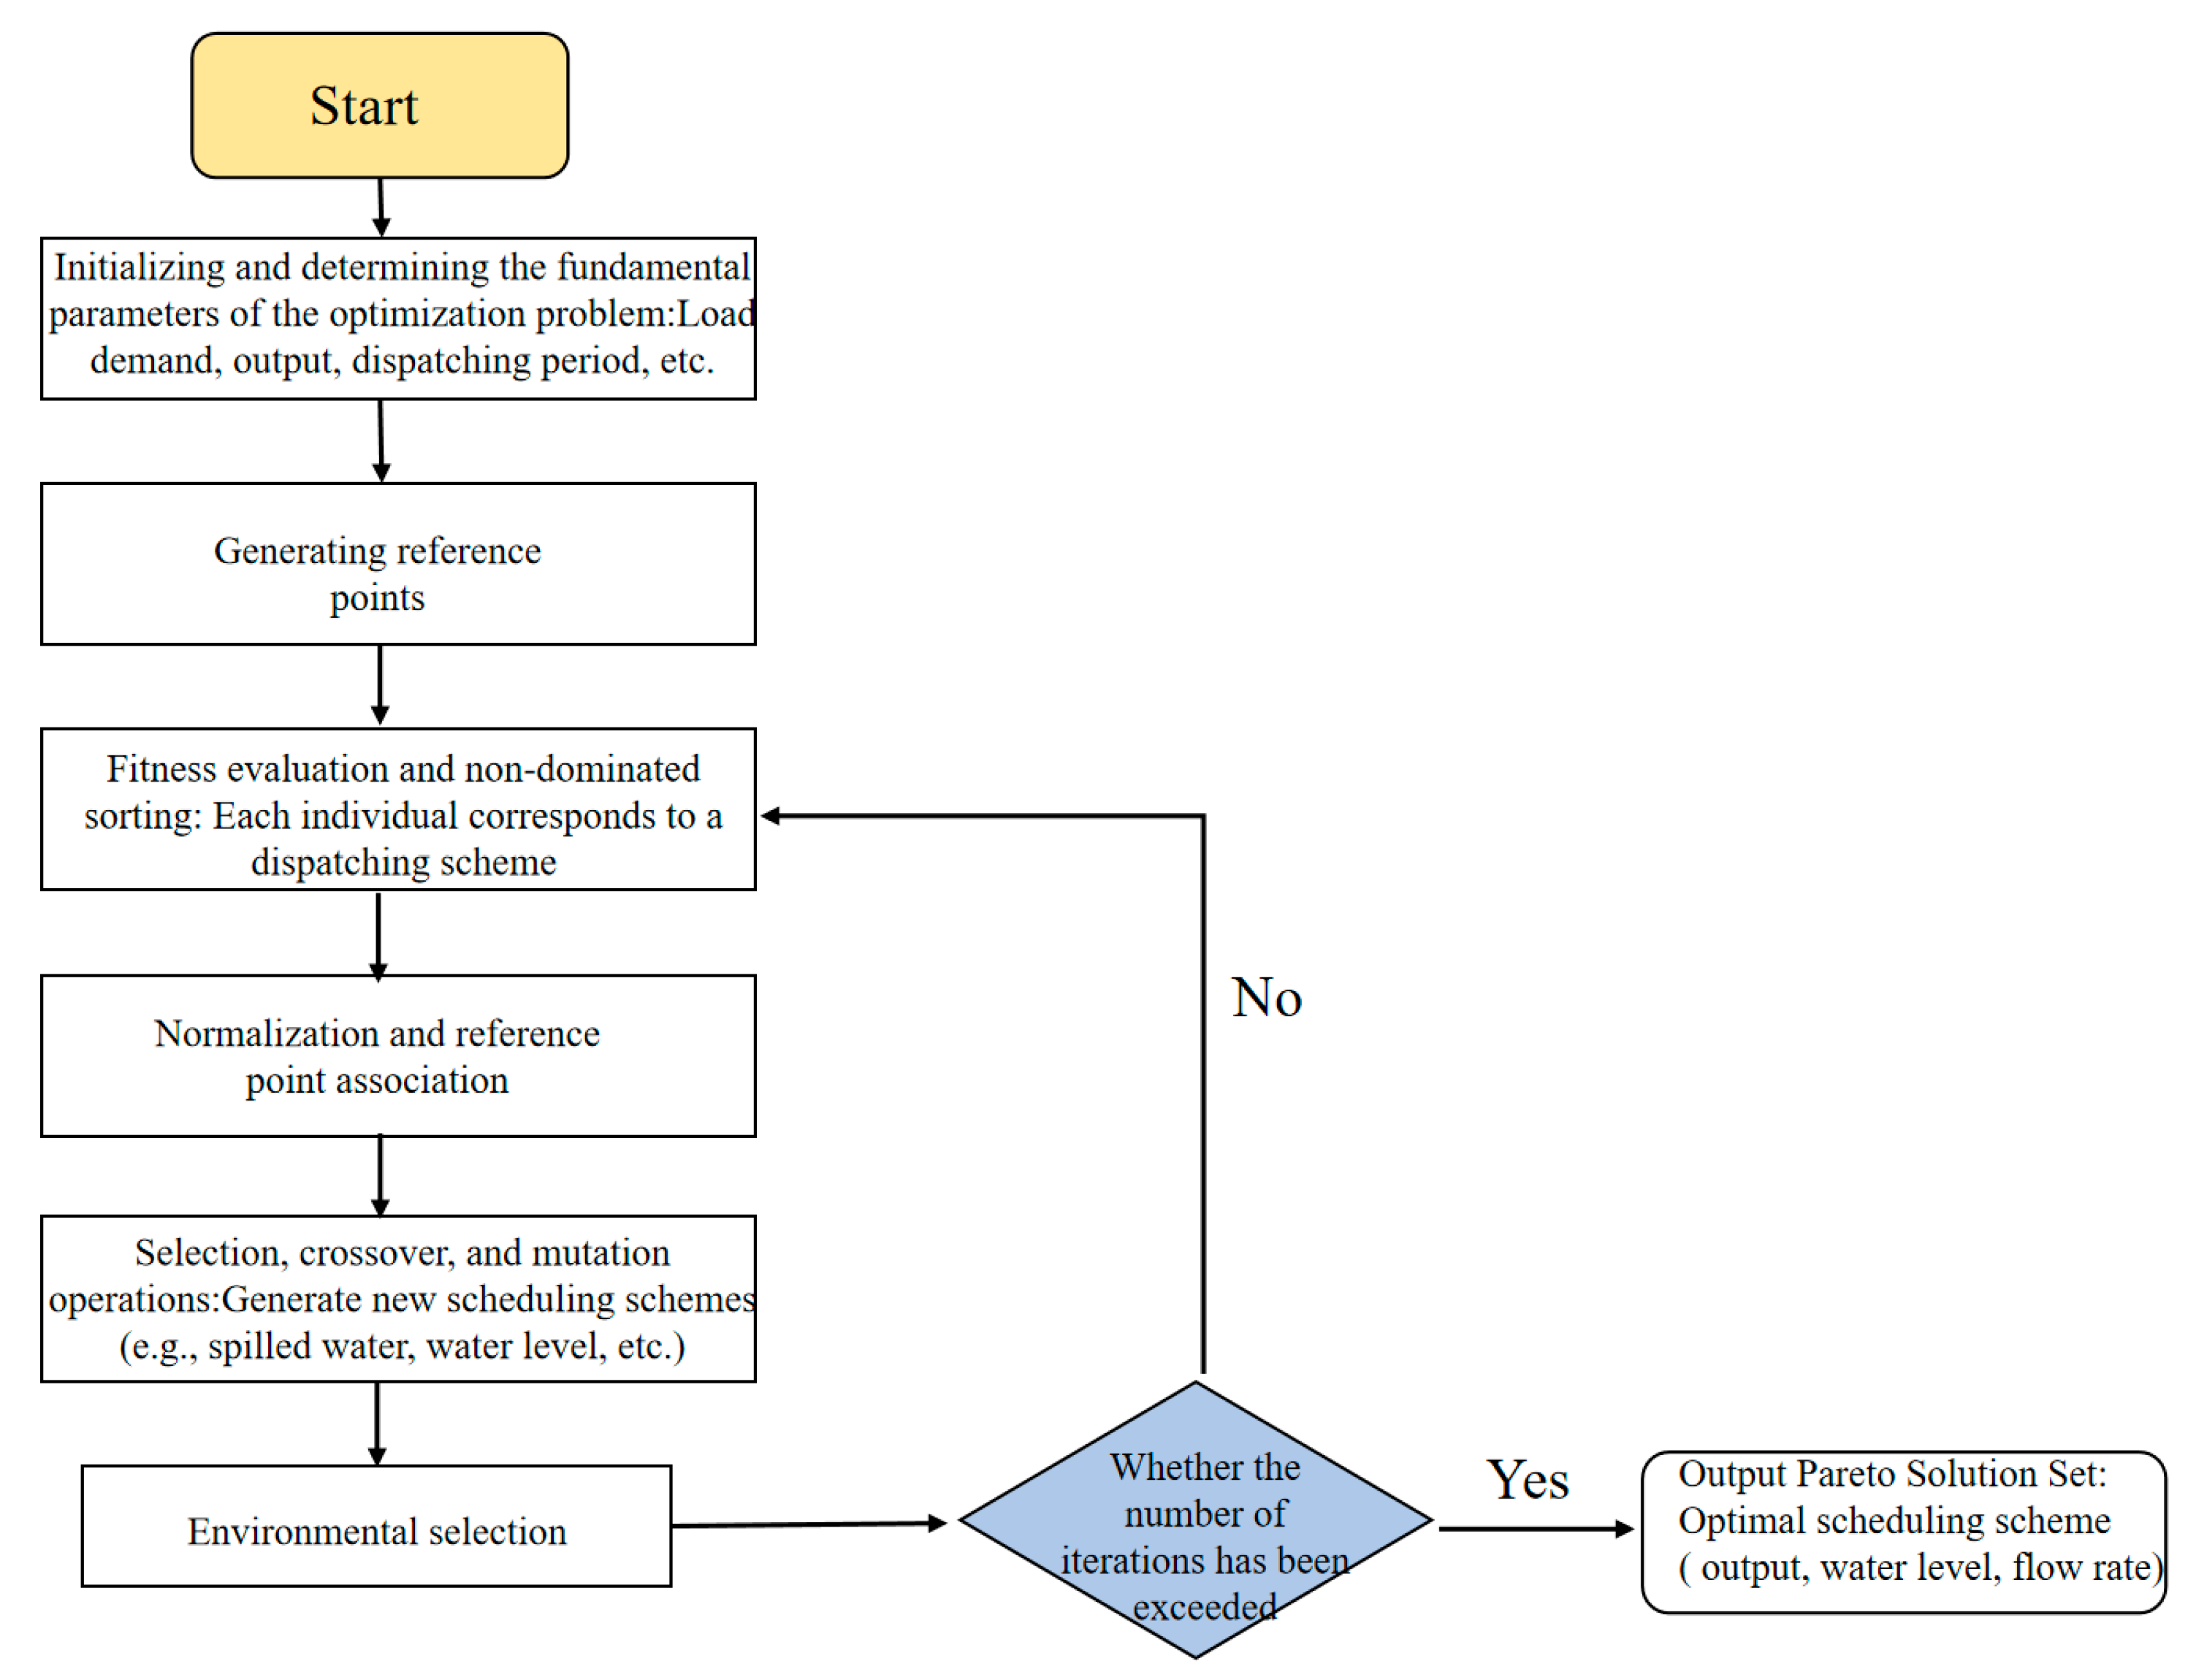
To solve the abovementioned model that contains two objectives and one optimized variable, methods such as NSGA-III (Non-dominated Sorting Genetic Algorithm III), the swarm method, and the weighted coefficient method in combination with the gradient method are suitable. Using the Pareto method or the weighted coefficient method in combination with the gradient method or another numerical method, the model can also be easily solved, and generalizations can even be obtained using the Pontryagin method with the Lagrangian. Based on the existing code and experienced basis of this study, NSGA-III is adopted in this work. NSGA-III is an evolutionary algorithm designed for multi-objective optimization that is particularly effective for problems with a large number of objectives [
14]. In this study, NSGA-III was employed to solve the short-term dispatching optimization model. The solution procedure is illustrated in
Figure 3.
In this paper, the maximization of the total hydro–wind–solar power generation and minimization of the average load deviation percentage are taken as the objective functions. The population size is set to 200, the maximum number of iterations to 20, the crossover probability to 0.3, and the mutation coefficient to 0.5. Different Pareto solution sets were analyzed.
4. Results and Analysis
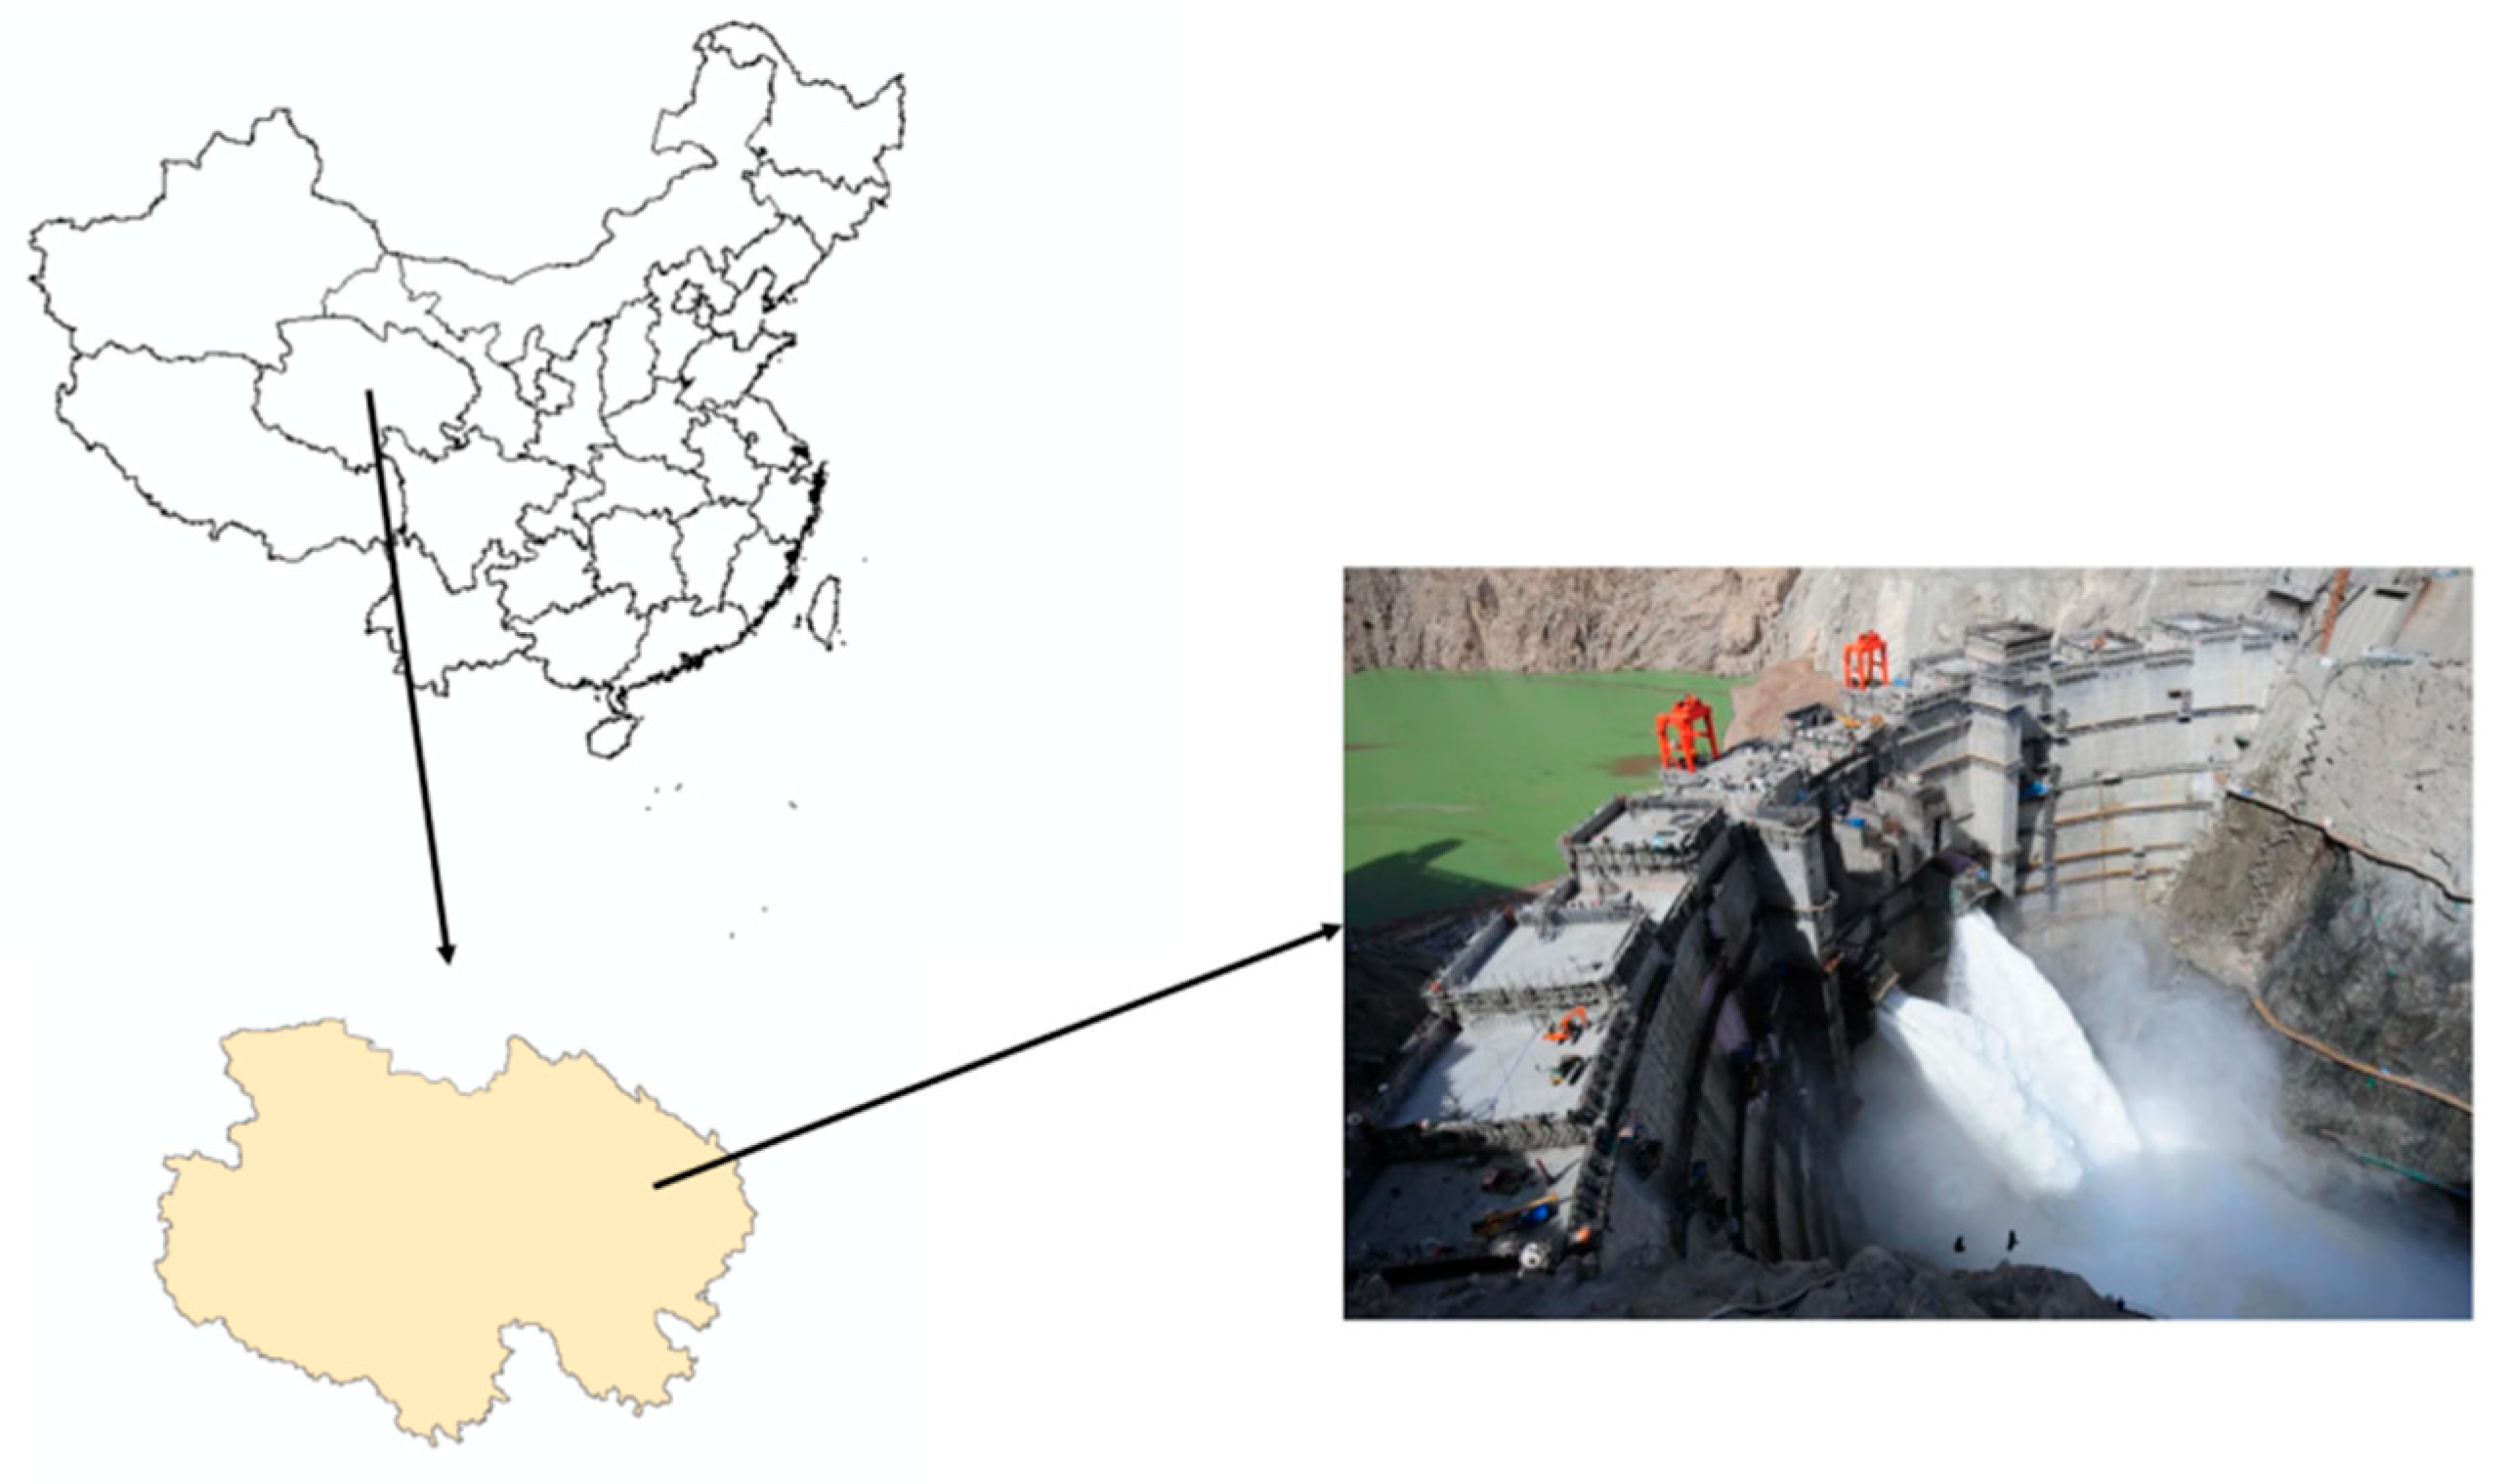
To explore the optimization mechanism for enhancing the resilience of hydro–wind–solar hybrid power systems under continuous multi-day extreme scenarios, this study focuses on the hybrid power system comprising the Laxiwa hydropower station and the nearby X wind farm and Y photovoltaic power station. The system performance is simulated under continuous multi-day extreme scenarios of wind and solar power under-, over-, and concurrent generation anomalies. To further investigate whether continuous extreme days introduce cumulative effects compared to single-day extremes, simulations were also conducted for single-day scenarios of under-, over-, and concurrent generation extremes. The specific results and analysis are as follows.
4.1. Under-Generation Scenario
4.1.1. Continuous Multi-Day Under-Generation Scenario
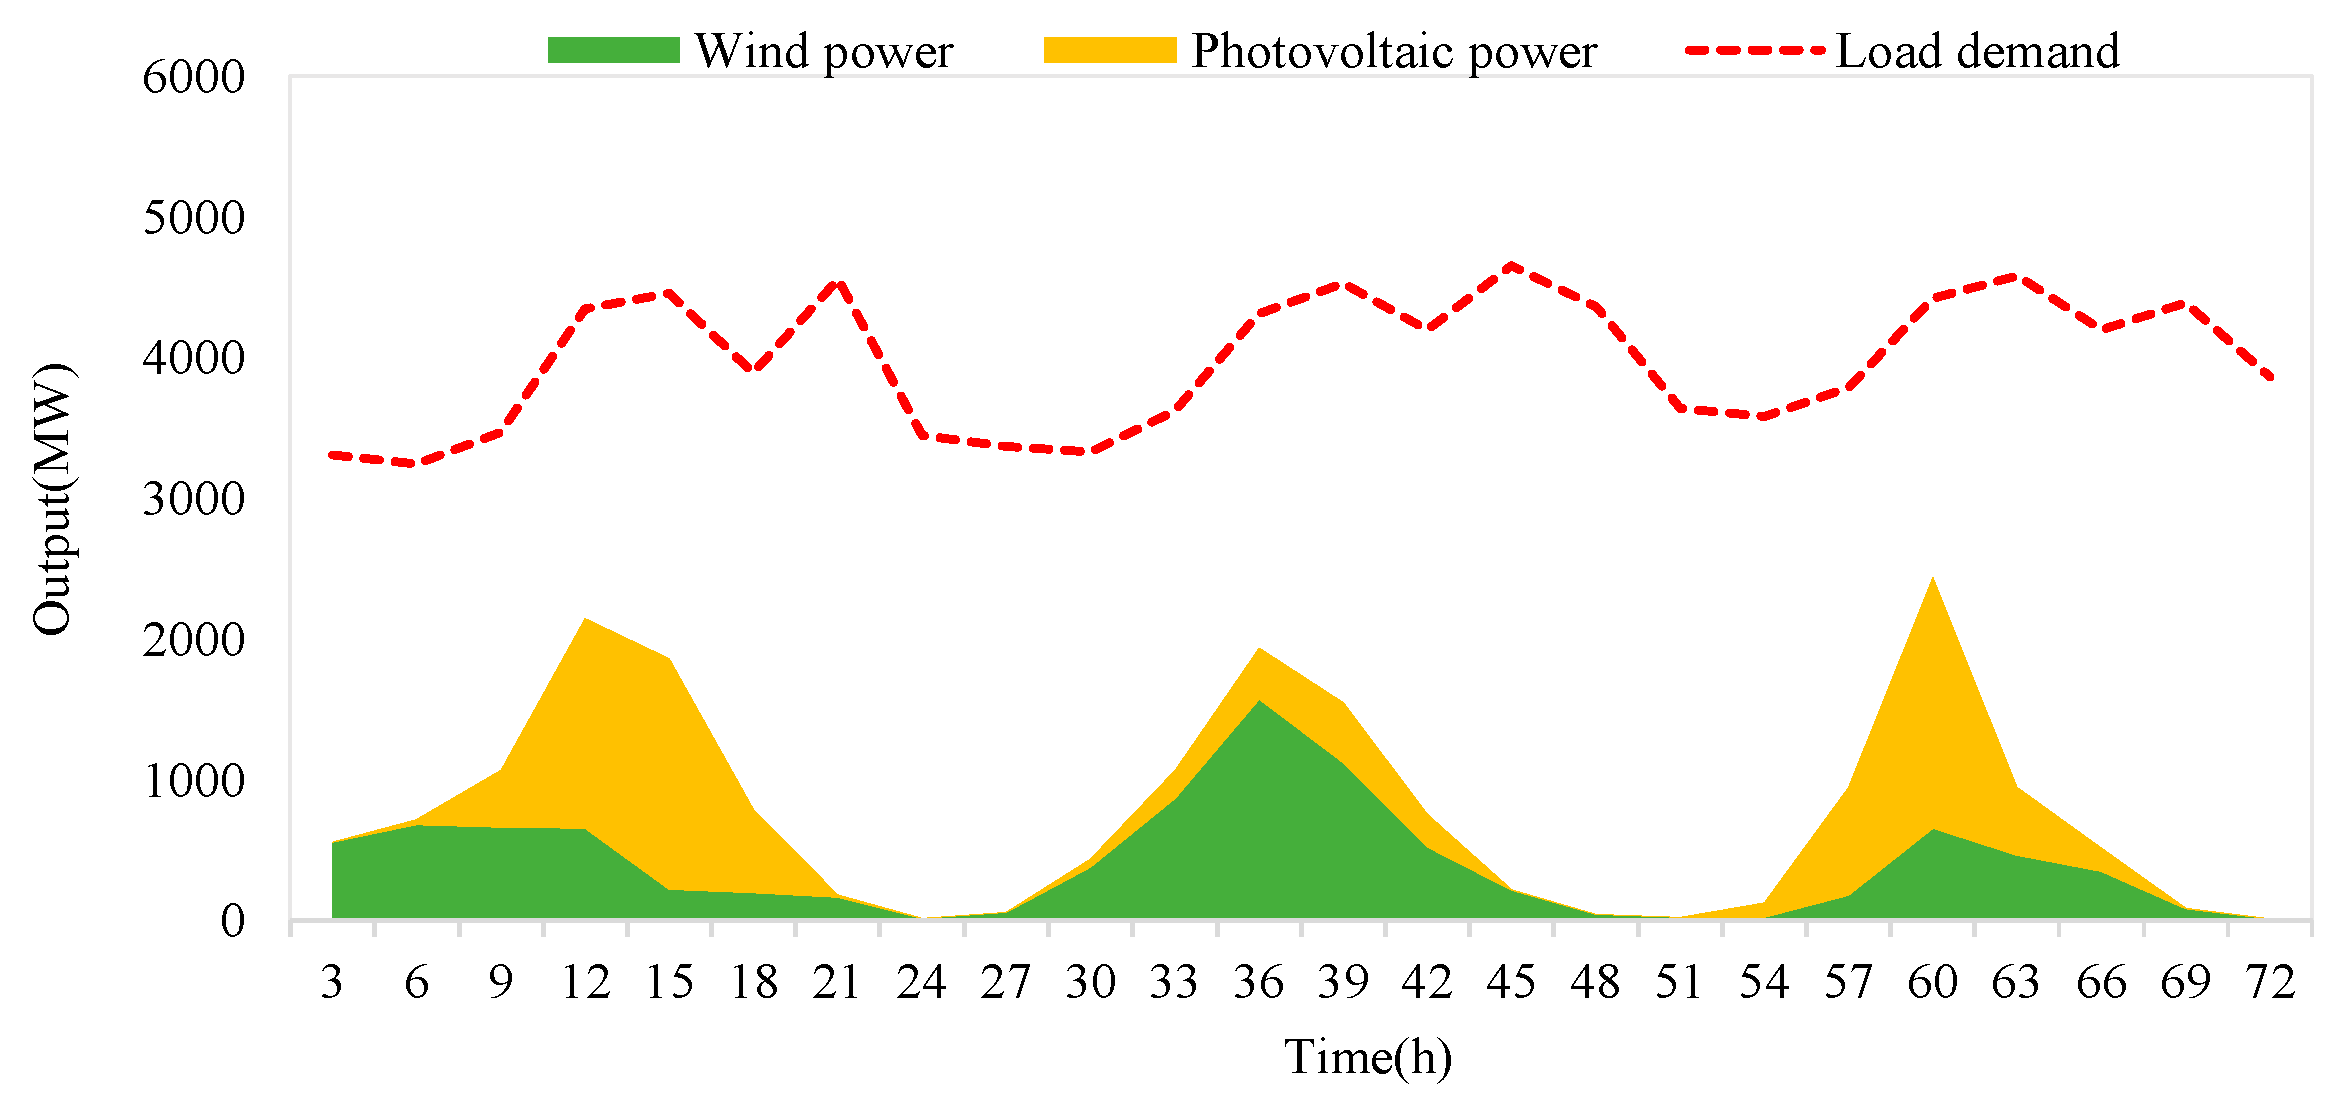
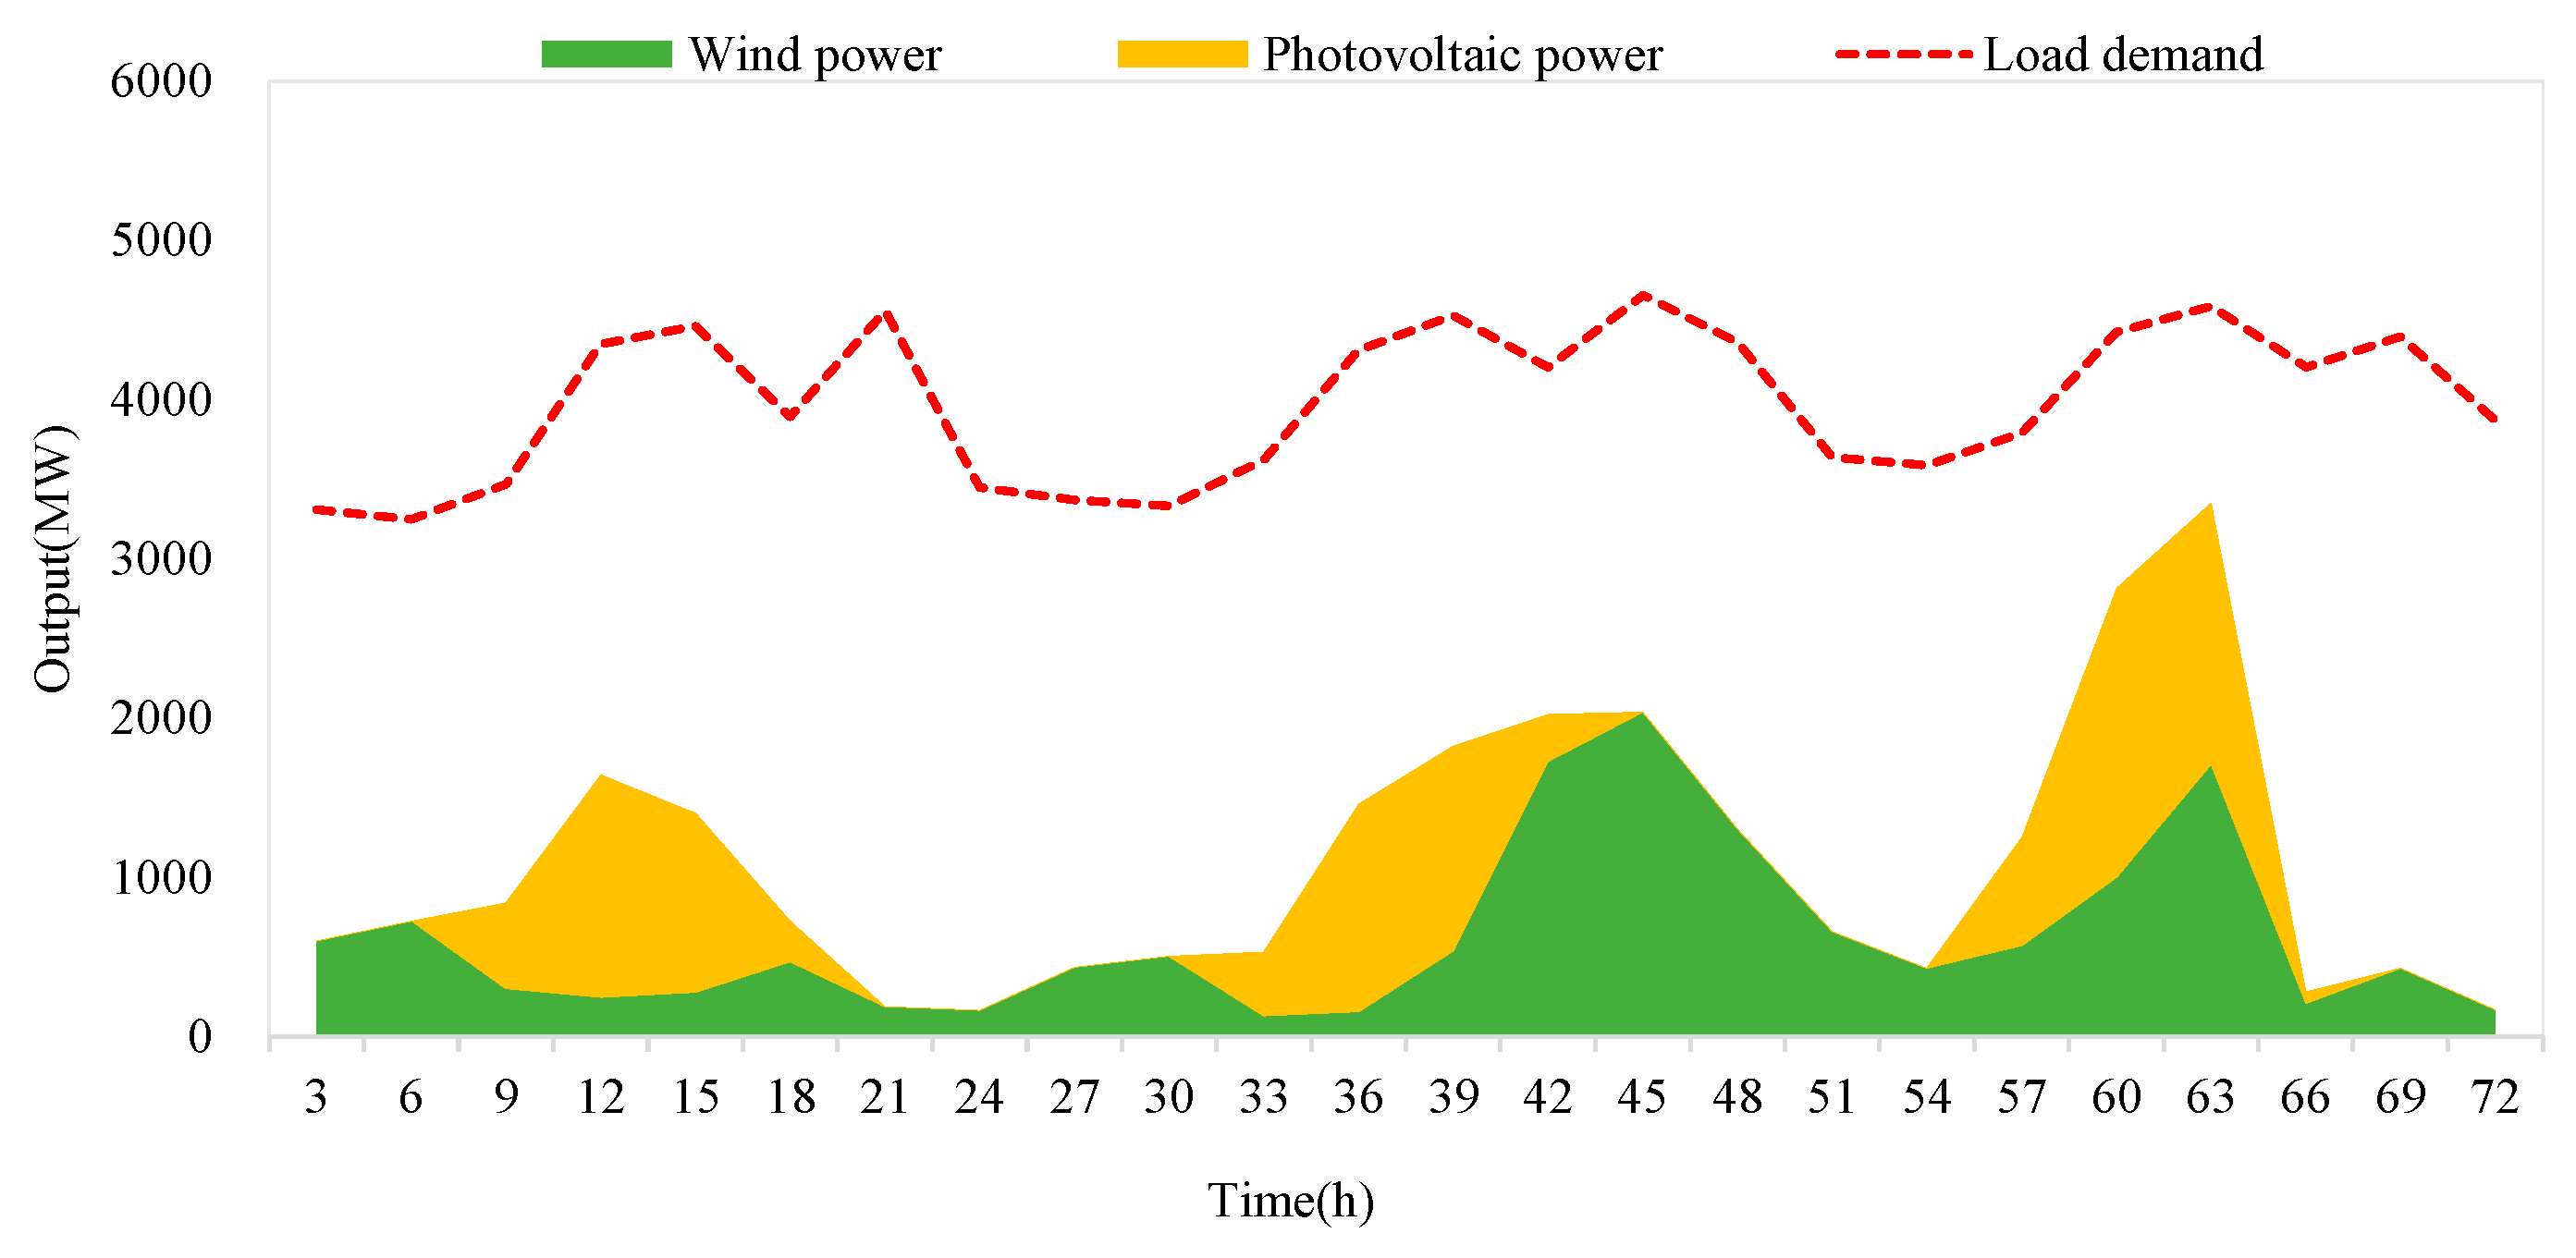
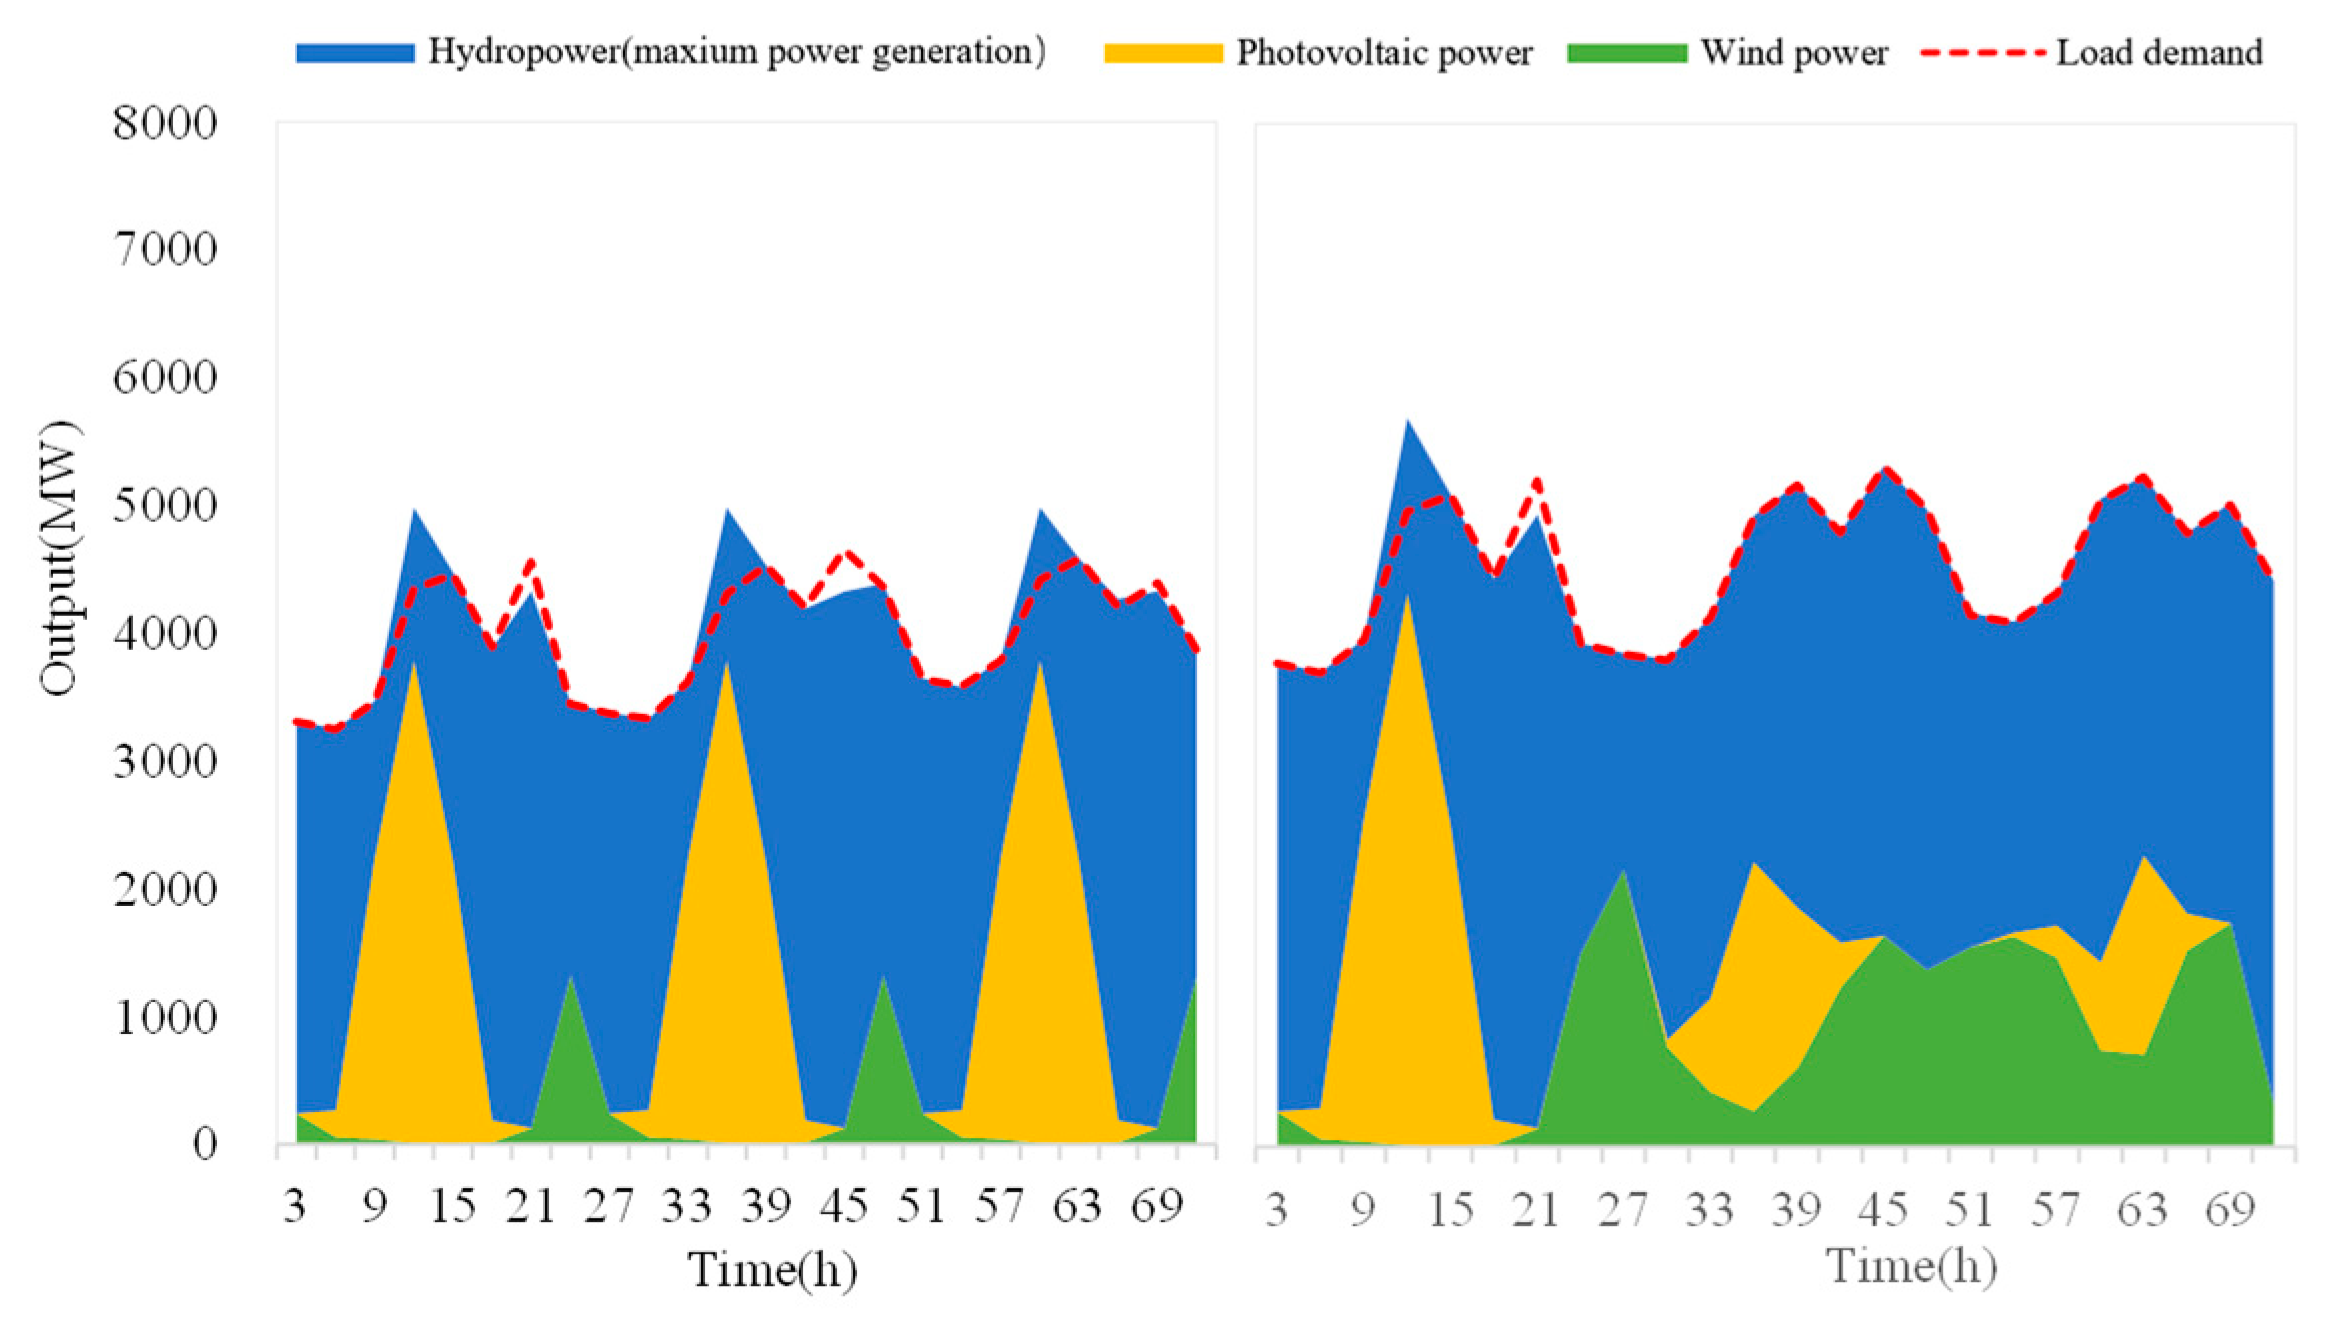
The wind and solar power output process under continuous multi-day under-generation conditions is shown in
Figure 4.
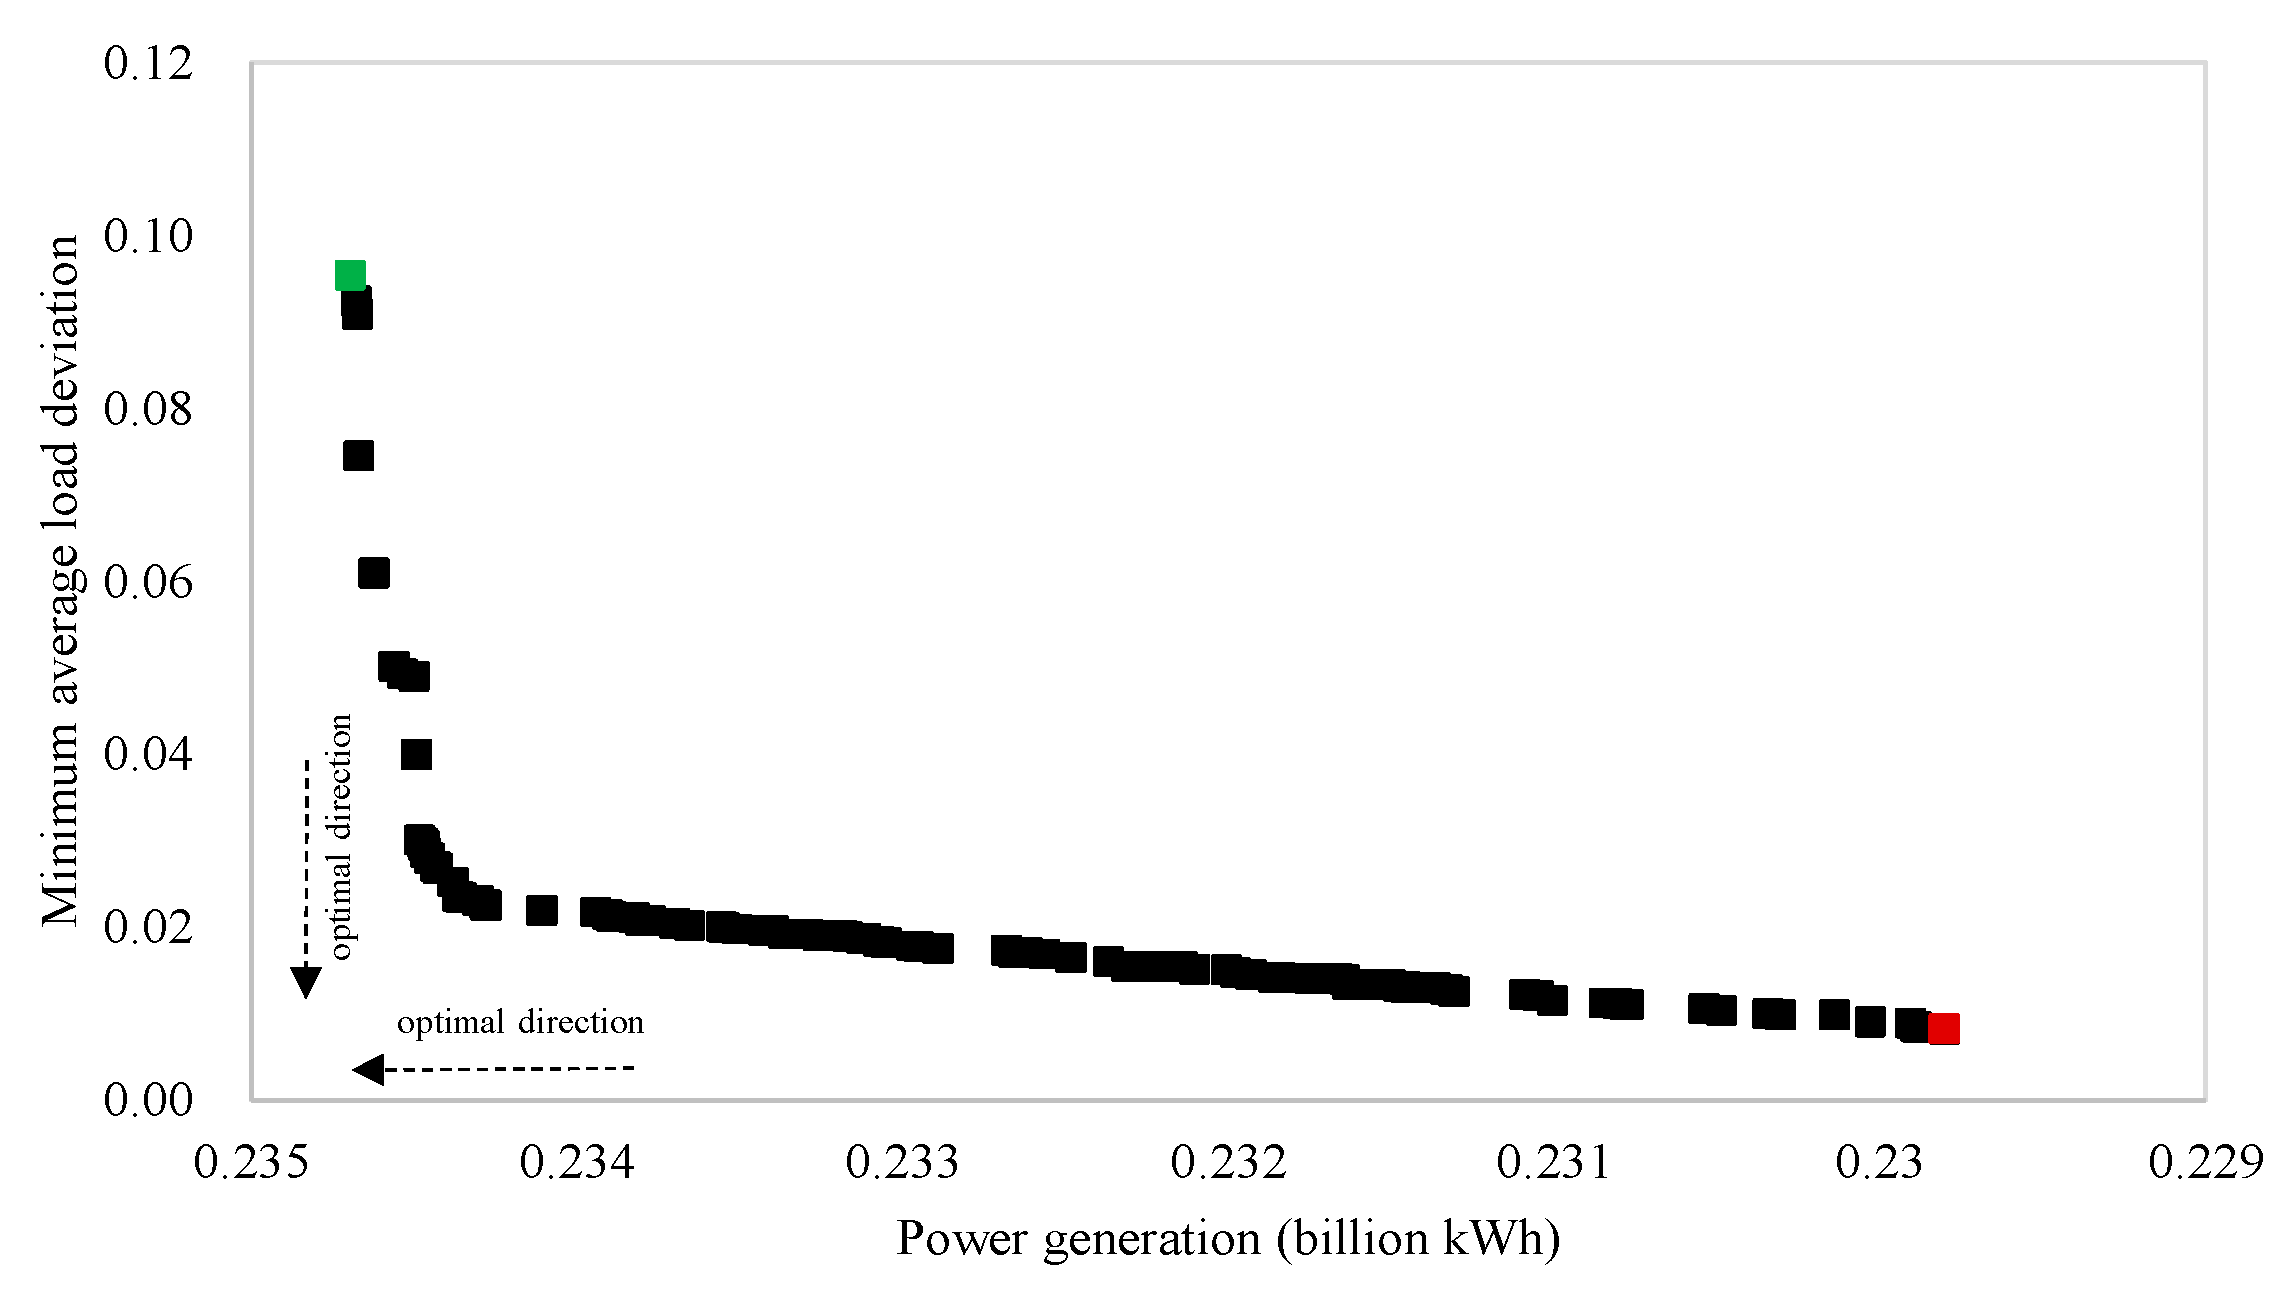
In the continuous multi-day under-generation scenario, the proposed resilience-enhanced optimal scheduling model for the hydro–wind–solar power system is implemented and solved using the NSGA-III algorithm. The corresponding Pareto-optimal frontier results for the two objectives—maximizing total power generation and minimizing the average load deviation percentage—are shown in
Figure 5. Two extreme points from the Pareto frontier were selected for analysis: the solution with the maximum total power generation and the solution with the minimum average load deviation percentage (the green and red points in
Figure 5, respectively).
- (1)
Analysis of the minimum average load deviation point on the Pareto frontier
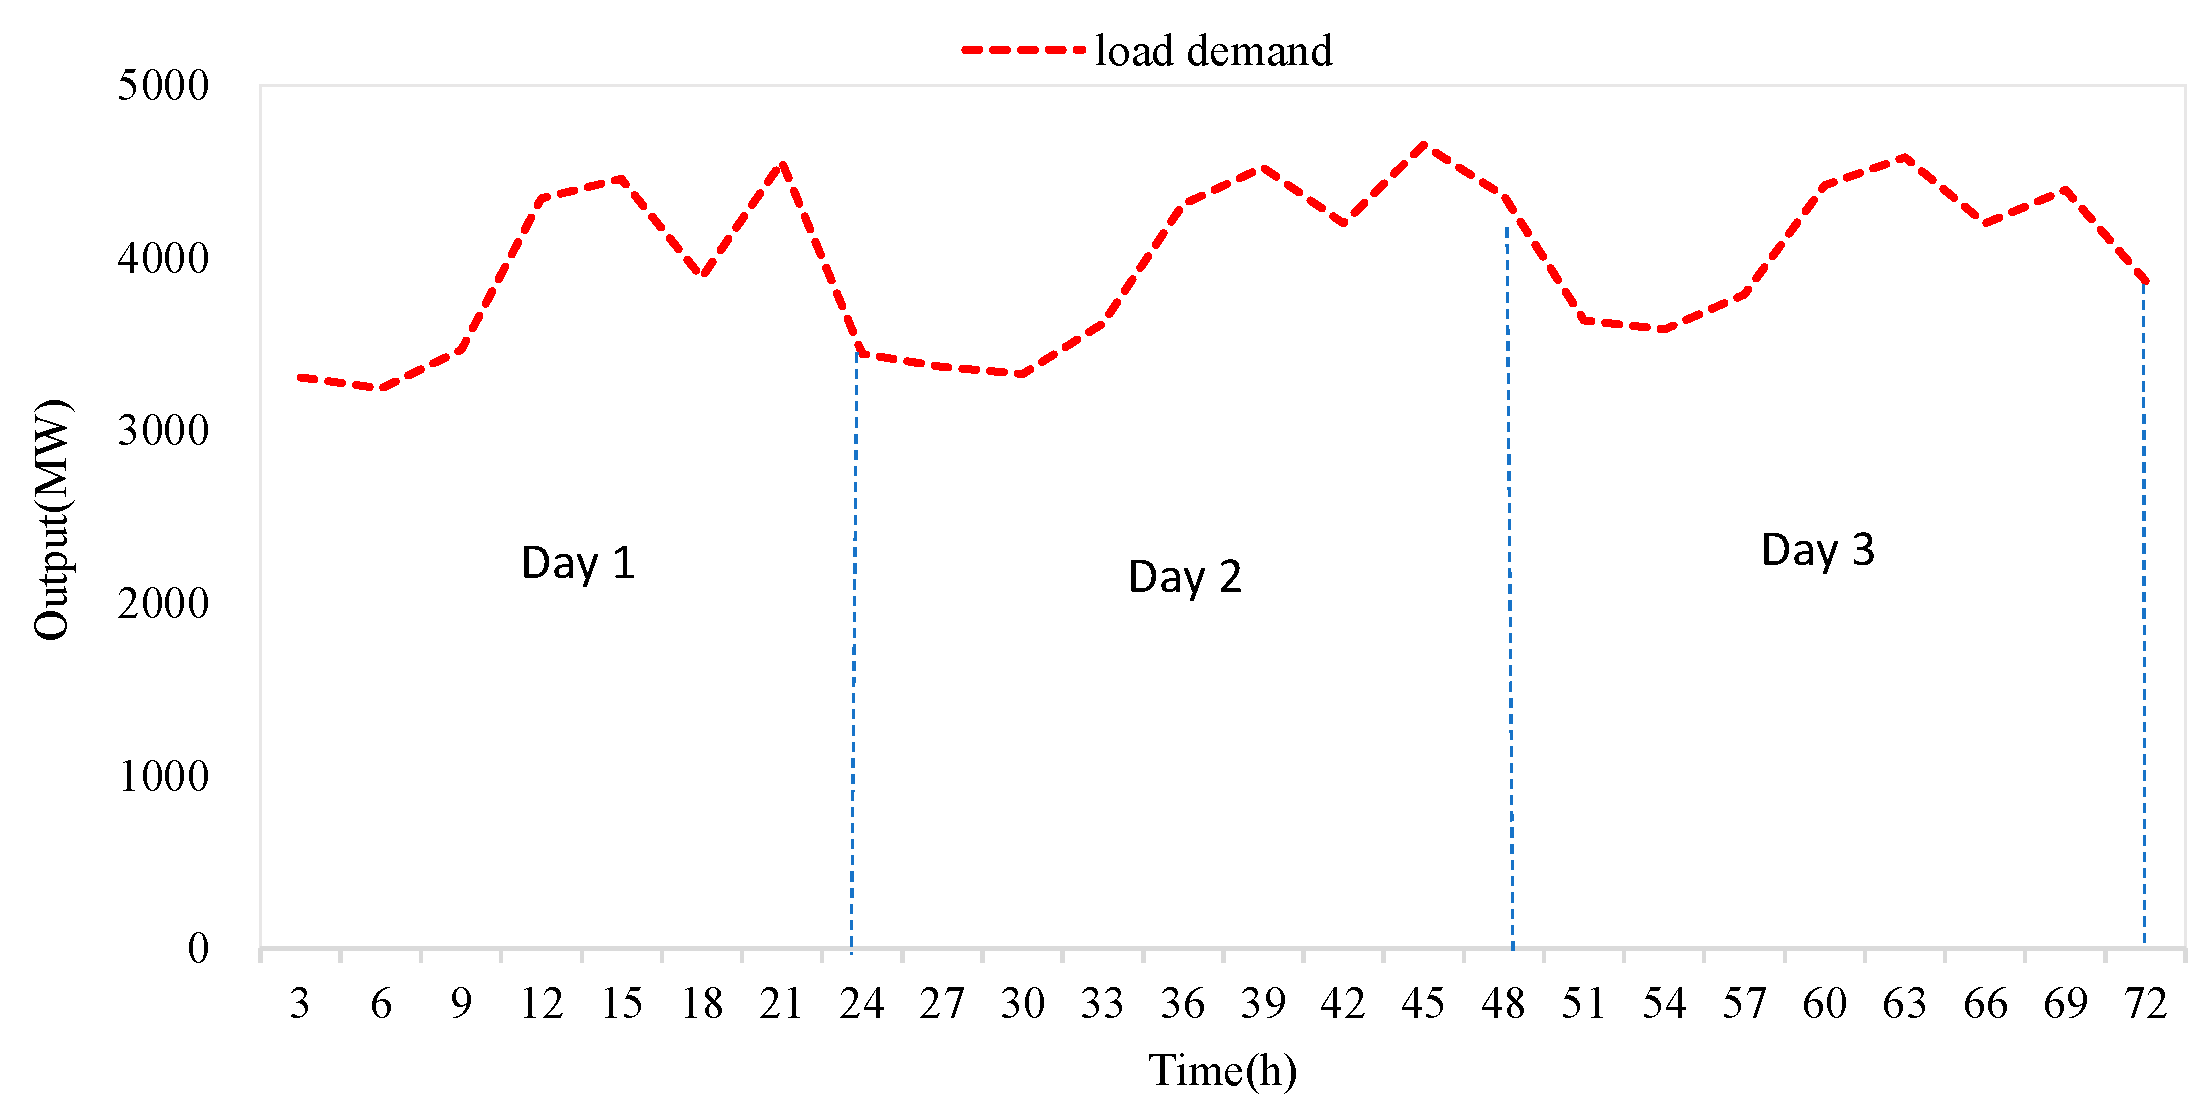
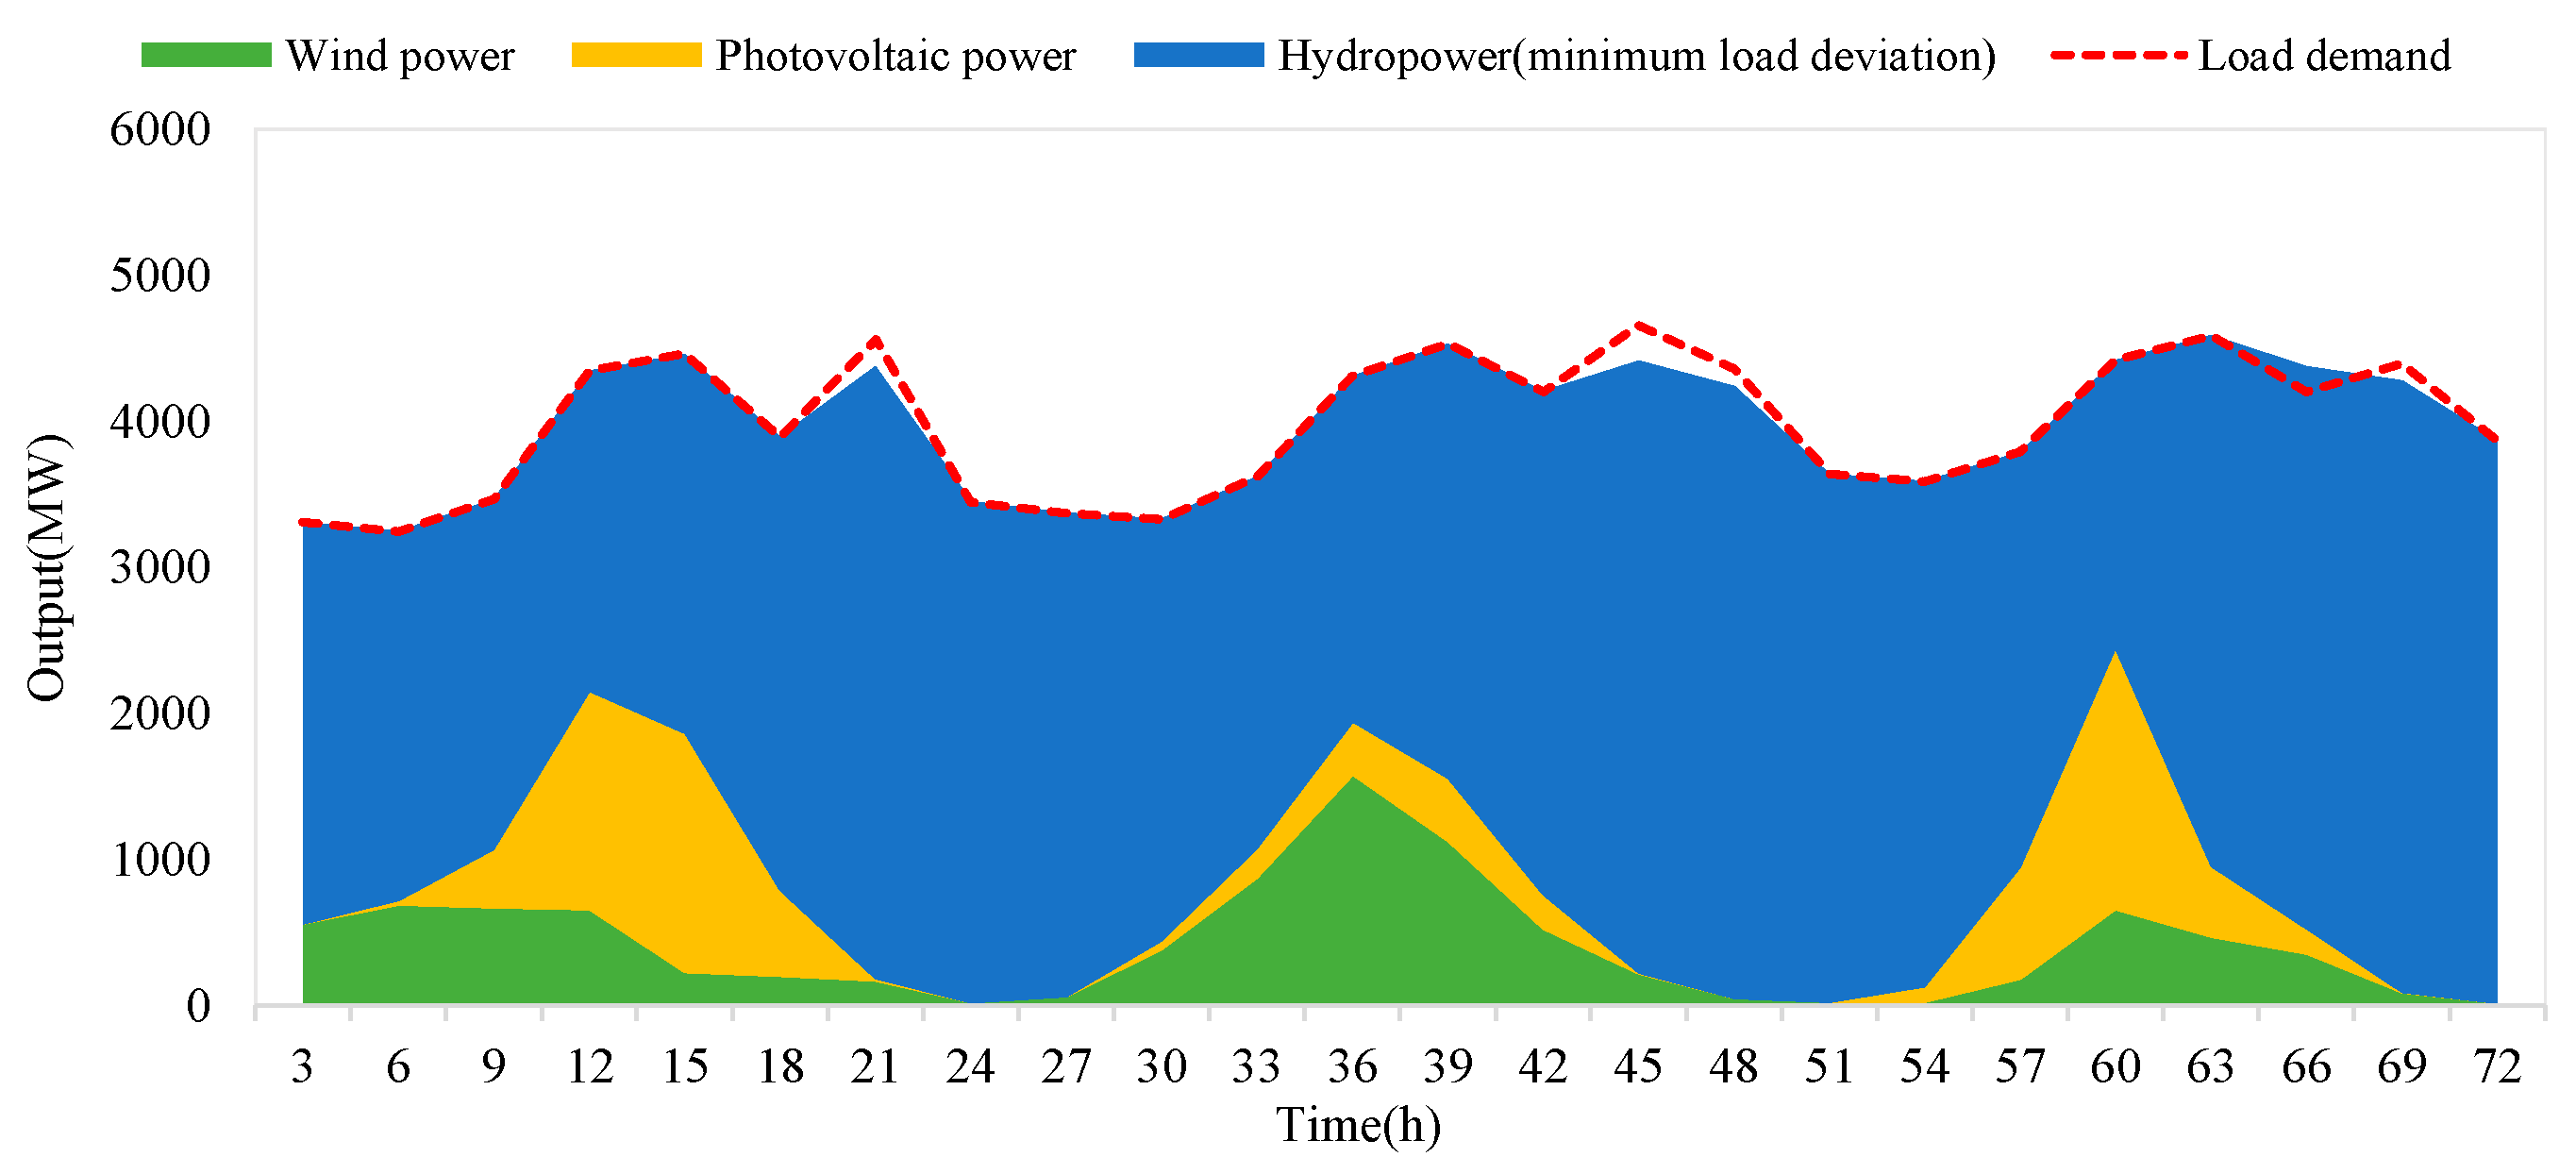
Figure 6 presents the power output profile of the hydro–wind–solar power system under continuous multi-day under-generation conditions. The resilience enhancement mechanism operates through hydropower’s reverse regulation capability by dynamically adjusting its output in response to renewable generation fluctuations. The system effectively minimizes deviations between total generation and load demand, thereby improving system resilience. As shown in periods 24–27 in
Figure 6, when wind and solar generation approach zero, hydropower supplied nearly 100% of the load. However, in extreme under-generation periods, generation shortages still occurred due to capacity constraints. In period 21, the load reached 4557.03 MW, while renewable generation reached 181.87 MW. Although hydropower operates at full capacity (4200 MW), the system still faced a 175.16 MW deficit. Similar shortages are observed in periods 45–48 and 69, where insufficient renewable generation coupled with maxed-out hydropower capacity failed to meet demand.
- (2)
Analysis of the maximum total power output point on the Pareto frontier
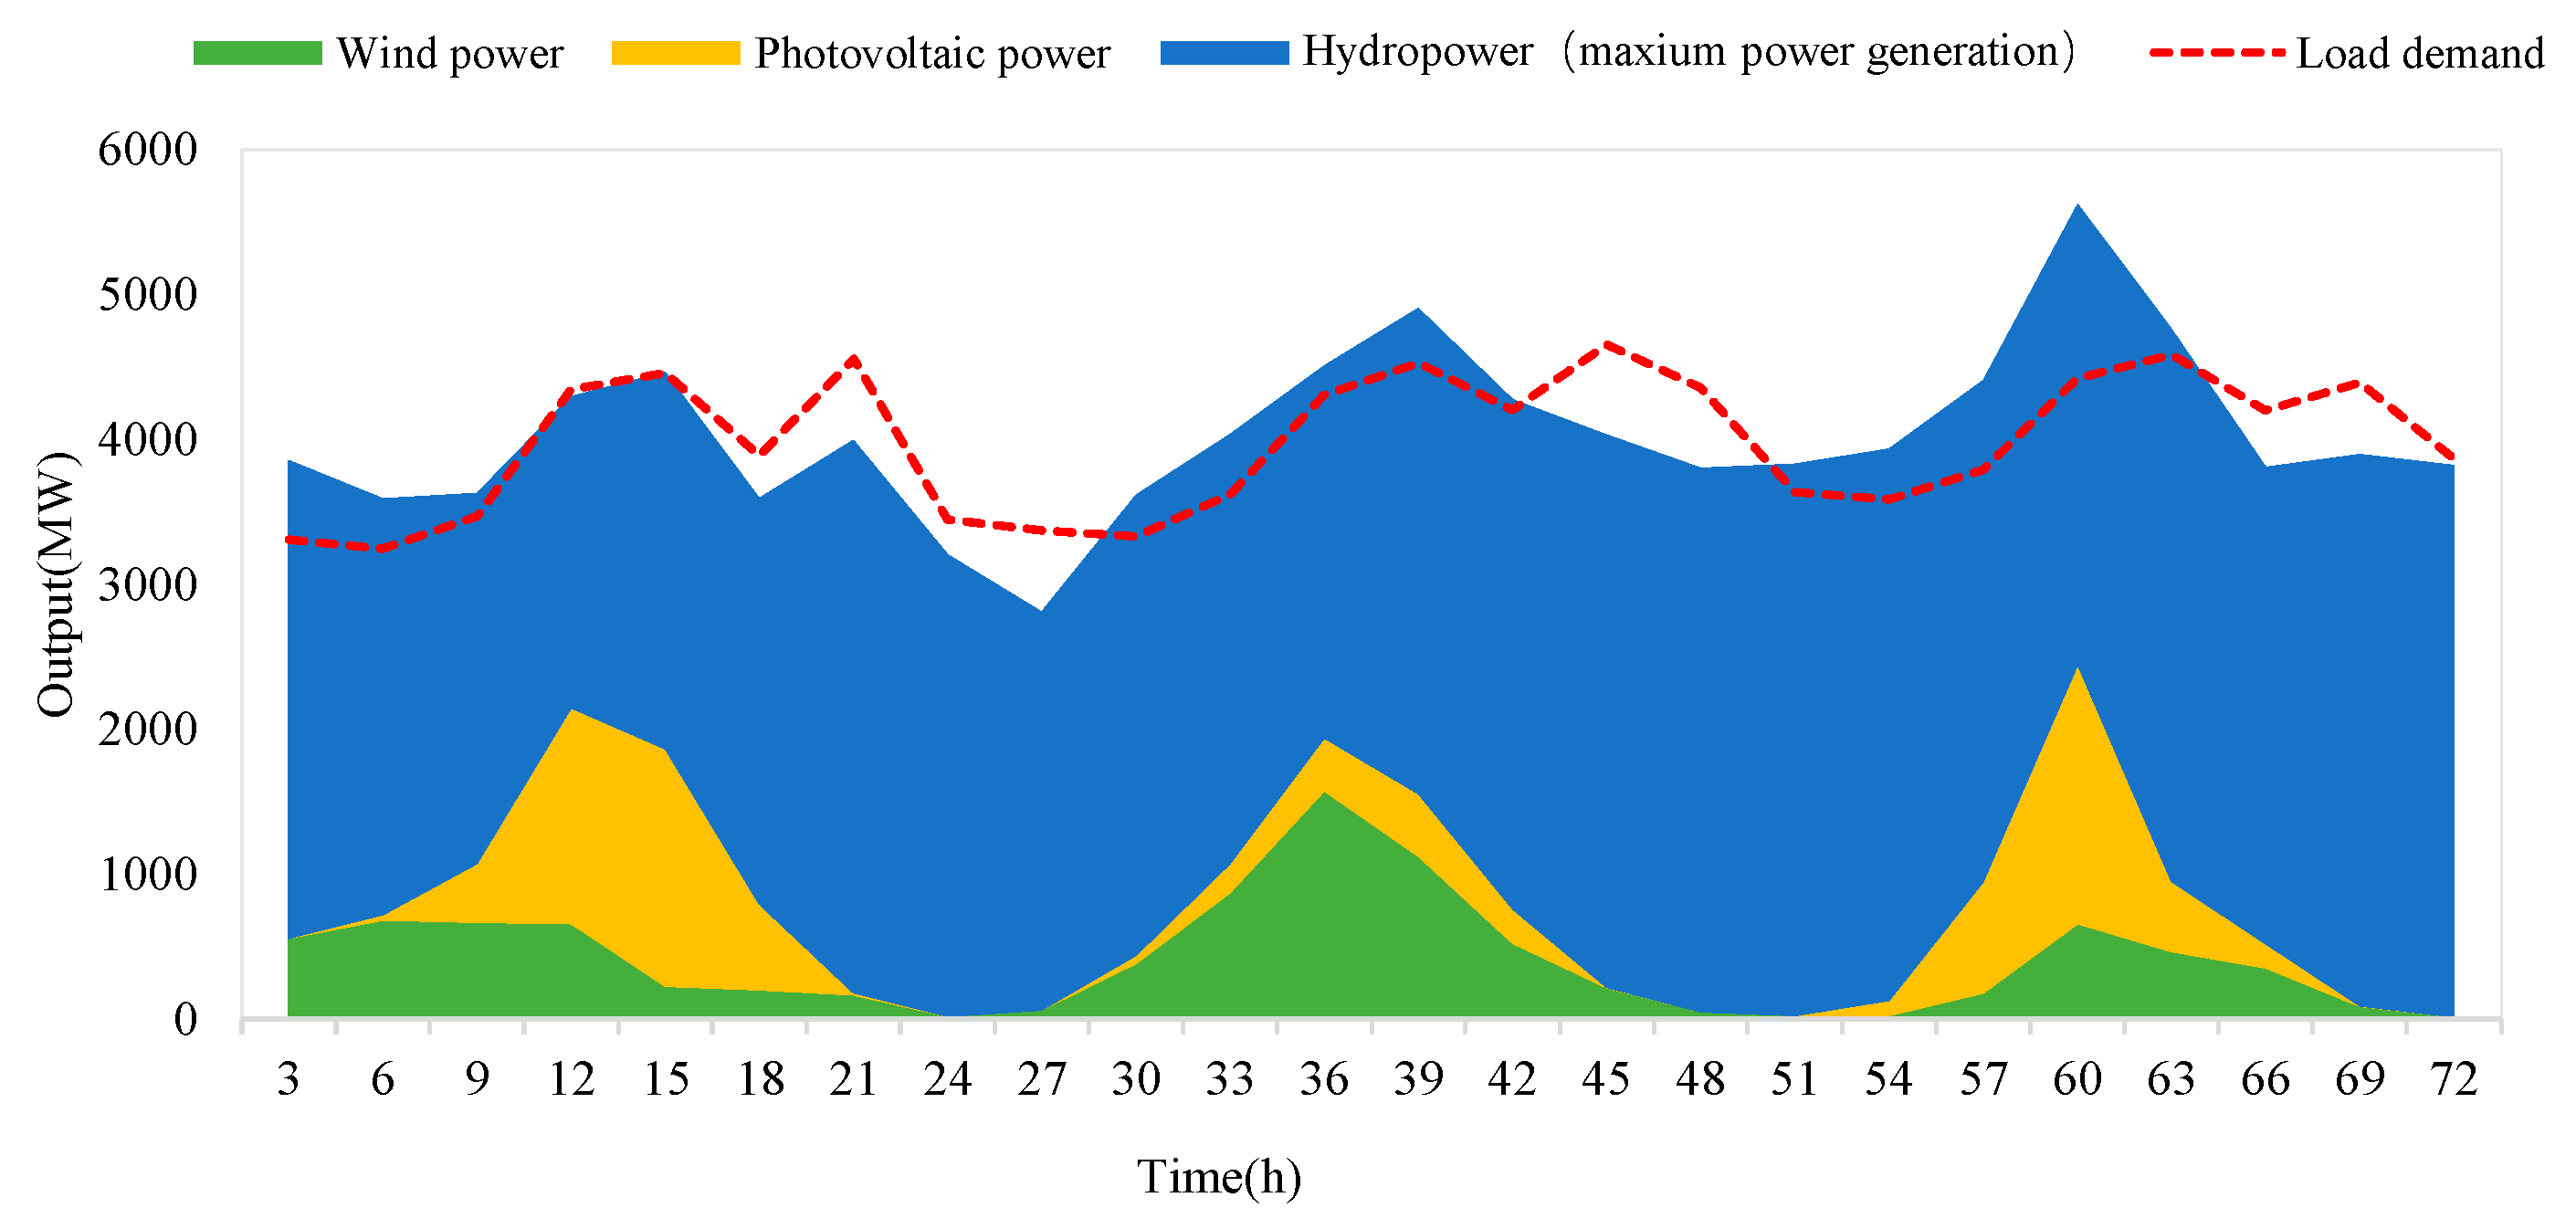
As shown in
Figure 7, when selecting the maximum power output point, the average load deviation is 9.54%, which is significantly higher than the result of the minimum average load deviation (0.76%). This reveals a trade-off between economic efficiency (maximum total power output) and system resilience (minimum average load deviation). From the Pareto frontier in
Figure 5, reducing the deviation by 8.78% would require a sacrifice of 19 GWh in total output. Additionally, there is a knee point on the frontier, on the right side where a slight economic sacrifice (0.5 GWh) yields a large gain in resilience (8%).
4.1.2. Single-Day Under-Generation Scenario
To further explore the difference between single-day and continuous under-generation scenarios, a single-day case was simulated.
Figure 8 shows the wind and solar power output. At period 21, the output is 186.3 MW and load demand is 4557.03 MW, resulting in a 4370.73 MW deficit. Despite the hydropower plant operating at its full installed capacity (4200 MW), a 170.73 MW generation shortage still occurred in period 21.
Similarly, by solving the model for the single-day under-generation scenario, the Pareto frontier is obtained. For comparison, the minimum average load deviation point is selected to compare with the multi-day case.
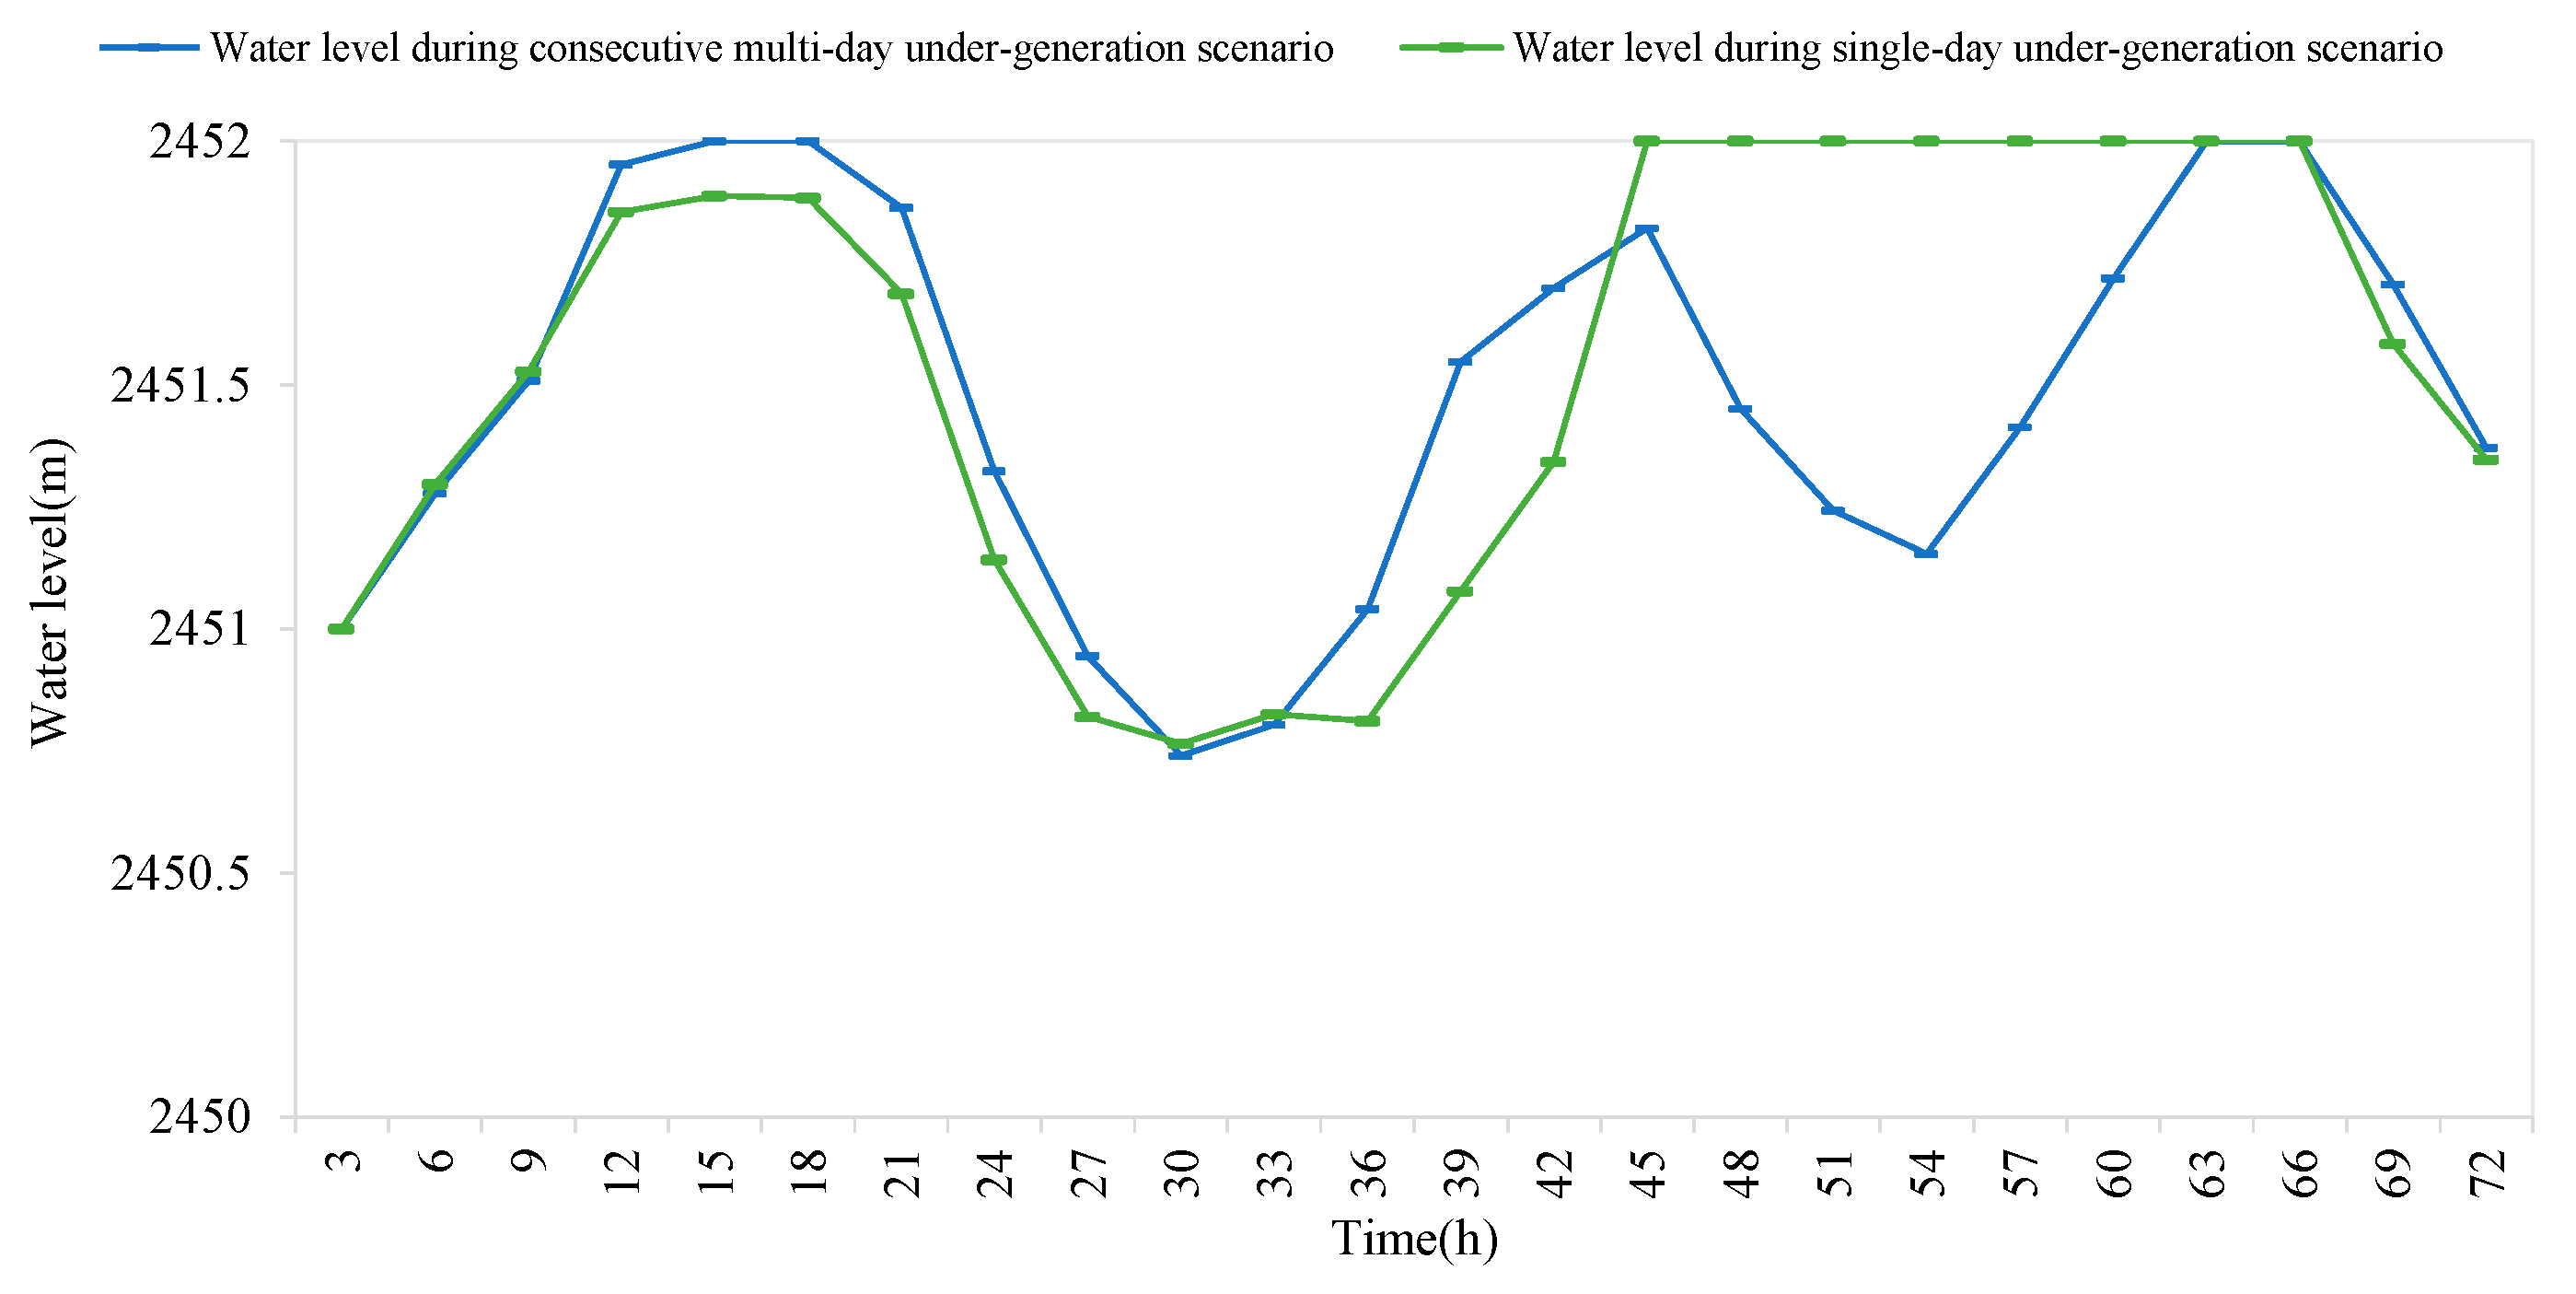
Figure 9 shows the reservoir water level operation processes under continuous multi- and single-day under-generation scenarios. Due to persistently low wind and solar output in the multi-day scenario, hydropower must frequently increase output, leading to more frequent reservoir-level fluctuations. Based on dimensional and shape-based fluctuation evaluation [
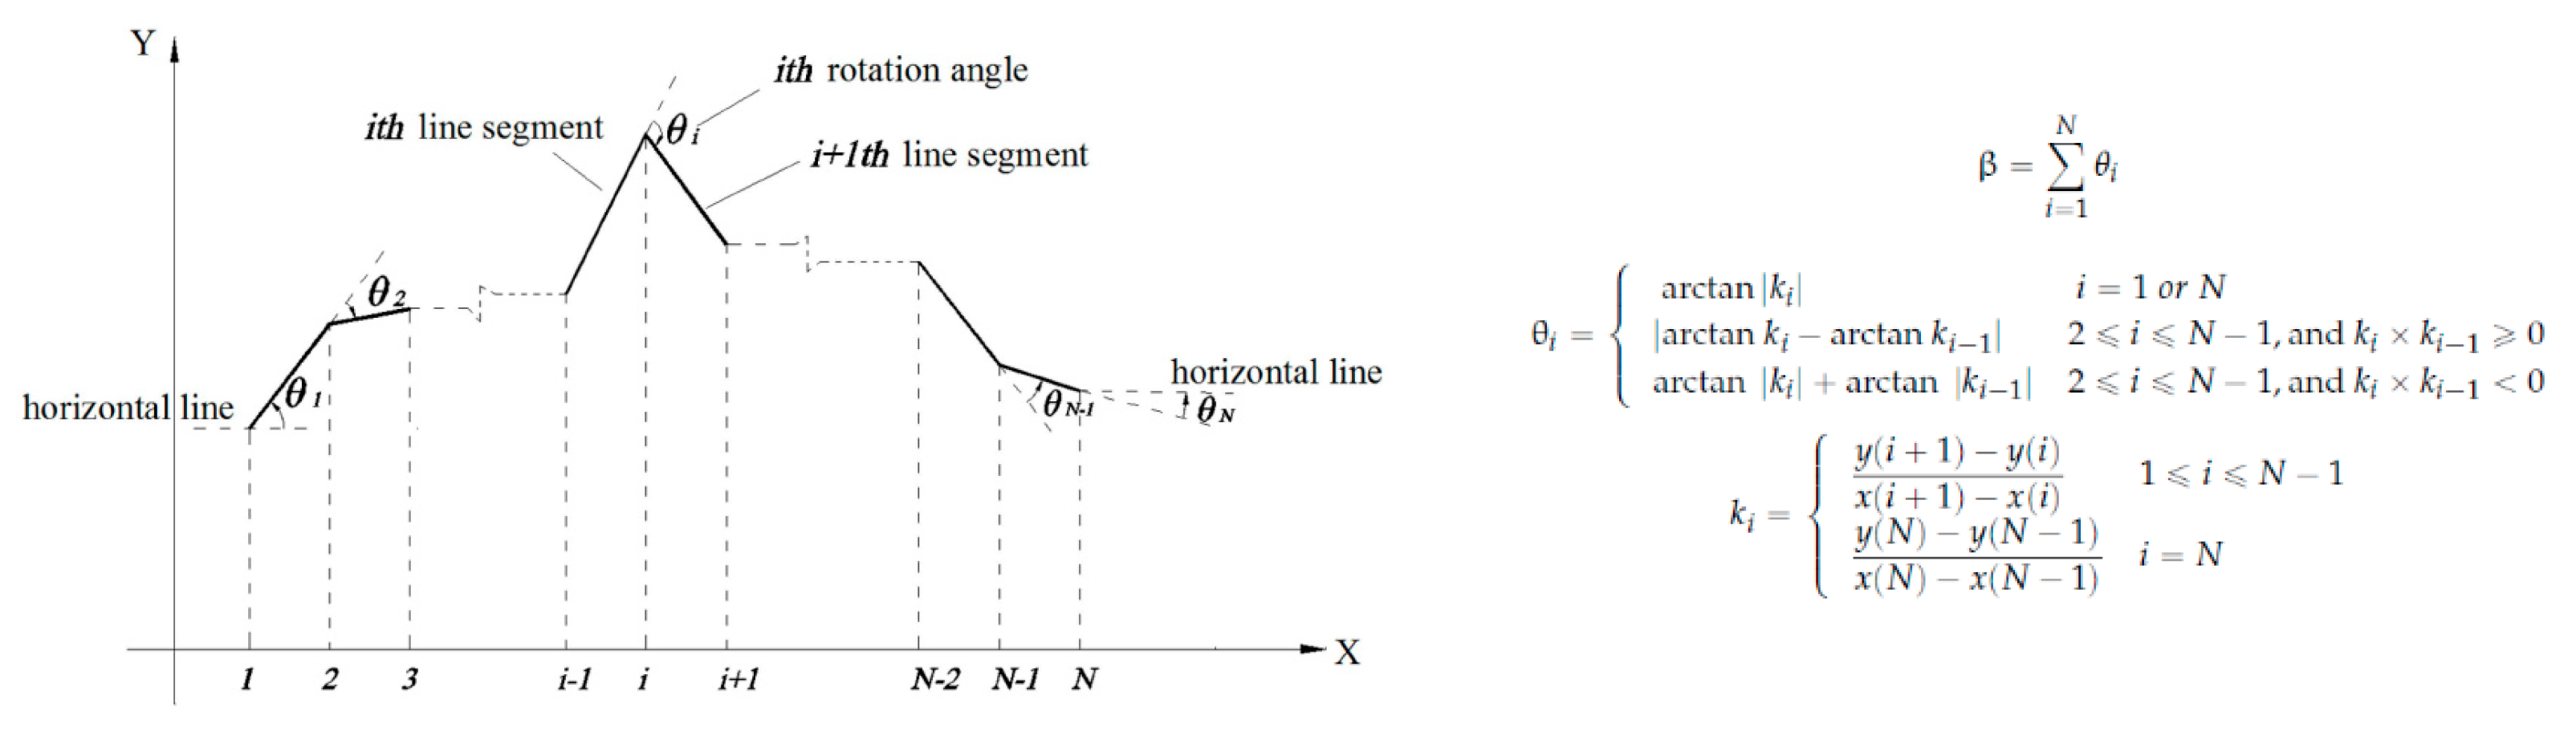
15], shape-dimension fluctuation in the multi-day case (5.43 MW) is 23.39% higher than in the single-day case (4.16 MW), resulting in a difference of 1.27 MW. The calculation process and formula for shape-dimension fluctuation, β, is shown in
Figure 10.
Table 2 compares the resilience metrics under the continuous multi- and single-day under-generation scenarios. In the multi-day case, under-generation lasts longer and occurs more frequently. Limited hydropower capacity and reservoir storage make it difficult to fully meet the load, resulting in a higher average deviation (99.18%). In contrast, the single-day case has only one short-duration event, which hydropower can fully cover, yielding a better result (99.24%). The comparison indicates a cumulative impact under the continuous multi-day under-generation scenario. In addition, the cumulative process of the reservoir water level up–down loop can be observed more under the multi-day scenario, as shown in
Figure 9.
4.2. Over-Generation Scenario
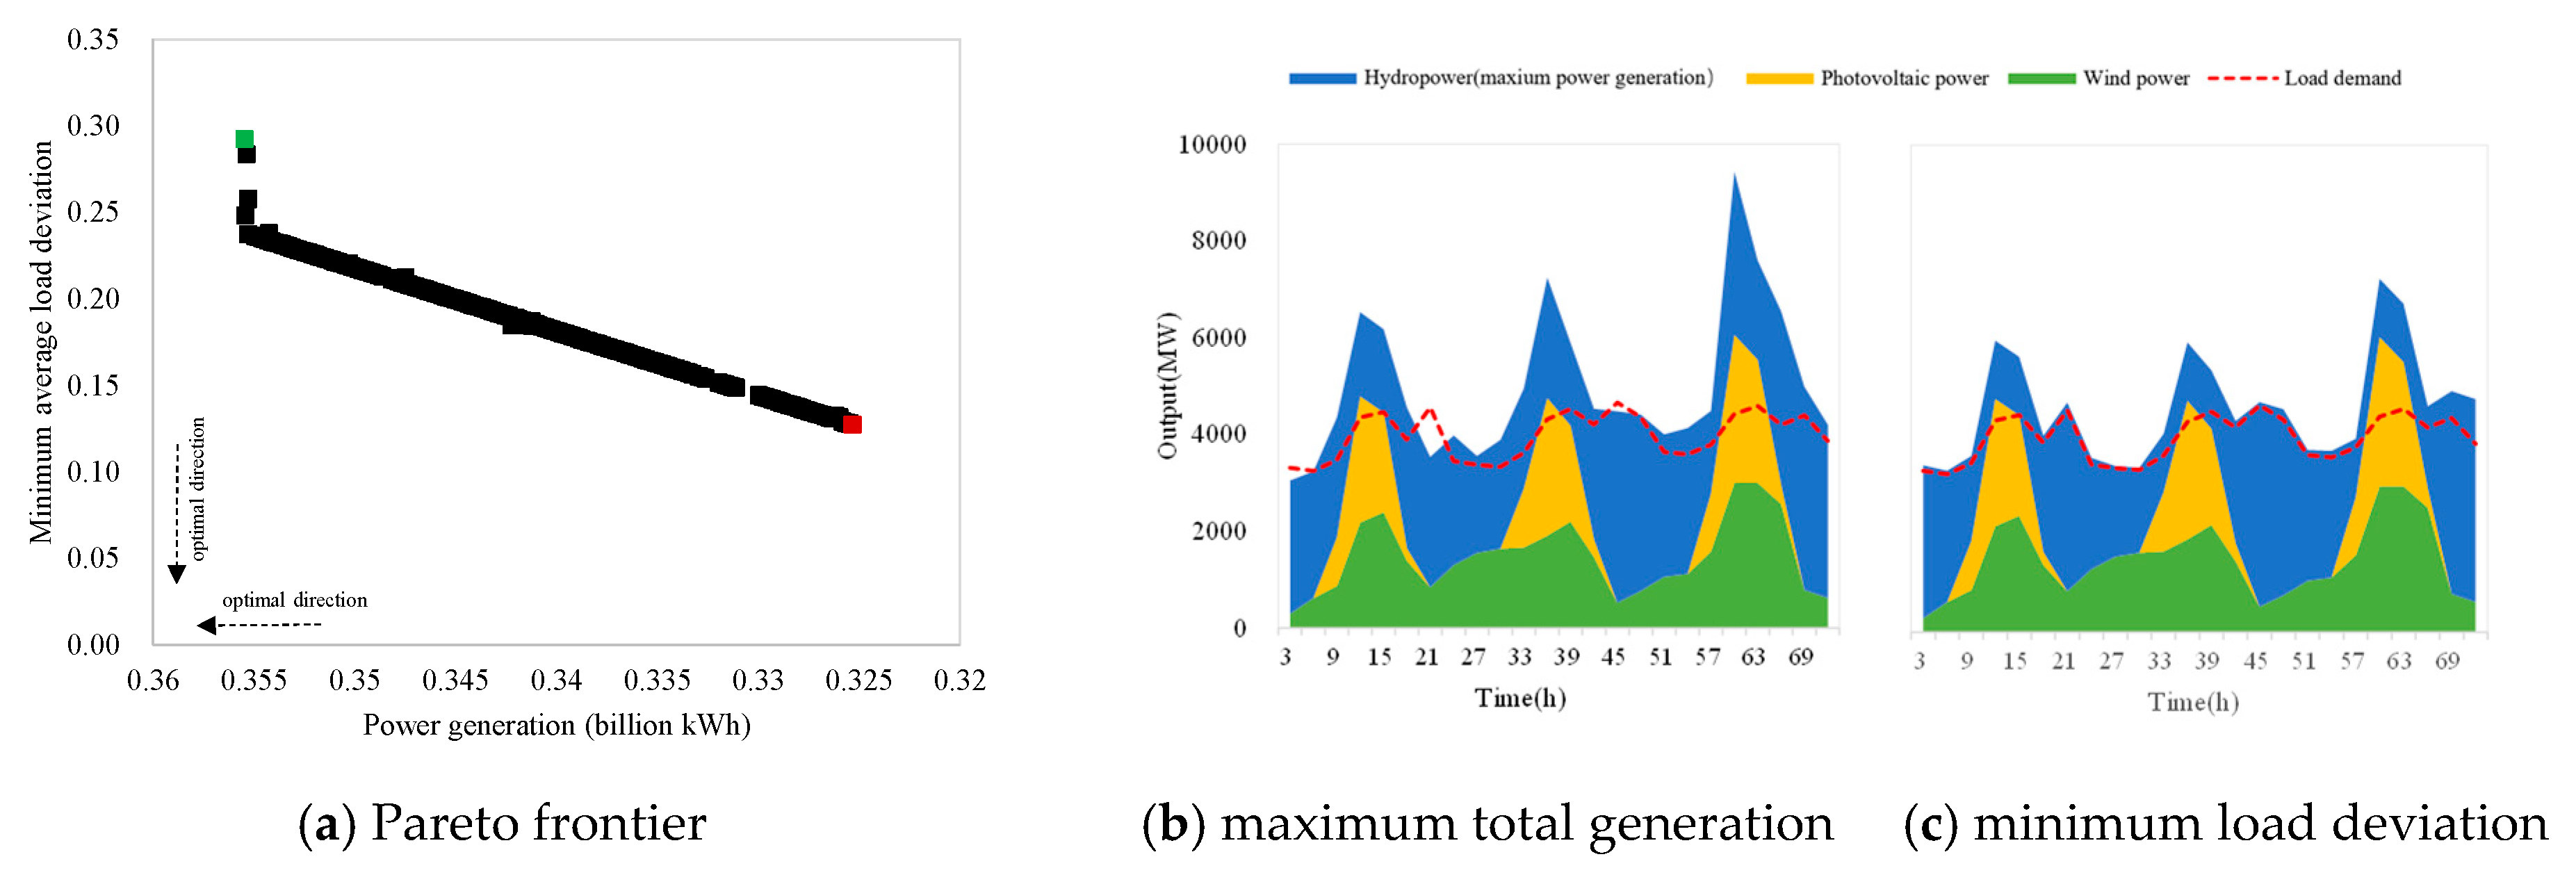
Under over-generation conditions, the resilience enhancement mechanism of the hydro–wind–solar power system involves hydropower proactively reducing its output to accommodate surplus wind and solar generation. This effectively minimizes deviations between the total system output and load demand, thereby improving system resilience. Similarly, the Pareto frontier and the corresponding power output profiles can be obtained with the model proposed in this work, and they can be seen in
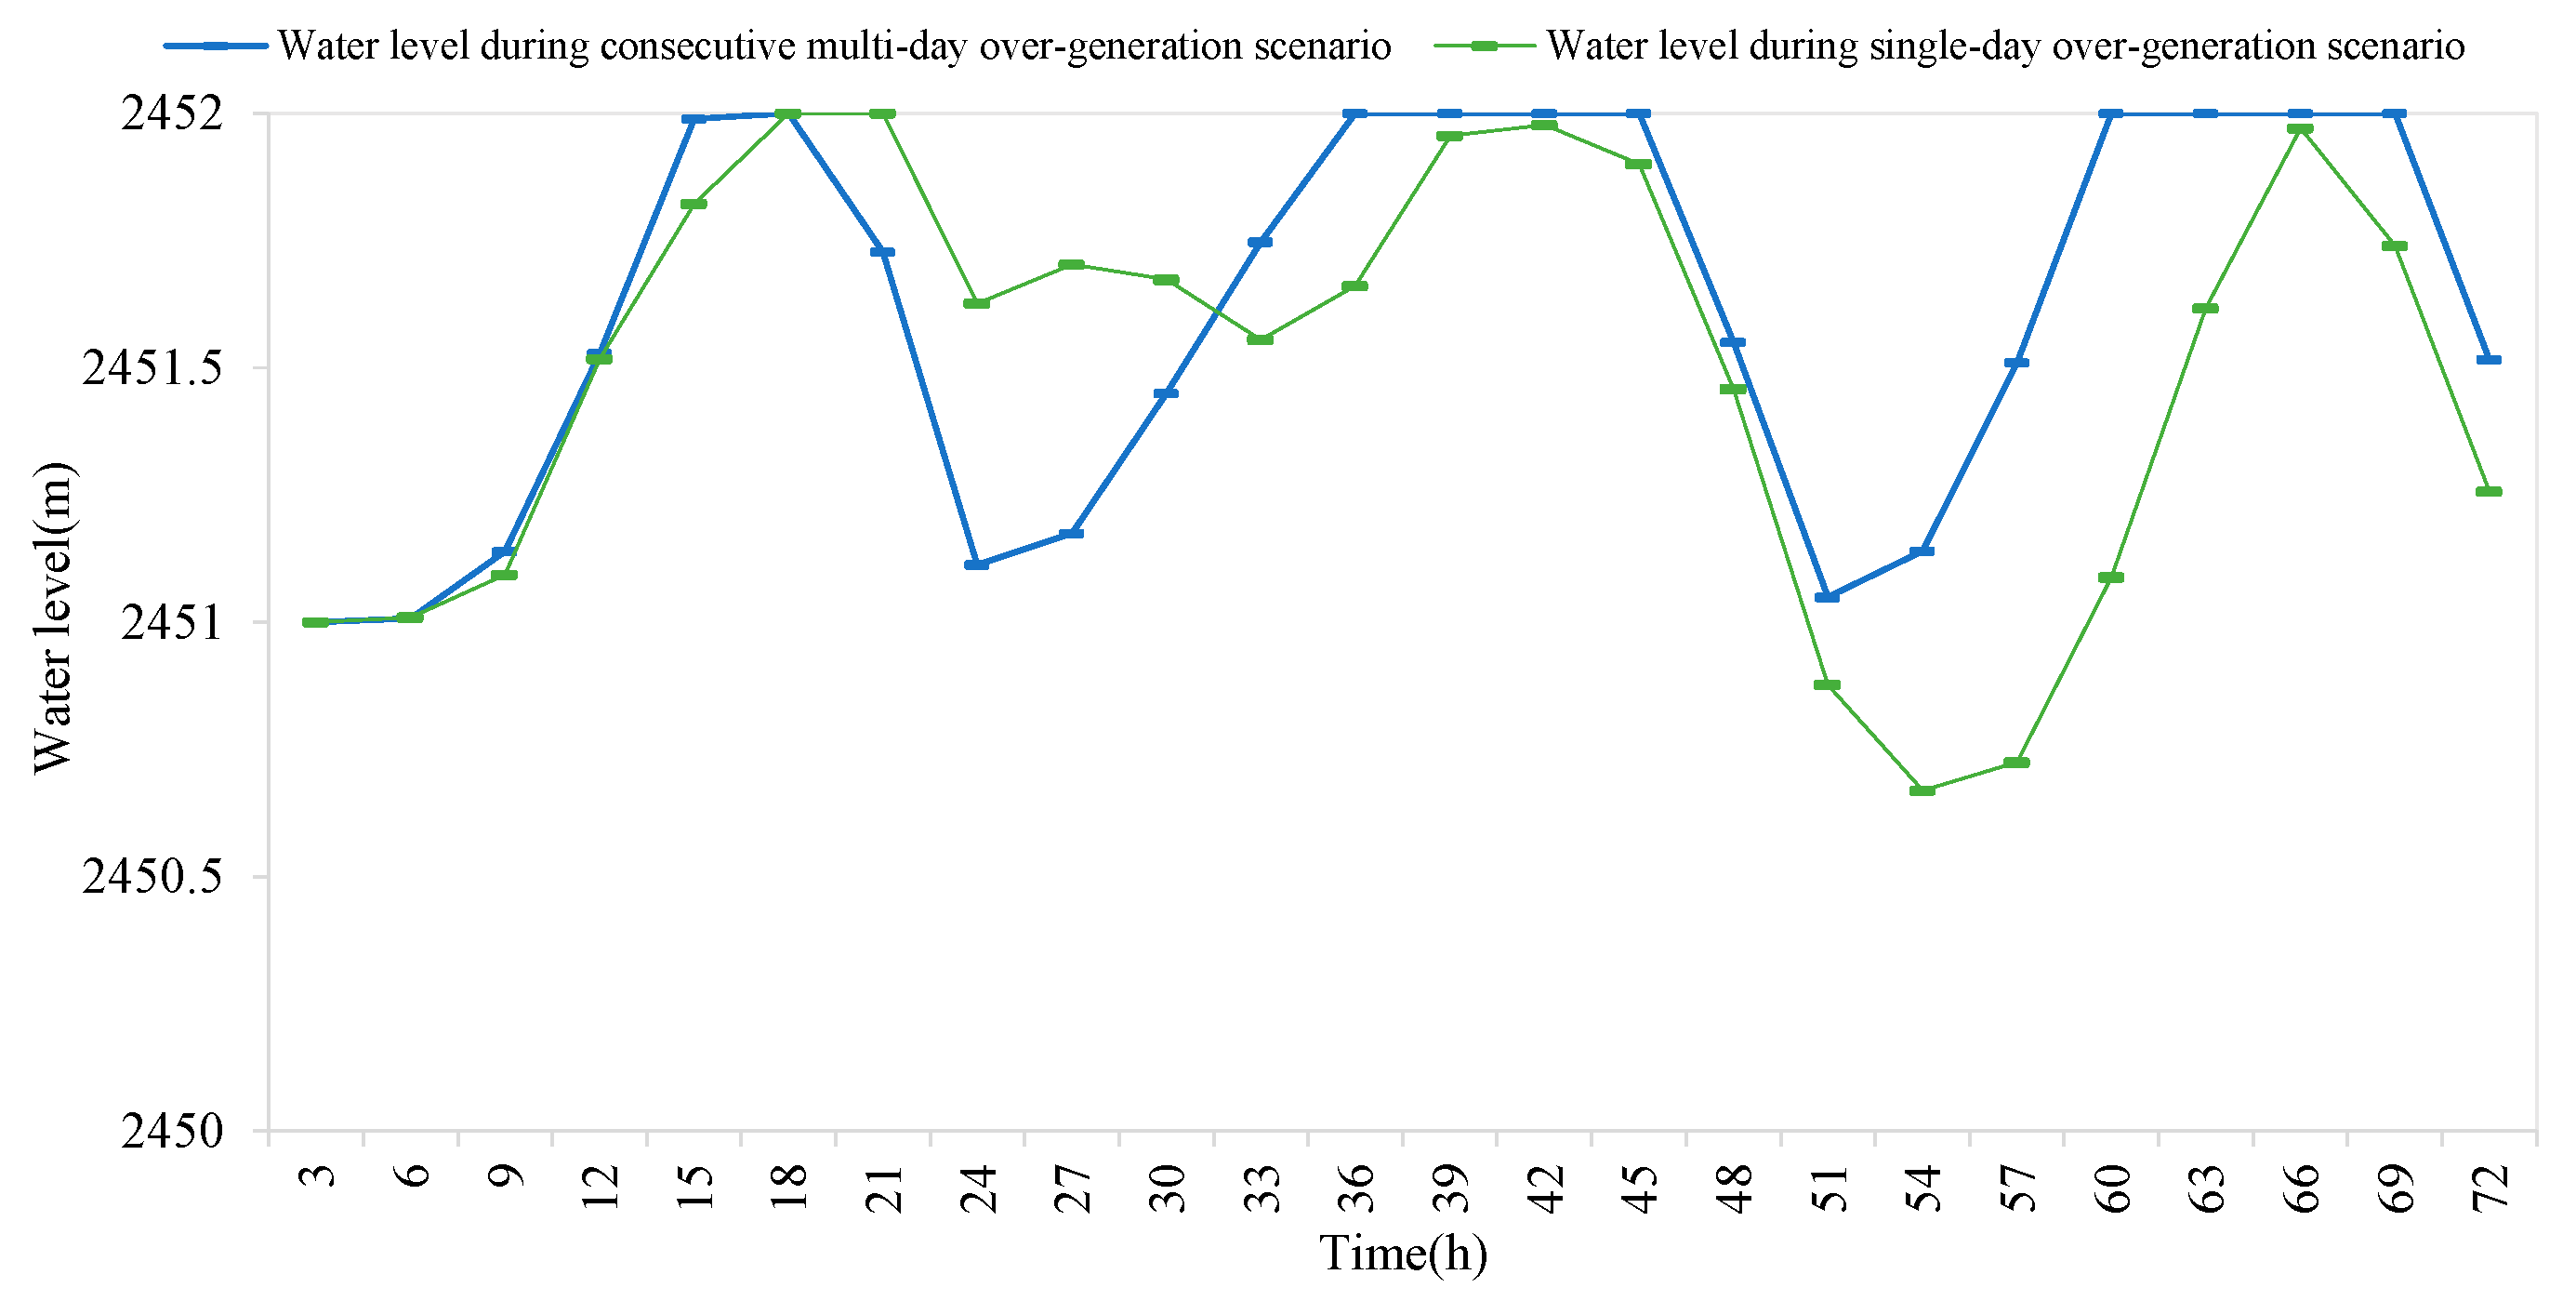
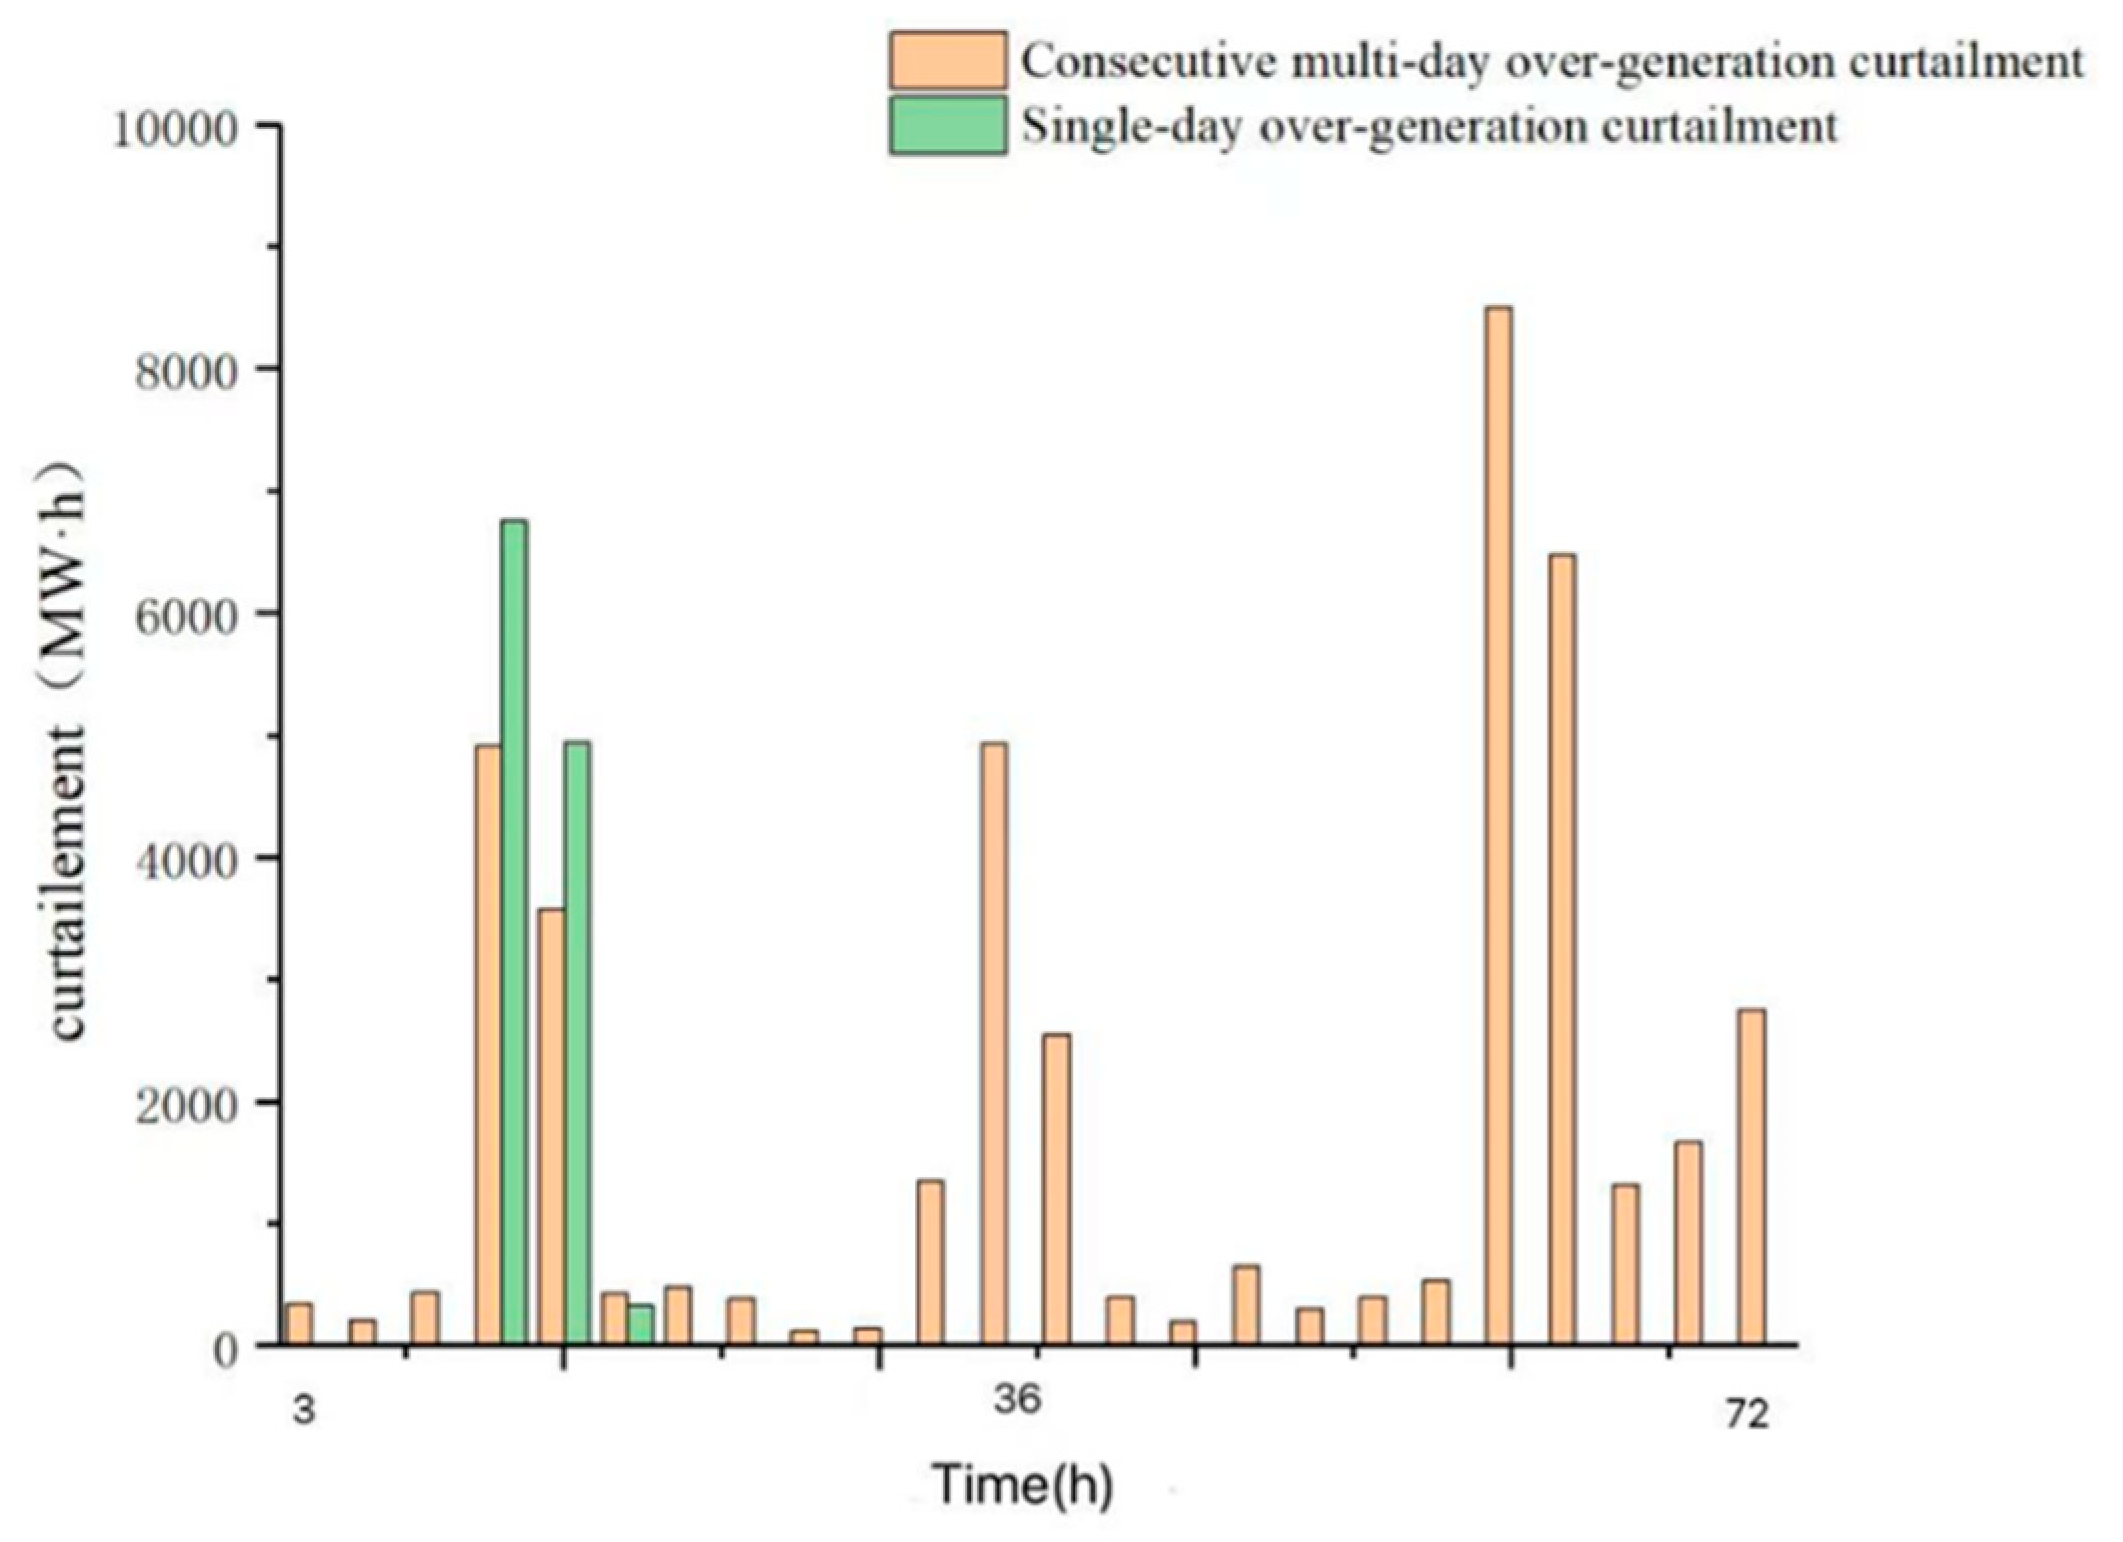
Figure 11. In considering that the features of these results in the over-generation scenario are very similar to those in the under-generation scenario, the following analysis focused on the differences in the over-generation scenario, such as the water level and power curtailment, which are shown in
Figure 12 and
Figure 13.
Figure 12 shows that compared with the reservoir water level in the under-generation scenario (as shown in
Figure 9), the water level reaches the highest level several times, because of the low hydropower output due to the complementarity of high wind and solar output. Furthermore, in the consecutive multi-day scenario, the reservoir water level fluctuates much more than during the single-day, and its average level (2451.59 m) is higher (0.11 m) than that of the single day (2451.48 m). Note that the inflow of the reservoir among various generation scenarios is not same; thus, it is not applicable to compare their water level on specific period.
Figure 13 shows that the curtailment of power generation, which does not occur in the under-generation scenario, is very noticeable in the over-generation scenario. Furthermore, in the consecutive multi-day scenario, the power curtailment is much higher than during the single-day case. This indicates that the complementarity of hydropower cannot avoid all surplus power, let alone its own objective of maximizing power generation, and the exchange between power grid or the storage facilities are needed to consume the excess power.
Because of the abovementioned problem (i.e., excessive power generation and limited regulation ability), the resilience index in the over-generation scenario is lower than in the under-generation scenario in this studied case. Moreover, in the consecutive multi-day scenario, it (86.63%) is much less (9.52%) than in the single-day case (96.15%).
4.3. Concurrent Generation Scenario
Under concurrent generation scenarios, the mechanism for enhancing the resilience of the hydro–wind–solar power system is more complicated. It involves the hydropower system proactively adjusting its output (either decreasing or increasing) to compensate for wind/solar over- or under-generation, thereby reducing the deviation between the total system output and load demand to improve system resilience. However, since concurrent scenarios simultaneously include both wind/solar over- and under-generation conditions, hydropower is required to frequently regulate its output, as shown in
Figure 14. The hydropower output fluctuation (magnitude-dimension fluctuation, 1.11 MW, similarly hereinafter) under continuous concurrent scenarios increased by 8.11% (0.09 MW) and 4.5% (0.05 MW) compared to in the continuous multi-day under-generation (1.02 MW) and continuous multi-day over-generation (1.06 MW) scenarios, respectively.
The resilience metric under different extreme scenarios is compared in
Table 3. It can be observed that in the concurrent generation scenario, the resilience indicator for the multi-day continuous concurrent event (97.45%) also exhibits the abovementioned cumulative effect seen in the under- and over-generation scenarios, relative to the single-day concurrent event (99.02%). However, compared to the under- and over-generation scenarios, the cumulative effect in the concurrent scenario (with a difference of 1.57% in the resilience indicator) is less pronounced than that in the over-generation scenario (9.52%). This indicates that, under the concurrent scenario, the impacts of over- and under-generation occurring on the same day partially offset each other, i.e., the hedging effect.
5. Conclusions
This study investigates the resilience-enhanced optimal dispatch of hydro–wind–solar power systems under continuous multi-day extreme scenarios. A resilience enhancement optimization model for hydro–wind–solar systems was developed, extracting wind and solar power output profiles in continuous multi-day over-, under-, and concurrent generation scenarios. The model was implemented to derive operational processes of the hybrid power system under these scenarios, and the resilience enhancement mechanisms were then analyzed. The main conclusions of this study are as follows:
- (1)
Under continuous multi-day extreme scenarios, the compensatory regulation capability of hydropower can be leveraged to mitigate the impact of extreme wind and solar power fluctuations on the power system, reduce load deviations, and thereby enhance system resilience. However, a trade-off exists between resilience enhancement objectives and power generation economic goals.
- (2)
Due to constraints, including installed hydropower capacity, existing reservoir storage, minimum output requirements, and available storage capacity, hydropower’s ability to counteract extreme renewable energy fluctuations is limited. The complete avoidance of power shortages caused by under-generation impacts or curtailment issues (in both power and water) resulting from over-generation impacts remains unachievable.
- (3)
Compared to single-day extreme scenarios, continuous multi-day extreme scenarios exhibit cumulative impacts of wind–solar power output fluctuations on the power system. Notably, in concurrent generation scenarios (simultaneous under- and over-generation), partial offsetting effects occur between under- and over-generation impacts.
This paper explores the resilience enhancement mechanisms of hydro–wind–solar systems under continuous multi-day extreme scenarios, with analyses conducted under conventional constraints. Note that the conclusions have limitations because they are all drawn according to the results of the studied case which was calculated by the adopted method. To further explore hydropower’s capacity to address extreme renewable energy events and enhance system resilience, subsequent studies must be conducted under unconventional constraint conditions.